


Abstract
If concentrating coal is difficult or impossible using gravity methods (such as jigs, shaking spirals, dense-media drum, and cyclone), which are among the cheapest and simplest options, flotation becomes an alternative. This is due to the differences in surface chemistry properties between the relatively hydrophobic coal and the gangue minerals. On the other hand, flotation methods are far more complex than gravity methods and involve many more parameters that influence concentrate, such as coal particle size, amounts of reagents dosages (e.g., collectors, activators, depressants, and frothers), conditioning times, pulp mixing speeds, flotation times, and pH levels of the pulp medium. In flotation methods with so many variables, determining the combustible recovery (CR) and ash content (AC) of clean coal concentrate that can be obtained may require many experiments. To facilitate these challenging processes, understand the effects of parameters influencing concentration on the flotation method, and estimate the resulting clean coal recovery and ash content, it is necessary to utilize various statistical regression methods. In this study, the effects of six parameters on the flotation of a lignite coal sample with 40% ash content were used to estimate the CR and AC of coal concentrate using multivariate linear regression (MLR) and artificial neural network (ANN) models. As a result, the ANN model demonstrated superior estimate accuracy, with correlation coefficients of 0.988 and 0.963, compared with the MLR models (R2 = 0.575 and 0.540) for estimating the ash content (AC, %) and combustible recovery (CR, %) of coal concentrate, respectively.
1. Introduction
Lignite coal is an indispensable energy source whose importance is increasing day by day. Due to population growth and the resulting increase in energy needs for heating, industry, and electricity generation in thermal power plants, the demand for lignite is constantly increasing, especially in countries where bituminous coal reserves are absent. To meet this demand and make the best use of the existing potential, various research studies need to be conducted on the concentration of lignite coals [1,2].
The preferred methods for coal concentration include gravity methods based on density differences to separate liberated coal particles in the size range of 150 mm to 1 mm from gangue minerals (Baum-Batac-Acco jigs, spirals, heavy-medium drums and cyclones, etc.). Gravity methods are the most widely used coal concentration techniques due to their low cost and ease of use. To evaluate the effectiveness of concentration based on the differences in density between coal and gangue minerals, float–sink tests are among the simplest and most effective laboratory methods. If the gangue minerals in the coal sample are liberated to less than 1 mm, the flotation method must be used because of the difference in the surface chemistry of the coal; that is, the coal is hydrophobic, whereas the gangue minerals are hydrophilic [3,4,5,6,7].
Although flotation has been used worldwide for years to concentrate coal on an industrial scale, especially bituminous coals, Türkiye’s high-ash lignite coal reserves are currently concentrated using gravity-based methods, which are cost-effective and easy to use [4,8,9]. However, in the future, it will be necessary to use flotation methods to concentrate fine coal particles smaller than 1 mm that cannot be concentrated by gravity methods. Therefore, this study will provide valuable information on the concentration of lignite coal by froth flotation in Türkiye in the coming years.
Flotation, or froth flotation, is a method developed for the concentration of fine-sized coals with particle sizes smaller than 1 mm and ores with particle sizes smaller than 0.5 mm. Additionally, worldwide, approximately 142 million tons of fine coal are concentrated by flotation each year [10,11,12].
The flotation ability of coals varies with characteristics such as the degree of coalification (rank), ash content, moisture level, and surface oxidation. Although coal is naturally hydrophobic, ash and moisture can reduce this hydrophobicity. Due to this hydrophobic property of coal, it can be floated only with alcohol or phenol-type frothers (such as isooctane, 2-ethyl hexanol, crecic acid, pine oil). However, to increase flotation efficiency, it is often necessary to use neutral hydrocarbon oils as collectors (e.g., kerosene, diesel, fuel oil) [13,14,15].
Coal flotation is a highly effective separation technology that concentrates coal by exploiting differences in surface hydrophobicity between coal and gangue minerals [13,15,16]. As with all other concentration methods, the quality of the clean coal concentrate produced by flotation is indicated by its low ash content. The success of mineral or coal flotation experiments is evaluated by the recovery (combustible recovery, CR) and grade (ash content, AC) of the resulting concentrate or clean coal. Measuring recovery (combustible recovery) and grade (ash content) is standard practice in coal and mineral processing plants. Traditional methods for determining ash content are often time-consuming. Additionally, the CR of coal, which can be derived from its AC, is a crucial indicator of concentration success. Therefore, statistical methods are needed to estimate the CR and AC of coal concentration in a simple, cost-effective, and straightforward way. Moreover, estimating the CR and AC of clean coal using mathematical approaches based on changes in various operating parameters can also help flotation plants operate efficiently.
In recent years, many researchers [17,18,19,20,21,22,23,24] have developed various models using multivariate linear and nonlinear regression methods (MLR and NMLR) for flotation processes and particularly in coal flotation research [25,26,27,28], as well as machine learning approaches such as Adaptive Neuro-Fuzzy Inference System (ANFIS), Artificial Neural Networks (ANN), Factorial Design (FD), and Random Forest (RF). Therefore, different statistical methodologies, such as MLR, NMLR and ANN models, can be applied to estimate the CR and AC of coal concentrates obtained in fine coal flotation.
The main objective of this study is to estimate the CR and AC of rough clean coal concentrates obtained from the flotation concentration of high-ash lignite coal samples, as a function of some flotation operating parameters, using statistical methods. For this purpose, the effects of six operating parameters on combustible recovery (CR) and ash content (AC) of coal concentrate during the coarse coal flotation stage were first evaluated at the laboratory scale. Next, based on the test results for these six parameters, the aim was to estimate the CR and AC of the clean coal concentrate with high accuracy using MLR and ANN models in SPSS 22.0.
2. Materials and Methods
In this study, the lignite coal sample used in the float–sink and flotation tests was obtained from the Eskişehir-Mihalıççık region of Türkiye. The proximate analysis values and net calorific value of the lignite coal sample used in the experiments were determined according to ASTM D3172-13 (2021) [29] standards, and the results are shown in Table 1.
Table 1.
Net calorific and proximate analysis values of the lignite coal sample used in the experiments.
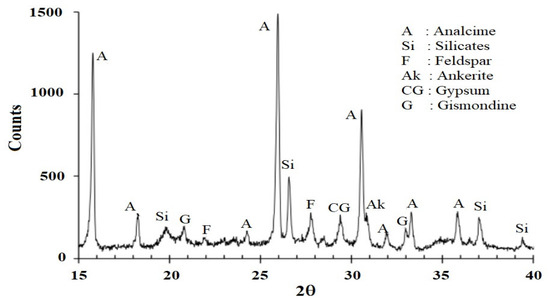
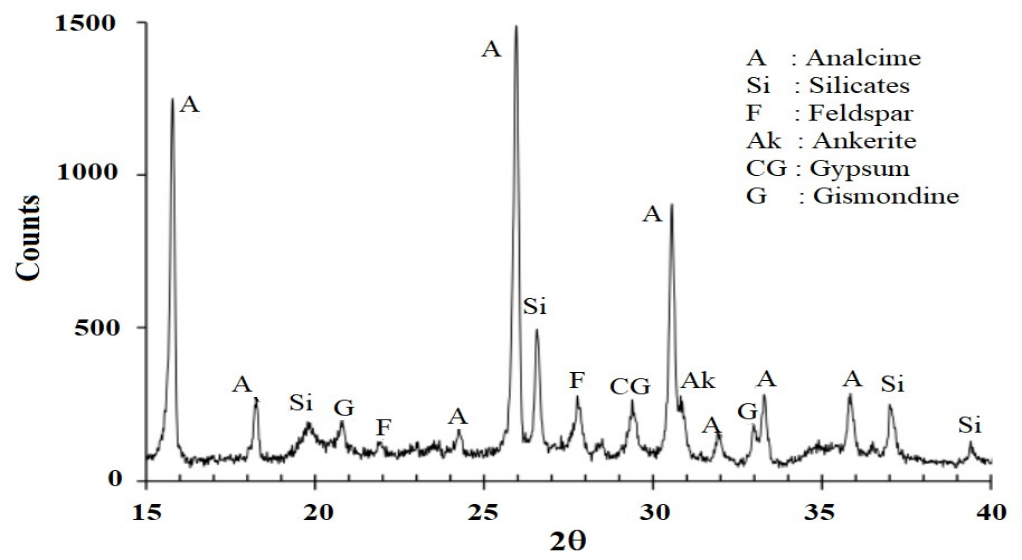
Additionally, mineralogical analysis of the coal sample was performed using an XRD device (Shimadzu-6000 (Shimadzu Corporation, Kyoto, Japan)), and the results are shown in Figure 1. Accordingly, analcime, gismondine, feldspar, ankerite, gypsum, and clay minerals (smectite, kaolinite and illite, etc.) were identified as ash minerals in the lignite coal sample. The chemical composition of the sample was also determined using an XRF device (Rigaku ZSX primus II (Rigaku Corporation, Tokyo, Japan)), and the results are presented in Table 2. As expected, the high SiO2 and Al2O3 ratios in the lignite coal sample used in the study indicate the presence of clay minerals, while the CaO and SO3 ratios indicate the presence of gypsum.
Figure 1.
The XRD graph of the lignite coal sample used in the experiments.
Table 2.
Chemical analysis values of the lignite coal sample used in the experiments.
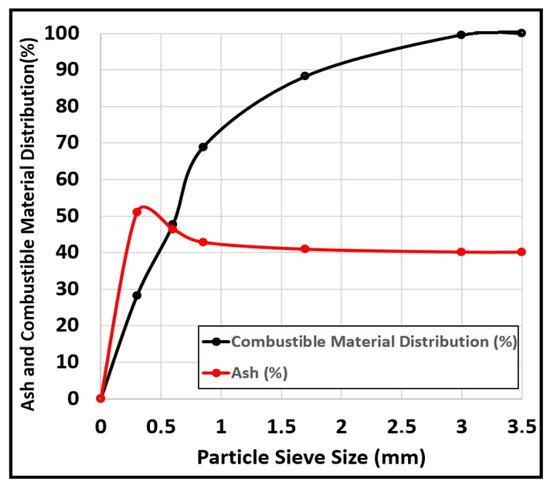
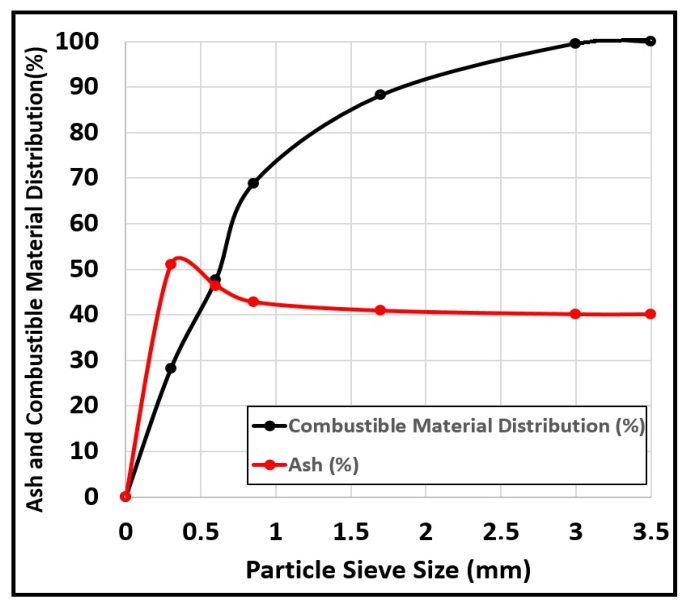
Macroscopic and microscopic examination of the coal sample revealed the presence of silicate and carbonate minerals dispersed within the coal during its formation, as well as finely dispersed gypsum minerals (with an average below size 3 mm) formed after coal formation. Therefore, the lignite coal sample used in the experiments was progressively comminuted to −3 mm using laboratory-type jaw and roller crushers, and the ash content and particle-size distribution of the comminuted coal are presented in Figure 2.
Figure 2.
Ash and combustible particle size distribution curves by size of lignite coal sample.
First, float–sink tests were conducted to determine whether gypsum minerals could be concentrated using gravity concentration methods, and washability (Henry-Reinhardt) curves were plotted from the test results. Following the float–sink tests, the possibility of concentrating the coal by flotation, based on surface properties, was investigated to remove minerals like gypsum that are difficult to remove by physical methods.
2.1. Float–Sink Tests
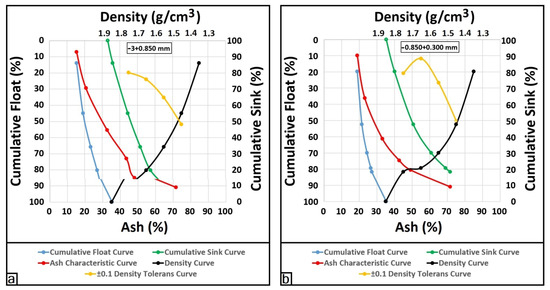
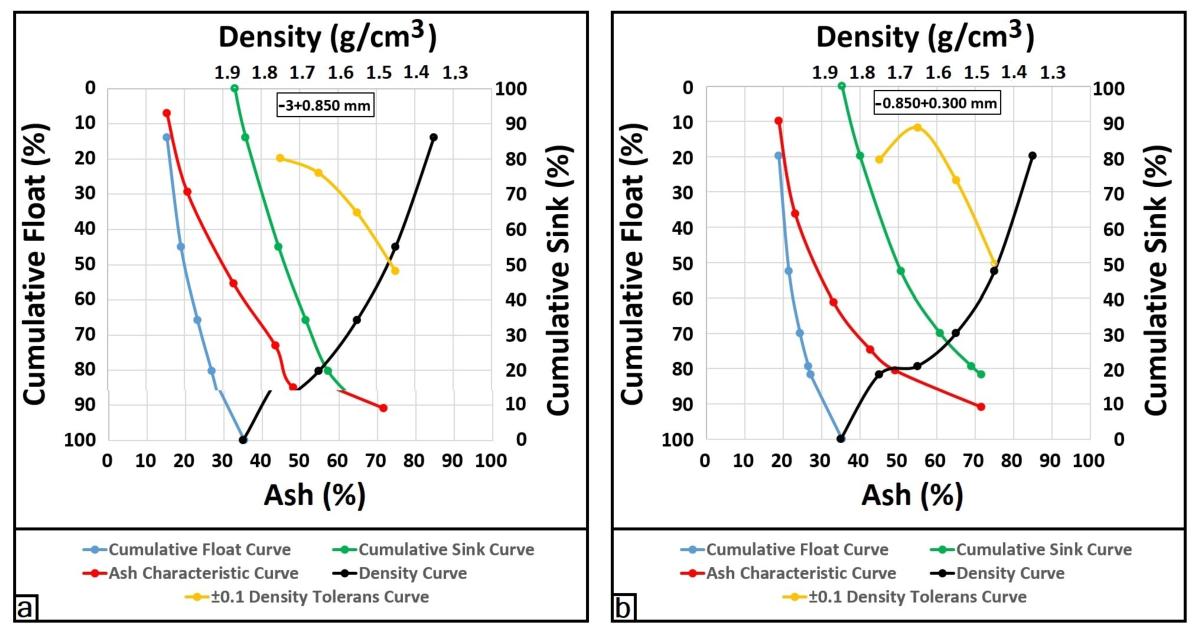
Float–sink tests were conducted at two different size fractions (−3.000 + 0.850 and −0.850 + 0.300 mm) to evaluate the gravity concentration of the lignite coal sample. Subsequently, washability (Henry-Reinhardt) curves were plotted from the float–sink test results, and the results are shown in Figure 3.
Figure 3.
The float–sink (Henry-Reinhardt) curves for two different coal size fractions (−3 + 0.850 mm (a) and −0.850 + 0.300 mm (b)) of lignite coal samples.
As can be seen from the washability curves in Figure 3, specifically the ash characteristic curve and the ±0.1 density tolerance curve, the coal sample exhibits difficult washability. Based on the washability curve results, the gravity concentration of the lignite coal sample did not appear to be technically feasible; therefore, flotation was considered a more suitable for concentration method.
2.2. Flotation Tests
For gravity concentration, the lignite sample, which had been reduced to below 3 mm, was further ground in a laboratory-type rod mill to under 0.600 mm to achieve a suitable size for flotation, after which flotation tests were conducted.
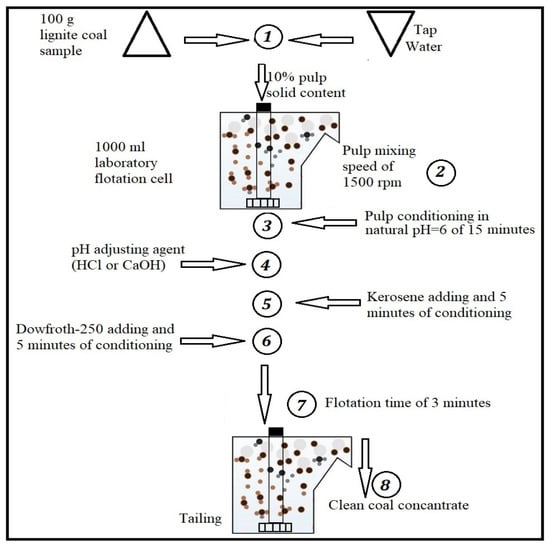
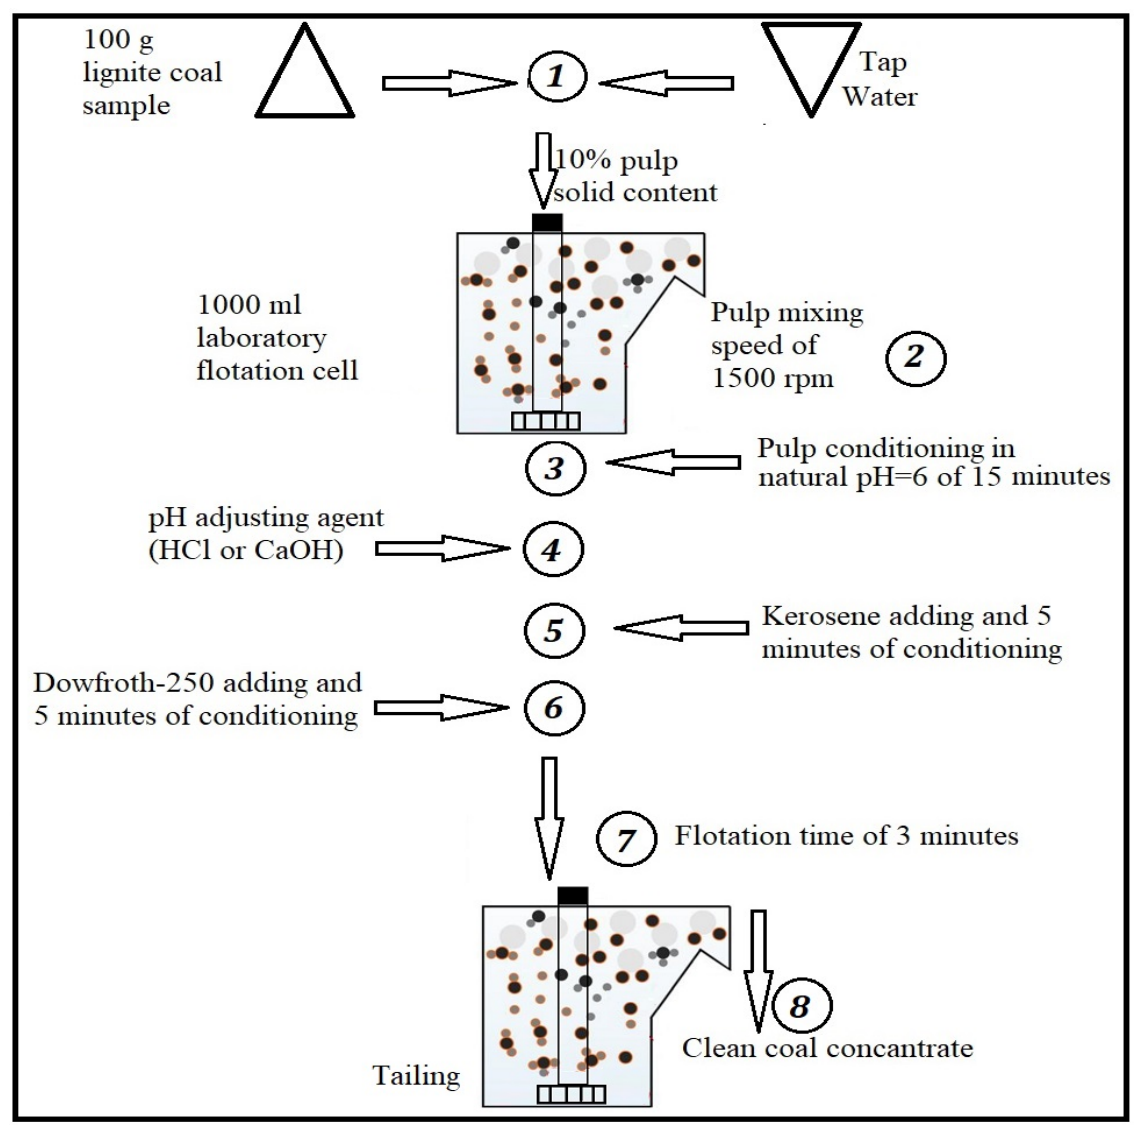
A laboratory-scale flotation machine with a 1000 mL cell was used in the flotation tests. The pulp mixing speed was set to 1500 rpm, and the pulp solid content was adjusted to 10%. For each flotation test, 100 g of coal sample was mixed with tap water to soak the coal at its natural pH (pH = 6) for 15 min in the flotation cell before adding any reagent. In the initial experimental conditions, 3000 g/t kerosene was added as a collector, and the pulp was conditioned for an additional 5 min. Subsequently, 2800 g/t Dow Froth-250 was added as a frother, and the pulp underwent another 5 min of conditioning. Then, air was introduced into the flotation pulp, and the clean coal concentrate was collected as froth for 3 min. The steps of the laboratory flotation experiments conducted in this study are shown in the flowchart in Figure 4. After completing the flotation process, the clean coal concentrate and tailings were filtered and dried in a drying oven at 105 °C to constant weight, and the ash content was determined according to ASTM D3174-12 (2020) [30].
Figure 4.
Flowchart showing the stages of flotation experiments.
For each flotation parameter, two verification tests were conducted. If the results of the two parallel tests were very close (less than 5% deviation between the two tests), their arithmetic mean was taken, and the next flotation tests were performed. If the results of both tests differed by more than 5% in terms of clean coal content and ash content, a third test was conducted, and the arithmetic mean of the results of the three tests was taken, and the flotation tests for the next flotation parameter were performed.
In laboratory experiments, flotation performance for each parameter was evaluated based on the combustible recovery (CR, %) and ash content (AC, %) of clean coal concentrate. These metrics are standard measures used across coal concentration studies. The ash contents of the coal concentrate and tailings were determined by ash analysis, and the CR was calculated using Equation (1) below.
where WC is the weight of clean coal (g), ACC is the ash content of coal concentrate (%), and WF and ACF are the weight (g) and ash content (%) of the lignite coal sample used in the flotation tests, respectively [31].
3. Results and Discussion
3.1. Results of Flotation Tests
3.1.1. Effect of Kerosene Dosage
Kerosene is among the most widely used hydrocarbon-based collectors in coal flotation due to its availability and cost-effectiveness. To determine the optimal kerosene dosage, kerosene trials were conducted at concentrations of 1000, 2000, 3000, and 4000 g/ton.
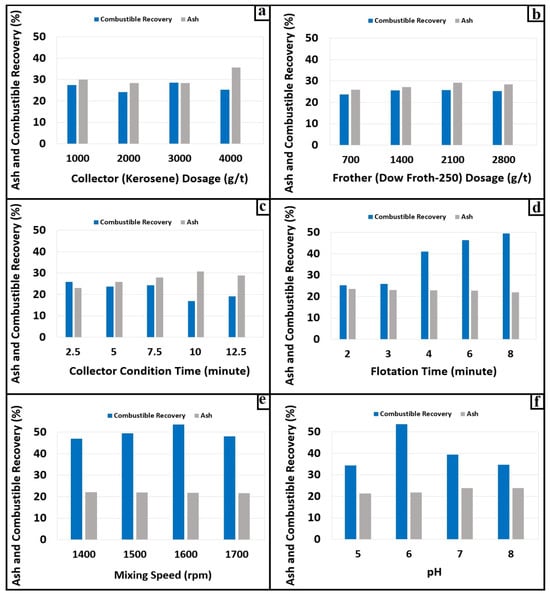
The flotation performance of kerosene is shown in Figure 5a. Test results indicate that at low kerosene doses, coal particles become more hydrophobic, whereas at high kerosene doses above 3000 g/t, coal particles clump together, carrying gangue minerals into the froth and increasing the ash content of the clean coal concentrate.
Figure 5.
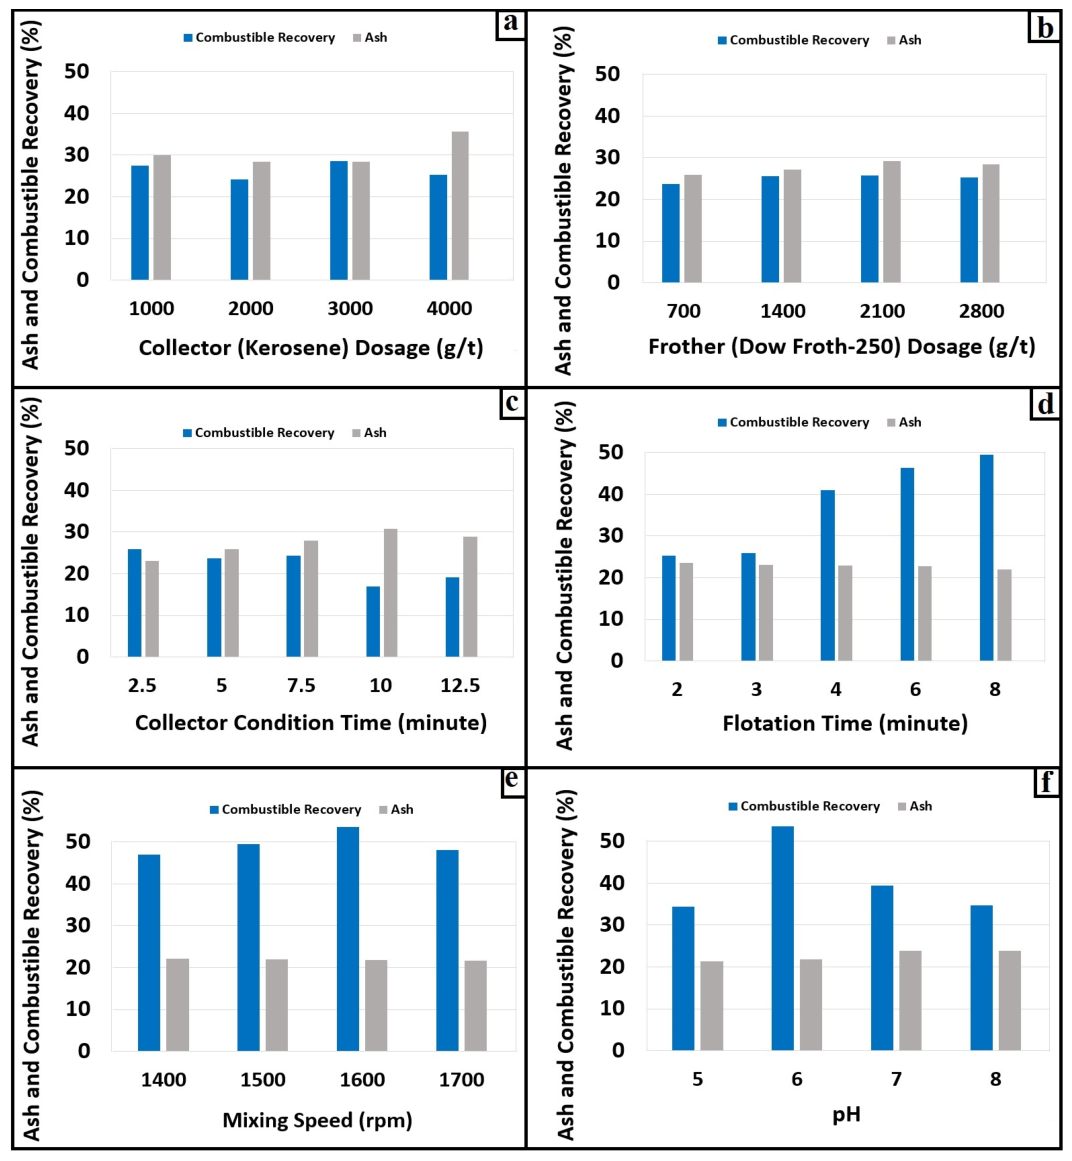
The trends in CR and AC depending on some operating parameters in the flotation tests. (a) collector dosage; (b) frother dosage; (c) collector condition time; (d) flotation time; (e) mixing speed; (f) pH.
Under all tested conditions, combustible recovery values were generally low. The highest combustible recovery observed was approximately 29% at a kerosene dosage of 3000 g/t, indicating that, based on collector dosage, combustible recovery is limited in lignite flotation under the conditions studied. In coal flotation, oily collectors such as kerosene typically have relatively low reagent consumption, especially for high-rank coals, which are naturally hydrophobic. However, low-rank coals, such as lignite, require higher collector dosages because of various oxygen-containing functional groups, such as hydroxyl, carboxyl, and carbonyl, on their surface. Additionally, the low flotation performance can be attributed to the surface properties of lignite. These functional groups increase the hydrophilicity of the coal surface, significantly hindering the adsorption of the non-polar kerosene collector and thereby reducing particle-bubble adhesion and overall flotation performance. These results align with previous research showing the limited effectiveness of non-polar collectors like kerosene in the flotation of low-rank lignite coals [13,32,33,34,35,36].
3.1.2. Effect of Frother (Dow Froth-250) Dosage
In coal flotation, frothers are used to create both small bubbles and stable froth, and their use in conjunction with oily reagents such as kerosene also increases flotation performance [13,37].
To determine the optimal amount of frother dosage, 700, 1400, 2100, and 2800 g/t Dow Froth-250 amounts were used in tests, and the test results are shown in Figure 5b. From these results, the optimal amount of frother was determined to be 700 g/t. Adding more frother reduces the coal’s hydrophobicity by forming a second adsorption layer on the surface. Furthermore, increasing the frother dose also tended to increase the ash content of the clean coal, possibly due to non-selective adsorption. Therefore, using small amounts of frother is preferable for most lignite coals [37].
3.1.3. Effect of Kerosene Condition Time
In coal flotation, the collector conditioning time greatly affects the flotation efficiency. Longer collector conditioning times can make the coal surface more hydrophilic. This can sometimes cause the collector to detach from the oxidized coal surface, resulting in reduced combustible recovery. Additionally, as the collector conditioning time increases, particles with high ash content can clump together and be floated, allowing them to be easily concentrated by the bubbles [38]. Piskin and Akgun (1997) [39] showed that short conditioning, even just 1 min, can be favorable for flotation efficiency in the flotation of an oxidized and low-rank coal.
To identify the optimal kerosene conditioning time, tests were conducted at 2.5, 5.0, 7.5, 10.0, and 12.5 min, with the results shown in Figure 5c. Based on these results, the optimal conditioning time for the kerosene collector was determined to be 2.5 min. Similar results to those reported by Piskin and Akgun (1997) [39] and Xia et al. (2012) [38] on the effect of collector conditioning in coal flotation were also observed in this study.
3.1.4. Effect of Flotation Time
To determine the optimal flotation time, tests were conducted at 2, 3, 4, 6, and 8 min, and the results are shown in Figure 5d. Based on these results, the optimal flotation time was determined to be 8 min.
Flotation time has the strongest positive linear effect on combustible recovery across all variables. This demonstrates that, as with all flotation processes, increasing flotation time increases the likelihood of particle-bubble collisions and adhesion, thereby improving combustible recovery. On the other hand, as the flotation time increases, the likelihood of unwanted particles (gangue minerals) adhering to the froth also increases, which explains the increase in ash content of the clean coal concentrate.
3.1.5. Effect of Pulp Mixing Speed
To determine the optimal pulp mixing speed, tests were conducted at 1400, 1500, 1600, and 1700 rpm, and the results are shown in Figure 5e. Based on these results, the optimal mixing speed was determined to be 1600 rpm.
Increasing the pulp mixing speed from 1400 rpm to 1600 rpm increases the likelihood of contact between coal particles and the collector (kerosene), thereby increasing combustible recovery. On the other hand, after 1600 rpm, the combustible yield begins to decrease because the coal particles adhering to the froth phase lose their ability to hold on due to increased turbulence within the pulp.
3.1.6. Effect of pH Value of Pulp
To improve coal flotation performance, adjusting the pH of the coal surface is a commonly used parameter to enhance coal hydrophobicity [40]. Tests were conducted at pH 5, 6, 7 and 8 to determine the optimal pH value. According to the results shown in Figure 5f, the optimal pH value for the flotation paste was found to be 6, which is the natural pH value. This study showed similar results to the previous findings of Liu et al. (1994) [41] that the flotation performance of the coal sample decreased sharply, especially when the pH exceeded 7.
The decrease in combustible recovery with increasing pH above 7 may be related to the ionization of carboxyl (COOH), carbonyl (C═O), and phenolic polar groups in the lignite sample; this ionization increases hydration via hydrogen bonding with water molecules [32,33,34,35,36].
Some researchers have suggested that humic substances, which are products of coal surface oxidation, significantly affect coal flotation, making the zeta potential values of both kerosene droplets and coal particles much more negative. Therefore, it has been argued that conditioning lignite coal with small amounts of kerosene (or fuel oil) for a few minutes leads to much better selectivity and a significant increase in combustible recovery [42,43]. Additionally, in the flotation process, humic substances in coal readily adsorb onto the surface of fresh coal, increasing the coal’s hydrophobicity and thereby improving flotation efficiency. Adsorption of humic substances peaks at a pulp’s natural pH and decreases both below and above the natural pH [43]. On the other hand, Firth and Nicol (1981) [44] stated that although humic matter does not negatively affect coal flotation, it interacts with the surfaces of clay particles adsorbed onto them, rendering them hydrophobic and thereby hindering coal flotation. This study also points to a similar situation regarding the effect of humic substances in low-quality lignite coals on the efficiency of the flotation process.
3.2. Mathematical Modelling
3.2.1. Multi Linear Regression (MLR) Modelling
In this study, the relationships between the independent variables, namely combustible recovery (CR) and ash content (AC) of clean coal concentrate, and the 6 different dependent variables in flotation (collector and frother dosages, collector conditioning and flotation time, pulp mixing speed, and pulp pH value) were first examined using multivariate linear regression (MLR) analysis. In estimating the value of the dependent variable, MLR models are expressed as a linear function. The choice of the MLR model is determined according to the coefficients of determination of the relationships to be obtained, as seen in Equation (2) [17,18,45].
where, while Y is the dependent variable, X1, X2, X3, X4, X5, X6, …, Xn are independent variables. While β0 is the constant value, β1, β2, β3, β4, β5, β6, …, βn are the regression coefficients of linear independent variables [17,18].
Y = β0 + β1X1 + β2X2 + β3X3 + β4X4 + β5X5 + β6X6 + … + βnXn
Because MLR analyses involve complex calculations, they were performed using IBM SPSS 22.0., a statistical software package. The IBM SPSS 22.0. was used to generate MLRs between six independent variables (the collector dosage (X1), the frother dosage (X2), the collector conditioning time (X3), the flotation time (X4), the pulp mixing speed (X5), the pH value (X6)) and a dependent variable as output CR (Y1) or AC (Y2) of coal concentrate.
The most reliable regression equations for estimating the combustible recovery (CR) and ash content (AC) of clean coal concentrate obtained by the flotation tests using the MLR model are presented in Equations (3) and (4).
CR (%) = 67.57 + (0.0001 × X1) + (0.0001 × X2) − (1.346 × X3) + (3.34 × X4) − (0.019 × X5) − (2.504 × X6) R2 = 0.540
AC (%) = 10.011 + (0.002 × X1) + (0.003 × X2) + (0.722 × X3) − (0.283 × X4) + (0.0001 × X5) + (1.021 × X6) R2 = 0.575
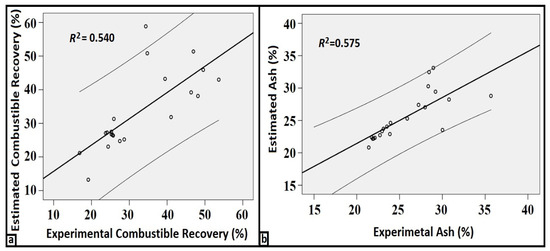
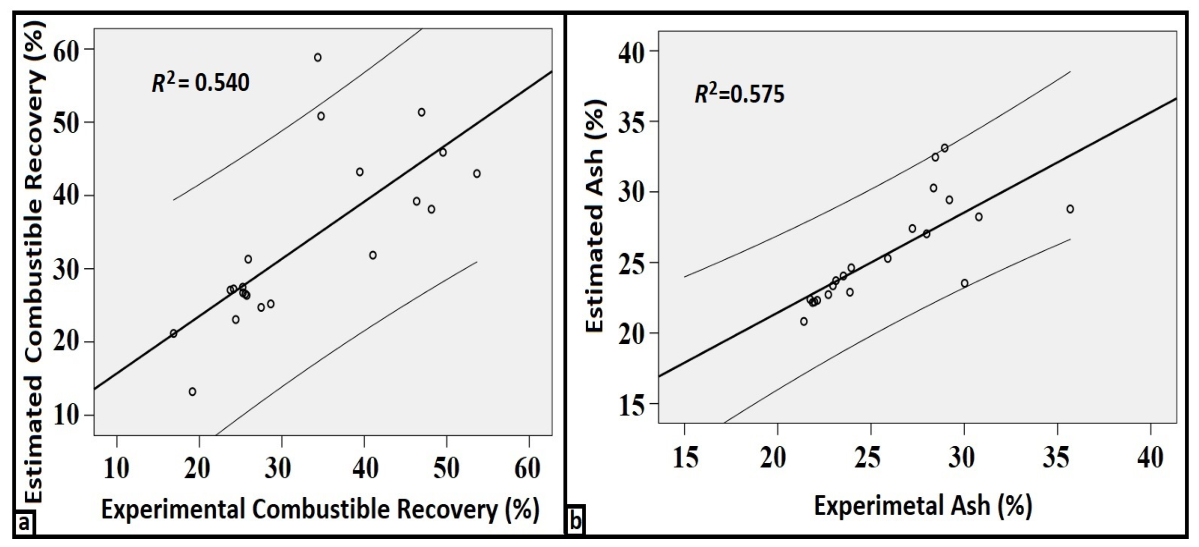
The relationships between the CR and AC values of clean coal concentrate, estimated using the MLR equations obtained, and the experimental results from flotation tests are shown in Figure 6.
Figure 6.
Relationship between experimental and estimated values for the CR (a) and the AC (b) of the clean coal concentrate.
From MLR analysis results, VIF, T, D-W, and β (beta) values are important statistical indicators that help determine whether there is autocorrelation in the data. If the mean variance inflation factor (VIF) value is greater than 3.0 and each VIF value is greater than 10.0, the regression has low reliability and the independent variables are interdependent. Additionally, when the tolerance (T) value is less than 0.10, the independent variables are interdependent. Furthermore, a Durbin–Watson (D-W) statistic between 1.5 and 2.5 (around 2) indicates no autocorrelation among the independent variables. Finally, the larger the absolute value of β (beta) for the independent variable, the stronger the evidence that it influences the dependent variable [46,47].
Table 3 and Table 4 present the results of the ANOVA analysis, which statistically compared the results of the MLR equations estimating CR and AC values of coal concentrate, obtained via SPSS 22.0., with the experimental data.
Table 3.
The statistical factors for combustible recovery (CR) of coal concentrate by MLR model.
Table 4.
The statistical factors for ash content (AC) of coal concentrate by MLR model.
The R2 values of the MLR model equations obtained regarding the CR and AC of clean coal concentrate were found to be 0.720 and 0.856, respectively. Furthermore, the F values were 9.591 and 20.777 (for p = 0.000), respectively, which are a moderate-to-good significance for both equations, especially for the AC (%) of the clean coal concentrate. Additionally, the mean absolute error (MAE) and root mean square error (RMSE) values, used to reveal the variation in error between experimental data and the model equations used to estimate the CR and AC of coal concentrate, were found to be 0.178 and 0.054 for MAE and 8.131 and 2.561 for RMSE, respectively.
Additionally, as shown in Table 3 and Table 4, the D-W values for CR and AC of clean coal were 1.756 and 2.286, respectively, both close to 2, indicating no autocorrelation among the six independent variables. Furthermore, the fact that T values are significantly higher than 0.10 and VIF values are significantly lower than 3.0 indicates that there is no multicollinearity among the independent variables. In addition, the larger the absolute values of β in Table 3 and Table 4, the greater the influence of the independent variables on the resulting model equations. It was determined that flotation time (X4) contributed most to combustible recovery (β = −0.734), while froth dosage (X2) contributed most to ash content (β = 0.642). In conclusion, a moderate-to-good significance relationship was found between CR and AC of clean coal across six different dependent variables.
Consequently, there is a moderate to good correlation between the values obtained using Equations (3) and (4). On the other hand, using artificial neural networks (ANNs), a type of machine learning method, a much stronger correlation can be achieved between experimental values and the values estimated by the ANN model.
3.2.2. Artificial Neural Network (ANN) Modelling
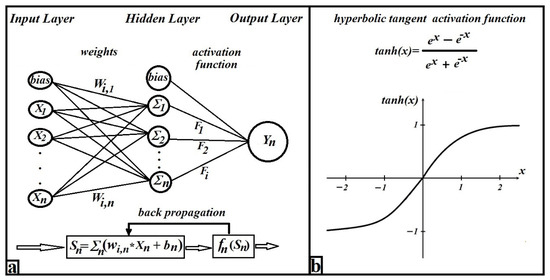
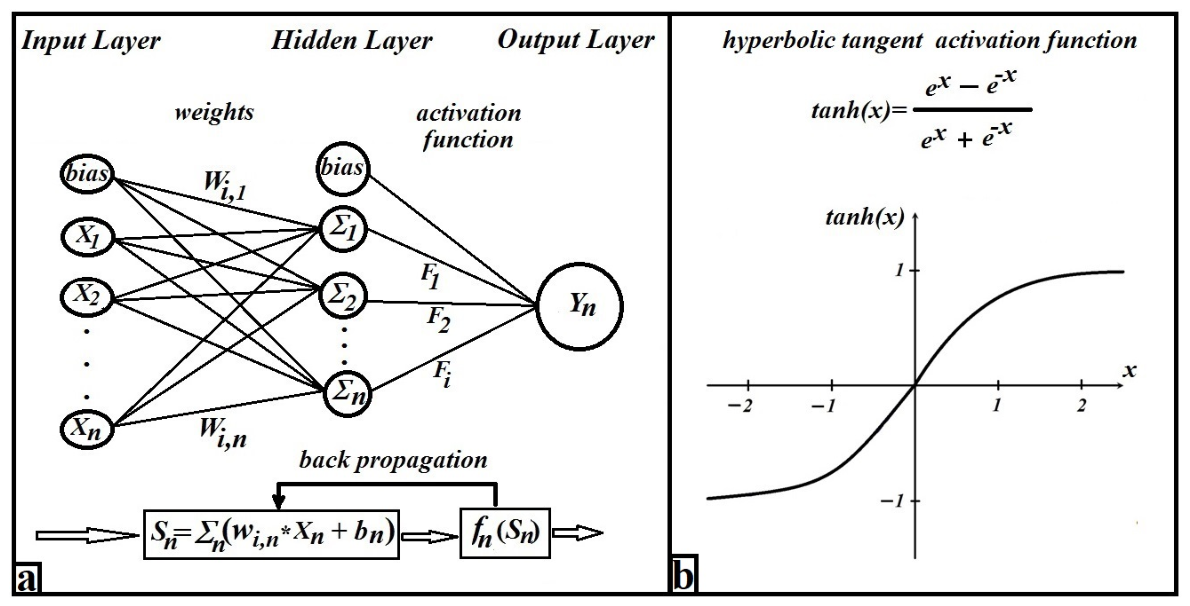
ANNs are widely used to optimize complex nonlinear processes and estimate desired outputs from one or more inputs, similar to multivariate nonlinear regression (MNLR) analyses [48,49]. ANNs consist of interconnected neurons and various input, hidden, and output layers that operate both sequentially and in parallel. Although many studies use different types of artificial neural networks (ANNs), the most widely used is the backpropagation ANN (BP-MLP-ANN) with a hyperbolic tangent activation function, as it has proven to be the most effective approach [18,46,50]. The general structure of the backpropagation model for an BP-MLP-ANN and its hyperbolic tangent activation function are shown in Figure 7a and Figure 7b, respectively. Furthermore, the hyperbolic tangent activation function is given in Equation (5).
Figure 7.
(a) A general ANN model architecture; (b) hyperbolic tangent activation function.
In this study, the ANN model was constructed with three layers: input, hidden, and output, each consisting of neurons. 70% of the data were used to train, and 30% were used to test the ANN model in SPSS 22.0. The independent variables, namely collector and frother dosages, conditioning and flotation times, pulp mixing speed, and pulp pH, were included as six covariates in the ANN model’s input layer. Additionally, a single hidden layer and a cross-validation method with 1 to 4 layers were tested according to the Hyperbolic Tangent activation function. The CR and AC of the obtained coal concentrate were separately included as dependent variables in the ANN model’s output layer, and the ANN was then trained.
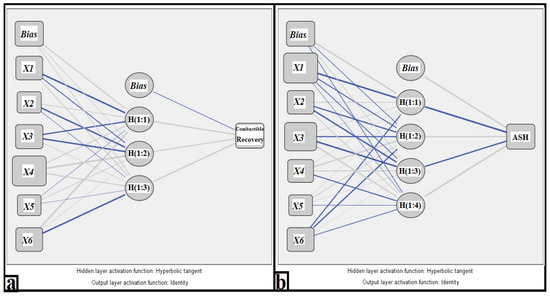
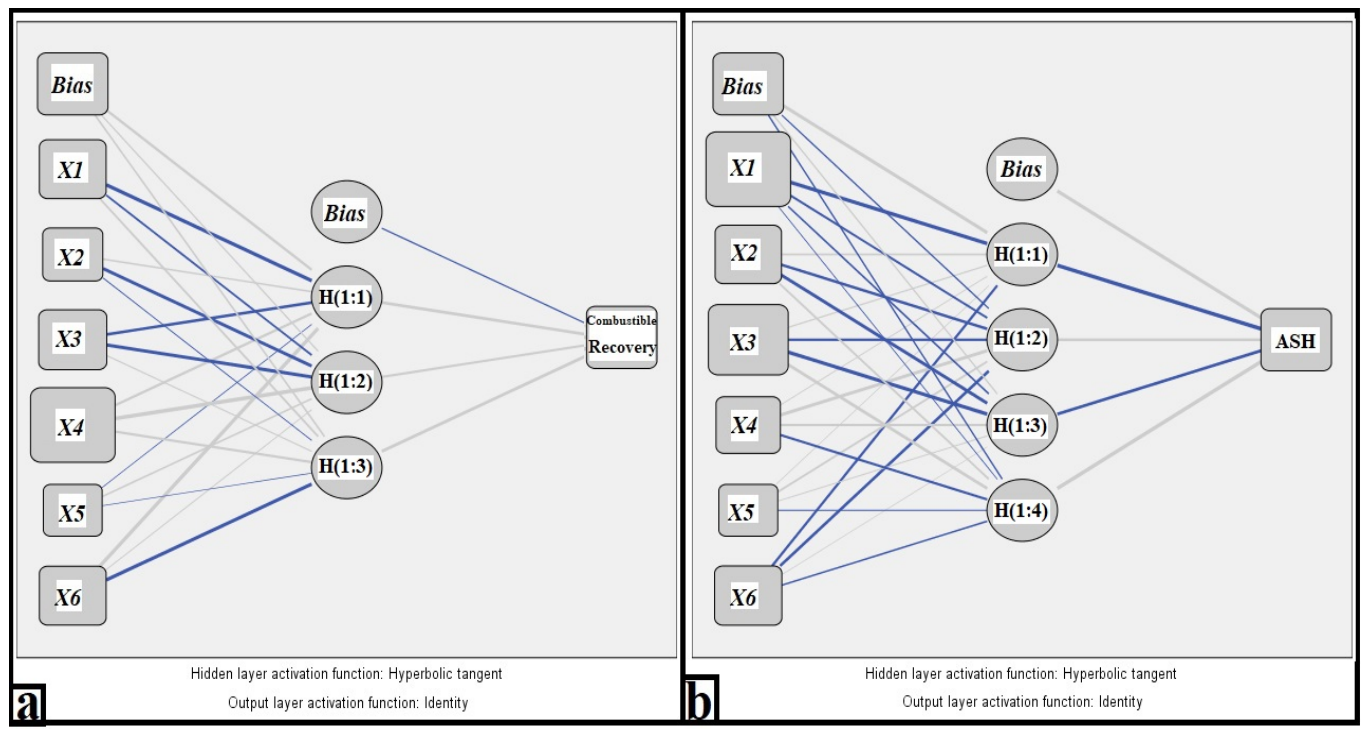
As a result of the tests, to best estimate the CR of coal concentrate, the ANN3 model (6-3-1 structure) consisting of an input layer with 6 input variables, a hidden layer with 3 neurons [H(1:3)], and an output layer with one output variable, as shown in Figure 8a, was selected based on the highest R2, lowest MAE and RMSE values. Similarly, to best estimate the AC of coal concentrate, the ANN4 model (6-4-1 structure) consisting of an input layer with 6 input variables, a hidden layer with 4 neurons [H(1:4)], and an output layer with one output variable, as shown in Figure 8b, was selected based on the best R2, MAE, and RMSE values. The statistical parameters of the best artificial neural network (ANN) models in this study are presented in Table 5. To evaluate the reliability of the selected MLR and ANN models, the R2, MAE, and RMSE equations given in Equations (6)–(8) were used.
where ŷi and yi are the estimated and experimental values, respectively. ŷ is the average of the experimental values, and n is the number of experiments.
Figure 8.
The best ANN model architectures used to determine the CR (a) and AC (b) of coal concentrate.
Table 5.
Comparison of statistical parameters of the ANN models.
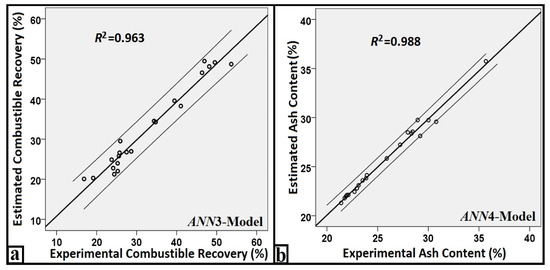
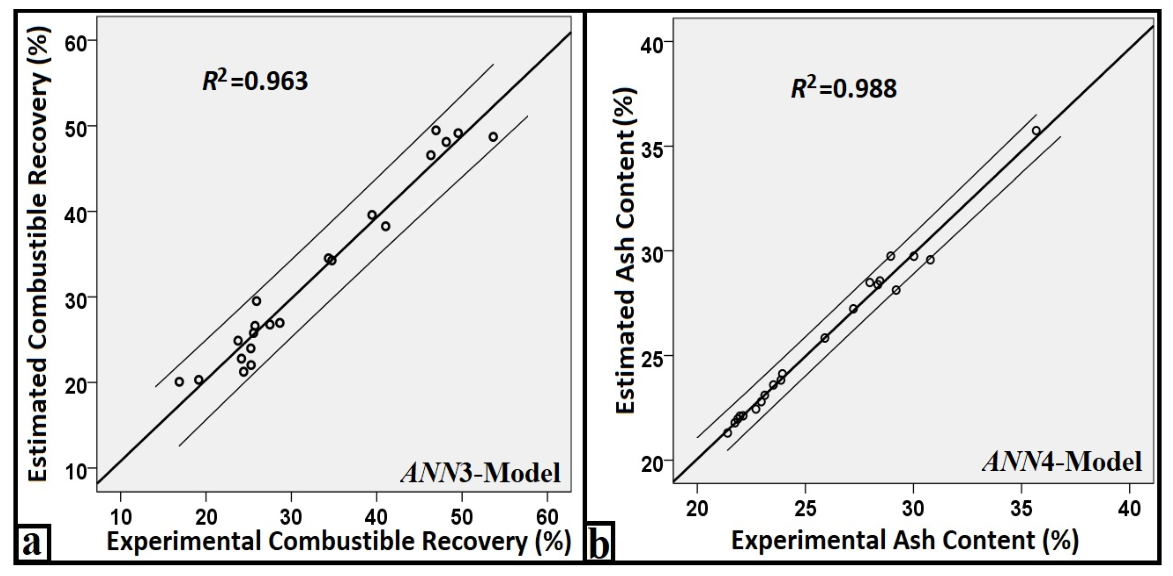
To understand whether ANN models accurately estimate experimental results, the regression relationships of the best models (ANN3 and ANN4) obtained from the ANN study are shown in Figure 9. Additionally, the R2, RMSE, and MAE values obtained by the ANN models are given in Table 5. From the values in Table 5, it can be seen that the ANN1 [H(1:1)], ANN2 [H(1:2)], ANN3 [H(1:3)], and ANN4 [H(1:4)] models exhibit a very realistic approach with very small error values.
Figure 9.
Comparison of estimated values obtained the best ANN models and the experimental values of the CR (a) and AC (b) of coal concentrate.
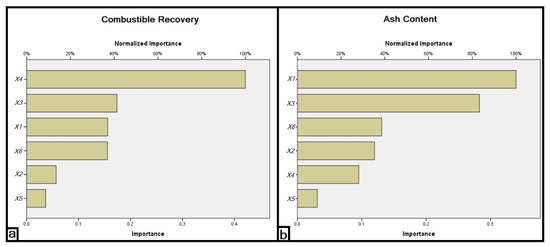
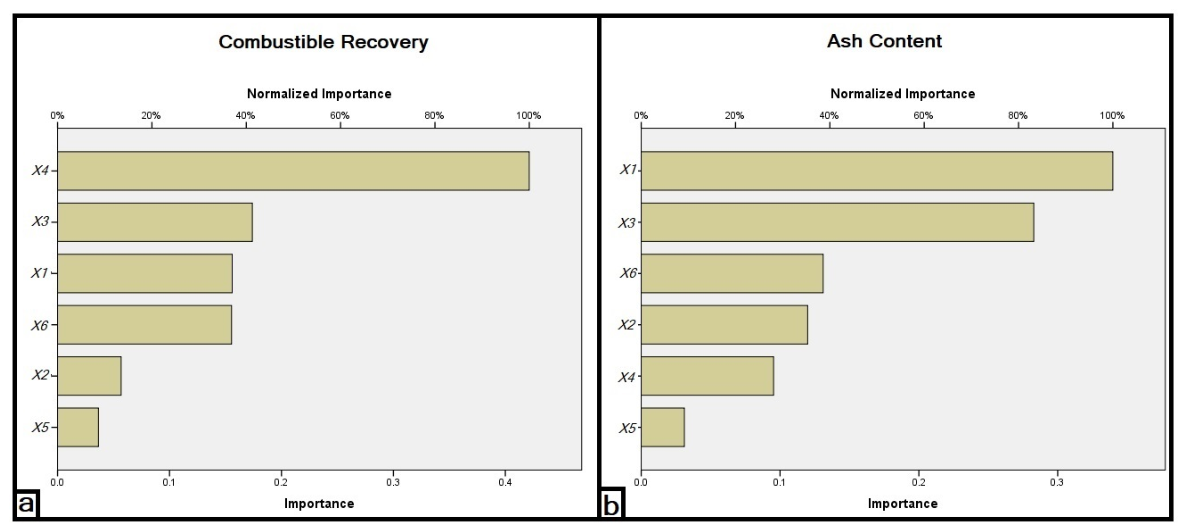
Normalized significance is one of the most important elements for analysing the interpretability of ANN methods. The significance level shows how much each variable affects the model, thereby increasing the transparency of the estimated model. Figure 10 shows the significance levels of the independent variables affecting the artificial neural network models that best estimate the CR and AC of coal concentrate. According to the normalized importance values obtained by the ANN models, it was found that flotation time (X4) has a 100% importance value for CR and collector dosage (X1) has a 100% significant effect on the AC. Additionally, it was found that three hidden neurons had the greats effect on the CR, while four hidden neurons were responsible for the AC of the coal concentrate according to the hidden neurons’ weights.
Figure 10.
Normalized important relations between experimental and estimated values from ANN models. (a) Combustible recovery; (b) Ash content.
4. Discussion
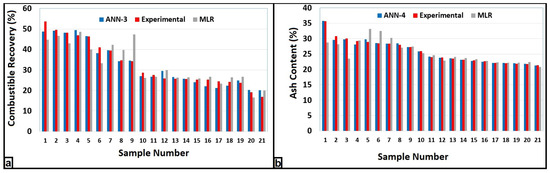
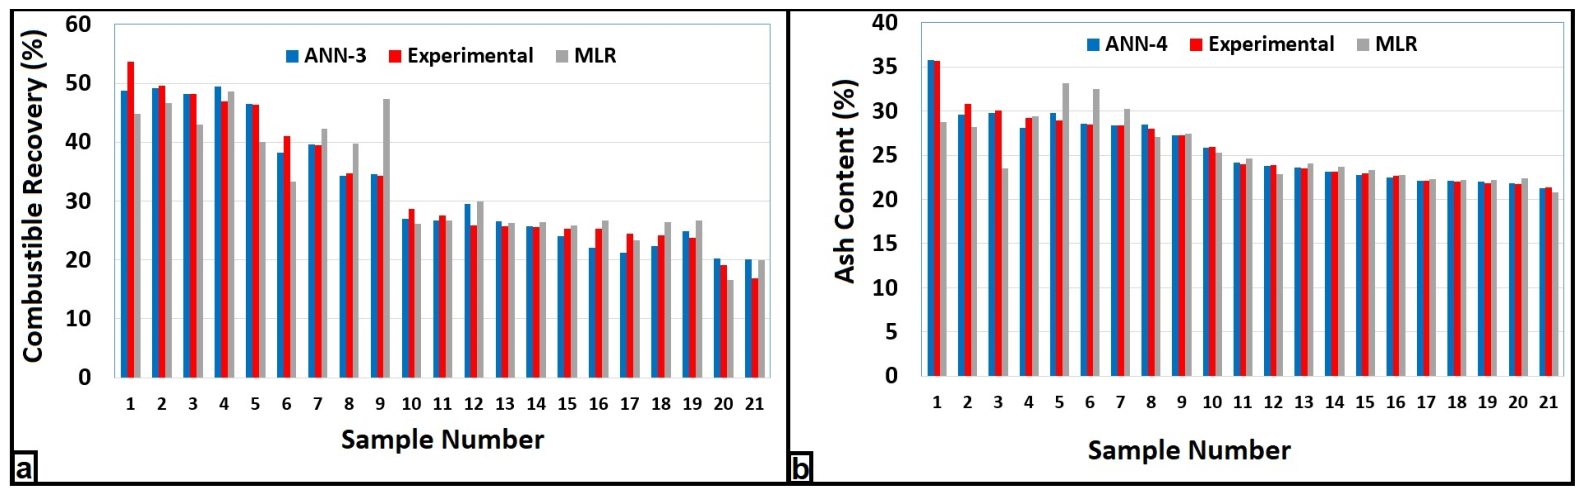
A comparison of the estimated values obtained using of the MLR and the best ANN models for each of the 21 experimental datasets for the CR and AC of clean coal concentrates is shown in Figure 11. The results show that MLR models can estimate CR and AC with moderate-to-good accuracy within acceptable limits for the CR of the clean coal concentrate, the accuracy of the MLR estimations was significantly low. On the other hand, as shown in Table 6, ANN models were found to provide more realistic results than MLR models because they had the lowest MAE and RMSE values and the highest R2 values when estimating the CR and AC of clean coal concentrate.
Figure 11.
Comparison plots of the estimated values from the MLR and the best ANN models with experimental values of CR (a) and AC (b) of the clean coal concentrate.
Table 6.
Comparison of statistical parameters of the MLR and the best ANN models.
The ANN models exhibit R2 values above 0.963, indicating a very good relationship and estimates with acceptable accuracy. Additionally, RMSE and MAE values indicate that ANN4’s CR estimates have smaller errors than those of the other ANN models. Moreover, the RMSE and MAE values of the ANN models were very low, given the complexity of the flotation process. Therefore, ANNs appear more reliable, although MLR models can be used to estimate the CR and AC of coal concentrate.
Flotation plant operators are often interested in flotation modeling for optimization purposes, as the primary goal of every flotation plant is to increase process recovery and concentrate quality. However, online concentrate quality (grade or ash) and recovery are generally not consistently measurable in flotation plants. On-line quality measurement of concentrate grade (ash) is very expensive, often inaccurate, and can be impossible for certain elements. Therefore, parameters affecting flotation are not commonly used for on-line control. Furthermore, the continuous operation of flotation plants makes it impossible to test every parameter affecting flotation, and each test would be very time-consuming and costly.
Many researchers [17,18,20,21,22,23,24,25,26,27,28] were primarily interested in flotation modeling for optimization to overcome these challenges and costs. For this purpose, it has been shown that estimating concentrate quality and recovery can be more easily achieved using various machine learning methods (ANFIS, FD, RF, etc.) that employ nonlinear approaches rather than MLR models.
In this study, an interesting application of artificial neural networks (ANNs), one of the most modern techniques and nonlinear approaches, using both existing linear MLR approaches, was carried out in a flotation of lignite coal sample. As a result, it was also shown that ash content and combustible material recovery values can be predicted with quite good accuracy in coal flotation concentrate using ANN models depending on specific flotation parameters.
5. Conclusions
In the first stage of this study, float–sink tests were carried out to determine whether the concentration of lignite coal sample from the Eskişehir-Mihalıççık (Türkiye) region could be concentrated using gravity methods. However, since the float–sink test results indicated that gravity concentration was not technically feasible, it was decided to apply the flotation method to the coal sample.
The reason for the failure of the gravity concentration for the lignite coal sample was the fine distribution of gypsum crystals (between 3 mm and 0.1 mm in size), named “gypsum roses”, within the coal. It was determined that the concentration of the lignite coal sample by flotation was necessary.
For this purpose, the size of the coal sample was first reduced to below 0.600 mm, which was suitable for flotation. In subsequent studies, the effects of kerosene dosage as a collector, Dow Froth-250 dosage as a frother, required collector conditioning time, flotation time, pulp pH, and pulp mixing speed were investigated, and optimum results were obtained.
It was concluded that, using parameters affecting the coal flotation process, both combustible recovery (CR) and ash content (AC) of the coal concentrate could be successfully estimated using artificial neural network (ANN) models. The results showed that the ANN architecture optimized for estimating CR and AC consists of six input nodes, one hidden layer (containing 1 to 4 neurons), and one output node. Using ANN as a nonlinear method increased the estimation accuracy of both CR and AC. Compared with multivariate linear regression (MLR), the ANN models produced lower RMSE and MAE values and higher R2 values on the validation dataset.
Funding
This research received no external funding.
Data Availability Statement
The original contributions presented in this study are included in the article. Further inquiries can be directed to the author.
Acknowledgments
The author would like to express sincere appreciation to N. Gunes and E. Dinler for their valuable contributions in analyses of the samples.
Conflicts of Interest
The author declares no conflicts of interest.
Abbreviations
The following abbreviations are used in this manuscript:
| CR | Combustible Recovery |
| AC | Ash Content |
| MLR | Multivariable Linear Regression |
| MNLR | Multivariable Nonlinear Regression |
| ANN | Artificial Neural Network |
| SPSS | Statistical Package for the Social Sciences |
| ANFIS | Adaptive Neuro-Fuzzy Inference System |
| FD | Factorial Design |
| RF | Random Forest |
| ASTM | American Society for Testing Materials |
| R2 | Coefficient of Regression |
| VIF | Variance Increases Factor |
| T | Tolerance |
| D-W | Durbin Watson |
| β | (Beta) Statically constant |
| F | Statically constant |
| ANOVA | ANalysis Of VAriance |
| RMSE | Root Mean Squared Error |
| MAE | Mean Absolute Error |
References
- Deniz, V.; Balta, G.; Yamık, A. The interrelationships between Bond grindability of coals and impact strength index (ISI), point load index (Is) and Friability index (FD). In Changing Scopes in Mineral Processing; Kemal, M., Arslan, V., Akar, A., Canbazoglu, M., Eds.; A.A. Balkema: Rotterdam, The Netherlands, 1996; pp. 15–19. [Google Scholar]
- Deniz, V. The effects of moisture content and coal mixtures on the grinding behavior of two different coals. Energy Sources Part A 2014, 36, 292–300. [Google Scholar] [CrossRef] [Scilit]
- Leonard, J.W. Coal Preparation, 4th ed.; AIME: New York, NY, USA, 1979. [Google Scholar]
- Umucu, Y.; Deniz, V. A study simulation and modeling on the performance of the heavy media cyclone in coal beneficiation. AGH J. Min. Geoeng. 2012, 36, 179–185. [Google Scholar]
- Abbott, J.; Miles, N.J. Smoothing and interpolation of float-sink data for coals. Miner. Eng. 1991, 4, 511–524. [Google Scholar] [CrossRef] [Scilit]
- Govindarajan, B.; Rao, T.C. A simple equation for float sink data. Miner. Eng. 1994, 7, 1441–1446. [Google Scholar] [CrossRef] [Scilit]
- Deniz, V.; Umucu, Y.; Çayırlı, S. Prediction of the Bond grindability index from the sink-float test data of coals. Energy Sources Part A 2013, 35, 1385–1391. [Google Scholar] [CrossRef] [Scilit]
- Hoşten, Ç.; Muratoğlu, R.A. A preliminary study on split feed flotation of Turkish bituminous coal fines. Fuel 1996, 75, 651–653. [Google Scholar] [CrossRef] [Scilit]
- Güney, A.; Önal, G.; Ergut, Ö. Beneficiation of fine coal by using the free jet flotation system. Fuel Process. Technol. 2002, 75, 141–150. [Google Scholar] [CrossRef] [Scilit]
- Yoon, R.H. Microbubble flotation. Miner. Eng. 1993, 6, 619–630. [Google Scholar] [CrossRef] [Scilit]
- Heiser, N. Coal flotation technical review. Aust. Coal Rev. 1996, 1, 34–36. [Google Scholar]
- Honaker, R.Q.; Das, A. Ultrafine coal cleaning using a centrifugal fluidized-bed separator. Coal Prep. 2004, 24, 1–18. [Google Scholar] [CrossRef] [Scilit]
- Laskowski, J. Coal Flotation and Fine Coal Utilization; Elsevier: Amsterdam, The Netherlands, 2001. [Google Scholar]
- Demir, U.; Yamik, A.; Kelebek, S.; Oteyaka, B.; Ucar, A.; Sahbaz, O. Characterization and column flotation of bottom ashes from Tuncbilek power plant. Fuel 2008, 87, 666–672. [Google Scholar] [CrossRef] [Scilit]
- Ozdemir, O.; Taran, E.; Hampton, M.A.; Karakashev, S.I.; Nguyen, A.V. Surface chemistry aspects of coal flotation in bore water. Int. J. Miner. Process. 2009, 92, 177–183. [Google Scholar] [CrossRef] [Scilit]
- Niu, C.; Xia, W.; Li, Y.; Bu, X.; Wang, Y.; Xie, G. Insight into the low-rank coal flotation using amino acid surfactant as a promoter. Fuel 2022, 307, 121810. [Google Scholar] [CrossRef] [Scilit]
- Deniz, V. Application of multiple linear regression (MLR) analysis for concentration of chromite tailings by the flotation. Physicochem. Probl. Miner. Process. 2020, 56, 579–589. [Google Scholar] [CrossRef] [Scilit]
- Deniz, V.; Umucu, Y.; Deniz, O.T. Estimation of grade and recovery in the concentration of barite tailings by the flotation using the MLR and ANN analyses. Physicochem. Probl. Miner. Process. 2022, 58, 150646. [Google Scholar] [CrossRef] [Scilit]
- Deniz, V. The Hardgrove grindability index (HGI) prediction from calorific and proximate analysis values of solid fuel blends using multivariate simple and polynomial regressions. Int. J. Coal Prep. Util. 2026, in press. [Google Scholar] [CrossRef] [Scilit]
- Jovanović, I.; Nakhaei, F.; Kržanović, D.; Conić, V.; Urošević, D. Comparison of Fuzzy and Neural Network computing techniques for performance prediction of an industrial copper flotation circuit. Minerals 2022, 12, 1493. [Google Scholar] [CrossRef] [Scilit]
- Niquini, F.G.F.; Branches, A.M.B.; Costa, J.F.C.L.; Moreira, G.d.C.; Schneider, C.L.; Araújo, F.C.d.; Capponi, L.N. Recursive feature elimination and neural networks applied to the forecast of mass and metallurgical recoveries in a Brazilian phosphate mine. Minerals 2023, 13, 748. [Google Scholar] [CrossRef] [Scilit]
- Amankwaa-Kyeremeh, B.; McCamley, C.; Zanin, M.; Greet, C.; Ehrig, K.; Asamoah, R.K. Prediction and optimisation of copper recovery in the rougher flotation circuit. Minerals 2024, 14, 36. [Google Scholar] [CrossRef] [Scilit]
- Devasahayam, S. Advancing flotation process modeling: Bayesian vs. Sklearn Approaches for gold grade prediction. Minerals 2025, 15, 591. [Google Scholar] [CrossRef] [Scilit]
- Purev, O.; Park, C.H. Optimization of operating variables of molybdenite column flotation using factorial design and statistical techniques. Minerals 2026, 16, 192. [Google Scholar] [CrossRef] [Scilit]
- Li, Y.; Liu, H.; Lu, F. Research on prediction of ash content in flotation-recovered clean coal based on NRBO-CNN-LSTM. Minerals 2024, 14, 894. [Google Scholar] [CrossRef] [Scilit]
- Jorjani, E.; Mesroghli, S.; Chelgani, C.S. Prediction of operational parameters effect on coal flotation using artificial neural network. J. Univ. Sci. Technol. Beijing Miner. Metall. Mater. 2008, 15, 528–533. [Google Scholar] [CrossRef] [Scilit]
- Jorjani, E.; Poorali, H.A.; Sam, A.; Chelgani, S.C.; Mesroghli, S.; Shayestehfar, M.R. Prediction of coal response to froth flotation based on coal analysis using regression and artificial neural network. Miner. Eng. 2009, 22, 970–976. [Google Scholar] [CrossRef] [Scilit]
- Wen, Z.; Zhou, C.; Pan, J.; Nie, T.; Zhou, C.; Lu, Z. Deep learning-based ash content prediction of coal flotation concentrate using convolutional neural network. Miner. Eng. 2021, 174, 107251. [Google Scholar] [CrossRef] [Scilit]
- ASTM D3172-13; Standard Practice for Proximate Analysis of Coal and Coke. ASTM International: West Conshohocken, PA, USA, 2021.
- ASTM D3174-12; Standard Test Method for Ash in the Analysis Sample of Coal and Coke from Coal. ASTM International: West Conshohocken, PA, USA, 2020.
- Jia, R.; Harris, G.H.; Fuerstenau, D.W. An Improved class of universal collectors for the flotation of oxidized and/or low-rank coal. Int. J. Miner. Process. 2000, 58, 99–118. [Google Scholar] [CrossRef] [Scilit]
- Xia, W.; Yang, J.; Liang, C. A short review of improvement in flotation of low rank/oxidized coals by pretreatments. Powder Technol. 2013, 237, 1–8. [Google Scholar] [CrossRef] [Scilit]
- Wen, B.; Xia, W.; Sokolovic, J.M. Recent advances in effective collectors for enhancing the flotation of low/oxidized coals. Powder Technol. 2017, 319, 1–11. [Google Scholar] [CrossRef] [Scilit]
- Mao Bu, X.; Peng, Y.; Tian, F.; Xie, G. Effects of simultaneous ultrasonic treatment on the separation selectivity and flotation kinetics of high-ash lignite. Fuel 2020, 259, 116270. [Google Scholar] [CrossRef] [Scilit]
- Xu, F.; Wang, S.; Kong, R.; Wang, C. Synergistic effects of dodecane-castor oil acid mixture on the flotation responses of low-rank coal: A combined simulation and experimental study. Int. J. Min. Sci. Technol. 2023, 33, 649–658. [Google Scholar] [CrossRef] [Scilit]
- Wang, X.; Ding, R.; Cui, X.; Qin, Y.; Cheng, G.; Abaka-Wood, G.; Li, E. New insights for improving low-rank coal flotation performance via tetrahydrofurfuryl ester collectors. Minerals 2025, 15, 78. [Google Scholar] [CrossRef] [Scilit]
- Kumar, B.; Das, B.; Garain, A.; Rai, S.; Begum, W.; Inamuddin Md Mondal, M.H.; Bahattarai, A.; Saha, B. Diverse utilization of surfactants in coal-floatation for the sustainable development of clean coal production and environmental safety: A review. RSC Adv. 2022, 12, 23973–23988. [Google Scholar] [CrossRef] [Scilit] [PubMed]
- Xia, W.C.; Yang, J.; Liang, C.; Zhu, B. The effects of conditioning time on the flotation of oxidized coal. Energy Sources Part A 2014, 36, 31–37. [Google Scholar] [CrossRef] [Scilit]
- Piskin, S.; Akgun, M. The effect of premixing on the flotation of oxidized Amasra coal. Fuel Process. Technol. 1997, 51, 1–6. [Google Scholar] [CrossRef] [Scilit]
- Piñeres, J.; Barraza, J. Effect of pH, air velocity and frother concentration on combustible recovery, ash and sulphur rejection using column flotation. Fuel Process. Technol. 2012, 97, 30–37. [Google Scholar] [CrossRef] [Scilit]
- Liu, D.; Somasundaran, P.; Vasudevan, T.V.; Harris, C.C. Role of pH and dissolved mineral species in Pittsburgh No. 8 coal flotation system—I. Floatability of coal. Int. J. Miner. Process. 1994, 41, 201–214. [Google Scholar] [CrossRef] [Scilit]
- Laskowski, J.S.; Sirois, L.L.; Moon, K.S. Effect of Humic Acids on coal flotation Part I. Coal flotation selectivity in the presence of humic acids. Coal Prep. 1986, 3, 133–154. [Google Scholar] [CrossRef] [Scilit]
- Lai, R.W.; Wen, W.W.; Okoh, J.M. Effect of humic substances on the flotation response of coal. Coal Prep. 1989, 7, 69–83. [Google Scholar] [CrossRef] [Scilit]
- Firth, B.A.; Nicol, S.K. The influence of humic materials on the flotation of coal. Int. J. Min. Process. 1981, 8, 239–248. [Google Scholar] [CrossRef] [Scilit]
- Kutner, M.H.; Nactsheim, C.J.; Neter, J.; Li, W. Applied Linear Statistical Models, 5th ed.; McGraw-Hill: New York, NY, USA, 2004. [Google Scholar]
- Hair, J.F., Jr.; Anderson, R.E.; Tatham, R.L.; Black, W.C. Multivariate Data Analysis, 5th ed.; Prentice Hall PTR: New York, NY, USA, 1998. [Google Scholar]
- Paulson, D.S. Handbook of Regression and Modelling; Chapman & Hall/CRC: Oxfordshire, UK; Taylor &Francis: Boca Raton, FL, USA, 2007. [Google Scholar]
- Smith, M. Neural Networks for Statistical Modeling, 1st ed.; International Thomson Computer Press: Boston, MA, USA, 1996. [Google Scholar]
- Umucu, Y.; Deniz, V.; Bozkurt, V.; Caglar, F. The evaluation of grinding process using artificial neural network. Int. J. Miner. Process. 2016, 146, 46–53. [Google Scholar] [CrossRef] [Scilit]
- Jain, A.K.; Mao, J.; Mohiddin, K.M. Artificial neural networks: A tutorial. Computer 1996, 29, 31–44. [Google Scholar] [CrossRef] [Scilit]

Disclaimer/Publisher’s Note: The statements, opinions and data contained in all publications are solely those of the individual author(s) and contributor(s) and not of MDPI and/or the editor(s). MDPI and/or the editor(s) disclaim responsibility for any injury to people or property resulting from any ideas, methods, instructions or products referred to in the content. |
© 2026 by the author. Licensee MDPI, Basel, Switzerland. This article is an open access article distributed under the terms and conditions of the Creative Commons Attribution (CC BY) license.