Article

New Apatite and Zircon Fission-Track Data from Precambrian Intrusions in the Southeastern Fennoscandian Shield (Karelia, Russia)

by
Tatyana E. Bagdasaryan
1,*,
Daria A. Krevsun
1,
Alvina V. Chistyakova
1,2,
Roman V. Veselovskiy
1,2 and
Alexandra V. Stepanova
3
1
Schmidt Institute of Physics of the Earth, Russian Academy of Sciences, 123995 Moscow, Russia
2
Geological Faculty, Lomonosov Moscow State University, 119991 Moscow, Russia
3
Institute of Geology, Karelian Research Centre, Russian Academy of Sciences, 185910 Petrozavodsk, Russia
*
Author to whom correspondence should be addressed.
Minerals 2026, 16(6), 659; https://doi.org/10.3390/min16060659
Submission received: 4 May 2026 / Revised: 10 June 2026 / Accepted: 16 June 2026 / Published: 22 June 2026
(This article belongs to the Section Mineral Geochemistry and Geochronology)

Abstract

This paper presents the results of apatite fission-track (AFT) and zircon fission-track (ZFT) analysis (dating) on samples collected from the surface exposures of six Precambrian intrusions in the southeastern Fennoscandian Shield: the Avdeevo and Shala dykes, the Valaam sill, the Salmi and Wiborg batholiths, and the Kuznechenskii massif. The short mean track lengths in apatite (10.7–13.5 μm) indicate that the studied rocks resided for a prolonged period within the apatite partial annealing zone (APAZ, 60–120 °C). We suggest that the AFT ages obtained from two of the granitic intrusions—the Salmi batholith and the Kuznechenskii massif—are apparent due to α-radiation-enhanced annealing (REA), as evidenced by an inverse correlation between single-grain AFT age and effective uranium (eU) concentration, and high dispersion and a negative chi-square test. An attempt to minimize the contribution of the REA effect to the AFT data for the Salmi batholith allowed its AFT age to be estimated as 1251 ± 125 (2σ) Ma, but the same approach was unsuccessful for the Kuznechenskii massif. In contrast, the mafic intrusions show no such correlation and yield reliable AFT ages: the Avdeevo dyke, 1040 ± 104 Ma; the Shala dyke, 1145 ± 89 Ma; and the Valaam sill, 1184 ± 78 Ma. The AFT data from the Wiborg batholith can be regarded as preliminary only. The most reliable AFT ages and thermal evolution models for the studied intrusions are similar and indicate prolonged exhumation of the intrusions to the surface over more than 1 billion years, with a marked increase in cooling rates around 300 Ma, which possibly has far-field causes, such as mantle dynamics related to the initial fragmentation of Pangea. Our data, as a first approximation, suggest a similar tectono–thermal evolution for intrusions located both within the northeastern margin of the Svecofennian orogen and on the Archean Karelian craton.

1. Introduction

Determining the long-term thermal evolution of ancient cratons and their adjacent orogenic belts is fundamental to understanding how the continental lithosphere maintains its stability over billions of years. The Fennoscandian Shield, one of the best-preserved Precambrian crustal blocks on Earth, offers a natural laboratory to investigate the thermal and tectonic processes that operate within stable continental interiors. Apatite and zircon fission-track (AFT and ZFT) analysis (dating) are among the most widely used methods in low-temperature thermochronology, and they are increasingly applied to reconstruct tectonic and magmatic events in the geological history of ancient platforms, as they record cooling through the upper crust (60–120 °C for apatite, and 330–190 °C for zircon).
Over the past decade, these methods have enabled the development of thermal evolution models for the sedimentary cover and crystalline basement of the East European Platform in Scandinavia and the Kola Peninsula [1,2,3,4,5]. These studies have clearly shown that adjacent areas often record contrasting thermal histories, reflecting tectonic events of different scales and ages, and—to a lesser extent—local magmatic episodes.
Because fission-track thermochronology has only recently been widely applied in Russia, most thermochronological data have come from the western and northern parts of the Fennoscandian Shield. In contrast, the southeastern part (Russian Karelia) remains largely unexplored. At the same time, the southeastern part of the Fennoscandian Shield—exposed in Karelia—represents a transitional zone between young (~300 Ma, Kola and Murmansk provinces) and old (Meso–Neoproterozoic, western part of the Karelian craton) AFT ages (see Figure 5 in [5]). Specifically, it remains unknown: (1) how the thermal evolution differs between the Archean Karelian craton and the Paleoproterozoic Svecofennian orogen; (2) whether these AFT ages represent unrejuvenated cooling events or are biased by radiation-enhanced annealing (REA); and (3) whether any post-Mesoproterozoic thermal event (>120 °C) has reset the AFT thermochronometer.
This study presents new AFT and ZFT data from six Precambrian intrusions along a SW–NE transect that spans the craton–orogen boundary: the Avdeevo and Shala dykes (Karelian craton), the Valaam sill, the Salmi batholith (transition zone), the Kuznechenskii massif, and the Wiborg batholith (Svecofennian orogen). These intrusions define a SW–NE-trending profile and are tectonically confined to the Svecofennian orogen in the southwest and the Archean Karelian craton in the northeast. This study integrates AFT and ZFT dating with inverse thermal history modeling to determine whether the observed fission-track age transition reflects a sharp tectonic boundary (e.g., a fault-controlled step) or a gradual thermal gradient (e.g., differential lithospheric cooling), and to develop a thermal evolution model for the southeastern part of the Fennoscandian Shield.

2. Geological Setting and Studied Objects

2.1. A Geological Overview of the Southeastern Fennoscandian Shield

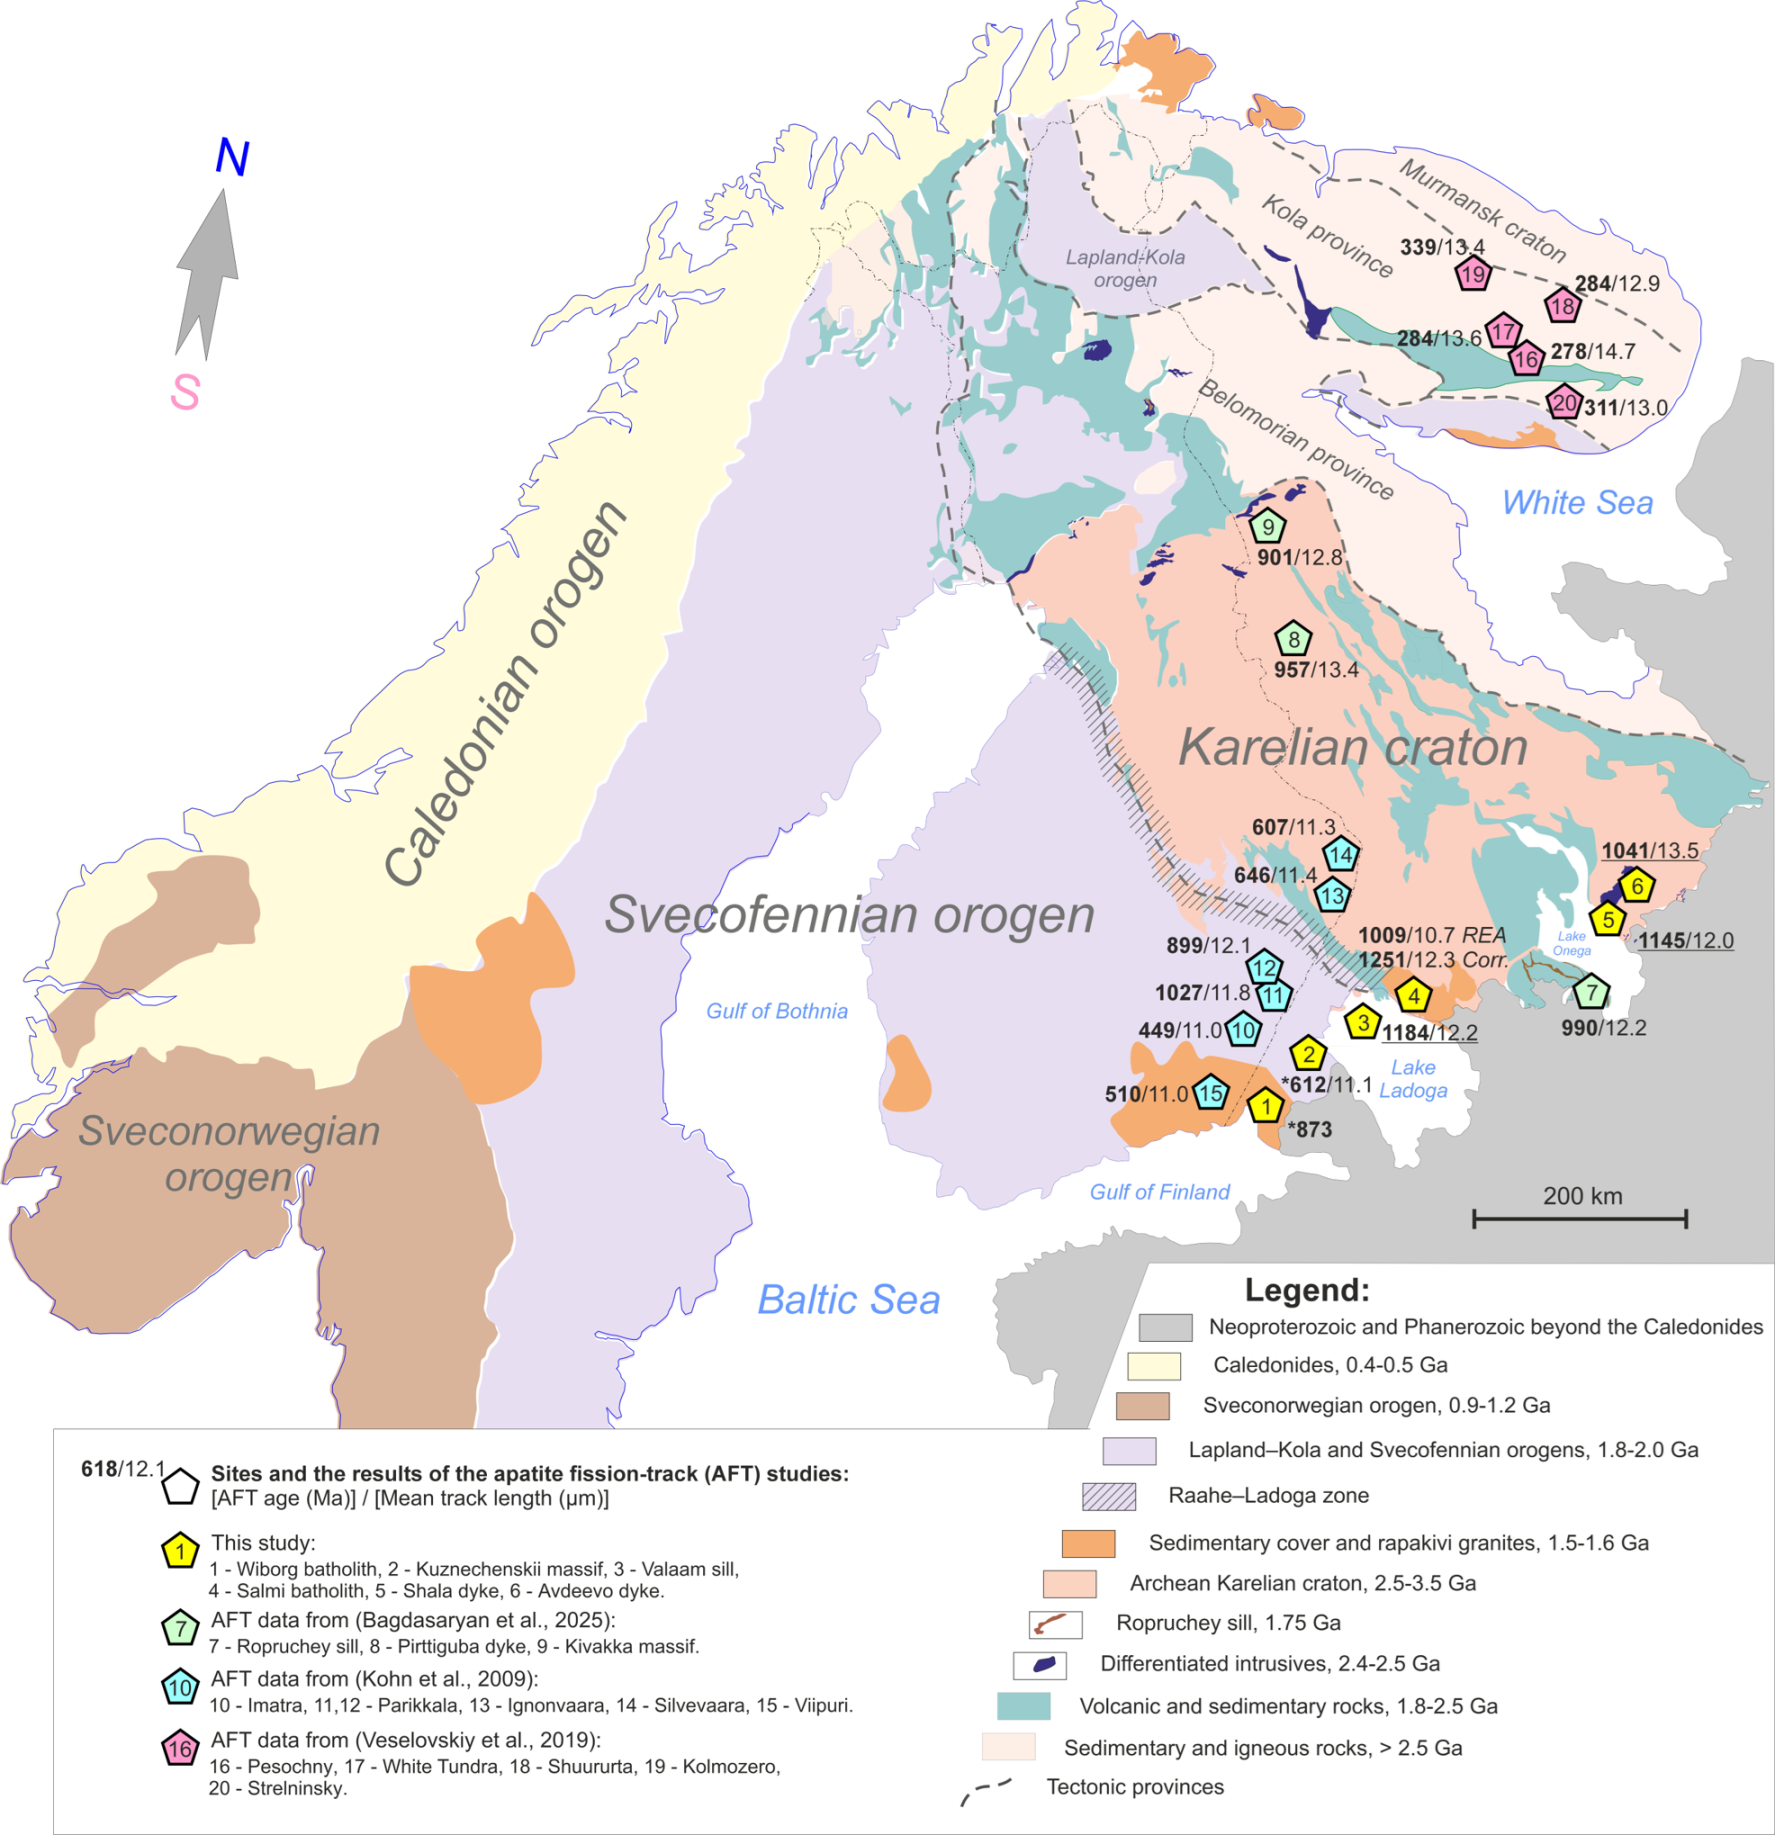
The study area is located in the southeastern part of the Fennoscandian Shield, one of the largest exposures of Precambrian crust on Earth. Tectonically, the study region comprises two main structures: (1) the Archean Karelian craton in the northeast, and (2) the Paleoproterozoic Svecofennian orogen in the southwest. The boundary between them is the Raahe–Ladoga zone (Figure 1), a long-lived suture that marks the collisional assembly of these blocks at ca. 1.9–1.8 Ga [6,7,8,9,10].
The general geological history of this part of the shield can be summarized as follows. During the Archean (3.5–2.5 Ga), the cratonic basement formed and stabilized. In the Paleoproterozoic (2.5–1.9 Ga), rifting and several pulses of mafic magmatism were recorded by the emplacement of mafic dykes and intrusions (e.g., the Avdeevo and Shala dykes at ca. 2.50 Ga, the 2.45 Ga Burakovsky layered intrusion; etc.) [14]. These events were followed by the Svecofennian accretional orogeny (1.92–1.78 Ga), accompanied by high-grade metamorphism [8] and granitoid magmatism (e.g., the Kuznechenskii massif, 1874 ± 4 Ma [15]). The Mesoproterozoic (1.65–1.45 Ga) was marked by intraplate magmatism: rapakivi granites (Wiborg, 1.61–1.65 Ga [16,17,18]; Salmi, 1.55–1.53 Ga [19,20,21]) and the Valaam gabbro–dolerite sill (ca. 1.46 Ga [22,23]) were emplaced, accompanied by sedimentation of the Proterozoic (Riphean) Priozerskaya and Salminskaya formations in the Pasha–Ladoga paleorift system (onset after 1477 ± 8 Ma) [24].

2.2. Studied Magmatic Bodies

Fission-track analysis was performed for six magmatic bodies located within the Karelian craton and the Svecofennian orogen (Figure 1, Table 1). The selection of objects is based on a preliminary assessment of their sufficient apatite content and the availability of crystallization age information for the correct interpretation of thermochronological results. Additionally, magmatic bodies with the greatest possible differences in rock composition were chosen to increase the likelihood of extracting apatite with varying contents of elements that control fission track annealing kinetics (uranium and chlorine), which, in turn, allows obtaining more representative information on the thermal evolution of the studied region.
The Wiborg rapakivi granite batholith is located on the northeastern coast of the Gulf of Finland within the Paleoproterozoic Svecofennian orogen (Figure 1). It covers an area of about 16,000 km2 on land and up to 30,000 km2, including its southern part beneath the waters of the Gulf of Finland [25]. The batholith was emplaced into migmatitic mica schists, amphibolites, and quartz–feldspar gneisses [26] of the Svecofennian orogen [27]. The batholith is composed of rapakivi granites, within which three intrusive phases are recognized: an early phase of quartz syenites (“lappee–granites”); a second phase of biotite–hornblende ovoidal rapakivi granites; a third phase of weakly ovoidal rapakivi granites; and gabbro–anorthosites, occurring as xenoliths and small blocks [27]. The age of the Wiborg batholith, according to U-Pb zircon, monazite, and baddeleyite dating, is estimated in the range of 1615–1646 Ma [16,17,18]. Sample Vyb-2 was collected from the second intrusive phase (wiborgite) from an outcrop near Wiborg city.
The Kuznechenskii massif is located on the northwestern shore of Lake Ladoga in the southern part of the Paleoproterozoic Svecofennian orogen (Figure 1), northwest of the town of Priozersk. The Kuznechenskii granite massif, with an area of 50 km2, is compositionally homogeneous and intrudes intensely migmatized biotite and biotite–garnet, garnet–sillimanite–ordierite gneisses [15]. The crystallization age of the Kuznechenskii massif, according to U-Pb zircon dating, is 1874 ± 4 Ma, while the U-Pb age of monazite is 1851 ± 5 Ma [15]. Sample Kuzn-1 was collected from porphyritic biotite granites with garnet from an outcrop on the eastern border of the Kuznechnoe town.
The Valaam sill is located in the water area of Lake Ladoga within the Pasha–Ladoga graben at the boundary of the Raahe–Ladoga zone, which separates the Archean Karelian craton and the Paleoproterozoic Svecofennian orogen [6,7,8,9,10]. It is best exposed in the area of Valaam Island and neighboring islands, where it forms a gentle synclinal fold dipping southeast at 5–10°. The total thickness of the sill is estimated at more than 200 m, and its area is about 16,000 km2. It is intruded into terrigenous rocks of the Pasha Formation and is composed mainly of gabbro–dolerites with vein and injection bodies of granite [28]. The sill shows compositional differentiation: at the base, a horizon of ore gabbro with abundant titanomagnetite phenocrysts; above that, ophitic gabbro–dolerites with consistent structure and texture; and in the central part, trachytoid gabbro–dolerites [28]. The baddeleyite U-Pb ages of monzodolerites are 1459 ± 3 and 1457 ± 2 Ma [22,23]. Sample Val-1 was collected from gabbro–dolerites in an outcrop in the north of Valaam Island.
Table 1. The results of the apatite and zircon fission-track dating of the studied objects.
Apatite Fission-Track Dating
#Object/SampleRock TypeLat (°N)Long (°E)Elevation (m)Crystallization Age, ±1σ (Ma) [Reference]NcStandard Track Density, ρs
(106 cm−2)/
(Ns)
eU
(ppm)
ξICP ± 2σ
(Ma × μm2)
P(χ2)
(%)
FT Age *,
±2σ
(Ma)
MTL/MTLc (μm)
(n)
SD (μm)Dpar
(μm)
Range
of Cl
(wt. %)
1Wiborg batholith
(Vyb-2)
Granite rapakivi60°43′26.18″28°41′42.18″11615–1646 (Zrn, Mnz, Bdl, U-Pb) [16,17,18]82.62 (382)13.07
(3.27–34.82)
64 ± 51873 ± 163 (ca)--1.79
(1.66–1.95)
0 (n.d.)
2Kuznechenskii massif
(Kuzn-1)
Granite61°7′25.74″29°53′33.97″201874 ± 4 (Zrn, U-Pb) [15]992.76 (5142)10.49
(1.32–22.21)
79 ± 34REA: 612 ± 31
(ca)
REA:
11.06/
13.02 (103)
REA: 2.051.3
(0.91–1.78)
0 (n.d.)
3Valaam sill
(Val-1)
Gabbro–dolerite61°23′33.65″30°56′27.91″61459 ± 3, 1457 ± 2 (Bdl, U-Pb) [22,23]980.48 (1975)1.60
(0.97–2.28)
74 ± 3801184 ± 78 (pa)12.16/
13.63 (57)
1.611.88
(0.94–2.39)
0.09
4Salmi batholith (Salm-2)Granite61°39′27.22″31°55′39.66v661550–1530 (Zrn, Bdl, U-Pb) [19,20,21]REA:
87
Corr.: 52
1.58 (2159)7.25
(0.72–37.95)
79 ± 30REA: 1009 ± 97 (ca)
Corr.: 1251 ± 125 (ca)
REA:
10.72/
12.96 (57)
Corr.: 12.29/
13.91 (10)
REA: 2.12
Corr.: 2.01
1.68
(1.28–2.07)
0 (n.d.)
5Shala dyke
(Sch-1)
Gabbronorite61°49′17.31″35°52′40.58″362505 ± 3 (Bdl, U-Pb) [29]374.01 (2239)14.02
(7.29–25.39)
79 ± 3961145 ± 89 (pa)11.99/
13.50 (16)
1.751.59
(1.13–1.94)
0.16
6Avdeevo dyke (Avd)Gabbronorite61°56′1.70″36°4′24.46″522436 ± 46 (Sm-Nd) [30]195.13 (1266)20.11
(11.82–30.41)
79 ± 3941041 ± 104 (pa)13.49/
13.87 (74)
1.562.12
(1.23–2.52)
0.22
Zircon Fission-Track Dating
7Salmi batholith
(Salm-2)
Granite61°39′27.22″31°55′39.66″661550–1530 (Zrn, Bdl, U-Pb) [19,20,21]2019.52 (3655)26.9189 ± 901416 ± 117 (ca)9.91/–(10) **0.80--
Notes: ζICP—the zeta factor; P(χ2)–the probability of obtaining χ2 value for ν degrees of freedom, where ν = (number of grains—1). * Type of AFT age: (pa)—pooled age, (ca)—central age. n.d.—not detectable for Cl content below the detection limit. ** MTLs and (number of lengths), with angles to the c-axis greater than 60°. REA—the data for which the REA effect is assumed. Corr.—the values after the minimization of the REA effect for the Salmi batholith.
The Salmi anorthosite–rapakivi granite batholith is exposed on the northeastern shore of Lake Ladoga in the central part of the Raahe–Ladoga zone. The area of the Salmi batholith is 4000 km2. The batholith is considered the shallowest among the anorthosite–rapakivi granite complexes in the East European Platform: its emplacement occurred at pressures no greater than 2–3 kbar, corresponding to depths of 6–10 km (orthopyroxene geobarometer) [31]. Six phases are distinguished in the batholith: (1) anorthosites, gabbronorites, and gabbro; (2) monzonites, quartz syenites, and syenites; (3) amphibole–biotite syenogranites; (4) amphibole–biotite rapakivi granites, including ovoidal and non-ovoidal varieties; (5) biotite granites; and (6) albite–siderophyllite topaz-bearing granites [19,20,32,33]. Numerous geochronological studies have been carried out for the Salmi batholith: the U-Pb ages of baddeleyite and zircon from different zones of the batholith range between 1.55 and 1.53 Ga [19,20,21]; the U-Pb ages of apatite from anorthosite and gabbronorite give a weighted mean value of 1563 ± 9 Ma [19]; and a Sm-Nd mineral isochron for anorthosite and gabbronorite yields values of 1552 ± 69 and 1527 ± 130 Ma, respectively [19]. The age of the termination of postmagmatic processes in the satellite Ulaleg massif is estimated at 1455 ± 17 Ma (Rb-Sr mineral isochron) [31]. Near the southwestern margin, volcanic–sedimentary complexes of the Pasha–Ladoga basin rest with angular unconformity on the rocks of the Salmi batholith; their formation age interval is estimated at ~1477–1460 Ma and is constrained by the age of detrital zircon and the emplacement of the Valaam sill [24]. Sample Salm-2 was collected from pegmatoid granites from an outcrop on the A-121 road, 1 km from the Uuksunjoki river.
The Shala gabbronorite dyke is also located within the Mesoarchean Vodlozero terrane in the Karelian craton on the eastern shore of Lake Onega in the area of the settlement of Shalsky. The dyke is up to 200 m thick, has been traced for several kilometers along a NE strike, and is composed of medium-grained gabbronorites. The age of the Shala dyke is 2505 ± 3 Ma (U-Pb, ID-TIMS baddeleyite, Ref. [29]). The Shala dyke is cut by numerous thin dolerite bodies, with an age of about 1.98 Ga [34]. Sample Sch-1 was collected from gabbronorite on an island near the Shalsky settlement.
The Avdeevo dyke is located within the Mesoarchean Vodlozero terrane in the Karelian craton on the eastern shore of Lake Onega. It is about 500 m thick and extends in a northeastern direction for several kilometers [14]. The dyke is composed of massive medium-grained gabbronorites. The crystallization age of the Avdeevo dyke is 2504 ± 5 Ma [14,35]. Sample Avd was collected from an outcrop in the forest northwest of Shala Lake.

2.3. Tectonic Affinity and Rationale for the Transect

The tectonic affinity of the study objects is as follows. The Avdeevo and Shala dykes are situated at the southeastern margin of the Archean Karelian craton, within the Mesoarchean Vodlozero block. The Salmi batholith and the Valaam sill are located in the Raahe–Ladoga zone, which is considered a foreland of the Svecofennian orogen in the southern part of the Karelian craton. The Kuznechenskii massif and the Wiborg batholith are intruded into complexes along the eastern margin of the Svecofennian orogen (Figure 1, Table 1). Thus, the selection of study objects makes it possible, as a first approximation, to characterize the thermal evolution of the entire southeastern part of the Fennoscandian Shield, including a preliminary comparison of the thermal histories of two contrasting tectonic blocks—the Karelian craton and the Svecofennian orogen.

3. Methods

3.1. Apatite and Zircon Fission-Track Dating

Apatite and zircon were separated at the Geological Institute RAS (GIN RAS, Moscow, Russia) using standard heavy-liquid and electromagnetic separation techniques. Apatite and zircon fission-track analysis was carried out in the Laboratory of Fission-Track Analysis and Isotope Geochronology of the Institute of Physics of the Earth RAS (IPE RAS) (IPE RAS, Moscow, Russia), following the standard procedure [36].
For AFT, the grains were arranged in rows on glass by elongation parallel to the c-axis, embedded in epoxy resin, ground on 2500-grit abrasive paper, and then polished on cloths using diamond suspensions of 9, 6, 3, and 1 μm. The samples were etched with 5.5 M HNO3 for 20 s at 21 °C and immediately immersed in water afterwards. Panoramic images of the samples, density counting, Dpar measurements, and confined track length measurements were performed using an ADF E300 optical microscope (ADF, Hangzhou, China). The confined track lengths were determined by measuring their projections on the crystal surface and then converting to the true length using a motorized XY stage with a Z-axis adjustment (prior motorized stage) (Moscow, Russia). All available confined tracks (TINT and TINCLE) were measured; the type of measured length is specified in the Supplementary Materials (Table S1) (T for TINT and C for TINCLE). The Dpar parameter, together with F and Cl concentrations, was used as a kinetic parameter for fission-track annealing. F and Cl were measured with a Tescan MIRA IV LMS scanning electron microscope (TESCAN GROUP, a.s., Brno, Czech Republic) equipped with an Oxford X-Max 80 EDS detector (Oxford Instruments, High Wycombe, UK) and expressed in wt. % (Supplementary Materials (Table S1)).
Sample preparation for ZFT analysis was performed according to standard protocols [37,38] and included (1) placing zircon grains on glass slides in rows oriented along their elongation; (2) putting slides with zircons on a hotplate, heated to 290 °C for 1 min, and then mounting the grains on 1.5 × 1.5 × 0.05 cm FEP sheets; and (3) grinding with 2500-grit paper, and subsequent polishing with diamond suspensions with grain sizes of 9, 6, 3, and 1 μm. Etching of fission tracks in zircon was carried out in a eutectic KOH:NaOH melt at a temperature of ~228 °C. Etching was performed stepwise, with intermediate control, using an optical microscope. Of the six studied samples, only zircon from the Salmi batholith granite proved to be suitable for fission-track dating, which is probably due to the presence of grains with relatively low uranium concentrations (tens of ppm). In the remaining samples, the fission-track density was too high and exceeded the countable range. The Salmi batholith zircon grains were etched for 6 h until fission tracks were fully revealed in all crystallographic orientations.
Uranium concentration in apatite and zircon was measured using the zeta-calibration approach (against Durango apatite and Fish Canyon Tuff zircon) by laser ablation inductively coupled plasma mass spectrometry (LA-Q-ICP-MS) at the Laboratory of Fission-Track Analysis and Isotope Geochronology of IPE RAS, using an Agilent 7900 mass spectrometer (Agilent Technologies, Santa Clara, CA, USA) coupled with an ESL NWR213 laser ablation system (Elemental Scientific Lasers, Bozeman, MT, USA), following protocols [39,40]. Optimized operating parameters and equipment configuration are given in Supplementary Materials (Table S2).
The AFT and ZFT ages for the studied samples are presented in Table 1. The AFT ages for four samples (Shala dyke, Valaam sill, Salmi batholith, and Kuznechenskii massifs) were obtained from more than 40 grains, which satisfies the modern reliability criteria when using the LA-ICP-MS method for determining 238U concentration [39,41]. The AFT age of the Avdeevo dyke was obtained from 19 grains, which is below the recommended number; however, the apatite of this sample has a high track density and an average uranium concentration of 10.78 ppm, allowing age determination with a standard uncertainty typical for fission-track analysis (~10%) (Table 1). The smallest number of grains was analyzed for the apatite from the Wiborg batholith (8 grains), and we regard this age as preliminary (Table 1).

3.2. Thermal History Modeling

Thermal histories of the studied samples were obtained by inverse modeling using the HeFTy software, version 2.3.1 [42] (Supplementary Materials (Table S3)). The annealing model [43] and C-axis projection [43] were used for modeling. The [43] model does not account for the effects of REA, and for samples suspected of REA, the modeling results should be considered preliminary and qualitative. As kinetic parameters, we used either Dpar (measured etch pit diameter parallel to the c-axis) or, for samples with detectable chlorine (>0.1 wt. %), the Cl content. All models were constrained by the CRS search method. The following geological constraints were applied to the time–temperature paths for each intrusion (Table 1):
  • For the Salmi batholith: crystallization at 1550–1530 Ma (U-Pb, zircon and apatite) with an initial temperature of 450–800 °C; exhumation to the surface, constrained by overlying Riphean (Mesoproterozoic) sedimentary rocks, whose formation age interval is estimated at ~1477–1460 Ma; and subsequent burial and possible reheating to at least 190 °C (ZFT age of ca. 1416 Ma).
  • For the Valaam sill: emplacement at 1459 Ma (U-Pb, baddeleyite), with an initial temperature of ~1100 °C; and cooling to host rock temperature (~50 °C) by ~1400 Ma.
  • For the Avdeevo and Shala dykes: crystallization at ~2500 Ma (U-Pb, baddeleyite), with an initial temperature of ~1100 °C.
The search for acceptable t-T paths was performed within a temperature range from the estimated initial crystallization temperature down to 0 °C (present-day surface temperature). The cooling paths were allowed to vary freely between these bounds, except where geological constraints (e.g., unconformities or known magmatic events) required reheating.
The modeling output consists of two types of regions on a time–temperature (t-T) plot. The green region represents the range of temperature and time values within which a particular thermal history model cannot be rejected (“acceptable” fit). The narrower purple region represents the range of thermal history models that are supported by the actually obtained fission-track data (“good” fit). HeFTy compares modeled and actually observed thermochronological data and characterizes their fit by the goodness-of-fit (GOF) parameter. The resulting “acceptable” models have 0.50 > GOF > 0.05, and “good” models have GOF > 0.50.

4. Results

The results of the fission-track analysis of the studied objects are presented in Table 1, as well as in Figure 1 and Figure 2. All of the raw data are provided in the Supplementary Materials (Table S1).
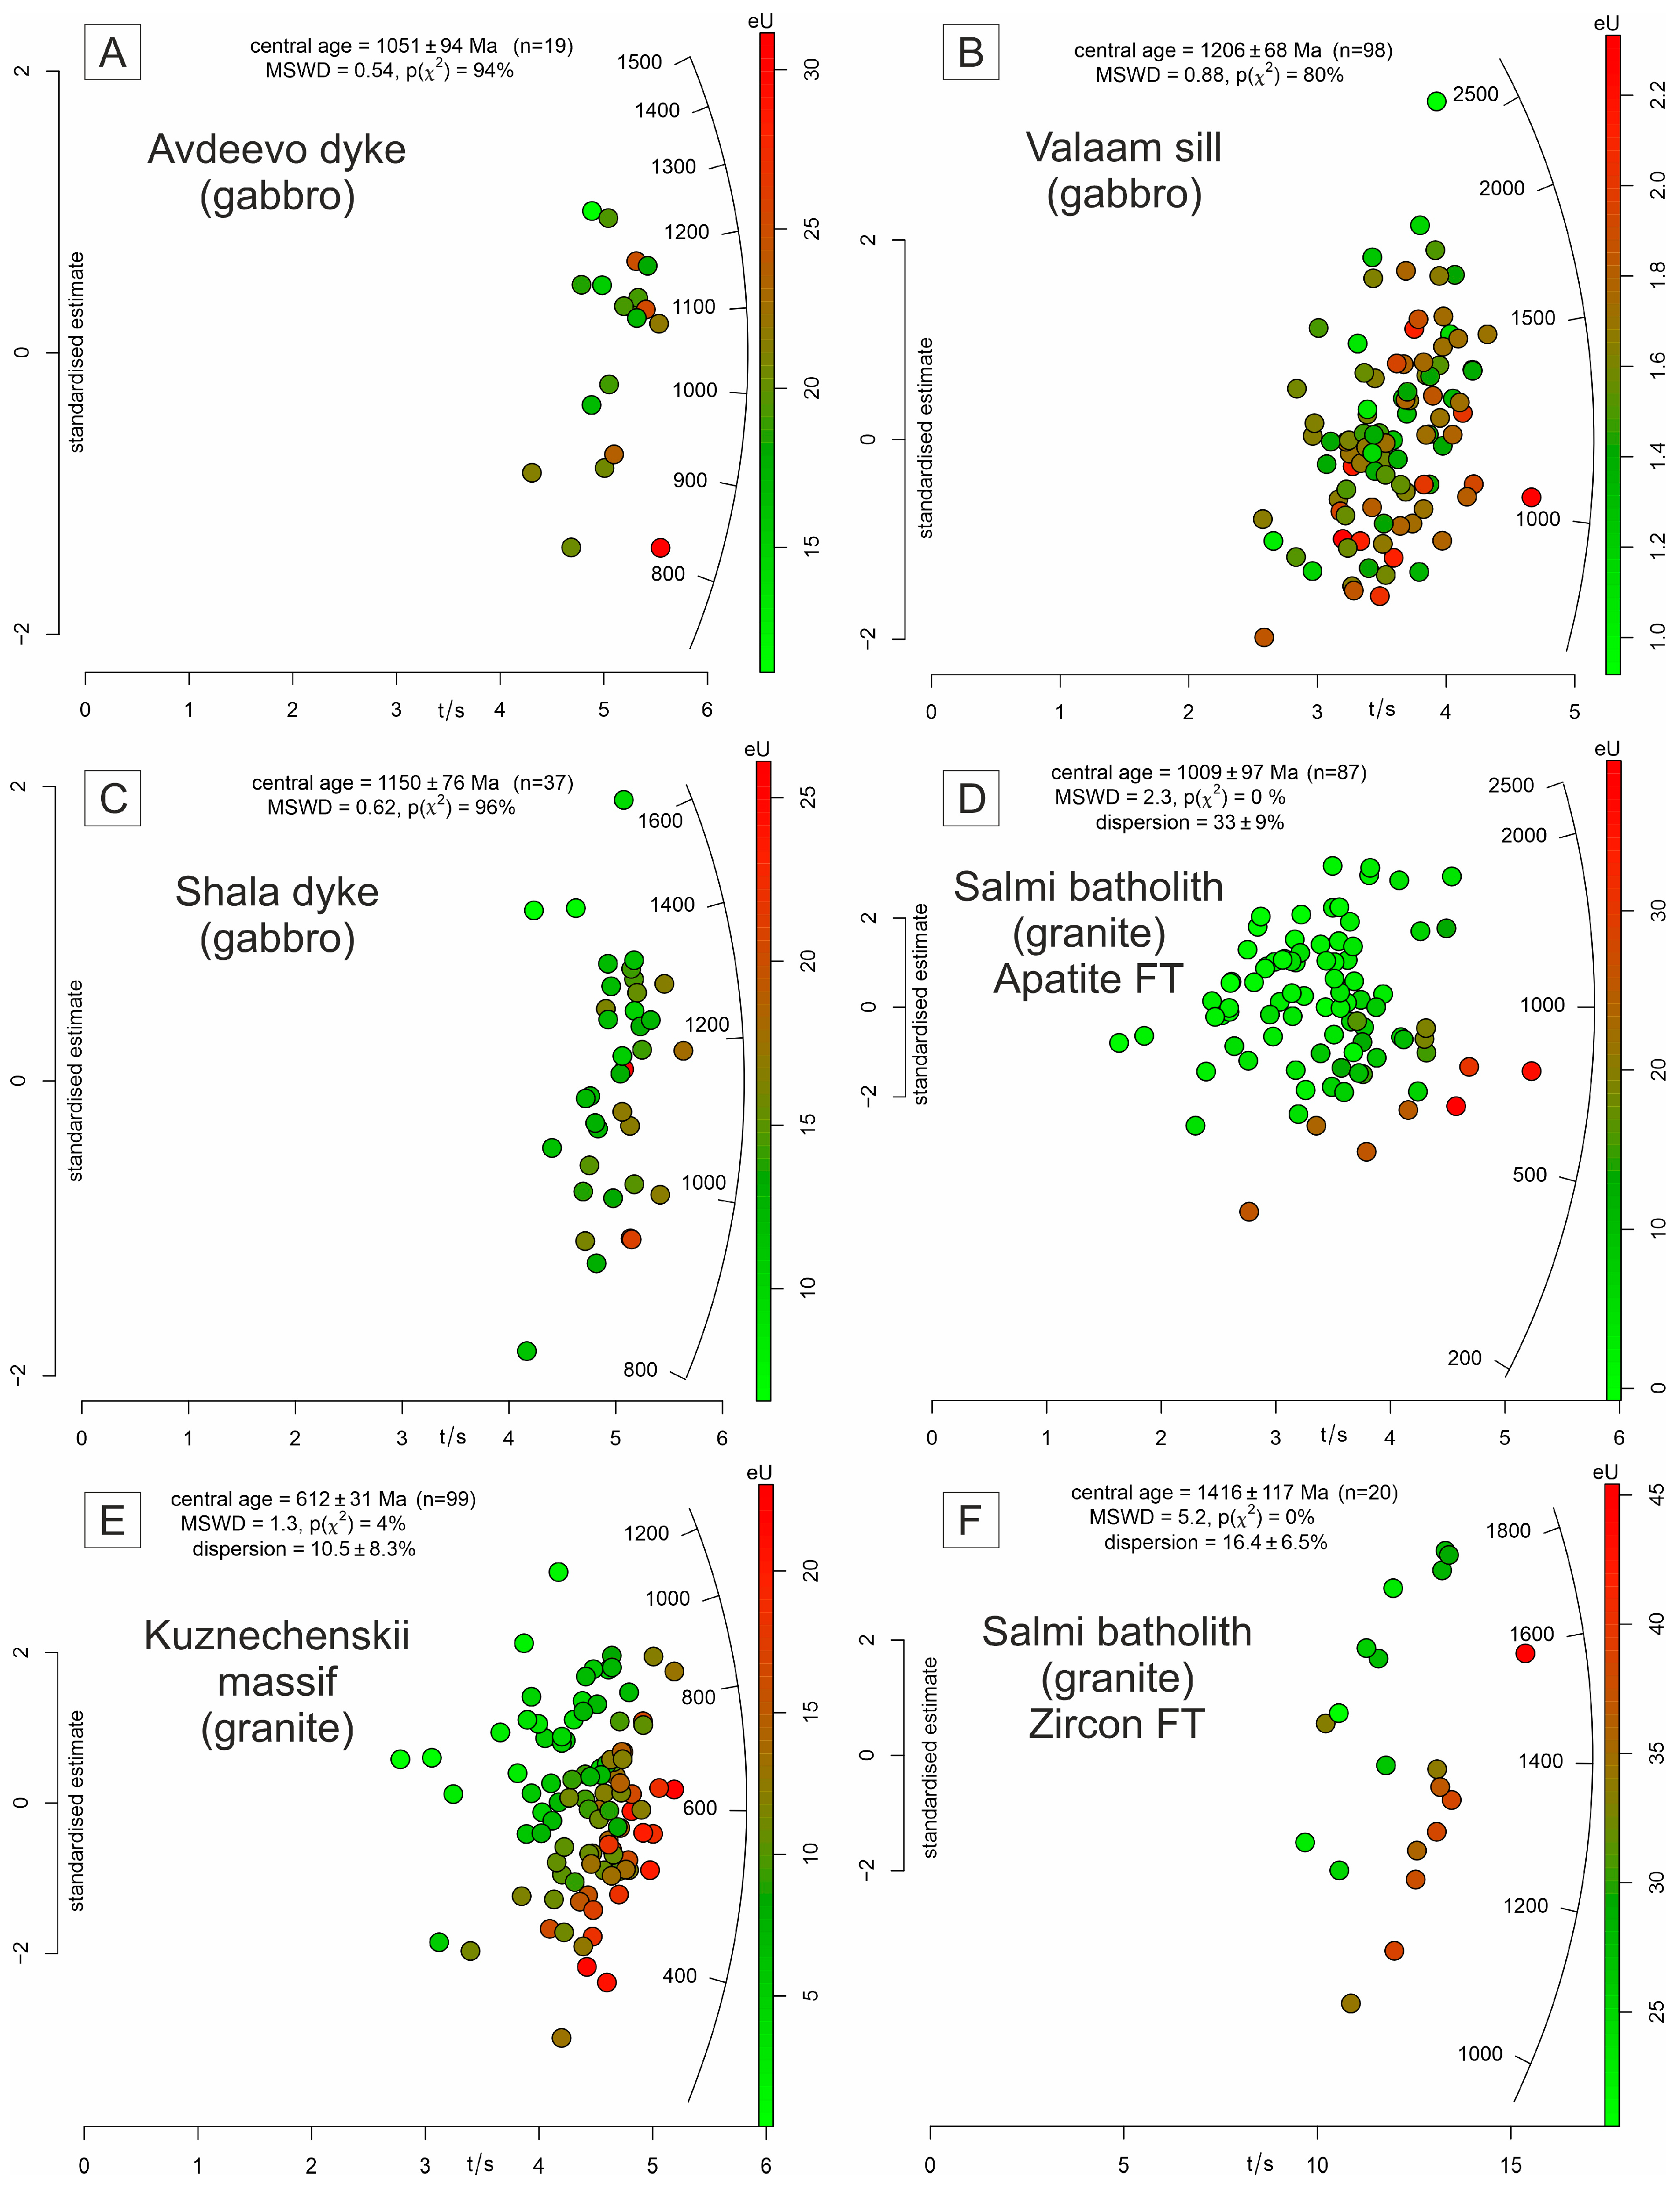
The AFT results can be divided into two groups: one with a positive chi-square test and one with a negative one (Table 1; Figure 2A–C). A positive chi-square test (P(χ2) > 5%) is observed for the AFT data from mafic rocks from the Avdeevo dyke, the Shala dyke, and the Valaam sill. Apatite from these rocks is characterized by the presence of chlorine, although its concentration does not exceed 0.22 wt. % (Table 1). The presence of chlorine increases the resistance of apatite to track annealing, and, as noted previously [13,36,44], such rocks are considered the most promising for obtaining reliable results within ancient cratons. The pooled AFT ages for these objects are presented in Table 1; central age estimates can be found in Figure 2.
Figure 2. Radial plots showing the dependence of AFT (AE) and ZFT (F) single-grain ages for the studied intrusions (except the Wiborg batholith) on the effective uranium concentration (eU). The radial plots were generated using the package ‘IsoplotR’ [45].
Minerals 16 00659 g002
The second group includes the AFT results obtained from the Kuznechenskii massif and the Salmi batholith, which show a negative chi-square test (Table 1; Figure 2D,E). This indicates a high dispersion of single-grain AFT ages as one of the indications of possible REA effect in apatite [44], and thus, we tested these objects for the presence of the REA effect. It should be remembered that the REA effect occurs in apatite with high uranium and thorium contents (effective uranium, eU) and promotes fission-track annealing at lower temperatures [46,47,48]. The presence of REA in rocks is primarily indicated by a strong negative correlation between single-grain AFT age and eU concentration. Additionally, evidence supporting the presence of REA includes high data dispersion and a negative chi-square test. Indeed, the data from the Salmi batholith and the Kuznechenskii massif show a dependence of single-grain AFT age on eU, as clearly seen in Figure 2D,E: the higher the eU concentration, the younger the single-grain AFT age. A strong negative correlation between eU and single-grain AFT ages is also observed quantitatively: the correlation coefficients are r = −0.46 (the Salmi batholith) and r = −0.55 (the Kuznechenskii massif). Thus, the direct use of AFT data from the Salmi and Kuznechenskii intrusions for any kind of thermal and/or tectonic interpretations is strictly limited, if not impossible.
The ZFT dating of the Salmi batholith yielded an age of 1416 ± 117 Ma (Table 1, Figure 2F).
For the granites from the Wiborg batholith, the AFT age is 873 ± 163 Ma; however, due to the small number of grains analyzed (Nc = 8, due to the small grain size and the presence of defects in them), this result is considered preliminary.

5. Discussion

The AFT ages obtained for the Avdeevo and Shala dykes, as well as for the Valaam sill, are among the oldest ever reported on Earth [49], and the broad distributions of fission-track lengths indicate prolonged residence of the rocks at temperatures between 120 and 60 °C, i.e., within the apatite partial annealing zone (APAZ). Only a few comparably old Proterozoic AFT ages have been reported from other Precambrian basement. For instance, few Proterozoic ages (up to 600–800 Ma) have been documented in the Superior Province of the Canadian Shield [50], and apatite fission-track ages up to ~500 Ma are known from basement rocks of the West African Craton [51]. We consider these data the most reliable, and their tectonic interpretation is presented below. On the other hand, the data from the Kuznechenskii massif and the Salmi batholith were obtained with great difficulty and are obviously of potential value; therefore, we attempted to salvage these data and minimize the REA effect within them.

5.1. The REA Effect: Attempting to Salvage the Data

As noted above, the arguments in favor of the presence of the REA effect in apatite from the Precambrian granites are (1) a negative chi-square test, and (2) a strong negative correlation between single-grain fission-track ages and eU. In an attempt to minimize the REA effect, we applied the following procedure to the AFT data from the Kuznechenskii massif and the Salmi batholith: the grains were ranked by their eU concentration, and the highest-eU grains were sequentially excluded from the age calculation until the chi-square test result became positive (p(χ2) > 5%) and the correlation between the AFT ages and eU became weak (correlation coefficient is r < −0.30).
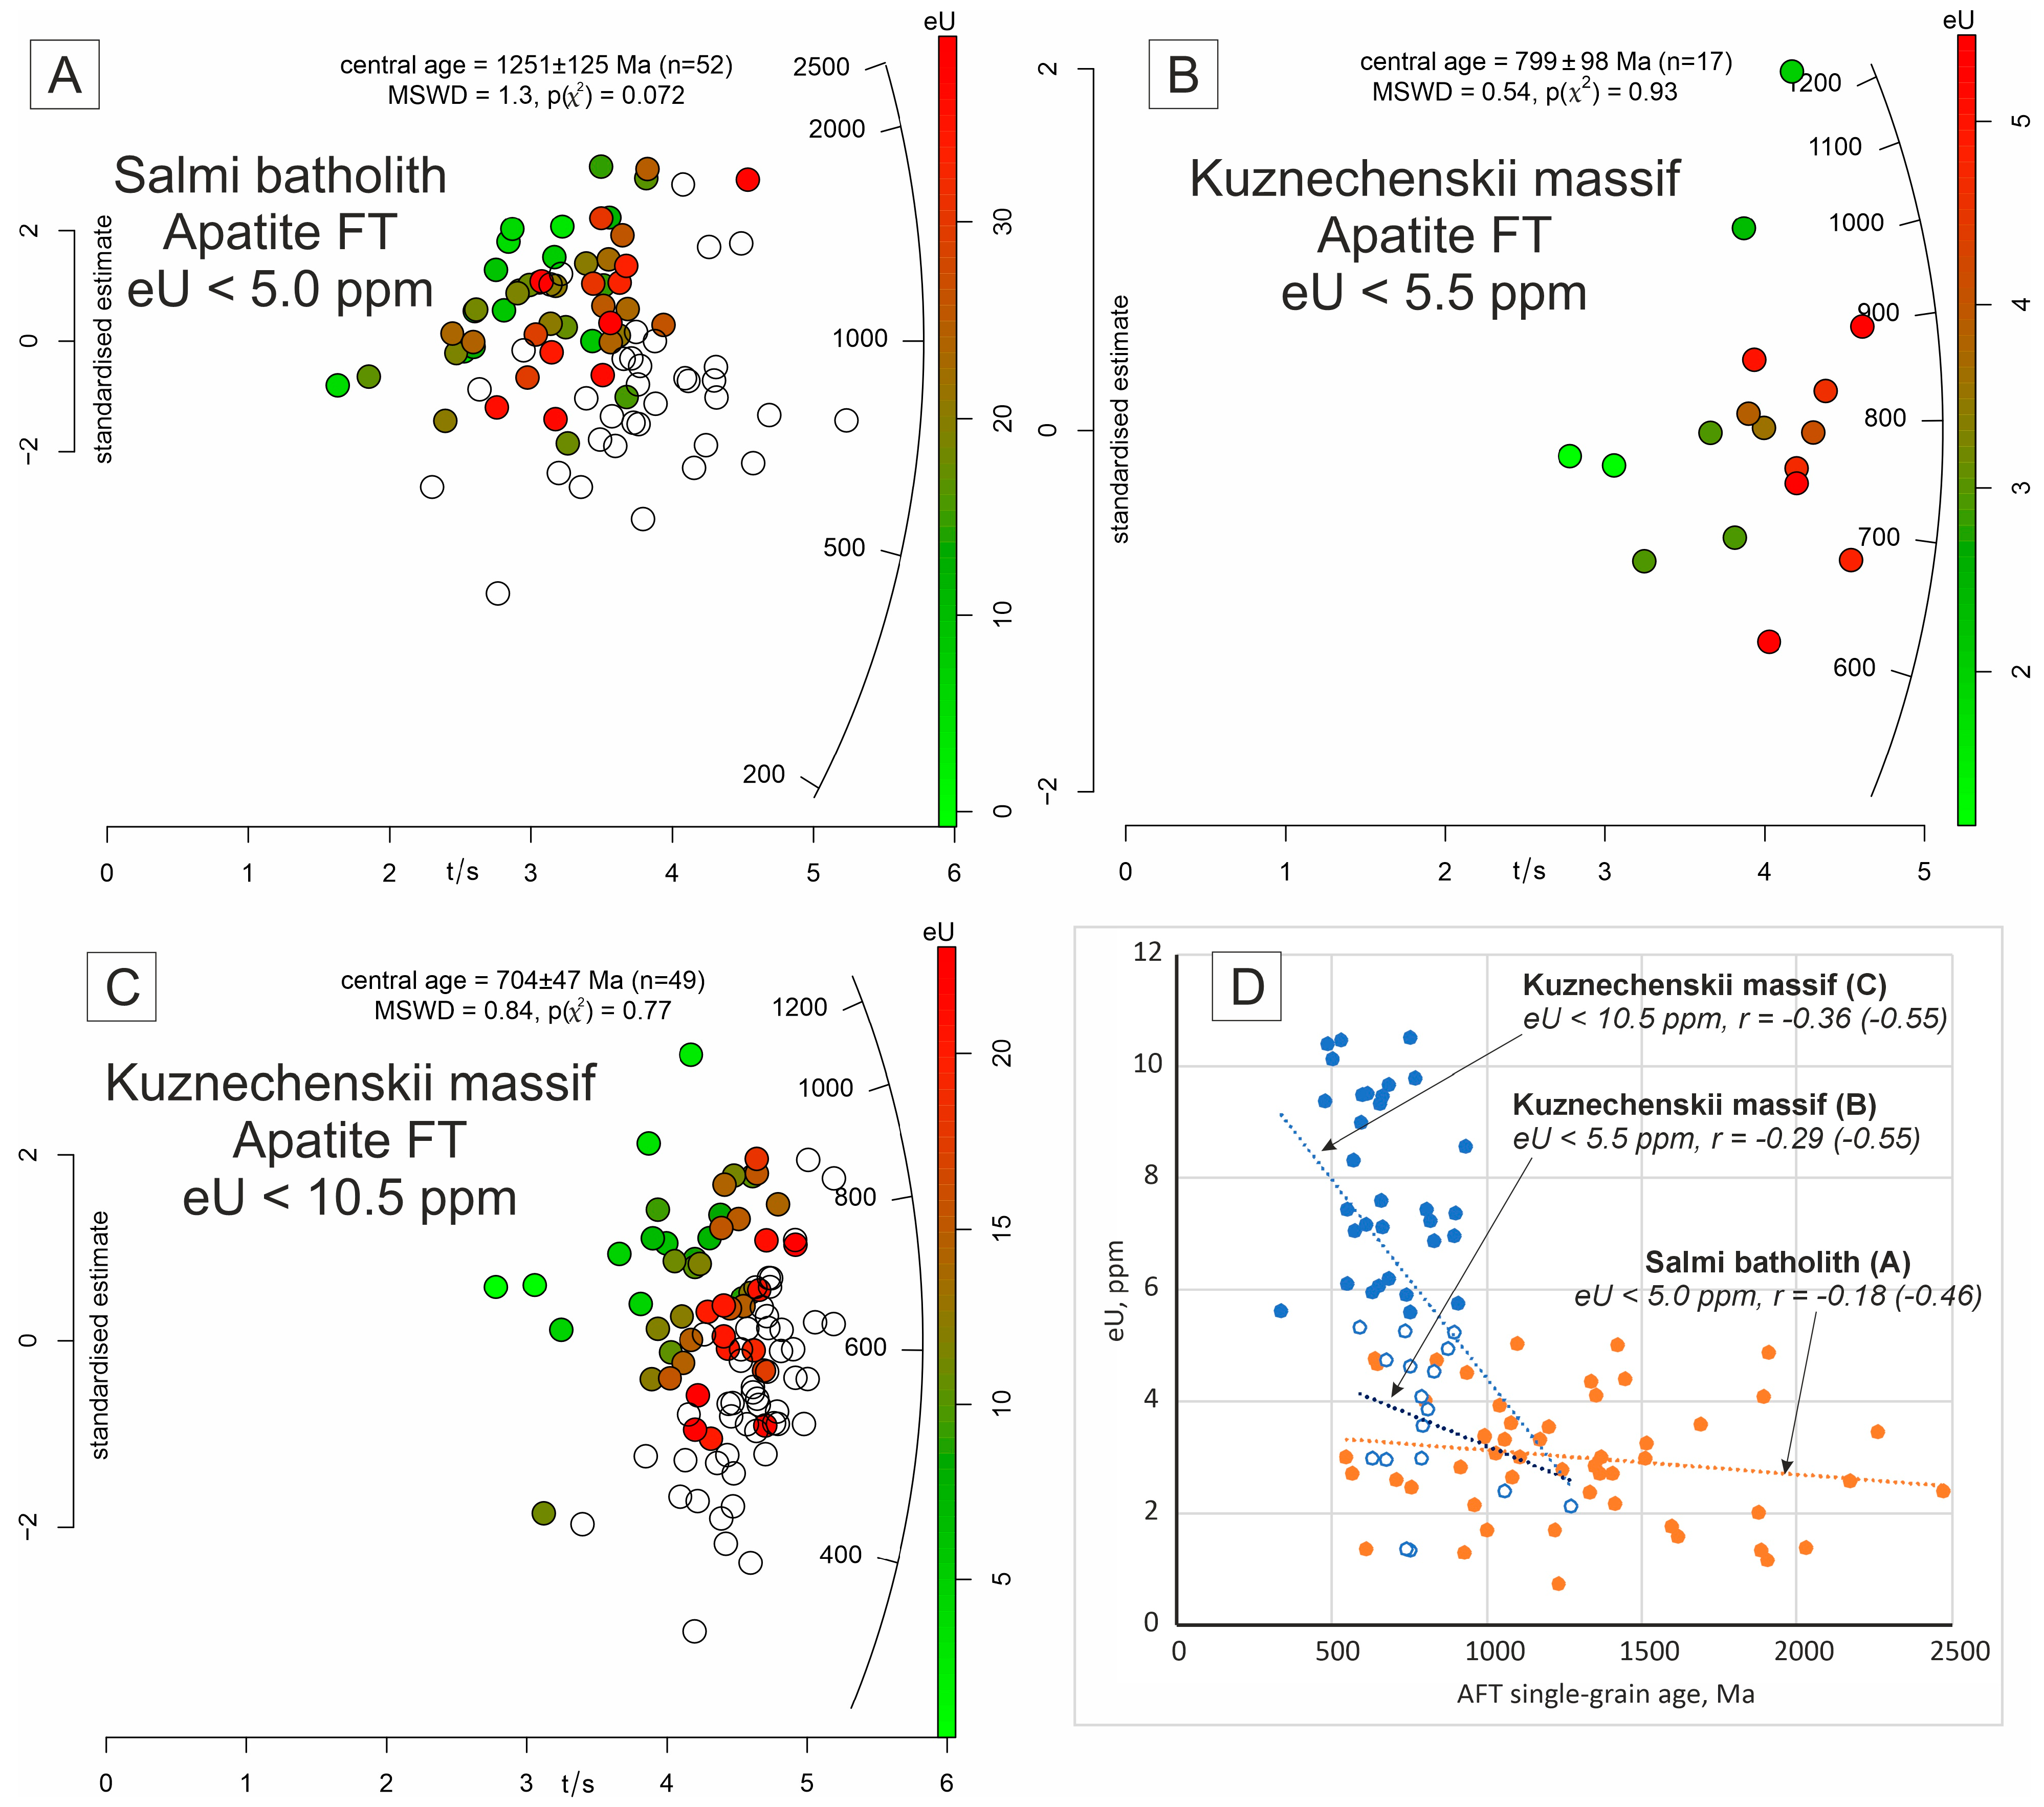
In the case of the Salmi batholith, the chi-square test becomes positive (p(χ2) = 7.2%) when the grains with an eU concentration >5.0 ppm are excluded from the dataset. The result of this data filtering is shown in the radial plot (Figure 3A), which visually does not demonstrate the presence of the REA effect in the remaining data, which includes 52 single-grain AFT ages. The correlation coefficient is r = −0.18 (Figure 3D), indicating a very weak correlation between AFT ages and eU concentration or its absence. Using this dataset, the central age of the Salmi batholith can be estimated as 1251 ± 125 Ma (Figure 3A).
At the same time, the AFT results from the Kuznechenskii massif behave differently. The chi-square test becomes positive after removing just one of the highest-eU grains, but the negative correlation of single-grain AFT age vs. eU remains strong (r > −0.30) until grains with eU > 5.5 ppm are excluded. In this case, 17 single-grain AFT ages remain in the dataset, and the central age of the massif is estimated as 799 ± 98 Ma (Figure 3B). For example, the AFT dataset from the Kuznechenskii massif is shown in Figure 3, after excluding half of the grains with eU > 10.5 ppm: the REA effect is still visually noticeable in the radial plot (Figure 3C), as is the quite strong negative correlation of r = −0.36 (Figure 3D).
Thus, we consider that the REA effect is more pronounced in apatite from the Kuznechenskii massif than in the Salmi batholith. And while the exclusion of the high-eU grains from the Salmi batholith dataset leaves a chance to obtain a reliable result, the substantial reduction in the Kuznechenskii massif dataset only allows for a very preliminary estimate of its AFT age.

5.2. The Thermal History of the Studied Intrusions

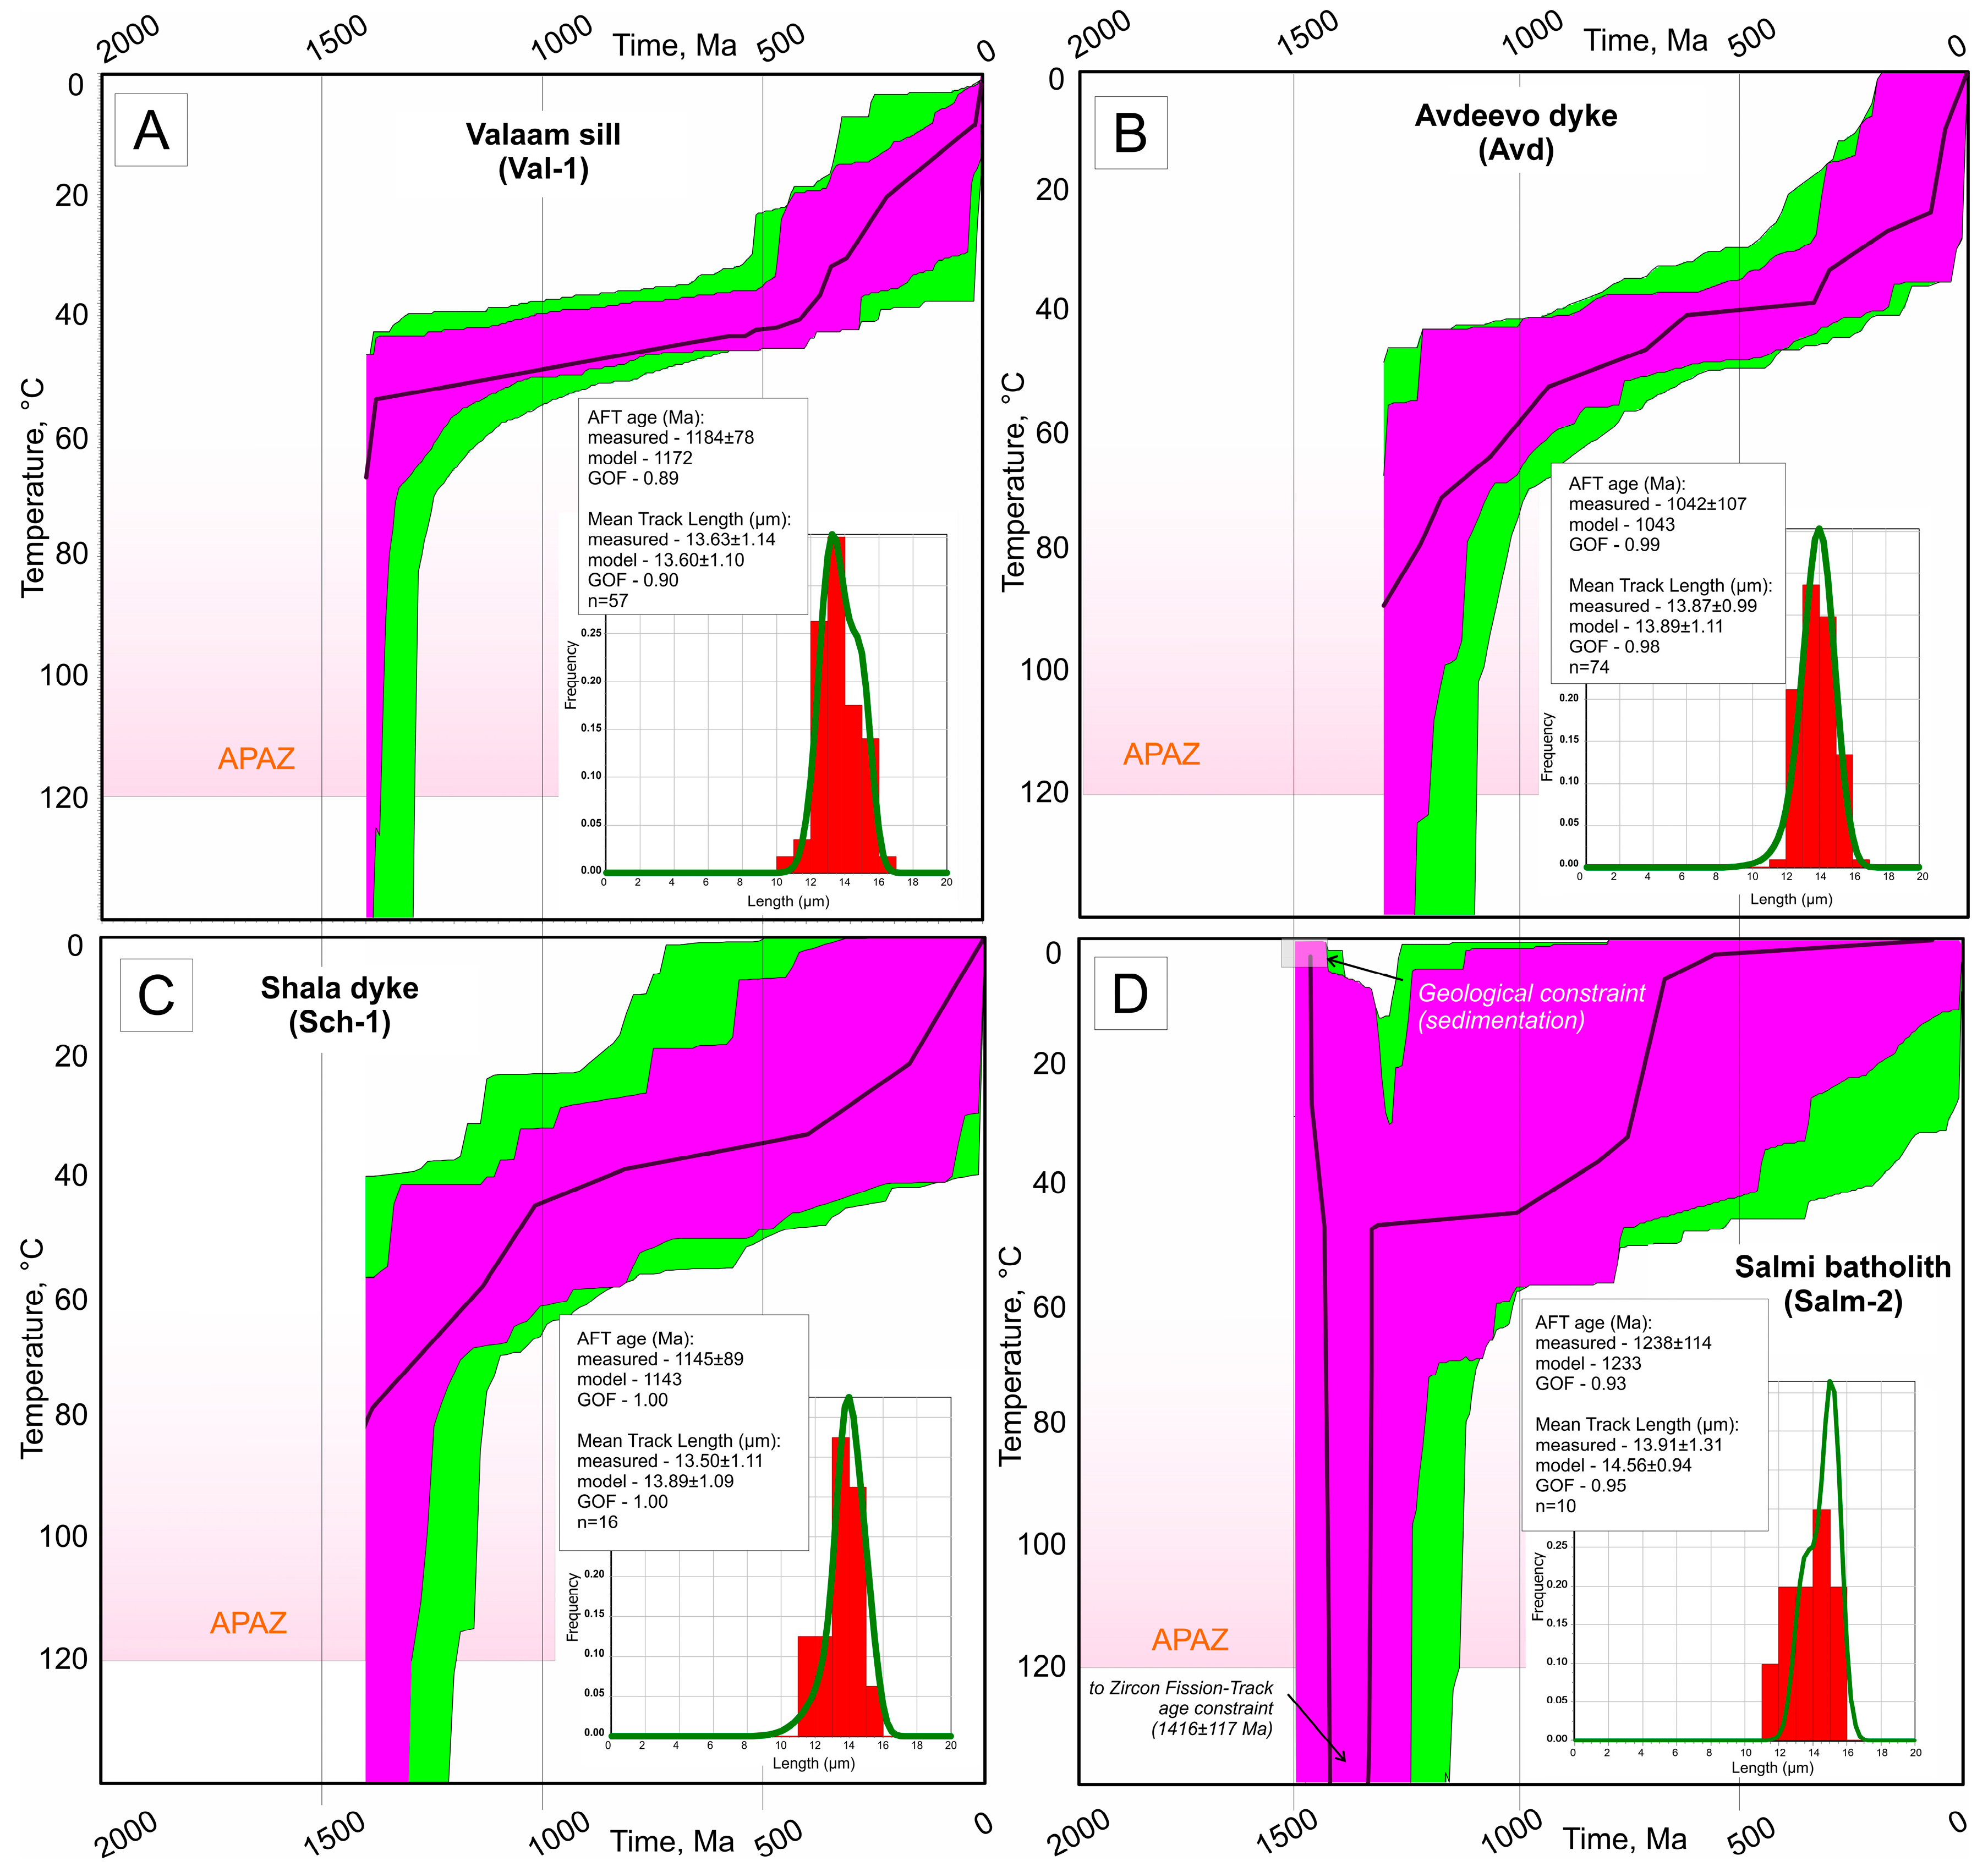
Time–temperature (t-T) models were constructed for the four studied objects (Figure 4) and are discussed below.
The thermal evolution of the Valaam sill (Figure 4A) and the Avdeevo dyke (Figure 4B) is similar, suggesting that the intrusions cooled to the host-rock temperature of ~60–50 °C at ca. 1 Ga and then experienced ultra-slow cooling at ~0.01–0.05 °C/Myr for ~1 Gyr. The thermal histories of these intrusions end with a phase of relatively rapid cooling to present-day near-surface temperatures at a rate of about 0.12 °C/Myr during the last 400–300 Myr.
The thermal history model for the Shala dyke (Figure 4C) is based on only 16 track lengths, which is below modern standards (models based on fewer than 40 lengths are generally considered less robust [52]); therefore, the model for the Shala dyke is regarded as preliminary, although it generally agrees well with models for the Valaam sill and the Avdeevo dyke.
The time–temperature model for the Salmi batholith (Figure 4D) is based on the single-grain AFT ages and track lengths for low-eU (<5.0 ppm) grains only. Unfortunately, only 10 track lengths were used in constructing the t-T model, since all other lengths were measured in high-eU grains. Therefore, this thermal model can be regarded as only very preliminary, although, anticipating the results, it is in good agreement with the models for the other intrusions. The geological situation and geochronological data (Table 1) from the Salmi batholith allow for use of the following constraints: (1) U–Pb zircon age—1543 ± 8 Ma (closure temperature ~800 °C, Ref. [53]), (2) U–Pb apatite age—1557 ± 10 Ma (~450 °C [54]), (3) zircon fission-track age—1416 ± 117 Ma (~330–190 °C, Refs. [41,55,56], and (4) apatite fission-track age (after correction for the REA effect)—1251 ± 125 Ma (60–120 °C, Refs. [36,41]). Taking into account these constraints, the thermal history of the Salmi batholith (Figure 4D) is as follows.
After the emplacement of the youngest phases of the intrusion at ca. 1530 Ma, the rocks cooled to the host-rock temperature, and by ~1477–1460 Ma, the Salmi batholith was exhumed to the surface [24,31]. Following exhumation to near-surface conditions and the onset of volcanogenic–terrigenous sedimentation within the paleorift system (including the Pasha–Ladoga rift), the Salmi batholith experienced prolonged (≥1 Myr) reheating at temperatures of 120–190 °C (scenario #1) or more than 190 °C (scenario #2) at ca. 1300 Ma. After 1300 Ma, the resolution of the t-T model is too low, but there is no obvious evidence that the thermal history of the Salmi batholith significantly differs from that of the adjacent Valaam sill.
The AFT data from the Wiborg batholith and Kuznechenskii massif were not used for inverse modeling.
From the thermal history modeling of the studied objects, we draw the general conclusion that four of the studied Precambrian intrusions—the Avdeevo and Shala dykes, the Salmi batholith, and the Valaam sill—cooled below 60–50 °C at about 1.3–1.0 Ga and experienced no subsequent reheating within and above the APAZ (60–120 °C). A similar thermal history has previously been obtained for intrusions in the northern part of the Karelian craton—the Ropruchey sill and the Pirttiguba dyke [12].
Given that the apatites from these intrusions have very low Cl contents (below ~0.35 wt. %), the direct effect of Cl on annealing kinetics is negligible [57]. Indeed, thermal history modeling using chlorine as the kinetic parameter did not reveal significant differences from models based on Dpar, confirming that our interpretations are not biased by the choice of kinetic parameter.
The similarity of the t-T models for the intrusions within the Archean Karelian craton and Svecofennian orogen allows us to make a preliminary conclusion on the absence of regional differences in the thermal history of tectonic blocks in the southeastern Fennoscandian Shield. Indeed, objects tectonically confined to the Archean Karelian craton—the Avdeevo and Shala dykes, the Pirttiguba dyke, and the Ropruchey sill—show similar thermal history models, which differ markedly from those of the Salmi batholith and Valaam sill, located within the transitional zone between the Svecofennian orogen and the Archean Karelian craton (the Raahe–Ladoga zone).
Tectonic interpretation of the apatite and zircon fission-track dating results indicates the sustained uplift of the southeastern Fennoscandian Shield over at least the past 1 billion years, without clear evidence for downward motions or large-scale endogenic events. Two main stages can be distinguished: (1) a long (~1 Gyr) period during which the studied rocks resided at 60–50 °C, and (2) an episode of increased cooling rate over the last 300 Myr. The accelerated cooling may reflect increased heat flow and/or accelerated vertical movements. Notably, the AFT results from Precambrian to Devonian complexes in the Murmansk craton, the Kola Province/Terrane, and the Devonian Kola alkaline intrusions [4,5,58] indicate the resetting of the AFT system around 300 Ma. While the precise driver remains speculative due to the absence of a preserved sedimentary cover, this accelerated cooling is consistent with reported episodes of km-scale exhumation in Fennoscandia during the Late Paleozoic–Early Mesozoic. Possible far-field causes include the Uralian Orogeny (e.g., reactivation of fracture networks) [59] and mantle dynamics related to the initial fragmentation of Pangea (i.e., epeirogenic uplift) [60]. Thus, we interpret this cooling acceleration as recording regional exhumation rather than a local thermal event.

6. Conclusions

This study presents new AFT and ZFT thermochronological data from six Precambrian intrusions exposed in the southeastern part of the Fennoscandian Shield, an area that until now has remained largely unexplored by low-temperature thermochronology. The main conclusions of this paper are as follows:
  • New apatite fission-track ages and the first zircon fission-track thermochronology results were obtained for the Precambrian magmatic complexes in the southeastern Fennoscandian Shield. The oldest AFT ages (the Avdeevo dyke—1041 Ma, the Shala dyke—1145 Ma, and the Valaam sill—1184 Ma) were obtained from mafic rocks, whose apatite is characterized by elevated chlorine contents.
  • We attempted to minimize the contribution of the α-radiation-enhanced annealing (REA) effect to the age of the Salmi batholith and the Kuznechenskii massif. For the Salmi intrusion, a reliable central age of 1251 ± 125 Ma and a preliminary thermal model were successfully obtained. For the Kuznechenskii massif, it was not possible to minimize the REA effect and obtain a reliable AFT age.
  • Thermal history modeling of the studied intrusion indicates that the region encompassing the southern part of the Karelian craton and the southeastern margin of the Svecofennian orogen has experienced sustained slow uplift over the last billion years, without any significant thermal events. At the same time, apatite from most of the studied objects records an acceleration in cooling rate during the last 300 Myr.
  • Our data, as a first approximation, do not allow us to infer a different thermal history for the Precambrian intrusive bodies located within the tectonically contrasting lithosphere—the Archean Karelian craton and the Svecofennian orogen (or their transitional zone). However, to convincingly resolve this issue, a larger amount of reliable data is needed, preferably from mafic rocks.

Supplementary Materials

The following supporting information can be downloaded at: https://www.mdpi.com/article/10.3390/min16060659/s1, Table S1: Raw AFT data; Table S2: LA-ICP-MS parameters; Table S3: AFT models’ parameters.

Author Contributions

T.E.B., R.V.V., and A.V.C. conceived and designed this study. T.E.B., D.A.K., and A.V.S. conducted the fieldwork. T.E.B., D.A.K., A.V.C., and R.V.V. conducted the AFT and ZFT analysis and t-T modeling. All authors discussed the results, problems, and methods, and contributed to the interpretation of the data and the writing of this paper. All authors have read and agreed to the published version of the manuscript.

Funding

This research was supported by the Russian Scientific Foundation, grant no. 24-77-00040, https://rscf.ru/project/24-77-00040/ (17 June 2026).

Data Availability Statement

The original contributions presented in this study are included in the article and Supplementary Materials; further inquiries can be directed to the corresponding authors.

Acknowledgments

We thank the editors and the anonymous reviewers for their constructive comments leading to substantial improvement of the manuscript.

Conflicts of Interest

The authors declare no conflicts of interest.

References

  1. Green, P.F.; Japsen, P.; Bonow, J.M.; Chalmers, J.A.; Duddy, I.R.; Kukkonen, I.T. The post-Caledonian thermo-tectonic evolution of Fennoscandia. Gondwana Res. 2022, 107, 201–234. [Google Scholar] [CrossRef]
  2. Hall, A.M.; Putkinen, N.; Hietala, S.; Lindsberg, E.; Holma, M. Ultra-slow Cratonic denudation in Finland since 1.5 Ga indicated by tiered unconformities and impact structures. Precambr. Res. 2021, 352, 106000. [Google Scholar] [CrossRef]
  3. Hendriks, B.; Andriessen, P.; Huigen, Y.; Leighton, C.; Redfield, T.; Murrell, G.; Gallagher, K.; Nielsen, S.B. A fission track data compilation for Fennoscandia. Nor. J. Geol. 2007, 87, 143–155. [Google Scholar]
  4. Veselovskiy, R.V.; Thomson, S.N.; Arzamastsev, A.A.; Botsyun, S.; Travin, A.V.; Yudin, D.S.; Samsonov, A.V.; Stepanova, A.V. Thermochronology and exhumation history of the northeastern Fennoscandian Shield since 1.9 Ga: Evidence from 40Ar/39Ar and apatite fission track data from the Kola Peninsula. Tectonics 2019, 38, 2317–2337. [Google Scholar] [CrossRef]
  5. Veselovskiy, R.V.; Arató, R.; Bagdasaryan, T.E.; Samsonov, A.V.; Stepanova, A.V.; Arzamastsev, A.A.; Myshenkova, M.S. New apatite fission-track data from the Murmansk Craton, NE Fennoscandia: An echo of hidden thermotectonic events. Minerals 2020, 10, 1095. [Google Scholar] [CrossRef]
  6. Gaál, G.; Gorbatschev, R. An outline of the Precambrian evolution of the Baltic Shield. Precambr. Res. 1987, 35, 15–52. [Google Scholar] [CrossRef]
  7. Gorbatschev, R.; Bogdanova, S. Frontiers in the Baltic Shield. Precambr. Res. 1993, 64, 3–21. [Google Scholar] [CrossRef]
  8. Nironen, M. The Svecofennian Orogen. Precambr. Res. 1997, 86, 21–44. [Google Scholar] [CrossRef]
  9. Lahtinen, R.; Korja, A.; Nironen, M. Paleoproterozoic Tectonic Evolution of the Fennoscandian Shield. In Precambrian Geology of Finland—Key to the Evolution of the Fennoscandian Shield; Lehtinen, M., Nurmi, P.A., Rämö, O.T., Eds.; Elsevier: Amsterdam, The Netherlands, 2005; pp. 481–532. [Google Scholar]
  10. Bogdanova, S.V.; Gorbatschev, R.; Garetsky, R.G. East European Craton. In Encyclopedia of Geology, 2nd ed.; Elsevier: Amsterdam, The Netherlands, 2020; Volume 4, pp. 284–301. [Google Scholar] [CrossRef]
  11. Koistinen, T.; Stephens, M.B.; Bogatchev, V.; Nordgulen, Ø.; Wennestrom, M.; Korhonen, J. Geological Map of the Fennoscandian Shield, Scale 1:2 000 000; Geological Survey of Finland (GTK): Espoo, Finland; Geological Survey of Norway (NGU): Trondheim, Norway; Geological Survey of Sweden (SGU): Uppsala, Sweden; Ministry of Natural Resources of Russia: Moscow, Russia, 2001. [Google Scholar]
  12. Bagdasaryan, T.E.; Veselovskiy, R.V.; Stepanova, A.V.; Bychkov, A.Y. Apatite fission track dating of rocks of the Karelian Archean Craton: First results. Dokl. Earth Sci. 2025, 523, 113–120. (In Russian) [Google Scholar] [CrossRef]
  13. Kohn, B.P.; Gleadow, A.J.W.; Brown, R.W.; Gallagher, K.; O’Sullivan, P.B.; Foster, D.A. A reappraisal of low-temperature thermochronology of the eastern Fennoscandian Shield and radiation-enhanced apatite fission-track annealing. Geol. Soc. Lond. Spec. Publ. 2009, 324, 193–216. [Google Scholar] [CrossRef]
  14. Kulikov, V.S.; Bychkova, Y.V.; Kulikova, V.V.; Ernst, R. The Vetreny Poyas (Windy Belt) subprovince of southeastern Fennoscandia: An essential component of the ca. 2.5–2.4 Ga Sumian large igneous provinces. Precambr. Res. 2010, 183, 589–601. [Google Scholar] [CrossRef]
  15. Baltybaev, S.K.; Salnikova, E.B.; Glebovitsky, V.A.; Berezhnaya, N.G.; Yakovleva, S.Z.; Kovach, V.P. Kuznechensky massif of potassium porphyritic granites: Results of U-Pb dating and substantiation of tectonic position. Dokl. Earth Sci. 2004, 398, 519–523. [Google Scholar]
  16. Vaasjoki, M.; Rämö, O.T.; Sakko, M. New U–Pb ages from the Wiborg rapakivi area: Constraints on the temporal evolution of the rapakivi granite–anorthosite–diabase dyke association of southern Finland. Precambr. Res. 1991, 51, 227–243. [Google Scholar] [CrossRef]
  17. Rämö, O.T.; Haapala, I. Rapakivi granite magmatism: A global review with emphasis on petrogenesis. In Petrology and Geochemistry of Magmatic Suites of Rocks in the Continental and Oceanic Crust; Demaiffe, D., Ed.; ULB: Bruxelles, Belgium, 1996; pp. 177–200. [Google Scholar]
  18. Alviola, R.; Johanson, B.; Rämö, O.T.; Vaasjoki, M. The Proterozoic Ahvenisto granite-massif-type anorthosite complex, southeastern Finland: Petrography and U–Pb chronology. Precambr. Res. 1999, 95, 89–107. [Google Scholar] [CrossRef]
  19. Neymark, L.A.; Amelin, Y.V.; Larin, A.M. Pb-Nd-Sr isotopic and geochemical constraints on the origin of the 1.54–1.56 Ga Salmi rapakivi granite-anorthosite batholith (Karelia, Russia). Miner. Petrol. 1994, 50, 173–193. [Google Scholar] [CrossRef]
  20. Amelin, Y.V.; Larin, A.M.; Tucker, R.D. Chronology of multiphase emplacement of the Salmi rapakivi granite–anorthosite complex, Baltic Shield: Implications for magmatic evolution. Contrib. Mineral. Petrol. 1997, 127, 353–368. [Google Scholar] [CrossRef]
  21. Suominen, V. The chronostratigraphy of SW Finland with special reference to the Postjotnian and Subjotnian diabases. Geol. Surv. Finl. Bull. 1991, 356, 100. [Google Scholar]
  22. Rämö, O.T.; Mänttäri, I.; Vaasjoki, M.; Upton, B.G.J.; Sviridenko, L. Age and significance of Mesoproterozoic CFB magmatism, Lake Ladoga region, NW Russia. Geol. Soc. Am. Abstr. Programs 2001, 33, A-L 139. [Google Scholar]
  23. Rämö, O.T.; Mänttäri, I.; Kohonen, J.; Upton, B.G.J.; Luttinen, V. Mesoproterozoic CFB magmatism in the Lake Ladoga basin, Russian Karelia. In Proceedings of the Fifth Dyke Conference, Rovaniemi, Finland, 31 July–3 August 2005; p. 41. [Google Scholar]
  24. Kuptsova, A.V.; Khudoley, A.K.; Davis, W.; Rainbird, R.H.; Kovach, V.P.; Zagornaya, N.Y. Age and provenance of sandstones from the Priozersk and Salmi formations of the Riphean in the eastern part of the Pasha-Ladoga Basin (Southern margin of the Baltic Shield). Stratigr. Geol. Correl. 2011, 19, 117–133. [Google Scholar] [CrossRef]
  25. Velikoslavinsky, D.A.; Birkis, A.P.; Bogatikov, O.A.; Bukharev, V.P.; Velikoslavinsky, S.D.; Gordienko, L.I.; Zinchenko, O.V.; Kivisilla, Y.Y.; Kirs, Y.E.; Kononov, Y.V.; et al. Anortozit-Rapakivigranitnaya Formatsiya (Anorthosite–Rapakivi Granite Formation); Nauka Publ.: Leningrad, Russia, 1978; 296p. [Google Scholar]
  26. Simonen, A. Pre-Quaternary Rocks of the Map-Sheet Areas of the Rapakivi Massif in SE Finland. Geological Map of Finland 1:100 000, Explanation to the Maps of Pre-Quaternary Rocks, Sheets 3023 + 3014, 3024, 3041, 3042, 3044, 3113, 3131 and 3133; Geological Survey of Finland: Espoo, Finland, 1987; 49p, (In Finnish with an English summary). [Google Scholar]
  27. Sharkov, E.A. Middle-Proterozoic anorthosite–rapakivi granite complexes: An example of within-plate magmatism in abnormally thick crust: Evidence from the East European Craton. Precambr. Res. 2010, 183, 689–700. [Google Scholar] [CrossRef]
  28. Sviridenko, L.P.; Svetov, A.P. Valaam Sill of Gabbro-Dolerites and Geodynamics of the Lake Ladoga Basin; Karelian Research Centre RAS: Petrozavodsk, Russia, 2008; 123p. [Google Scholar]
  29. Stepanova, A.V.; Sukhanova, M.A.; Salnikova, E.B.; Egorova, S.V.; Lubnina, N.V.; Sibelev, O.S. Short duration of mantle events in the early Paleoproterozoic: A case study of mafic dikes in the south-eastern Fennoscandian Shield. Dokl. Earth Sci. 2026, 528, 39. [Google Scholar]
  30. Chistyakov, A.V.; Sharkov, E.V. Petrology of the Early Paleoproterozoic Burakovsky Complex, Southern Karelia. Petrology 2008, 16, 63–86. [Google Scholar] [CrossRef]
  31. Sharkov, E.V. Proterozoic anorthosite-rapakivi granite complexes of the East European Craton as an example of within-plate magmatism in conditions of anomalously thick sialic crust. Lithosphere 2005, 4, 3–21. (In Russian) [Google Scholar]
  32. Larin, A. Salmi batholith and Pitkäranta ore field in Soviet Karelia: Ore mineralization. In Geological Survey of Finland Guide 33; Haapala, I., Rämö, O.T., Salonsaari, P.T., Eds.; University of Helsinki: Helsinki, Finland, 1991; pp. 19–34. [Google Scholar]
  33. Beljaev, A.; Stepanov, K. Salmi batholith and Pitkäranta ore field in Soviet Karelia: Internal structure and composition of the Salmi batholith. In Geological Survey of Finland Guide 33; Haapala, I., Rämö, O.T., Salonsaari, P.T., Eds.; University of Helsinki: Helsinki, Finland, 1991; pp. 8–11. [Google Scholar]
  34. Lubnina, N.V.; Pisarevsky, S.A.; Stepanova, A.V.; Bogdanova, S.V.; Sokolov, S.J. Fennoscandia before Nuna/Columbia: Paleomagnetism of 1.98–1.96 Ga mafic rocks of the Karelian craton and paleogeographic implications. Precambr. Res. 2017, 292, 1–12. [Google Scholar] [CrossRef]
  35. Bleeker, W.; Hamilton, M.A.; Ernst, R.E.; Kulikov, V.S. The search for Archean-Paleoproterozoic superCratons: New constraints on Superior-Karelia-Kola correlations within superCraton Superia, including the first ca. 2504 Ma (Mistassini) ages from Karelia. In Proceedings of the 33rd International Geological Congress (IGC), Oslo, Norway, 6–14 August 2008. [Google Scholar]
  36. Malusà, M.G.; Fitzgerald, P.G. Fission-Track Thermochronology and its Application to Geology; Springer Textbooks in Earth Sciences, Geography and Environment; Springer: Cham, Switzerland, 2019; ISBN 978-3-030-01646-3. [Google Scholar]
  37. Gleadow, A.J.W.; Hurford, A.J.; Quaife, R.D. Fission track dating of zircon: Improved etching techniques. Earth Planet. Sci. Lett. 1976, 33, 273–276. [Google Scholar] [CrossRef]
  38. Balkanska, E.; Georgiev, S.; Kounov, A.; Tagami, T.; Sueoka, S. Fission-track analysis using LA-ICP-MS: Techniques and procedures adopted at the new low-temperature Thermochronology Laboratory in Bulgaria. C. R. Acad. Bulg. Sci. 2021, 74, 102–109. [Google Scholar] [CrossRef]
  39. Cogné, N.; Chew, D.M.; Donelick, R.A.; Ansberque, C. LA-ICP-MS apatite fission track dating: A practical zeta-based approach. Chem. Geol. 2020, 531, 119302. [Google Scholar] [CrossRef]
  40. Iwano, H.; Danhara, T.; Danhara, Y.; Hirabayashi, S.; Nakajima, T.; Sakai, H.; Hirata, T. Zircon fission track and U–Pb double dating using femtosecond laser ablation–inductively coupled plasma–mass spectrometry: A technical note. Isl. Arc 2020, 29, e12348. [Google Scholar] [CrossRef]
  41. Kohn, B.P.; Ketcham, R.A.; Vermeesch, P.; Boone, S.C.; Hasebe, N.; Chew, D.; Bernet, M.; Chung, L.; Danišík, M.; Gleadow, A.J.W.; et al. Interpreting and reporting fission-track chronological data. Geol. Soc. Am. Bull. 2024, 136, 3891–3920. [Google Scholar] [CrossRef]
  42. Ketcham, R.A. Technical Note: Incorporating Topographic Deflection Effects into Thermal History Modelling; Texas Data Repository: Austin, TX, USA, 2025. [Google Scholar] [CrossRef]
  43. Ketcham, R.A.; Carter, A.; Donelick, R.A.; Barbarand, J.; Hurford, A.J. Improved modeling of fission-track annealing in apatite. Am. Mineral. 2007, 92, 799–810. [Google Scholar] [CrossRef]
  44. McDannell, K.T.; Issler, D.R.; O’Sullivan, P.B. Radiation-enhanced fission track annealing revisited and consequences for apatite thermochronometry. Geochim. Cosmochim. Acta 2019, 252, 213–239. [Google Scholar] [CrossRef]
  45. Vermeesch, P. IsoplotR: A free and open toolbox for geochronology. Geosci. Front. 2018, 9, 1479–1493. [Google Scholar] [CrossRef]
  46. Barbarand, J.; Carter, A.; Wood, I.; Hurford, T. Compositional and structural control of fission-track annealing in apatite. Chem. Geol. 2003, 198, 107–137. [Google Scholar] [CrossRef]
  47. Carlson, W.D.; Donelick, R.A.; Ketcham, R.A. Variability of apatite fission-track annealing kinetics: I. Experimental results. Am. Mineral. 1999, 84, 1213–1223. [Google Scholar] [CrossRef]
  48. Green, P.F.; Duddy, I.R.; Gleadow, A.J.W.; Tingate, P.R.; Laslett, G.M. Thermal annealing of fission tracks in apatite: 1. A qualitative description. Chem. Geol. Isot. Geosci. Sect. 1986, 59, 237–253. [Google Scholar] [CrossRef]
  49. Herman, F.; Seward, D.; Valla, P.G.; Carter, A.; Kohn, B.; Willett, S.D.; Ehlers, T.A. Worldwide acceleration of mountain erosion under a cooling climate. Nature 2013, 504, 423–426. [Google Scholar] [CrossRef] [PubMed]
  50. Powell, J.W.; Kellett, D.A.; Kohlmann, F.; McMillan, M. Canadian ThermoCHronology (CATCH) database: Northern Canada compilation. Geol. Surv. Can. 2025, 13, 9225. [Google Scholar] [CrossRef]
  51. Leprêtre, R.; Barbarand, J.; Missenard, Y.; Gautheron, C.; Saddiqi, O. Mesozoic Evolution of NW Africa: Implications for the Central Atlantic Ocean Dynamics. J. Geol. Soc. 2017, 174, 817–835. [Google Scholar] [CrossRef]
  52. Rahn, M.; Seward, D. How many track lengths do we need? Radiat. Meas. 2000, 10, 14–17, (unpublished Newsletter of the International Fission-Track Community). [Google Scholar]
  53. Grimes, G.W.; Cheadle, M.J.; John, B.E.; Reiners, P.W.; Wooden, J.L. Cooling rates and the depth of detachment faulting at oceanic core complexes: Evidence from zircon Pb/U and (U-Th)/He ages. Geochem. Geophys. Geosyst. 2011, 12, Q0AG01. [Google Scholar] [CrossRef]
  54. Chamberlain, K.R.; Bowring, S.A. Apatite–feldspar U–Pb thermochronometer: A reliable, mid-range (~450 °C), diffusion-controlled system. Chem. Geol. 2001, 172, 173–200. [Google Scholar] [CrossRef]
  55. Karl, M.; Glasmacher, U.A.; Kollenz, S.; Franco-Magalhaes, A.O.; Stockli, D.F.; Hackspacher, P.C. Evolution of the South Atlantic passive continental margin in southern Brazil derived from zircon and apatite (U–Th–Sm)/He and fission-track data. Tectonophysics 2013, 604, 224–244. [Google Scholar] [CrossRef]
  56. Yamada, R.; Tagami, T.; Nishimura, S.; Ito, H. Annealing kinetics of fission tracks in zircon: An experimental study. Chem. Geol. 1995, 122, 249–258. [Google Scholar] [CrossRef]
  57. Donelick, R.A.; O’Sullivan, P.B.; Ketcham, R.A. Apatite fission-track analysis. Rev. Mineral. Geochem. 2005, 58, 49–94. [Google Scholar] [CrossRef]
  58. Veselovskiy, R.V.; Thomson, S.N.; Arzamastsev, A.A.; Zakharov, V.S. Apatite fission track thermochronology of Khibina Massif (Kola Peninsula, Russia): Implications for post-Devonian tectonics of the NE Fennoscandia. Tectonophysics 2015, 665, 157–163. [Google Scholar] [CrossRef]
  59. Puchkov, V.N. The evolution of the Uralian orogen. Geol. Soc. Lond. Spec. Publ. 2009, 327, 161–195. [Google Scholar] [CrossRef]
  60. Japsen, P.; Green, P.F.; Bonow, J.M.; Erlström, M. Episodic Burial and Exhumation of the Southern Baltic Shield: Epeirogenic Uplifts during and after Break-up of Pangaea. Gondwana Res. 2016, 35, 357–377. [Google Scholar] [CrossRef]
Figure 1. Tectonic scheme of the Fennoscandian Shield and the positions of sampling sites (yellow symbols) for apatite and zircon fission-track dating, simplified after [11,12]. The symbols with colored backgrounds indicate objects for which apatite fission-track analysis was performed in the following works [12] (green), Ref. [13] (blue), and [4] (pink). The most reliable results of this study are underlined. The asterisk (*) denotes the results of this study that should be used very carefully. REA—the AFT data possibly affected by the REA effect (this study). Corr.—the corrected AFT data for the Salmi batholith with the minimized input of the REA effect.
Minerals 16 00659 g001
Figure 3. Diagrams illustrating the REA effect in the Salmi batholith and Kuznechenskii massif. (A)—the radial plot for the Salmi batholith with only low-eU (<5 ppm) grains. (B)—the radial plot for the Kuznechenskii massif with only the lowest-eU (<5.5 ppm) grains. (C)—the radial plot for the Kuznechenskii massif with only low-eU (<10.5 ppm) grains. (D)—a diagram showing the dependence of single-grain AFT age on eU for low-eU grains from the Salmi batholith (orange dots and orange linear regression line) and Kuznechenskii massif (blue dots and blue/black linear regression lines). r—the correlation coefficient for low-eU grains and for all grains (in brackets). The radial plots were generated using the package ‘IsoplotR’ [45].
Minerals 16 00659 g003
Figure 4. The results of thermal history modeling for the samples from (A) the Valaam sill (Val-1), (B) the Avdeevo dyke (Avd), (C) the Shala dyke (Sch-1), and (D) Salmi batholith (Salm-2), after the minimization of REA. Top panels: the thermal history model; the purple and green colors correspond to the 95% and 50% confidence intervals (GOF) relative to the best-fit model, respectively; the black line represents the thermal model that best matches the apatite fission-track age and length distribution. Bottom right panels: a red histogram of the measured fission-track lengths in the sample; the green curve shows the fission-track length distribution predicted by the model. APAZ—apatite partial annealing zone.
Minerals 16 00659 g004
Disclaimer/Publisher’s Note: The statements, opinions and data contained in all publications are solely those of the individual author(s) and contributor(s) and not of MDPI and/or the editor(s). MDPI and/or the editor(s) disclaim responsibility for any injury to people or property resulting from any ideas, methods, instructions or products referred to in the content.