


Abstract
Identifying beryl within muscovite host rocks is a challenging task for traditional X-ray transmission (XRT) separation due to the proximity of their effective atomic numbers (Zeff) and densities. In this paper, an improved dual-energy X-ray transmission (DE-XRT) method using second-order polynomial calibration is proposed to compensate for the beam hardening effect in massive samples. To verify the accuracy of the method, natural beryl and muscovite intergrowths were investigated on an experimental DE-XRT setup (160 kV), and the results were compared with computed tomography (CT) data. The results confirm that the polynomial model reliably identifies both exposed and hidden (internal) beryl inclusions. It was established that at a sample thickness of approximately 20–30 mm, the system confidently detects inclusions constituting more than 15% of the total thickness; this threshold serves as a preliminary quantitative estimate given the finite sample set. With an increase in thickness beyond 40 mm, the detection threshold rises due to significant absorption of the low-energy spectrum component, which leads to a loss of dual-energy contrast and a critical reduction in the signal-to-noise ratio. The proposed approach creates a basis for effective beryl pre-concentration, ensuring the preservation of large crystals from mechanical damage during crushing.
1. Introduction
Currently, dual-energy X-ray radiography (DE) is widely used for material identification in medicine, non-destructive testing, and baggage screening systems. The foundations of the method were laid by G. N. Hounsfield [1], who proposed the concept of substance separation based on their absorptivity, and were further developed in the works of R. Alvarez and A. Macovski [2]. Their research enabled material decomposition based on the energy dependence of radiation attenuation coefficients.
Traditionally, DE methods evolved within the framework of computed tomography (CT), where they remain a subject of active research today [3,4,5,6,7,8]. However, their application in planar (single-projection) radiography is equally significant. While CT efforts are primarily focused on medical tasks, planar studies have found widespread application in security systems [9,10,11,12], particularly for detecting explosives with atomic numbers close to those of organic substances [13,14]. Nevertheless, the potential of DE methods in mineralogy, especially when studying gemstones with similar physical properties, remains not fully realized.
The relevance of dual-energy (DE) methods is also increasing in mineral processing tasks [15,16,17,18]. Unlike screening systems, radiography of rock mass requires the analysis of dense objects across a wide range of thicknesses, where valuable minerals are often close in chemical composition to the host rock. Research at the extraction stage is critically important, as the value of the product correlates nonlinearly with their size and purity.
Modern X-ray transmission (XRT) separators, successfully used in diamond and coal mining, are based on these principles. For instance, the work of Firsching et al. [19] demonstrated the effectiveness of separating diamonds from kimberlite. Studies [20] show that the application of XRT separation allows for diamond recovery levels of 99%, which significantly exceeds the performance of the X-ray luminescence method (91%). DE methods have also proven their effectiveness in coal separation tasks [21].
The efficiency of XRT separation directly depends on the contrast between the effective atomic numbers of the target mineral (Zeff_target) and the host rock (Zeff_host). In the case of diamond mining, the difference is substantial: the Zeff of diamond is 6, while for kimberlite, this figure is close to 12. Such a significant absorption gradient has made it possible to increase diamond recovery by 8% compared to luminescence methods [20].
Beryl and its precious varieties (emerald, aquamarine) are of similar interest for radiographic detection. Currently, X-ray luminescence remains the primary method for their extraction. However, this method does not allow for the detection of stones inside rock fragments, leading to their accidental destruction during crushing stages and the loss of valuable large crystals. The application of DE methods for beryl is complicated by the proximity of its characteristics to host rocks, such as muscovite. Both materials are complex aluminosilicates with similar effective atomic numbers (Zeff_beryl ≈ 10.5, Zeff_muscovite ≈ 12.0), making their differentiation by standard methods extremely difficult.
It should be noted that the choice of hardware implementation for dual-energy systems significantly affects identification accuracy. Currently, the most technologically advanced solution is photon-counting detectors (PCDs), which possess spectral selectivity [22,23]. However, their application in mineralogy is limited by low efficiency at high energies, making them suitable primarily for low-atomic-number objects of small thickness.
Alternative approaches, such as the use of dual-source systems [24] or “sandwich” type detectors with selective filters [25,26,27,28], demonstrate greater stability. Furthermore, for the analysis of dense media, line-scan detectors are preferable to flat-panel detectors (FPDs) [29], as the latter are susceptible to the strong influence of scattered radiation, which is extremely difficult to account for during dual-energy processing.
Despite advances in hardware, the ability to differentiate substances with similar attenuation properties remains limited [30,31,32]. This is largely due to the specific nature of the radiation sources used: industrial analysis typically employs X-ray tubes with a continuous bremsstrahlung spectrum, a choice dictated by their long service life, stability, and the power required to penetrate dense rocks. However, the use of polychromatic radiation inevitably leads to the beam hardening effect: as the radiation passes through significant rock thicknesses, the low-energy part of the spectrum is preferentially absorbed, which distorts the final data. Consequently, the relationship between attenuation and energy becomes non-linear, and at greater thicknesses, the contrast between beryl and muscovite is neutralized, making their correct differentiation by traditional methods impossible.
Due to the proximity of effective atomic numbers (Zeff) and the pronounced beam hardening effect, the classical representation of decomposition coefficients in the Alvarez-Macovski model as constants (linear approximation) proves to be insufficiently accurate. This paper proposes using a polynomial dependence for these coefficients, which allows for compensation of spectral distortions across a wide dynamic range of thicknesses.
The objective of this work is to determine the limiting sizes of beryl inclusions in muscovite that can be identified using the dual-energy method across a wide range of host rock thicknesses.
To achieve this objective, the following tasks were addressed in this paper:
- Theoretical absorption spectra of beryl and muscovite were calculated, and the necessity of transitioning from a linear approximation to a polynomial dependence in the dual-energy coordinate space was justified to compensate for the beam hardening effect;
- Experimental studies were conducted on a specialized test bench using sandwich- type line-scan detectors;
- Sensitivity thresholds for beryl detection were determined for various thicknesses of the host rock (muscovite);
- The experimental results were verified using CT scans of the studied samples, which allowed for a comparison between the real geometry of the inclusions and the planar radiography data.
The application of the proposed approach allows for a quantitative assessment of the potential of XRT separation to improve the preservation of large beryl crystals at the early stages of mineral processing.
2. Materials and Methods
2.1. Selected Substances and Theoretical Background
The study focuses on the identification of beryl inclusions (Be3Al2Si6O18) within a muscovite host rock (KAl2(AlSi3O10)(OH)2). We also performed calculations for fluorite (CaF2), which sometimes occurs as an associated mineral. It possesses a sufficiently high contrast relative to the materials under consideration and is included in this work to emphasize how challenging the task of beryl identification against a muscovite background is. While fluorite is easily distinguished, beryl and muscovite present a significant challenge for X-ray transmission (XRT) separation due to their overlapping effective atomic numbers (Zeff) and similar densities (ρ ≈ 2.63–2.85 g/cm3). Chemical composition data are presented based on the International Mineralogical Association classification [33].
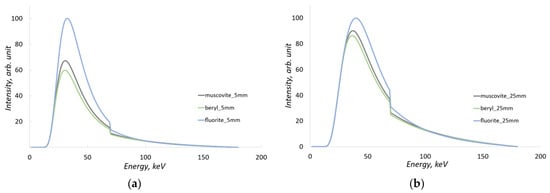
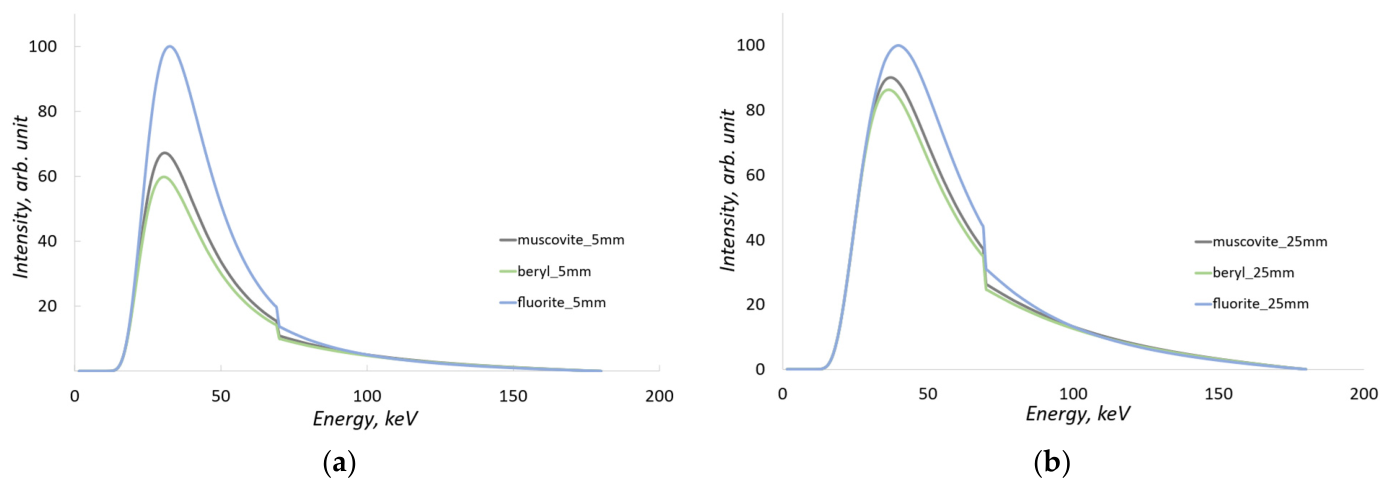
As seen from the chemical formulas, both beryl and muscovite contain significant amounts of oxygen, silicon, and aluminum. Their similar chemical composition results in comparable X-ray attenuation characteristics. The absorption spectra of these substances were calculated for sample thicknesses of 5 mm and 25 mm and are shown in Figure 1.
Figure 1.
Absorption X-ray spectra for muscovite, beryl, and fluorite, calculated for (a) sample thickness of 5 mm, (b) sample thickness of 25 mm.
Absorption spectra indicate that for beryl and muscovite, the most significant differences in attenuation are observed at low radiation energies and smaller sample thicknesses. As the object thickness increases, the absorption of low-energy radiation rises significantly, leading to a decrease in the differences between the absorption spectra.
The theoretical X-ray spectra and the corresponding energy-dependent linear absorption coefficients µ(E) for beryl and muscovite (presented in Figure 1) were modeled using the SpekPy Python toolkit (version 2.0) [34]. The photon mass attenuation coefficients utilized by the toolkit for material simulation are based on cross-section data from the PENELOPE Monte Carlo code system. To ensure full reproducibility and technical consistency of the methodology, all subsequent theoretical calculations, numerical modeling, and dual-energy data processing algorithms in this work were also developed and implemented within the Python programming environment.
2.2. Dual-Energy Image Processing
The dual-energy (DE) processing method allows for the calculation of the effective atomic number (Zeff) of the substance under study. For materials with similar physicochemical properties, such as beryl and muscovite, the accuracy of this process is of critical importance.
Classical linear models are inapplicable in this case: as sample thickness increases, the beam hardening effect manifests, leading to a reduction in contrast and making linear approximation inaccurate. In this section, we consistently examine two approaches to data interpretation: an idealized monoenergetic case and a more realistic method using a polynomial dependence for polychromatic radiation and a dual-layer (sandwich) detector.
2.2.1. Case of Monoenergetic Radiation
In most studies on dual-energy processing, the absorption of photon radiation is presented for a specific value of low energy and high energy. Consider the case of radiation passing through a homogeneous object at fixed low and high energies.
The attenuation of monoenergetic radiation through a homogeneous medium is described by the Beer-Lambert law (1):
where I is the intensity of the radiation that has passed through the object, I0 is the intensity of the direct radiation, μ is the mass attenuation coefficient of the radiation in the given material for the specified energy, ρ is the density, which can be considered a constant for a specific substance, and x is the thickness of the object under investigation. If radiation at two different energies is used, we can obtain a system of Equation (2):
where the symbol L refers to low-energy radiation and the symbol H refers to high-energy radiation. This system of equations can be transformed as follows (3):
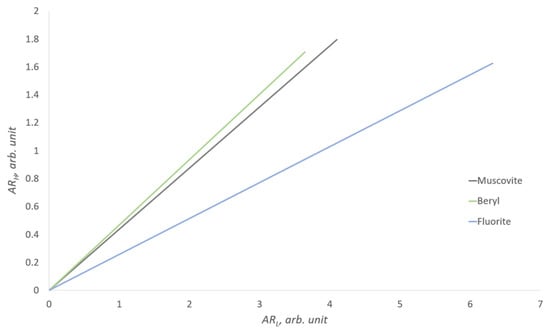
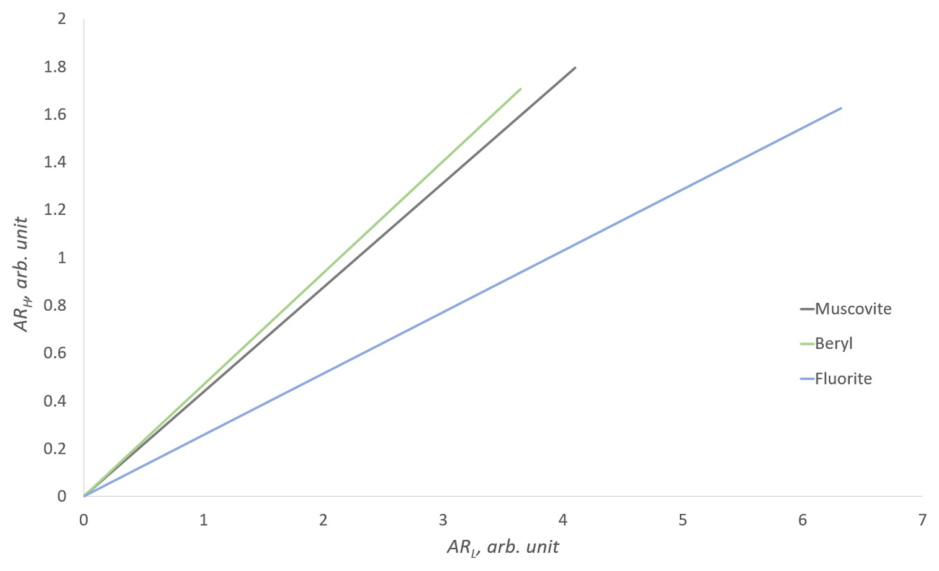
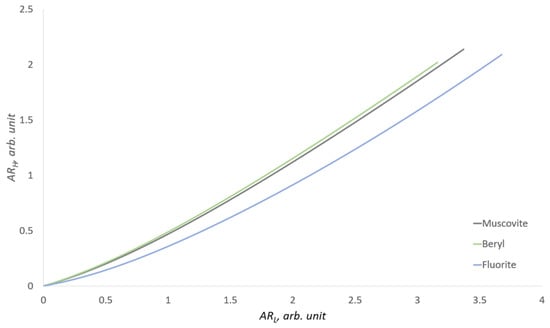
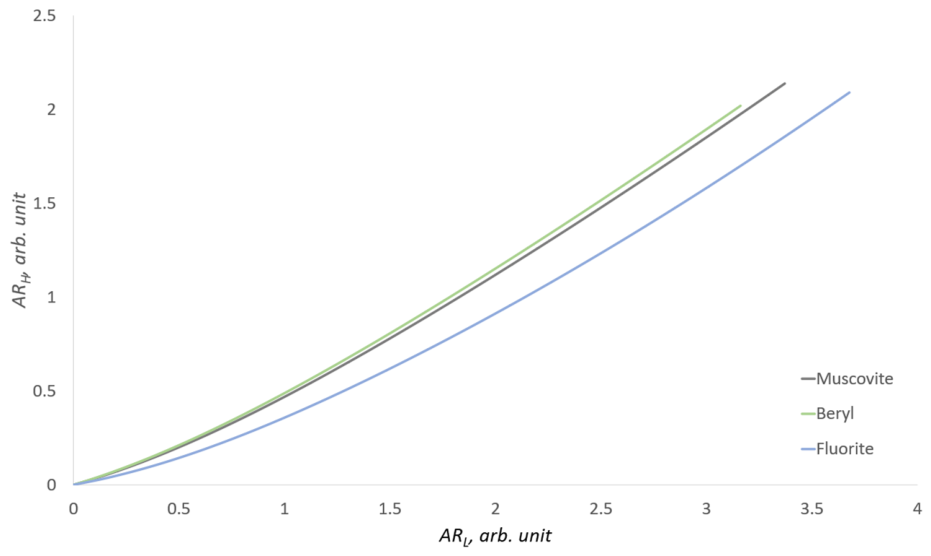
In the monoenergetic case, the attenuation coefficients are constant; thus, the ratio µH/µL = k, where k is a constant that characterizes only a specific substance. If we make the substitutions ARL = µL · ρ · x = − and ARH = µH · ρ · x = −, then the influence of the object’s thickness in this case will be linear. The intensity data IL, IH can be obtained experimentally or through calculation. For the minerals muscovite, beryl, and fluorite, a graph of the dependence of ARH on ARL has been constructed (Figure 2).
Figure 2.
Dual-energy representation for the monoenergetic case. Low energy 55 keV, high energy 120 keV.
In this model, the low-energy radiation is set at 55 keV, while the high-energy radiation is set at 120 keV. Thus, the influence of the object’s thickness in this case will be linear. The dual-energy representation for the monoenergetic case allows for the discrimination of substances based on effective atomic numbers; in this case, each substance has a specific tangent of the slope of the line on the graph or a constant k. However, this is an idealized scenario; in practice, we do not operate with monoenergetic sources, but rather with a bremsstrahlung spectrum.
2.2.2. Polyenergetic Case: Bremsstrahlung Spectrum
When considering the two-energy method, which uses discrete low and high energies, it simplifies the understanding of the process of X-ray radiation absorption. The relationship between ARH and ARL, presented in Figure 2, appears strictly linear, with an increase in the object’s thickness proportionally affecting absorption. In this consideration, each substance with a specific effective atomic number is simply defined by the slope angle.
In practice, however, polychromatic radiation is absorbed non-uniformly as it passes through an object of variable thickness. This beam hardening effect and its impact on dual-energy signal calibration have been comprehensively detailed in the foundational works by Brooks and Di Chiro [35] and Lehmann et al. [36]. Moreover, the efficiency of detecting radiation at a given thickness heavily depends on the material and thickness of the scintillator. Therefore, it is necessary to take into account the spectrum of radiation from the source, changes in the object’s thickness, the dependence of radiation absorption by the scintillator, and X-ray absorbing filters. Essentially, we have several functions that depend on the energy of the radiation.
It is evident that the graph presented for monoenergies in Figure 2 will have significant differences for a bremsstrahlung spectrum and detection with a dual-energy system. For polyenergetic radiation, the attenuation model in Equation (1) is replaced by a summation over discrete energy intervals (4):
where Ii represents the intensity within a specific energy bin, defined as (5):
In the expression (5), I0_i is the intensity for a specific energy of radiation; in this case, it is the intensity over a certain calculation interval, which is equal to 0.5 keV in our case. μi is the attenuation coefficient of radiation for the studied substance at the calculated energy interval, and i is the number of the energy interval, the number of which depends on the maximum energy of radiation, which in turn is determined by the voltage on the X-ray tube.
In this study, a dual-layer detector configuration was modeled, consisting of a 0.2 mm GOS scintillator (low-energy layer), a 0.6 mm copper filter, and a 4 mm CsI scintillator (high-energy layer). The resulting dual-energy dependence for this case is shown in Figure 3.
Figure 3.
Dual-energy response of muscovite, beryl, and fluorite using a dual-layer detector with a 180 kV bremsstrahlung X-ray spectrum.
In this case, approximating the dependencies as straight lines is incorrect, and determining the effective atomic number (Zeff) as the tangent of the slope angle is also not feasible. The approximation of the curves in Figure 3 as straight lines can be applied only as a rough estimate—for instance, for separating beryl from fluorite, but not for separating beryl from muscovite.
To address this problem, we apply a second-order polynomial approximation method. Unlike linear approximation, this approach accounts for the non-linear relationship between material thickness and the dual-energy signal caused by the X-ray beam hardening effect.
2.3. Experimental Samples
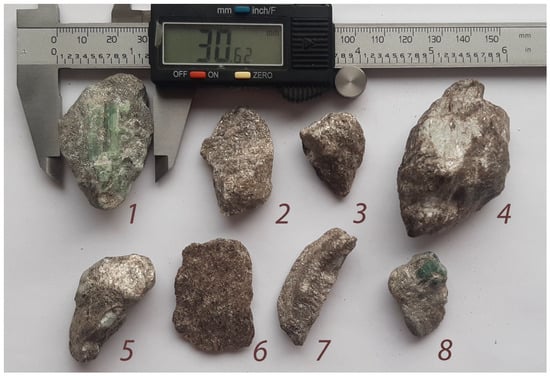
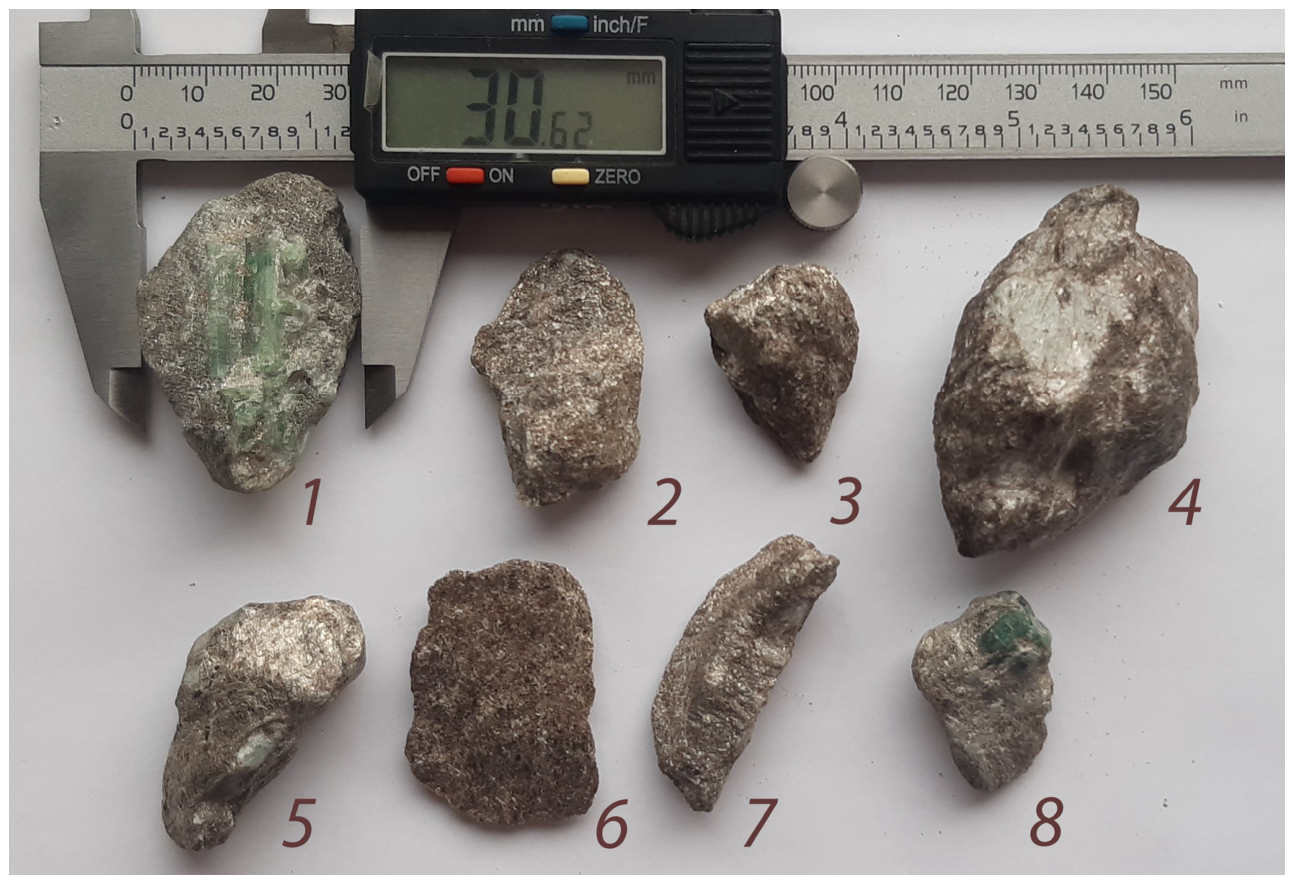
To verify the theoretical model, several natural mineral samples were selected (Figure 4). The samples consist of beryl and muscovite intergrowths, with linear dimensions reaching up to 60 mm in certain directions. In most cases, the effective thickness of the samples in the transmission direction is up to 30 mm. This sample thickness is physically justified for the use of an X-ray source with a voltage of 160 kV.
Figure 4.
Photographs of the mineral samples used in the experiments. Beryl crystals with a greenish tint are visible on samples 1, 4, 5, and 8; sample 6 is muscovite without inclusions; in the remaining samples, the beryl is hidden.
2.4. X-Ray Instrumentation: DE-XRT Prototype and CT Imaging
To obtain dual-energy images, an experimental test bench simulating conveyor belt separation conditions was used. The samples were fixed on a moving belt at a speed of 0.5 m/s. An X-ray tube with a voltage of 160 kV and a current of 1 mA was used as the radiation source.
The detection system consisted of a linear dual-layer “sandwich” assembly. The upper scintillator layer, based on GOS (Gd2O2S), primarily records the low-energy part of the spectrum. This is followed by a 0.6 mm thick copper filter, behind which is a second layer based on CsI (cesium iodide). The greater thickness and high atomic number of CsI ensure efficient detection of the high-energy part of the radiation. To minimize the influence of scattered radiation, slit collimators (diaphragms) were installed on both the source and the detector. The pixel size in the resulting images is 1.2 mm. Despite the relatively low spatial resolution, this pixel size allows for the necessary signal-to-noise ratio (SNR) for reliable material identification.
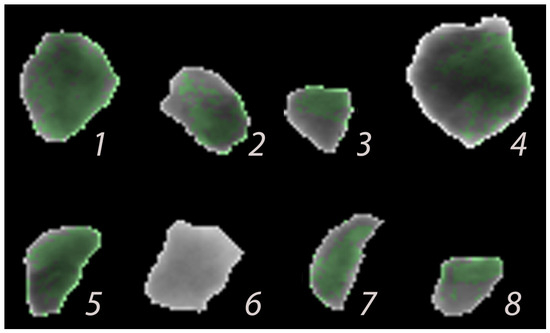
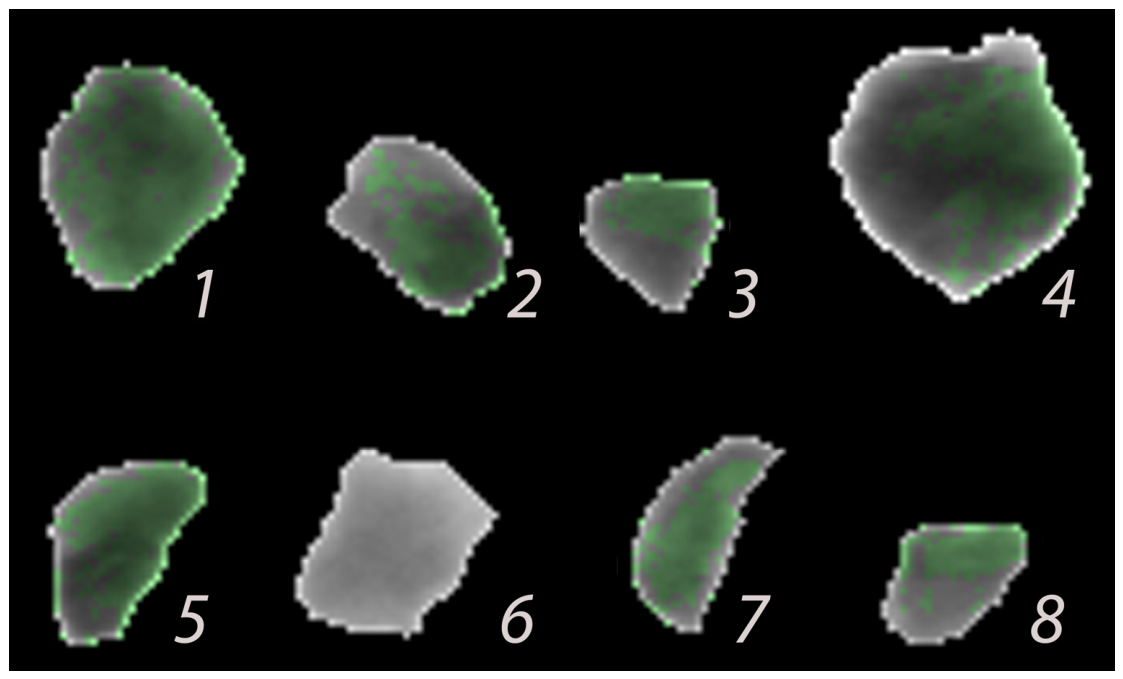
As a result of the dual-energy processing of the X-ray images, color mapping is performed: areas identified as beryl are colored green. To verify the accuracy of the mineral inclusion localization on the planar (single-projection) images, computed tomography (CT) of the studied samples was conducted.
We used a CT setup based on the VIVIX-V 2323D flat-panel detector (Vieworks Co., Ltd., Anyang, Republic of Korea) with a physical pixel pitch of 179 µm. In the scanning geometry, the samples were positioned at the maximum possible distance from the source, with a Source-to-Detector Distance (SDD) of 1500 mm, and placed directly against the detector’s input window, operating at a geometric magnification of M ≈ 1.0. The tomographic acquisition was performed over 180° with a rotation step of 0.9° (200 projections). At this step, the Crowther angular blurring near the sample core (calculated for a mean inclusion zone radius of R = 10 mm) is mathematically evaluated as ∆x_angular = π · 10 mm/200 ≈ 157 µm, which perfectly matches the hardware pixel pitch, ensuring a non-interpolated spatial resolution of 179 µm.
Given the large SDD and small sample dimensions, the maximum geometric projection deviation at the absolute outer boundaries was mathematically evaluated to be ∆z ≈ 0.30 mm. More importantly, the differential scaling error for local inclusion size measurements (D_beryl ≈ 2–3 mm) was below 0.06 mm. This error is completely absorbed within the 179 µm CT spatial resolution and is substantially lower than the 1.2 mm pixel pitch of the main dual-energy X-ray (DE-XRT) detector, rigorously justifying the parallel-beam reconstruction model.
To suppress edge artifacts, reduce scattered radiation, and eliminate the ‘burn-out’ effect at the air-mineral interface, an original technique was applied: the samples were placed in a cylindrical container filled with fine-grained muscovite sand. This ensured uniform background absorption, regularized the isotropic scatter component inherent to flat-panel detectors, and prevented sharp intensity drops at the edges of the objects under study. Although scattered radiation remains a critical limitation for high-throughput flat-panel DE-XRT sorting (as discussed in the Introduction), this homogenized scanning environment, combined with standard background normalization, effectively neutralized scatter-induced geometric distortions in the static CT setup. As can be observed further, the edge effects were physically shifted out to the outer circumference of the artificial container. Consequently, these parasitic effects were successfully suppressed.
The resulting three-dimensional reconstructions allowed for a comparison between the spatial distribution of beryl within the rock volume and the results of the two-dimensional detection.
3. Experiment
3.1. Dual-Energy Data Distribution
To construct the distribution of experimental points in ARH and ARL coordinates (log-attenuation values for the low- and high-energy channels), dual-energy data were obtained for beryl and muscovite samples. To establish the reference dependence for the target substance (beryl), measurements were performed on an array of pure fraction fragments, which were virtually free of host rock. The dependence for beryl samples hosted in muscovite was obtained in a similar manner.
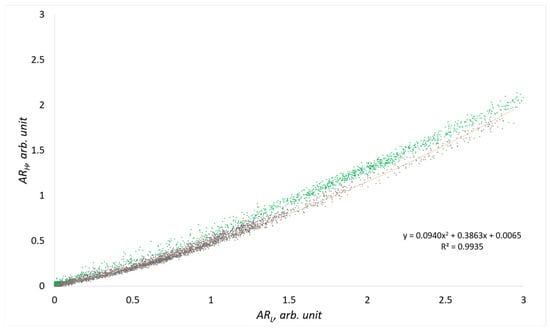
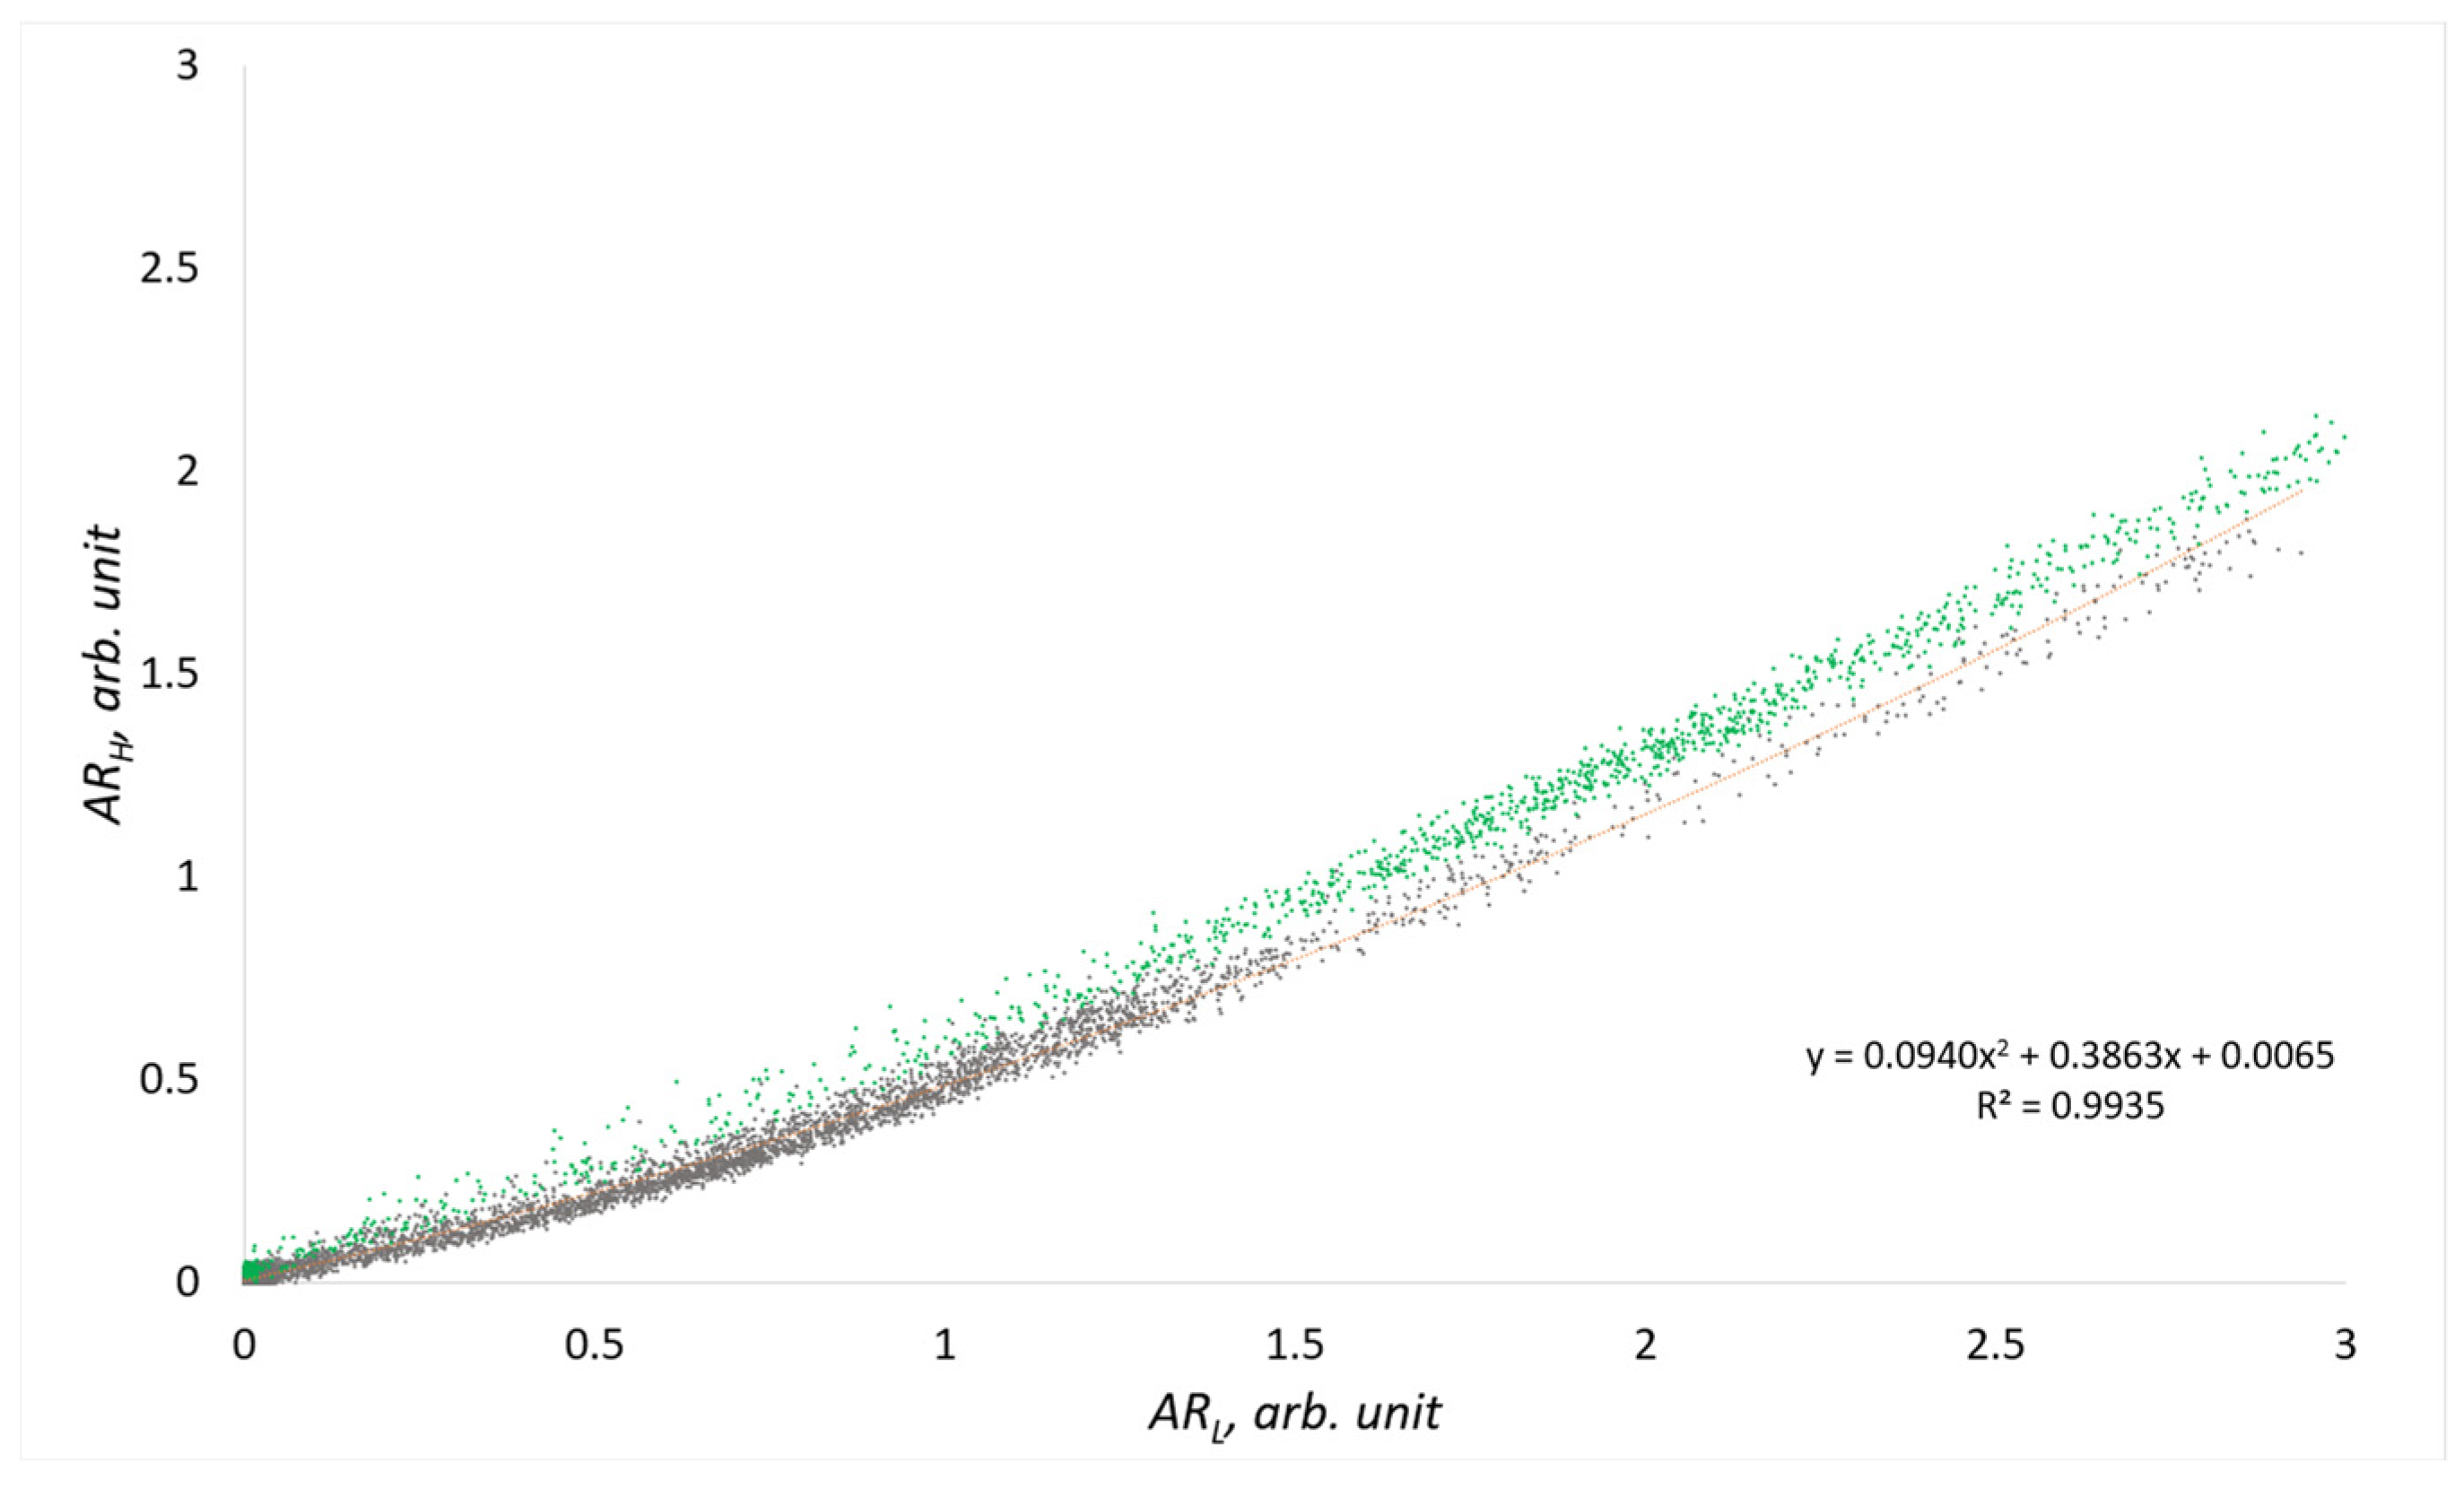
Figure 5 presents these dependencies; the data points corresponding to pure beryl are marked in green. The resulting experimental curves are generally in good agreement with the theoretical dependencies presented in Section 2.
Figure 5.
DE-XRT results for pure beryl (green) and beryl–muscovite intergrowths (gray). The polynomial curve (orange) defines the detection threshold for material identification.
Based on these experimental data, it is necessary to obtain a dependence that determines the threshold values for classifying the studied rock as a concentrate, waste rock, or material for reprocessing. Although the curve could be configured strictly along the lower boundary of the pure material, this would cause smaller beryl inclusions to be misclassified as waste. Visually, it is evident that the dependence is non-linear; therefore, the approximation must be either piecewise-linear or of another non-linear type. However, using a piecewise-linear approximation requires complex stitching at the joint points, which unnecessarily complicates the problem. To avoid this, a second-order approximating polynomial was constructed using the ordinary least squares (OLS) method based on the data from the intergrowth samples:
where the baseline coefficients are a0 = 0.0940, a1 = 0.3863, and a2 = 0.0065. The goodness-of-fit is confirmed by a high coefficient of determination (R2 = 0.9935). Using a second-order polynomial allows for the mathematical compensation of the non-linearity caused by the beam hardening effect as radiation passes through significant rock thicknesses.
In this model, the polynomial coefficients carry a clear physical meaning, accounting for the curvature (compensation for absorption non-linearity), slope, and offset of the decision boundary in the dual-energy coordinate space. The baseline OLS curve acts as a reference. In practice, to define the actual decision boundary (the orange curve in Figure 5) and perform colorization/calibration, a parallel downward shift was applied by decreasing the offset coefficient a2. The selection of these parameters determines the sensitivity of the method and enables the classification of an object as either a beryl-bearing concentrate or waste rock, based on the ratio of the inclusion volume to the thickness of the host muscovite.
Analysis of these data allowed for the assessment of the overlap between the absorption regions of muscovite and beryl, as well as the evaluation of the noise influence from the measurement system, which includes the 160 kV X-ray tube, the dual-layer detector, and the sample transport system moving at a speed of 0.5 m/s.
3.2. CT Reconstruction and Contrast Verification
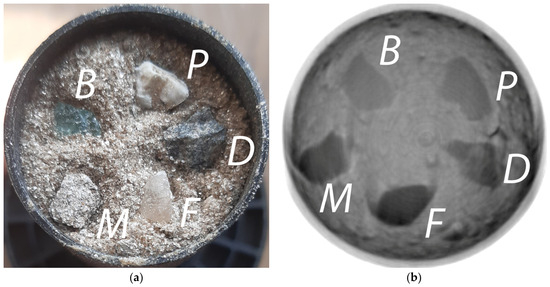
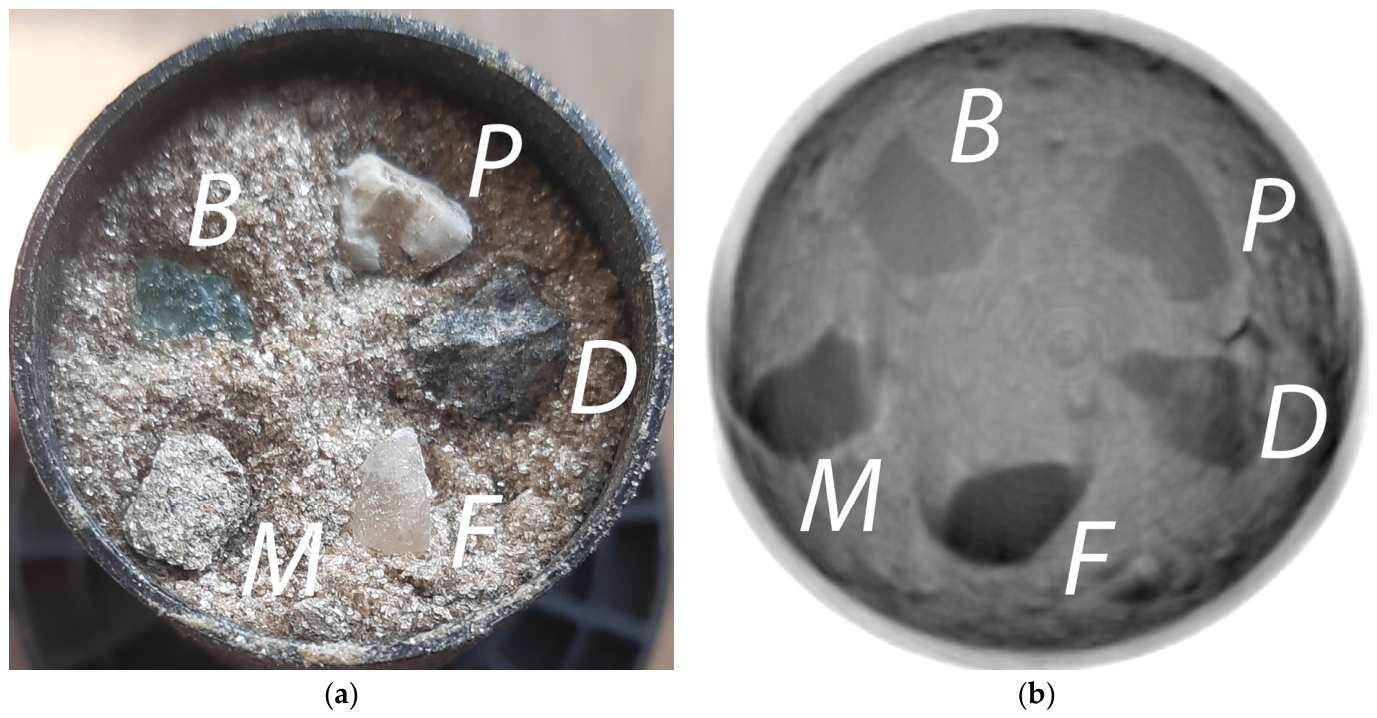
CT reconstruction was performed for the experimental samples. As previously noted, beryl and muscovite possess similar attenuation characteristics, which makes their differentiation on planar X-ray images difficult. For precise verification of the contrast difference on CT slices, preliminary scanning of individual reference particles of muscovite, beryl, plagioclase, fluorite, and diorite was conducted (Figure 6a). Figure 6b presents an example of a CT slice containing all the listed minerals. As described above, the particles were placed in a container and covered with crushed muscovite to reduce the influence of edge effects during CT scanning.
Figure 6.
Reference mineral samples: (a) optical photograph of the particles within the container; (b) CT cross-section. B—beryl; P—plagioclase; D—diorite; F—fluorite; M—muscovite. The internal diameter of the cylindrical container is 30 mm.
It should be noted that the visible crescent-shaped (arc-like) artifacts in the CT cross-sections of the model assemblies are primarily a consequence of their vertical offset from the central reconstruction plane. While the primary geological samples were positioned along the central axis to ensure optimal parallel-beam conditions, the reference elements shown in Figure 6 were vertically offset by approximately 50 mm, as the experimental sample occupied the space near the central slice. Even with a source-to-detector distance of 1500 mm, such an axial displacement introduces a noticeable cone-beam tilt angle. As X-rays pass through the planar boundaries of these reference specimens, this projection tilt causes axial blurring and a geometric mismatch under the parallel-beam approximation, manifesting as crescent artifacts. However, this phenomenon is strictly confined to these peripheral test configurations and has a minimal effect on the final measurements, as the investigated beryl-muscovite samples were always positioned as close as possible to the central plane of the beam.
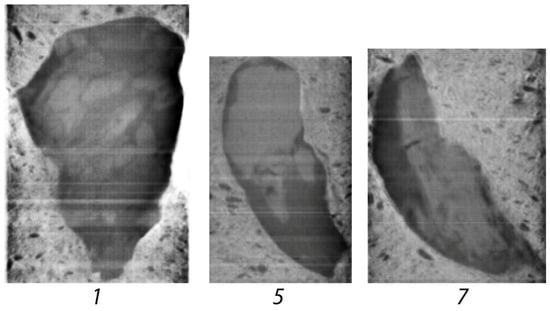
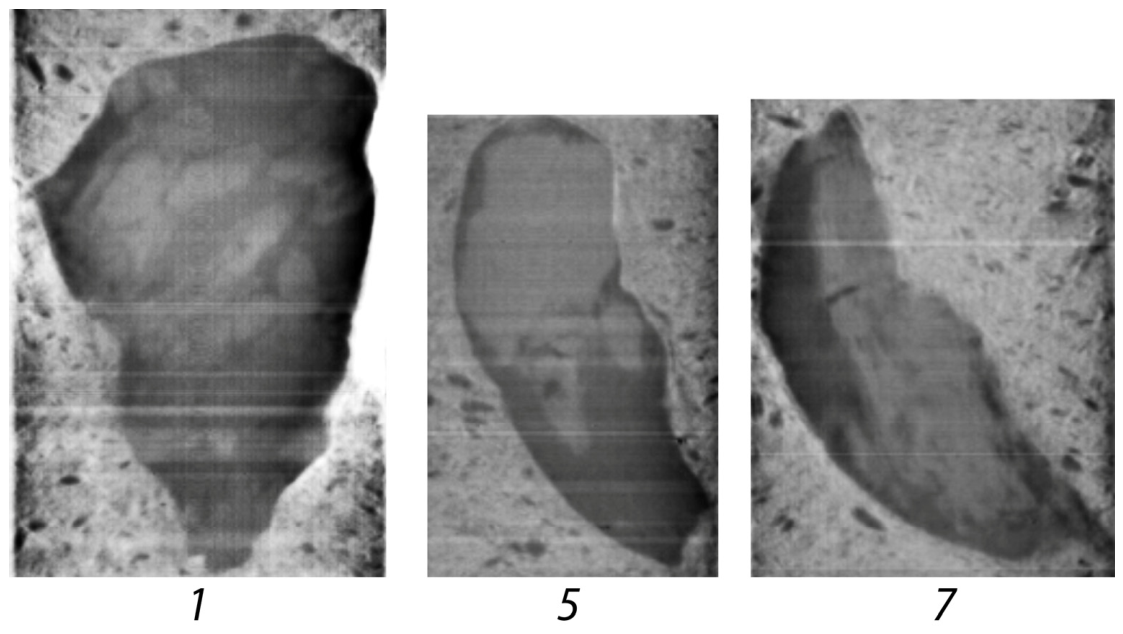
The obtained data confirm the presence of a stable, albeit slight, contrast between beryl and muscovite under CT scanning conditions. Figure 7 shows characteristic slices of several studied samples (“stones”), clearly visualizing their internal structure and inclusion boundaries. The slices are oriented perpendicular to the X-ray projection plane used in the DE-XRT experiments. The samples are embedded in a muscovite-rich sand matrix; high-density bright inclusions represent beryl grains.
Figure 7.
Selected CT cross-sections for samples 1, 5, and 7. Beryl inclusions within the muscovite are visible, with the background filled with muscovite sand.
These results provided the basis for the subsequent validation of the DE-XRT planar imaging data against the 3D distribution of beryl inclusions. For the validation process, CT cross-sections co-planar with the X-ray beam path were utilized. This approach allowed for an accurate determination of the mineral inclusion thickness along the line of sight and the establishment of the detection threshold.
4. Results and Discussion
Based on the developed polynomial model, software processing and pseudo-colorization of the obtained radiographs were performed. For each pixel of the image, the absorption values in the low- and high-energy channels (ARL and ARH) were calculated. If the corresponding point on the coordinate plane was located above the adjusted polynomial decision curve (see Figure 5), the pixel was classified as “beryl” and colored green. Figure 8 presents the processing results for the experimental samples. Visual analysis confirms that the method allows for the identification of not only exposed surface crystals but also inclusions completely hidden within the host rock.
Figure 8.
Dual-energy pseudocolorization of the studied samples.
To quantitatively assess the detection reliability, data verification was performed using CT. By aligning the projection images with the three-dimensional CT reconstructions, the exact radiation transmission planes were determined. This allowed for a comparison between the dual-energy processing results and the actual internal structure of the samples.
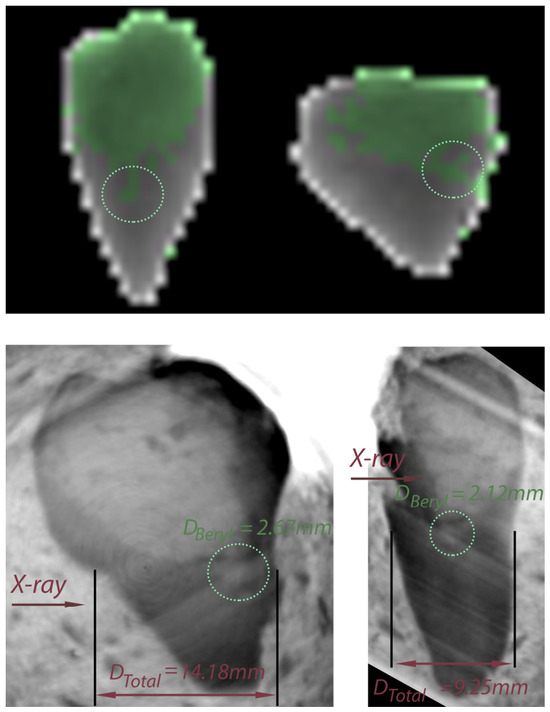
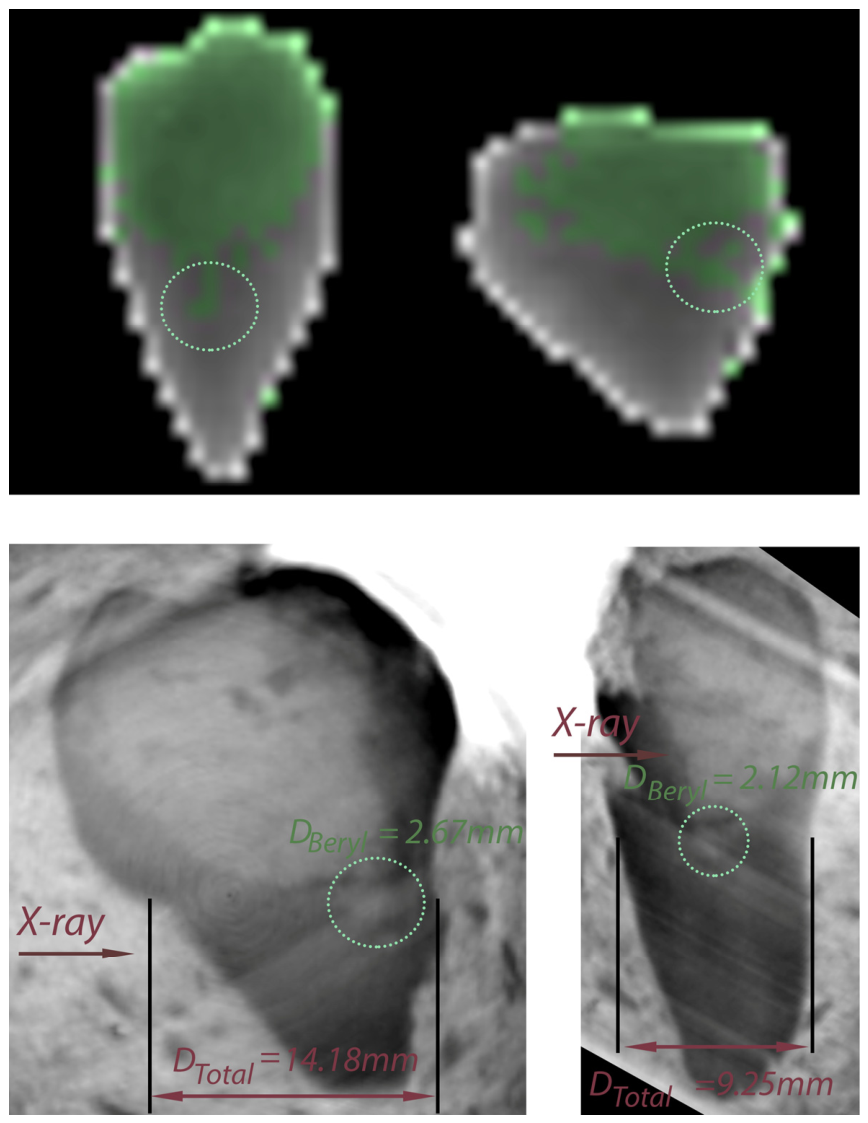
Figure 9 shows the colorization of sample 3 in two orthogonal planes. The difference in height is due to the measurement system and the various orientations; in one plane, the system produces projection magnification caused by the X-ray beam conicity. While the large beryl fragment is identified effectively, a finer structure is also visible (highlighted by the dashed circle). Below the dual-energy projections, the corresponding CT slices are shown, aligned with the X-ray transmission paths. To evaluate the identification of the small beryl inclusion, the total rock thickness for this area was measured. For the left image, the total thickness is Dtotal = 14.18 mm with a beryl size of Dberyl = 2.67 mm; on the right, for the other projection, the X-ray path is Dtotal = 9.25 mm with Dberyl = 2.12 mm. Accordingly, these points are marked as positive identifications.
Figure 9.
Comparison of dual-energy pseudocolorization and CT cross-sections for sample No. 3 in two orthogonal projections. The dashed circle highlights a small beryl inclusion. The reported nominal dimensions require a physical system uncertainty of ±0.09 mm to be taken into account.
The dimensional measurements were conducted using the 3D Slicer (version 5.6.1) software. It should be noted that these hundredths of a millimeter represent nominal values generated by sub-voxel interpolation within the 3D Slicer environment. Factoring in the hardware-limited spatial resolution of 179 µm, the physical uncertainty of the boundary detection is approximately half a voxel ±0.09 mm. Therefore, these measurements realistically correspond to effective dimensions rounded to the nearest tenth of a millimeter (14.2 mm and 2.7 mm for the first case; 9.3 mm and 2.1 mm for the second case).
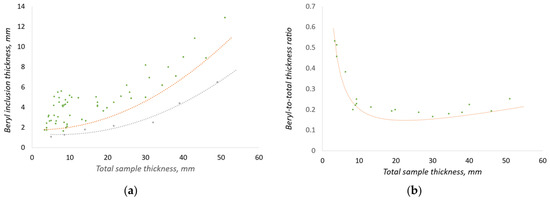
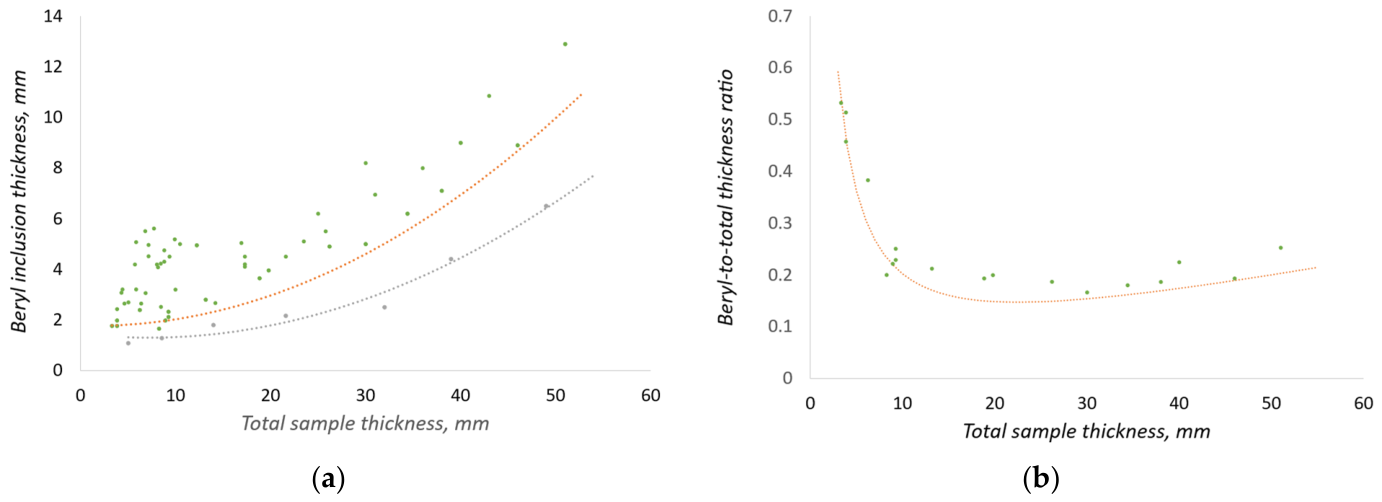
Based on the analysis of a series of samples, the dependence presented in Figure 10a was constructed. The graph plots points corresponding to various detection scenarios: True Positives (highlighted in green) and missed targets (False Negatives, highlighted in gray) where the beryl inclusion was not identified by the algorithm.
Figure 10.
Detection performance of the DE-XRT method for beryl inclusions in muscovite rock: (a) Distribution of identification results showing True Positive (green) and False Negative (gray) events; (b) Relative detection threshold (ratio of minimum beryl thickness to total sample thickness) as a function of total thickness. The curve represents the boundary of reliable identification.
Special attention was paid to the study of boundary conditions, as identification is performed without error for large inclusions. An intermediate region exists between the zones of confident detection (the area above the orange curve) and the absence of signal (the area below the gray curve). In this transition zone, the probability of correct identification decreases, and both missed targets and False Positives may occur due to the influence of noise and density fluctuations within the host rock.
Figure 10b presents the dependence of the relative detection threshold—the ratio of the minimum beryl inclusion thickness to the total sample thickness—on the total thickness itself. The curve drawn on the graph serves as the confident identification boundary: all points lying above this line correspond to cases of error-free beryl detection. The area below the curve is a marginal zone where, due to physical limitations of the method, missed targets or false alarms occur.
Analysis of the dependence shows that the system demonstrates optimal sensitivity at object thicknesses of approximately 20–30 mm, where particles constituting about 15% of the total rock thickness are confidently detected. In this range, the influence of edge effects is minimal. However, as the thickness increases beyond 40 mm, the detection threshold begins to rise: for a 50 mm thick sample, stable identification is possible only for inclusions larger than 10 mm. This is due to the near-total absorption of low-energy radiation in massive objects, which leads to the transmitted beam intensity falling below 10% of the primary level and a sharp reduction in the signal-to-noise ratio (SNR).
Classification errors are also characteristic of thin structures (less than 3 mm) and sample edges. The use of a detector with a 1.2 mm pixel size results in the partial volume effect, where a single pixel captures both the mineral edge and the direct beam. Furthermore, in the low-thickness range, the absorption of low-energy photons is extremely sensitive to geometry: thickness fluctuations of a fraction of a millimeter cause sharp changes in the calculated data within dual-energy image processing algorithms, triggering false positives.
While this analysis explains the physical nature of the detection limits, a statistical limitation of this quantitative evaluation must be acknowledged. Although the dataset compiled in Figure 10b represents a dense distribution of dozens of localized pixel-level observations, these observations originate from a finite suite of eight independent physical specimens. Consequently, the established 15% thickness threshold should be interpreted as a preliminary quantitative estimate subject to potential pseudoreplication effects.
The proposed dual-energy method offers several significant advantages for mineral processing tasks. Unlike traditional X-ray luminescence separation, which is based on recording surface optical luminescence, DE-XRT allows for the identification of both exposed crystals and inclusions completely hidden within the host rock volume. This is critically important for preventing the destruction of valuable crystals during crushing stages.
The proposed model offers tuning flexibility: by varying the polynomial parameters (the curve in Figure 5), the separation threshold can be shifted. This allows for either maximizing the recovery of fine beryl fractions (at the cost of increased low-grade product yield) or increasing concentrate purity by minimizing the amount of waste rock sent to subsequent processing stages.
5. Conclusions
In this study, we address the challenge of identifying beryl inclusions within a muscovite host rock using dual-energy radiography. The research demonstrates that applying a second-order polynomial approximation effectively compensates for the beam hardening effect. This ensures reliable discrimination between the minerals despite the proximity of their effective atomic numbers (Zeff) and densities.
Based on CT verification, it was established that the method provides confident identification of inclusions exceeding 15% of the total sample thickness within the optimal range of 20–30 mm. As the rock thickness increases to 50 mm, the detection threshold naturally rises to 10 mm or more. This is due to the intense absorption of soft X-rays within the sample body, leading to a loss of intensity in the low-energy channel and a subsequent drop in the signal-to-noise ratio. While these findings establish a strong physical basis for industrial sorting, the 15% threshold should be considered a preliminary quantitative estimate given the finite set of independent rock specimens.
The proposed approach demonstrated high efficiency in detecting crystals hidden inside the rock, which is its key advantage over traditional X-ray luminescence separation methods. Future work will focus on confirming these limits on a larger and more geologically diverse collection of beryl-bearing masses, using neural networks for the automatic correction of edge effects, and the implementation of pixel clustering algorithms to improve the identification accuracy of objects with complex morphology in real-world ore masses.
Author Contributions
Conceptualization, A.K. and S.K.; methodology, A.K.; software, A.K.; validation, A.K., S.K. and M.P.; formal analysis, A.K.; investigation, A.K. and S.K.; resources, S.K.; data curation, A.K.; writing—original draft preparation, A.K.; writing—review and editing, A.K. and S.K.; visualization, A.K.; supervision, A.K. and S.K.; project administration, A.K. All authors have read and agreed to the published version of the manuscript.
Funding
This research received no external funding.
Data Availability Statement
All data used in this article are from experiments conducted by the author.
Conflicts of Interest
The authors declare no conflicts of interest.
Abbreviations
The following abbreviations are used in this manuscript:
| CT | Computed tomography |
| DE | Dual-Energy |
| DE-XRT | Dual-Energy X-ray Transmission |
| FPD | Flat panel detector |
| OLS | Ordinary Least Squares |
| SDD | Source-to-Detector Distance |
| XRT | X-ray Transmission |
References
- Hounsfield, G.N. Computerized transverse axial scanning (tomography): Part 1. Description of system. Br. J. Radiol. 1973, 46, 1016–1022. [Google Scholar] [CrossRef] [Scilit] [PubMed]
- Alvarez, R.E.; Macovski, A. Energy-selective reconstructions in X-ray computerized tomography. Phys. Med. Biol. 1976, 21, 733–744. [Google Scholar] [CrossRef] [Scilit]
- Di Chiro, G.; Brooks, R.A.; Kessler, R.M.; Johnston, G.S.; Jones, A.E.; Herdt, J.R.; Sheridan, W.T. Tissue signatures with dual-energy computed tomography. Radiology 1979, 131, 521–523. [Google Scholar] [CrossRef] [Scilit]
- Genant, H.K.; Boyd, D. Quantitative bone mineral analysis using dual energy computed tomography. Investig. Radiol. 1977, 12, 545–551. [Google Scholar] [CrossRef] [Scilit]
- Johnson, T.R. Dual-energy CT: General principles. Am. J. Roentgenol. 2012, 199, 3–8. [Google Scholar] [CrossRef] [Scilit]
- Forghani, R.; De Man, B.; Gupta, R. Dual energy CT: Physical principles, approaches to scanning, usage, and implementation: Part 1. Neuroimaging Clin. N. Am. 2017, 27, 371–384. [Google Scholar] [CrossRef] [Scilit] [PubMed]
- Forghani, R.; De Man, B.; Gupta, R. Dual energy CT: Physical principles, approaches to scanning, usage, and implementation: Part 2. Neuroimaging Clin. N. Am. 2017, 27, 385–400. [Google Scholar] [CrossRef] [Scilit]
- Schmidt, B.; Flohr, T. Principles and applications of dual source CT. Phys. Medica 2020, 79, 36–46. [Google Scholar] [CrossRef] [Scilit]
- Rebuffel, V.; Dinten, J.-M. Dual-energy X-ray imaging: Benefits and limits. Insight Non-Destr. Test. Cond. Monit. 2007, 49, 589–594. [Google Scholar] [CrossRef] [Scilit]
- Macdonald, R.D.R. Design and implementation of a dual-energy X-ray imaging system for organic material detection in an airport security application. In Proceedings of SPIE Machine Vision Applications in Industrial Inspection IX; SPIE: Bellingham, WA, USA, 2001; Volume 4301, pp. 31–41. [Google Scholar]
- Park, J.S.; Kim, J.K. Calculation of effective atomic number and normal density using a sourceweighting method in a dual energy X-ray inspection system. J. Korean Phys. Soc. 2011, 59, 2709–2713. [Google Scholar] [CrossRef] [Scilit]
- Yalçın, O. 3D effective atomic number estimation for X-ray security inspection systems. In Proceedings of SPIE Anomaly Detection and Imaging with X-Rays (ADIX) IX; SPIE: Bellingham, WA, USA, 2024; Volume 13043. [Google Scholar]
- Yalçın, O.; Reyhancan, İ.A. Detection of explosive materials in dual-energy X-Ray security systems. Nucl. Instrum. Methods Phys. Res. A 2022, 1040, 167265. [Google Scholar] [CrossRef] [Scilit]
- Ying, Z.; Naidu, R.; Crawford, C.R. Dual energy computed tomography for explosive detection. J. X-Ray Sci. Technol. 2006, 14, 235–256. [Google Scholar] [CrossRef] [Scilit]
- Bauer, C.; Wagner, R.; Orberger, B.; Firsching, M.; Ennen, A.; Pina, C.G.; Wagner, C.; Honarmand, M.; Nabatian, G.; Monsef, I. Potential of Dual and Multi Energy XRT and CT Analyses on Iron Formations. Sensors 2021, 21, 2455. [Google Scholar] [CrossRef] [Scilit]
- Zhang, Y.; Yoon, N.; Holuszko, M.E. Assessment of Sortability Using a Dual-Energy X-ray Transmission System for Studied Sulphide Ore. Minerals 2021, 11, 490. [Google Scholar] [CrossRef] [Scilit]
- Firsching, M.; Bauer, C.; Wagner, R.; Ennen, A.; Ahsan, A.; Kampmann, T.C.; Tiu, G.; Valencia, A.; Casali, A.; Atenas, M.G. REWO-SORT Sensor Fusion for Enhanced Ore Sorting: A Project Overview. In Proceedings of the Procemin-Geomet Conference 2019, Santiago de Chile, Chile, 20–22 November 2019. [Google Scholar]
- Komarskiy, A.; Korzhenevskiy, S.; Ponomarev, A.; Chepusov, A. Dual-Energy Processing of X-ray Images of Beryl in Muscovite Obtained Using Pulsed X-ray Sources. Sensors 2023, 23, 4393. [Google Scholar] [CrossRef] [Scilit]
- Firsching, M.; Nachtrab, F.; Muhlbauer, J.; Uhlmann, N. Detection of enclosed diamonds using dual energy X-ray imaging. In Proceedings of the 18th World Conference on Nondestructive Testing, Durban, South Africa, 16–20 April 2012. [Google Scholar]
- Lang, Z.; Alam, S.; Hunt, L.; Di Feo, A.; Robben, C.; Kinakin, Y.; Tjossem, R. Comparative Evaluation of X-Ray Transmission and X-Ray Luminescence Sorting Technologies for Fine Diamond Recover. Minerals 2025, 15, 773. [Google Scholar] [CrossRef] [Scilit]
- Ketelhodt, K.; Bergmann, C.L. Dual energy X-ray transmission sorting of coal. J. South. Afr. Inst. Min. Metall. 2010, 110, 371–378. [Google Scholar]
- Taguchi, K. Energy-sensitive photon counting detector-based X-ray computed tomography. Radiol. Phys. Technol. 2017, 10, 8–22. [Google Scholar] [CrossRef] [Scilit]
- Rosenfeld, A.; Alnaghy, S.; Petasecca, M.; Cutajar, D.; Lerch, M.; Pospisil, S.; Giacometti, V.; Schulte, R.; Rosso, V.; Würl, M.; et al. Medipix detectors in radiation therapy for advanced quality-assurance. Radiat. Meas. 2020, 130, 106211. [Google Scholar] [CrossRef] [Scilit]
- Li, B.; Yadava, G.; Hsieh, J. Quantification of head and body CTDI(VOL) of dual-energy X-ray CT with fast-kVp switching. Med. Phys. 2011, 38, 2595–2601. [Google Scholar] [CrossRef] [Scilit]
- Komarskiy, A.A.; Korzhenevskiy, S.R.; Ponomarev, A.V.; Chepusov, A.S.; Krinitzin, V.V.; Krasniy, O.D. Comparison of Methods for Modifying the Emission Spectrum of a Pulsed X-ray Source to Determine the Most Effective Dual-Energy Image Processing. Russ. J. Nondestruct. Test. 2024, 60, 1040–1050. [Google Scholar] [CrossRef] [Scilit]
- Udod, V.A.; Osipov, S.P.; Nazarenko, S.Y. Algorithm for Optimizing the Parameters of Sandwich X-ray Detectors. X-Ray Methods 2023, 59, 359–373. [Google Scholar] [CrossRef] [Scilit]
- Osipov, S.P.; Udod, V.A.; Wang, Y. Identification of materials in X-Ray inspections of objects by the dualenergy method. Russ. J. Nondestruct. Test. 2017, 53, 568–587. [Google Scholar] [CrossRef] [Scilit]
- Bauer, C.; Wagner, R.; Leisner, J. The Detection of Foreign Items in Laundry Industry by Dual-Energy X-ray Transmission—Advantages and Limits. Sensors 2022, 22, 8248. [Google Scholar] [CrossRef] [Scilit]
- Kim, D.S.; Lee, D. Two-Step Image Registration for Dual-Layer Flat-Panel Detectors. Diagnostics 2024, 14, 2742. [Google Scholar] [CrossRef] [Scilit]
- Chang, C.H.; Ni, Y.C.; Tseng, S.P. Calculation of effective atomic numbers using a rational polynomial approximation method with a dual-energy X-ray imaging system. J. X-Ray Sci. Technol. 2021, 29, 317–330. [Google Scholar] [CrossRef] [Scilit]
- Komarskiy, A.A.; Korzhenevskiy, S.R.; Komarov, N.A. Detection of plastic articles behind metal layers of variable thickness on dual-energy X-ray images using artificial neural networks. In AIP Conference Proceedings; AIP Publishing: Melville, NY, USA, 2023; Volume 2726. [Google Scholar]
- Fahad, M.; Zhang, T.; Ullah, S.; Albanyan, A.; Siddiqui, F.; Iqbal, Y.; Zhao, X.; Geng, Y. Optimizing dual energy X-ray image enhancement using a novel hybrid fusion method. J. X-Ray Sci. Technol. 2024, 32, 1553–1570. [Google Scholar]
- International Mineralogical Association. Available online: https://cnmnc.units.it/files/editor/master_list/IMA_Master_List_(2025-11).pdf (accessed on 5 February 2026).
- Poludniowski, G.; Omar, A.; Bujila, R.; Andreo, P. Technical Note: SpekPy v2.0—A software toolkit for modeling X-ray tube spectra. Med. Phys. 2021, 48, 3630–3637. [Google Scholar] [CrossRef] [Scilit]
- Brooks, R.A.; Di Chiro, G. Beam hardening in X-ray reconstructive tomography. Phys. Med. Biol. 1976, 21, 390–398. [Google Scholar] [CrossRef] [Scilit] [PubMed]
- Lehmann, L.A.; Alvarez, R.E.; Macovski, A.; Brody, W.R.; Pelc, N.J.; Riederer, S.J.; Hall, A.L. Generalized image combinations in dual KVP digital radiography. Med. Phys. 1981, 8, 659–667. [Google Scholar] [CrossRef] [Scilit] [PubMed]
Disclaimer/Publisher’s Note: The statements, opinions and data contained in all publications are solely those of the individual author(s) and contributor(s) and not of MDPI and/or the editor(s). MDPI and/or the editor(s) disclaim responsibility for any injury to people or property resulting from any ideas, methods, instructions or products referred to in the content. |
© 2026 by the authors. Licensee MDPI, Basel, Switzerland. This article is an open access article distributed under the terms and conditions of the Creative Commons Attribution (CC BY) license.