


Abstract
Persistent uncertainty in translating low-field nuclear magnetic resonance (NMR) T2 relaxation spectra into geometrically meaningful pore–throat metrics has long hindered the quantitative characterization of tight reservoirs. To address this issue, this study develops an enhanced conversion framework that incorporates scale-dependent pore geometry, enabling more realistic estimation of pore–throat radius distributions. Core samples were collected from the first member of the Shanxi Formation and the eighth member of the Shihezi Formation in the Ordos Basin. A comprehensive experimental dataset was established, including porosity and permeability measurements, X-ray diffraction (XRD) mineral analysis, NMR experiments, high-pressure mercury intrusion (HPMI), and constant-rate mercury injection (CRMI). The results demonstrate that total clay content exhibits weak correlations with pore size and porosity. In contrast, the occurrence and morphology of specific clay minerals exert significant control on pore connectivity and flow behavior. In particular, fibrous illite increases pore–throat complexity, while early chlorite coatings help preserve primary intergranular pores. A single geometric model cannot fully represent the complex pore–throat system in tight sandstones. For pores, a spherical geometry is most appropriate and indeed necessary. Smaller throats connecting these pores often exhibit geometries more consistent with cylindrical shapes. Within the coarse pore size range, large pores dominate the reservoir space and generally exhibit geometries that better conform to a spherical shape. And larger pores dominate the volumetric contribution in the coarse pore-size range. These observations suggest that a scale-dependent composite model could further improve the accuracy of NMR-based pore-size estimations. Therefore, the spherical-pore model provides a physically meaningful framework for characterizing pore structures in tight reservoirs. At the same time, incorporating scale-dependent considerations offers a promising avenue for future methodological development.
1. Introduction
Escalating worldwide energy consumption has intensified research efforts focused on unconventional hydrocarbon systems, especially shale and tight oil–gas accumulations [1,2]. In contrast to classical reservoirs, tight formations are governed by pore systems whose hydraulic behavior is inherently scale-sensitive, giving rise to pronounced departures in porosity, permeability, and pressure regimes [3,4]. Their pore–throat networks are characterized by drastically reduced radii and limited interconnection, conditions that impose substantial resistance to fluid migration [5,6]. As a consequence, the efficiency of hydrocarbon recovery is strongly contingent upon the microstructural attributes of the pore network. A rigorous appraisal of how pore structure constrains fluid mobility is therefore indispensable for optimizing development strategies in tight reservoirs.
Numerous investigations have explored the quantification of pore–throat radii in tight reservoirs through the joint application of nuclear magnetic resonance (NMR) measurements and mercury intrusion porosimetry (MIP) [7,8]. This preference stems from the capacity of both the NMR T2 relaxation spectrum and MIP-derived intrusion curves to encode, albeit indirectly, key attributes of pore–throat structure [9]. By integrating these datasets through difference analysis and least-squares optimization, the T2 distribution can be transformed into a quantitative pore–throat radius distribution. One widely adopted framework for this transformation is the conventional conversion approach proposed by Dunn et al. [10,11]:
where C [ms/μm] is the conversion coefficient and rt [μm] is the pore throat radius.
Nevertheless, the intricate and heterogeneous pore–throat structure typical of tight sandstones undermines the assumption of simple proportionality between the transverse relaxation time (T2) and the throat radius (rt) embedded in the conventional formulation [12]. As a result, the predicted T2–rt correspondence often deviates from linear behavior. To accommodate this structural complexity, several authors have introduced empirically calibrated relationships that relax the geometric constraints of the conventional model [13]:
where n is a constant.
Empirical correlations, however, lack a rigorous physical foundation, as they are not derived from an explicit representation of pore–throat geometry. In essence, such formulations ignore the underlying structural model that governs fluid–solid interactions. For instance, within a cylindrical pore framework, the conventional transformation embodied in Equation (1) is mathematically valid only when the geometric exponent n equals unity, and deviation from this condition precludes a formal derivation. This inconsistency highlights the theoretical fragility of purely empirical approaches when applied to complex pore systems.
Building on these considerations, this study proposes an alternative strategy to infer pore–throat radii from NMR T2 relaxation spectra. The proposed formulation is based on a spherical pore-geometry assumption, from which an explicit analytical expression is established to characterize the correlation between NMR T2 relaxation times and the equivalent radius of a spherical cavity. When employed in conjunction with the cylindrical pore model of Huang et al. [14], the complementary use of these two geometric representations is anticipated to refine the depiction of flow-relevant pore structures and to furnish a more robust basis for evaluating and exploiting unconventional hydrocarbon reservoirs.
2. Samples and Experiments
2.1. Geological Setting and Core Material
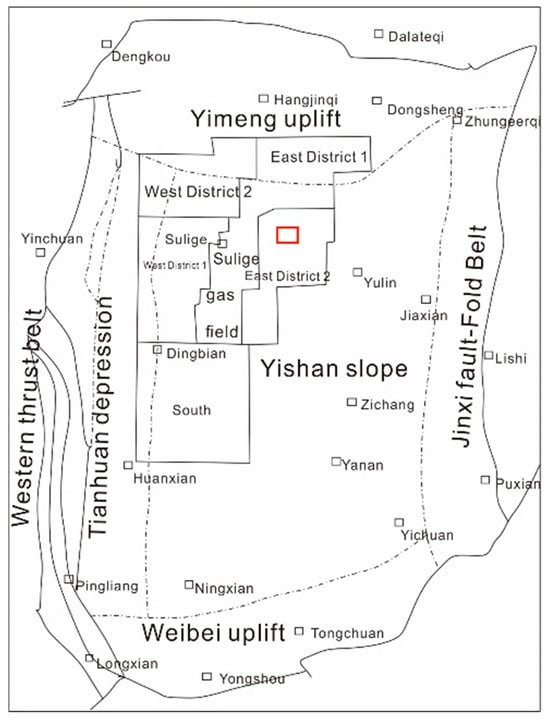
Cores examined in this work were retrieved from the Sulige Gas Field within the Ordos Basin, situated across the northern Yishan Slope and the eastern Wushenqi region (the red area in Figure 1). The basin has undergone multi-stage tectonic–sedimentary evolution, featured by intense subsidence, differential structural migration, prominent stratigraphic flexure, and long-term depositional continuity across geological periods [15]. The investigated intervals correspond to the first member of the Upper Permian Shanxi Formation and the eighth member of the Middle Permian Shihezi Formation. A total of seven core plugs were selected from depths of 3047.58–3132.53 m. After establishing the principal geological and petrophysical descriptors of these samples, low-field NMR measurements were used to construct a tight-reservoir pore–throat size distribution model under a spherical-geometry premise.
Figure 1.
Location map of the study area. Reproduced with permission from Hexin Huang et al., Marine and Petroleum Geology; published by Elsevier, 2020 [16].
2.2. Experimental Methods and Procedures
2.2.1. Petrophysical Measurements
Sample porosity was measured using a KXD-III helium porosimeter (Hua’an Technology, Nantong, China). During testing, equilibrium pressures were set to 4 and 8 MPa, and pressure readings were logged at 1 s intervals. Permeability was measured using a CP-200 nitrogen pulse permeameter (Yongruida Technology, Beijing, China), which applies the pressure-pulse decay method, and the instrument recorded the transient response at 30 s intervals.
2.2.2. X-Ray Diffraction (XRD)
Each core sample was first crushed into ~1 cm fragments and then milled in a grinding vessel for 4–6 min, yielding a powder in which more than 65% of particles were finer than 100 μm. The prepared powders were analyzed on a rotating sample stage (1 rpm). The divergence and anti-scatter slit angles were set to 0.5° and 1°, respectively. Meanwhile, the X-ray tube was operated at 45 kV and 40 mA. Mineral identification and quantification were performed using a consistent reference phase for each mineral across all measurements to ensure inter-sample comparability.
2.2.3. MIP
All samples were prepared in parallel, and one group was selected for high-pressure mercury injection testing. Mercury intrusion analyses were conducted on all seven samples using an AutoPore IV 9500 porosimeter (Micromeritics, Norcross, GA, USA). An interfacial tension of ~480 × 10−3 N/m and a mercury contact angle of 140° were adopted for the calculations. The maximum applied intrusion pressure was 200 MPa, corresponding to an inferred pore throat radius of approximately 0.004 μm [17].
2.2.4. Constant-Rate Mercury Injection (CRMI)
Take another set of parallel samples and complete the constant-rate mercury pressure experiment. Constant-rate mercury injection tests were carried out using an ASPE 730 apparatus (Coretest, Dover, DE, USA), with a test pressure range set to 0.09–6.715 MPa. A mercury contact angle of 140° and a surface tension of 48.5 mN/m were specified in the instrument settings. Samples were prepared as elongated cylindrical plugs with a diameter of 1 cm. Before conducting the tests, each plug was vacuum-dried at 120 °C for at least 24 h to remove pore water, after which the dry mass was recorded. The sample was then submerged in mercury, and intrusion proceeded at a constant rate of 0.00005 mL/min. The test was terminated once the intrusion pressure reached 6.715 MPa.
2.2.5. NMR
Low-field NMR measurements were performed on a RecCore2500 system (Suzhou Niumag Analytical Instrument Co., Ltd., Suzhou, China) operating at 2.38 MHz. The acquisition protocol employed 2048 echoes, 128 scans, a 5000 ms recycle time, and an echo spacing of 0.6 ms, with the receiver gain fixed at 50. Prior to saturation, all plugs were vacuum-dehydrated at elevated temperature and subsequently oven-dried at 120 °C for a minimum of 24 h, after which the dry mass was determined. The samples were then saturated with synthetic formation brine (total salinity: 25,000 mg/L) under 2060–2070 psi for at least 24 h. During the surface-drying step, the samples were handled with the aid of slightly moistened filter paper to minimize experimental error.
Within the NMR framework for single-phase fluid saturation in porous media, the transverse relaxation rate (1/T2) is typically expressed as the sum of three contributions: bulk relaxation, surface relaxation, and diffusion-related relaxation under internal field gradients [16,18,19].
where 1/T2s = ρ2S/V, 1/T2d = D (GTEγ)2/12 [18,20], T2b is the relaxation time of the fluid bulk, T2s is the relaxation time of the particle surface, T2d is the relaxation time of molecular diffusion, ρ2 is the relaxation rate [9,21], and S/V is the specific area of porosity.
Therefore, 1/T2 can be expressed as:
NMR methods have been extensively investigated and implemented for the characterization of clastic lithologies [10,22,23]. In NMR experiments on tight sandstone, the magnetic susceptibility of the rock matrix is far higher than that of pore fluids, the saturated fluid exists as single-phase water, and internal magnetic field gradients are negligible. Consequently, the contributions of bulk relaxation and diffusion-controlled relaxation are extremely limited relative to surface relaxation, and their impacts on the measured NMR response can be reasonably omitted [24]. Accordingly, Equation (4) can be reduced to:
In this work, the Korringa–Seevers–Torrey (KST) framework is adopted to relate T2 to the pore geometry, which links surface relaxation at the pore wall to the pore volume via the surface-to-volume ratio.
Meanwhile,
where Fs is the pore shape factor and has no dimension; for spherical pores, Fs = 3; for cylindrical pores, Fs = 2.
In this study, Equations (6)–(8) are consolidated into the following expression [10,22]:
Since ρ2Fs remains constant in this formulation, it can be combined into a single parameter, yielding:
This leads to the expression given in Equation (1) above.
With the above transformation, the NMR T2s spectrum can be mapped to a pore–throat size distribution. In tight reservoirs, however, pervasive microporosity and a highly intricate pore–throat network often preclude an adequate linear fit between T2 and rt. Accordingly, numerous studies have adopted the empirically calibrated relationship in Equation (2), which integrates theoretical considerations with observational constraints [13,25].
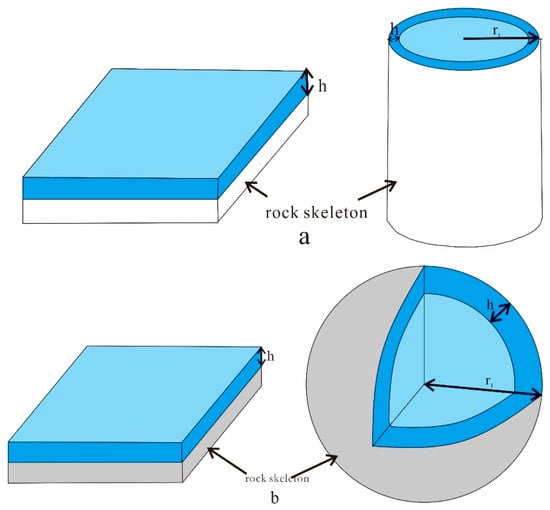
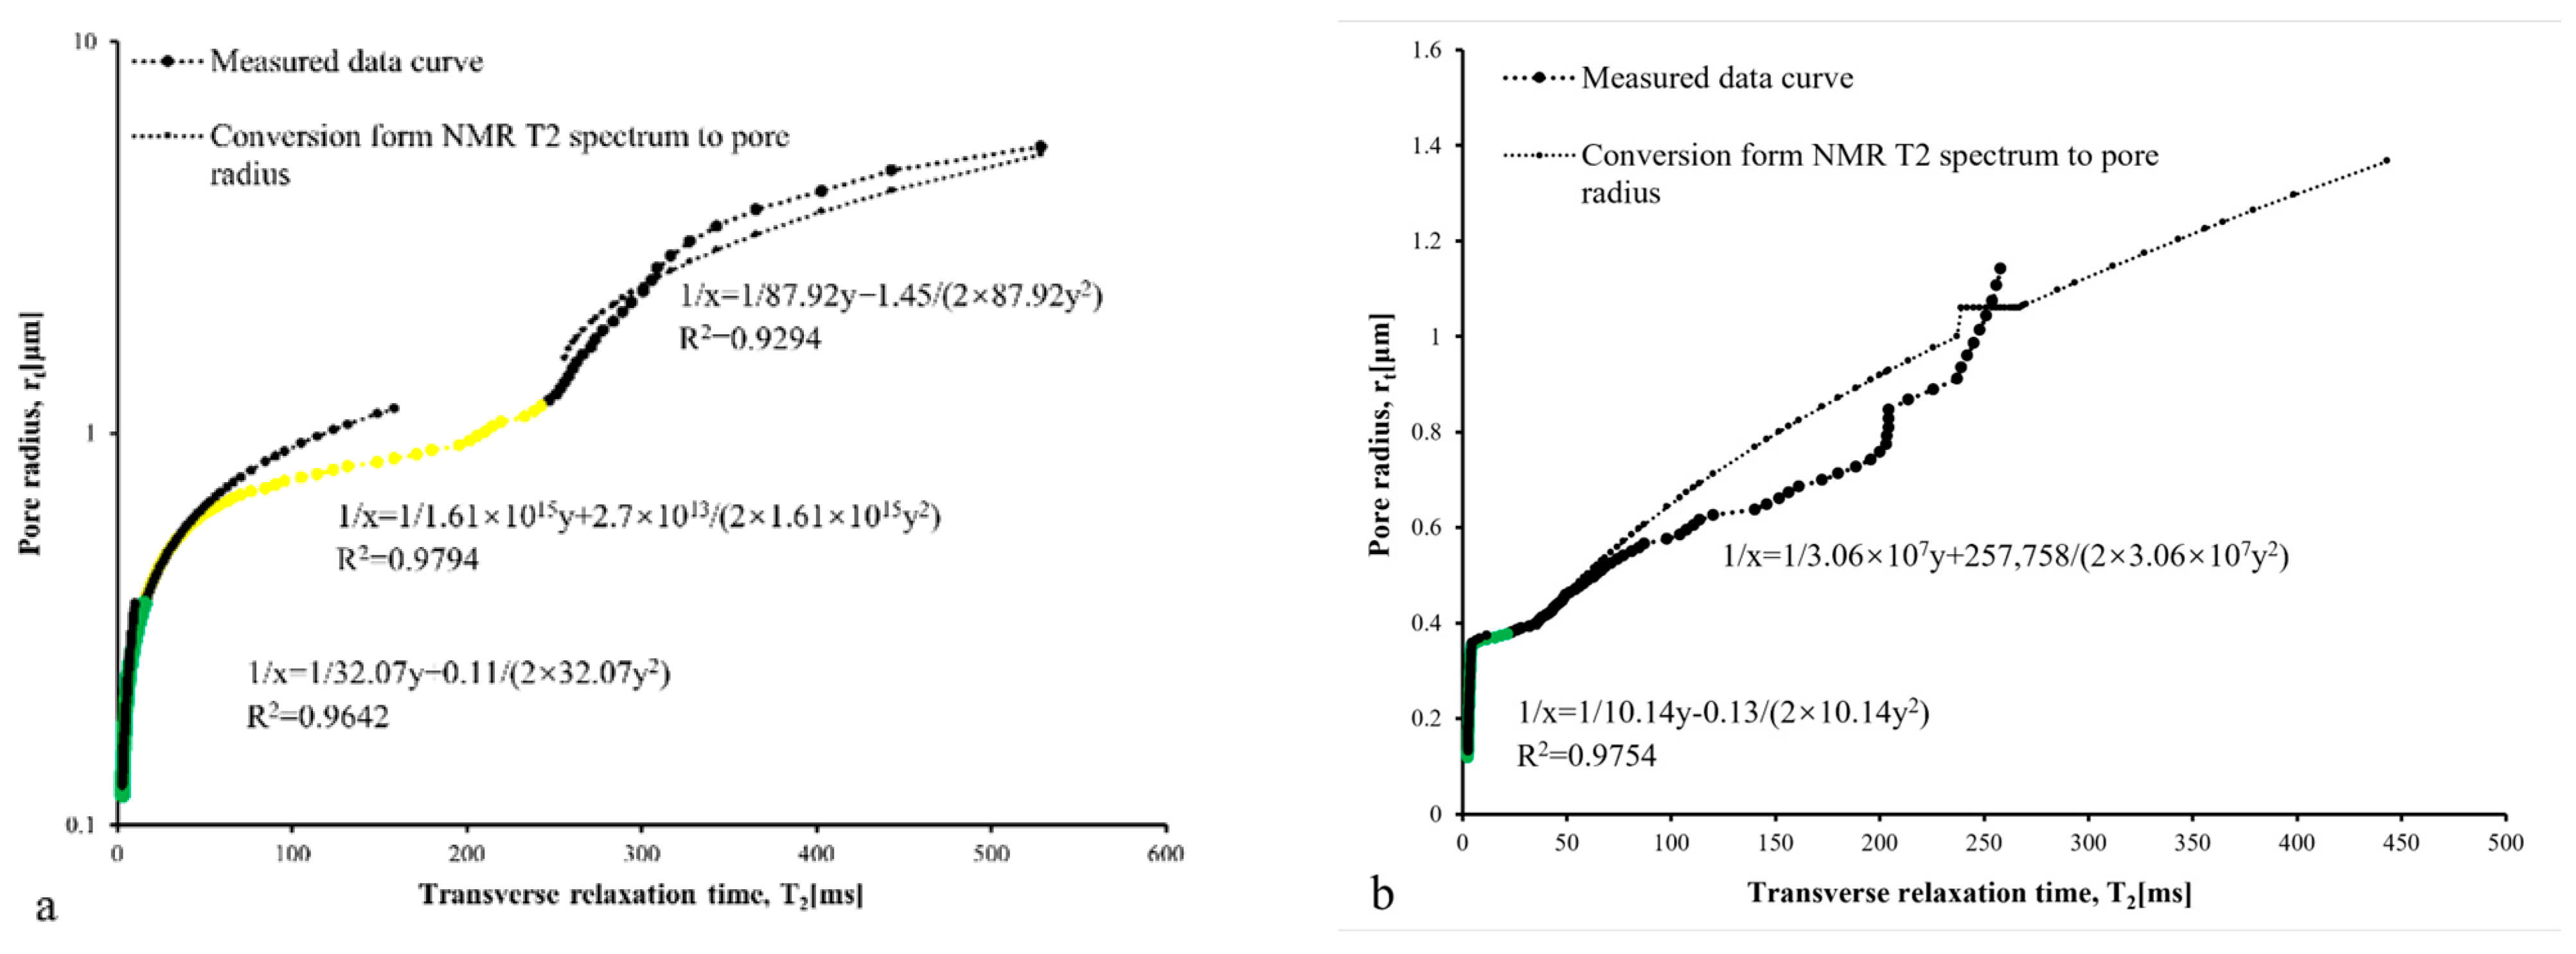
Building on this line of work, some scholars coupled Equation (6) with a cylindrical pore-geometry assumption to obtain the following relationship (Figure 2a) [14]:
Figure 2.
Schematic diagram of the liquid thin layer on particle surface of different pore models: (a) cylindrical pore model; (b) spherical pore model. Reproduced with permission from Hexin Huang et al., Journal of Petroleum Science and Engineering; published by Elsevier, 2018 [26].
Combining Equations (11) and (12) yields:
Ultimately, integrating Equations (6)–(8) with Equation (10) gives:
Once C and h are calculated from the measured dataset, the NMR-derived relaxation times can be transformed into a corresponding pore-radius distribution.
2.2.6. New Conversion Method
Based on the conversion approaches reported in prior studies, the mapping of NMR T2 spectra to pore–throat size distributions has typically been formulated under planar-surface assumptions or idealized cylindrical pore geometries (Figure 2b). Here, we extend the geometric basis by introducing a spherical pore representation. In this context, Equations (11) and (12) are reformulated as follows:
By substituting Equation (16) into Equation (15):
Subsequently, Equation (6) can be rewritten as:
Next, substituting Equations (7), (8) and (10) into Equation (18) gives:
Ultimately, once the parameters C and h are quantified from the measured data, the mapping from NMR T2 to rt can be established effectively.
3. Results
3.1. Petrophysical Properties
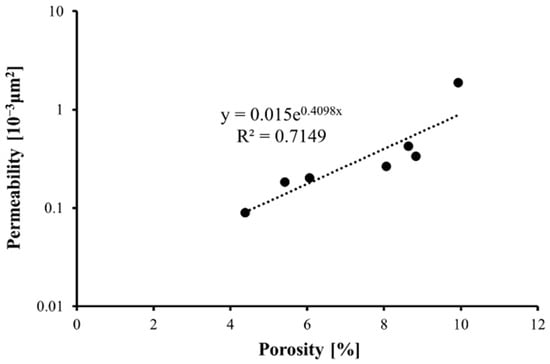
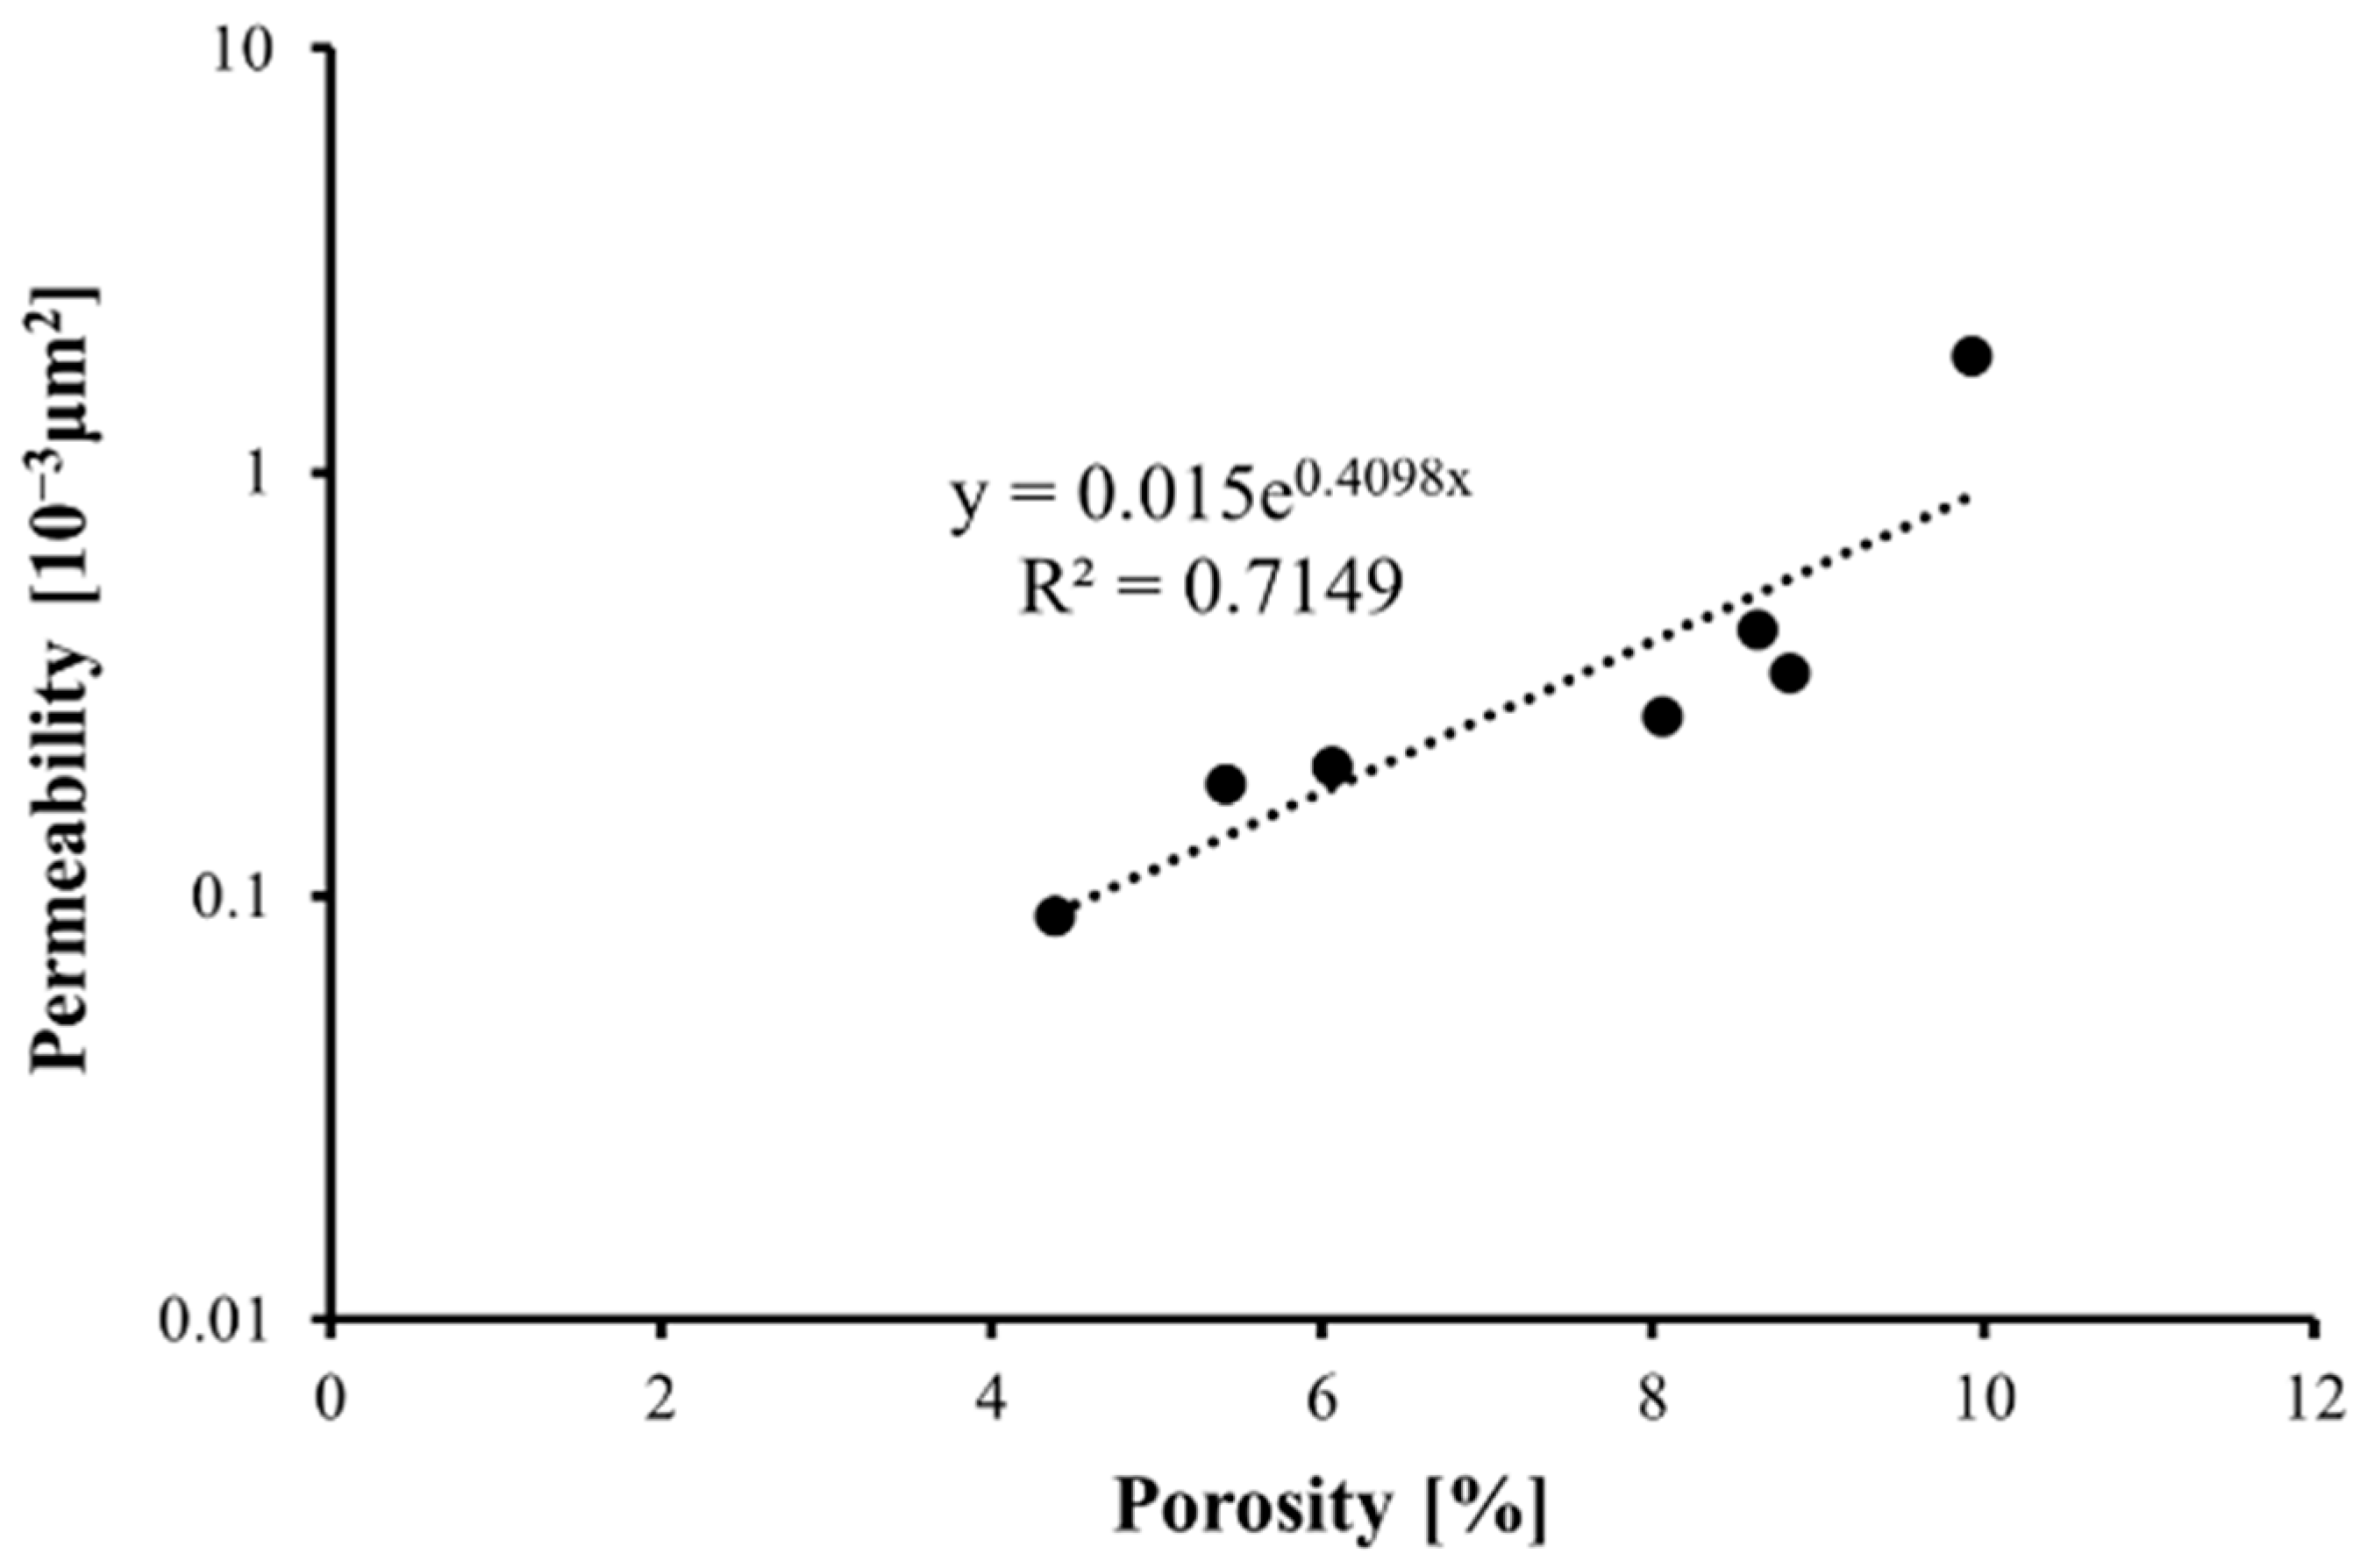
Porosity and permeability were determined for the seven samples and subsequently evaluated. Measured porosity ranges from 4.38%–9.93%, with a mean value of 7.33%. Permeability varies from 0.0892 to 1.8836 × 10⁻³ μm2, averaging 0.4830 × 10⁻³ μm2. The sample-by-sample results are reported in Table 1. As indicated by Figure 3, the dataset exhibits pronounced rock-property heterogeneity across the studied cores. However, due to the limitation of the sample size, the correlation coefficient between porosity and permeability is R2 = 0.714, indicating a relatively low reliability. Therefore, the relevant conclusions are only applicable to a limited scope.
Table 1.
Summary of the physical properties of core samples.
Figure 3.
Correlation between porosity and permeability of the samples in the study area. The black line represents the best-fit trend of the porosity–permeability data.
3.2. XRD
Quantitative XRD results are summarized in Table 2. Quartz-group minerals dominate the bulk composition, comprising 53%–66% of the rock (mean: 59.29%), primarily as quartz (50%–63%) with a minor chert contribution (~3%). Feldspar is detected only in samples Z91 and Z92, where it constitutes ~3%. Total clay-mineral content ranges from 4.98% to 7.89% (average: 6.09%). The clay assemblage is composed mainly of illite (45.66%–83.57%), with variable proportions of chlorite (0.23%–28.33%), kaolinite (2.59%–53.04%), and mixed-layer illite/smectite (I/S; 9.37%–13.97%).
Table 2.
Clay mineral compositions of samples determined by X-ray diffraction.
3.3. MIP
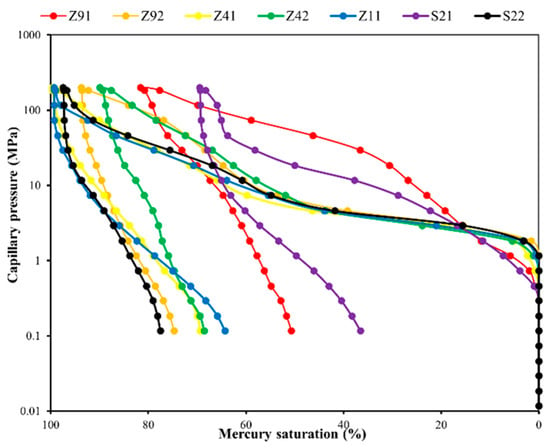
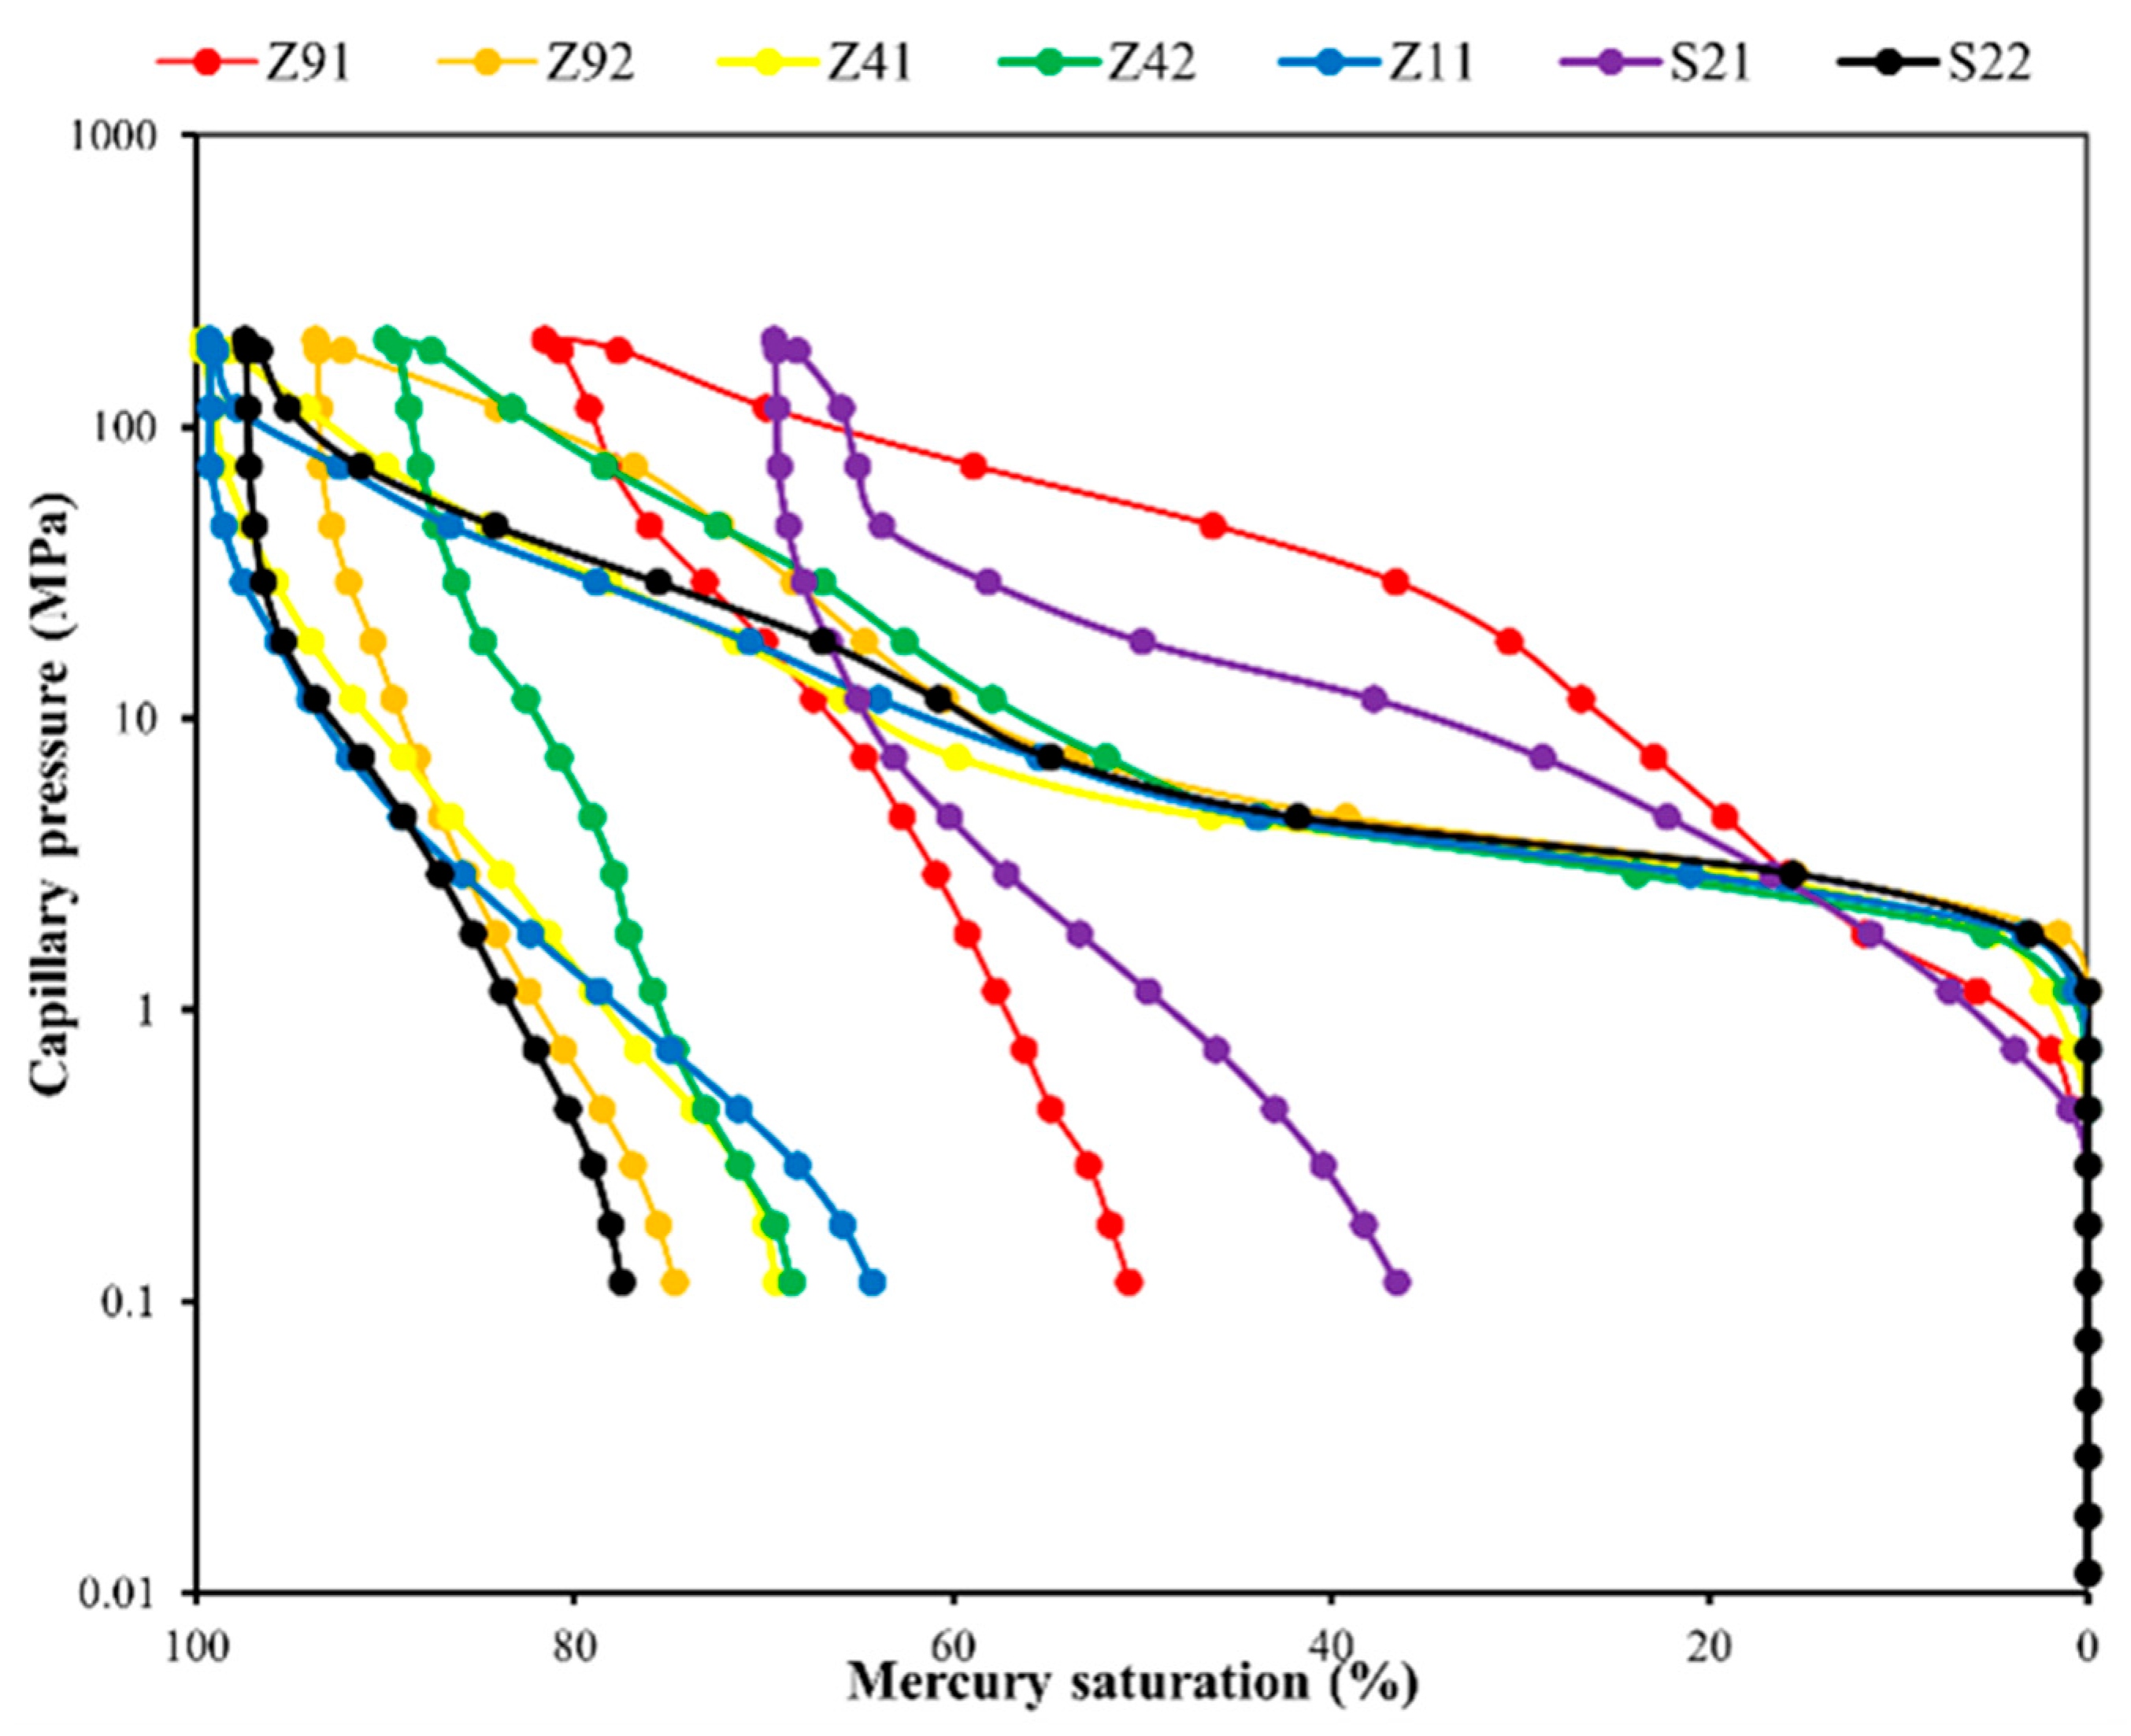
As shown in Figure 4, the maximum mercury saturation achieved by the core samples ranges from 69.5%–99.7%, with a mean of 88.8%. Displacement pressure varies from 0.3 to 1.5 MPa, averaging 0.84 MPa. Mercury withdrawal efficiency is generally below 40%, with only sample S21 reaching 47.4%. As indicated by the high-pressure mercury intrusion data, the mean pore–throat radius ranges from 0.14 to 0.34 μm, with an overall average of ~0.20 μm. Collectively, these metrics indicate a predominantly fine pore–throat system and weak pore-network connectivity within the studied rocks [27].
Figure 4.
High-pressure mercury intrusion and withdrawal curves of the sample.
3.4. CRMI
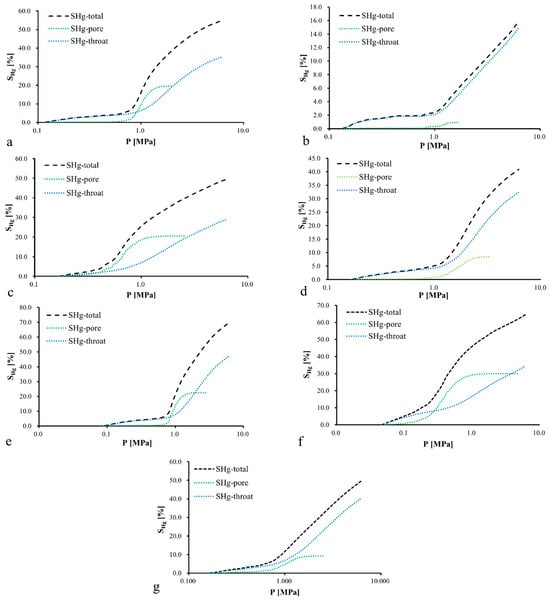
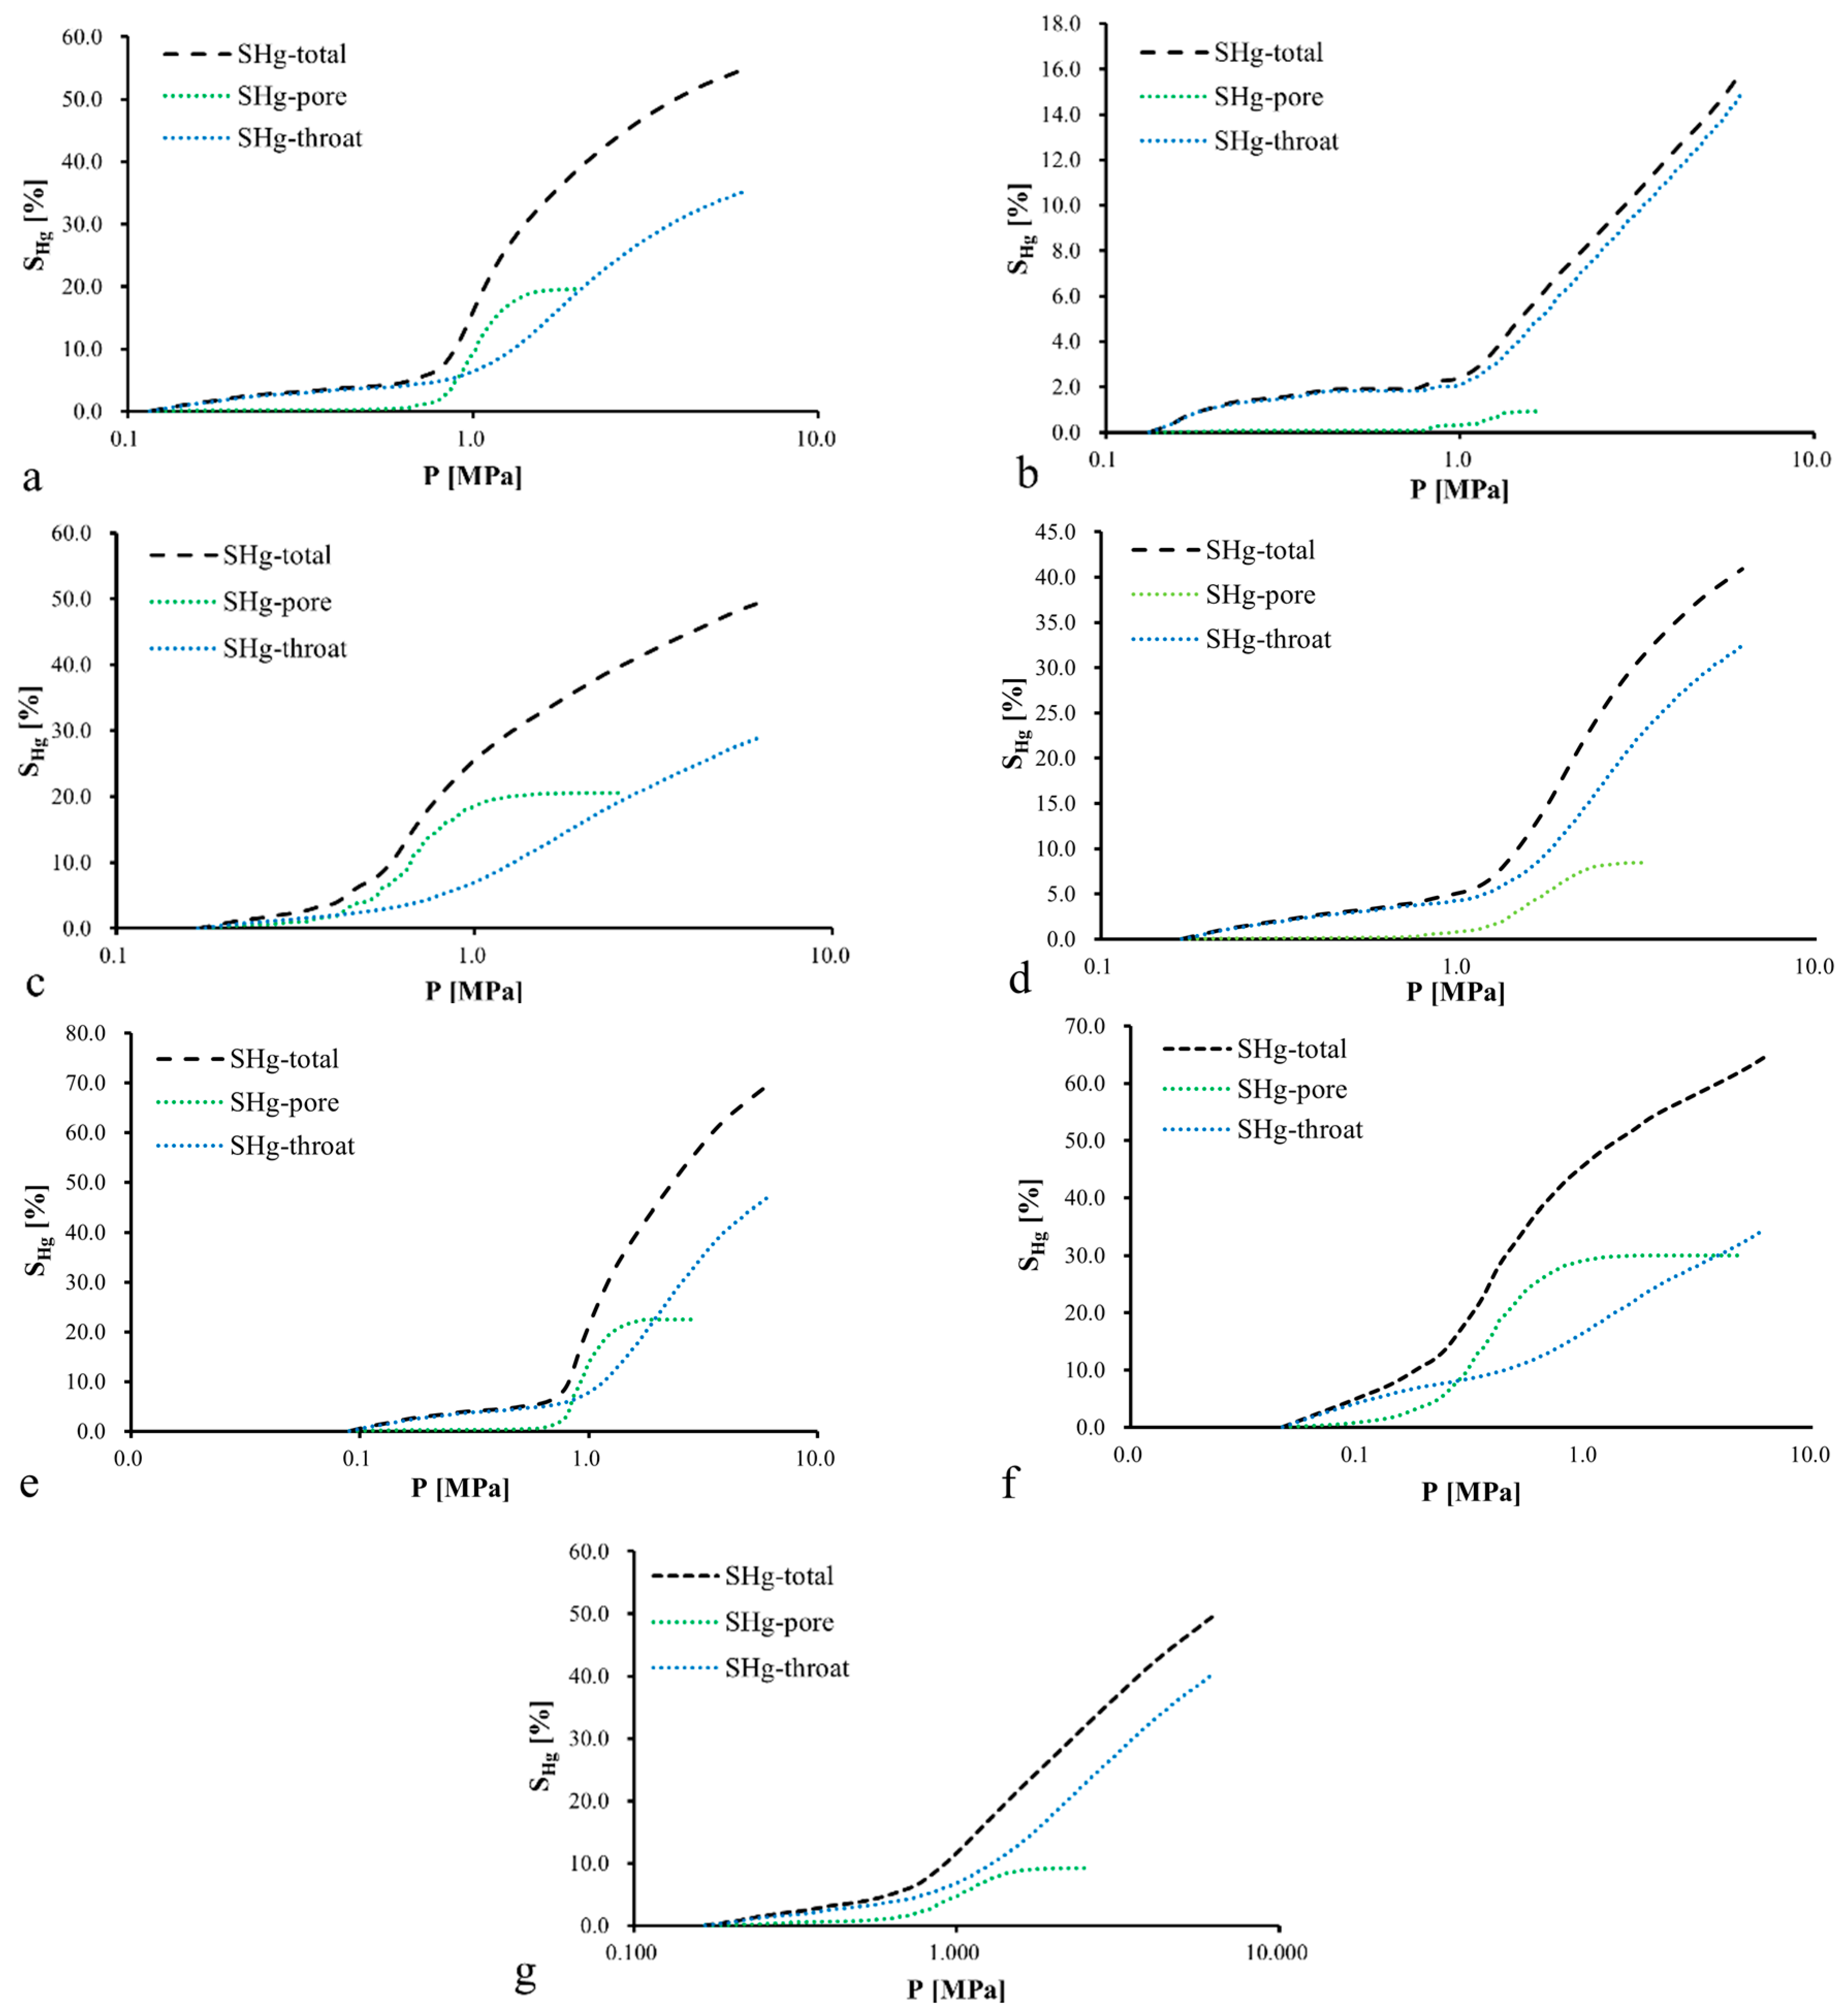
Constant-rate mercury intrusion (CRMI) adopts a low mercury injection rate to maintain a quasi-static intrusion process. During continuous mercury injection, it can accurately capture the characteristic parameters of pores and throats in reservoirs, realize their effective distinction, and further finely characterize the distribution law of pore-throat sizes. (Figure 5). Moreover, capillary-pressure responses can be leveraged to appraise both the abundance and characteristic dimensions of pores and throats in tight reservoirs [28,29]. In general, larger characteristic throat radii are associated with improved reservoir quality and, correspondingly, more favorable conditions for fluid transport (Table 3).
Figure 5.
Relationship between capillary pressure and mercury saturation for total, pore, and throat volumes in (a) Z91, (b) Z92, (c) Z41, (d) Z42, (e) Z11, (f) S21, and (g) S22 samples.
Table 3.
Pore-throat parameters of the samples measured by constant-rate mercury intrusion.
3.5. NMR
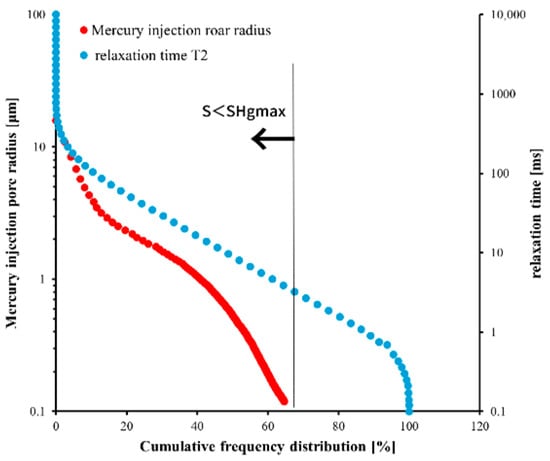
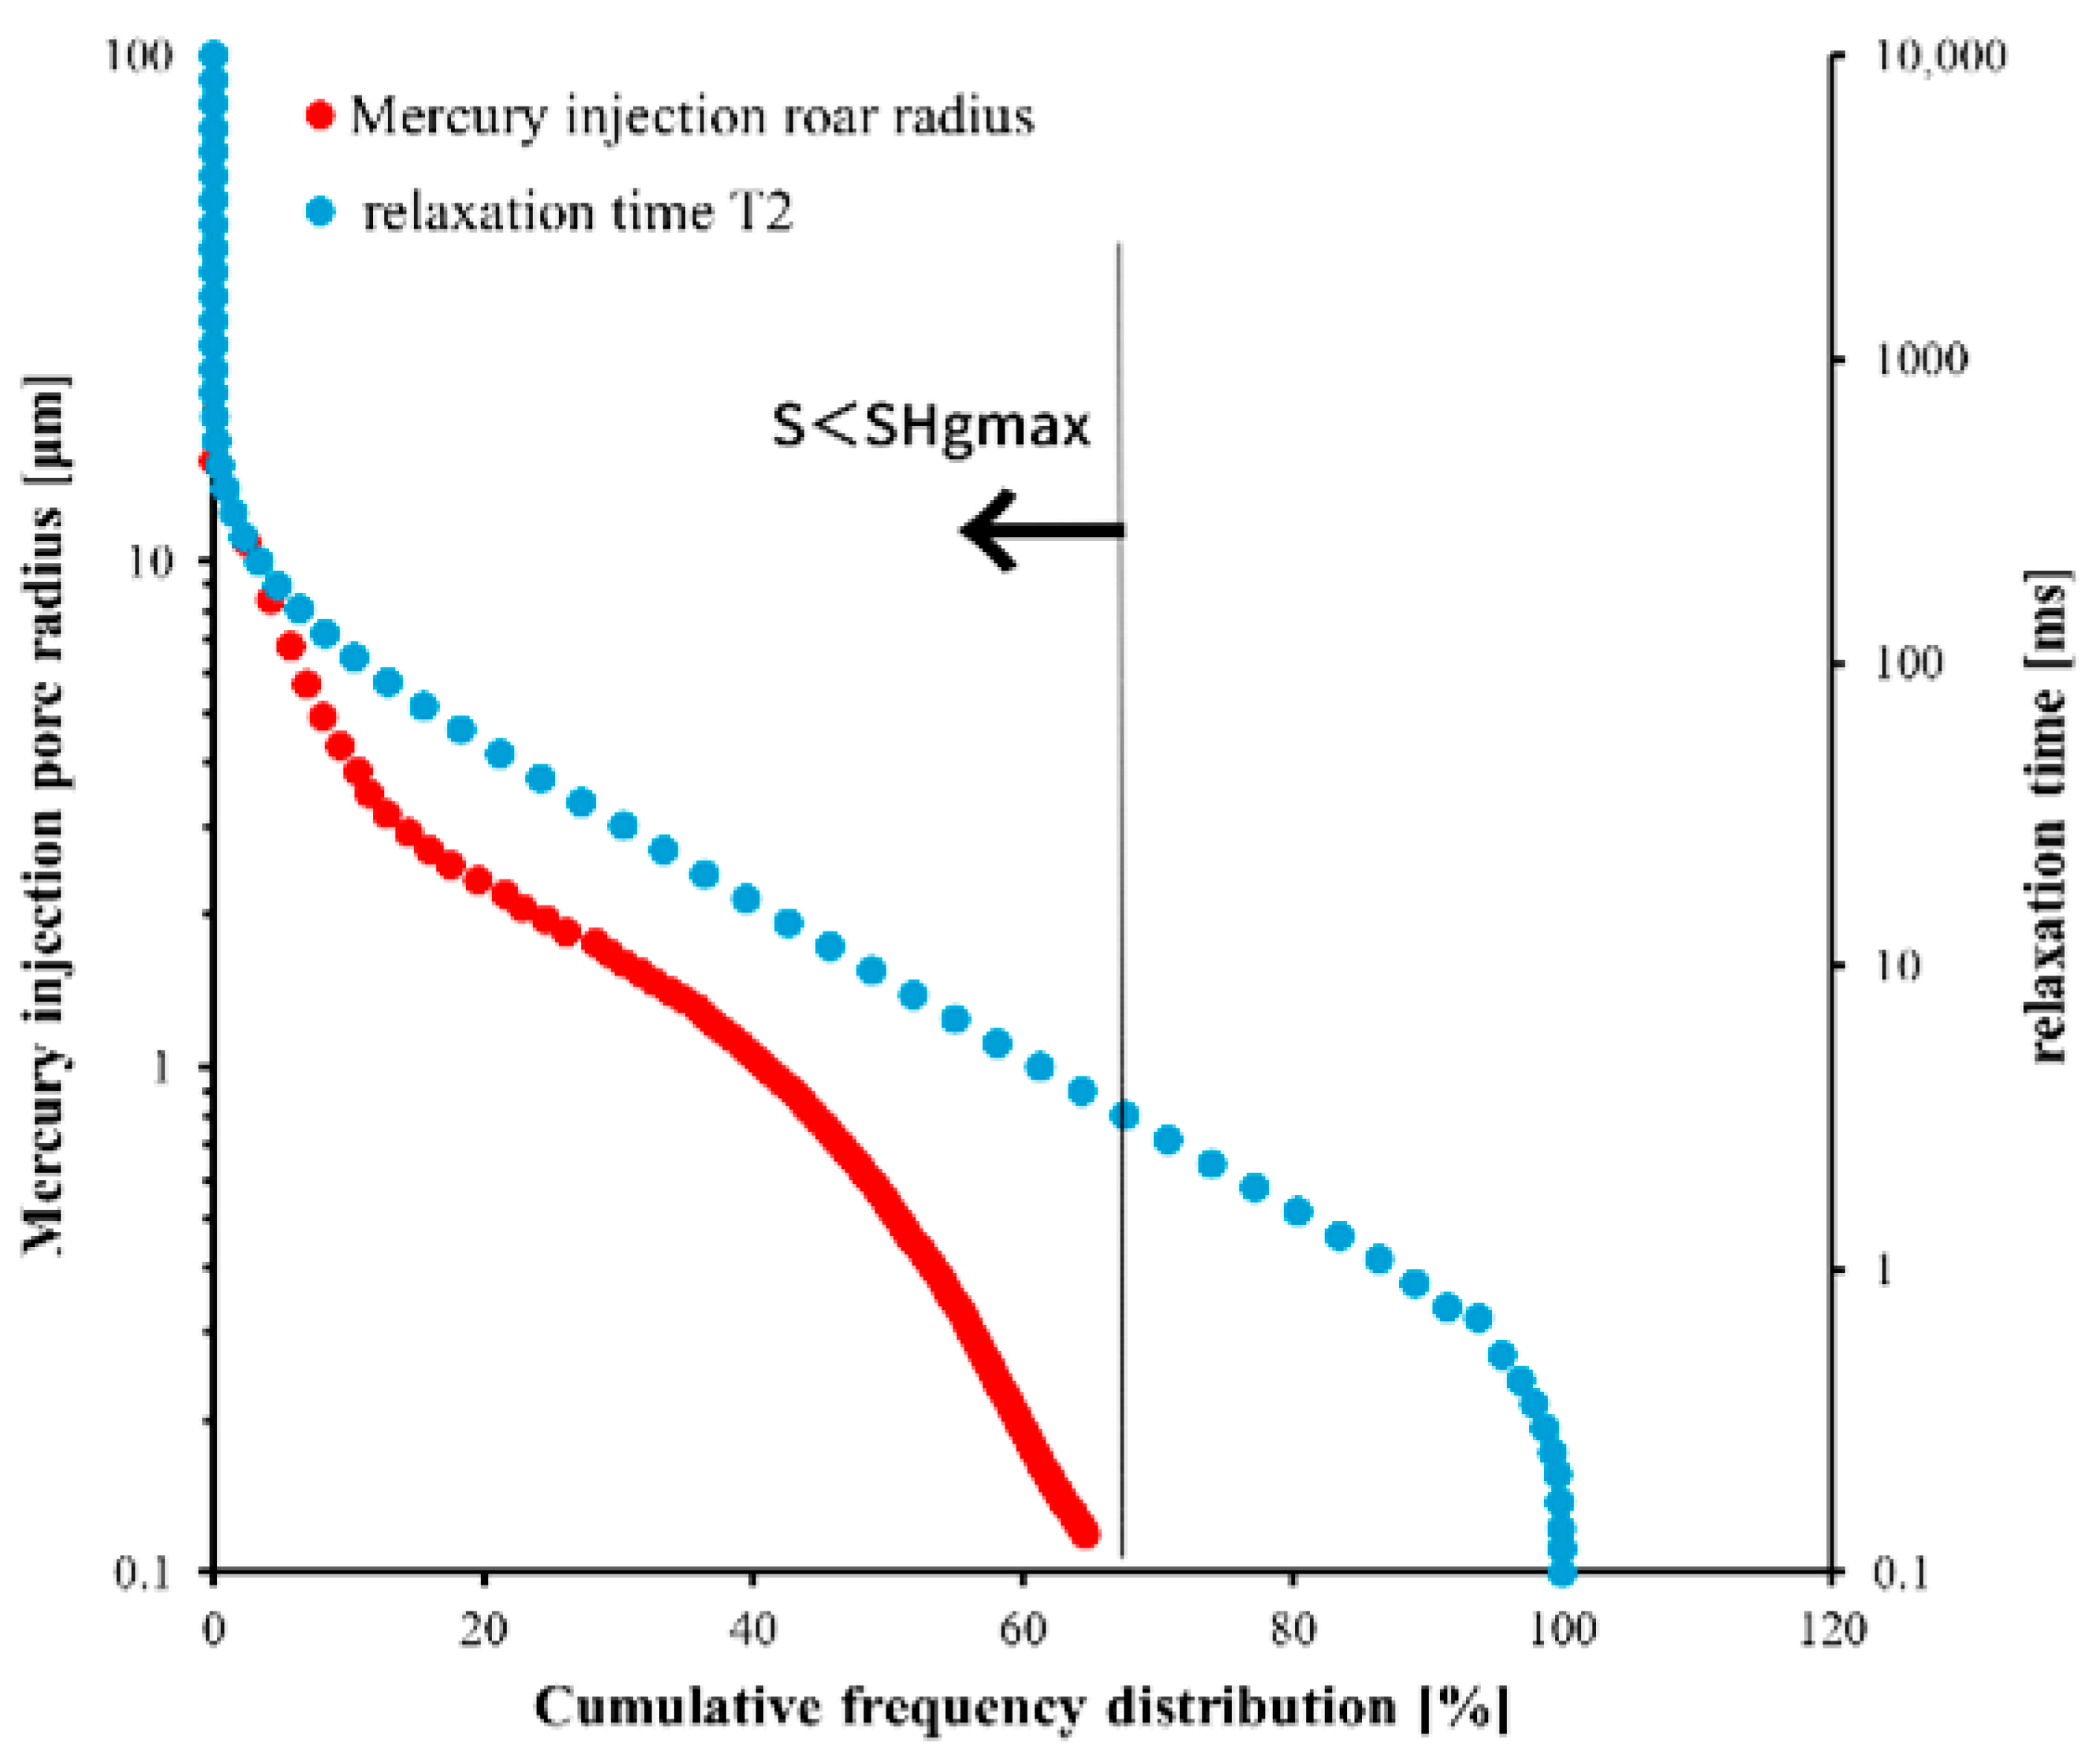
During mercury intrusion, a given capillary pressure first drives mercury into larger pores and gradually enters smaller pores as the applied pressure increases [30,31,32,33]. In tight reservoirs, however, mercury saturation during MIP commonly remains below full saturation. For this reason, when coupling the NMR-derived cumulative T2 distribution (ordered from long to short relaxation times) with the MIP-derived cumulative pore–throat radius distribution (ordered from large to small radii), the matching was restricted to the fraction of the NMR cumulative amplitude that does not exceed the maximum mercury saturation achieved in MIP (Figure 6).
Figure 6.
The NMR T2 spectrum of sample S21 was converted to pore throat radius.
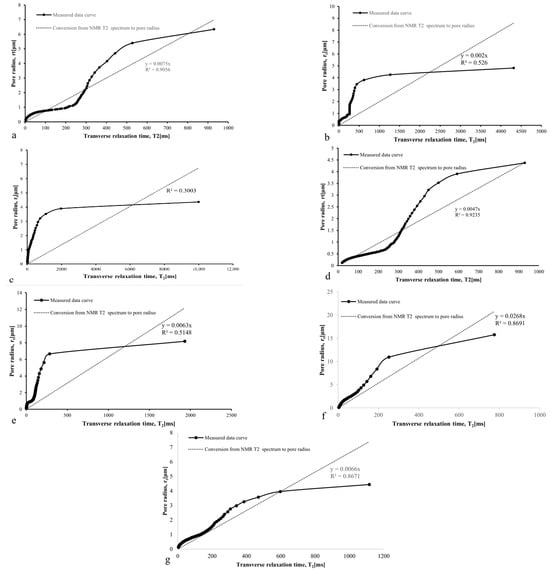
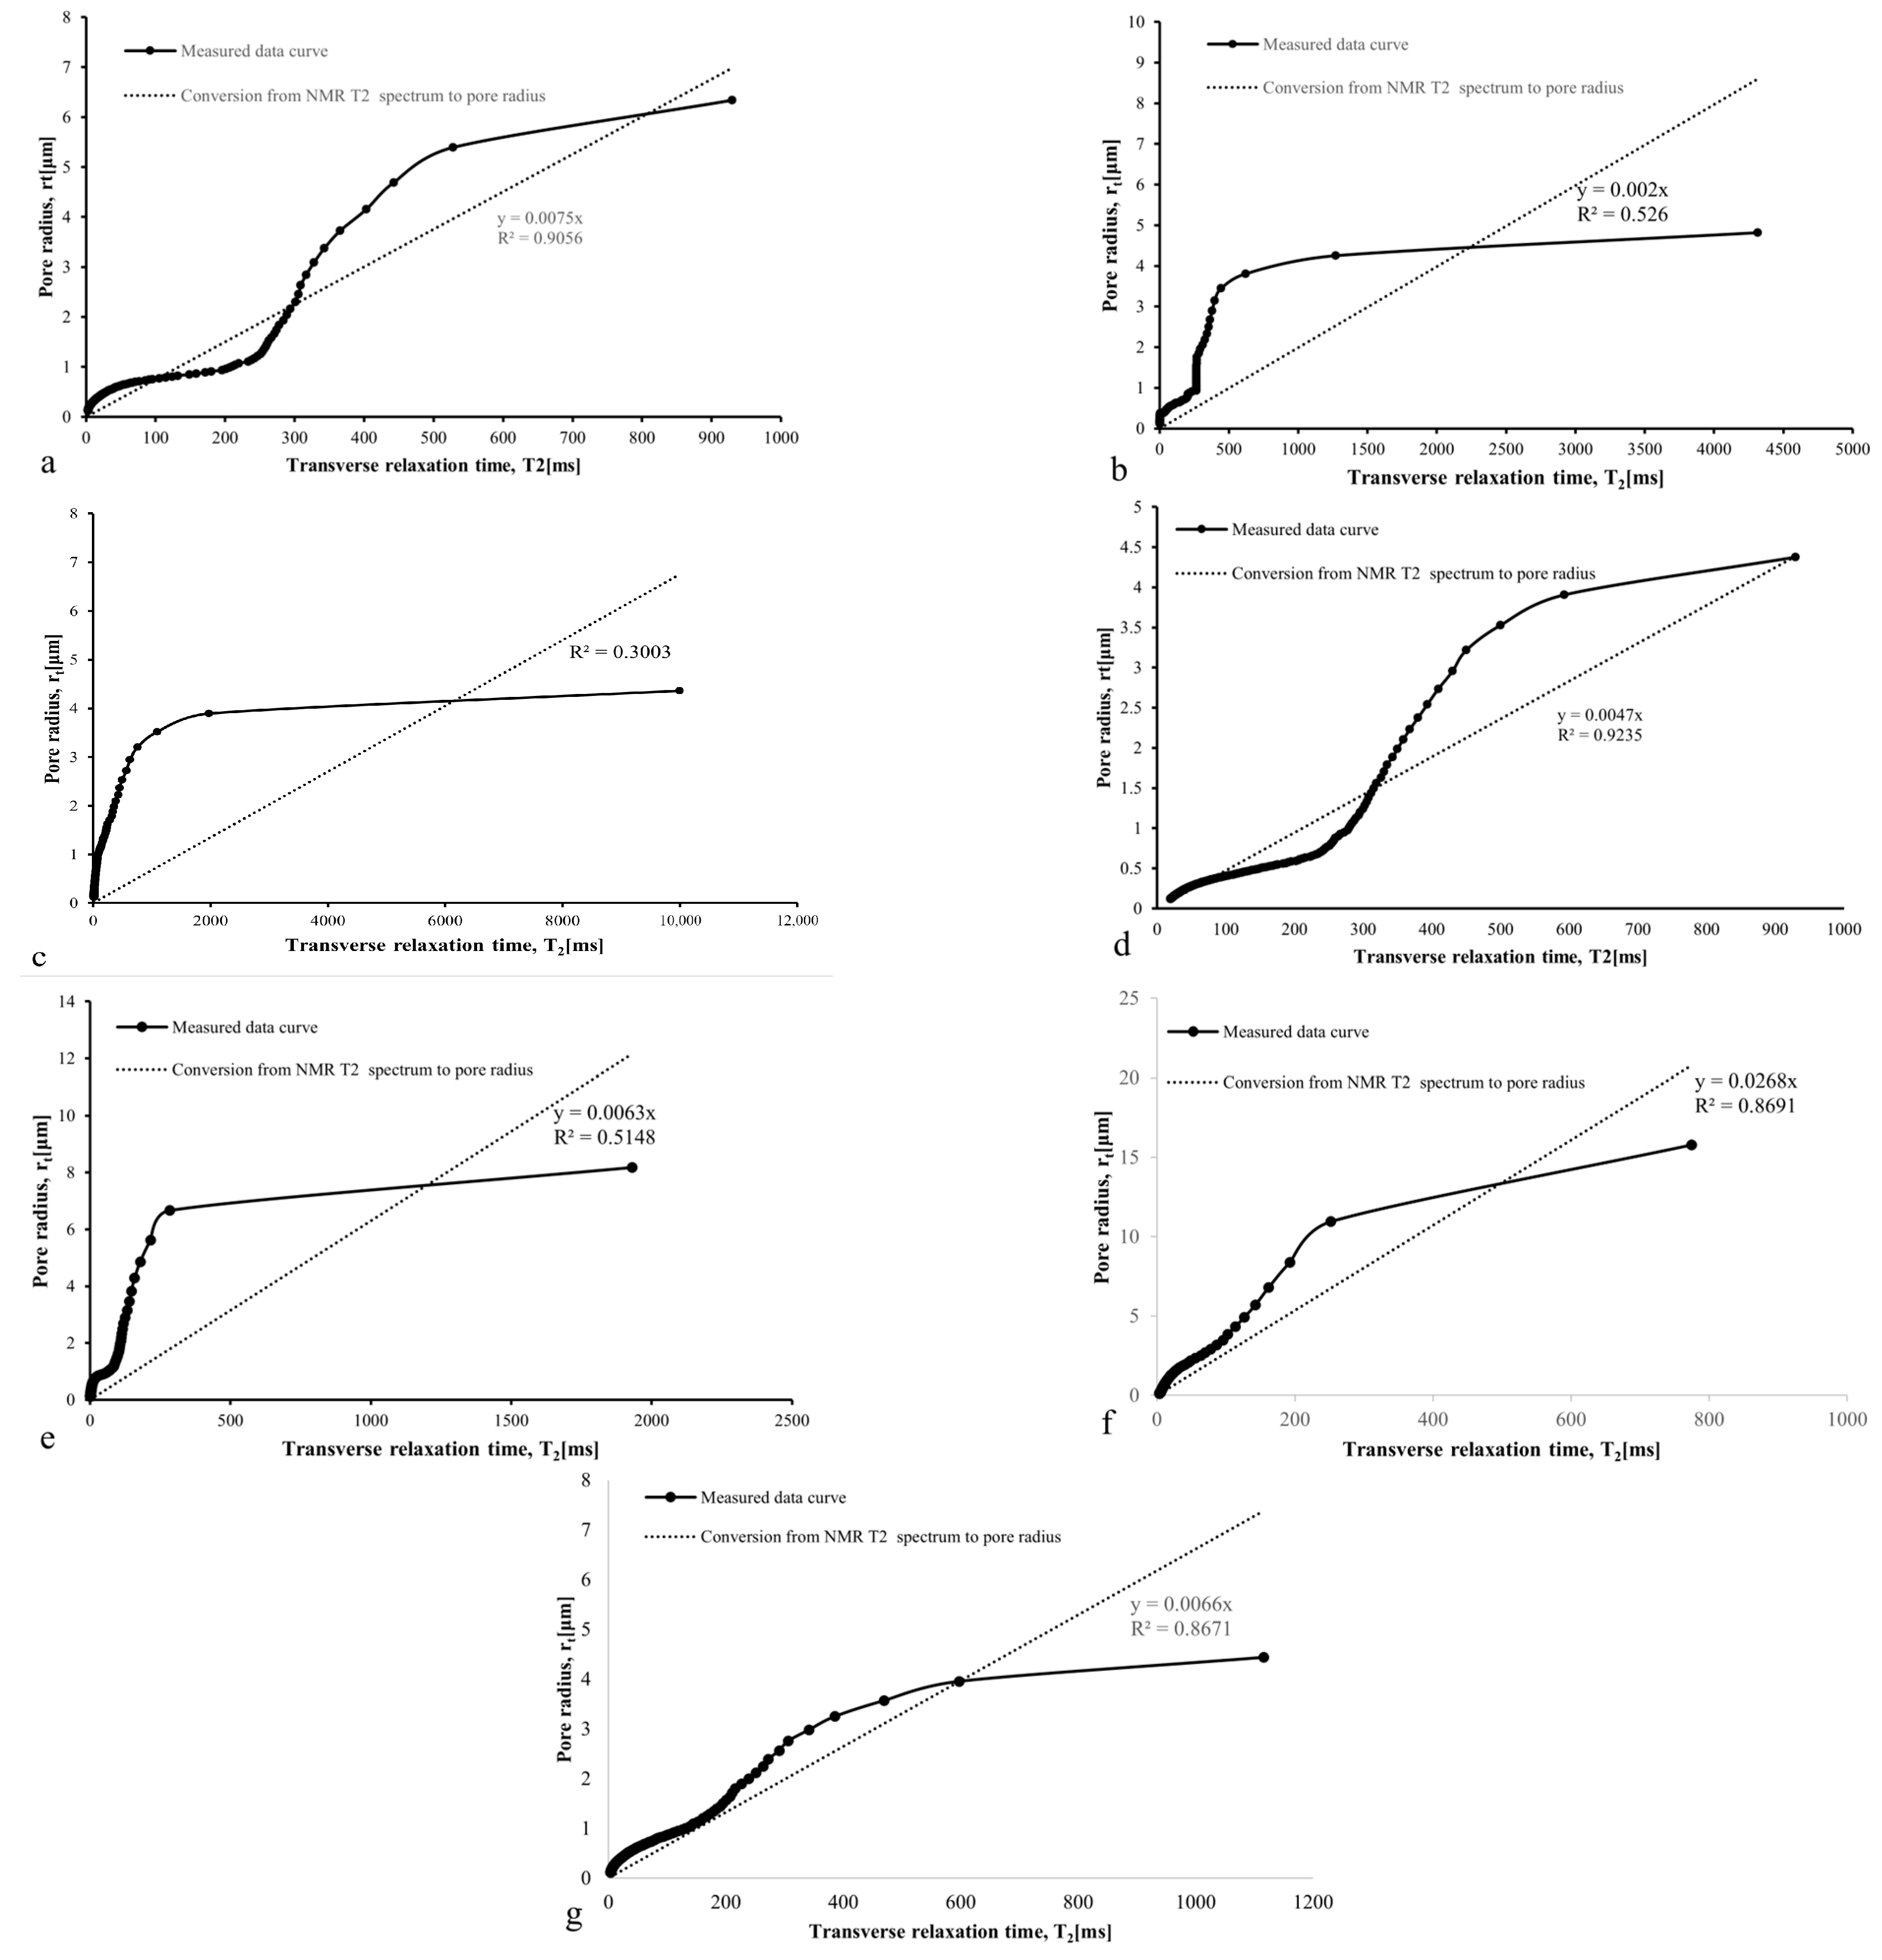
The T2 data were coupled with the MIP-derived pore–throat radius distribution using Equation (1) within the conventional conversion scheme to estimate parameter C and derive the corresponding relationship (Figure 7). However, as evident from the results, the agreement between the two datasets is poor.
Figure 7.
According to conventional methods, NMR T2 spectra from (a) Z91, (b) Z92, (c) Z41, (d) Z42, (e) Z11, (f) S21, and (g) S22 samples were fitted to the transition parameters to the pore throat radius.
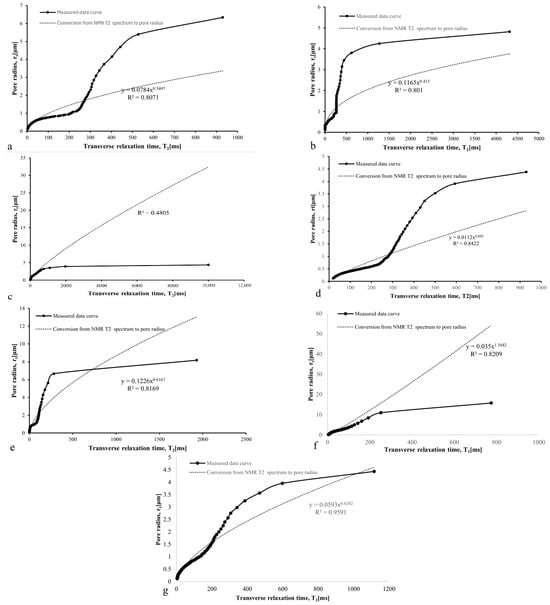
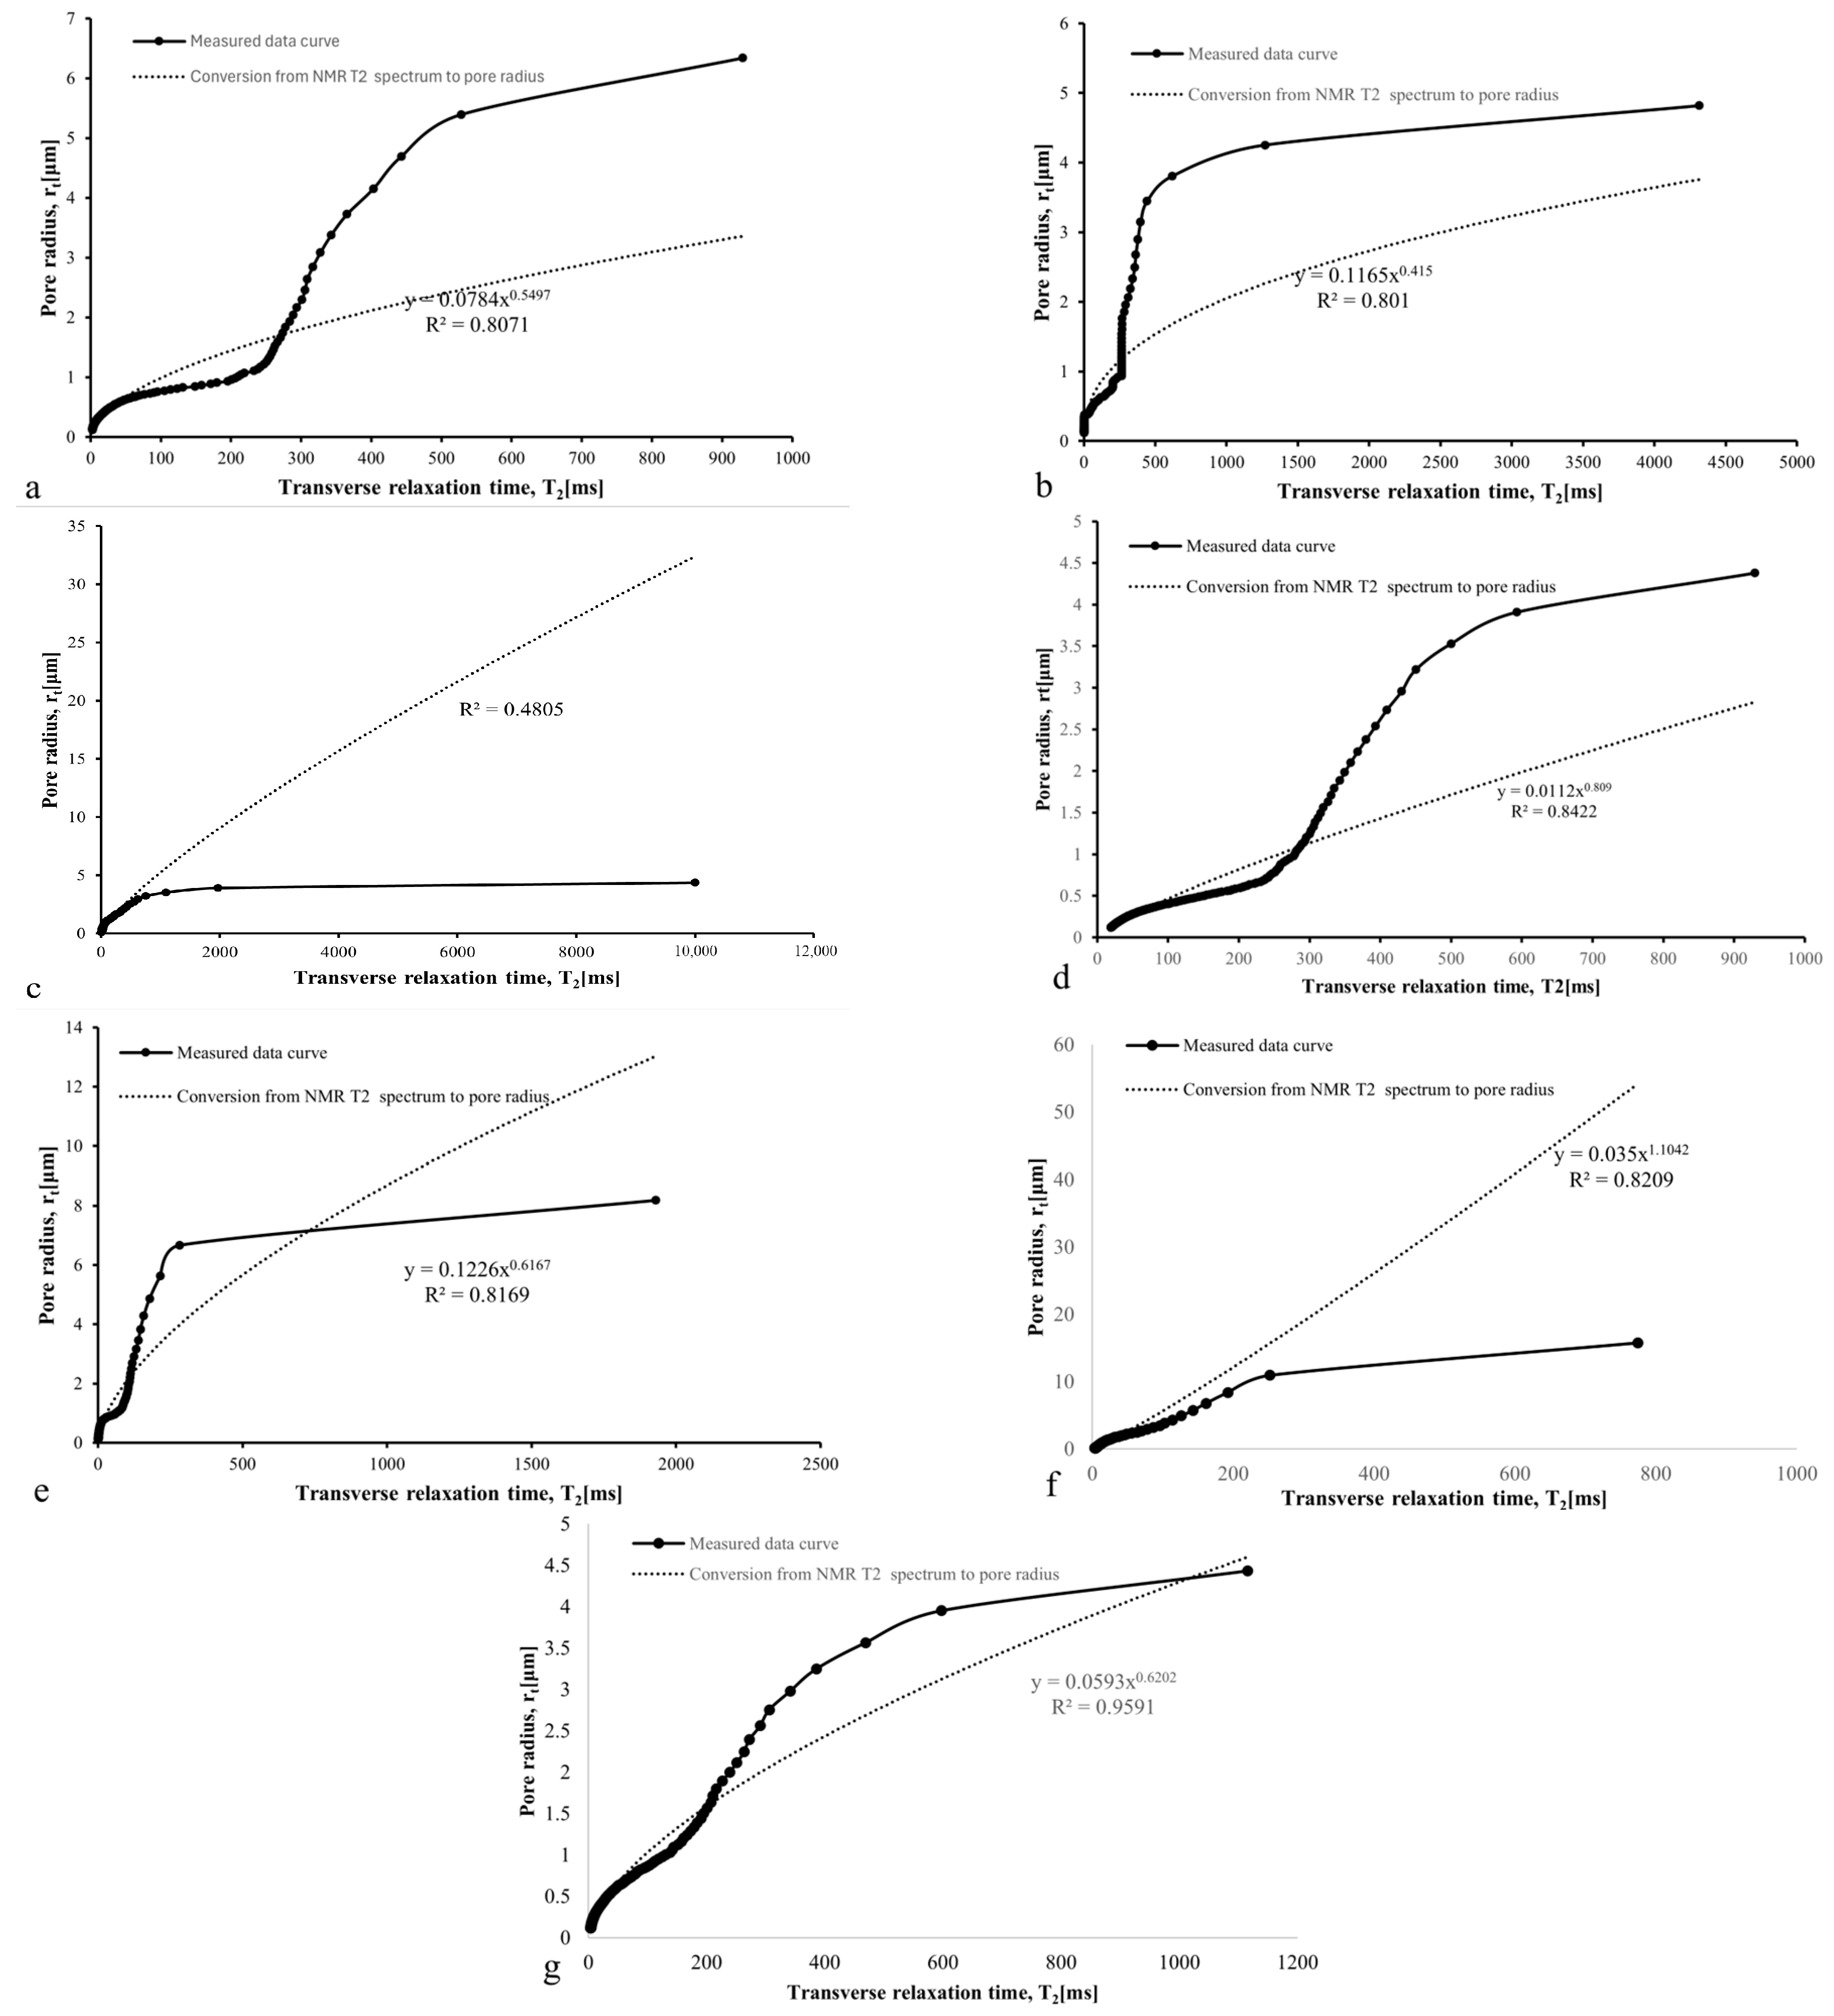
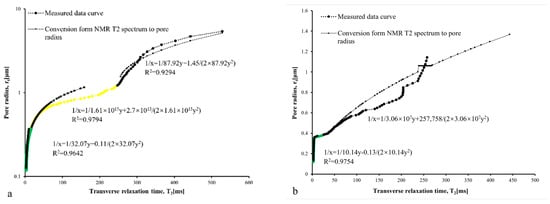
Given the limitations of the conventional method, we further adopted the empirically derived relationship in Equation (2). The NMR T2 response was coupled with the pore-throat radius distribution from MIP by using Excel trendline fitting, from which the optimized estimates of parameters C and n were obtained (Figure 7 and Figure 8) (Table 4). Nevertheless, our fitted results indicate that the correspondence between T2 and MIP-inferred pore–throat radii cannot be adequately represented by either a purely linear mapping or a single power-law form.
Figure 8.
According to the empirical method, NMR T2 spectra from (a) Z91, (b) Z92, (c) Z41, (d) Z42, (e) Z11, (f) S21, and (g) S22 samples were fitted to the transition parameters to the pore throat radius.
Table 4.
Conversion parameters determined based on conventional methods and empirical methods.
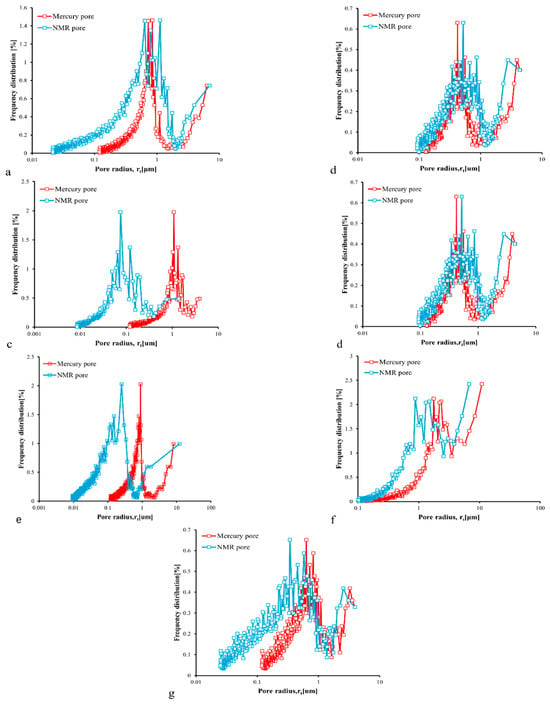
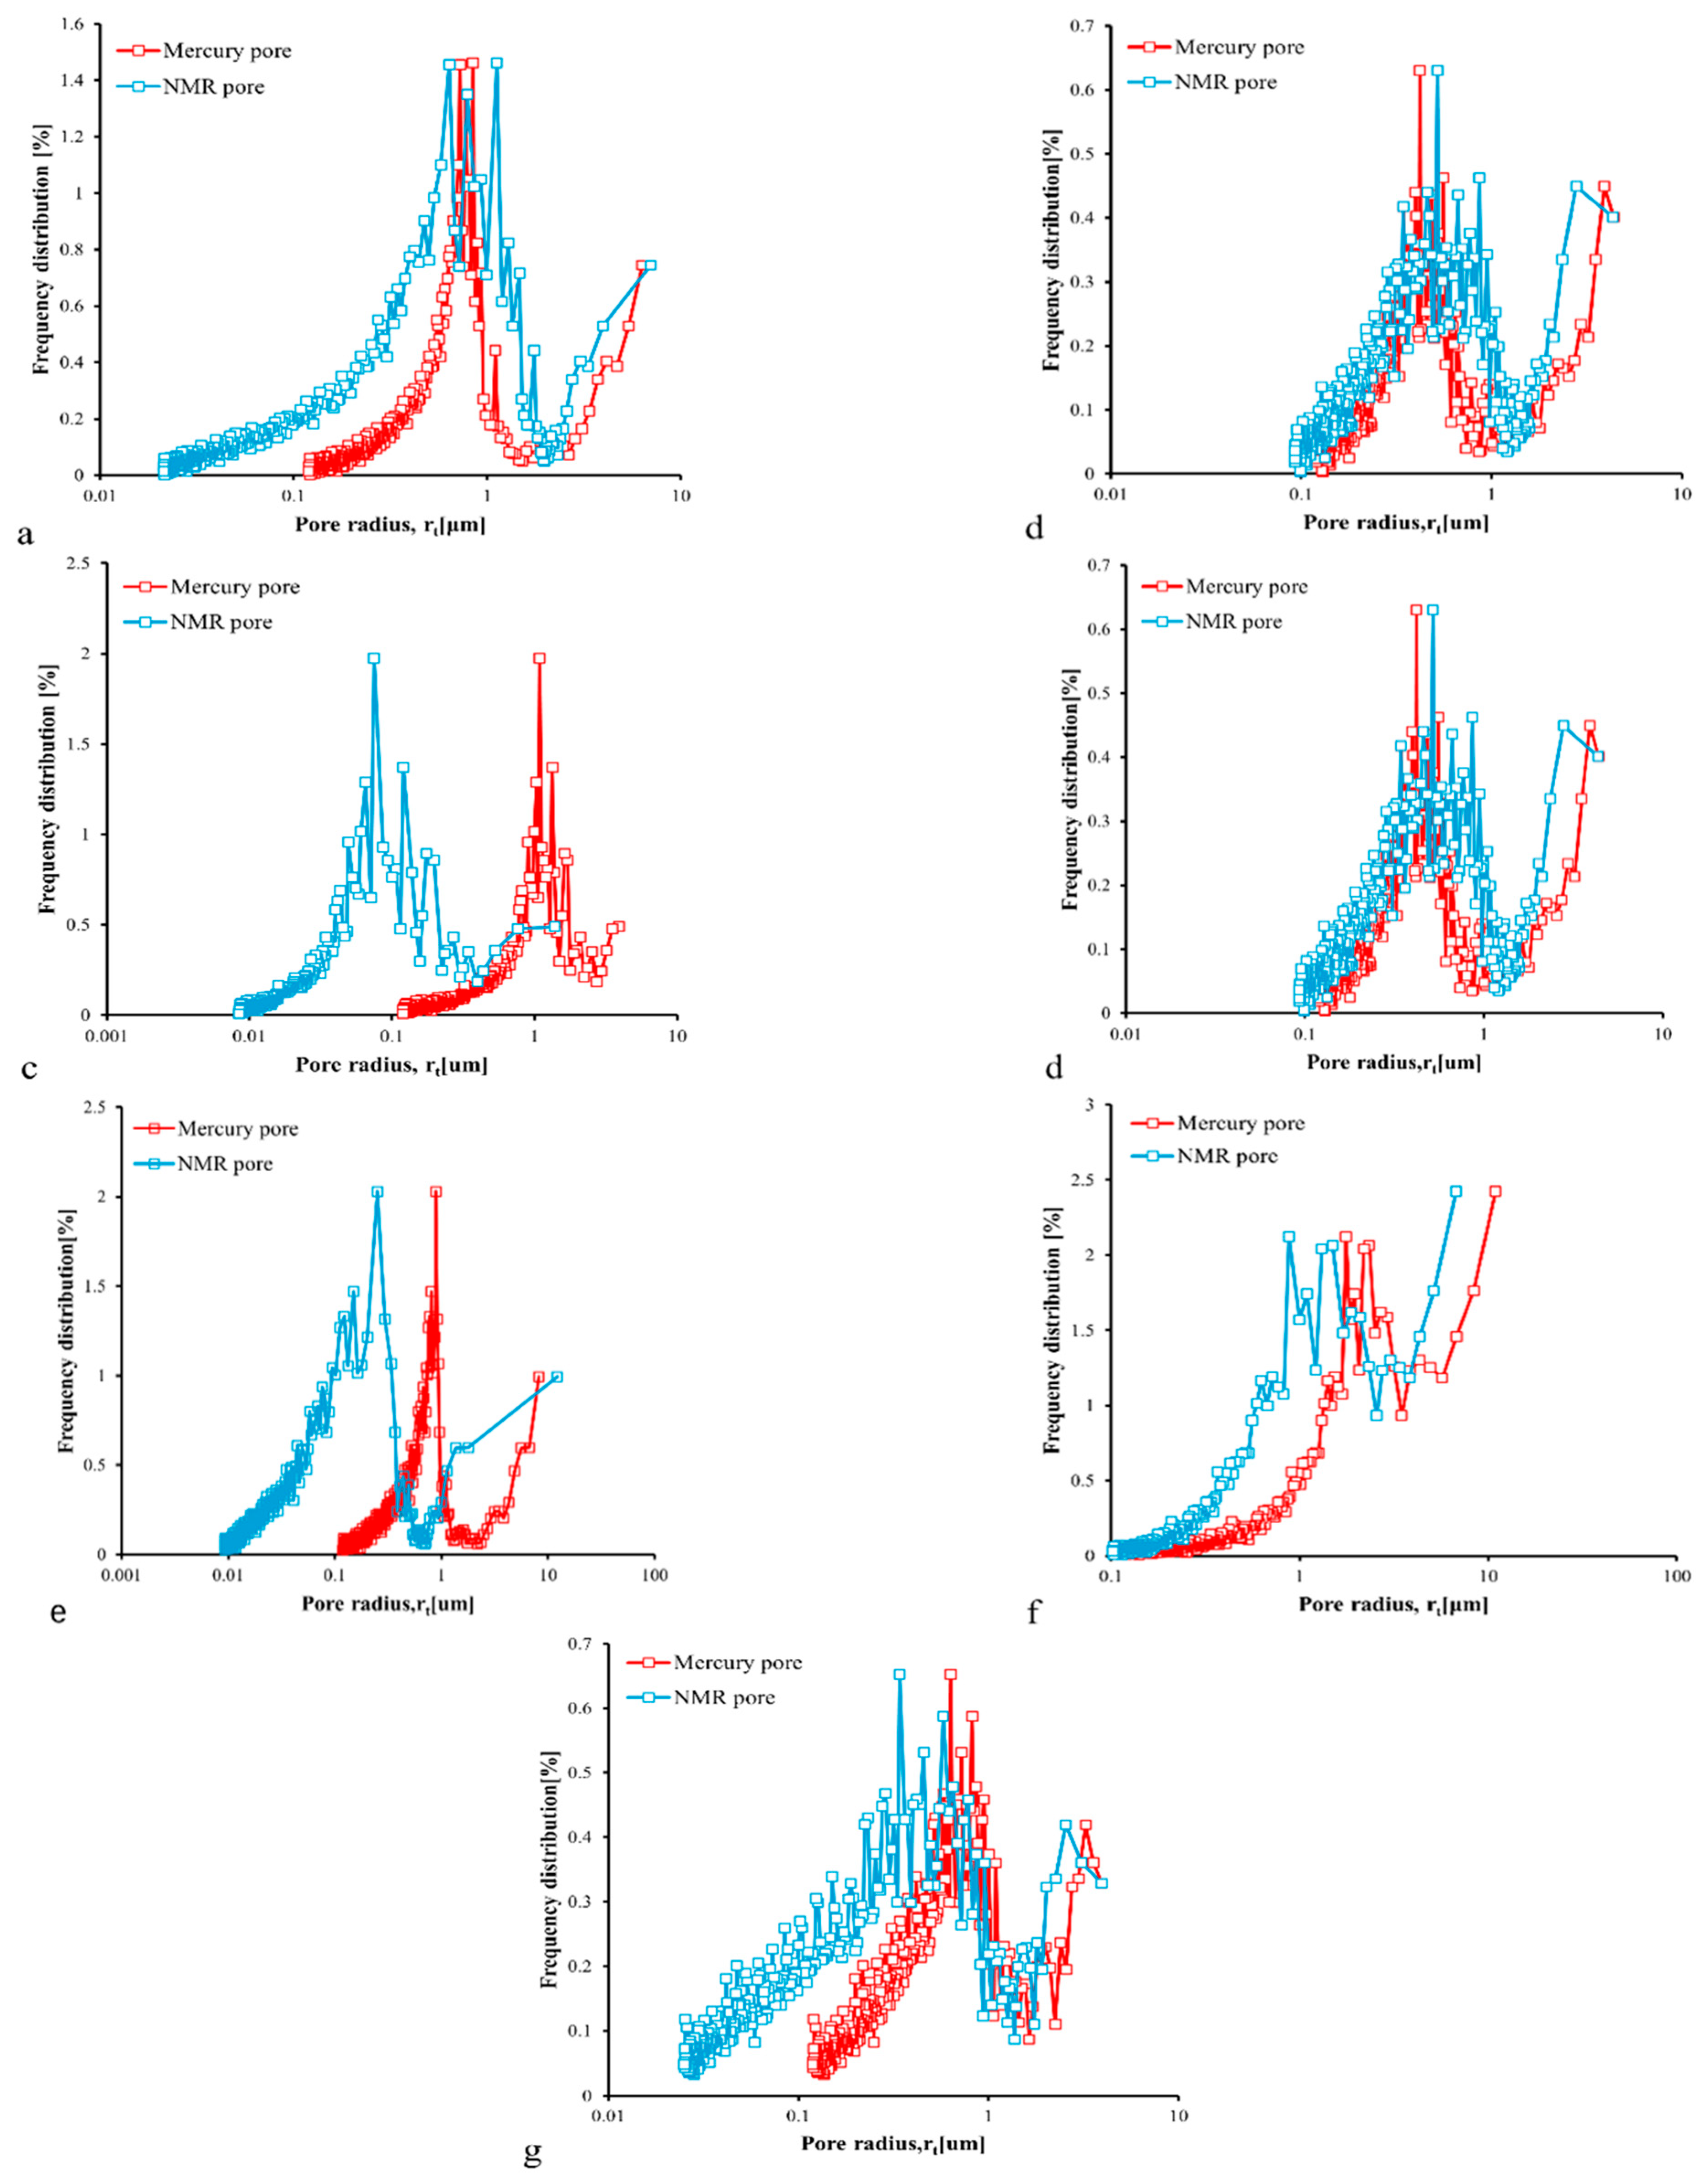
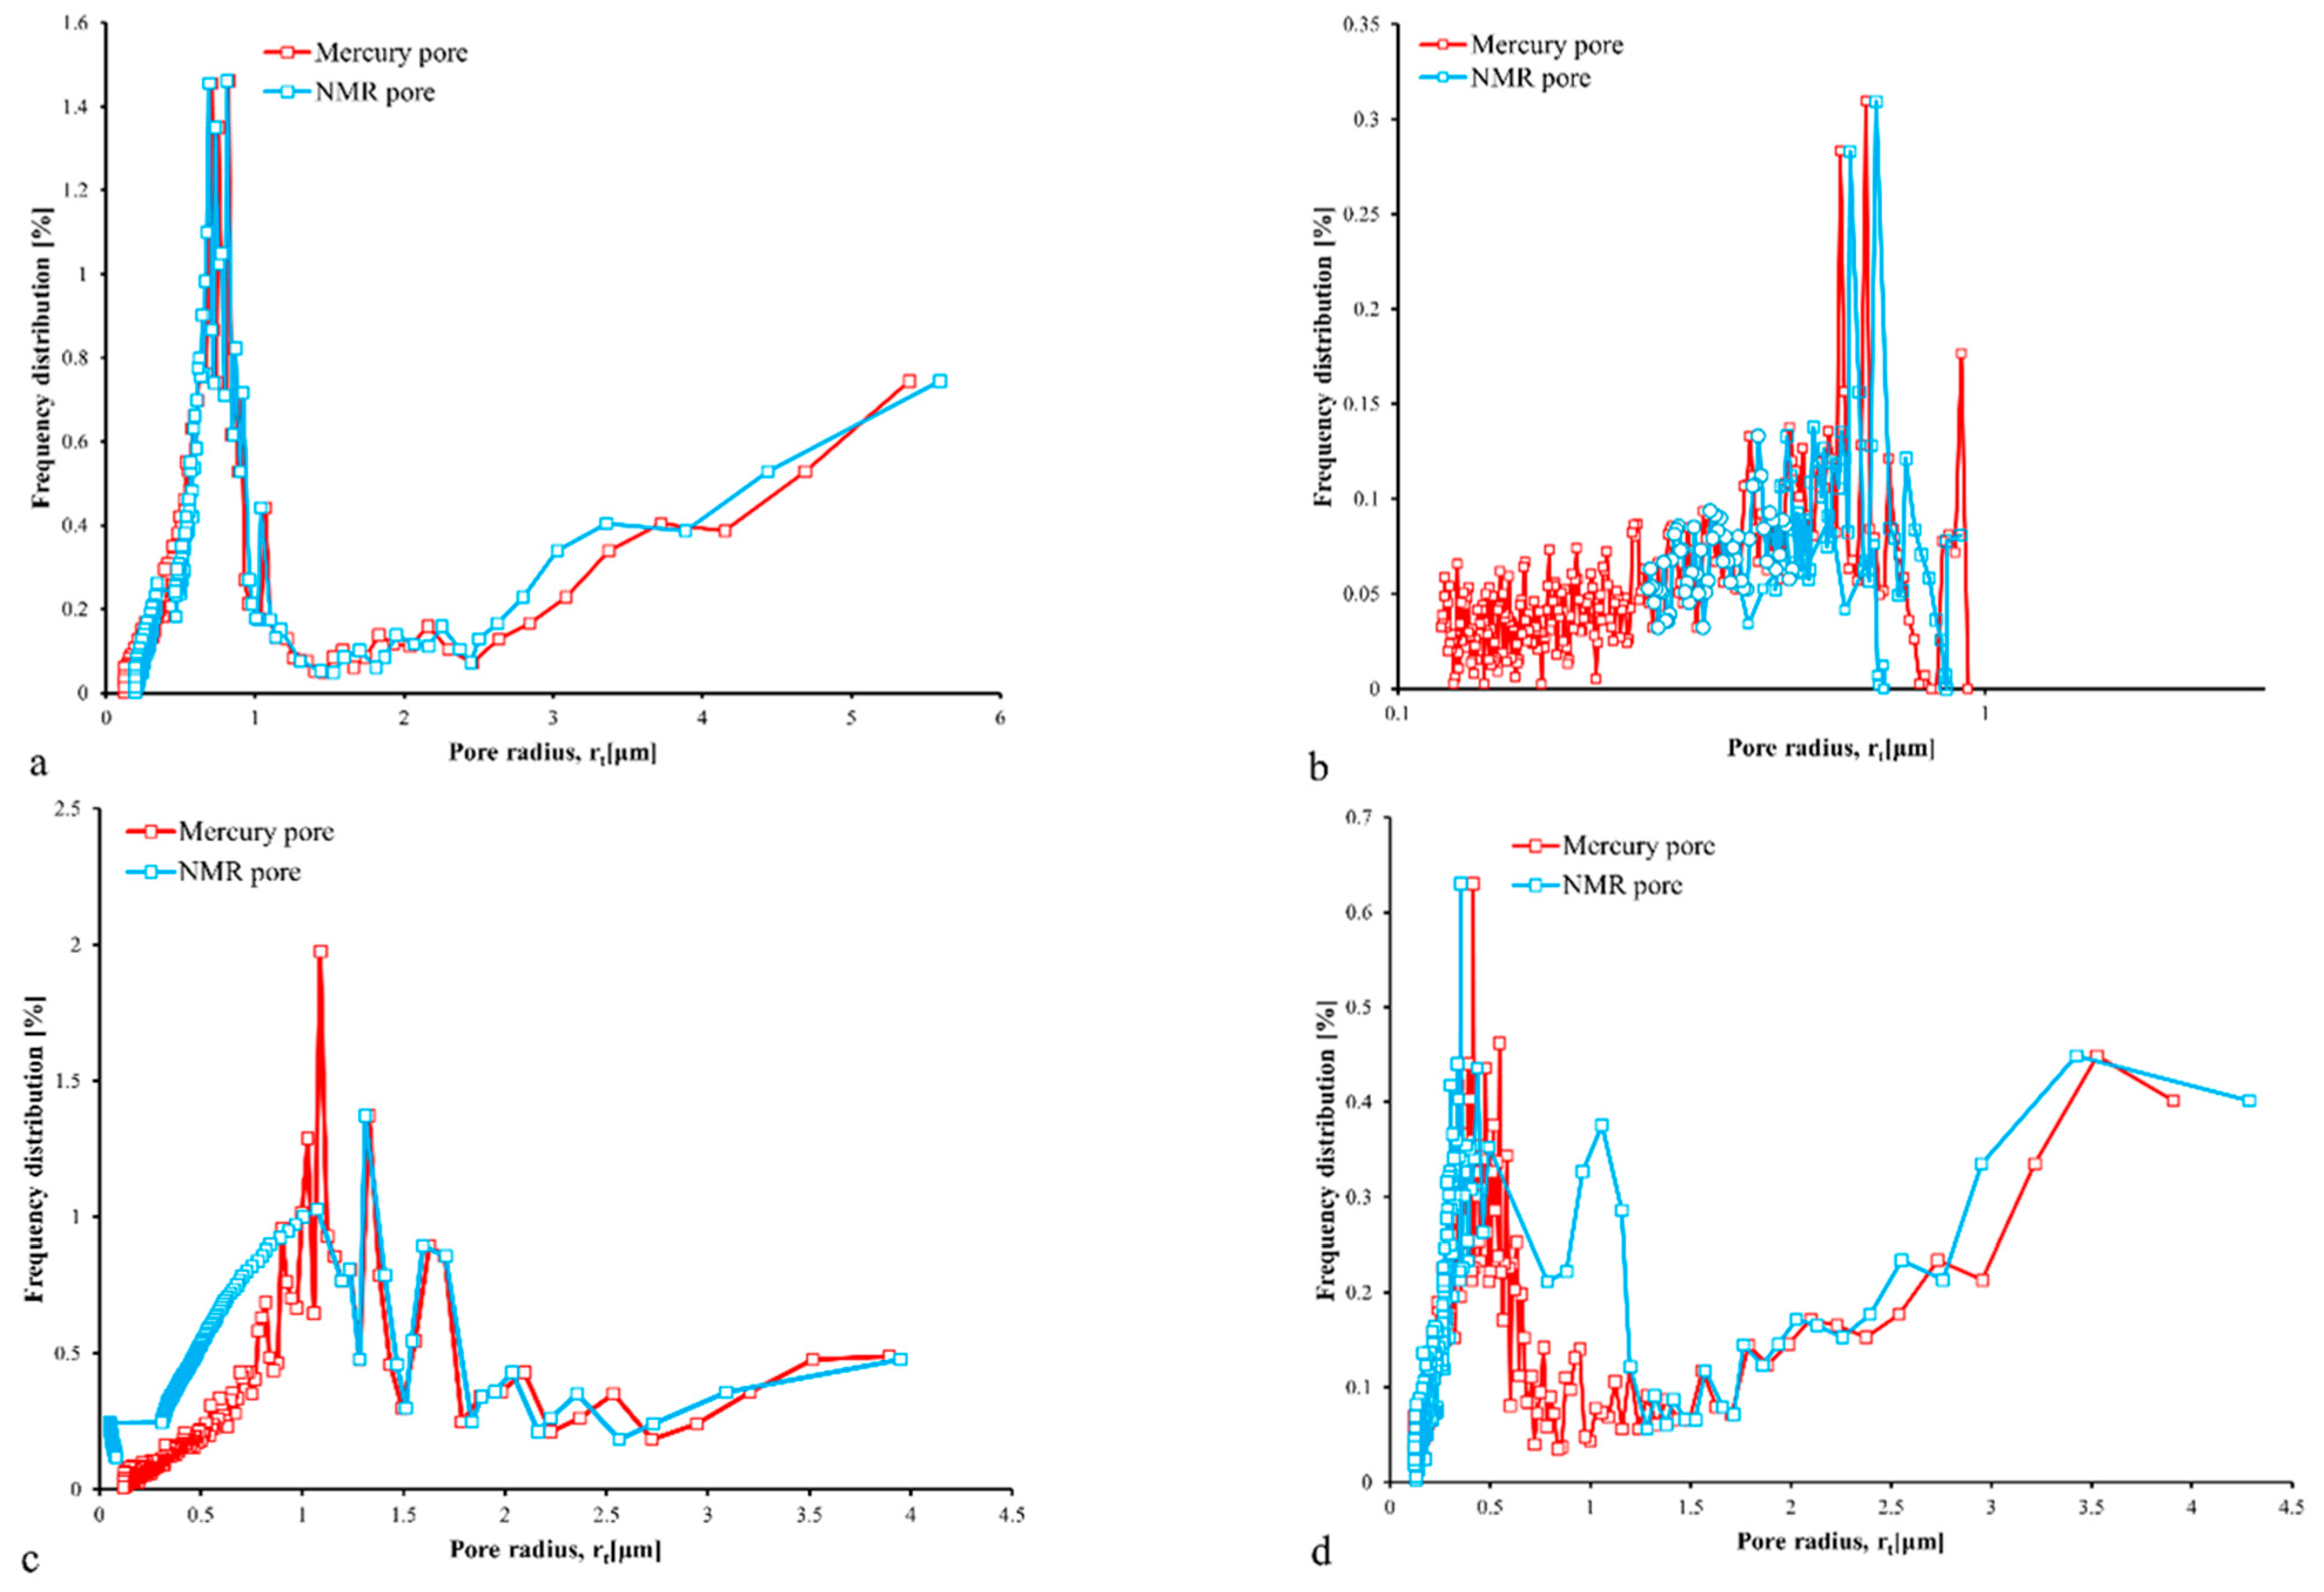
As shown in Figure 9, the pore–throat size distribution inferred by converting NMR T2 spectra using the spherical formulation exhibits a broadly comparable pattern to that obtained from constant-rate mercury injection. This observation is consistent with the findings of Huang et al. [14], although their analysis was conducted under a cylindrical pore-geometry assumption. Nevertheless, the non-uniform distribution of the underlying data skews the conversion toward the small-radius domain, resulting in an overestimation of fine throats relative to larger ones. In particular, the proportion of data points falling within 0–1 μm amounts to 89.56%, 89.90%, 90.57%, 90.57%, 89.23%, 88.55%, and 90.24% for the seven samples, respectively.
Figure 9.
Comparison between NMR T2 spectra from the spherical model and pore-throat size distribution obtained by constant-rate mercury intrusion for samples (a) Z91, (b) Z92, (c) Z41, (d) Z42, (e) Z11, (f) S21, and (g) S22.
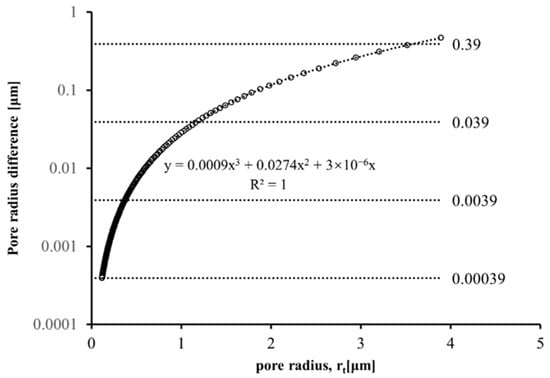
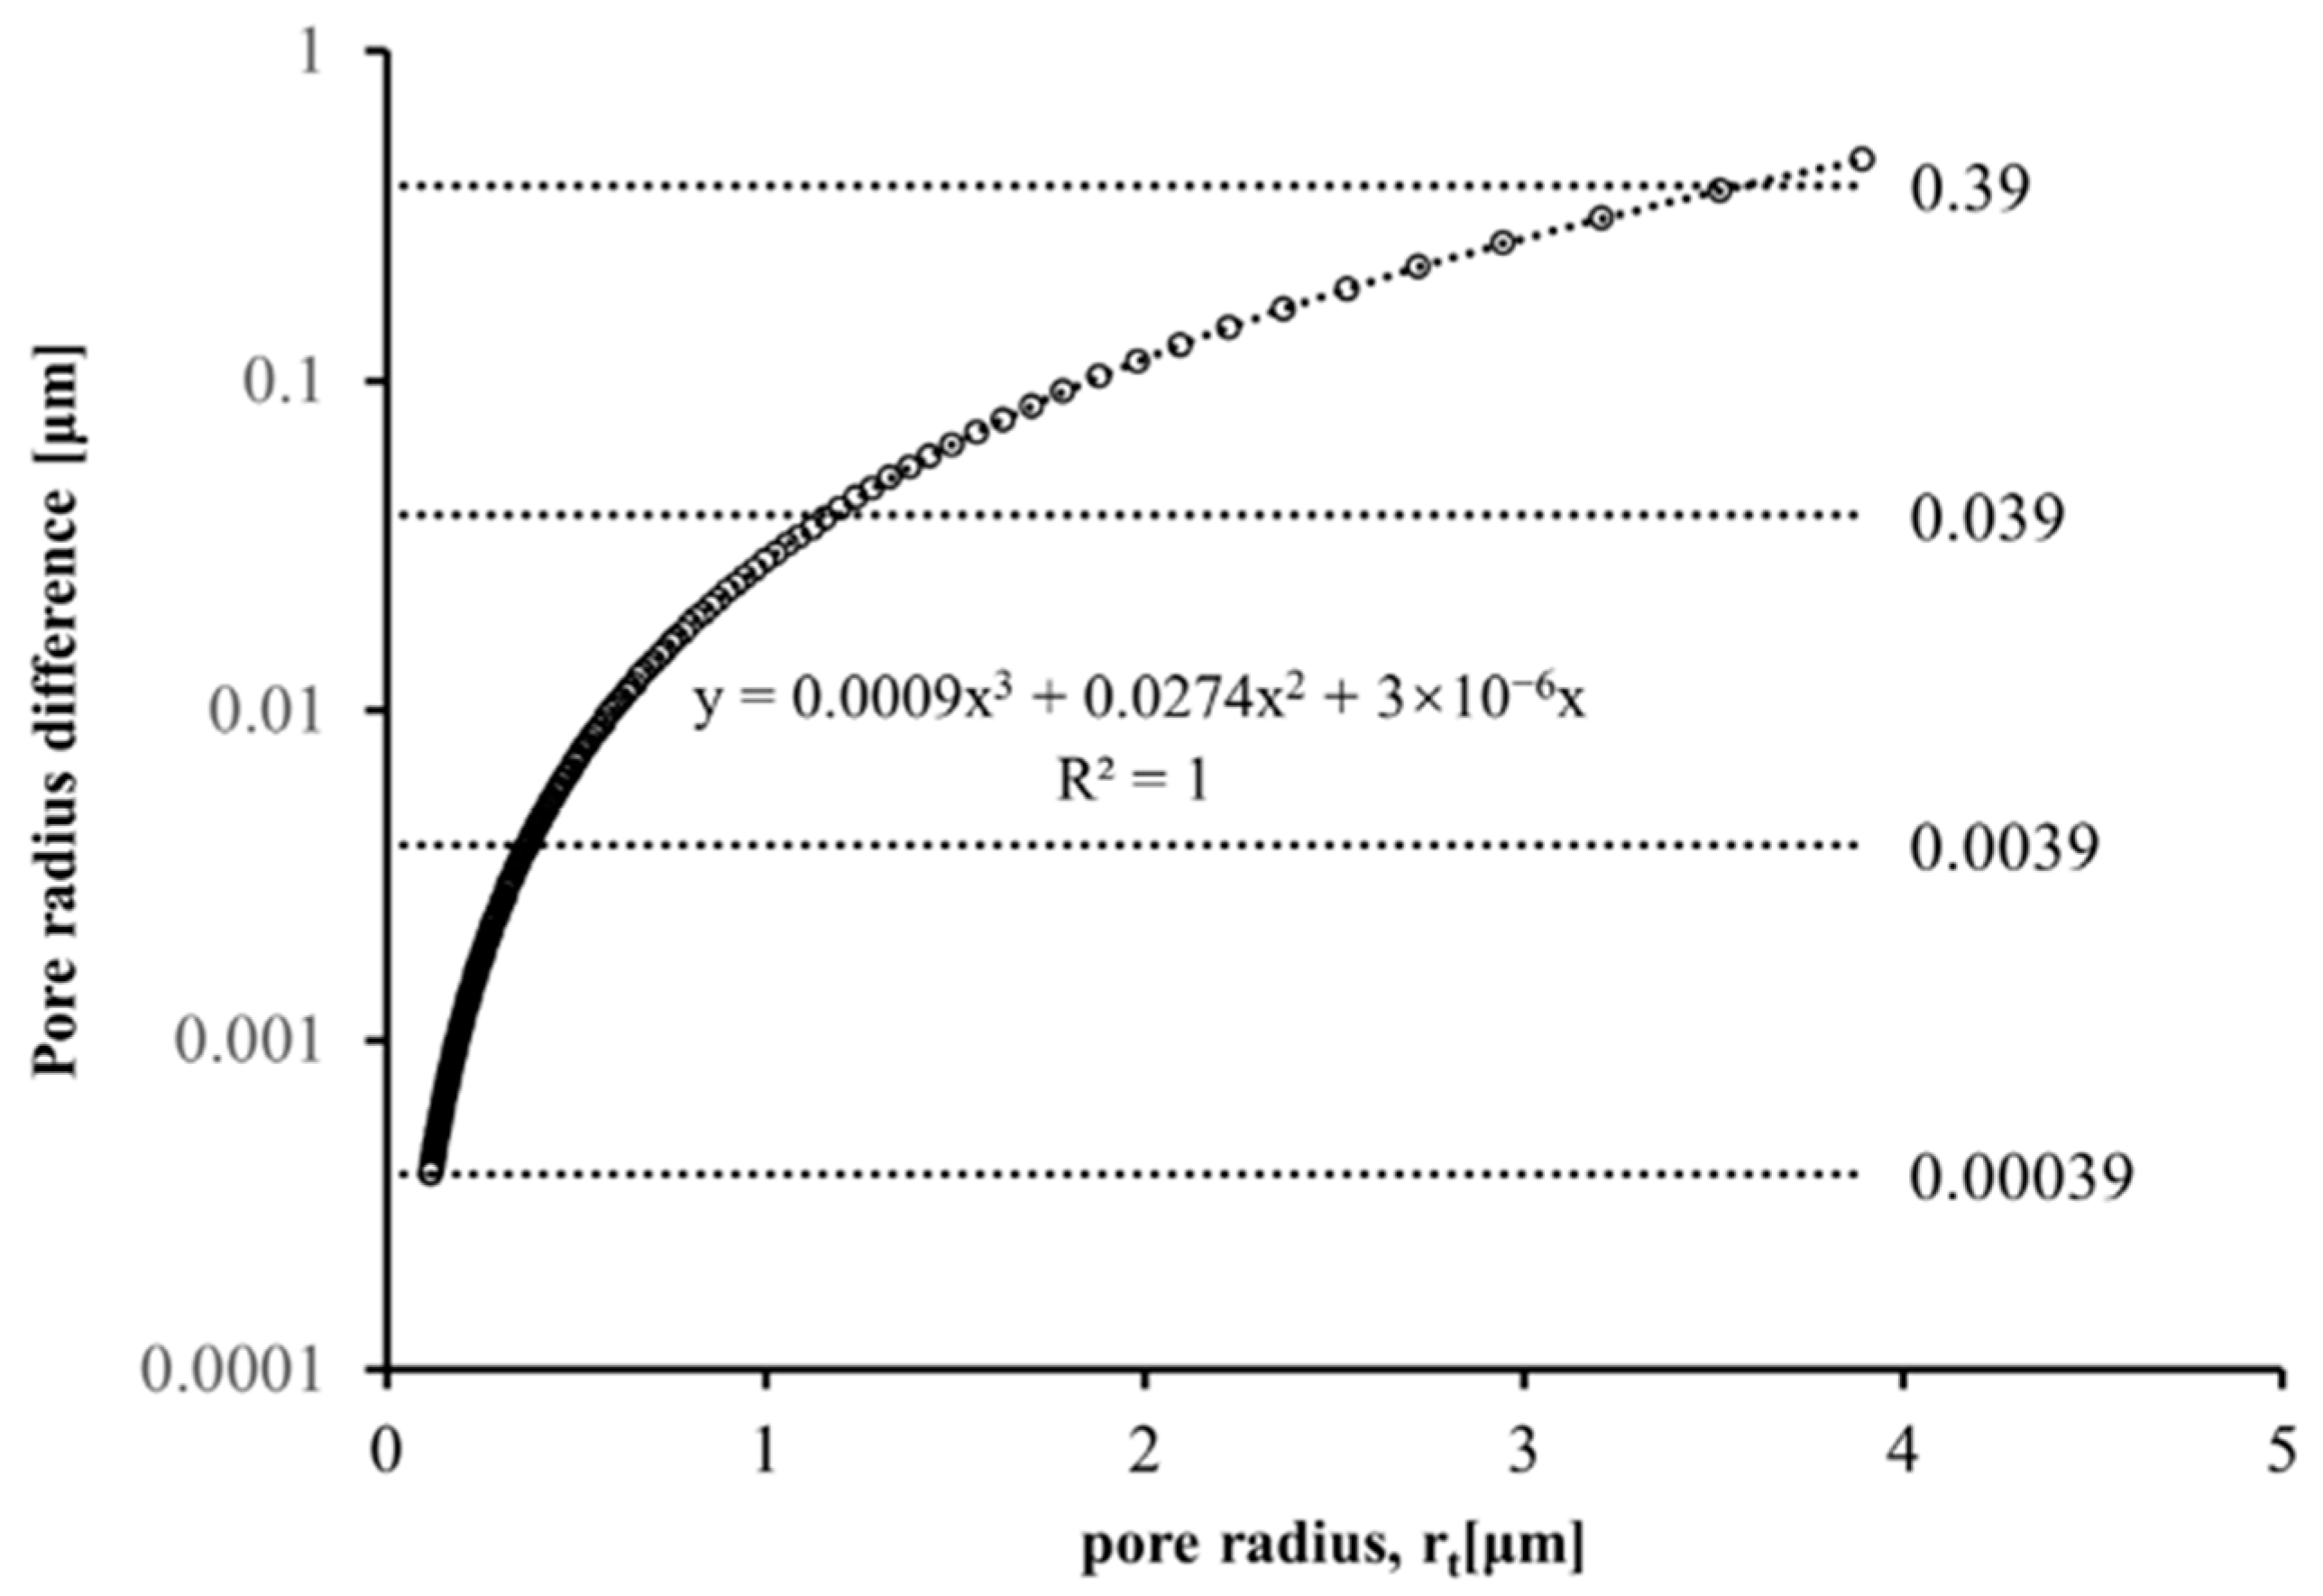
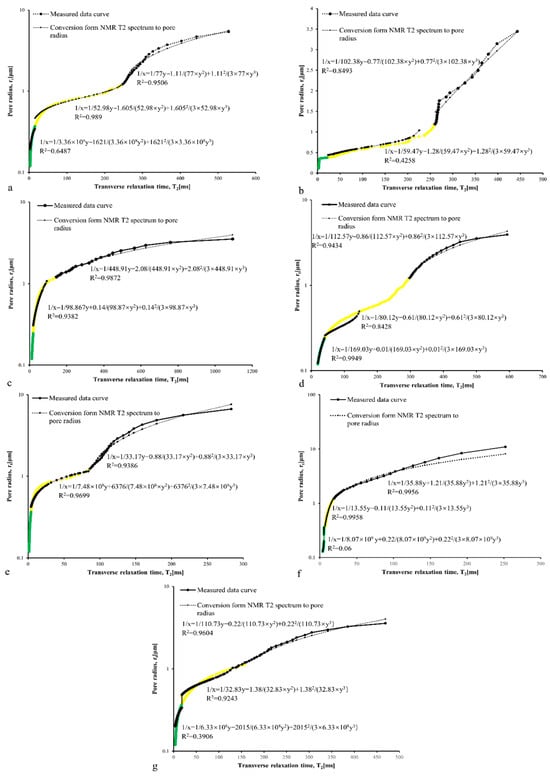
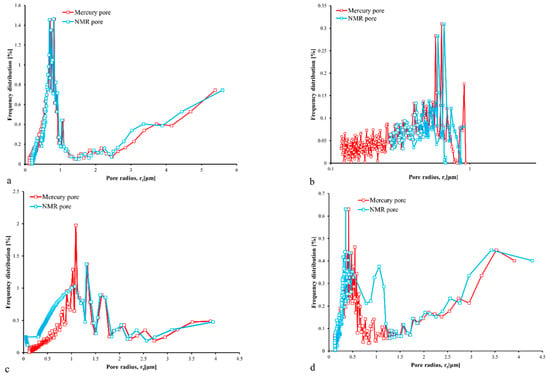
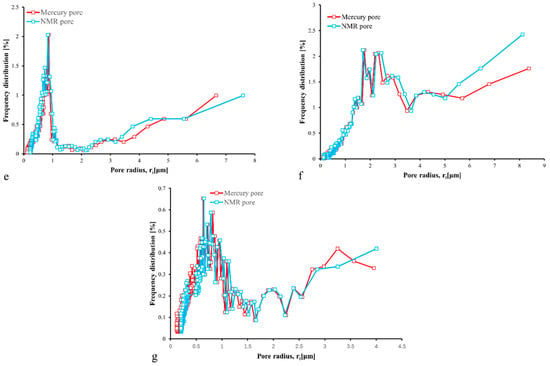
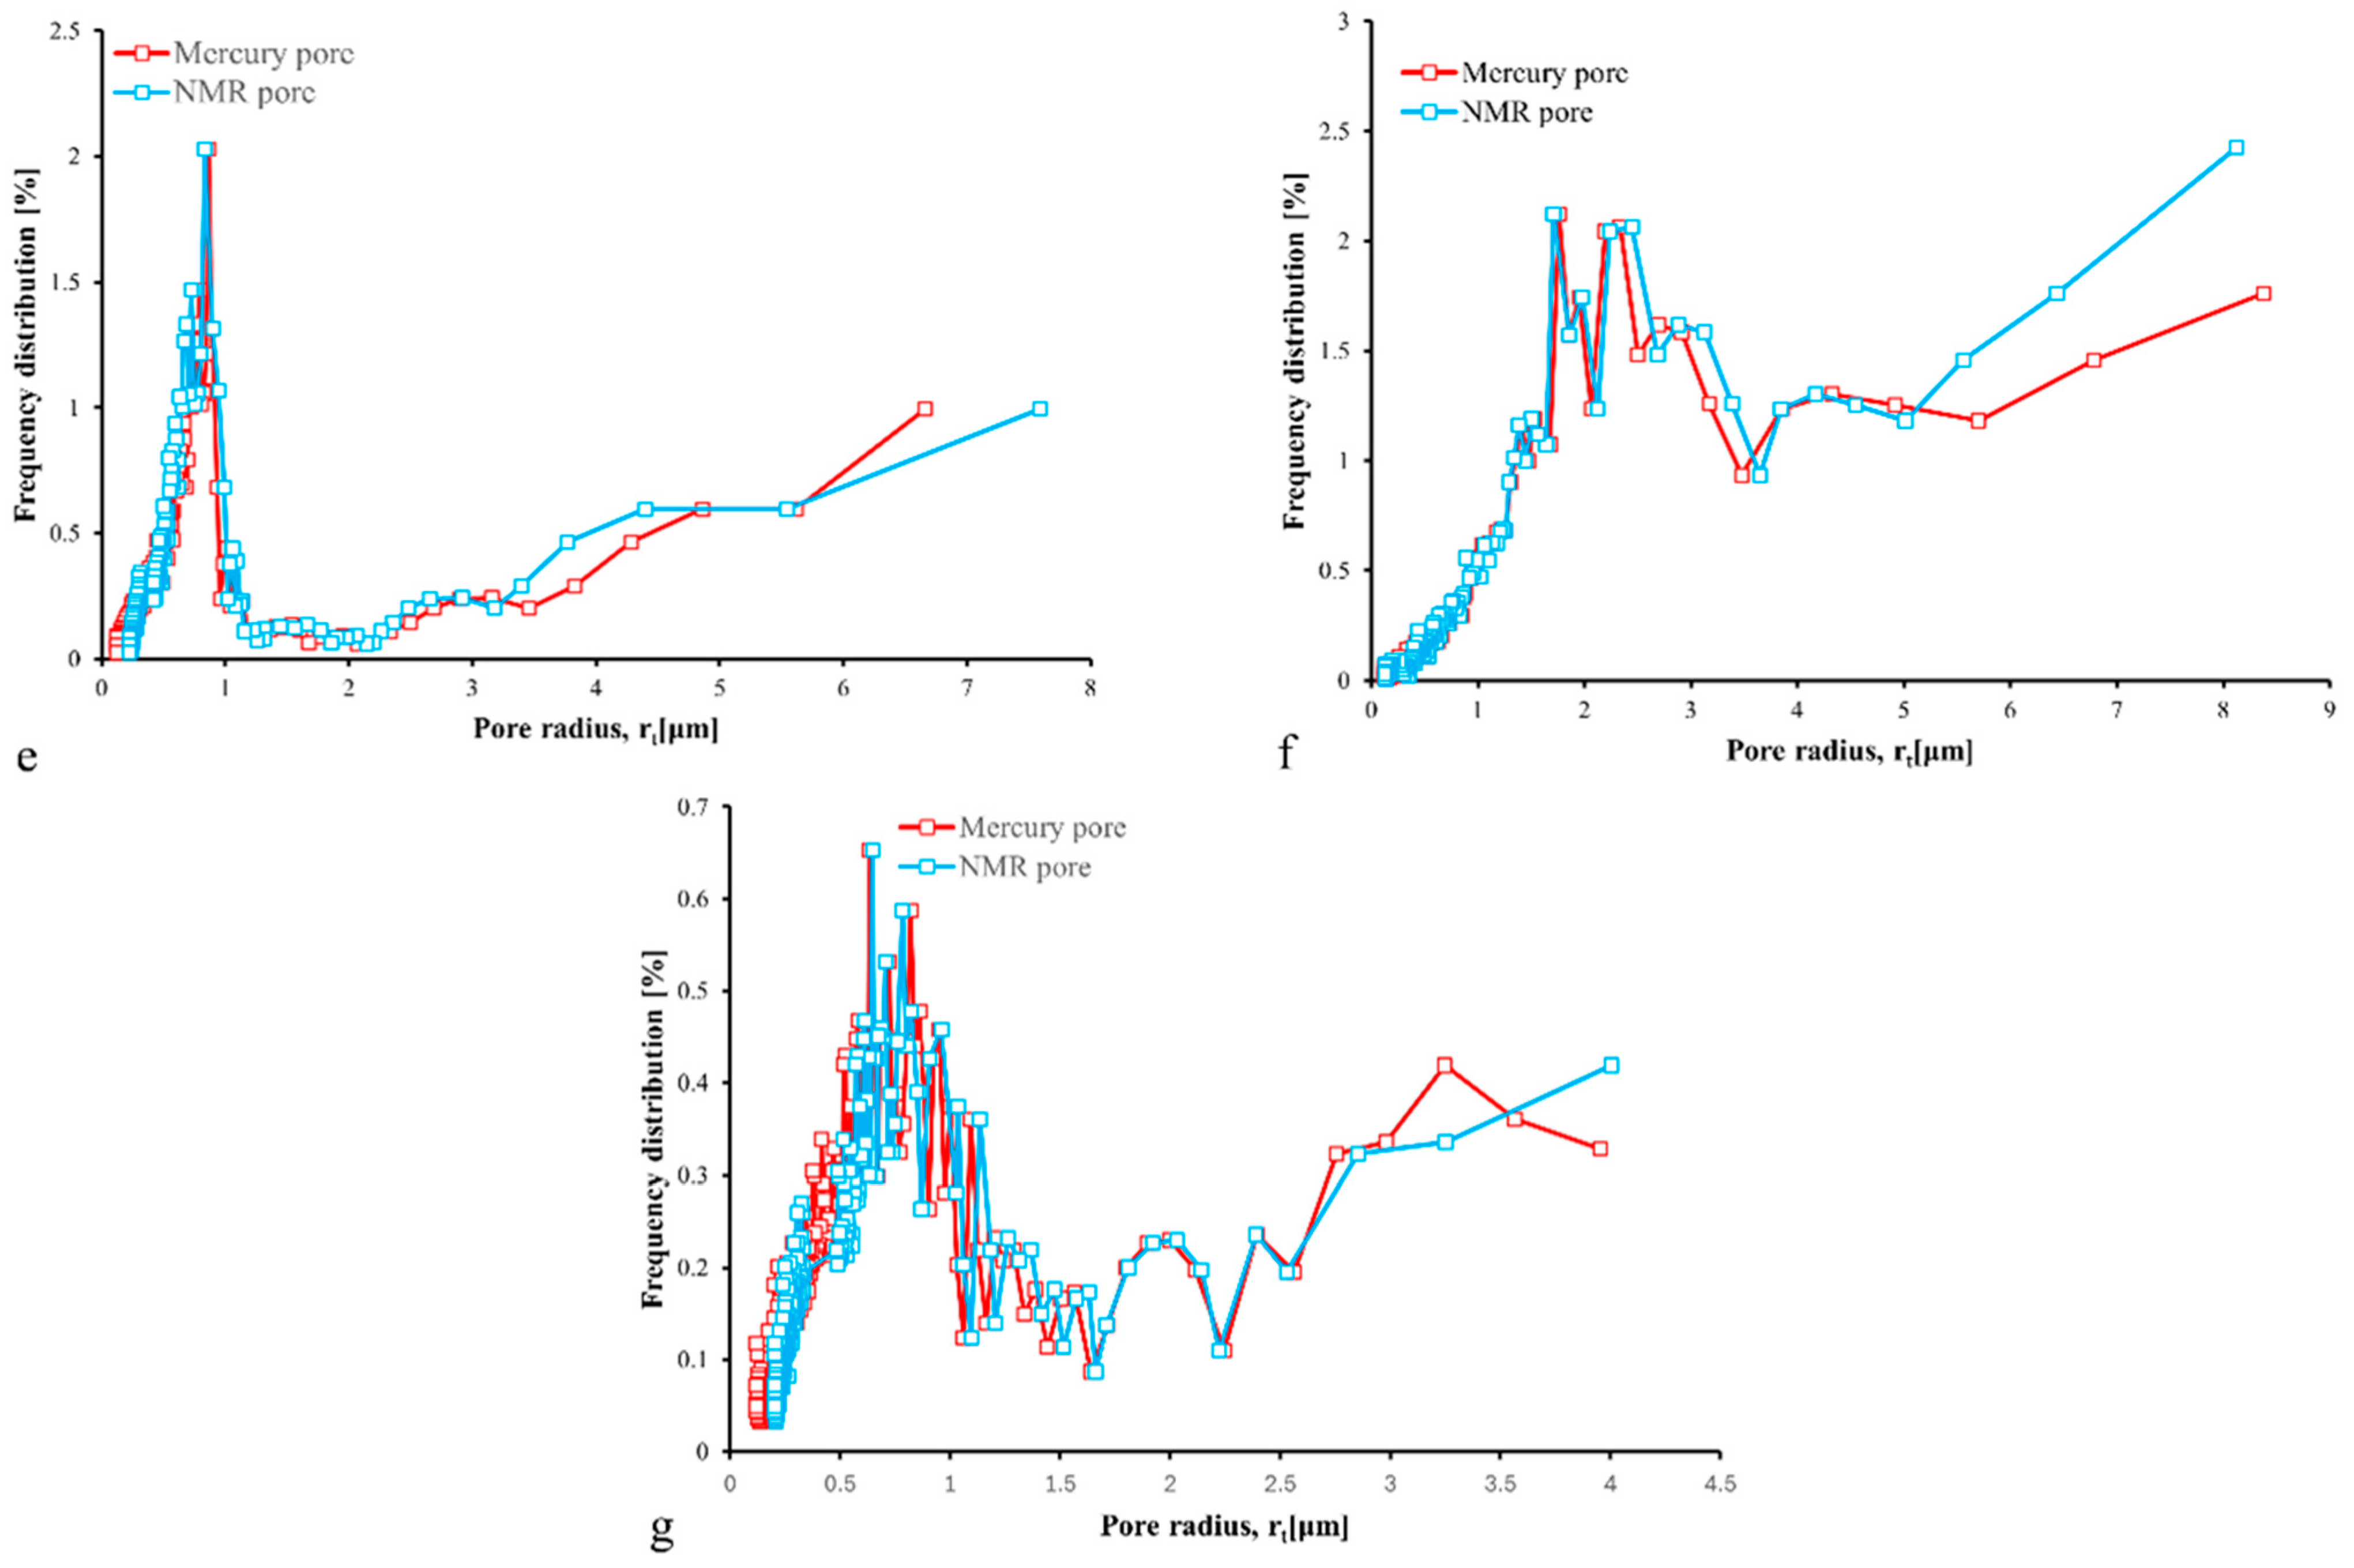
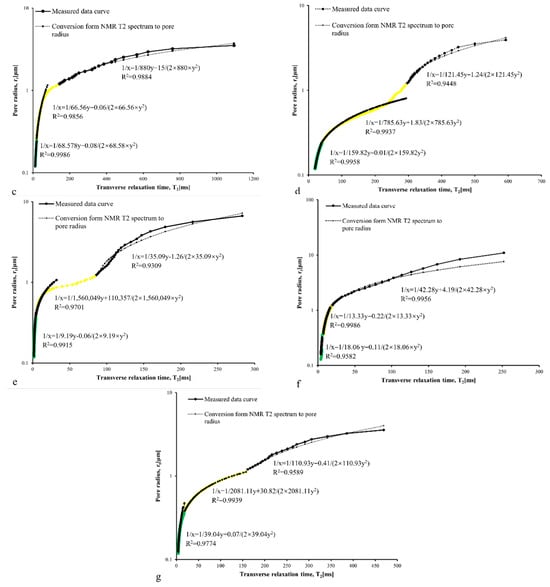
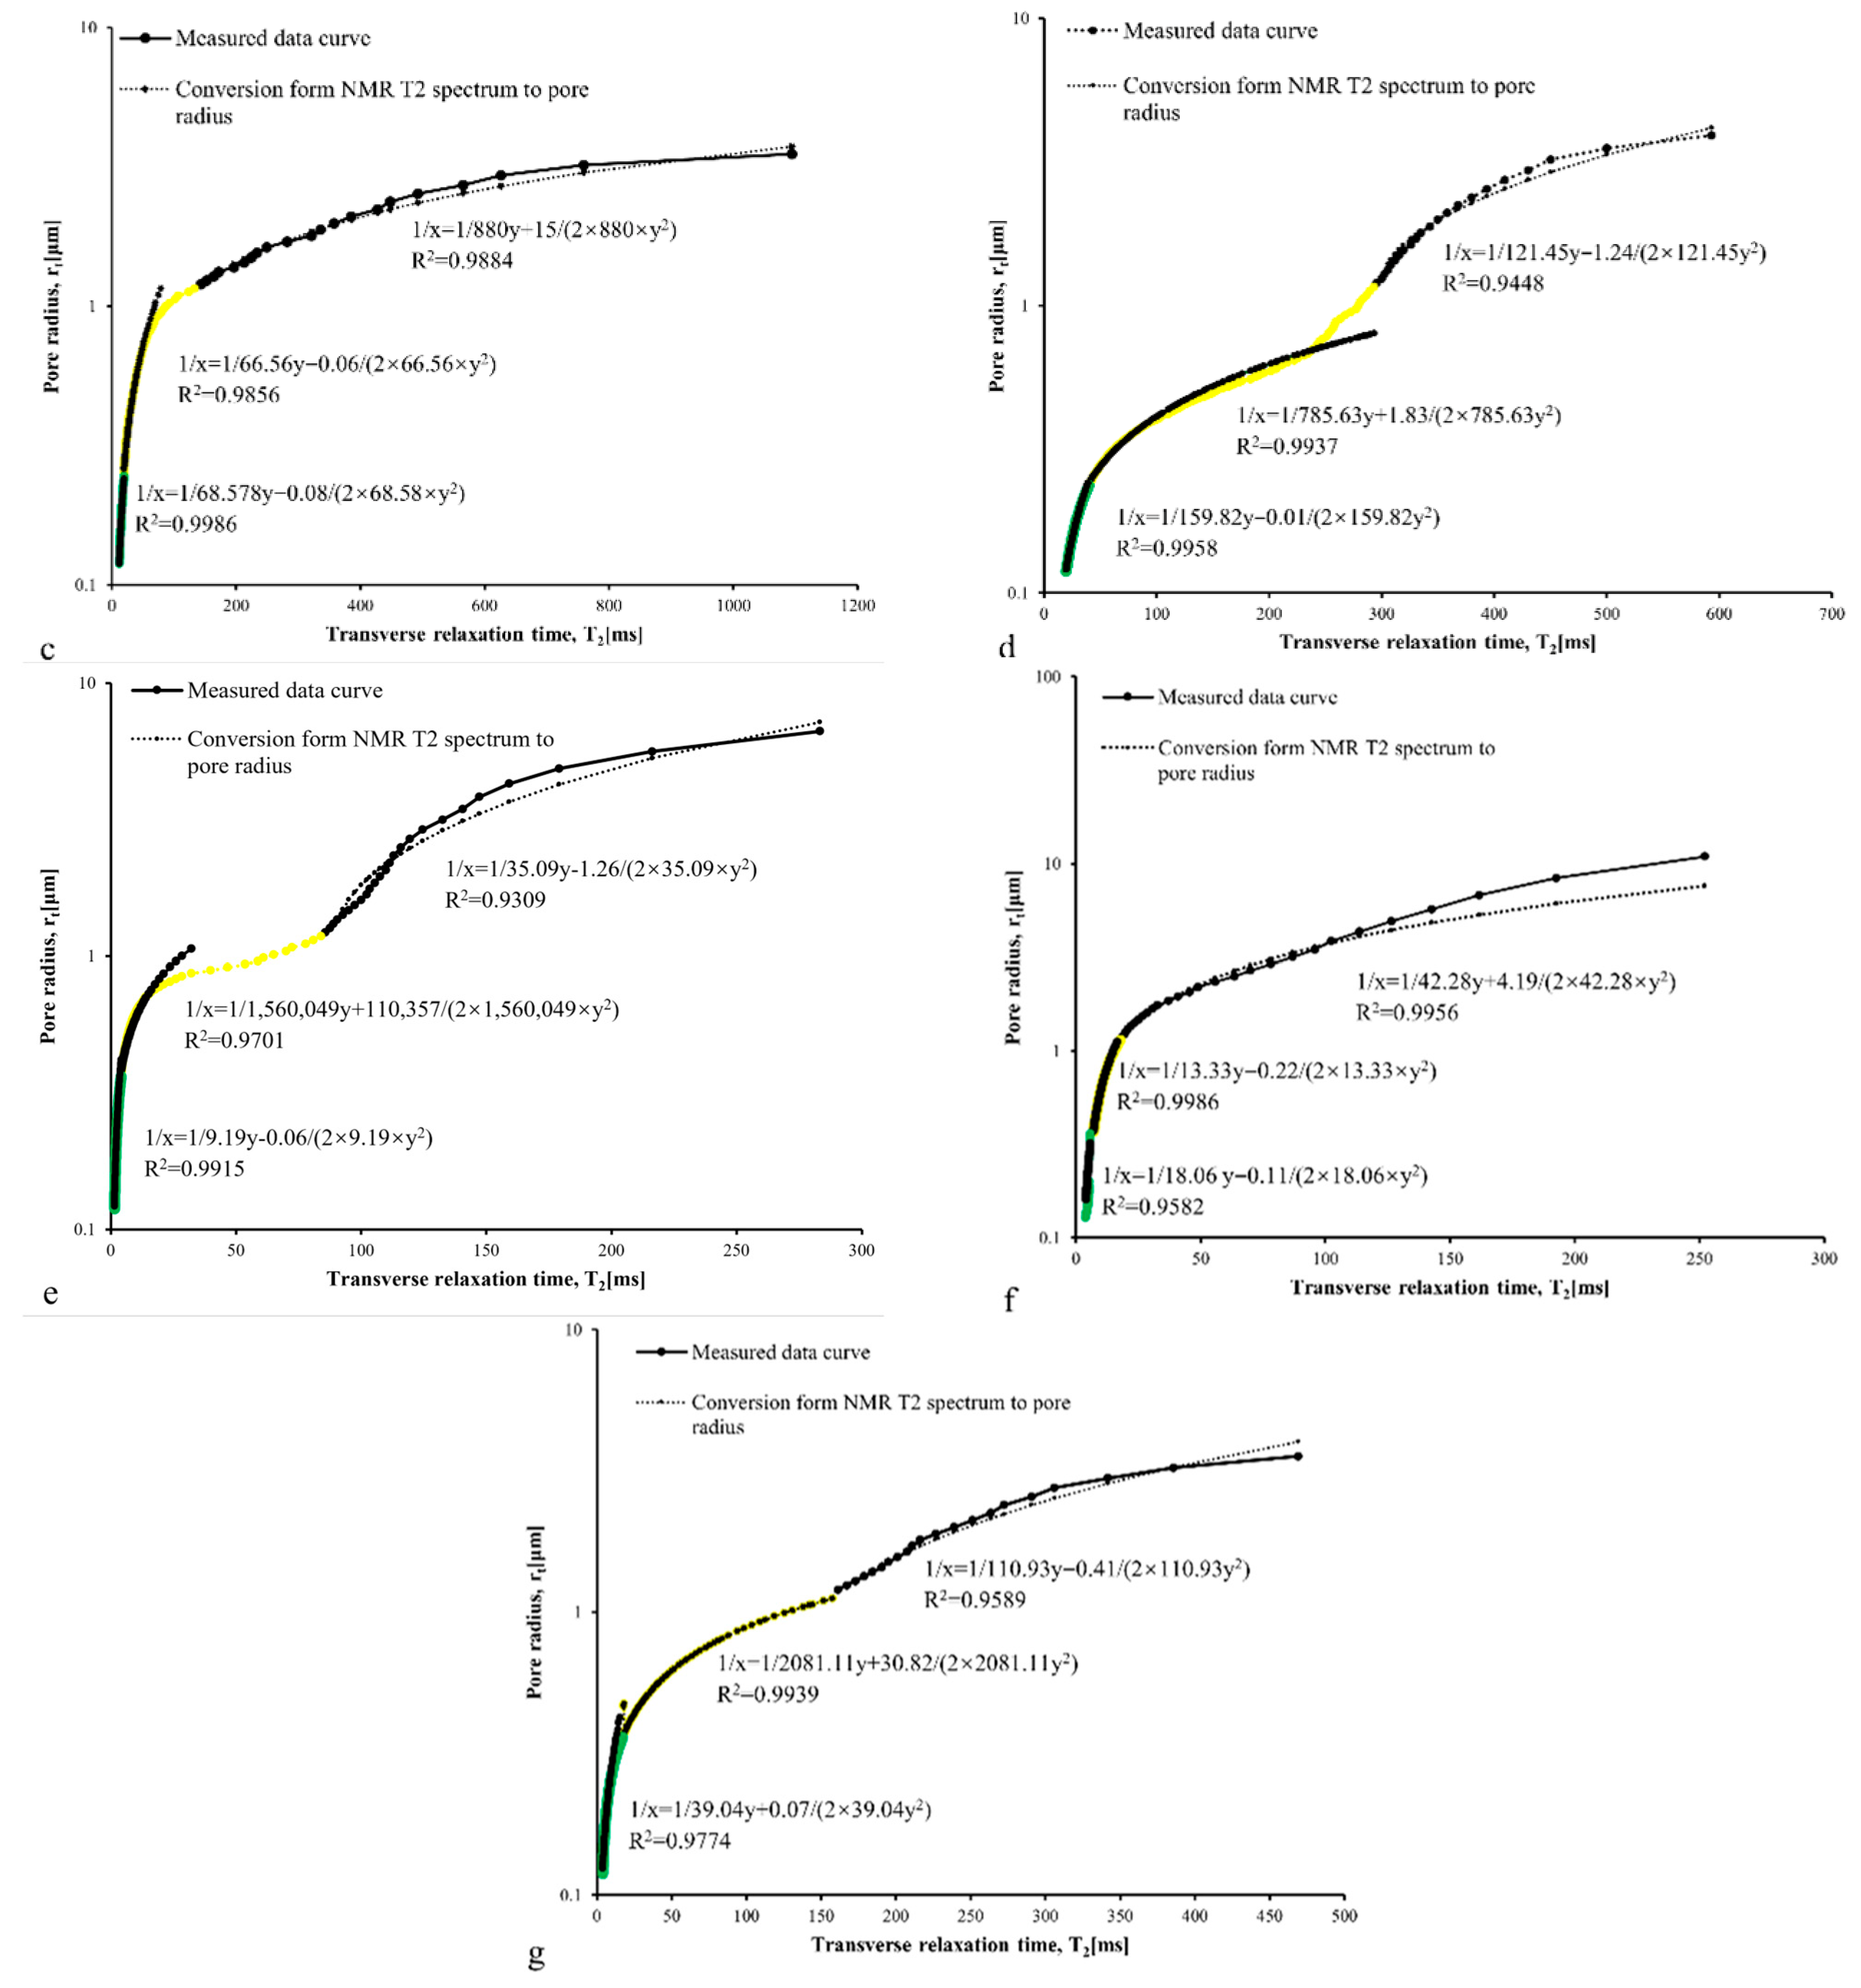
Analysis demonstrates that the inversion error of pore-throat radius is markedly pronounced within the large-radius tail region. As pore-throat size increases, the number of valid observational points per unit radius interval gradually decreases, resulting in distinct data sparsity. To mitigate the adverse effects of insufficient data in the large pore-throat range on regression stability, the dataset was hierarchically partitioned into logarithmic intervals in descending order of magnitude, with the maximum pore-throat radius defined as the upper boundary. The corresponding threshold values were set as 0.00039 μm, 0.0039 μm, 0.039 μm, and 0.39 μm. The segmented conversion strategy effectively alleviates the issue of sparse data distribution throughout the fitting process, compensates for inadequate sampling in the large-radius domain, and further improves the stability and quantitative consistency of the overall fitting results. (Figure 10). Revisiting Equation (19), the NMR T2 data were then paired with MIP-derived pore–throat radii, and the new parameters h and C were estimated via nonlinear regression in Origin 2019b (Table 5), yielding the optimized fitting curves shown in Figure 11. Notably, Figure 12 further indicates that the pore–throat size distribution derived from the spherical-model T2 conversion exhibits markedly enhanced comparability with the distribution obtained from constant-rate mercury injection. This observation is consistent with the results reported by Huang et al. [14] using a cylindrical model. Overall, these results suggest that both the cylindrical and the spherical models developed here can convert NMR T2 spectra into pore-radius distributions with relatively good agreement. Following Equation (14), the same workflow was applied to derive the pore–throat radius distribution from the NMR T2 spectrum under the cylindrical pore-geometry assumption (Figure 13). The corresponding parameters h and C were again obtained by nonlinear fitting in Origin 2019b, as summarized in Table 6. The results in Figure 14 demonstrate that although the pore-throat size distribution converted from the T2 spectrum based on the cylindrical model is more consistent with the constant-rate mercury intrusion data, obvious data anomalies and deviations still exist in some samples.
Figure 10.
Segment classification of constant-rate mercury intrusion data for sample Z41, using the method proposed by [14].
Table 5.
Conversion parameters derived from the spherical model (comparative table).
Figure 11.
Fitting of the NMR T2 spectra to the pore-throat radius conversion parameters based on the new model for samples (a) Z91, (b) Z92, (c) Z41, (d) Z42, (e) Z11, (f) S21, and (g) S22. (The yellow and green lines indicate the hierarchical partition boundaries of the pore-throat size range, corresponding to different logarithmic intervals for segmented regression analysis).
Figure 12.
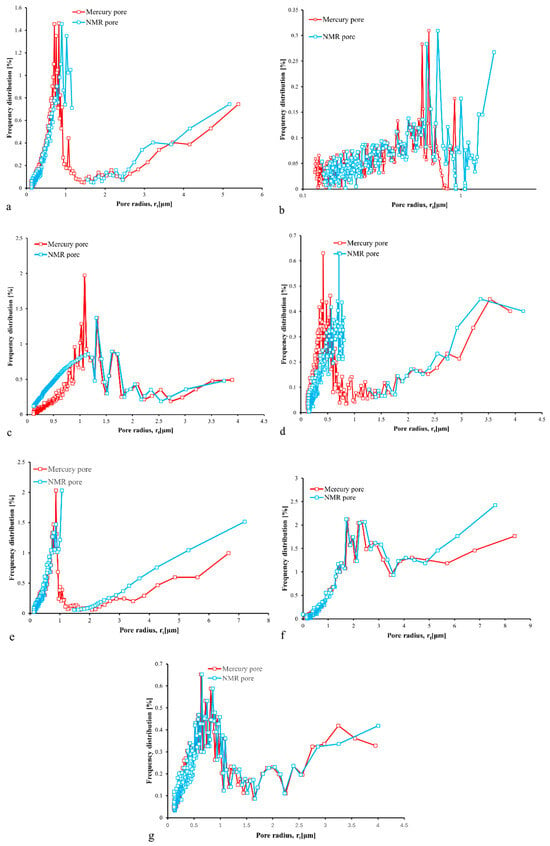
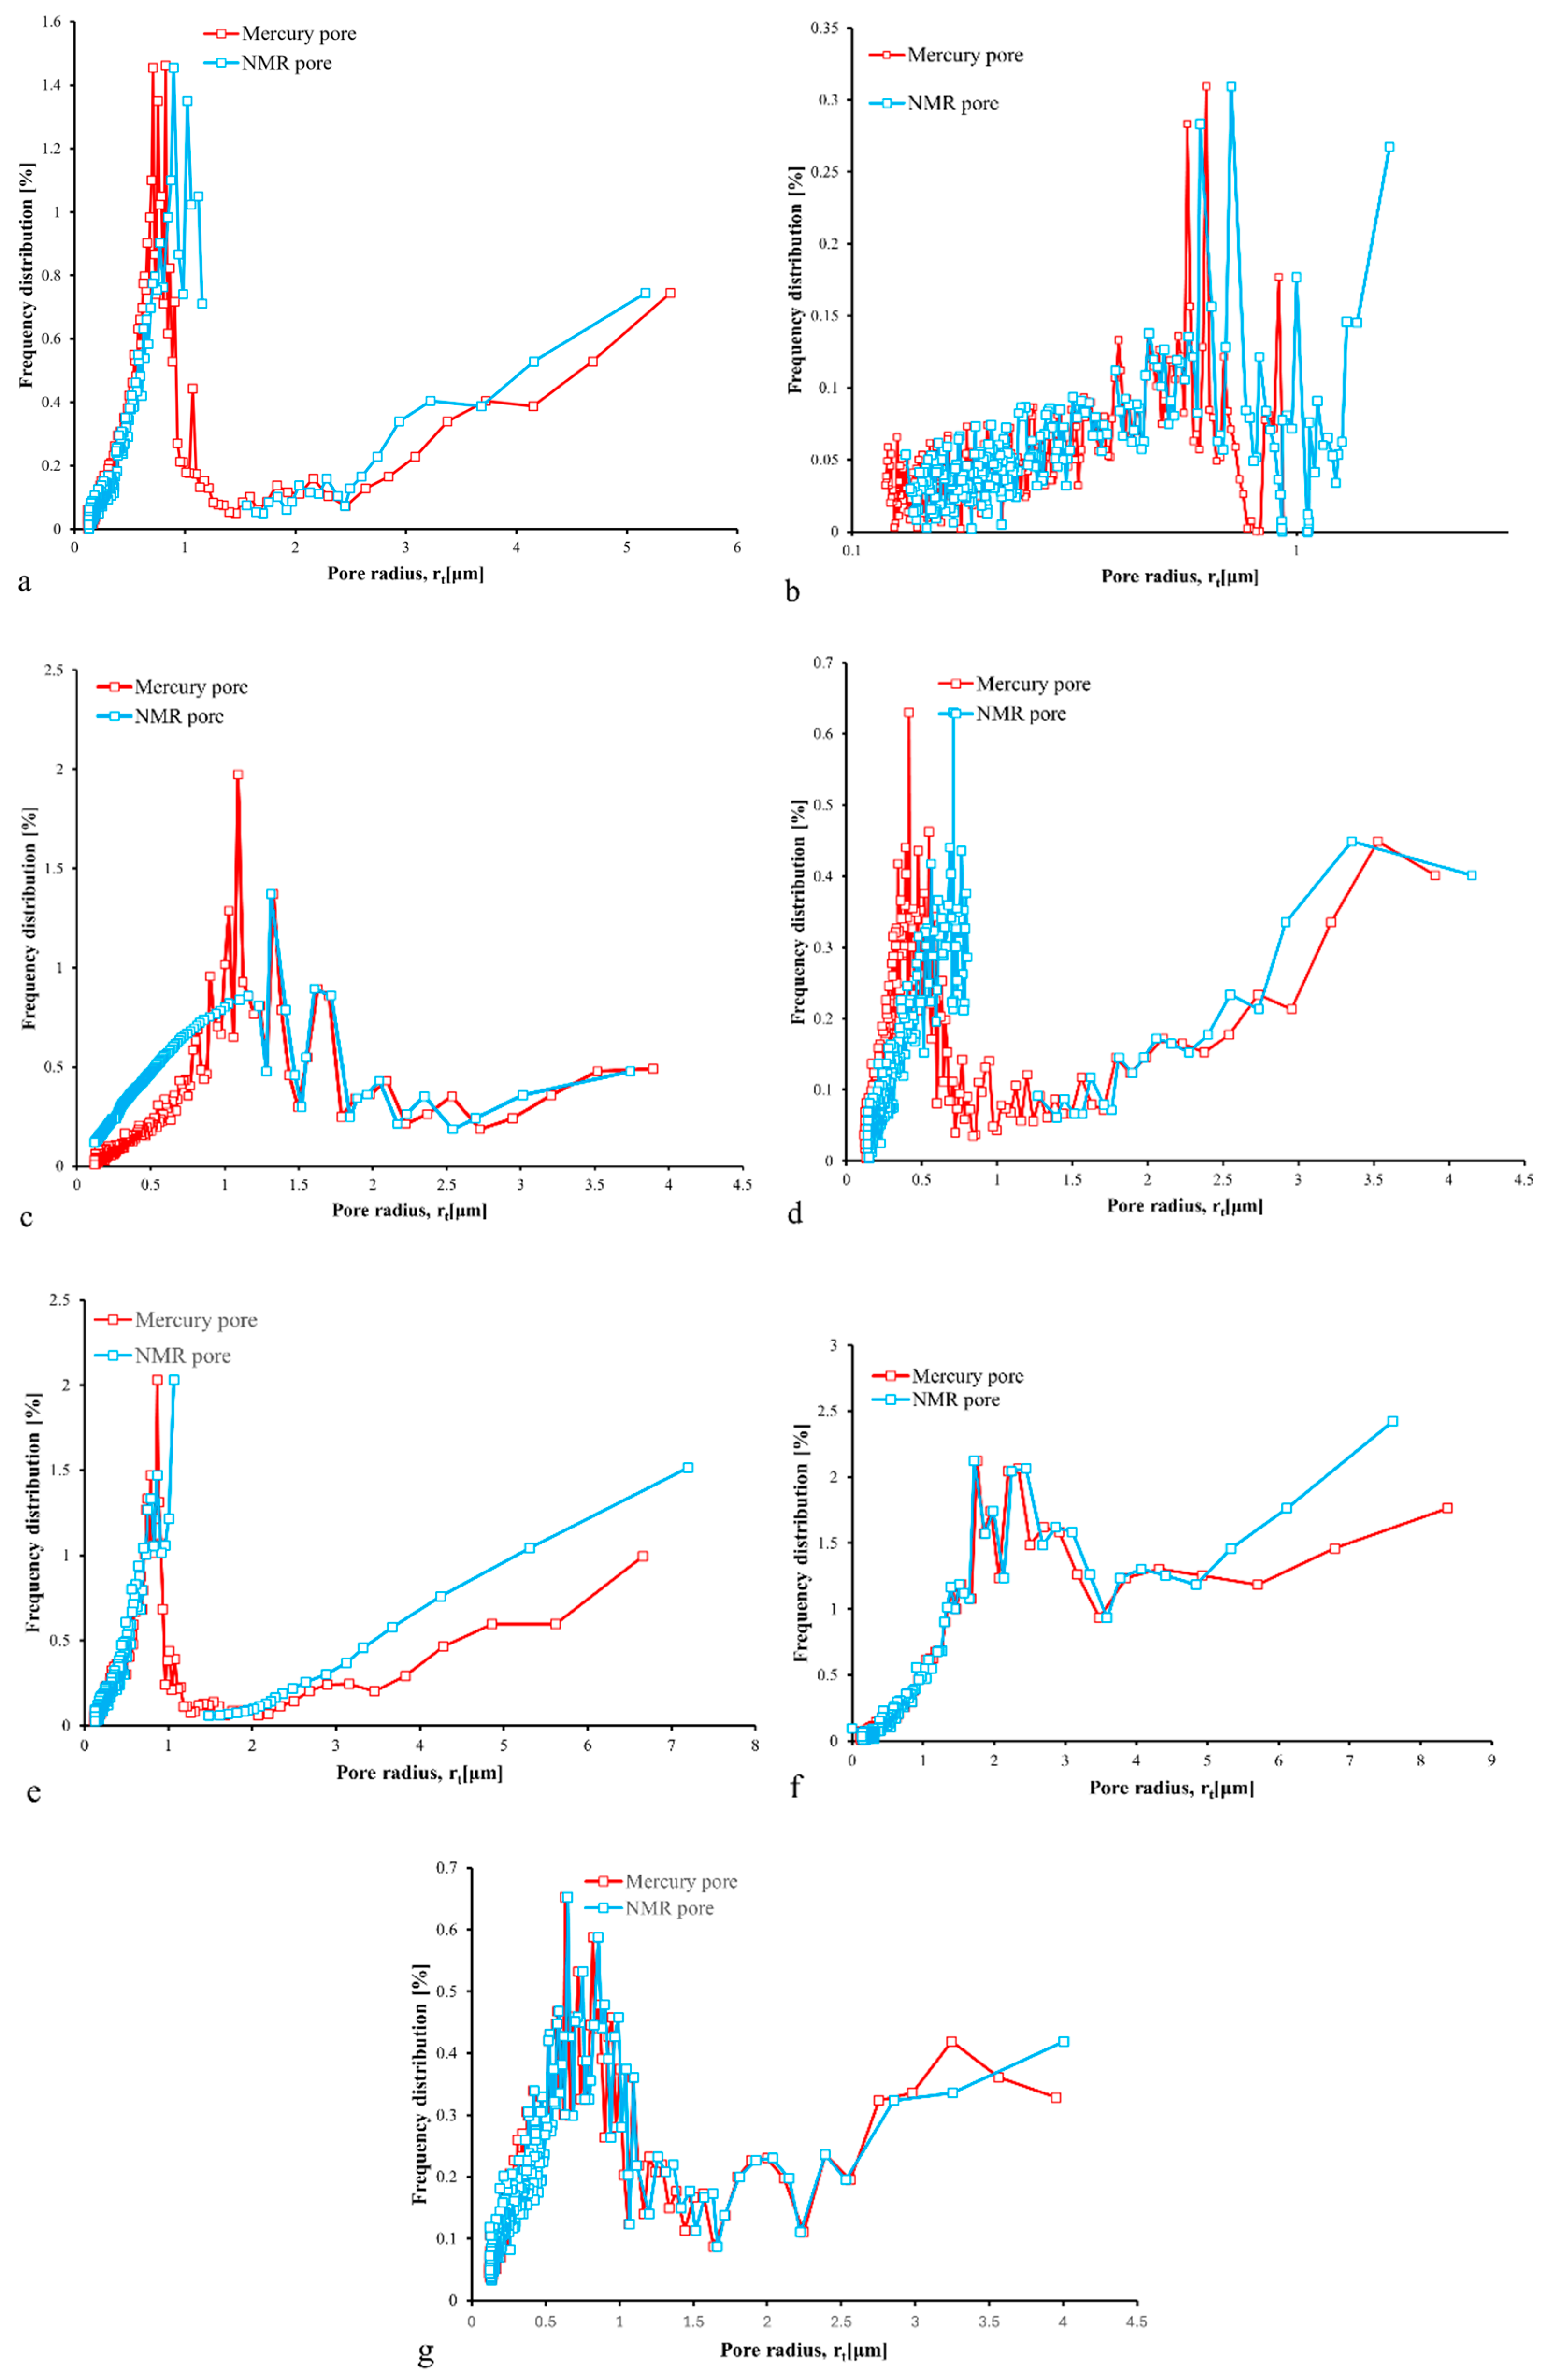
Comparison between NMR T2 spectra based on the spherical model and pore-throat size distribution obtained by the constant-rate mercury intrusion method for samples (a) Z91, (b) Z92, (c) Z41, (d) Z42, (e) Z11, (f) S21, and (g) S22.
Figure 13.
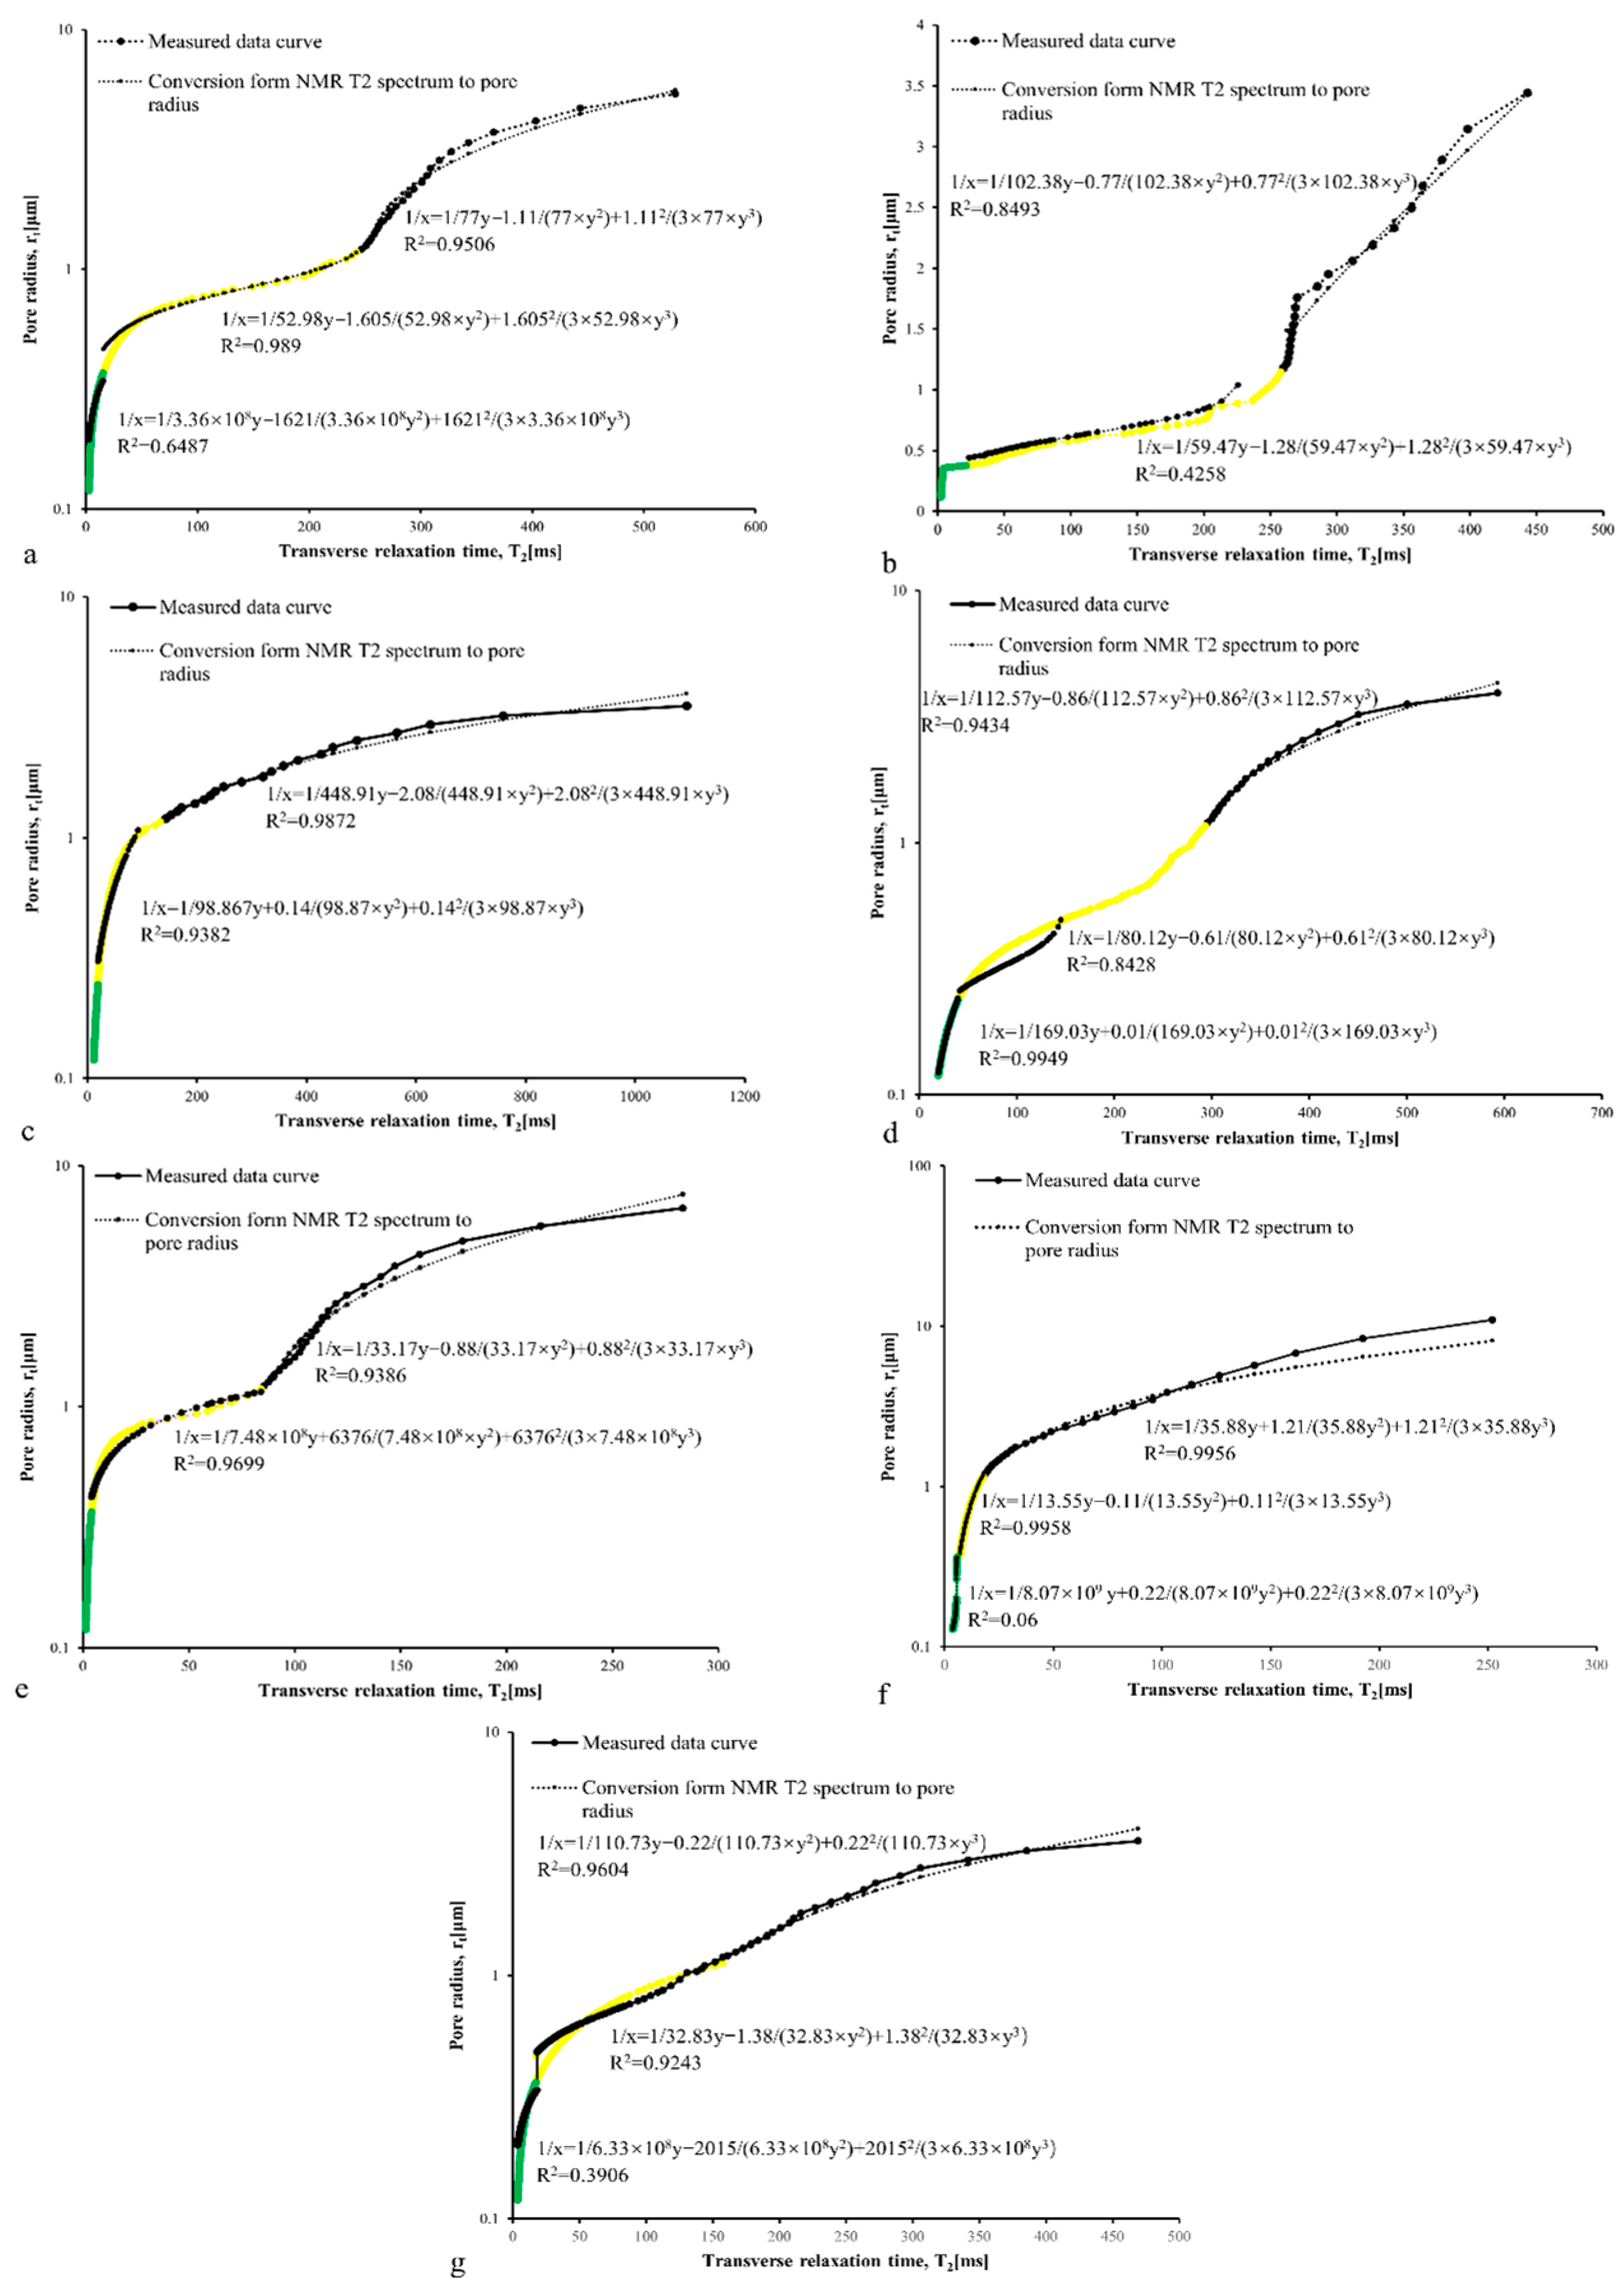
Fitting of the NMR T2 spectra to the pore-throat radius conversion parameters based on the cylindrical model for samples (a) Z91, (b) Z92, (c) Z41, (d) Z42, (e) Z11, (f) S21, and (g) S22. (The yellow and green lines indicate the hierarchical partition boundaries of the pore-throat size range, corresponding to different logarithmic intervals for segmented regression analysis).
Table 6.
Conversion parameters derived from the cylindrical model (comparative table).
Figure 14.
Comparison between NMR T2 spectra based on the cylindrical model and pore-throat size distributions obtained by constant-rate mercury intrusion for samples (a) Z91, (b) Z92, (c) Z41, (d) Z42, (e) Z11, (f) S21, and (g) S22.
4. Discussions
4.1. Clay Mineral Controls on Pore–Throat Structure
In tight sandstone systems, reservoir performance is governed to a large extent by the intricate interplay between clay mineral assemblages and the structure of the pore–throat network. The analyzed samples present obvious heterogeneities in both porosity and permeability. Such variability appears to be closely linked to the spatial distribution and mineralogical identity of constituents occupying the pore domain, demonstrating that mineral occurrence within the pore framework exerts a decisive control over the development and connectivity of pore space.
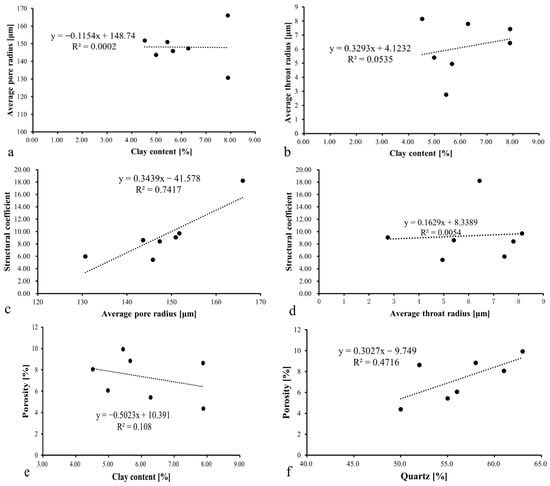
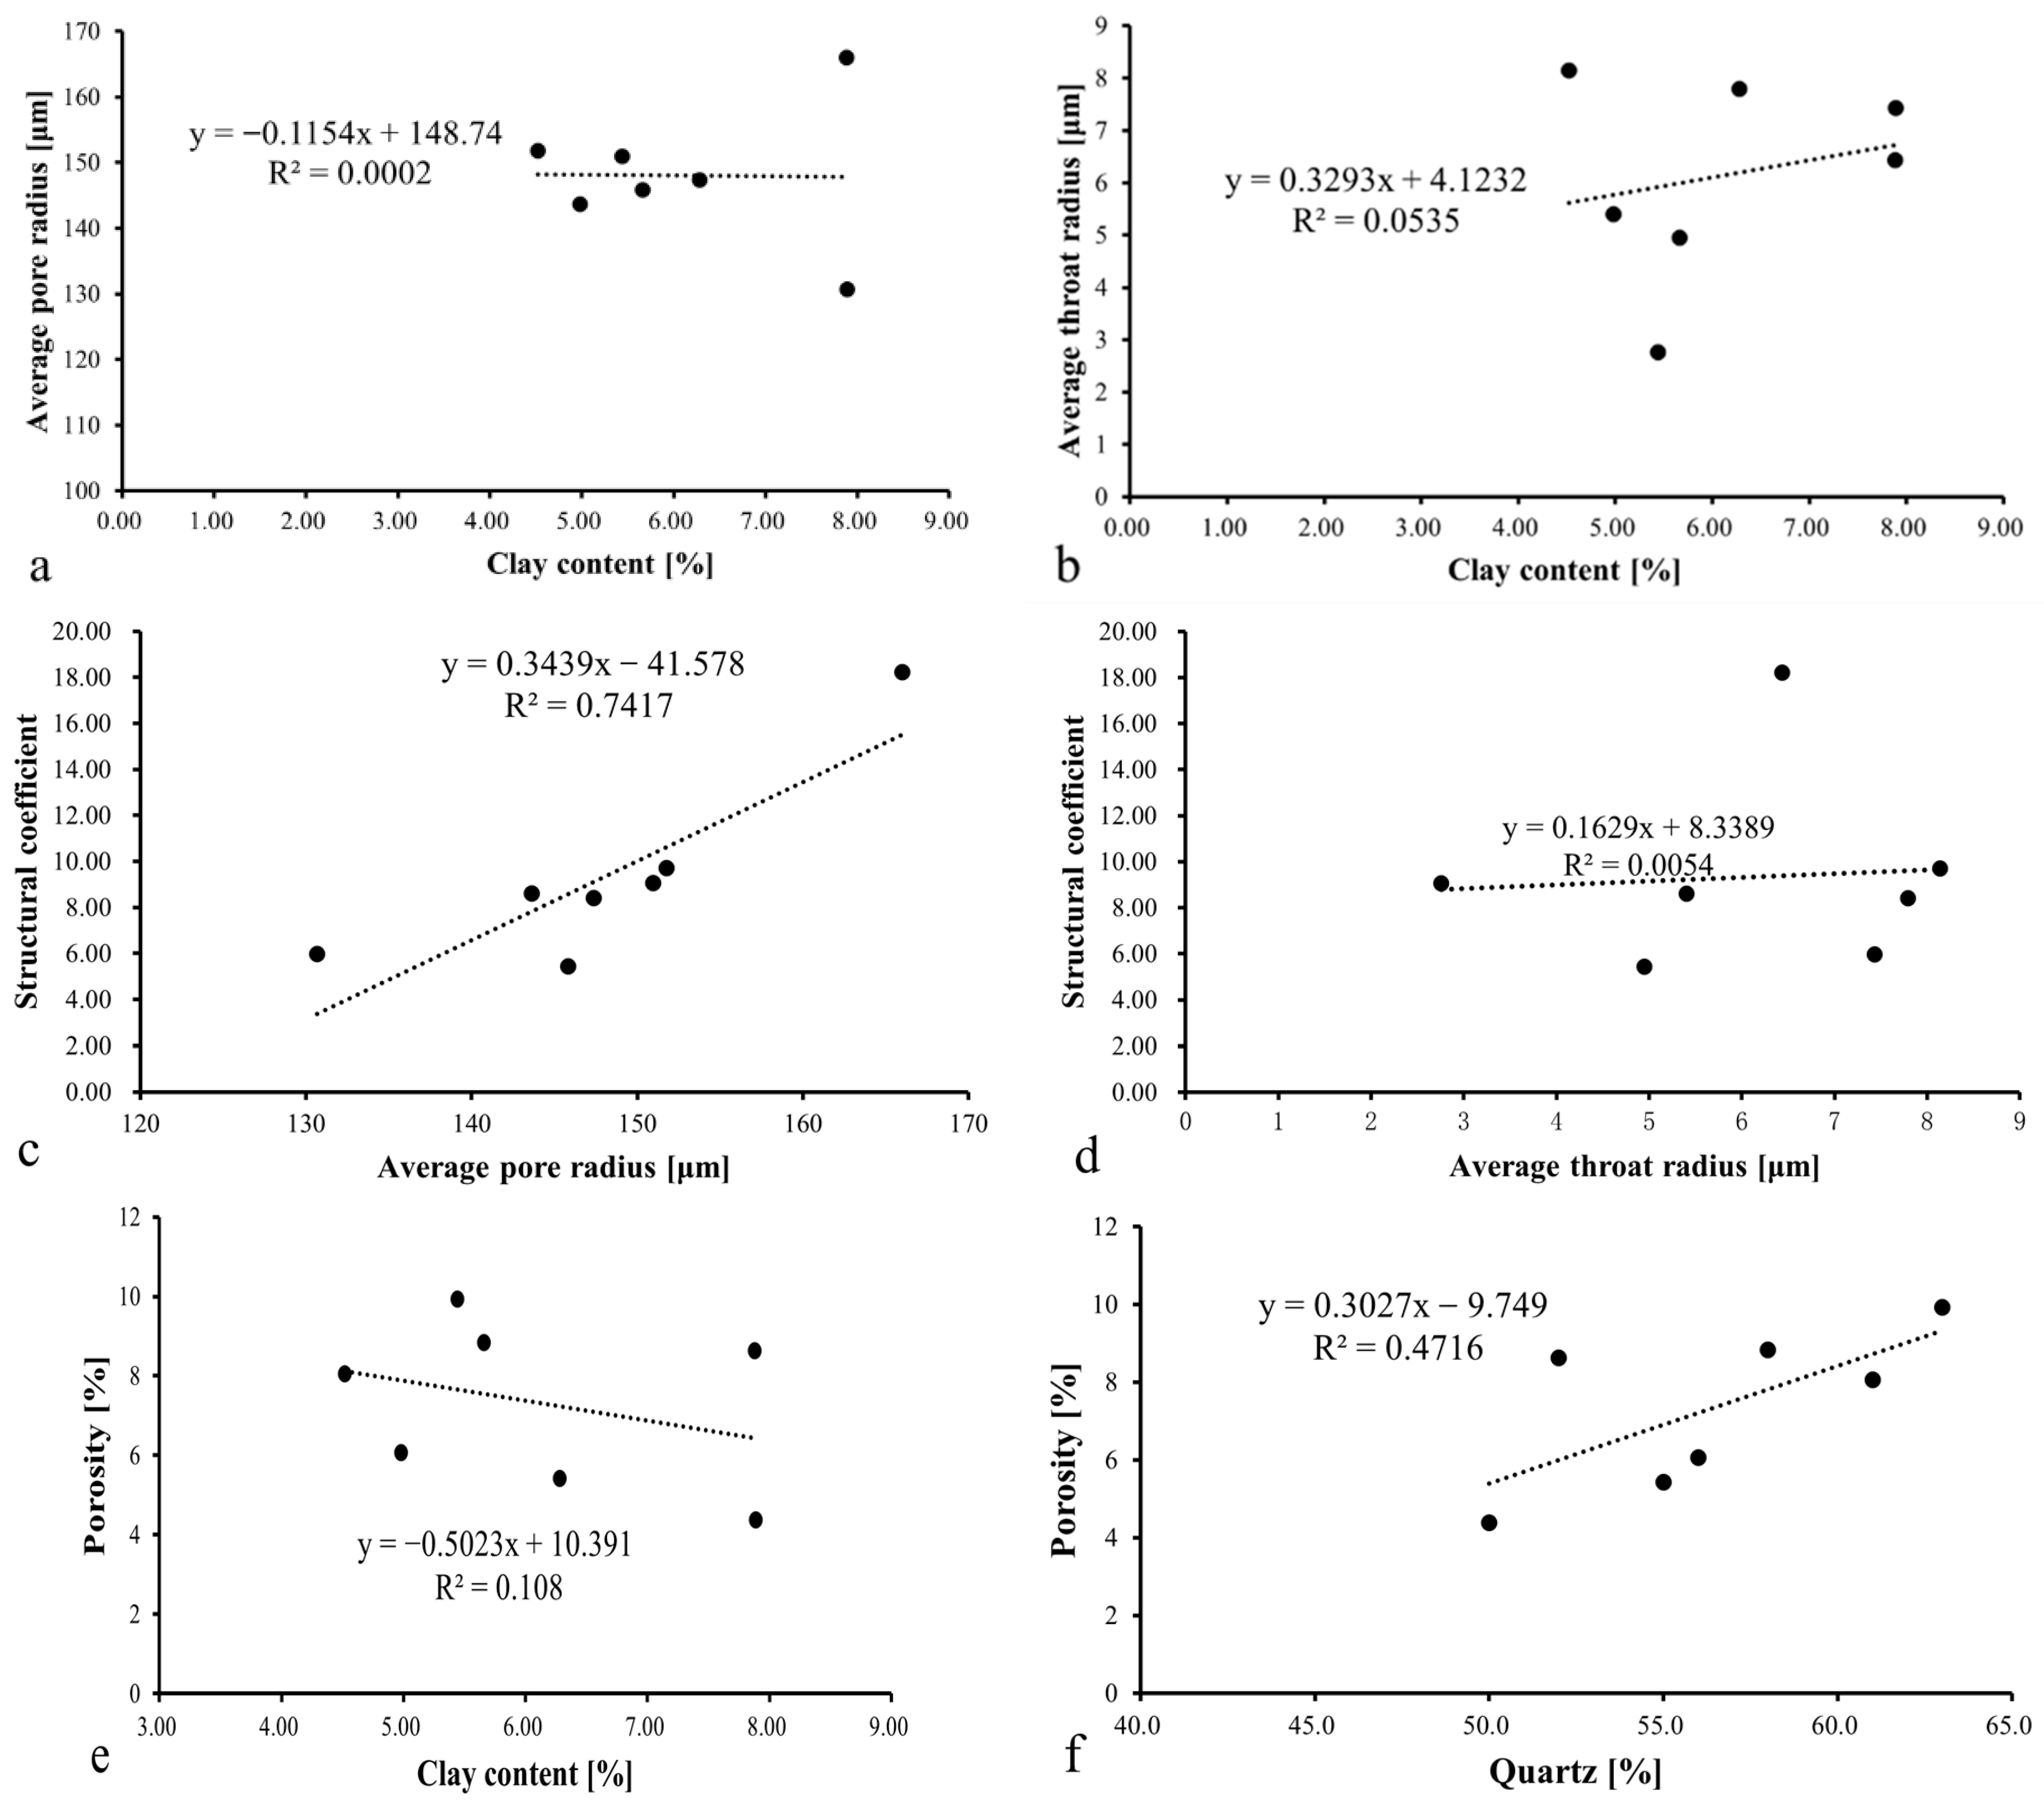
No straightforward correspondence can be identified between pore–throat attributes and the bulk abundance of clay minerals (Figure 15a,b). The essentially negligible coefficients of determination obtained for both the mean pore radius (R2 = 0.0002) and the characteristic throat radius (R2 = 0.0535) relative to clay content suggest that the scale of storage and fluid flow pathways cannot be accounted for by simple volumetric infilling of clay phases. Rather, their dimensions appear to be governed by a more intricate suite of diagenetic modifications that reshape the pore network over time. Evidence from the CRMI measurements summarized in Table 3 further supports this inference. Samples with comparable clay proportions may nevertheless display markedly different pore–throat dimensions. For instance, samples Z11 and S22 contain similar clay fractions (4.52% and 5.66%, respectively), yet their mean throat radii diverge substantially, measuring 8.141 μm and 4.949 μm. Such contrasts imply that the impact of clay minerals on throat constriction is not uniform but depends strongly on mineral type, morphology, and emplacement within the pore system. While excessive clay precipitation can inevitably occlude narrow throats—features that commonly constitute the principal pathways of the reservoir—the magnitude of this restriction varies with clay habit. Fibrous illite and book-like kaolinite, for example, impose throat narrowing at distinctly different scales owing to their contrasting crystal morphologies. Conversely, certain clay minerals occurring in specific textural configurations may contribute to primary intergranular pore preservation. Illite can develop “bridging” fabrics that span throats and partially occupy pore space, In contrast, early-formed chlorite linings serve as a critical diagenetic agent for protecting primary intergranular pores, which can effectively inhibit quartz overgrowth, stabilize the primary pore framework, reduce the damage of compaction and cementation, and realize the effective preservation of primary intergranular pores, thereby maintaining pore volume and reservoir connectivity [34,35].
Figure 15.
Correlation plots of (a) clay minerals vs. average pore radius, (b) clay minerals vs. average throat radius, (c) average pore radius vs. structural coefficient, (d) average throat radius vs. structural coefficient, (e) clay minerals vs. porosity, and (f) quartz vs. porosity.
The structural coefficient is commonly employed as a proxy for the internal complexity and tortuosity of the pore network within reservoir rocks. As illustrated in Figure 15c,d, this parameter displays a pronounced positive relationship with mean pore radius (R2 = 0.7417), whereas it exhibits a weak correlation with the mean throat radius (R2 = 0.0054). Such asymmetric correlations imply that with the increase in pore structure complexity, the structural coefficient is mainly governed by reservoir heterogeneity, rather than merely controlled by the average throat radius within the measured range. A plausible explanation is that an increase in absolute pore size tends to broaden the relative size spectrum within the pore system—i.e., the disparity between large and small pores, as well as between wider and narrower throats, becomes more pronounced. This widening of the internal size distribution enhances heterogeneity along potential flow pathways and consequently increases the tortuous character of the pore network. The dataset in Table 3 provides an illustrative example. Sample Z41 exhibits an exceptionally high structural coefficient (18.22), associated with a comparatively large mean pore radius (165.982 μm) but only a moderate throat radius (6.434 μm). This combination implies a pronounced pore-to-throat size contrast. Such a configuration typically signals limited connectivity and elevated microscale heterogeneity. One possible explanation is the uneven precipitation of clay minerals—particularly kaolinite, which accounts for 53.04% of the clay assemblage in Z41. A second plausible mechanism is that the phenomenon may reflect a more heterogeneous distribution of authigenic phases within relatively spacious pore domains. By contrast, variation in throat dimensions alone does not necessarily track changes in pore body size and therefore exerts only a minor influence on the structural coefficient. Evidence from Table 1 and Table 3 supports this interpretation. Although sample S21 is characterized by a relatively small average throat radius (2.758 μm), it exhibits the highest permeability among the analyzed samples (1.8836 × 10⁻³ μm2). This suggests that its elevated permeability likely arises from efficient linkage among larger pores or from a relatively dense population of effective flow pathways rather than from throat enlargement by itself. Overall, these findings reveal that, in the studied tight sandstone samples, the structural coefficient responds sensitively to variations in pore-body dimensions [26,36,37,38].
The relationship between clay minerals and reservoir storage capacity is inherently multifaceted. As shown in Figure 15e, total clay content exhibits only a weak negative correlation with porosity (R2 = 0.108). This result demonstrates that although clay minerals commonly occupy primary pore space and diminish effective storage volume, their bulk abundance alone does not dictate porosity. For example, sample Z92 contains the highest clay fraction (7.89%) and correspondingly displays the lowest porosity (4.38%), whereas sample S21, with a moderate clay content (5.44%), records the highest porosity (9.93%).
This contrast highlights that the distribution and morphology of clay minerals exert a stronger influence than their bulk proportion. As summarized in Table 2, the clay assemblage is predominated by illite (up to 83.57% in Z42) and chlorite (up to 28.33% in Z92). Authigenic illite commonly develops fibrous or hair-like bridges across pore throats, which can markedly increase the geometric complexity of the pore network without necessarily occupying large pore volumes. Conversely, the abundance of quartz-group minerals shows a moderate positive relationship with porosity (R2 = 0.4716; Figure 15f). This pattern suggests that a rigid quartz framework plays a key role in resisting mechanical compaction and in preserving primary intergranular pores.
Taken together, the interaction between clay minerals and pore–throat structures in tight sandstone reservoirs should not be interpreted simply as a reduction in pore volume. Rather, it represents a qualitative reorganization of the pore network. A quartz-rich framework provides the rigid support necessary to maintain macroscopic pore volume, whereas clay mineral types exert a stronger influence on the tortuous character of fluid pathways. The extent and manner in which clay minerals modify pore throats depend on mineral species and their modes of occurrence within the pore system. In this context, the structural coefficient emerges as a key parameter linking mineral composition to flow behavior. Higher diversity in clay mineral types tends to generate more irregular pore–throat geometries, thereby increasing the structural coefficient and amplifying reservoir heterogeneity. At the same time, pore size primarily captures variability at the macroscopic scale: larger mean pore radii are typically accompanied by a broader distribution of pore sizes and a correspondingly more intricate pore structure. These observations suggest that future predictions of reservoir quality should place greater emphasis on the specific types and configurations of clay minerals, as well as the resulting structural coefficient, rather than relying solely on bulk clay content.
4.2. Spherical Model Conversion Approach
Accurately transforming NMR T2 spectra into pore–throat radius distributions remains a persistent challenge in the characterization of microscopic pore structures in tight sandstone reservoirs. Conventional linear conversion schemes are straightforward to implement, yet they often prove inadequate when applied to strongly heterogeneous pore systems typical of tight formations. Examination of the conversion parameters listed in Table 4 illustrates this limitation. For most tight sandstone samples, the conventional linear fitting approach yields relatively poor correlations. For instance, the coefficient of determination for sample Z41 is only R2 = 0.3003, while those for Z92 and Z11 fluctuate around ~0.5. Such weak correlations suggest that a single linear relationship cannot adequately capture the contribution of surface relaxation within complex pore–throat networks.
Empirical formulations, which typically introduce power-law expressions, can improve statistical fitting (e.g., R2 = 0.9591 for sample S22). However, because these expressions lack a well-defined geometric and physical basis, parameters such as n and C tend to act merely as numerical fitting constants rather than descriptors of pore geometry. This limitation becomes evident in the graphical comparison shown in Figure 7 and Figure 8, where pore–throat radius distribution curves derived from conventional approaches (dashed lines) display noticeable offsets relative to the pore-size distributions inferred from the NMR T2 responses.
Previous studies have attempted to address this issue by adopting cylindrical pore models to T2 relaxation time to pore–throat radius, demonstrating a degree of practical feasibility [14]. However, given the geometric complexity of pore–throat systems in tight sandstones, the present study introduces an alternative conversion strategy based on a spherical pore model to establish the relationship between T2 relaxation time and pore–throat radius distribution.
From a physical standpoint, pores in sandstone are commonly conceptualized as quasi-spherical voids sustained by the grain framework. A comparison between the spherical-model results in Table 5 and the conventional estimates in Table 4 points to the clear advantage of the revised approach. In the first segment, which represents the macropore domain, the fitting performance is notably stronger, with R2 values ranging from 0.8493 to 0.9956 and averaging 0.9464. By contrast, the second and third segments, associated with progressively smaller pore systems, yield lower fits: 0.4528–0.9958 (mean 0.8694) and 0.0600–0.9949 (mean 0.5236), respectively. This trend demonstrates that the spherical geometric approximation is particularly effective in characterizing the dominant storage spaces of the reservoir, namely the larger pores. In addition, the parameters C and h in Table 5 can be interpreted as geometric correction factors related to pore morphology. Abnormally large values of parameter C and negative values of h may occur. Such anomalies mainly stem from fitting deviations induced by mixed signals in the pore–throat transition zone and biased mathematical solutions resulting from uneven data distribution within segmented intervals. However, the parameters generated by the new method remain comparatively robust and physically interpretable, allowing a more faithful reconstruction of pore-space distribution as governed by grain-contact structure.
This study likewise underscores the indispensability of segmented fitting in NMR-based conversion. Given the strongly multimodal pore structure of tight sandstones, no single parameter set can adequately describe the full spectrum from nanometric throats to micrometric pores. The contrast between Figure 9, based on direct fitting, and Figure 12, derived from segment-wise calibration, makes this especially evident: once the spherical-framework model is applied in a staged manner, the NMR-derived pore–throat radius distribution curve exhibits a striking correspondence with the MIP profile in its overall distribution pattern. The agreement is particularly pronounced in higher-quality samples such as S21 and Z91, where the converted NMR curves reproduce with notable fidelity the peak response of the MIP curves around 0.5–1.0 μm. By comparing Figure 12 and Figure 14, it can be found that the overall consistency between the mercury intrusion test results and the NMR-inverted pore-throat radius distribution curves varies distinctly after conversion using the segmented spherical pore framework model and cylindrical pore framework model. The cylindrical pore framework model presents a weaker matching performance than the spherical pore framework model.
The improved agreement stems largely from the capacity of segmented fitting to accommodate scale-dependent variations in the surface relaxivity, ρ, across different pore classes. In larger pores, where capillary effects and fluid configuration exert greater influence, surface relaxation makes a comparatively limited contribution. In finer pores, by contrast, the much higher specific surface area renders the relaxation process far more sensitive to interfacial properties. The systematic divergence among the C1, C2, and C3 parameters in Table 5 captures precisely this trend, namely, the progressive intensification of relaxation response as pore size decreases.
Alongside the spherical framework, the cylindrical formulation advanced by Huang et al. [14] and summarized in Table 6 also warrants consideration. Notably, in the smaller-radius segments, this model occasionally outperforms the spherical approximation. For the second and third segments, which correspond to the fine-pore domain, R2 values reach 0.9699–0.9986 (mean 0.9838) and 0.9582–0.9986 (mean 0.9817), respectively. These results are not only superior to those obtained from the spherical model in the same pore-size ranges, but also exceed the fit quality in the first segment, where R2 ranges from 0.9294 to 0.9956 with an average of 0.9581. Such behavior is closely tied to reservoir microstructure: in tight sandstones, the flow-limiting throats tend geometrically to resemble elongated tubular or cylindrical conduits rather than equant pore bodies.
The segmental variation of NMR conversion parameters points to a scale-dependent pore-geometry regime within the reservoir. When read alongside the pore- and throat-saturation curves from CRMI in Figure 5, a clear pattern emerges: in the larger-radius segment, where pore bodies dominate, and the spherical model performs best, the pore-volume contribution is markedly higher. This is likewise reflected in Table 5, where the large-pore segments generally show strong goodness of fit; for instance, both the first and second segments of sample S21 yield R2 values above 0.995. Such results suggest that, for larger storage domains, the spherical assumption provides an adequate representation of surface-relaxation behavior. As radius decreases, however, the fluid-hosting space shifts from pore-body-dominated to throat-dominated geometry, with a corresponding transition from more equant forms to more elongated conduits. In these finer segments, the spherical model becomes far less stable, and its fit quality tends to deteriorate substantially. By comparing Table 5 and Table 6, the small-pore segments in which the rod-like or cylindrical formulation performs well almost invariably coincide with an appreciable throat-volume fraction. This offers a convincing explanation for the superior small-pore fitting results of the cylindrical model in Table 6 relative to the spherical one. Put differently, the spherical framework tends to yield more physically plausible parameter solutions in the macropore domain, whereas the cylindrical model shows broader overall applicability because throat sizes span a wider and more influential range.
Taken together, the segmented NMR conversion strategy built on a spherical framework offers clear advantages for characterization of pore–throat radius distribution in tight sandstone reservoirs. It not only outperforms conventional linear and empirical approaches in statistical terms, but also exhibits far stronger consistency with the physical signals revealed by CRMI. Admittedly, the finer-pore domain may call for a transition toward a cylindrical representation. Even so, for the primary storage pore space in tight sandstones—where pore bodies are more appropriately approximated as equant cavities—the spherical model delivers a more faithful description and captures pore-scale heterogeneity with greater precision. This is well illustrated by samples such as Z41: despite its high structural coefficient (18.22) and elevated clay content (7.88%), and although the cylindrical model can still produce acceptable fit statistics, its geometric premise is less compatible with the actual pore structure. By contrast, the strong, large-pore fit obtained with the spherical model in this sample (R2 = 0.9872) more plausibly reconstructs the intricate void system shaped by kaolinite infilling, which accounts for 53.04% of the clay fraction. Accordingly, the spherical model provides a more effective basis for the quantitative evaluation of heterogeneous reservoirs. Future work should therefore move beyond single-geometry assumptions and develop a hybrid pore–throat framework, coupling spherical pores with cylindrical throats, so as to improve full-range pore–throat radius distribution from NMR measurements.
4.3. Factors Affecting Spherical-Model Conversion Results
During the application of the spherical-pore model to convert NMR relaxation times into pore–throat radius distributions, the fitting accuracy of the model parameters is governed by a combination of geological controls and geometric attributes. A comparison between Table 5, derived from the spherical model, and Table 6, based on the cylindrical model, clearly shows that the latter generally produces better fitting results. The most direct implication of this contrast is that, with decreasing pore size, the fluid-occupied space progressively shifts from pore-body-dominated spherical cavities to slender, tube-like throats. In tight sandstones, the fine-scale domain is therefore composed predominantly of narrow throats, for which the cylindrical approximation captures the surface-area-to-volume relationship more realistically than the spherical one, thereby achieving higher accuracy in NMR T2 spectrum conversion.
Beyond the geometric constraint imposed by pore-size scale, the accuracy of spherical model conversion is also jointly controlled by clay-mineral assemblage and structural complexity.
Mineralogical composition, particularly the type and abundance of clay minerals, constitutes a major control on conversion reliability. Sample Z92 contains the highest absolute clay content, reaching 7.89%, with chlorite accounting for 28.33% of the clay fraction (Table 2). Authigenic chlorite, especially when developed as rosette-like aggregates or crystal clusters within pore space, tends to partition originally connected larger pores into highly intricate micropore networks, thereby markedly increasing structural complexity. This helps explain the relatively weak spherical model fit obtained for Z92 in Table 5. In addition, Figure 15e,f suggest that quartz, as a rigid framework mineral, is more favorable for the preservation of larger equant pores, whereas clay infilling intensifies heterogeneity within the pore–throat system. Once clay minerals precipitate within fine throats, they not only distort pore geometry away from an ideal spherical form, but also introduce additional surface-relaxation effects due to their high specific surface area. Consequently, anomalous C and h values are more likely to emerge when the spherical model is applied to the small-pore domain. This interpretation is consistent with the data in Table 5: S21, which has the highest quartz content, also shows the highest R2 values in the first and second segments, whereas Z92, with the lowest quartz content, exhibits the lowest R2 values in those same segments.
The rock structure coefficient serves as a composite proxy for the complexity of the pore–throat network. As shown in Table 3, sample Z41 exhibits a structure coefficient of 18.22, far exceeding that of the other samples. Its strong correlation with mean pore radius (R2 = 0.7417; Figure 15c) implies a broader spectrum of pore and throat sizes and, consequently, a higher degree of heterogeneity. Under such conditions, no single geometric idealization can adequately represent the full pore-size range during NMR conversion. For a structurally complex sample such as Z41, the spherical model remains effective in describing larger, quartz-supported pore bodies, yielding an R2 of 0.9872. Yet when the analysis shifts to smaller pores and throats shaped by kaolinite and illite, the elevated pore tortuosity undermines the validity of the spherical assumption and introduces conversion error. The cylindrical model performs substantially better in these finer segments, with R2 values of 0.9856 and 0.9986 for the second and third segments, respectively, because its parameterization is better suited to compensating for flow-path constriction associated with a high structure coefficient.
In summary, the accuracy of spherical-model-based conversion is jointly governed by pore-size scale, clay-mineral composition, and structural complexity. In tight sandstone reservoirs, the larger-pore domain, represented by C1 and h1, conforms more closely to a spherical geometry, whereas the finer-pore domain, represented by C3 and h3, is fitted more effectively by the cylindrical model. This scale-dependent model preference highlights a coupled size–geometry relationship and suggests that future NMR characterization should adopt a composite geometric framework: spherical conversion parameters for larger pore bodies, and cylindrical parameters for smaller pores and throats, so as to minimize the distortion imposed by complex pore–throat structure on characterization of pore–throat radius distribution.
5. Conclusions
- In tight sandstone reservoirs, the effect of clay minerals on pore–throat structure is primarily controlled by mineral type and occurrence. Total clay content shows weak correlations with mean pore size, throat radius, and porosity, whereas the spatial distribution and microscopic habit of specific clay minerals can strongly alter pore connectivity and flow pathways. Fibrous illite tends to bridge pores and throats, increasing structural complexity, while early chlorite linings can inhibit quartz overgrowth and help preserve primary intergranular pores.
- During the conversion of NMR T2 spectra into pore–throat radius distributions, a single geometric model cannot adequately capture the full-scale pore system of tight sandstones. Large storage pores are better approximated as spherical, whereas fine pores and throats are more consistent with tubular geometries. A scale-dependent composite model therefore provides a more realistic representation of pore–throat structure and markedly improves the agreement between NMR-inverted distributions and mercury-intrusion results.
- The accuracy of converting NMR T2 spectra into pore–throat radius distributions using the spherical-pore model is governed not only by pore-size scale, but also by structural complexity and mineral composition. Accordingly, in tight reservoirs characterized by complex pore systems and abundant clay minerals, NMR-based pore–throat characterization should explicitly incorporate the coupled effects of radius scale and mineralogy to yield more physically meaningful pore-structure inversions.
Author Contributions
Methodology, Y.M., Y.X. and H.H.; Software, P.S., S.C. and X.Z.; Validation, S.C.; Investigation, Y.X., X.Z. and R.X.; Resources, S.C., Y.M. and W.S.; Data curation, P.S.; Writing—original draft, P.S.; Supervision, H.H.; Funding acquisition, H.H. All authors have read and agreed to the published version of the manuscript.
Funding
This work was supported by the National Natural Science Foundation of China (42302157), the Deep Earth probe and Mineral Resources Exploration-National Science and Technology Major Project (2025ZD1005701), the Provincial College Student Innovation Training Program Project, Chang’an University (S202510710397) and the Fundamental Research Funds for Central Universities, CHD (No. 300102274201). The authors also thank Dr. Xi Zhang for her assistance with data collection and for her constructive suggestions.
Data Availability Statement
Dataset available on request from the authors.
Conflicts of Interest
Pengfei Song is employee of China National Petroleum Corporation. Yaxuan Ma and Yankai Xu are employees of PetroChina Changqing Oilfield Company. The authors declare that they have no known competing financial interests or personal relationships that could have appeared to influence the work reported in this paper. All authors have read and agreed to the published version of the manuscript.
Nomenclature
| γ | The gyromagnetic ratio |
| n, C | It is a constant |
| l | The length of the connected pore, μm |
| V | The pore volume, μm3 |
| S | The pore surface area, μm2 |
| G | The magnetic field gradient |
| D | The diffusion coefficient |
| h | The thickness of liquid in the total pore volume V, μm |
| ρ2 | The relaxation rate, μm/ms |
| Vst | The volume of thin-layer fluid, μm3 |
| Vs | The pore fluid volume that produces particle surface relaxation time T2s, μm3 |
| TE | The echo spacing |
| T2b | The relaxation time of the fluid, ms |
| T2s | The relaxation time of the particle surface, ms |
| T2d | The relaxation time of molecular diffusion, ms |
| St | The surface area of the pore, μm2 |
| Fs | The pore shape factor; it has no dimension |
| rt | The pore throat radius obtained by MIP, μm |
References
- Xiong, J.; Liu, X.; Liang, L. Adsorption model of shale to CH4 based on adsorption potential theory and its application. J. Chengdu Univ. Technol. (Nat. Sci. Ed.) 2014, 41, 604–611. [Google Scholar]
- Debenham, N.; Farrell, N.J.C.; Holford, S.P.; King, R.C.; Healy, D. Spatial distribution of micrometre-scale porosity and permeability across the damage zone of a reverse-reactivated normal fault in a tight sandstone: Insights from the Otway Basin, SE Australia. Basin Res. 2019, 31, 640–658. [Google Scholar] [CrossRef] [Scilit]
- Shang, Y.X.; Liu, J.Y.; Wang, Z.Y.; Zhang, B. Diagenetic controls on sweet spots pore types and reservoir quality of Permian tight sandstones in the Ordos Basin, China. Mar. Pet. Geol. 2025, 174, 107324. [Google Scholar] [CrossRef] [Scilit]
- Bao, L.; Chen, Q.; Liu, Y.M.; Hou, J.G.; Zhang, Z.Y. Effect of pore-throat structure and displacement pressure on gas distribution in tight sandstone reservoirs of the Lower Shihezi Formation in the Ordos Basin, China. Front. Earth Sci. 2026, 14, 1757103. [Google Scholar] [CrossRef] [Scilit]
- Chen, L.; Jiang, Z.X.; Liu, K.Y.; Tan, J.Q.; Gao, F.L.; Wang, P.F. Pore structure characterization for organic-rich Lower Silurian shale in the Upper Yangtze Platform, South China: A possible mechanism for pore development. J. Nat. Gas Sci. Eng. 2017, 46, 1–15. [Google Scholar] [CrossRef] [Scilit]
- Zang, Q.B.; Liu, C.L.; Awan, R.S.; Yang, X.Y.; Lu, Z.D.; Li, G.X.; Wu, Y.P.; Feng, D.H. Occurrence Models of Movable Fluid in Lacustrine Sandstone Reservoir of Chang 7 Member in the Heshui Block, Ordos Basin, China. J. Earth Sci. 2025, 36, 57–74. [Google Scholar] [CrossRef] [Scilit]
- Xiao, D.S.; Lu, S.F.; Lu, Z.Y.; Huang, W.B.; Gu, M.W. Combining nuclear magnetic resonance and rate-controlled porosimetry to probe the pore-throat structure of tight sandstones. Pet. Explor. Dev. 2016, 43, 1049–1059. [Google Scholar] [CrossRef] [Scilit]
- Jin, L.; Wang, G.W.; Fan, Z.Y.; Chen, J.; Wang, S.C.; Zhou, Z.L.; Fan, X.Q. Insight into the pore structure of tight sandstones using NMR and HPMI measurements. Energy Fuels 2016, 30, 10200–10214. [Google Scholar] [CrossRef] [Scilit]
- Kleinberg, R.L. Utility of NMR T2 distributions, connection with capillary pressure, clay effect, and determination of the surface relaxivity parameter ρ2. Magn. Reson. Imaging 1996, 14, 761–767. [Google Scholar] [CrossRef] [Scilit]
- Dunn, K.J.; Bergman, D.J.; LaTorraca, G.A. Nuclear Magnetic Resonance: Petrophysical and Logging Applications; Elsevier: Amsterdam, The Netherlands, 2002. [Google Scholar]
- Xu, W.B.; Zhang, C.; Nie, X.; Meng, S.H.; Lv, H.; Zeng, W.J.; Zhang, Z.S. Multifractal Characterization of Pore Structure and Its Control on Capillary Pressure Shape and Relative Permeability in Tight Sandstones. Fractal Fract. 2026, 10, 188. [Google Scholar] [CrossRef] [Scilit]
- Meng, M.M.; Li, Z.J.; Hong, Z.Q.; Bao, J.W.; Jiang, Q.X. Quantifying pore size distribution by nuclear magnetic resonance method in tight sandstones: Comparison between water-wet and oil-wet saturated fluids. Int. J. Hydrogen Energy 2026, 197, 152608. [Google Scholar] [CrossRef] [Scilit]
- Mao, Z.Q.; He, Y.D.; Ren, X.J. An improved method of using NMR T2 distribution to evaluate pore size distribution. Chin. J. Geophys. 2005, 48, 412–418. [Google Scholar] [CrossRef] [Scilit]
- Huang, H.X.; Li, R.X.; Xiong, F.Y.; Hu, H.; Sun, W.; Jiang, Z.X.; Chen, L.; Wu, L. A method to probe the pore-throat structure of tight reservoirs based on low-field NMR: Insights from a cylindrical pore model. Mar. Pet. Geol. 2020, 117, 104344. [Google Scholar] [CrossRef] [Scilit]
- Yu, W.; Wang, F.; Gong, L.; Wang, G.H.; Tian, J.C.; Ma, Z.R. Sedimentary environment characteristics and tectonic implications of Yanghugou Formation in the western margin of Ordos Basin, China. J. Chengdu Univ. Technol. (Sci. Technol. Ed.) 2021, 48, 691–704. [Google Scholar]
- Durrett, R. Oriented percolation in two dimensions. Ann. Probab. 1984, 12, 999–1040. [Google Scholar] [CrossRef] [Scilit]
- Yang, Y.X.; Wen, Z.G.; Tian, W.C.; Fan, Y.P.; Gao, H.T. A New Model for Predicting Permeability of Chang 7 Tight Sandstone Based on Fractal Characteristics from High-Pressure Mercury Injection. Energies 2024, 17, 821. [Google Scholar] [CrossRef] [Scilit]
- Toumelin, E.; Torres-Verdín, C.; Sun, B.Q.; Dunn, K.J. Random-walk technique for simulating NMR measurements and 2D NMR maps of porous media with relaxing and permeable boundaries. J. Magn. Reson. 2007, 188, 83–96. [Google Scholar] [CrossRef] [Scilit]
- Liu, P.P.; Liu, Y.M.; Hou, J.G.; Bao, L.; Chen, Q. Multifractal Characteristics of Tight Sandstone Pore Structure Based on Nuclear Magnetic Resonance in Benxi Formation, Ordos Basin, China. Fractal Fract. 2026, 10, 153. [Google Scholar] [CrossRef] [Scilit]
- Wang, K.W.; Li, N. Numerical simulation of rock pore-throat structure effects on NMR T2 distribution. Appl. Geophys. 2008, 5, 86–91. [Google Scholar] [CrossRef] [Scilit]
- Korringa, J.; Seevers, D.O.; Torrey, H.C. Theory of spin pumping and relaxation in systems with a low concentration of electron spin resonance centers. Phys. Rev. 1962, 127, 1143. [Google Scholar] [CrossRef] [Scilit]
- Brownstein, K.R.; Tarr, C.E. Importance of classical diffusion in NMR studies of water in biological cells. Phys. Rev. A 1979, 19, 2446. [Google Scholar] [CrossRef] [Scilit]
- Daigle, H.; Dugan, B. Extending NMR data for permeability estimation in fine-grained sediments. Mar. Pet. Geol. 2009, 26, 1419–1427. [Google Scholar] [CrossRef] [Scilit]
- Wampler, J.J.; Rai, C.S.; Abdelghany, O. Estimating permeability in UAE carbonates using NMR. In SEG Technical Program Expanded Abstracts; Society of Exploration Geophysicists: Houston, TX, USA, 2010; pp. 2649–2653. [Google Scholar]
- Li, Y.; Fang, Y.; Deng, S.; Liu, B. Experimental study of pore structure with nuclear magnetic resonance. Prog. Explor. Geophys. 2008, 31, 129–132. [Google Scholar]
- Yang, W.; Wang, Q.Y.; Wang, Y.H.; Jiang, Z.X.; Song, Y.; Li, Y.H.; Liu, D.; Zuo, R.S.; Gu, X.M.; Zhang, F. Pore characteristic responses to categories of depositional microfacies of delta-lacustrine tight reservoirs in the Upper Triassic Yanchang Formation, Ordos Basin, NW China. Mar. Pet. Geol. 2020, 118, 104423. [Google Scholar] [CrossRef] [Scilit]
- Klaver, J.; Desbois, G.; Littke, R.; Urai, J.L. BIB-SEM characterization of pore space morphology and distribution in postmature to overmature samples from the Haynesville and Bossier Shales. Mar. Pet. Geol. 2015, 59, 451–466. [Google Scholar] [CrossRef] [Scilit]
- Wang, J.K.; Zhang, J.L.; Shen, W.L.; Liu, H.Y. Comparison of the Pore Structure of Ultralow-Permeability Reservoirs Between the East and West Subsags of the Lishui Sag Using Constant-Rate Mercury Injection. J. Ocean Univ. China 2021, 20, 315–328. [Google Scholar] [CrossRef] [Scilit]
- Anovitz, L.M.; Cole, D.R. Characterization and analysis of porosity and pore structures. Rev. Mineral. Geochem. 2015, 80, 61–164. [Google Scholar] [CrossRef] [Scilit]
- Mirotchnik, K.D.; Allsopp, K.; Kantzas, A.; Curwen, D.; Badry, R. Low-field NMR method for bitumen sands characterization: A new approach. SPE Reserv. Eval. Eng. 2001, 4, 88–96. [Google Scholar] [CrossRef] [Scilit]
- Yang, R.; He, S.; Hu, Q.H.; Zhai, G.Y.; Yi, J.Z.; Zhang, L. Comparative investigations on wettability of typical marine, continental, and transitional shales in the middle Yangtze Platform (China). Energy Fuels 2018, 32, 12187–12197. [Google Scholar] [CrossRef] [Scilit]
- Li, Z.; Jiang, Z.; Liang, Z.; Yu, H.; Yang, Y. Pore-structure characterisation of tectonically deformed shales: A case study of Wufeng-Longmaxi Formation in western Hunan Province, southern China. Aust. J. Earth Sci. 2019, 66, 1075–1084. [Google Scholar] [CrossRef] [Scilit]
- Liu, D.; Li, Z.; Jiang, Z.; Zhang, C.; Zhang, Z.; Wang, J.; Yang, D.; Song, Y.; Luo, Q. Impact of laminae on pore structures of lacustrine shales in the southern Songliao Basin, NE China. J. Asian Earth Sci. 2019, 182, 103935. [Google Scholar] [CrossRef] [Scilit]
- Cao, Q. Characterization and Techniques of Micropores in Organic-Rich Shale of Chang 7th of Yanchang Formation, Ordos Basin. Ph.D. Thesis, Chengdu University of Technology, Chengdu, China, 2016. [Google Scholar]
- Huang, H.X.; Sun, W.; Ji, W.M.; Zhang, R.H.; Du, K.; Zhang, S.H.; Ren, D.; Wang, Y.W.; Chen, L.; Zhang, X. Effects of pore-throat structure on gas permeability in the tight sandstone reservoirs of the Upper Triassic Yanchang formation in the Western Ordos Basin, China. J. Pet. Sci. Eng. 2018, 162, 602–616. [Google Scholar] [CrossRef] [Scilit]
- Ehrenberg, S.N. Measuring sandstone compaction from modal analyses of thin sections; how to do it and what the results mean. J. Sediment. Res. 1995, 65, 369–379. [Google Scholar] [CrossRef] [Scilit]
- Haile, B.G.; Klausen, T.G.; Czarniecka, U.; Xi, K.; Jahren, J.; Hellevang, H. How are diagenesis and reservoir quality linked to depositional facies? A deltaic succession, Edgeøya, Svalbard. Mar. Pet. Geol. 2018, 92, 19–546. [Google Scholar] [CrossRef] [Scilit]
- Isah, A.; Mahmoud, M.; Eltom, H.; Salih, M.; Arif, M.; Aljawad, M.S. Exploring the Impact of Mineralogy on Pore Structure and Fluid Dynamics in Tight Reservoir Rocks: Insights for Enhanced Oil Recovery and Gas Storage. Arab. J. Sci. Eng. 2025, 50, 5055–5080. [Google Scholar] [CrossRef] [Scilit]

Disclaimer/Publisher’s Note: The statements, opinions and data contained in all publications are solely those of the individual author(s) and contributor(s) and not of MDPI and/or the editor(s). MDPI and/or the editor(s) disclaim responsibility for any injury to people or property resulting from any ideas, methods, instructions or products referred to in the content. |
© 2026 by the authors. Licensee MDPI, Basel, Switzerland. This article is an open access article distributed under the terms and conditions of the Creative Commons Attribution (CC BY) license.