


Abstract
Uranium ore preconcentration is a critical step in achieving environmentally sustainable uranium mining and reducing the operational load of hydrometallurgical processing systems. Conventional radioactive sorting systems predominantly employ a “single-ore-particle intermittent measurement” mode. Under continuous ore flow and high-throughput operating conditions, however, the radiation fields of adjacent ore particles inevitably overlap, which results in gamma-counting interference and blurred ore-segment boundaries, thereby limiting sorting accuracy and system capacity. To address these challenges, this study established a convolutional model that describes the relationship between ore-grade distribution and gamma-response characteristics under continuous ore flow conditions. On this basis, a deconvolution-based method for uranium ore grade calculation was proposed, and an adaptive determination strategy for the characteristic parameter α was introduced to improve grade estimation accuracy and enable reliable identification of ore-segment boundaries. The experimental results showed that, for uranium grades ranging from 0.05% to 0.18% and ore-segment lengths of 16–40 cm, the relative errors between the inverted and true grades of individual segments were all less than 10%. Compared with conventional intermittent measurement and identification schemes, the proposed method achieves stable and accurate grade inversion under conditions of overlapping radiation fields in continuous ore segments.
1. Introduction
Uranium is a strategic resource that underpins nuclear power generation and the nuclear fuel cycle [1,2]. However, owing to its relatively low abundance in the Earth’s crust and strong geological controls on uranium mineralization, uranium deposits typically exhibit complex orebody morphologies, pronounced spatial heterogeneity, and a high proportion of low-grade material [3,4]. In deposits characterized by intense mixing of ore and host rock and a large fraction of subeconomic material, the absence of effective preconcentration measures causes substantial volumes of low-grade ore to enter crushing, grinding, and leaching circuits. This not only increases energy and reagent consumption but also reduces the effective metal loading and recovery efficiency of the leaching system while increasing the burden of tailings management [5]. Consequently, developing high-throughput, online preconcentration technologies for low-grade and structurally complex uranium ores is of significant engineering importance for improving resource utilization efficiency and enabling environmentally sustainable and economically viable mining [6,7].
In recent years, driven by advances in mineral recognition theory and sensor hardware, sensor-based sorting technologies that exploit contrasts in physical properties have found widespread application in the mining industry [8,9]. Representative techniques include color-based optical sorting [10], electromagnetic (EM) methods, X-ray fluorescence (XRF) [11], X-ray transmission (XRT) [12,13], near-infrared spectroscopy (NIR) [14], laser-induced breakdown spectroscopy (LIBS) [15], and prompt gamma neutron activation analysis (PGNAA) [16]. These methods have been deployed at an industrial scale for ores such as copper, gold, tin, tungsten, and rare earth elements [17,18].
Uranium ores, however, typically have low grades, fine and uneven mineral dissemination, subtle surface manifestations, and radioactivity dominated by subsurface contributions [19]. As a result, optical, infrared, and other surface-sensitive sorting techniques often provide insufficient discrimination sensitivity or limited effective sampling depth, and they may incur comparatively high equipment costs in low-grade uranium ore applications [20].
By contrast, radioactive sorting based on natural gamma radiation offers distinct advantages for the primary sorting of uranium ore [21]. Radium-series nuclides in the uranium decay chain, such as 214Pb and 214Bi, emit medium- to high-energy gamma rays with high penetration and limited sensitivity to ore surface morphology and moisture conditions. The measured signals reflect average radioactivity at the bulk (volumetric) scale and thus provide an effective and stable physical indicator of uranium content. Owing to these attributes, radioactive sorting has been implemented in uranium mining operations in several countries as a front-end approach for waste rejection and preconcentration of near-cut-off material [22,23].
Physically, natural gamma radiation emitted by radionuclides within an ore particle can penetrate the rock matrix and propagate into the surrounding space; consequently, its radiation contribution is not confined to the geometric boundary of the particle. Outside the particle, the radiation flux decreases with distance due to geometric attenuation, giving rise to a continuously varying spatial field. The counting signal recorded by the detector can be described as a linear, weighted superposition of the ore’s spatial radioactivity distribution governed by the system’s spatial response function; when the system can be approximated as shift-invariant, this measurement process is mathematically represented as the convolution of these two functions. Consequently, on a sorting conveyor, the radiation contributions from adjacent particles inherently overlap in space, thereby introducing intrinsic signal cross-talk.
To mitigate signal intermixing arising from field overlap, existing industrial radioactive sorting systems typically rely on engineering constraints rather than advanced signal separation algorithms. First, lead shielding and collimation structures are used to narrow the detector’s effective field of view. Second, the ore stream is arranged in a single-layer, intermittently spaced configuration so that only one ore particle enters the detector’s field of view at a time, enabling particle-by-particle measurement [23,24]. This “single-ore-particle intermittent measurement” strategy effectively suppresses the influence of overlapping radiation fields under low-throughput conditions.
In practical mining operations, uranium ore sorting is often conducted at high ore-flow densities and elevated conveyor-belt speeds to meet throughput targets. Under such conditions, maintaining sufficient physical spacing between ore particles becomes impractical, and multiple particles simultaneously enter the detector’s field of view, which leads to pronounced broadening of the gamma-counting traces. In this situation, conventional discrimination methods based on fixed thresholds or simple time windows often fail to accurately identify particle boundaries or calculate grades, resulting in increased misclassification. This limitation has become a key bottleneck for deploying radioactive sorting in high-throughput, low-grade uranium ore scenarios.
From a theoretical standpoint, the gamma-counting sequence acquired under continuous ore flow conditions can be formulated as the convolution of the axial distribution of segment grade (or radioactive activity) along the conveying direction with the detector’s impulse response function, with additional contributions from background radiation and statistical noise [25]. In high-throughput scenarios where radiation-field overlap is unavoidable, recovering the average grade of a local ore segment reduces to deconvolving the mixed counting signal to separate and reconstruct the radiation contributions of each unit layer or segment. However, studies that address deconvolution-based radioactive sorting specifically for continuous uranium ore flow remain scarce in the published literature.
To address signal intermixing caused by overlapping radiation fields in continuous ore streams, this study presents a deconvolution-based radioactive sorting method for uranium ore. First, a convolution model for the gamma response of unit layers was established. Second, a deconvolution solution suitable for online implementation was derived. An adaptive identification scheme for the characteristic parameter α is then introduced to improve robustness under varying operating conditions. Finally, an experimental setup was constructed, and multiple types of ore-segment models were designed to validate and evaluate the grade inversion performance of the proposed method under continuous ore flow scenarios. The results provide a practically deployable theoretical basis and an engineering framework for high-throughput radioactive sorting.
2. Theory and Methodology
2.1. Deconvolution Theory for Grade Calculation
Radioactive sorting of uranium ore relies on the natural radioactivity of uranium-bearing minerals. Natural uranium occurs predominantly as 238U, whose decay chain comprises multiple radioactive progeny. Among these progeny, radium-series nuclides such as 214Pb and 214Bi emit medium- to high-energy gamma rays, with energies primarily distributed in the range of 400–2000 keV. These emissions have comparatively high emission probabilities and distinct spectral peaks. Consequently, the gamma radiation signal measured in practice is dominated by contributions from radium-series nuclides [26].
This study targets rapid online measurement and real-time data processing. Therefore, the experimental system performs integral counting via a fixed energy-threshold approach (rather than high-resolution spectral analysis), and a 400–2000 keV integral window is selected to obtain a stable count rate while balancing signal-to-noise ratio and real-time performance. This window suppresses background interference from low-energy Compton scattering and encompasses the principal characteristic peaks of radium-series nuclides, thereby strengthening the linear relationship between gamma-counting rate and uranium grade. By measuring gamma counts as ore passes through the detector’s field of view on the conveyor belt, the uranium content can be inferred in real time, which provides essential input for ore-segment grade reconstruction and subsequent sorting decisions. Under adequate counting statistics and processing speed, using characteristic peak windows (ROI) and peak-feature analysis is expected to further enhance background suppression and improve effective information utilization. In addition, scattered components in the Compton region may still contain usable information. These directions can be explored in future work.
During online measurement under continuous ore flow conditions, ore moving along the conveying direction can be discretized into successive unit layers of equal length. As each unit layer passes through the detection zone, it contributes a corresponding number of gamma counts to the detector. Accordingly, the total counting signal recorded by the detector can be expressed as a convolutional sum of the radiation contributions from all unit layers, governed by the system’s spatial response function. Furthermore, when the radiation characteristics of individual unit layers are identical, and the ore-segment length is sufficiently large, the cumulative response approaches a steady-state counting regime corresponding to an infinitely long, “saturated ore segment” [27].
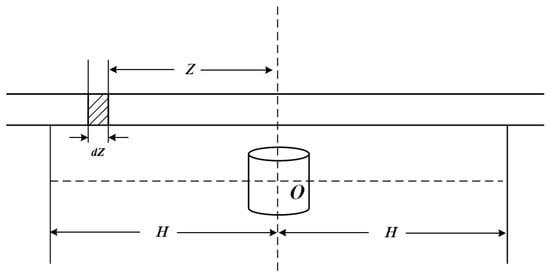
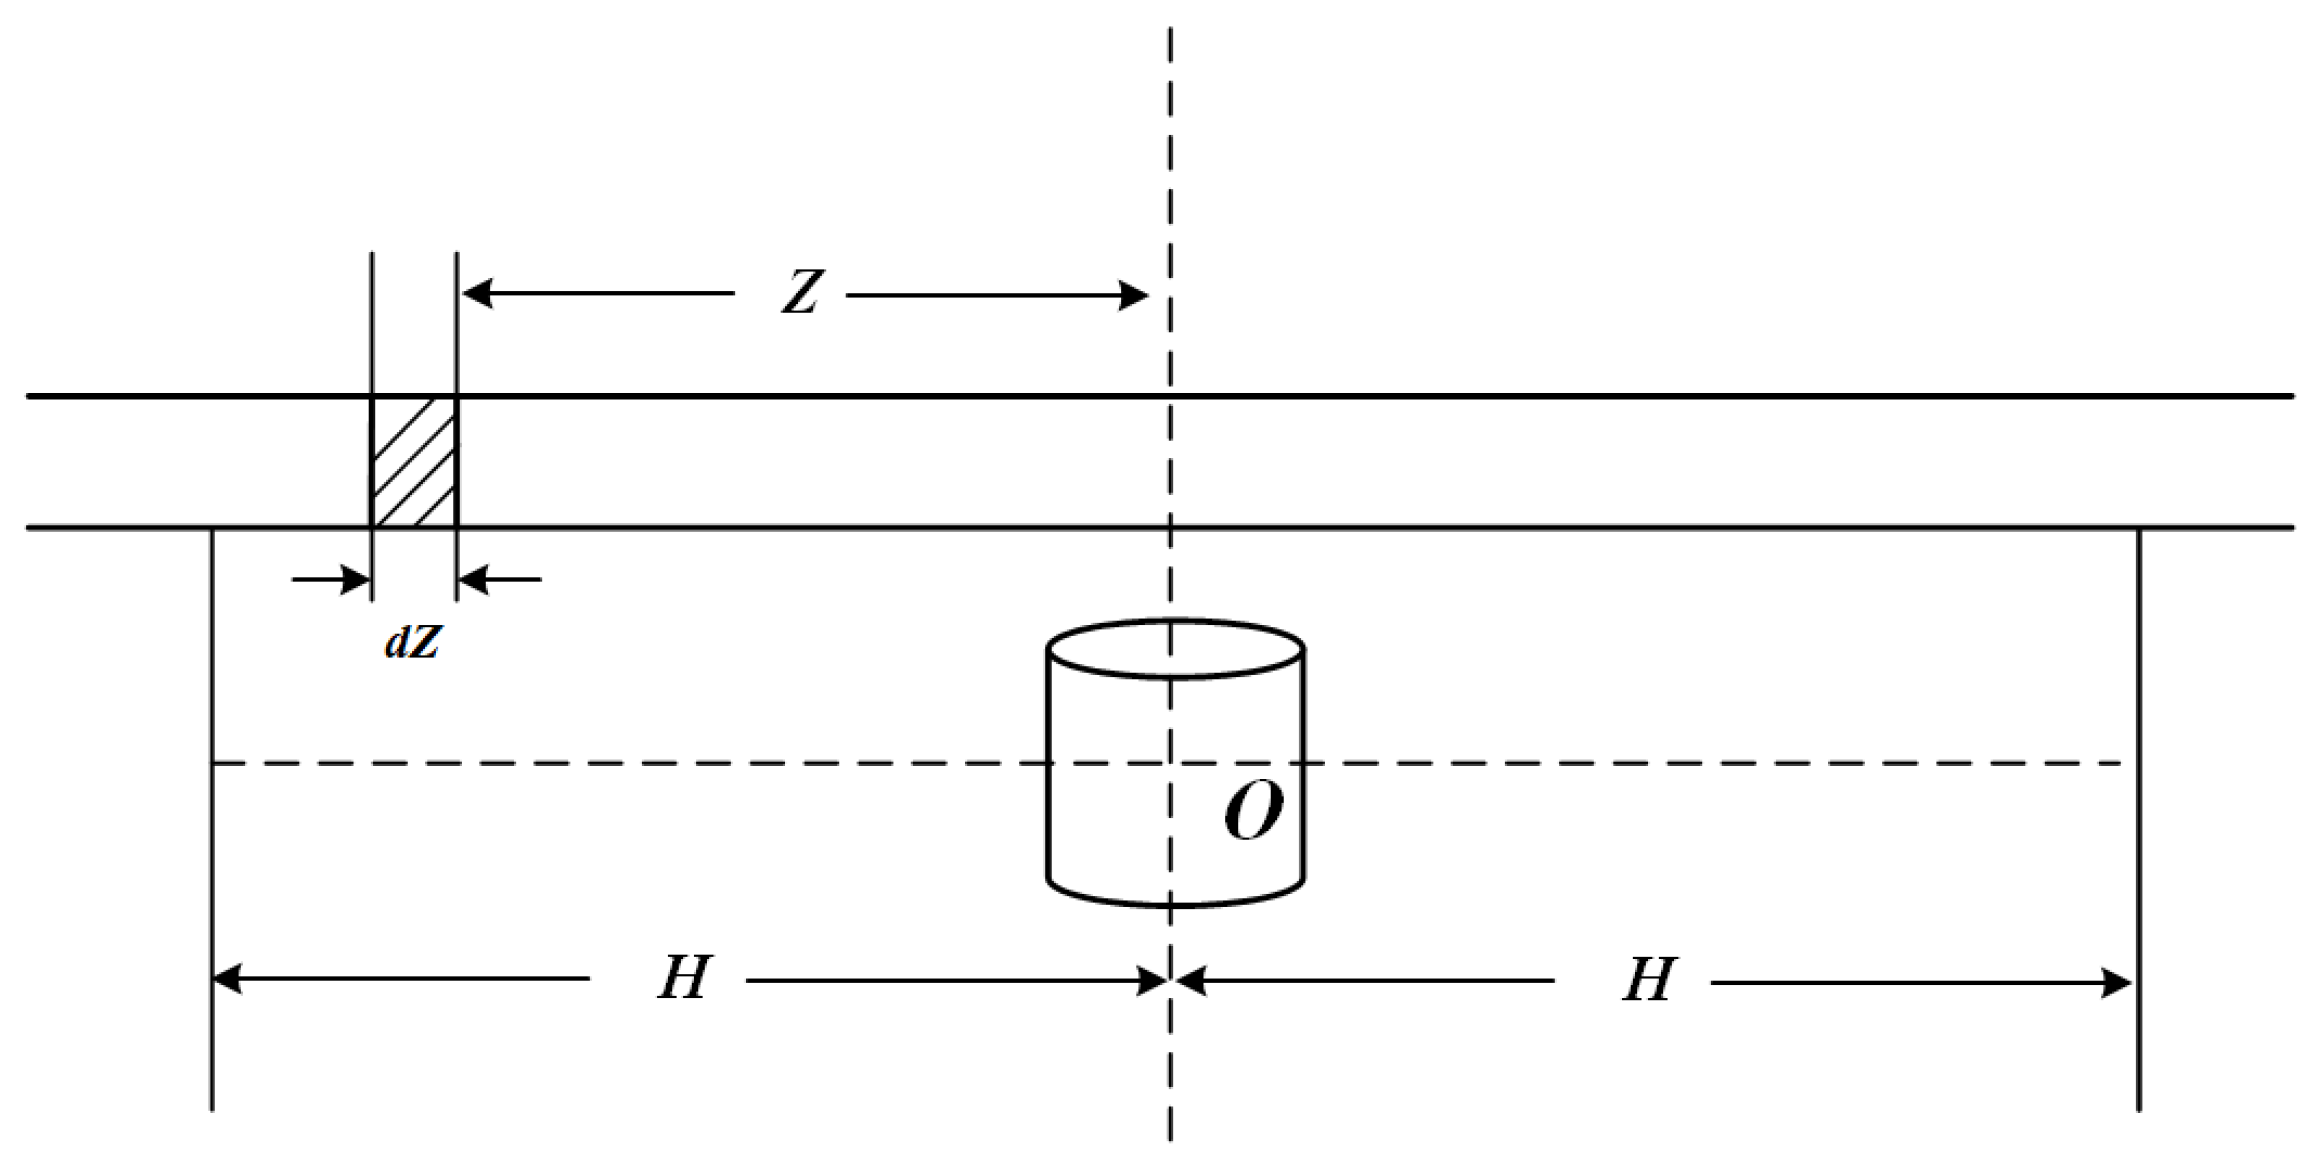
Figure 1 schematically illustrates the convolution model. The uranium grade distribution of an individual unit layer is denoted by , while the corresponding gamma-counting rate is represented by . These two quantities are linked by the detector response function and satisfy the following convolution relationship:
Figure 1.
Measurement model for a saturated ore segment. O denotes the detector center (axial coordinate origin), and H denotes the maximum effective detection distance used to define the truncation range where the response becomes negligible. The dashed line represents a reference axis centered at the detector’s geometric origin O, defining the longitudinal coordinate (i.e., distance along the conveyor belt direction) of the ore relative to the detector during continuous belt transport.
In this expression, K0 denotes the conversion coefficient that relates the gamma spectral counting rate at the detector center to the uranium grade. denotes the detector response function as a function of axial distance Z from the detector center.
Given that the detector response attenuates exponentially with distance, can be approximated by an exponential function [28]:
In this equation, α is the characteristic parameter whose value depends on the detector configuration, the energy window settings, and the geometric properties of the ore.
Taking the Fourier transform of Equation (1) with respect to Z, denoting , , and , where ω is the spatial frequency, the convolution theorem yields
Equation (3) gives the product relationship in the frequency domain between the spectrum of the counting signal and the spectrum of the grade distribution through the system response spectrum. Therefore, an inverse filter can be constructed within the non-zero frequency band of the response spectrum, and the corresponding space-domain anti-impulse response function can be obtained to achieve deconvolution-based reconstruction.
Let be the inverse filter, and be the anti-impulse response function; then,
For the bi-exponential response in Equation (2), the ideal inverse filter corresponds to the following anti-impulse response function [27]:
Here, and denote the Dirac delta function and its second derivative, respectively.
Substituting Equation (6) into Equation (5) yields the solution formula for the uranium grade:
In practical measurements, the gamma spectral counting rate is acquired as discrete data along the axial coordinate Z. With a sampling interval of , the continuous formulation is evaluated using finite-difference approximations. At each sampling point Zi, the relationship between and is given by
Under discrete sampling conditions, the grade calculation in Equation (8) achieves second-order accuracy. To further improve derivative accuracy, higher-order interpolation polynomials can be employed, and multi-point deconvolution operators can be constructed using Lagrange interpolation [29]. As the operator length increases, truncation errors generally decrease; however, counting noise is also amplified, which can induce numerical oscillations and reduce the stability of the inversion results [30,31]. Therefore, the operator length should be selected to balance accuracy and noise robustness under the actual measurement conditions [32].
In engineering practice, the three-point deconvolution method is widely employed to ensure stable and reliable real-time computation, and it often serves as a standard deconvolution operator. This method is computationally straightforward, exhibits smooth response characteristics, and effectively limits the amplification of random fluctuations while preserving adequate accuracy. It is therefore particularly suitable for online grade reconstruction of low-grade uranium ores [32].
Accordingly, when a continuous ore stream passes through the detection region, the detector receives a counting signal formed by the superposition of radiation fields from multiple ore segments, which complicates the direct separation of individual segment contributions. By applying deconvolution, the superimposed counting curve can be decomposed, which enables the reconstruction of segment-averaged grades and provides a reliable basis for downstream sorting decisions.
2.2. Adaptive Determination of the Characteristic Parameter
The selection of the characteristic parameter α is crucial for deconvolution because it governs the shape and stability of the reconstructed grade profile. The optimal value of α depends on multiple factors and should be determined with reference to specific measurement conditions and experimental settings. An inappropriate choice of α may cause pronounced oscillations in the reconstructed profile and may yield unphysical negative values. Accordingly, this study adopts a relative discrimination factor (RDF) method to adaptively estimate α, thereby ensuring that the inversion results closely reflect the actual grade distribution [33]. The procedure is summarized as follows:
(1) Initial Value Calculation and Extreme Point Extraction
An initial parameter α0 is selected, and the measured counting rate is initially deconvolved to obtain a preliminary grade profile . The maximum and minimum values, and , together with their corresponding positions, and , are recorded.
(2) Construction of the Discrimination-Factor Limit
Based on the preliminary reconstruction results and , the discrimination-factor limit E is defined as given in Equation (5):
Here, . The discrimination factor reflects the amplitude range of the reconstructed grade profile and is used to assess the suitability of the selected α value and guide subsequent parameter adjustment.
(3) Determination of the Optimal α
The optimal value of the characteristic parameter α is determined from the extrema at and and the count rates at the neighboring sampling points. The calculation is given in Equation (10).
2.3. Final Grade Calculation and Application
After the adaptive update of the characteristic parameter α is completed, we performed a second deconvolution on the measured count rates using the optimal α to obtain the final reconstructed grade for each unit layer.
During operation, continuous sampling is conducted at a predetermined interval to acquire the gamma-counting rates of the flowing ore. Accordingly, the ore stream along the conveyor is discretized into unit layers of length , where v is the belt velocity. By applying the adaptively estimated α and performing two deconvolution iterations, the average grade of each unit layer is reconstructed. Finally, the reconstructed grades are compared with predefined threshold values to classify ore and waste, thereby enabling online uranium ore sorting.
3. Experiment
3.1. Experimental Setup
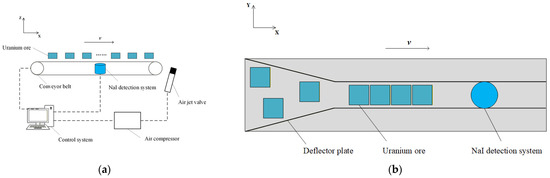
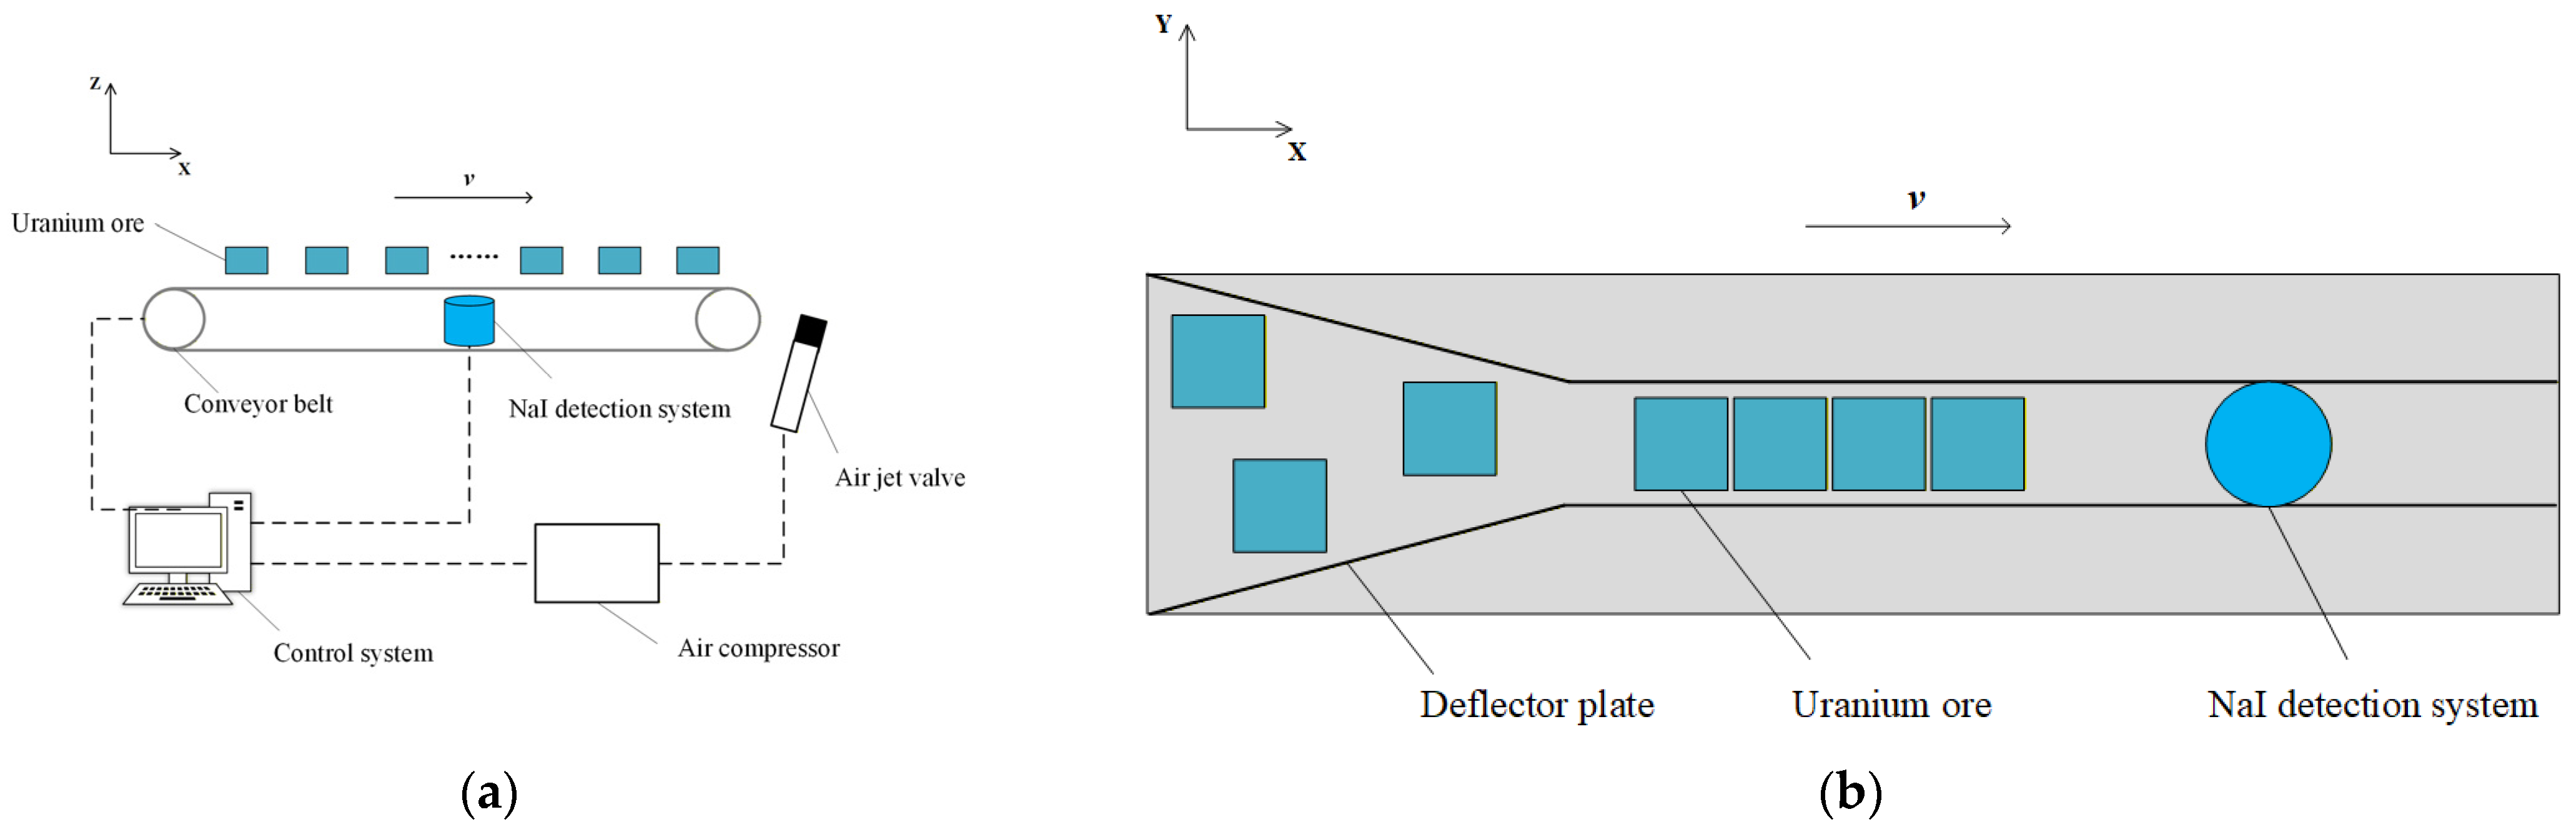
The experimental platform primarily consists of an ore guide chute, a belt conveyor system, a radioactive detection system, and a data acquisition and processing unit, as shown in Figure 2. Ore was uniformly fed onto the conveyor centerline via a vibrating feeder and was transported through the detection zone at a constant belt speed, which ensured a stable, continuous ore flow. The detector was mounted beneath the conveyor belt.
Figure 2.
Uranium ore radiometric sorting apparatus: (a) front view; (b) top view.
The radioactive detection system employed a NaI(Tl) scintillation detector coupled with a multichannel analyzer (MCA). After energy calibration, this study selected a 400–2000 keV energy window for integrated gamma counting to emphasize the medium-to high-energy gamma peaks of 214Pb and 214Bi while suppressing low-energy scattered components. The data acquisition time was set to 160 ms, and the belt speed was 0.5 m/s, which corresponded to a unit-layer length of 8 cm and balanced position resolution with signal stability. Prior to the experiments, background counting and subtraction were performed to ensure that the recorded counts reflected the intrinsic radioactivity of the ore. This setup enabled continuous acquisition of gamma-counting rates from the ore flow and provided reliable input data for subsequent deconvolution and grade reconstruction.
Online sampling is performed continuously. In real-time implementation, the three-point deconvolution operator is equivalent to introducing a fixed delay of one sampling period (corresponding to a spatial shift ). Considering the actuator response time and the physical distance between the detector and actuator (e.g., air jet valve), this fixed delay can be synchronized and compensated in the control logic by calibrating v and dt. As long as the transport time from the detector to the actuator exceeds one sampling period, the online decision and actuation can be accurately aligned.
3.2. Sample Preparation and Experimental Model
To evaluate the applicability of the deconvolution method under varying ore grades and segment configurations, we prepared a set of experimental samples, including waste rock (<0.01% eU) and uranium ores of different grades. The samples were sieved to a particle size range of 40–60 mm to represent typical granularity under industrial crushing conditions. The reference grade of each rock sample was determined by offline gamma-ray spectrometry in a low-background lead shield. The system was calibrated using standard sources for energy and efficiency, and the uranium content was calculated by a relative method based on the calibrated response of the selected energy region. In this study, uranium grade was expressed in units of 0.01% eU, where eU denotes the equivalent uranium content derived from gamma emissions of 214Pb, 214Bi, and other uranium decay progeny under the assumption of radioactive equilibrium. This unit facilitates direct comparison between gamma-based grade reconstruction and radiometric sorting results. For reference, 0.01% eU is equivalent to 100 ppm U.
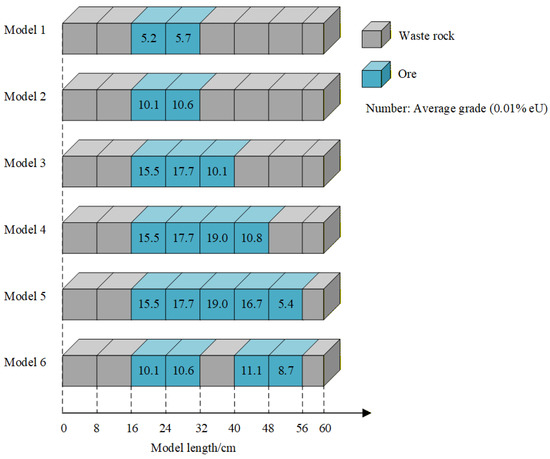
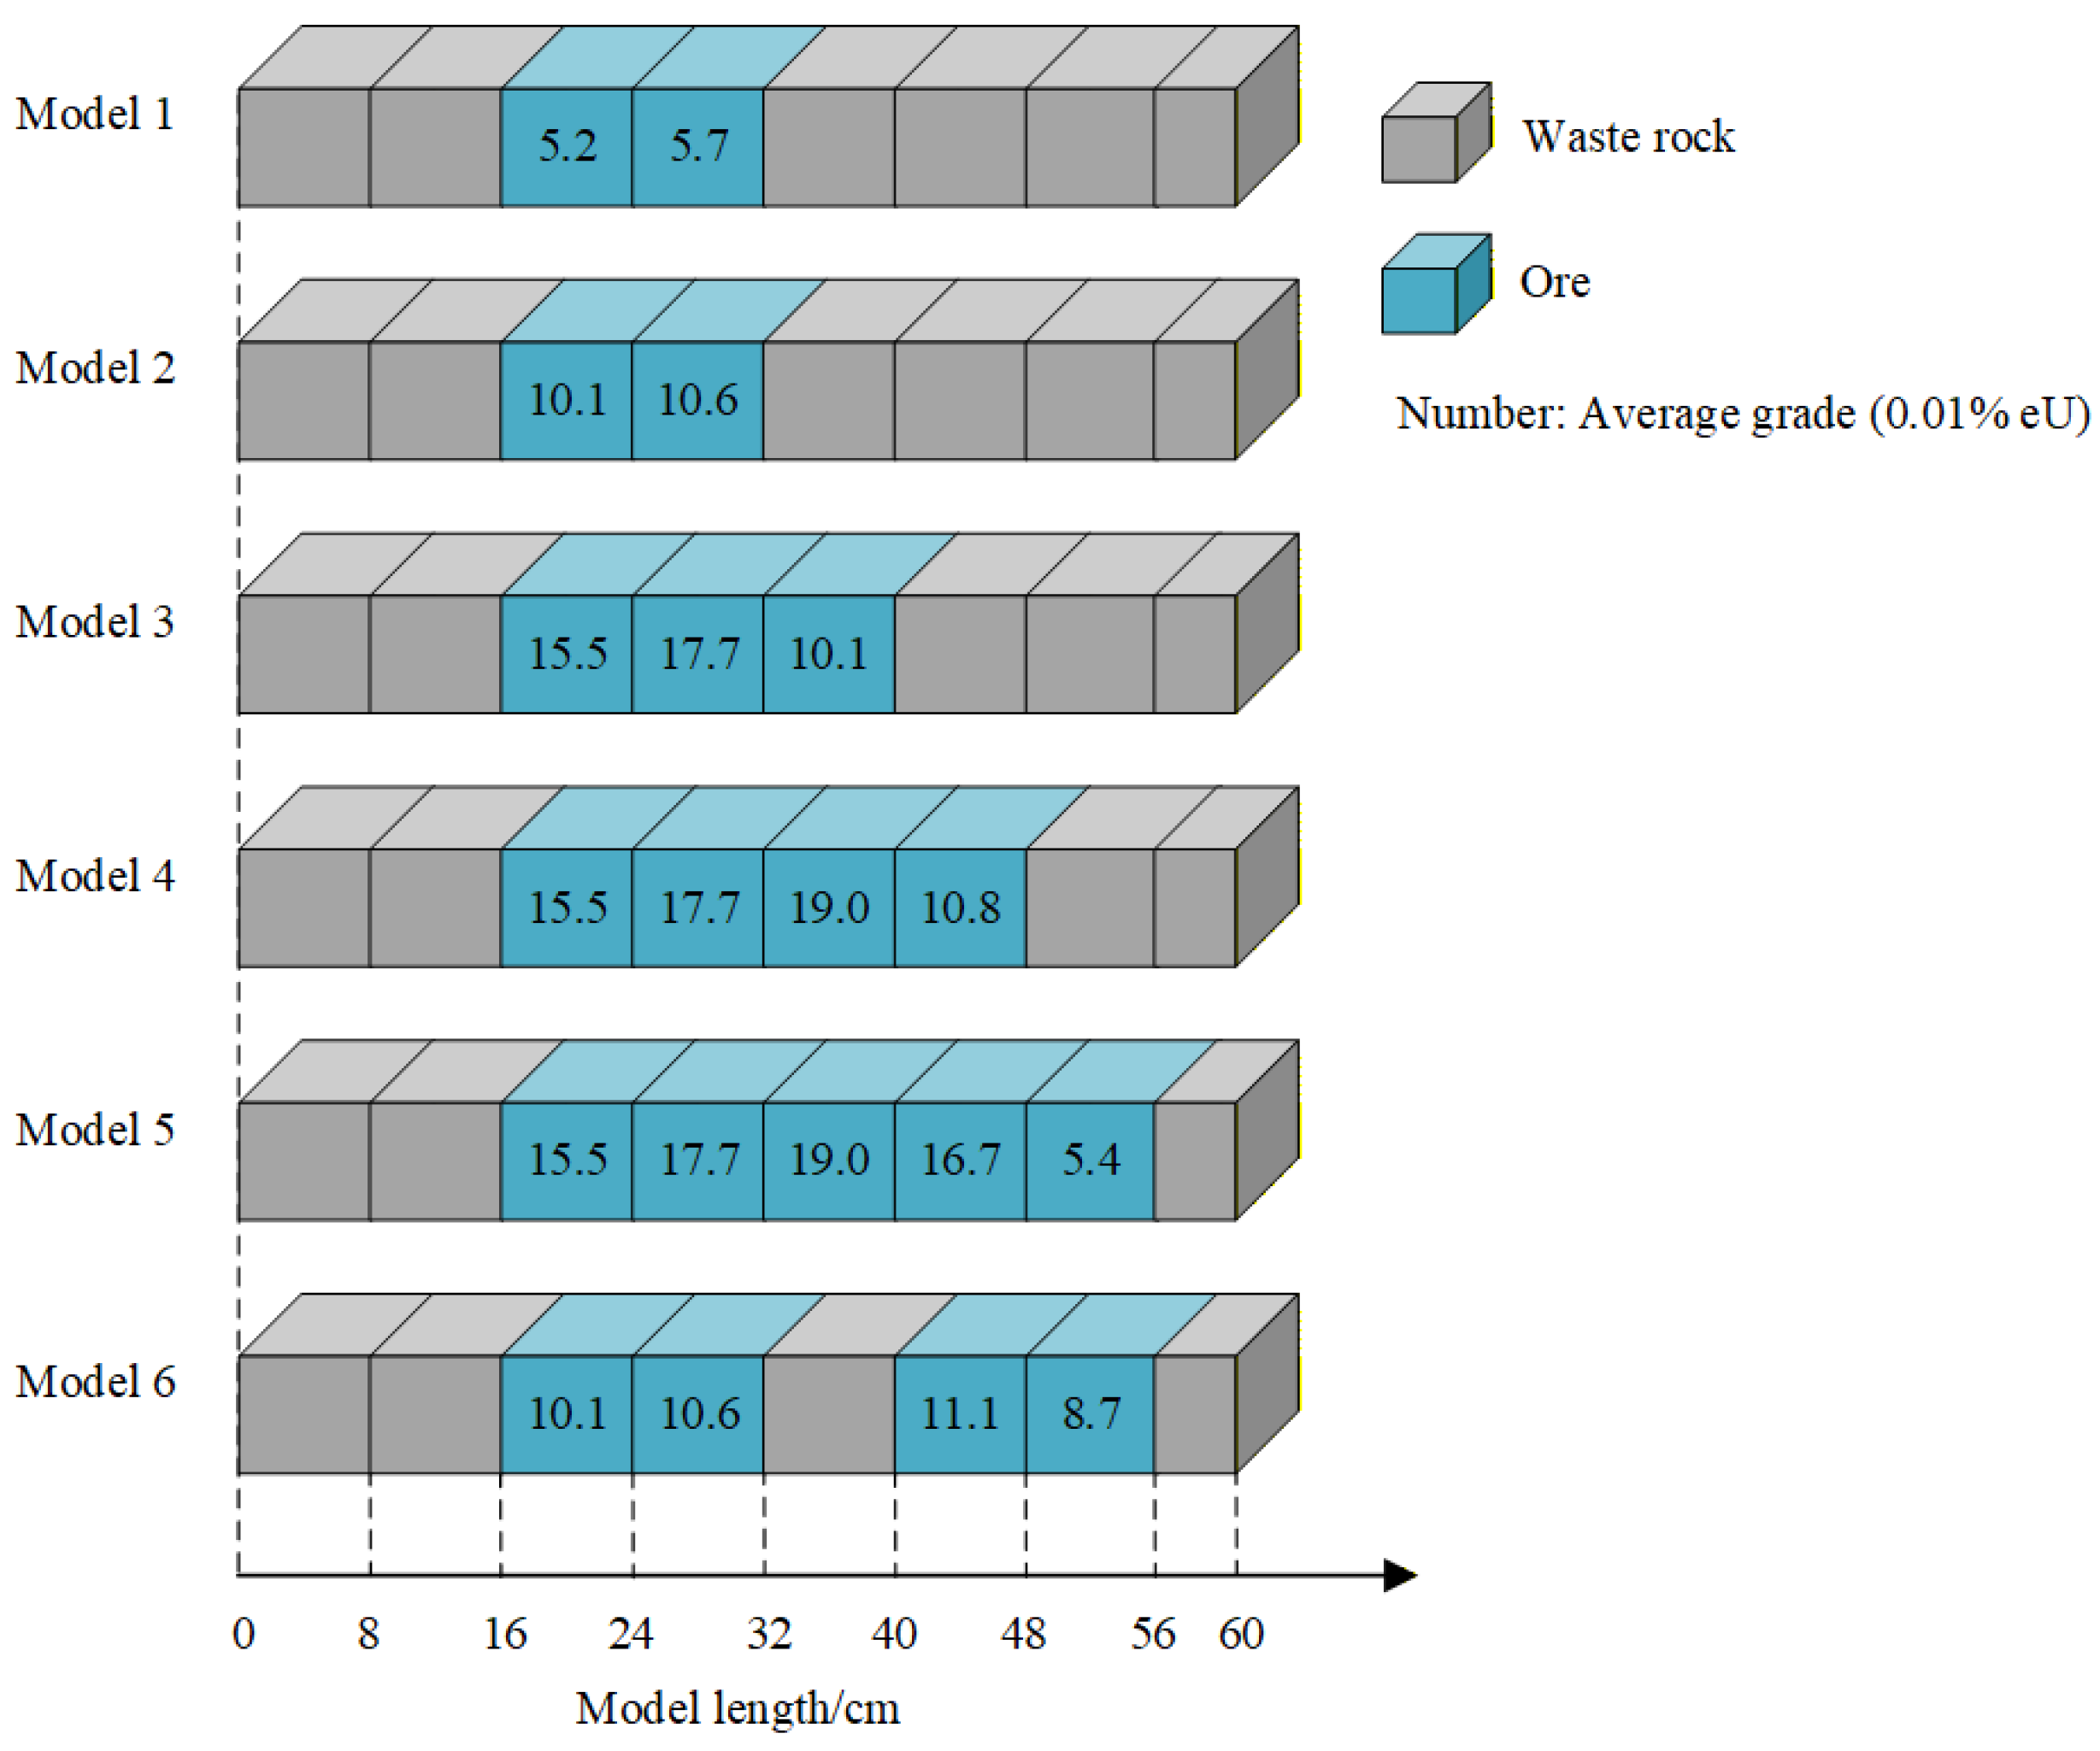
To reflect the commonly observed occurrence of localized high-grade zones in industrial sorting, this study constructed a “waste–ore–waste” sandwich-structured model to simulate the typical alternation of ore and waste within a run-of-mine stream. The total model length was 60 cm, and the ore-segment length and grade were adjustable, as illustrated in Figure 3. This configuration captures the high-grade ore regions and waste-rock regions, which makes it a suitable testbed for systematically evaluating the deconvolution algorithm in terms of boundary suppression and grade reconstruction performance.
Figure 3.
Schematic diagram of the sorting model’s structure.
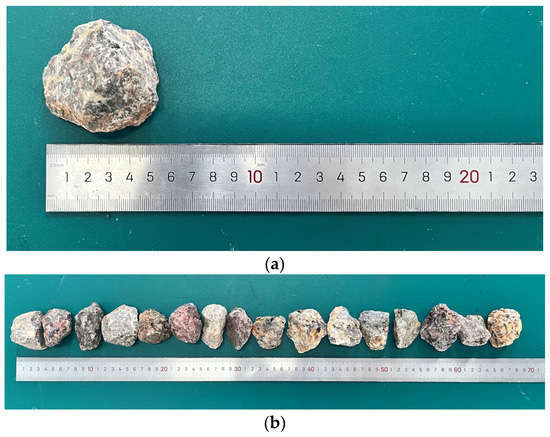
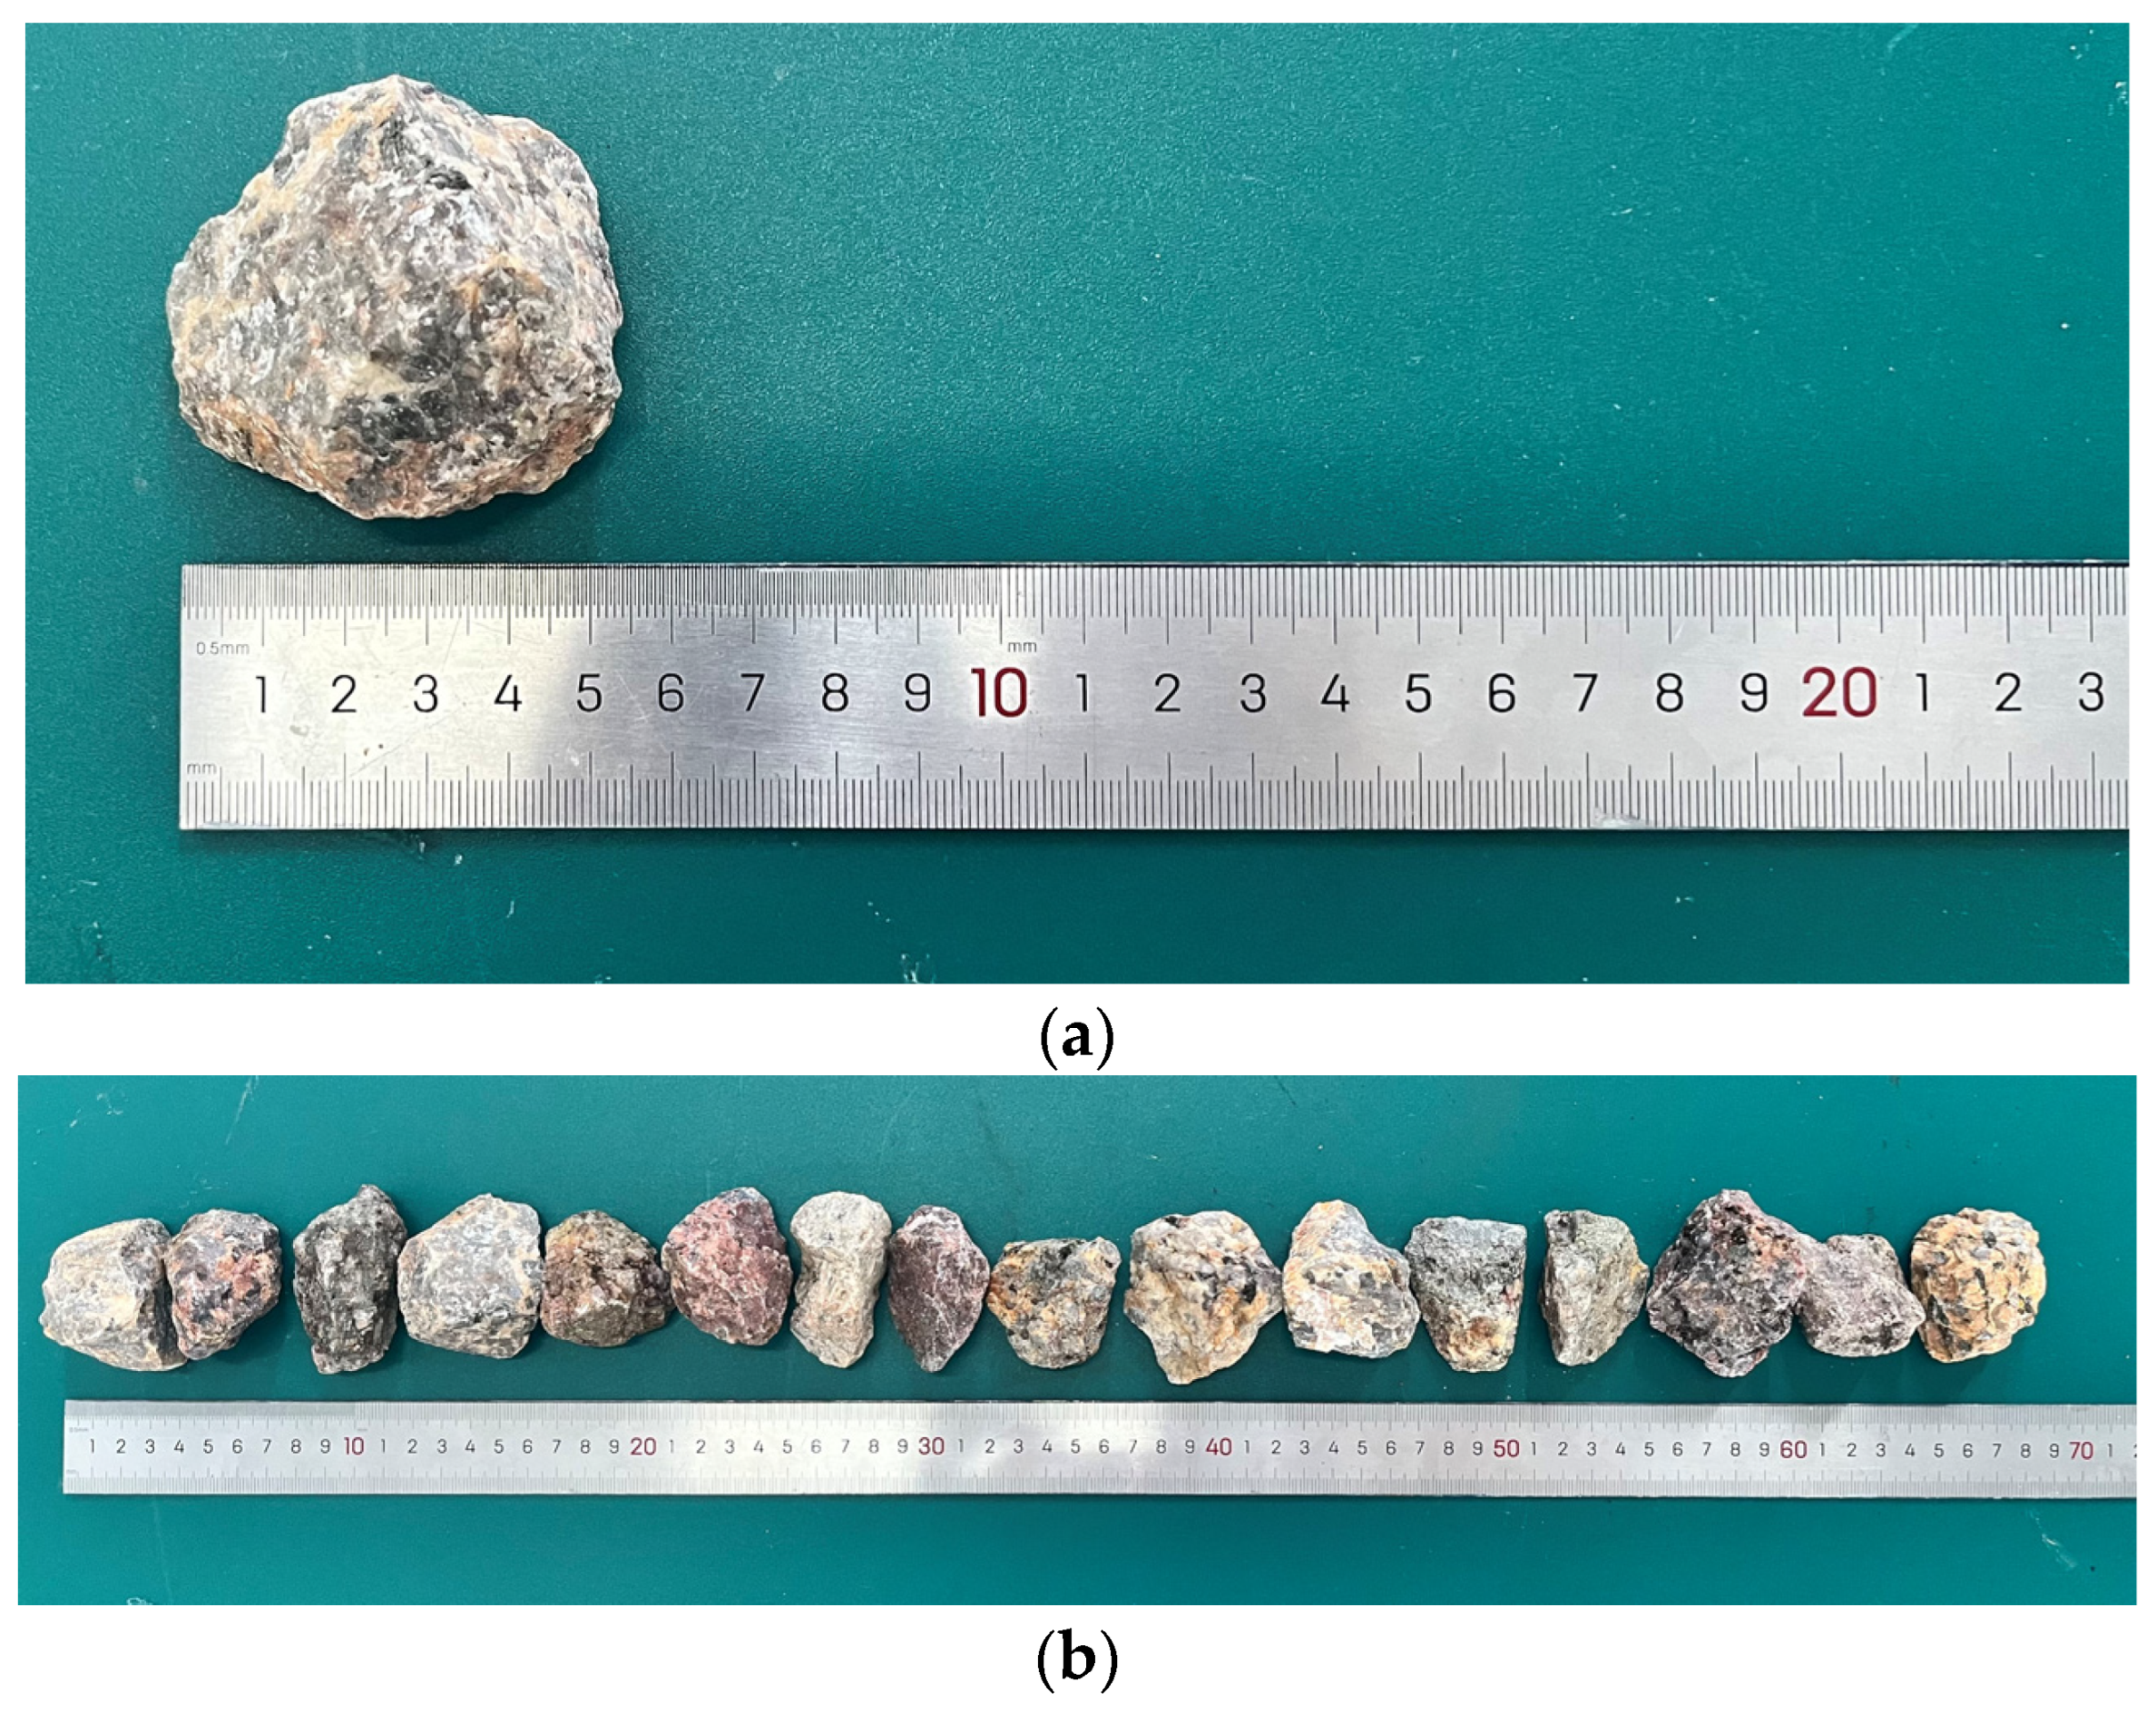
The physical specimens of the ore samples and the sorting model are presented in Figure 4. During the experiments, the samples were laid out along the belt centerline in the prescribed sequence and were arranged continuously and closely to satisfy the superimposed counting condition, thereby reproducing the count-rate overlap caused by adjacent ore segments.
Figure 4.
Photographs of (a) raw ore samples and (b) the sorting model.
The sample model in this study uses relatively small particles arranged in a single-layer bed, which keeps the internal source-to-detector distance relatively consistent and helps focus on axial overlap and deconvolution-based separation. When the particle size increases, and multilayer piling results in a thicker bed, distance correction and self-absorption correction must be applied using the average bed thickness (i.e., pile height) to mitigate distortions in count-grade mapping arising from three-dimensional geometric effects and spatially varying absorption.
3.3. Calibration of Conversion Coefficient K0
The conversion coefficient K0 establishes a quantitative relationship between the gamma-counting rate and the uranium grade of the ore and serves as a key parameter for converting the detector’s counting response into an absolute uranium grade during deconvolution-based reconstruction. Because the deconvolution model describes only a relative relationship between the counting signal and the grade distribution, the reconstructed results cannot be mapped to the true uranium grade without accurate calibration of K0. Therefore, this study calibrated the K0 experimentally for the specified detector configuration and measurement conditions.
Given the characteristics of the gamma radiation field generated by an ore segment, the counting signal recorded by the detector can be expressed as the superposition of contributions from all positions within the segment. By definition, the detector pulse response function is spatially isotropic and satisfies the normalization condition:
As the ore-segment length increases symmetrically about the detector center, the contribution of distant material to the counting rate decreases and approaches zero. In practical measurements, this study defined a maximum effective detection distance H such that, for , the contribution to the counting rate becomes negligible [34]. Under this condition, Equation (12) holds:
Consequently, when the ore-segment length reaches 2H, a finite segment within the detection region can be approximated by an “infinitely long” segment, and the measured counting rate approaches a stable saturated value. Under this condition, Equation (1) reduces to a steady-state form for the saturated segment. For a uniform-grade saturated segment, the corresponding gamma-counting rate is given by
Here, q0 represents the average uranium grade of the ore segment. Thus, once the effective detection distance H is determined and the stable counting rate of a saturated segment is measured, the conversion coefficient K0 can be obtained.
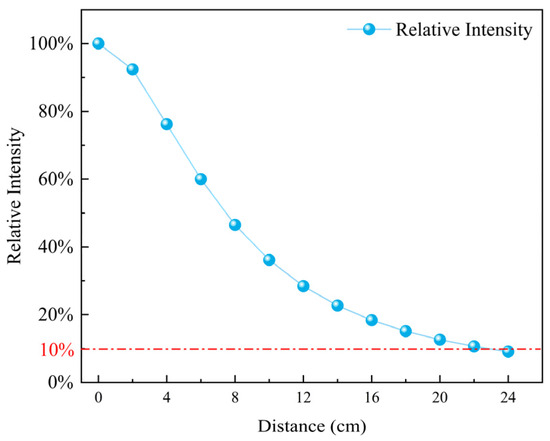
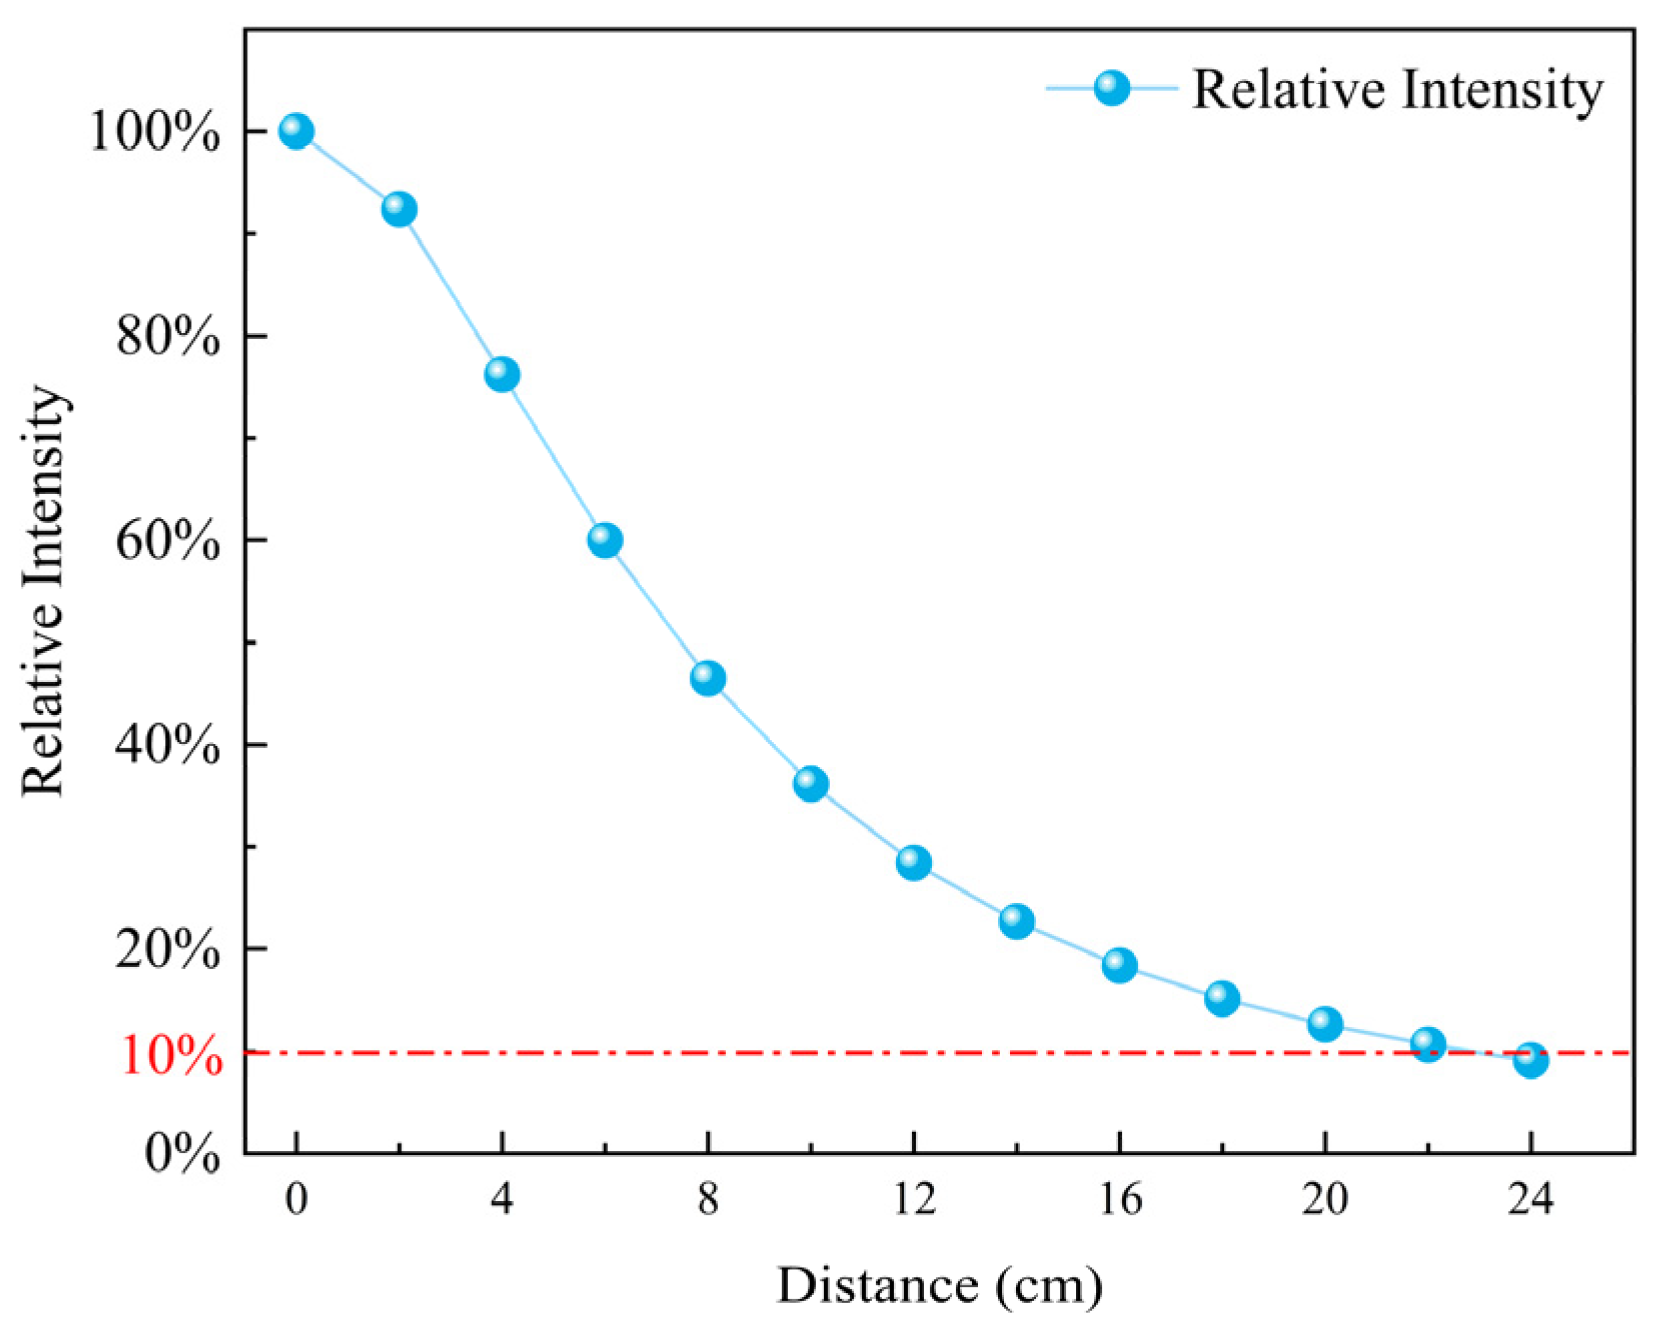
In this study, a Monte Carlo simulation was employed to develop a detection model for saturated ore segments and to quantify the relative contributions of ore units at different axial distances to the detector counting rate. The simulation results are presented in Figure 5. The simulation results showed that as the distance between an ore unit and the detector centerline increased, its relative contribution to the counting rate decreased approximately exponentially. When the distance exceeded 24 cm, the contribution fell below 10% of the centerline value, approached the level of statistical noise, and therefore had a negligible effect on grade reconstruction. Accordingly, this study defined the maximum effective detection distance as H = 24 cm.
Figure 5.
Relative gamma-counting intensity at different distances. The red dashed line represents a relative gamma count intensity of 10%, corresponding to a maximum effective detection distance of H = 24 cm.
In industrial systems, the relative-contribution threshold can be set lower (e.g., below 1%) by considering detector efficiency, background level, and counting statistics, so that the maximum effective detection distance H can be determined more accurately and the contribution from farther sections is not overly truncated. Therefore, H should be recalibrated according to detector parameters, background level, and operating conditions.
Based on the foregoing analysis, a saturated ore-segment model with a length of 2H = 48 cm was established to experimentally calibrate the conversion coefficient K0. For calibration, a homogeneous uranium ore sample with an average grade of 0.18% eU was packed to form a continuous ore segment along the conveying direction. Prior to measurement, background counting was measured and subtracted. Repeated measurements of the saturated segment were then performed, and the mean counting rate was obtained to reduce statistical fluctuations. By substituting the measured saturated counting rate into Equation (13), the conversion coefficient for the experimental system was determined as K0 = 5.25 cps/(0.01% eU).
4. Results and Discussion
Using the experimental setup and convolution measurement model described above, gamma-counting rate profiles were acquired under continuous ore flow conditions to evaluate the grade-reconstruction performance of the deconvolution method. Six sorting models were constructed to cover different ore grades, segment lengths, and discontinuous structures. Multiple comparative experiments were then conducted to assess the agreement between reconstructed and actual grades and to examine error sources, boundary effects, and the influence of sampling interval on reconstruction stability.
The experimental sampling time was set to 160 ms, which, combined with the conveyor speed, corresponds to a unit-layer length of ΔZ = 8 cm. This sampling interval determines the minimum spatial resolution for ore-segment identification and also affects the stability and boundary behavior of the deconvolution results. Thus, the choice of ΔZ reflects a trade-off between spatial resolution and statistical noise control. In this study, a unit-layer length of 8 cm was adopted to ensure adequate spatial resolution while keeping counting statistical fluctuations within an acceptable range, thereby providing good numerical stability for deconvolution-based reconstruction.
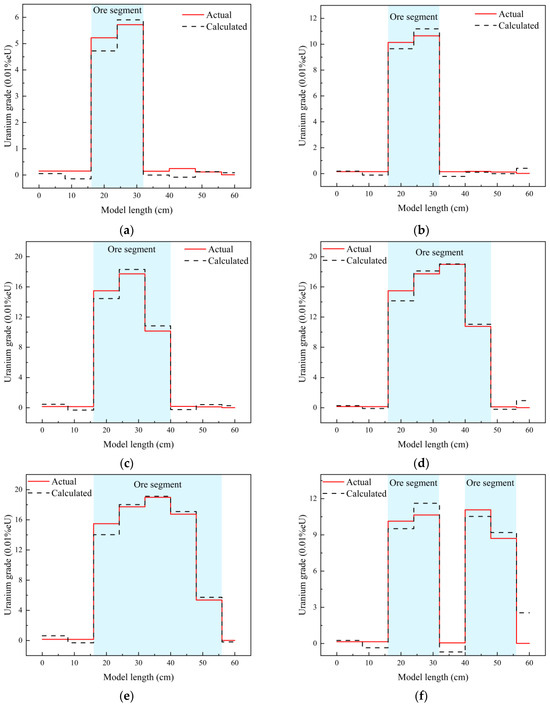
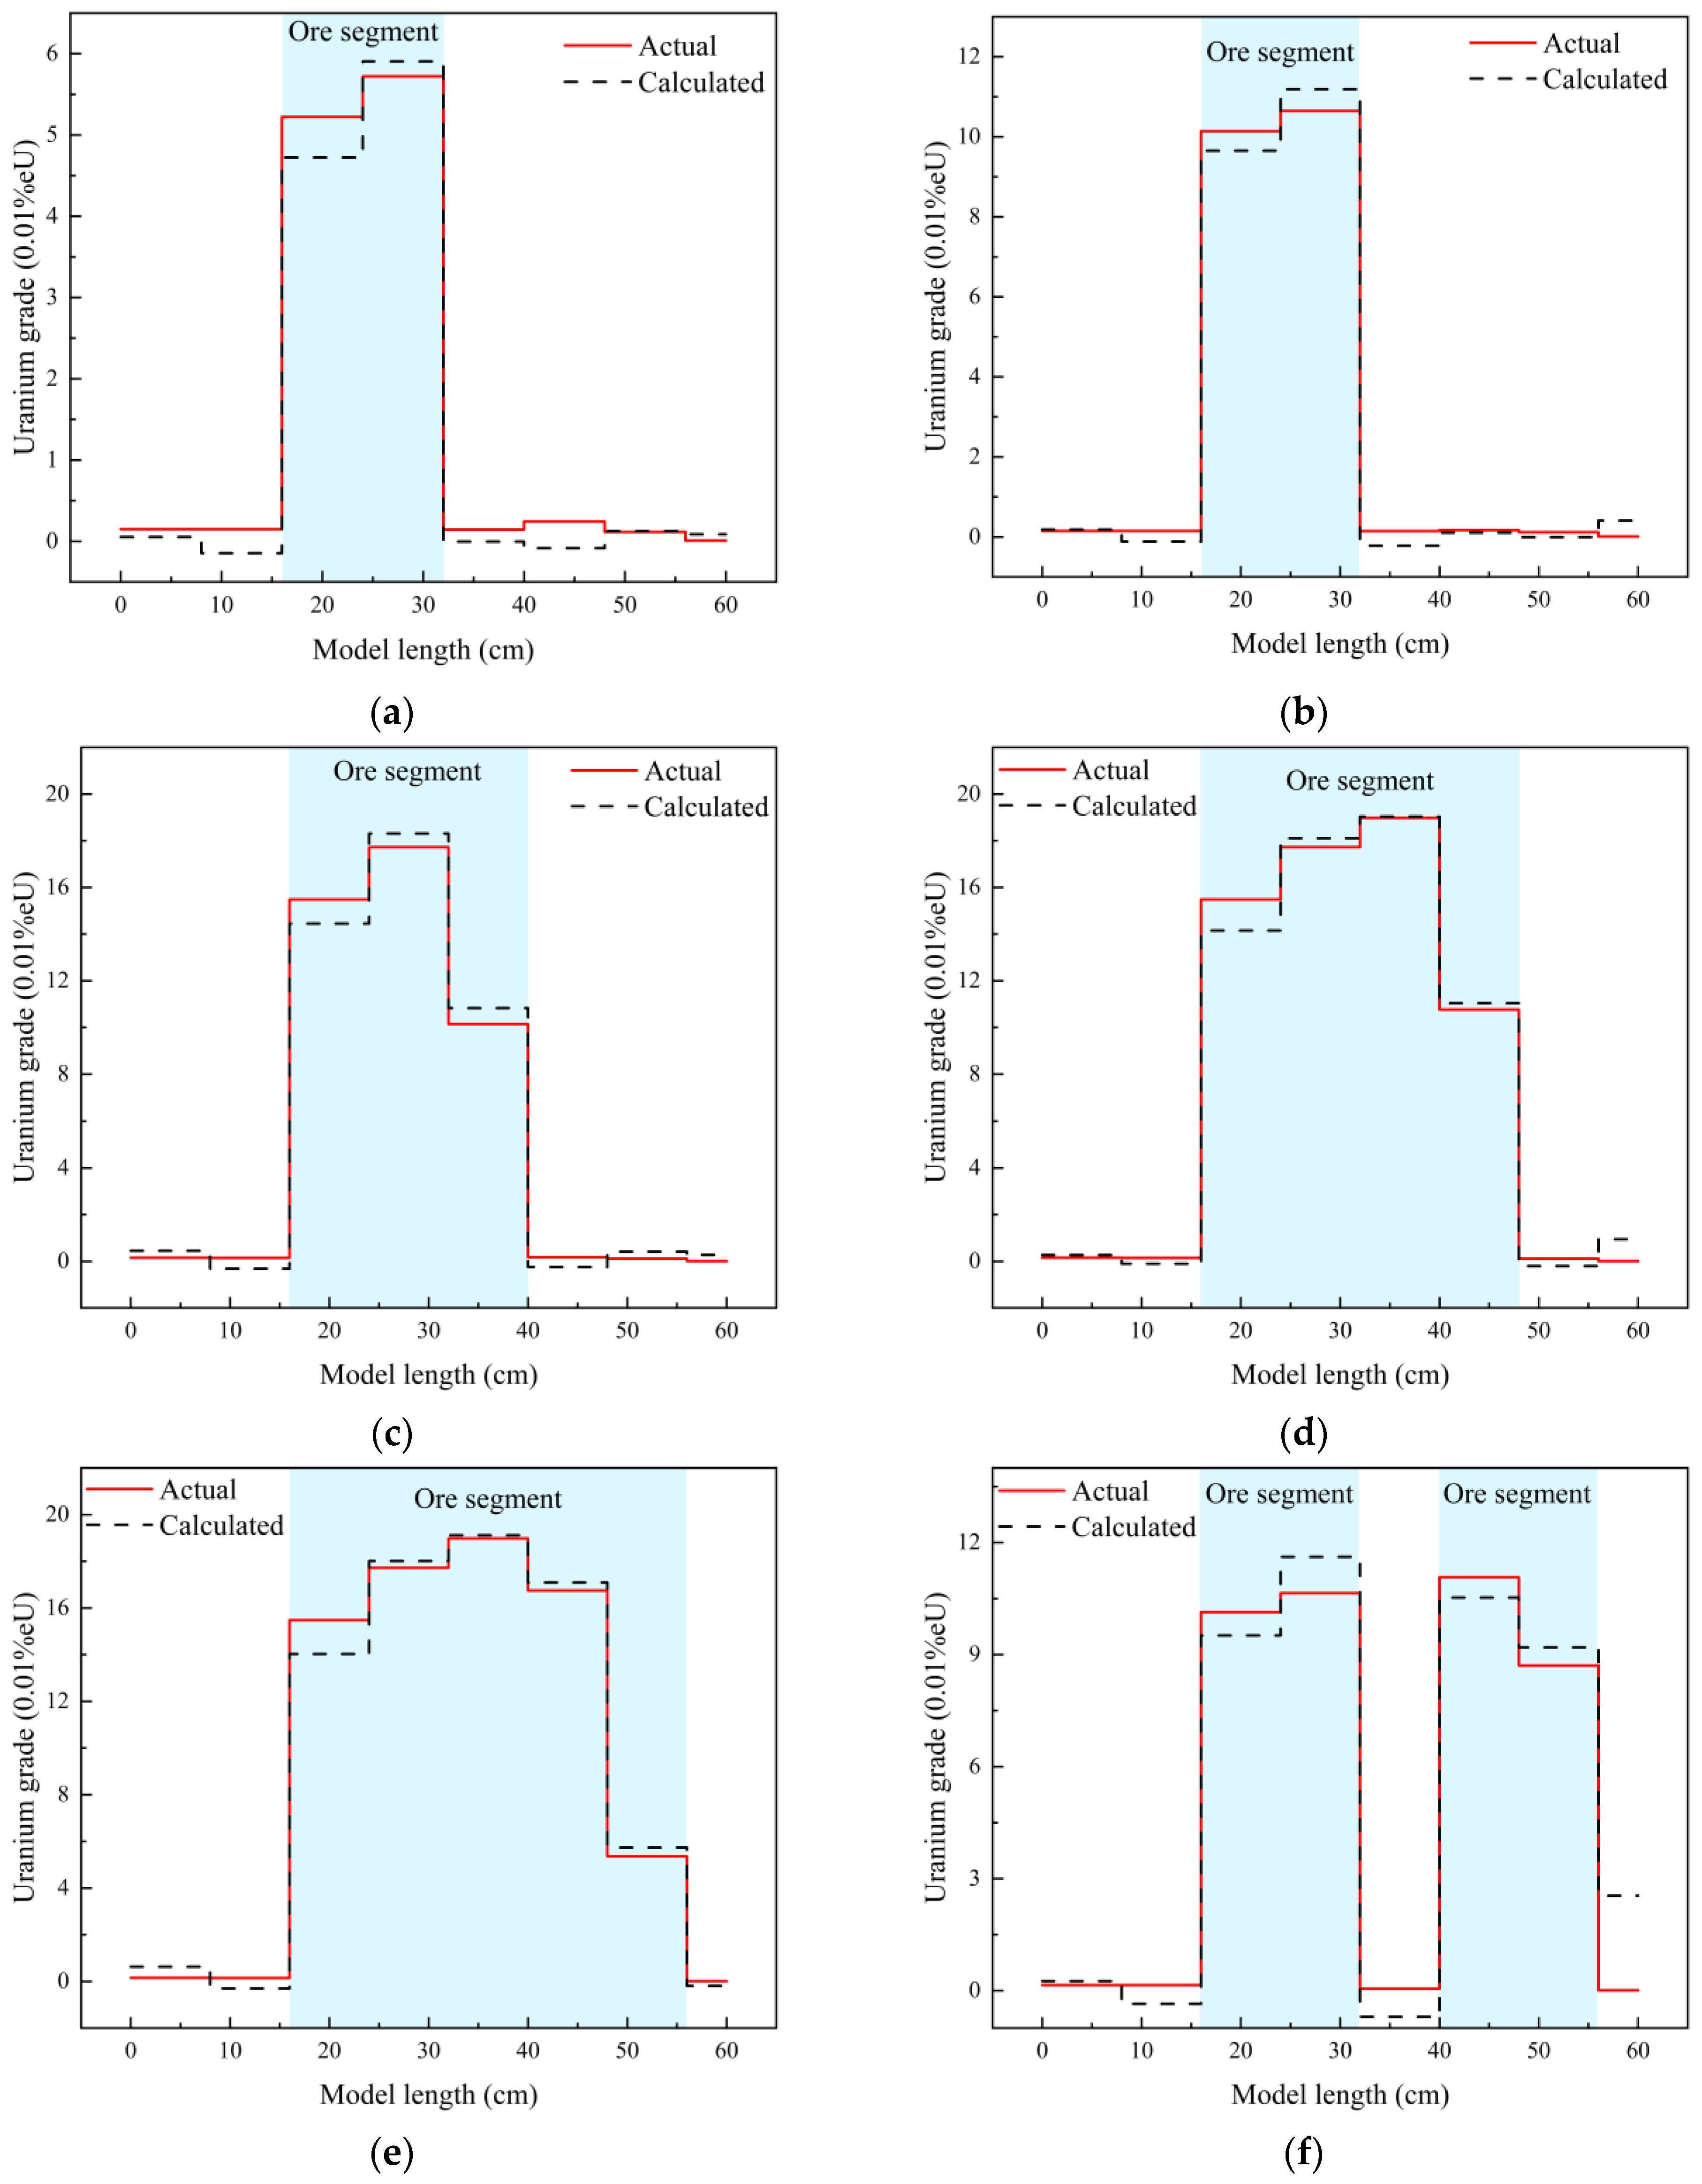
Figure 6a–f compare the actual grade distributions with the deconvolution-reconstructed grades for the six sorting models. The models covered ore grades of 0.05% eU (Figure 6a), 0.10% eU (Figure 6b), 0.15% eU (Figure 6c), and 0.18% eU (Figure 6d). Ore-segment lengths included 16 cm (Figure 6a,b), 24 cm (Figure 6c), 32 cm (Figure 6d), and 40 cm (Figure 6e), and a discontinuous ore-segment model was also considered (Figure 6f). Overall, the calculated grade distributions followed trends consistent with the actual grade distributions: the ore segments formed distinct grade plateaus, whereas the waste-rock background remained at low levels. The high-yield peaks were surrounded by a low-concentration region. These results indicate that the deconvolution method effectively recovered both ore-segment locations and grade variations from superimposed counting signals.
Figure 6.
Comparison of actual grade distributions with grades reconstructed by deconvolution for six sorting models: (a) 0.05% eU, 16 cm; (b) 0.10% eU, 16 cm; (c) 0.15% eU, 24 cm; (d) 0.18% eU, 32 cm; (e) 40 cm ore-segment length; and (f) a discontinuous ore-segment model.
A closer comparison showed that the calculated grade curves were typically more stable in the central regions of the ore segments, with minimal deviation from the true values. Near the ore–waste boundaries, however, the calculated curves exhibited pronounced fluctuations and occasionally yielded small negative values on the waste side. As the ore-segment length increased, the central stable plateau expanded, whereas the amplitude of boundary fluctuations decreased. This trend suggests that when segments are long relative to ΔZ, boundary effects on the reconstruction results are mitigated. For discontinuous segment models, the method remained capable of identifying the positions of intermediate ore segments and accurately recovering their average grades, thereby demonstrating robustness to complex ore-stream configurations.
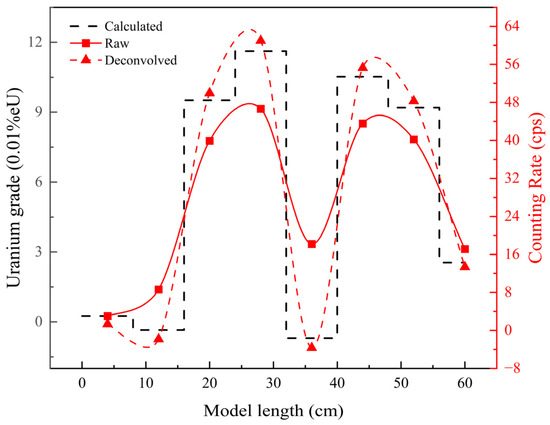
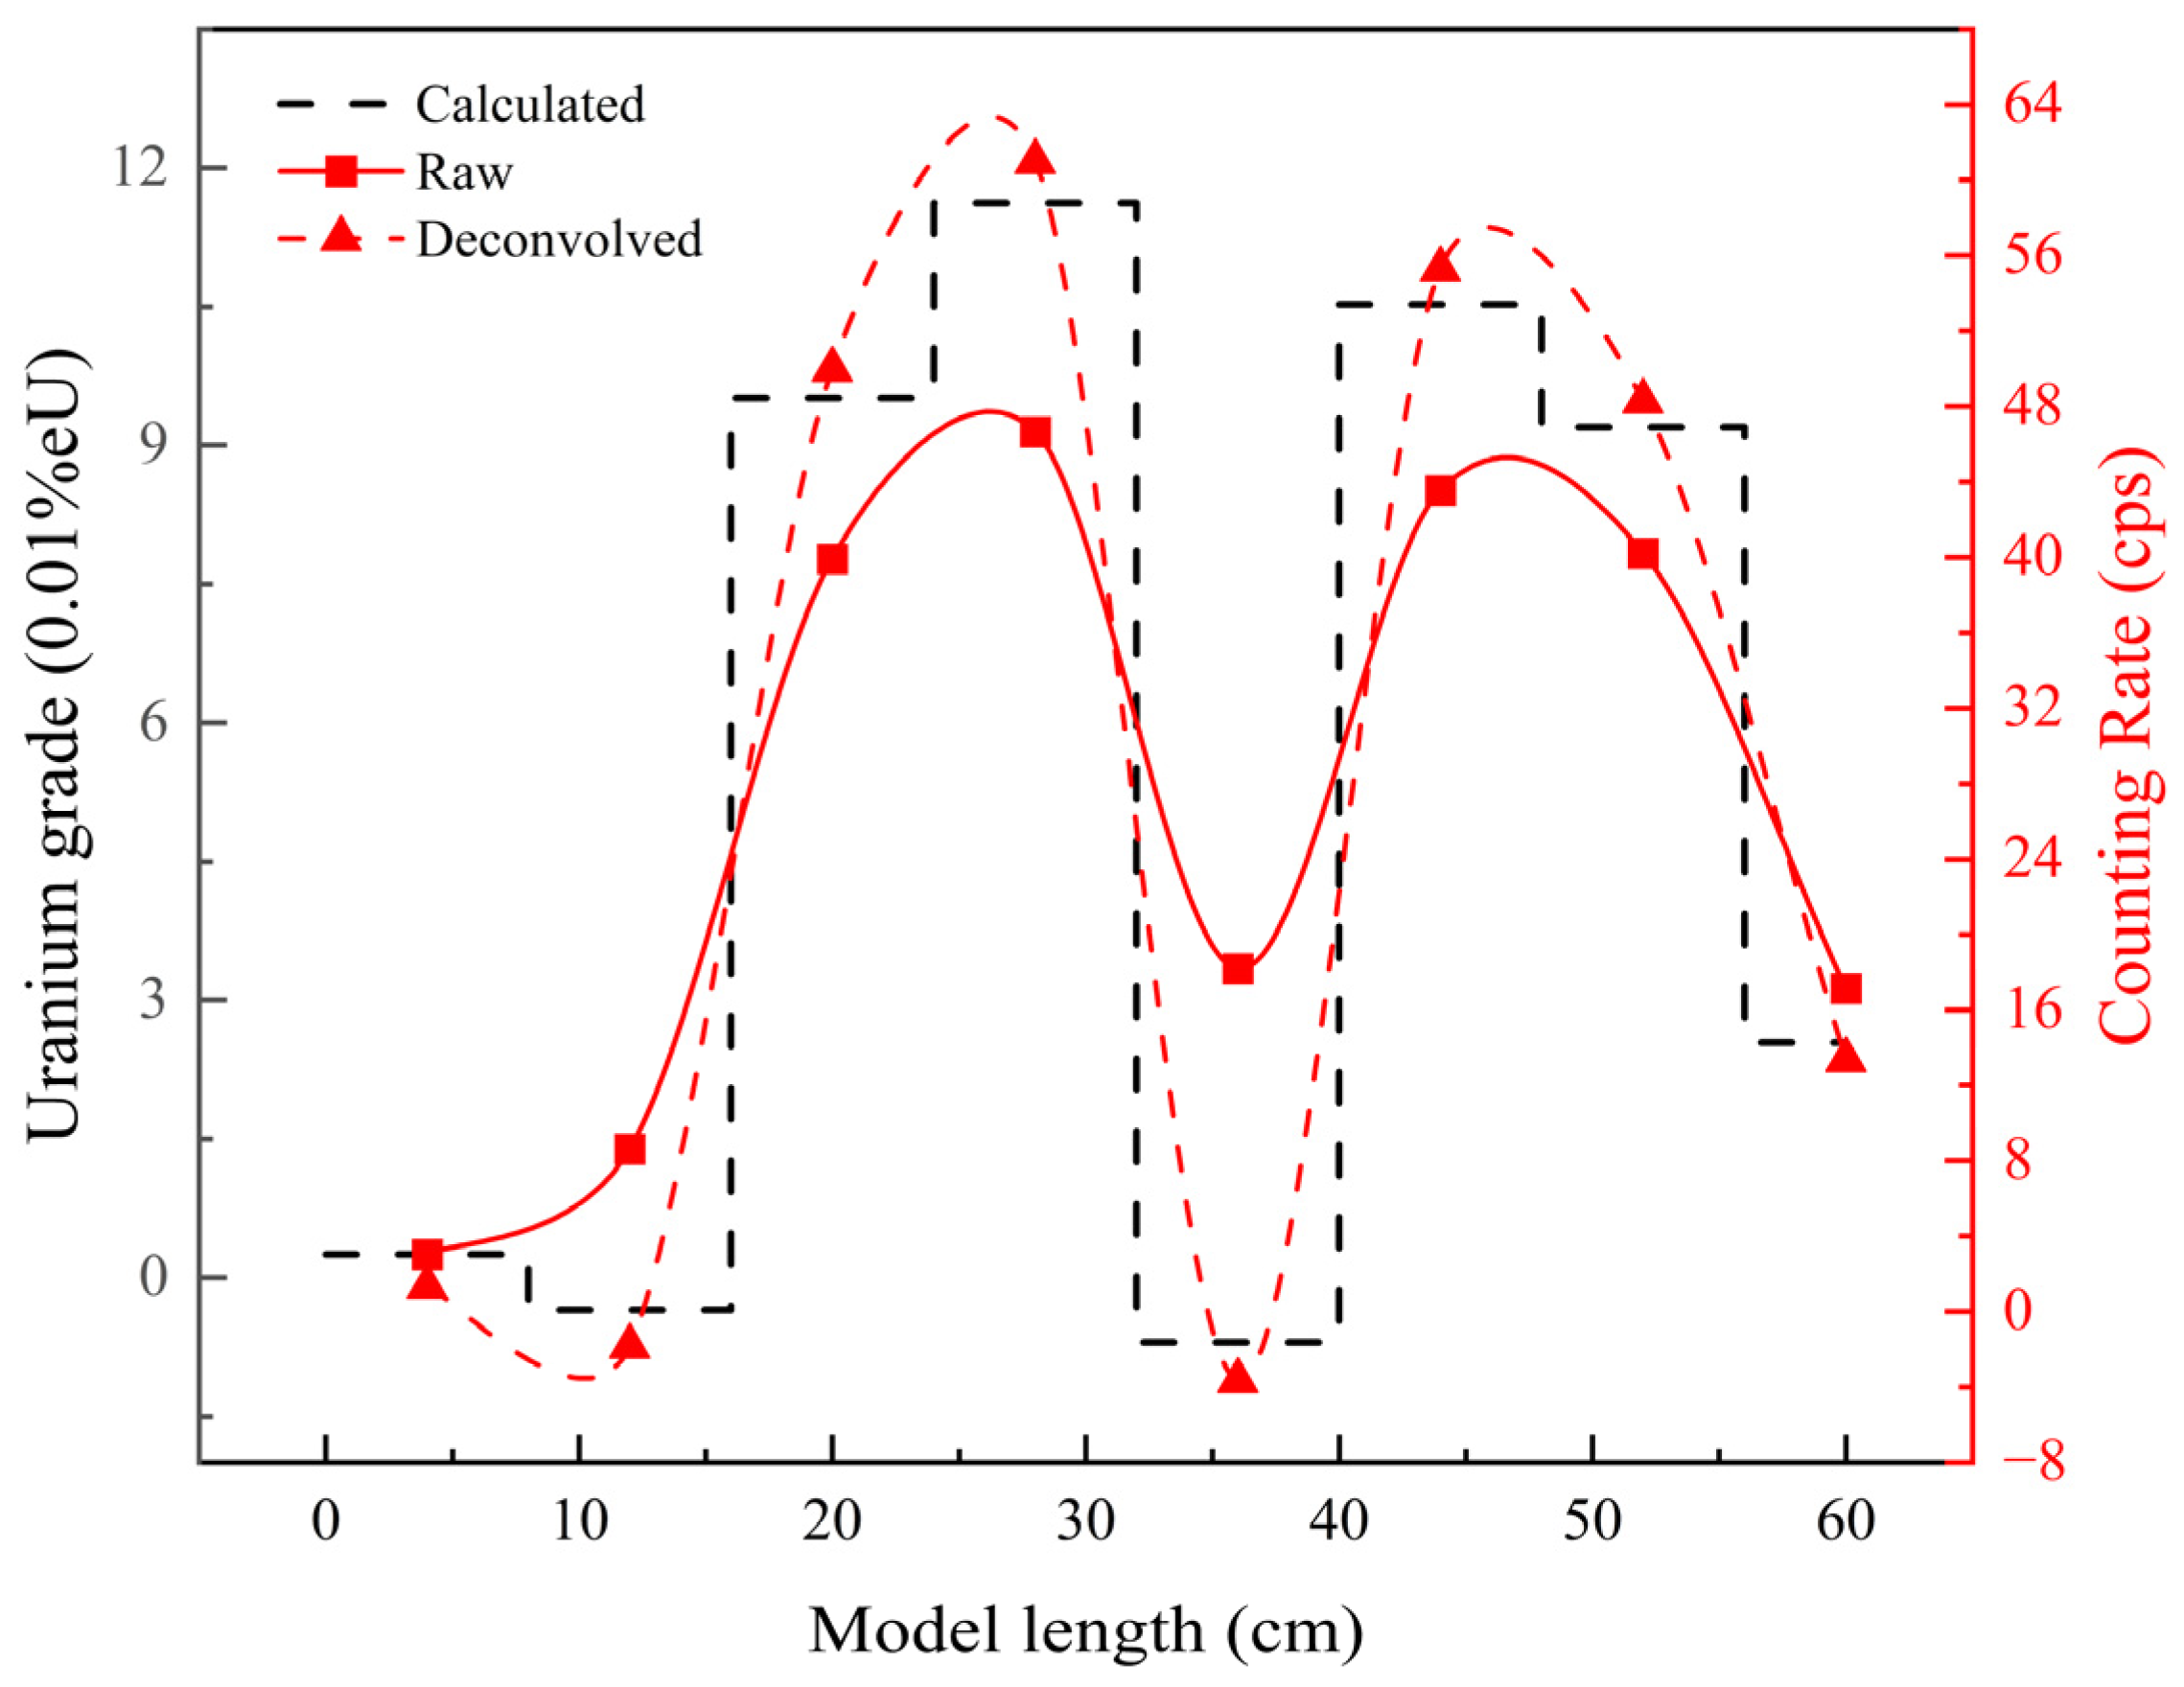
To visually illustrate both the efficacy and the challenges of deconvolution under continuous-flow conditions with superimposed counts, we added Figure 7 using the representative model in Figure 6f. Figure 7 shows the raw count sequence, the deconvolved count profile, and the corresponding grade sequence reconstructed by deconvolution.
Figure 7.
Raw counts, deconvolved counts, and reconstructed grade for the case in Figure 6f.
Table 1 summarizes the relative error statistics for each ore segment across the six sorting models. Overall, the absolute relative errors for all ore segments remained below 10%, and the mean absolute relative errors across the different models were below 5%, with no systematic bias associated with increasing or decreasing grade levels. These results indicate that, within the 0.05%–0.18% eU grade range, the proposed deconvolution-based reconstruction method achieves stable quantitative recovery and remains consistently applicable across varying ore grades.
Table 1.
Relative errors of calculated ore grades in the sorting models.
Taken together, Figure 6 and Table 1 indicate that errors were primarily concentrated in the transition regions near the ore–waste boundaries, whereas the central regions of the ore segments exhibited smaller and more stable deviations. As the ore-segment length increased relative to ΔZ, the proportion of boundary transition zones within the overall segment decreased, thereby yielding more stable and reliable grade estimates in the central regions.
During deconvolution-based grade reconstruction, localized oscillations and small negative values are commonly observed at ore–waste interfaces. In essence, this behavior reflects the numerical characteristics of deconvolution in the presence of noise and discrete differentiation and does not imply physically meaningful “negative grades.” The principal causes are as follows:
- Numerical error: The deconvolution formula involves derivative (finite-difference) terms. Finite differences are particularly sensitive to abrupt changes near boundaries and can therefore induce ringing and overshoot. These effects are exacerbated when ore segments are short or when the boundary is highly steep.
- Statistical noise: Gamma counts follow Poisson statistics, and random fluctuations arising from short integration times can be readily amplified during deconvolution. This amplification is most pronounced for low-grade segments and boundary regions, thereby degrading the stability of the calculated grade profile.
Under continuous-flow conditions, conventional intermittent single-particle strategies are not applicable; therefore, we used a direct-mapping baseline for comparison. Table 2 reports the grades obtained by directly mapping the continuous raw count rate to grade using the calibration coefficient K0 (without deconvolution) and the corresponding relative errors. Under overlapping radiation fields, count superposition causes the effective counts within a segment to be contaminated by contributions from neighboring segments, so a direct mapping cannot recover the local contribution. As a result, direct mapping exhibits a clear systematic bias and substantially larger relative errors than the proposed deconvolution-based inversion. This comparison indicates that, without separating and reconstructing the superimposed counting signal, reliable segment-averaged grade estimation is difficult to achieve, which limits the accuracy of high-throughput continuous radiometric sorting. Future work will focus on systematic head-to-head comparisons of three approaches. Specifically, we will compare (i) direct count-to-grade mapping without deconvolution, (ii) conventional decision schemes applicable to continuous broadened traces (e.g., fixed-threshold classification and moving-window/time-gated averaging), and (iii) the proposed deconvolution framework. These methods will be evaluated under strictly matched belt speed, sampling period, and feed presentation conditions, using unified sorting-relevant metrics (segment identification accuracy, segment-averaged grade error, ore loss, and waste rejection) to quantify their accuracy–throughput trade-offs.
Table 2.
Relative errors of grades obtained by direct mapping of the raw count rate (baseline without deconvolution).
In convolution–deconvolution terms, the measured count sequence is the convolution of the ore-grade distribution with the system response function and is therefore inherently smoothed. When exhibits abrupt changes at segment boundaries, high-frequency components become more prominent. Under the combined influence of statistical noise and truncation errors, the deconvolution process may over-reconstruct these high-frequency components, which manifests as spurious oscillations near the boundaries. Consequently, the calculated grade at any given point is subject to error, with the largest deviations occurring most frequently at the ore–waste interfaces. Furthermore, when the total ore length h is relatively short, and the sampling unit length ΔZ is comparatively large, boundary-induced deviations may also propagate into the central portion of the ore segment. Only when h is sufficiently long and ΔZ sufficiently small do the central-region errors converge toward a minimal level.
Taking model 4 as an example, the mean counts per sampling interval are approximately 17.4 and 3.8 counts per sample for the high-grade and background segments, respectively. Under the Poisson approximation, the corresponding relative statistical fluctuations are ~24% and ~51%, indicating that the background segment exhibits ~2.1 × higher relative noise. Considering that the deconvolution operator contains second-derivative terms that amplify high-frequency noise, low-grade segments and boundary regions are more sensitive to counting statistics.
Notably, the aforementioned boundary effects are primarily confined to the transition zones and therefore exert only a limited influence on ore-segment identification and average grade estimation. In practical sorting operations, decisions are typically based on segment-averaged grades or threshold criteria rather than instantaneous pointwise estimates. Consequently, provided that the magnitude of boundary negative values is appropriately bounded—for example, by suppressing overshoot through adaptive updating of the characteristic parameter α—these phenomena do not compromise the reliability of ore-segment sorting decisions. Moreover, the sensitivity of waste-side negative values and boundary ringing to variations in α provides a practical basis for adaptively estimating α using the relative discrimination factor (RDF) method proposed in this study.
Gamma self-absorption inside the ore makes the measured count rate sensitive to ore bed thickness (average depth), thereby introducing systematic uncertainty into the count-to-grade inversion. In this study, a thin single-layer bed was used, leading to limited thickness and source-to-detector distance variability, and thus minor self-absorption influence. For industrial sorting scenarios involving coarse particles and multilayer piling (i.e., significantly increased bed thickness), absorption and distance corrections based on the average bed thickness (pile height) should be incorporated to reduce effects on the count-to-grade mapping.
In the experimental setup, the samples were arranged continuously and in close contact to satisfy the superimposed counting condition, thereby reproducing a representative continuous-flow condition in which radiation contributions from adjacent ore segments overlapped. Under these conditions, the deconvolution method remained capable of identifying ore-segment positions and reconstructing segment-averaged grades across six model types, including discontinuous structures. These results indicate that the method does not rely on physical spacing between ore particles or blocks but can directly achieve grade reconstruction and boundary determination from superimposed counting signals in a continuous ore stream. The experimental results further suggest that, compared with the conventional single-particle intermittent measurement approach, the deconvolution framework exhibited superior adaptability to uninterrupted continuous ore flows and provided a foundation for extending radiometric sorting to high-throughput operations.
5. Conclusions
To address gamma-count overlap, boundary ambiguity, and throughput limitations inherent in conventional radiometric sorting for continuous ore streams, this study presented an online deconvolution-based sorting method for continuous ore flow. The method established a unit-layer gamma response model, derived a deconvolution solution suitable for real-time implementation, and incorporated an adaptive scheme to estimate the characteristic parameter α, thereby enabling real-time reconstruction of segment-averaged grades under continuous-flow conditions.
The experimental results showed that, across models covering multiple grades, segment lengths, and discontinuous structures, the deconvolution-reconstructed grades agreed closely with the true grades, with relative errors within 10%. Minor oscillations and small negative values occurred at ore-waste interfaces; however, these effects were confined to boundary transition zones and did not materially affect segment identification or segment-averaged grade estimation.
Notably, the proposed method did not rely on the conventional single-particle intermittent measurement approach but directly reconstructed grades from superimposed counting signals in continuous ore streams. This capability enhanced adaptability to uninterrupted ore flow and provided a practicable route for extending radiometric sorting to high-throughput operations and low-grade uranium ore applications.
For industrial deployment, engineering design should be revisited according to detector efficiency and background level, belt speed, sampling period, pile height, and throughput. The unit-layer length ΔZ determines the achievable spatial resolution and segment scale, while counting statistics (counts per sample) determine the noise floor and minimum detectable grade. For higher throughput or thicker-bed conditions, detector-efficiency enhancement, geometry optimization, and thickness/self-absorption correction are required to maintain adequate counting statistics and preserve the applicability of the convolution–deconvolution framework. In addition, future work will include strict head-to-head comparisons among direct mapping, conventional continuous-stream threshold/window schemes, and the proposed deconvolution method to quantify the practical benefit of deconvolution in terms of sorting performance and throughput.
Author Contributions
D.W.: conceptualization, methodology, software, investigation, data curation and interpretation, writing—original draft. X.Z.: conceptualization, investigation, writing—review and editing. Y.L.: formal analysis, data curation. Y.Y.: investigation, data curation, and interpretation. B.W.: validation. S.W.: investigation. Q.L.: visualization, software. X.C.: supervision, resources. R.W.: review and validation. B.T.: supervision, funding acquisition, and project administration. All authors have read and agreed to the published version of the manuscript.
Funding
This work was supported by the National Natural Science Foundation of China (No. U22B2077); the Key Technology Project under the “Revealing the List and Taking the Lead” Program of the Jiangxi Provincial Major Science and Technology Research and Development Project (No. 20224AAC01012); the “Revealing the List and Taking the Lead” Project of the School of Nuclear and Geosciences, East China University of Technology (Nos. 2024HDX03 and 2024HDX10); Jiangxi Provincial Natural Science Foundation (NO. 20243BCE51132); and the Graduate Innovation Fund of East China University of Technology (Nos. DHYC-202405 and DHYC-202464).
Data Availability Statement
The data presented in this study are available upon request from the corresponding authors. The data are not publicly available due to an ongoing study.
Conflicts of Interest
Yang Liu and Xinqi Cai are employees of CGNPC Uranium Resources Co., Ltd. The paper reflects the views of the scientists and not the company.
References
- Liu, X.; Liu, J.; Xing, Y.; Yang, Y.; Wang, R.; He, T. Spatiotemporal Evolutionary Patterns of Mineral Dissolution and Precipitation (Formation) Amount in Acid in Situ Leaching of Uranium. J. Radioanal. Nucl. Chem. 2025, 334, 2949–2962. [Google Scholar] [CrossRef] [Scilit]
- Liu, C.; Liu, H.; Long, J.; Liao, B.; Wang, X.; Sun, Z.; Guo, Y.; Zheng, Z. Interaction of Dry and Water-Saturated Uranium Ore with Microwave and Enhanced Extraction of Uranium. Miner. Eng. 2023, 196, 108047. [Google Scholar] [CrossRef] [Scilit]
- Yu, Z.-Y.; Zhang, Y.; Zhang, X.-J.; Zhang, H.-R.; Wang, D.-Y.; Duan, H.-Y.; Wang, R.-B.; Tang, B. Based on the Thickness Equivalent Basis Effect Decomposition Method of Ore Separation by Multi-Energy X-Ray Transmission Technology. Appl. Radiat. Isot. 2025, 219, 111710. [Google Scholar] [CrossRef] [Scilit] [PubMed]
- Bruneton, P.; Cuney, M. Geology of Uranium Deposits; Elsevier: Amsterdam, The Netherlands, 2016; pp. 11–52. [Google Scholar]
- Zhang, Y.; Yoon, N.; Holuszko, M.E. Assessment of Sortability Using a Dual-Energy X-Ray Transmission System for Studied Sulphide Ore. Minerals 2021, 11, 490. [Google Scholar] [CrossRef] [Scilit]
- Qiu, J.; Zhang, Y.; Fu, C.; Yang, Y.; Ye, Y.; Wang, R.; Tang, B. Study on Photofluorescent Uranium Ore Sorting Based on Deep Learning. Miner. Eng. 2024, 206, 108523. [Google Scholar] [CrossRef] [Scilit]
- Veras, M.M.; Young, A.S.; Born, C.R.; Szewczuk, A.; Neto, A.C.B.; Petter, C.O.; Sampaio, C.H. Affinity of Dual Energy X-Ray Transmission Sensors on Minerals Bearing Heavy Rare Earth Elements. Miner. Eng. 2020, 147, 106151. [Google Scholar] [CrossRef] [Scilit]
- Kern, M.; Akushika, J.N.P.; Godinho, J.R.A.; Schmiedel, T.; Gutzmer, J. Integration of X-Ray Radiography and Automated Mineralogy Data for the Optimization of Ore Sorting Routines. Miner. Eng. 2022, 186, 107739. [Google Scholar] [CrossRef] [Scilit]
- Robben, C.; Wotruba, H. Sensor-Based Ore Sorting Technology in Mining—Past, Present and Future. Minerals 2019, 9, 523. [Google Scholar] [CrossRef] [Scilit]
- Zhou, C.; Xi, Y.; Sun, X.; Liang, W.; Fang, J.; Wang, G.; Zhang, H. Multiclass Classification of Coal Gangue Under Different Light Sources and Illumination Intensities. Minerals 2025, 15, 921. [Google Scholar] [CrossRef] [Scilit]
- Duan, B.; Bobicki, E.R.; Hum, S.V. Application of Microwave Imaging in Sensor-Based Ore Sorting. Miner. Eng. 2023, 202, 108303. [Google Scholar] [CrossRef] [Scilit]
- Lang, Z.; Alam, S.; Hunt, L.; Di Feo, A.; Robben, C.; Kinakin, Y.; Tjossem, R. Comparative Evaluation of X-Ray Transmission and X-Ray Luminescence Sorting Technologies for Fine Diamond Recovery. Minerals 2025, 15, 773. [Google Scholar] [CrossRef] [Scilit]
- Zhou, J.; Guo, Y.; Wang, S.; Chen, W.; Cheng, G. Identification of Coal and Gangue Based on R Value Method for Dual-Energy X-Ray of Geant4 Simulation. Environ. Res. 2023, 226, 115650. [Google Scholar] [CrossRef] [Scilit] [PubMed]
- Amar, H.; Benzaazoua, M.; Elghali, A.; Taha, Y.; Ghorfi, M.E.; Krause, A.; Hakkou, R. Mine Waste Rock Reprocessing Using Sensor-Based Sorting (SBS): Novel Approach toward Circular Economy in Phosphate Mining. Miner. Eng. 2023, 204, 108415. [Google Scholar] [CrossRef] [Scilit]
- Hull, G.; Denton, J.S.; Inglis, J.D.; Sanborn, M.E. Single Particle Trace Element Analysis of Uranium Oxide Standards with Laser-Induced Breakdown Spectroscopy. J. Radioanal. Nucl. Chem. 2025, 334, 2353–2367. [Google Scholar] [CrossRef] [Scilit]
- Nadolski, S.; Samuels, M.; Klein, B.; Hart, C.J.R. Evaluation of Bulk and Particle Sensor-Based Sorting Systems for the New Afton Block Caving Operation. Miner. Eng. 2018, 121, 169–179. [Google Scholar] [CrossRef] [Scilit]
- Cardenas-Vera, A.; Hesse, M.; Möckel, R.; Gerhard Merker, R.; Heinig, T.; Van Phan, Q. Investigation of Sensor-Based Sorting and Selective Comminution for Pre-Concentration of an Unusual Parisite-Rich REE Ore, South Namxe, Vietnam. Miner. Eng. 2022, 177, 107371. [Google Scholar] [CrossRef] [Scilit]
- Santos, E.; Brum, I.; Ambrós, W. Techniques of Pre-Concentration by Sensor-Based Sorting and Froth Flotation Concentration Applied to Sulfide Ores—A Review. Minerals 2025, 15, 350. [Google Scholar] [CrossRef] [Scilit]
- Rout, D.; Krishnamurthi, R.; Kushwaha, A.P.; Sharma, S.K. The Geochemistry and Element Mobility during Albitization and Related Uranium Mineralization, Rohil Deposit, Rajasthan, India. Discov. Geosci. 2025, 3, 102. [Google Scholar] [CrossRef] [Scilit]
- Adewuyi, S.O.; Anani, A.; Luxbacher, K.; Ndlovu, S. From Single-Sensor Constraints to Multisensor Integration: Advancing Sustainable Complex Ore Sorting. Minerals 2025, 15, 1101. [Google Scholar] [CrossRef] [Scilit]
- Cui, T.; Yang, Y. An Advanced Uranium Ore Grade Estimation Method Based on Photofission Driven by an E-LINAC. Instrum. Methods Phys. Res. Sect. A Accel. Spectrometers Detect. Assoc. Equip. 2021, 1014, 165710. [Google Scholar] [CrossRef] [Scilit]
- Smirnov, K.M.; Molchanova, T.V.; Anan’ev, A.V.; Akimova, I.D.; Ovcharenko, E.V.; Krylova, O.K. Promising Technology for Reprocessing Complex Uranium Ores from the Elkon Deposit. At. Energy 2017, 122, 377–384. [Google Scholar] [CrossRef] [Scilit]
- Böhme, R.C. The development of a radiometric sorter for South African gold ores. Int. J. Appl. Radiat. Isot. 1983, 34, 417–428. [Google Scholar] [CrossRef] [Scilit]
- Kelly, L. Radiometric Ore Sorting Method and Apparatus. Patent US4365719A, 28 December 1982. [Google Scholar]
- Craig, M. Transfer Functions for Predicting Borehole Gamma-Ray Logs. Pure Appl. Geophys. 2019, 176, 1649–1658. [Google Scholar] [CrossRef] [Scilit]
- Allinei, P.G.; Pérot, N.; Pérot, B.; Marchais, T.; Fondement, V.; Toubon, H.; Bruned, V.; Berland, A.; Goupillou, R. Estimation of Uranium Concentration in Ore Samples with Machine Learning Methods on HPGe Gamma-Ray Spectra. Nucl. Instrum. Methods Phys. Res. Sect. A Accel. Spectrometers Detect. Assoc. Equip. 2022, 1032, 166597. [Google Scholar] [CrossRef] [Scilit]
- Conaway, J.G.; Killeen, P.G. Quantitative Uranium Determinations from Gamma-Ray Logs by Application of Digital Time Series Analysis. Geophysics 1978, 43, 1204–1221. [Google Scholar] [CrossRef] [Scilit]
- Dickson, B.; Craig, M. Deconvolving Gamma-Ray Logs by Adaptive Zone Refinement. Geophysics 2012, 77, D159–D169. [Google Scholar] [CrossRef] [Scilit]
- Cuenod, M.; Sage, A.P. Comparison of Some Methods Used for Process Identification. Automatica 1968, 4, 235–269. [Google Scholar] [CrossRef] [Scilit]
- Lantz, R.B. Quantitative Evaluation of Numerical Diffusion (Truncation Error). Soc. Pet. Eng. J. 1971, 11, 315–320. [Google Scholar] [CrossRef] [Scilit]
- Khan, I.R.; Ohba, R. New Finite Difference Formulas for Numerical Differentiation. J. Comput. Appl. Math. 2000, 126, 269–276. [Google Scholar] [CrossRef] [Scilit]
- Lu, L.; Tang, B. The deconvolution-difference iteration technique for gamma-ray logs. J. E. China Coll. Geol. 1991, 14, 50–56. [Google Scholar]
- Tang, B.; Lu, L.; Sheng, H. Discussion on Multiple-Point Deconvolution Technique for Gamma Logging and Its Negative Content. Uranium Geol. 1991, 7, 99–107. [Google Scholar]
- Ibrahim, N.A.; Amirlatifi, A.; Ma, P.; Ramezani, S.B. Maximum Detectable Distance in Mobile Gamma Spectrometry Using Physics-Informed Neural Network: Optimizing Radiation Detection. J. Radioanal. Nucl. Chem. 2025, 334, 3297–3309. [Google Scholar] [CrossRef] [Scilit]

Disclaimer/Publisher’s Note: The statements, opinions and data contained in all publications are solely those of the individual author(s) and contributor(s) and not of MDPI and/or the editor(s). MDPI and/or the editor(s) disclaim responsibility for any injury to people or property resulting from any ideas, methods, instructions or products referred to in the content. |
© 2026 by the authors. Licensee MDPI, Basel, Switzerland. This article is an open access article distributed under the terms and conditions of the Creative Commons Attribution (CC BY) license.