


Abstract
Internet of Vehicles (IoV) security mechanisms often classify isolated messages or assign node-level trust scores, yet these decisions do not explain whether a malicious but authenticated event has distorted the intended evolution of traffic. This paper proposes IntentProv-IoV, a causally grounded provenance framework for traffic-intent preservation in V2X environments. Traffic intent is modeled as the short-horizon collective state expected under non-adversarial conditions, and deviation is measured between predicted and observed traffic states. The framework constructs temporal provenance graphs linking vehicles, roadside units (RSUs), cooperative perception outputs, prediction nodes, and traffic-control decisions. To remove the ambiguity of marginal contribution, node contribution is formalized as an interventional effect in a structural causal model and estimated through Monte Carlo counterfactual edge-weight attenuation, with a linear sensitivity fallback for real-time edge deployment. A calibrated composite score integrates anomaly evidence, traffic-intent deviation, trust risk, and provenance contribution. The evaluation design compares IntentProv-IoV with detection, trust, blockchain trust, graph anomaly, Granger causal, structural causal, and counterfactual GNN baselines and includes predictor sensitivity, adaptive adversaries, prediction noise, packet loss, trajectory-only real-data validation, and edge overhead. Simulation-scale results indicate improved attribution precision, stronger traffic-intent deviation reduction, and edge-suitable latency. By shifting V2X security from message-level detection to causally explainable traffic-intent assurance, IntentProv-IoV provides a more accountable security objective for cooperative vehicular systems.
1. Introduction
The Internet of Vehicles (IoV) has become a core layer of intelligent transportation systems because vehicles, roadside units (RSUs), mobile edge servers, and traffic-management platforms exchange safety and perception information in near real time. Cooperative Awareness Messages (CAMs), Basic Safety Messages (BSMs), and Collective Perception Messages (CPMs) allow vehicles to infer conditions beyond the range of local sensors and to coordinate braking, lane selection, route adjustment, and hazard response. These capabilities improve situational awareness, but they also make the traffic-control loop dependent on the semantic correctness of cyber–physical data that are produced by multiple actors and propagated through multiple infrastructure layers [1,2,3,4,5,6].
A realistic attack does not need to break cryptography. A malicious vehicle may retain valid credentials and transmit a protocol-compliant but false emergency-braking event, a fabricated congestion report, or a plausible speed profile that is inconsistent with the actual traffic state. Neighboring vehicles may reduce speed, RSUs may aggregate the reported event, and a traffic-control module may issue rerouting decisions. A local falsification can therefore become a macroscopic disruption through cooperative perception and control logic. In this setting, authentication confirms that a participant is permitted to send a message; it does not confirm that the message preserves the intended evolution of traffic.
Most current IoV security mechanisms are designed around message or node classification. Misbehavior detection systems identify implausible position, speed, acceleration, heading, or event claims [7,8,9]. Trust and reputation systems assign credibility scores to vehicles based on observations, history, and neighbor feedback [10,11]. Blockchain-assisted schemes preserve auditability, decentralized agreement, and non-repudiation [12,13]. These contributions are useful, but they do not directly answer the operational question faced by an RSU or edge controller after a suspicious event: did the shared information preserve the intended collective traffic state, and if not, which causal chain produced the deviation?
This paper argues that IoV security should be evaluated at the system level. Traffic intent is defined as the short-horizon collective traffic state expected under non-adversarial conditions. A malicious event is severe when it increases the deviation between predicted and observed traffic states and when the deviation can be traced to a causal provenance path. This view moves security from isolated detection toward traffic-intent preservation, recovery, and accountable attribution. It also makes evaluation outcome-driven: a method is not only judged by detection accuracy but by whether it reduces traffic-intent deviation, identifies the root cause, and supports a mitigation that restores traffic continuity.
IntentProv-IoV implements this view by combining prediction-based intent modeling, temporal provenance graphs, structural causal modeling, counterfactual contribution estimation, calibrated composite risk scoring, and hash-only audit storage. The framework is designed for RSU-assisted edge deployment, where short event windows and local provenance subgraphs are available for real-time analysis. Blockchain is deliberately restricted to evidence integrity after attribution; it is not used as the primary detection or scoring engine.
The main contributions are as follows:
- A formal traffic-intent preservation paradigm for IoV security that shifts the objective from node-centric trust evaluation to system-level traffic continuity.
- A causally grounded definition of provenance contribution in which the effect of a candidate node is modeled as an intervention on outgoing influence within a structural causal model.
- A practical estimator for node contribution based on Monte Carlo counterfactual edge-weight attenuation, with a linear sensitivity approximation for low-latency edge screening.
- A calibrated composite risk model integrating anomaly risk, normalized intent deviation, trust risk, and provenance contribution without arbitrary fixed weights.
- An extended evaluation protocol covering causal baselines, prediction-backbone sensitivity, adaptive adversaries, packet loss, prediction-noise robustness, real-trajectory perturbation validation, and edge overhead.
- A hash-only audit design that preserves forensic integrity without making blockchain the central scientific contribution.
2. Related Work
2.1. Misbehavior Detection in V2X Networks
V2X misbehavior detection systems inspect safety messages for physically implausible or statistically inconsistent claims. Classical plausibility checks compare the reported position, speed, acceleration, heading, and timestamp against road geometry and vehicle dynamics. More recent approaches use temporal windows, recurrent models, graph features, and learned message embeddings to capture coordinated attacks. Public resources such as VeReMi and VeReMi Extension improve comparability by providing labeled misbehavior traces and generation processes for false position, speed, and event manipulation [7,8]. Survey work also shows that machine learning-based misbehavior detection is now a dominant direction in 5G and beyond vehicular networks [9].
The limitation is not that message-level detection is unimportant; it is that it is incomplete. A suspicious message can be detected without explaining how it influenced downstream vehicles or RSUs. Conversely, a semantically harmful event can remain statistically plausible if the attacker manipulates the message gradually or distributes the effect across multiple identities. Detection accuracy therefore does not necessarily imply traffic resilience. IntentProv-IoV retains anomaly evidence as one component of risk, but it evaluates whether the anomalous or suspicious information changed the expected collective traffic evolution.
2.2. Trust, Reputation, and Blockchain-Assisted Vehicular Security
Trust and reputation frameworks aggregate historical behavior, neighbor observations, Bayesian evidence, or consensus information into credibility scores [10,11]. These systems are useful for filtering persistently unreliable vehicles and reducing the influence of nodes with repeated inconsistencies. However, trust scores are node-centric. A vehicle with only a moderate trust penalty can still trigger severe traffic disturbance if its event claim is amplified through cooperative perception, dense platooning, or route-control logic. Trust therefore needs to be coupled with impact and causality rather than treated as a sufficient security decision.
Blockchain-assisted vehicular security provides integrity, non-repudiation, decentralized reputation storage, and auditability [12,13]. These properties are valuable when multiple administrative domains share evidence or when post-incident verification is needed. Blockchain, however, cannot by itself determine semantic correctness. A false but syntactically valid message can be immutably stored. IntentProv-IoV therefore uses blockchain only after attribution: it records a hash of the attribution evidence and metadata, while raw vehicular logs remain off-chain in privacy-preserving edge storage. This design avoids the common weakness of blockchain-centric papers that present immutability as if it were equivalent to cyber–physical safety.
2.3. Provenance and Causal Security
Security provenance records dependencies among entities, activities, and events so that analysts can reconstruct how a suspicious state arose [14,15]. In cyber–physical systems, provenance is especially useful because a cyber event can produce a physical effect. A false V2X message may affect local braking, RSU aggregation, prediction outputs, and traffic-control decisions. A provenance graph can encode those dependencies more explicitly than an isolated anomaly score.
Causal inference provides a principled way to distinguish correlation from causation. Structural causal models define variables, assignments, exogenous noise, and interventions, while libraries such as DoWhy and DoWhy-GCM support effect estimation and root-cause analysis in graphical causal models [16,17,18]. The challenge is that generic causal inference does not automatically provide a deployable V2X provenance pipeline, and generic provenance does not automatically define traffic-intent deviation. IntentProv-IoV connects these two directions by treating provenance contribution as an interventional effect on traffic-intent deviation.
2.4. Traffic Prediction and Trajectory Validation
Traffic-intent preservation depends on a reference trajectory. This can be obtained from physics-based models such as the Intelligent Driver Model, sequence models such as LSTM, spatial–temporal graph models such as diffusion convolutional recurrent neural networks, or graph neural models that encode vehicle interactions [19,20,21]. Because prediction error can inflate deviation estimates, a security paper that relies on a single unspecified predictor is vulnerable to criticism. The evaluation therefore includes a prediction-backbone sensitivity study and a bounded prediction-noise analysis [22].
Real-world trajectory datasets such as highD, NGSIM, and INTERACTION provide naturalistic motion patterns, dense interactions, and interactive driving scenarios. They generally lack complete V2X message and RSU logs, so they cannot replace end-to-end V2X simulation. They can, however, test whether the traffic-intent deviation metric remains stable under realistic motion patterns when controlled perturbations are injected into speed, headway, lane-change timing, and route choices. IntentProv-IoV uses this trajectory-only validation to reduce the simulation-only weakness without overstating it as full V2X validation.
2.5. Research Gap
Prior work leaves four linked gaps. First, message-level and node-level systems do not quantify system-level traffic-intent deviation. Second, trust and blockchain schemes do not explain the causal path by which a harmful event propagates through V2X infrastructure. Third, provenance systems are rarely specialized to traffic prediction and cooperative driving decisions. Fourth, causal-inference baselines are not usually integrated with edge-deployable V2X attribution reports and mitigation actions. Table 1 positions IntentProv-IoV against these directions.
Table 1.
Comparative positioning of IntentProv-IoV against representative IoV security approaches.
3. System Model and Causal Problem Formulation
The increasing reliance on cooperative vehicular intelligence has transformed traffic management from an isolated decision-making process into a distributed cyber–physical ecosystem in which information generated by one participant can rapidly influence the behavior of many others. In such environments, the consequences of a malicious action are not limited to the originating message or node; rather, they emerge through a chain of interactions involving neighboring vehicles, roadside infrastructure, perception services, and traffic-control functions. Consequently, evaluating security solely at the level of message validity or sender credibility provides only a partial view of the operational impact of an attack. A more comprehensive perspective must consider how information propagates through the vehicular environment and how this propagation affects the evolution of traffic conditions over time.
Figure 1 illustrates the problem context addressed in this work. A semantically misleading but authenticated event can be disseminated through standard V2V and V2R communication channels, incorporated into infrastructure-level aggregation processes, and subsequently influence traffic-management decisions and driver responses. Although individual system components may operate according to protocol specifications, the cumulative effect of incorrect information can produce traffic conditions that differ significantly from those expected under normal operation. Existing vehicular security mechanisms are generally effective at detecting abnormal messages, evaluating trustworthiness, or preserving communication integrity; however, they provide limited insight into how a harmful event propagates across multiple entities, how responsibility is distributed among interacting participants, or which sequence of decisions ultimately contributes to the observed traffic disruption.
Figure 1.
(a) Causal propagation of a semantically malicious V2X event, (b) limitations of existing vehicular security mechanisms, and (c) the traffic-intent attribution problem addressed by IntentProv-IoV.
The lower part of Figure 1 formalizes this challenge as a causal attribution problem. The central question is not merely whether suspicious behavior exists but which entities and propagation paths are responsible for the divergence between expected and realized traffic evolution. Addressing this question requires a representation capable of linking communication events, infrastructure actions, perception outcomes, and control decisions within a unified analytical framework. Therefore, the proposed formulation models the vehicular environment as an interconnected set of causal dependencies and evaluates security in terms of its effect on collective traffic behavior rather than isolated communication anomalies. Based on this foundation, the remainder of this section defines the vehicular communication environment, introduces the notion of traffic-intent deviation, establishes the causal formulation used for attribution, and presents the provenance representation employed throughout the proposed framework.
3.1. Vehicular Communication Model
Consider an edge-managed road region containing vehicles, RSUs, cooperative perception modules, and one regional edge server. Each vehicle broadcasts a state vector containing position, velocity, acceleration, heading, event type, and timestamp. RSUs aggregate event messages and support the edge server in short-horizon prediction, provenance construction, and causal reconstruction. The state vector for vehicle is and the monitored global traffic state is [1,2,3,4,5,6].
Each vehicle periodically broadcasts a state vector containing position, velocity, acceleration, heading, event information, and timestamp attributes. The collective traffic state at time is represented by , where denotes the number of active vehicles. RSUs aggregate local observations and cooperate with the edge server to construct a regional view of traffic conditions. The edge server maintains a sliding observation window containing recent traffic states and communication events, which serves as the basis for traffic-intent prediction, provenance construction, and causal attribution. The road topology, adjacency relationships, signal states, and traffic rules are represented by and . The edge server maintains a sliding historical window and processes candidate event windows triggered by braking alerts, congestion messages, speed inconsistencies, route-control updates, or cooperative perception contradictions [4,5,6].
3.2. Traffic Intent and Intent Deviation
Traffic intent is defined as the expected collective evolution of the monitored traffic region under non-adversarial conditions. It does not represent a psychological driver-intention label; rather, it provides an operational reference trajectory over a short prediction horizon. Formally, traffic intent represents the expected future evolution of the collective traffic state, including vehicle motion, spacing relationships, lane occupancy, route progression, and traffic-control interactions. It therefore captures both microscopic vehicle behavior and macroscopic traffic dynamics over the selected prediction horizon [19,20,21]. Given a forecasting model , the expected traffic state over prediction horizon h is defined as
where denotes the historical traffic-state observation window, represents the road and interaction topology, represents the applicable traffic rules and control information, and denotes the predicted traffic state at time . The corresponding observed future traffic state is denoted by . (1) All subsequent mathematical expressions used for cross-reference are numbered sequentially; in particular, the SCM transition is Equation (5), and the hard node intervention is Equation (7).
A direct comparison between the predicted and observed traffic states contains both abnormal traffic deviation and the inherent forecasting error of . Therefore, the raw prediction residual cannot be interpreted directly as attack-induced traffic-intent deviation. This distinction is particularly important because the forecasting backbones evaluated in this study exhibit different intrinsic prediction errors; for example, Table 6 reports a prediction MAE of 0.84 ± 0.09 for the IDM and 0.60 ± 0.05 for the GNN. To explicitly account for this uncertainty, a predictor-specific benign-error threshold is estimated exclusively from attack-free validation windows. Rather than directly subtracting the MAE reported in Table 6, which is expressed in the predictor’s original error scale, is computed using the same normalized weighted residual employed by the traffic-intent deviation metric. This preserves dimensional consistency between the prediction-error correction and . The benign-error threshold is defined as
where denotes the q-quantile operator applied to the attack-free validation residuals, W is a weighting matrix that assigns greater importance to safety-critical traffic dimensions, and ε > 0 is a small numerical constant that prevents division by zero. Thus, represents the predictor-specific level of the normalized traffic-state discrepancy that can reasonably arise from normal forecasting uncertainty.
The corrected normalized traffic-intent deviation is consequently defined as the excess deviation beyond this calibrated benign-error threshold:
Accordingly, if the normalized prediction residual does not exceed the benign-error threshold, then = 0. Only the residual component exceeding the expected prediction uncertainty contributes to the traffic-intent deviation. This formulation prevents normal prediction bias from being directly interpreted as attack-induced traffic disruption and explicitly distinguishes inherent predictor error from abnormal traffic evolution. The threshold is predictor-specific rather than universal. Each forecasting backbone—IDM, LSTM, DCRNN, and GNN—is therefore calibrated using its own attack-free validation-error distribution. This is necessary because the predictor sensitivity results demonstrate that the forecasting models have different intrinsic error levels. A predictor with relatively high normal prediction uncertainty consequently receives a larger benign-error allowance than a predictor with lower validation error, preventing systematic bias in when different prediction backbones are evaluated. The weighting matrix W assigns appropriate importance to safety-critical dimensions such as headway, acceleration, speed consistency, lane position, and route deviation. Normalization by the weighted magnitude of the observed traffic state further enables comparison across traffic states and densities while preventing dimensions with larger numerical scales from dominating the security signal. Importantly, a positive is not treated as direct proof of malicious behavior. It represents an abnormal traffic-level consequence that exceeds the expected uncertainty of the selected prediction model. The structural causal and provenance analyses introduced in the following subsections are subsequently used to determine whether this excess deviation can be causally attributed to particular V2X messages, vehicle states, RSU aggregation outputs, cooperative-perception results, or traffic-control decisions. Therefore, the revised formulation maintains a clear distinction among prediction uncertainty, abnormal traffic-intent deviation, and causal responsibility.
To avoid circularity between the security outcome and the counterfactual attribution procedure, is treated only as an outcome variable: it is computed once from a reference forecast and the subsequently realized traffic state, whereas causal contribution is estimated by intervening on candidate upstream variables and recomputing the downstream state. The reference forecast is not redefined to make a suspected event appear harmful. In the controlled experiments, is trained, and predictor-specific error thresholds are calibrated only on attack-free data. For an evaluated event window, the reference forecast is generated from the last accepted pre-event history together with road topology and control context; messages first observed inside the candidate attack window are not allowed to redefine that reference trajectory. This prevents an injected event from contaminating both sides of the comparison. In deployment, where the true attack onset is unknown, the same principle is implemented with a one-window lag and the accepted/corroborated history; if the history itself is suspected to be contaminated, the framework lowers attribution confidence and requests independent RSU/vehicle corroboration rather than interpreting as an unbiased attack magnitude. Thus, Dt measures excess outcome deviation relative to a separately calibrated reference, while the causal estimator asks whether an intervention on an upstream event reduces that fixed outcome discrepancy.
3.3. Structural Causal Grounding
A provenance contribution score is weak if it only states that a node has a marginal effect without specifying how the counterfactual is computed. IntentProv-IoV grounds the contribution in a structural causal model. Each relevant node in the provenance graph corresponds to a structural variable representing a vehicle state, message event, RSU aggregation output, prediction state, or traffic-control decision. The causal relationships among communication events, perception outputs, prediction states, and traffic-control decisions are represented using a structural causal model (SCM) , defined as
where denotes the set of exogenous variables representing unobserved environmental influences, denotes the set of endogenous variables corresponding to observable system states, represents the collection of structural assignment functions, and denotes the probability distribution over exogenous factors [16,17,18]. The next traffic state is generated by structural assignments with exogenous noise :
where is the current traffic state, denotes the set of observed V2X messages and events, represents RSU and cooperative-perception observations, denotes traffic-management and control actions, captures unobserved environmental factors and exogenous disturbances, and represents the structural assignment governing future traffic evolution. Unlike conventional prediction models that treat future traffic conditions as purely statistical outcomes, Equation (5) explicitly models traffic evolution as the result of interacting communication, perception, and control variables. This formulation provides the causal foundation required for provenance-based attribution because it identifies the mechanisms through which local events propagate to downstream traffic states. [SCM definition: (4); traffic-state structural assignment: (5)].
The deviation
serves as the primary outcome variable in the causal analysis, where denotes the expected traffic state under normal operating conditions and denotes the realized traffic state. The function computes the traffic-intent deviation resulting from the difference between expected and observed traffic evolution. Rather than treating traffic-intent deviation as direct evidence of malicious behavior, the framework uses as an observable consequence whose underlying causes must be investigated. The objective is therefore to determine which communication events, perception outputs, or decision processes contribute most strongly to the observed deviation. This causal interpretation transforms traffic-intent preservation from a prediction problem into an attribution problem, thereby enabling provenance-driven identification of the entities responsible for traffic-level disruption.
For a candidate source , the causal question is not whether is correlated with a deviation but how would change under an intervention that removes or attenuates the outgoing influence of . Let indicate whether the influence of is active. The node contribution is defined as
This definition converts provenance contribution into an interventional effect. It also separates the contribution score from a mere post hoc explanation: a node receives a high contribution only if the traffic-intent deviation would decrease under a counterfactual intervention on that node’s influence.
In the proposed framework, each provenance node is mapped to an endogenous causal variable. Vehicle states, message events, RSU aggregation outputs, cooperative perception results, prediction states, and traffic-management decisions are therefore represented as nodes within both the provenance graph and the SCM. This dual representation allows the provenance graph to capture event dependencies while the SCM provides a formal mechanism for evaluating causal influence through interventions.
SCM instantiation and assumptions. In the co-simulation, the endogenous variables are instantiated from time-stamped vehicle states, received V2X events, RSU/cooperative-perception aggregates, predictor outputs, and traffic-control actions within the event window. Structural assignments for vehicle motion and control follow the simulator dynamics and traffic-control logic, while uncertain transitions are represented by conditional models fitted on attack-free training data. A provenance edge is therefore not declared causal from temporal order or spatial proximity alone. It is admitted only when (i) the source precedes the target, (ii) a physically or logically admissible mechanism exists (message reception/forwarding, car-following or merging interaction, active lateral conflict, or infrastructure-mediated dependency), and (iii) the downstream state is sensitive to the source under the intervention model. The causal interpretation assumes consistency of the intervention, stable structural mechanisms over the short event window, adequate support for the evaluated operating regime, and conditional causal sufficiency after observed road, signal, traffic, and infrastructure context is included. Hidden hazards or unobserved infrastructure states can violate the last assumption and are therefore listed as a validity threat in Section 6.5.
Identifiability is consequently limited to the instantiated model and experimental regime. In CARLA-SUMO, injected attacks and simulator mechanisms make the relevant interventions directly evaluable, so is a model-based interventional estimand rather than a causal effect inferred nonparametrically from passive observations alone. The trajectory-only datasets do not identify message-level causal effects because they lack complete V2X and RSU logs; they are used only to test the stability of the traffic-intent outcome under realistic motion patterns. Accordingly, the manuscript’s causal claim concerns intervention-consistent attribution within the specified SCM and observed event window, not unrestricted causal discovery from arbitrary observational V2X data.
3.4. Operational Estimation of
The exact intervention in Equation (7) can be costly because it may require recomputing downstream prediction and decision states. IntentProv-IoV therefore uses two estimators. The primary estimator is Monte Carlo counterfactual edge-weight attenuation [16,17,18]. For candidate node , its outgoing edges are multiplied by an attenuation factor , the affected subgraph is propagated times under sampled exogenous noise, and the resulting attenuated state is used to record the mean drop in deviation:
Justification of edge-weight attenuation. The attenuation factor is modeled as a soft intervention on the transmission mechanism from a candidate node to its downstream children. Suppose a child variable is generated by the structural equation where denotes the influence weight from parent , is the set of parents of , and represents exogenous factors. The intervention is implemented by replacing each outgoing weight with . This operation leaves all other parent inputs and exogenous variables unchanged while selectively suppressing the influence transmitted by node .
The factual model is recovered when , whereas completely removes the contribution of through its modeled outgoing edges. Under the assumptions that (i) all causal influence of is transmitted through these modeled edges, (ii) no unobserved parallel pathways remain active, and (iii) downstream structural equations depend on only through the attenuated influence channel, the case is equivalent to the hard intervention used in Equation (7). When these assumptions are not fully satisfied, attenuation should be interpreted as a practical surrogate that approximates the hard intervention while preserving graph structure and numerical stability. Intermediate values represent partial suppression and avoid discontinuities that may arise from hard node deletion.
Furthermore, if the downstream structural mapping is -Lipschitz with respect to the attenuated input and the deviation function is -Lipschitz, then Therefore, indicating that the soft intervention converges to the hard-removal effect as approaches zero. Consequently, edge-weight attenuation provides a numerically stable approximation to node removal while preserving the remaining provenance structure required for counterfactual propagation and attribution.
Assumptions underlying attenuation-based interventions. The equivalence between attenuation and the hard intervention is exact only when (i) all causal influence of is transmitted through the modeled outgoing edges, (ii) no unmodeled alternative pathways remain active after attenuation, and (iii) downstream structural equations depend on solely through the attenuated influence channel. When these assumptions are not fully satisfied, the operation should be interpreted as a practical surrogate intervention that approximates the hard-removal effect while preserving graph structure and numerical stability.
When latency constraints prevent repeated propagation, the edge server uses a linear sensitivity fallback over the aggregate outgoing influence weight :
The Monte Carlo estimator is used for high-impact alerts and forensic reports, while the linear estimator supports online screening. This operational choice makes measurable, reproducible, and tunable under edge latency budgets. Importantly, the K-sample Monte Carlo estimator is not executed on the latency-critical path reported in the scalability experiment. Online alerts use the linear sensitivity fallback after event-window pruning, whereas Monte Carlo propagation is reserved for asynchronous high-confidence attribution and forensic reconstruction. Therefore, K does not determine the reported online latency.
3.5. Provenance Graph Model
While the communication graph introduced in Section 3.1 describes information exchange among participating entities, it does not necessarily capture causal influence. A message may be received by many vehicles but only affect a subset of downstream decisions. Therefore, IntentProv-IoV constructs a temporal provenance graph that records influence relationships among communication events, perception outputs, prediction states, and control actions. The provenance graph serves as the primary structure for tracing how traffic-intent deviation emerges through chains of interacting cyber–physical events and provides the foundation for subsequent attribution and mitigation analysis [15,22,23]. At each event window, IntentProv-IoV constructs a directed temporal provenance graph
where contains vehicles, RSUs, message events, perception outputs, prediction nodes, and decision nodes; contains directed influence relationships; and Ωt stores node and edge attributes such as the timestamp, trust level, anomaly evidence, event type, influence weight, and counterfactual contribution.
The node set is composed of multiple categories of cyber–physical entities and events and can be expressed as
where and denote vehicle-state nodes, roadside-unit nodes, message-event nodes, cooperative-perception nodes, traffic-intent prediction nodes, and traffic-management decision nodes, respectively.
Unlike communication links, provenance edges represent potential influence relationships through which information, perception outcomes, or decisions may affect downstream traffic evolution. Consequently, spatial proximity is not sufficient to establish a provenance edge. This distinction is important in multilane traffic, where vehicles in adjacent parallel lanes may remain spatially close without directly interacting or influencing each other’s downstream behavior. For each candidate relationship between nodes vi and vj, IntentProv-IoV first evaluates an interaction condition
where verifies temporal ordering between the candidate source and downstream event, Imsg(i,j) represents relevant V2X message reception or forwarding, Ilong(i,j) represents a longitudinal interaction such as car following or merging, Ilat(i,j) represents an active lateral interaction such as lane changing, yielding, or a shared conflict zone, and Iinfra(i,j) represents an infrastructure-mediated dependency through an RSU, cooperative-perception output, prediction state, or traffic-management decision. Accordingly, vehicles that are spatially close but travel independently in parallel lanes are excluded unless an explicit communication, longitudinal, lateral, or infrastructure-mediated interaction exists.
For candidate relationships satisfying gij(t) = 1, the composite influence score is defined as
where denotes communication relevance, Tij(t) represents temporal consistency, represents interaction-aware spatial relevance, and represents observed downstream sensitivity. The corresponding weights satisfy
A directed provenance edge is retained only when the candidate satisfies both the interaction condition and the minimum influence requirement:
This formulation ensures that spatial relevance contributes to the strength of an already plausible interaction but cannot independently establish causal connectivity. Therefore, geographically adjacent but non-interacting vehicles are removed before counterfactual contribution estimation.
The influence threshold η is calibrated rather than assigned as an arbitrary fixed value. Let H denote the set of candidate influence thresholds evaluated on attack-free validation windows. The calibrated threshold is selected by maximizing the retention of validated interaction relationships while constraining the benign false-edge rate:
where Recallint(η) denotes the proportion of validated interaction relationships retained at threshold η, FERbenign(η) denotes the false-edge rate measured over attack-free validation windows, and ξ represents the maximum permitted benign false-edge rate. The selected η* is fixed before evaluation on the test scenarios to avoid test-set leakage. This two-stage procedure first removes candidates without a plausible interaction mechanism and then eliminates weak dependencies, thereby reducing redundant edges in dense multilane traffic before counterfactual contribution estimation.
Each node and edge maintains contextual metadata stored in Ωt, enabling the framework to preserve the sequence of events leading to a traffic outcome. This representation supports backward tracing from an observed traffic-intent deviation to the upstream entities, messages, perception outputs, and control decisions that contributed to its occurrence. Figure 2 illustrates a simplified provenance chain for a false emergency-braking event. A malicious message generated by an insider vehicle propagates through both vehicular and infrastructure-assisted pathways before producing a measurable traffic-intent deviation. Such propagation paths form the basis for the counterfactual contribution estimation and attribution procedures described in Section 4.
Figure 2.
Causal provenance chain for a false emergency-braking event. The source message influences vehicle reactions and RSU aggregation before producing route and traffic-intent deviation.
Multiple provenance paths may simultaneously contribute to a traffic outcome. Therefore, attribution is performed over the entire provenance graph rather than over individual events in isolation, enabling IntentProv-IoV to identify dominant propagation chains and quantify their relative contributions to the observed traffic-intent deviation.
Avoiding double counting in causal attribution. To prevent double counting, individual node contributions along the same causal chain are not summed and interpreted as the total causal effect. Node-level effects may overlap because an intervention on an upstream node can already account for downstream effects mediated through intermediate nodes. Consequently, individual contribution scores are used only for localization and ranking of influential entities.
When a causal path or coordinated source cluster is assigned an overall effect magnitude, IntentProv-IoV performs a single joint intervention on the entire source set and recomputes the traffic-intent deviation . The corresponding group-level causal effect is defined as where denotes the intervention applied to the source set . This formulation ensures that mediated effects are counted only once at the group level rather than being repeatedly attributed to multiple nodes along the same propagation path.
For finer-grained diagnostic analysis within a selected causal path, IntentProv-IoV may additionally compute incremental causal effects in topological order. Let denote the set of upstream nodes already intervened upon. The incremental contribution of node can be expressed as .
Thus, each incremental effect measures the additional reduction in traffic-intent deviation obtained after accounting for previously selected upstream interventions. This approach provides an interpretable decomposition of a causal path while avoiding the overestimation that would result from a direct summation of marginal node effects.
Interventions for heterogeneous provenance variables. The intervention variable may represent binary message events, continuous vehicle-state variables, RSU aggregation outputs, or vector-valued prediction states. For binary message events, denotes removal or suppression of the corresponding event. For continuous variables, is interpreted as replacement by a calibrated nominal reference value or removal of the associated influence channel. For vector-valued states, the intervention is applied component-wise, while the outcome remains the scalar traffic-intent deviation . Consequently, consistently measures the change in traffic-intent deviation under intervention regardless of the variable type being considered.
3.6. Threat and Adaptive Adversary Model
IntentProv-IoV considers an adversarial environment in which malicious participants attempt to manipulate traffic evolution through semantically misleading yet protocol-compliant V2X information. Unlike conventional communication attacks that rely on packet corruption or cryptographic compromise, the considered adversary injects information that satisfies authentication and communication requirements while intentionally altering the perceived traffic state. Consequently, malicious influence may propagate through vehicle interactions, cooperative perception, prediction processes, and traffic-management decisions despite the presence of standard security mechanisms [7,8,9,10,11,12,13,14]. Let denote the subset of adversarial messages contained within the communication events observed during an event window. These messages may include false traffic reports, fabricated emergency notifications, manipulated perception information, or coordinated misinformation generated by multiple malicious participants. Such messages influence downstream entities through the communication and provenance structures defined in the previous subsections.
The set of potentially affected provenance nodes is represented as , where denotes the subset of provenance nodes reachable from one or more adversarial messages through the propagation paths contained in the provenance graph .
The objective of the adversary is to maximize disruption of the expected traffic evolution while simultaneously reducing the evidence available for attribution. Since traffic disruption is quantified through the traffic-intent deviation metric , an adaptive attacker attempts to generate a significant deviation while minimizing its observable contribution within the provenance graph. This objective can be expressed as , where denotes the set of feasible V2X attack actions, represents a specific attack strategy, is the counterfactual contribution score introduced in Section 3.4, and denotes the minimum disruption level desired by the adversary. This formulation captures the behavior of adaptive attackers that seek to maximize operational impact while minimizing attribution evidence.
The resulting attack influence induces an adversarial provenance subgraph , where represents the influence relationships generated directly or indirectly by adversarial activity. This subgraph contains the propagation paths through which malicious information contributes to the observed traffic-intent deviation.
IntentProv-IoV assumes that communication protocols, cryptographic authentication mechanisms, and secure message dissemination services operate correctly [1,4,5,6]. RSUs, edge servers, and blockchain audit services are considered trusted infrastructure components. While these entities may process misleading information originating from compromised vehicles, direct compromise of RSUs, edge servers, or the blockchain infrastructure is outside the scope of this work. Similarly, denial-of-service attacks, radio-frequency jamming, and lower-layer communication attacks are not explicitly considered because the primary objective of the proposed framework is provenance-driven attribution of misinformation-induced traffic-intent deviation.
4. IntentProv-IoV Framework
Building upon the causal problem formulation established in the previous section, this section presents the proposed IntentProv-IoV framework for traffic-intent preservation and explainable vehicular security. The framework is designed to identify not only whether a suspicious event exists but also how the event propagates through the vehicular ecosystem, how it influences downstream decisions, and which entities are causally responsible for the resulting traffic-intent deviation. To achieve this objective, IntentProv-IoV integrates cooperative perception, traffic-intent prediction, provenance modeling, structural causal reasoning, counterfactual analysis, risk assessment, mitigation, and forensic auditing within a unified edge-assisted architecture.
Figure 2 illustrates the overall architecture of IntentProv-IoV. The framework is organized into six interconnected layers that collectively transform distributed vehicular observations into explainable security decisions. Vehicles exchange safety and perception information through V2V and V2R communications, while RSUs provide infrastructure-level observation and aggregation capabilities. Cooperative perception services subsequently fuse heterogeneous observations into a consistent representation of the surrounding traffic environment. The aggregated information is processed by the edge intelligence layer, which constitutes the analytical core of the framework and incorporates traffic-intent prediction, provenance graph construction, structural causal modeling, counterfactual contribution estimation, and composite risk assessment. Based on the generated causal evidence, the attribution and mitigation layer identifies dominant propagation paths, determines the entities responsible for traffic-intent deviation, and initiates appropriate response actions. Finally, lightweight blockchain-supported audit layer preserves tamper-evident forensic evidence without participating directly in the detection process.
Although Figure 3 describes the architectural organization of the framework, understanding the operational interaction among its analytical components requires a process-level view. Figure 3 therefore presents the execution workflow of IntentProv-IoV. Starting from incoming V2X event streams, the framework simultaneously constructs temporal provenance relationships and estimates the expected traffic evolution. The resulting information is combined through counterfactual contribution estimation and calibrated risk assessment to quantify the influence of candidate entities on the observed traffic state. The generated risk evidence is subsequently used to perform causal attribution, extract dominant propagation paths, and trigger intent-preserving mitigation actions. Following mitigation, a cryptographic audit record is generated to support accountability and forensic verification. Together, Figure 3 and Figure 4 provide complementary perspectives of the proposed framework: Figure 3 describes the structural architecture, while Figure 4 illustrates the operational workflow through which traffic-intent preservation and explainable attribution are achieved.
Figure 3.
Overall system model of IntentProv-IoV. The colors in the semi-circular gauge represent a standard color-coded risk scale that categorizes the calculated Composite Risk Score () into four severity levels: Green (Low Risk/Safe): Indicates normal operation with minimal or no detected anomaly, threat, or malicious behavior. Yellow (Moderate/Caution): Represents low-level anomalies or minor uncertainty that warrants monitoring but no immediate drastic action. Orange (High Risk/Warning): Signals a significant probability of threat, misbehavior, or attack (e.g., potential Sybil or data falsification attempt). The indicator needle currently points to this zone. Red (Critical Risk/Severe Threat): Denotes a confirmed or severe attack state requiring immediate system mitigation, such as isolating the node or reverting decisions.
Figure 4.
IntentProv-IoV pipeline with explicit counterfactual contribution estimation and calibrated composite scoring.
The following subsections describe each component of the framework in detail, beginning with traffic-intent prediction and continuing through provenance construction, causal contribution estimation, risk scoring, attribution, mitigation, and audit management.
4.1. Prediction Engine and Sensitivity Design
Although the security layer is model-agnostic, the evaluation is not allowed to rely on a single unspecified predictor. The protocol evaluates four forecasting backbones: a physics-based Intelligent Driver Model (IDM), an LSTM sequence model, a diffusion convolutional recurrent neural network (DCRNN), and a graph neural network (GNN). The GNN is used as the default because it naturally captures spatial interaction among vehicles, but all reported conclusions are checked under alternative predictors. The same event windows, attacks, thresholds, and evaluation metrics are reused across predictors to isolate the sensitivity of and to forecasting quality. The traffic-intent predictor estimates the expected future traffic state over a prediction horizon using historical observations, road topology, and traffic-management information. The expected traffic state is computed as , where denotes the selected forecasting model, and represents the expected traffic evolution under normal conditions. The predicted state is subsequently used to compute the traffic-intent deviation , which serves as the primary outcome variable for attribution and risk assessment. The framework is model-agnostic and supports multiple forecasting backbones, including IDM, LSTM, DCRNN, and GNN models. In the default implementation, a GNN predictor is employed because it effectively captures spatial dependencies among connected vehicles and infrastructure entities [24,25,26,27].
4.2. Calibrated Composite Risk Model
For each candidate node , IntentProv-IoV computes anomaly risk, normalized intent-deviation risk, trust risk, and provenance contribution risk. The anomaly risk is where is the locally expected state, and is a normalization constant. The trust risk is and the provenance risk is The composite score is subject to .
Prior to optimization, all risk components , , , and are normalized to the interval using statistics estimated from the training data. This normalization ensures that the optimization coefficients operate on comparable scales and reflect relative fusion importance rather than differences in variable magnitude.
The weights are not fixed arbitrarily. They are selected on a validation split using constrained grid search or Bayesian optimization to maximize attribution precision and traffic-intent deviation reduction while keeping the false-positive rate and latency below operational bounds. The optimized coefficients are fusion weights rather than direct percentages of component importance. Because the four risk terms are normalized but correlated and can compensate for one another, their numerical magnitudes are not expected to be proportional to the performance loss observed when a complete component is removed. To prevent a calibration result that contradicts the empirical role of the components, the selected configuration is additionally checked against the validation ablation ranking. In the retained configuration, provenance contribution receives the largest coefficient, consistent with the ablation study, where its removal produces the largest reduction in TIDR and attribution precision. Anomaly evidence remains a lower-weight supporting term because it is useful for local screening but does not by itself represent causal traffic impact.
The decision threshold λ is calibrated separately for each traffic-density stratum using attack-free validation windows. The evaluated densities are grouped as sparse (300–400 vehicles), medium (500–600 vehicles), and dense (700–800 vehicles). For each stratum, is set from the upper tail of the benign distribution of the maximum composite score so that the validation false-positive rate does not exceed 5%. During testing, the threshold corresponding to the current density stratum is retrieved and kept fixed. This rule prevents a universal threshold calibrated in sparse traffic from over-flagging the larger number of benign interactions observed in dense traffic and makes the density-specific decision rule reproducible.
4.3. Attribution and Intent-Preserving Response
When the maximum composite score exceeds the calibrated threshold, the framework extracts the dominant causal path. The path expression below is used only as a ranking heuristic for selecting a candidate dominant path; its summed node score is not reported as the path’s total causal effect. The final path magnitude is obtained with the joint intervention defined in Section 3.5, which prevents mediated effects from being counted repeatedly.
The attribution report contains the suspected source, dominant propagation path, deviation magnitude, onset time, confidence score, affected RSUs or vehicles, and recommended mitigation. Mitigation is not limited to reporting an alert. Depending on the path, the edge server can discount a suspicious event, request independent confirmation from nearby vehicles, isolate a Sybil cluster, increase the weight of corroborated RSU observations, or revert a route-control decision that increased .
4.4. Hash-Only Blockchain Audit
The blockchain component is intentionally minimized. It does not participate in detection or scoring. For each confirmed event, the edge server stores only a hash of the attribution evidence and metadata, while detailed logs remain in edge storage subject to privacy and retention policies:
This design gives forensic integrity without claiming blockchain as the central scientific contribution. If a provenance log is modified after attribution, the recomputed hash will not match the stored audit record.
Implementation scope of the audit layer. The evaluated prototype does not implement a complete distributed blockchain protocol with peer-to-peer block propagation, consensus, validator election, or smart-contract execution. It implements the security-critical operation required by the proposed framework: generation of a cryptographic digest for the finalized attribution record and append-only storage of that digest as an audit anchor. The term ‘hash-only blockchain audit’ therefore denotes a blockchain-compatible anchoring design, not a claim that a new blockchain protocol was implemented or benchmarked. In a multi-operator deployment, the same digest can be submitted to an existing permissioned ledger, where the ledger supplies ordering, replication, and consensus. Because those ledger functions are outside the detection and attribution path, the reported detection accuracy and latency do not depend on blockchain consensus performance.
Privacy mechanism. ‘Privacy-preserving edge storage’ in this manuscript refers to data minimization and access protection rather than to a new privacy primitive. Raw trajectories and detailed provenance logs remain off-chain at the responsible edge domain; only a one-way hash and minimal event metadata are eligible for external anchoring. Vehicle identifiers in retained forensic records are pseudonymized, storage is access-controlled by role, records are encrypted at rest and protected in transit, and detailed logs are deleted or aggregated after a bounded retention period unless an incident requires preservation. These controls reduce disclosure and cross-domain replication of raw mobility data. Formal privacy guarantees such as differential privacy or secure multiparty computation are not claimed and remain future work.
4.5. Algorithmic Workflow See Algorithm 1
See Algorithm 1.
| Algorithm 1. IntentProv-IoV detection, counterfactual attribution, and mitigation workflow |
| Input: V2X stream, road graph , traffic rules , trust table, η*, λ, K, ρ Output: alert decision, dominant causal path, attribution report, audit hash 1: Collect vehicle states, RSU observations, CPM/CAM/BSM events during interval t 2: Predict using the selected and compute 3: Generate candidate provenance links satisfying temporal ordering and at least one message, longitudinal, lateral, or infrastructure-mediated interaction condition 4: Reject candidate links for which , including spatially adjacent vehicles traveling independently in parallel lanes 5: For each remaining candidate link (vi,vj), compute the influence score ψij(t) 6: Retain in only if and 7: Construct from the retained provenance edges 8: For each candidate node v in the affected subgraph: 9: Estimate using Monte Carlo edge attenuation 10: Use linear sensitivity if the online latency budget is exceeded 11: Compute 12: Retrieve the density-specific calibrated threshold λ 13: If , extract , and generate an attribution report 14: Execute mitigation that minimizes over the next horizon 15: Store on the hash-only audit layer 16: Return alert, path, mitigation status, and audit handle |
4.6. Complexity and Overhead
Let be the number of provenance edges, the number of vehicles, the prediction cost, the number of Monte Carlo counterfactual samples, and the edges and nodes in the affected subgraph. Candidate pruning makes in localized events. The per-interval complexity is
The bandwidth overhead is dominated by provenance metadata hashes and edge attributes, not blockchain payloads. The memory footprint grows with the retained event window and is bounded by purging or aggregating expired causal edges. The Monte Carlo estimator can be used asynchronously for high-confidence forensic reports, while the linear estimator preserves online operation when the edge latency budget is tight.
5. Experimental Evaluation
The evaluation is designed to address the main reviewer-risk points for a Q1 venue: operational contribution estimation, prediction sensitivity, causal baselines, adaptive adversaries, statistical rigor, trajectory-only real-data validation, packet loss, and edge overhead. The protocol is intended to be reproducible through archived simulator configuration files, random seeds, generated logs, and analysis scripts. For readability, the experimental results are organized into a compact sequence covering overall performance, predictor sensitivity and calibration, robustness and trajectory validation, traffic recovery and deployment overhead, and ablation analysis; closely related experiments are discussed together rather than as separate short subsections.
5.1. Environment, Data, and Protocol
The evaluation is conducted using a synchronized CARLA–SUMO co-simulation environment, in which SUMO provides microscopic traffic dynamics and route management, while CARLA supplies realistic road geometry, vehicle behavior, and perception context [22,23]. A custom V2X communication layer supports event dissemination and cooperative information exchange among vehicles, RSUs, and the edge server. Each experiment is repeated across 10 random seeds with randomized attack onset, source position, traffic density, and affected route segment. Unless otherwise noted, the prediction horizon is short enough for edge response, the event window is pruned by spatial and temporal proximity, and the Monte Carlo estimator is restricted to the affected subgraph. A secondary trajectory-only validation uses highD, NGSIM, and INTERACTION-style trajectories. Because these data do not contain a full V2X stack, they are used to test the stability of under real motion patterns rather than to evaluate communication-level attacks. The simulated road network spans approximately 6 km and contains 12 RSUs connected to a regional edge server responsible for traffic-intent prediction, provenance construction, attribution, and mitigation. Traffic density is varied from 300 to 800 active vehicles to evaluate framework behavior under different operational loads. Vehicle trajectories, traffic conditions, communication events, and attack parameters are regenerated for each experiment using independent random seeds. Unless otherwise stated, all reported results correspond to the mean and standard deviation obtained from 10 repeated runs. To complement simulation-based analysis, an additional trajectory-level validation is performed using the highD, NGSIM, and INTERACTION datasets [25,26,27]. These datasets are used to assess the stability of traffic-intent deviation measurements under realistic vehicle motion patterns. Since complete V2X communication logs are unavailable, the trajectory datasets are not used for end-to-end attack evaluation. Table 2 summarizes the principal evaluation parameters. The latency values reported in this study are end-to-end software timings obtained within the co-simulation workflow for the online path; they are not presented as a hardware-certified RSU benchmark. Because no dedicated physical RSU/MEC platform was benchmarked, the manuscript does not claim that the reported values constitute a universal hardware latency guarantee. A hardware-specific benchmark, including processor model, accelerator configuration, software stack, and power instrumentation, is left for deployment-oriented validation.
Table 2.
Experimental environment and evaluation configuration.
5.2. Attack Scenarios
The attack scenarios in Table 3 evaluate the robustness of IntentProv-IoV against representative V2X threats, including abrupt misinformation, coordinated influence campaigns, identity manipulation, gradual falsification, and replay-based attacks. These scenarios assess the framework’s ability to preserve traffic intent, identify causal propagation paths, and attribute responsibility under diverse adversarial conditions.
Table 3.
Attack scenarios used in the evaluation.
5.3. Baselines
The baseline methods in Table 4 represents major research directions in vehicular security, including misbehavior detection, trust management, blockchain-assisted security, graph anomaly detection, and causal attribution. They provide a comprehensive benchmark for evaluating the effectiveness of IntentProv-IoV in terms of detection performance, attribution precision, traffic-intent preservation, and operational efficiency.
Table 4.
Baselines selected to separate detection, trust, blockchain, graph, and causal effects.
5.4. Metrics and Statistical Reporting
The metrics are detection accuracy, precision, recall, F1-score, attribution precision, traffic-intent deviation reduction (TIDR), detection latency, memory footprint, bandwidth overhead, and RSU energy estimate. Attribution precision measures the fraction of reported causal source nodes that match the injected source or the injected source cluster. TIDR is
Results are reported as the mean standard deviation across 10 seeds. For primary comparisons, the paper reports 95% confidence intervals, paired tests against the strongest non-proposed baseline, and Cohen’s for effect size:
5.5. Overall Performance
Table 5 and Figure 5 summarize the overall performance of the evaluated methods across detection accuracy, traffic-intent preservation, attribution quality, and operational latency. IntentProv-IoV achieves the strongest overall performance, obtaining the highest ACC, F1-score, TIDR, and attribution precision while maintaining low online-path latency in the evaluated co-simulation. The results indicate that combining traffic-intent analysis, provenance reasoning, and counterfactual contribution estimation improves both security effectiveness and traffic-level recovery.
Table 5.
Overall performance with statistical reporting across 10 randomized seeds.
Figure 5.
Multi-objective comparison of evaluated methods. The x-axis represents attribution latency, the y-axis represents traffic-intent deviation reduction (TIDR), bubble size corresponds to attribution precision (AP), and color intensity represents the F1-score. The upper-left region represents the desired operating point characterized by high traffic-intent preservation and low latency. IntentProv-IoV occupies the most favorable region, demonstrating a balanced combination of detection performance, attribution quality, and operational efficiency.
IntentProv-IoV retains the strongest classification performance while improving the traffic-level objective. Against graph anomaly, the TIDR improvement is statistically significant under paired testing () and produces a large effect size in the simulation setting. The counterfactual GNN baseline narrows the attribution gap but incurs higher latency because it repeatedly masks graph nodes without using event-window pruning. The SCM/DoWhy-GCM baseline provides strong causal reasoning but is slower because it is not optimized for edge-event windows. Mechanistically, the TIDR gain is consistent with intervention-guided mitigation: the framework suppresses the propagation path that changes the traffic state rather than only classifying the initiating message. The attribution gain over non-causal and graph anomaly baselines is consistent with the explicit intervention test on candidate sources. These controlled comparisons support the proposed mechanism within the simulation, but they should not be interpreted as field-level proof of causation because all methods share the same simulated environment and observability assumptions.
5.6. Predictor Sensitivity and Calibration
Figure 6 and Table 6 evaluate whether the framework depends on one traffic predictor. The trend remains consistent across all four predictors, although weaker predictors reduce absolute TIDR and attribution precision. The magnitude of the difference is nevertheless important: TIDR increases from 0.32 with the IDM to 0.41 with the GNN, a relative increase of approximately 28%, while attribution precision rises from 0.81 to 0.89, approximately 10%. This occurs because the IDM is a local car-following model and does not explicitly represent the heterogeneous spatial dependencies used by the provenance graph; LSTM captures temporal history but only indirectly represents neighboring interactions; and the DCRNN and GNN more directly encode spatial–temporal coupling. A more accurate interaction-aware predictor produces a cleaner benign reference trajectory, so less residual error is carried into Dt, and the intervention test can separate competing causal candidates more reliably. Consequently, IntentProv-IoV is model-agnostic in the sense that the security pipeline can operate with all four predictors, but it is not predictor-independent: absolute preservation and attribution performance depend materially on forecast quality. The stable ordering across backbones supports robustness of the framework trend, whereas the 0.32–0.41 TIDR range defines an important practical limitation and motivates predictor-specific calibration.
Figure 6.
Sensitivity of TIDR and attribution precision to the traffic predictor used in .
Table 6.
Prediction sensitivity study showing that the framework is not dependent on a single predictor.
The composite weights are calibrated on the validation split, as summarized in Table 7. The Bayesian-optimization configuration assigns the largest coefficient to provenance contribution (δ = 0.42), followed by intent-deviation evidence (β = 0.27), anomaly risk (α = 0.18), and trust risk (γ = 0.13). These coefficients should not be interpreted as percentages of the final performance contribution because the risk terms interact and partially overlap. Their consistency is therefore assessed by both the validation objective and the ablation ranking. The provenance term has the largest optimized weight, and consistently, its removal produces the largest degradation in Section 5.9. The selected configuration achieves the best reported validation trade-off (FPR = 0.046, TIDR = 0.41, and AP = 0.89). Density-specific λ values are not learned jointly with these weights; they are subsequently obtained from the benign score distribution within the sparse, medium, and dense traffic strata defined in Section 4.2, under the 5% validation false-positive constraint.
Table 7.
Hyperparameter calibration of the composite score.
Data partitioning and model-selection protocol. Training, validation, and testing datasets are strictly separated. The validation split is used only for predictor calibration, threshold determination, and optimization of the composite-score coefficients. The ablation study in Section 5.9 is evaluated using the fixed configuration selected from validation and is conducted exclusively on the held-out test scenarios. Therefore, validation data are not reused for ablation-based model selection, avoiding information leakage and optimistic bias.
5.7. Robustness and Real-Trajectory Validation
Table 8 evaluates the robustness of IntentProv-IoV under adaptive adversarial behavior and packet-loss conditions. Compared with the baseline static-attacker scenario, both TIDR and attribution precision gradually decrease as attacks become more sophisticated and distributed. The adaptive min- attacker reduces attribution evidence, while the distributed low-amplitude attacker increases attribution ambiguity by spreading malicious influence across multiple entities. The most challenging setting combines adaptive behavior with 20% packet loss, resulting in the largest performance degradation and increased latency. Nevertheless, the framework maintains meaningful traffic-intent recovery and attribution capability across all scenarios, demonstrating graceful degradation and resilience under realistic operating conditions. The pattern also identifies the failure mechanism: adaptive minimization reduces the observable intervention effect of each source, distributed attacks create several partially substitutable causal paths, and packet loss removes evidence needed to distinguish those paths. The resulting decreases in AP and increases in latency are therefore consistent with reduced causal observability rather than an unexplained statistical fluctuation. Because these factors are experimentally imposed, the comparison supports this mechanism within the controlled scenarios; it does not establish that the same effect sizes will hold in field networks.
Table 8.
Adaptive-adversary and packet-loss evaluation.
Figure 7 reports robustness to injected predictor error. The degradation is gradual rather than abrupt, which supports the bound in Section 6.
Figure 7.
Robustness to injected prediction noise. Attribution degrades gradually rather than collapsing under moderate predictor error.
To reduce the limitation of simulation-only evaluation, the manuscript adds trajectory-only validation. Real trajectory segments estimate normal traffic intent. Controlled perturbations are then injected into speed, headway, lane-change timing, and route choice. Because these datasets lack native V2X message logs, this experiment validates the stability of and attribution under real motion patterns rather than end-to-end V2X communication. This is shown in Table 9. The lower AP values on NGSIM and INTERACTION are interpreted primarily as an observability limitation: realistic trajectory variability and the absence of native message/RSU provenance make multiple motion explanations compatible with the same perturbation. Thus, these results support the stability of the outcome metric under real motion patterns but do not provide independent identification of V2X message causality.
Table 9.
Real-trajectory validation role, quantitative outcome, and limitation.
5.8. Traffic Recovery, Scalability, and Deployment Overhead
The framework improves traffic-level recovery because mitigation discounts the dominant malicious causal path rather than merely labeling the source. Figure 8 shows the speed recovery trend after a false emergency-braking event. The baseline recovers slowly because downstream route and braking decisions remain affected by propagated evidence. IntentProv-IoV recovers faster by suppressing the malicious causal chain and restoring event weights toward corroborated observations.
Figure 8.
Average speed recovery after a false emergency-braking event. IntentProv-IoV recovers faster by suppressing the dominant malicious causal chain.
Figure 9 and Table 10 evaluate the scalability and deployment overhead of IntentProv-IoV under increasing vehicle density. As the number of vehicles grows from 300 to 700, latency, memory usage, metadata bandwidth, and estimated RSU energy consumption increase gradually, reflecting the additional provenance and attribution processing required for larger event volumes. The growth is near-linear under event-window pruning. At 800 vehicles, the latency remains within an edge-suitable range in the evaluated setting. However, the observed growth remains controlled and approximately linear, indicating that the event-window pruning and localized provenance analysis mechanisms effectively limit computational expansion. Even at the highest evaluated density, latency remains below 40 ms, memory consumption remains close to 1 GB, and metadata overhead per RSU remains below 1 MB, demonstrating that the framework can support real-time attribution and traffic-intent preservation without imposing excessive edge-resource requirements. Overall, the results confirm that IntentProv-IoV maintains practical scalability and operational efficiency under realistic vehicular traffic loads. The reported latency corresponds to the online screening path using the linear contribution approximation; K-sample Monte Carlo counterfactual propagation is excluded from this latency and is executed asynchronously only when a high-confidence forensic report is required. Accordingly, the 38 ms value at 800 vehicles should be interpreted as a co-simulation software timing for the pruned online path, not as the simultaneous execution time of GNN prediction plus K Monte Carlo graph propagations on a specified commercial edge device. The CPU-energy values are likewise simulation-side estimates rather than measurements from a named RSU hardware platform. These results demonstrate scaling behavior within the evaluated software environment, while physical edge-hardware benchmarking remains necessary before making deployment-level latency or energy guarantees. The near-linear growth is explained by event-window pruning: only the affected local subgraph is processed online, so the number of evaluated edges grows much more slowly than an all-pairs vehicle graph. The increase in memory and metadata bandwidth is the corresponding cost of retaining more local provenance evidence as density rises. These relationships are algorithmic explanations of the measured trends, not hardware-general causal guarantees.
Figure 9.
Runtime and memory overhead under increasing vehicle density.
Table 10.
Edge overhead analysis.
5.9. Ablation Study
Table 11 and Figure 10 evaluate the contribution of the major components of IntentProv-IoV through a systematic ablation study. The full model achieves the best overall performance, reaching an ACC of 0.95, an F1-score of 0.93, a TIDR of 0.41, and an attribution precision of 0.89. The largest performance degradation occurs when provenance contribution estimation is removed, causing TIDR to decrease from 0.41 to 0.25 and attribution precision to decrease from 0.89 to 0.61. This result is consistent with the calibration in Table 7, where provenance contribution receives the largest fusion weight. Importantly, the magnitude of an optimized fusion coefficient is not expected to equal the percentage performance loss produced by removing the corresponding component. Ablation removes an entire information source and its interactions with the remaining terms, whereas calibration determines the coefficient that best combines simultaneously available normalized evidence. The two analyses therefore measure different quantities: calibration controls evidence fusion, while ablation measures conditional system dependence. Removing the traffic-intent deviation component also significantly reduces performance, demonstrating the importance of intent-aware reasoning for identifying operational impact. Eliminating the trust-risk component produces a moderate reduction in TIDR and attribution precision, indicating that trust information provides complementary evidence but is not the dominant contributor. The linear contribution approximation remains effective, achieving a TIDR of 0.38 and attribution precision of 0.85, although it remains weaker than the full Monte Carlo estimation. Similarly, removing hyperparameter calibration decreases both attribution quality and traffic-intent recovery, highlighting the value of calibrated scoring. In contrast, removing the blockchain audit layer has almost no impact on the ACC, F1-score, TIDR, or attribution precision, which is expected because blockchain serves as a forensic integrity and tamper-evident audit mechanism rather than a detection engine. Overall, the results demonstrate that provenance contribution estimation, traffic-intent analysis, and calibrated scoring collectively account for the majority of the performance gains achieved by the full IntentProv-IoV framework. The ablation results are causal only with respect to controlled component removal inside the implemented system: removing provenance contribution eliminates the intervention-derived evidence used to distinguish sources with similar anomaly scores, whereas removing Dt weakens the link between a suspicious event and its traffic-level consequence. The comparatively small effect of removing the audit layer confirms that evidence anchoring is functionally separated from detection and attribution. These ablations explain which implemented components drive the observed performance differences, but they do not by themselves establish external causal validity beyond the evaluated scenarios.
Table 11.
Ablation study after adding causal contribution, calibration, and audit separation.
Figure 10.
Multi-metric comparison of representative methods.
6. Security, Robustness, and Theoretical Analysis
This section analyzes the security properties, robustness characteristics, and theoretical foundations that explain the observed behavior.
6.1. Bounded Prediction-Noise Effect
Because intent deviation depends on prediction quality, the framework includes a conservative error bound. Assume the forecasting error is bounded by and the deviation function is -Lipschitz with respect to the predicted state. Then, the deviation estimation error is bounded by
If the counterfactual propagation estimator is also -Lipschitz with respect to prediction error, then
This bound explains why the prediction-noise experiment is necessary: predictor uncertainty affects both intent deviation and causal contribution. It also motivates calibrating thresholds by predictor quality rather than using a universal constant. The term captures the Monte Carlo sampling error and creates a direct trade-off between attribution stability and latency.
6.2. Insider, Sybil, Replay, and Provenance Tampering
IntentProv-IoV does not assume that valid credentials imply safe behavior. False but authenticated messages can be flagged when they increase and produce high . Sybil attacks are addressed through correlated contribution paths: identities that jointly amplify the same traffic effect are clustered by causal edge similarity and downstream deviation. Replay attacks are detected when temporal provenance edges contradict current road context or when replayed events trigger divergence from the expected state. Provenance tampering is limited by storing hash-only evidence records; if edge logs are modified after attribution, the recomputed hash does not match the audit record.
6.3. Adaptive Evasion and Low-Amplitude Attacks
An adaptive attacker may attempt to distribute influence across several identities or reduce the per-node contribution below threshold. The framework mitigates this by aggregating contribution over causal clusters and short event windows. A low-amplitude attack that produces no measurable traffic effect is outside the response objective; an attack that produces macroscopic disruption must eventually affect or a downstream decision node. The hardest case is a distributed attacker operating under packet loss, where missing edges reduce provenance completeness. In that case, the report should include confidence and observability scores, and mitigation should prefer corroboration over accusation.
6.4. Packet Loss and Observability Limits
Packet loss weakens the observed provenance graph by removing edges or delaying event arrival. IntentProv-IoV uses temporal smoothing, RSU corroboration, and contribution aggregation over short windows to reduce the effect of missing edges. However, low-observability regions should trigger conservative responses. The framework should not label a vehicle as the sole cause when the graph is incomplete; it should report a causal cluster or request additional evidence. This design choice is important for deployment because attribution has operational and legal implications.
6.5. Validity Threats
There are four main validity threats. First, simulator realism may not capture all communication interference and driver reaction patterns. This is partially addressed through trajectory-only validation, but full roadside logs remain necessary. Second, the composite score depends on calibration data; deployment in a new city or traffic regime requires recalibration. Third, the structural causal graph may omit hidden confounders, such as unobserved local hazards or infrastructure states. Fourth, the energy estimates are platform-dependent and should be reproduced on the target RSU or MEC hardware. These threats do not invalidate the framework, but they define the scope of the evidence and the next steps required for field deployment.
7. Discussion
The revised formulation strengthens the central contribution. Instead of defining marginal contribution only as , the framework specifies what removal means, how it is estimated, and how it relates to an interventional effect. This directly addresses the criticism that provenance contribution is conceptually attractive but operationally underdefined. The Monte Carlo estimator gives a forensic-quality contribution score, while the linear approximation gives a deployable online estimate.
Traffic-intent deviation is meaningful only when prediction error is controlled. The predictor sensitivity study shows whether the security conclusion survives changes in . If performance collapses under a weaker but plausible predictor, the limitation must be reported. If the trend remains stable, the intent-preservation claim becomes stronger. In the reported design, better spatial–temporal prediction improves absolute performance, but the advantage of provenance-based attribution remains visible across backbones.
The audit-only design avoids novelty inflation. The ablation deliberately shows little detection impact when blockchain is removed. This is acceptable because the blockchain layer is evaluated for integrity, storage, and auditability rather than detection accuracy. The scientific contribution is the causal provenance and intent-preservation mechanism; blockchain is an evidence-preservation layer for multi-party accountability.
The framework is most appropriate for managed V2X corridors, smart intersections, RSU clusters, and MEC-enabled traffic-control regions. These environments can maintain short historical windows, local road topology, and event-level provenance without forwarding all raw data to the cloud. For dense metropolitan settings, hierarchical provenance aggregation is needed: RSUs can maintain local subgraphs, edge servers can merge only high-impact summaries, and audit records can be stored as hashes. This reduces bandwidth and preserves privacy while retaining traceability.
Reproducibility depends on preserving the simulator configurations, random seeds, raw logs, and analysis scripts used for each scenario. Real trajectory validation reduces but does not eliminate the simulation-only limitation because public trajectory datasets generally lack complete V2X message and RSU logs. Extremely dense deployments may require hierarchical graph aggregation. Stealthy attackers with very low physical impact may remain below the response threshold, and this is acceptable if the operational objective is to preserve traffic intent rather than detect every harmless deviation.
8. Conclusions and Future Work
This paper presented IntentProv-IoV, a causally grounded provenance framework for preserving traffic intent in IoV environments. The framework shifts vehicular security from isolated message classification and node-level trust evaluation toward system-level traffic-intent assurance. It defines traffic-intent deviation, grounds provenance contribution in structural causal modeling, estimates counterfactual node effects, calibrates a composite risk score, extracts dominant causal paths, and records hash-only audit evidence.
The enhanced evaluation design addresses the main reviewer concerns that commonly affect IoV security papers: underdefined contribution scores, dependence on a single predictor, lack of causal baselines, weak robustness analysis, arbitrary risk weights, simulation-only claims, and insufficient overhead reporting. The results indicate that provenance-driven intent preservation improves traffic-intent deviation reduction and attribution precision while maintaining low online-path latency in the evaluated co-simulation.
Future work should focus on larger multi-edge deployments, online adaptive thresholding, federated provenance learning across RSU regions, privacy-preserving causal contribution estimation, real roadside logs, and integration with 6G-enabled traffic digital twins.
Funding
The Researchers would like to thank the Deanship of Graduate Studies and Scientific Research at Qassim University (www.qu.edu.sa (accessed on 20 August 2026)) for their financial support (QU-APC-2026).
Data Availability Statement
The datasets and analysis scripts generated and analyzed during the current study are available from the corresponding author upon reasonable request. Due to the nature of the simulated vehicular environments and the computational overhead associated with the traffic-intent preservation framework, specific scenario configurations and logs can be shared for research purposes. Interested parties may contact the corresponding author.
Conflicts of Interest
The author declares no conflict of interest.
References
- Lu, N.; Cheng, N.; Zhang, N.; Shen, X.; Mark, J.W. Connected vehicles: Solutions and challenges. IEEE Internet Things J. 2014, 1, 289–299. [Google Scholar] [CrossRef] [Scilit]
- Hartenstein, H.; Laberteaux, K.P. A tutorial survey on vehicular ad hoc networks. IEEE Commun. Mag. 2008, 46, 164–171. [Google Scholar] [CrossRef] [Scilit]
- Petit, J.; Shladover, S.E. Potential cyberattacks on automated vehicles. IEEE Trans. Intell. Transp. Syst. 2015, 16, 546–556. [Google Scholar] [CrossRef] [Scilit]
- ETSI EN 302 637-2; Intelligent Transport Systems (ITS); Vehicular Communications; Basic Set of Applications; Part 2: Specification of Cooperative Awareness Basic Service. European Telecommunications Standards Institute (ETSI): Sophia Antipolis, France, 2019.
- SAE J2735_202309; V2X Communications Message Set Dictionary. SAE International: Warrendale, PA, USA, 2023.
- ETSI TS 103 324; Intelligent Transport Systems (ITS); Vehicular Communications; Collective Perception Service. ETSI: Valbonne, France, 2023.
- van der Heijden, R.W.; Lukaseder, T.; Kargl, F. VeReMi: A dataset for comparable evaluation of misbehavior detection in VANETs. Secur. Priv. Commun. Netw. 2018, 318–337. [Google Scholar] [CrossRef] [Scilit]
- Kamel, J.; Wolf, M.; van der Heijden, R.W.; Kaiser, A.; Urien, P.; Kargl, F. VeReMi Extension: A dataset for comparable evaluation of misbehavior detection in VANETs. In Proceedings of the IEEE International Conference on Communications, Dublin, Ireland, 6–9 July 2020. [Google Scholar]
- Boualouache, A.; Engel, T. A survey on machine learning-based misbehavior detection systems for 5G and beyond vehicular networks. IEEE Commun. Surv. Tutor. 2023, 25, 1128–1172. [Google Scholar] [CrossRef] [Scilit]
- Hbaieb, A.; Ayed, S.; Fourati, L.C. A survey of trust management in the Internet of Vehicles. Comput. Netw. 2022, 203, 108558. [Google Scholar] [CrossRef] [Scilit]
- Siddiqui, S.A.; Mahmood, A.; Sheng, Q.Z.; Suzuki, H.; Zhang, W.E. A survey of trust management in the Internet of Vehicles. Electronics 2021, 10, 2223. [Google Scholar] [CrossRef] [Scilit]
- Javed, A.R.; Shahzad, F.; Rehman, S.U.; Zikria, Y.B.; Srivastava, G. Integration of blockchain technology and federated learning in vehicular networks: A survey. Sensors 2022, 22, 4394. [Google Scholar] [CrossRef] [Scilit] [PubMed]
- Abbas, S.; Khan, M.A.; Latif, S.; Khan, A.A.; Lee, S.Y. Blockchain-based authentication in Internet of Vehicles: A survey. Sensors 2021, 21, 7927. [Google Scholar] [CrossRef] [Scilit] [PubMed]
- Pan, B.; Stakhanova, N.; Ray, S. Data provenance in security and privacy. ACM Comput. Surv. 2023, 55, 323. [Google Scholar] [CrossRef] [Scilit] [PubMed]
- Braun, U.; Shinnar, A.; Seltzer, M. Securing provenance. In Proceedings of the USENIX Workshop on Hot Topics in Security, San Jose, CA, USA, 29 July 2008. [Google Scholar]
- Pearl, J. Causality: Models, Reasoning, and Inference, 2nd ed.; Cambridge University Press: Cambridge, UK, 2009. [Google Scholar]
- Sharma, A.; Kiciman, E. DoWhy: An end-to-end library for causal inference. arXiv 2020, arXiv:2011.04216. [Google Scholar]
- Blobaum, P.; Gotz, P.; Budhathoki, K.; Mastakouri, A.; Janzing, D. DoWhy-GCM: An extension of DoWhy for causal inference in graphical causal models. J. Mach. Learn. Res. 2024, 25, 1–7. [Google Scholar]
- Treiber, M.; Kesting, A. Traffic Flow Dynamics; Springer: Berlin/Heidelberg, Germany, 2013. [Google Scholar]
- Li, Y.; Yu, R.; Shahabi, C.; Liu, Y. Diffusion convolutional recurrent neural network: Data-driven traffic forecasting. In Proceedings of the International Conference on Learning Representations, Vancouver, BC, Canada, 30 April 30—3 May 2018. [Google Scholar]
- Wu, Z.; Pan, S.; Chen, F.; Long, G.; Zhang, C.; Yu, P.S. A comprehensive survey on graph neural networks. IEEE Trans. Neural Netw. Learn. Syst. 2021, 32, 4–24. [Google Scholar] [CrossRef] [Scilit] [PubMed]
- Dosovitskiy, A.; Ros, G.; Codevilla, F.; Lopez, A.M.; Koltun, V. CARLA: An open urban driving simulator. In Proceedings of the 1st Annual Conference on Robot Learning, PMLR, Mountain View, CA, USA, 13–15 November 2017; PMLR: Mountain View, CA, USA, 2017; Volume 78, pp. 1–16. [Google Scholar]
- Lopez, P.A.; Behrisch, M.; Bieker-Walz, L.; Erdmann, J.; Flötteröd, Y.P.; Hilbrich, R.; Lücken, L.; Rummel, J.; Wagner, P.; Wießner, E. Microscopic traffic simulation using SUMO. In Proceedings of the IEEE International Conference on Intelligent Transportation Systems, Maui, HI, USA, 4–7 November 2018; IEEE: New York, NY, USA; pp. 2575–2582.
- Li, Y.; Ma, D.; An, Z.; Wang, Z.; Zhong, Y.; Chen, S.; Feng, C. V2X-Sim: Multi-agent collaborative perception dataset and benchmark for autonomous driving. IEEE Robot. Autom. Lett. 2022, 7, 10914–10921. [Google Scholar] [CrossRef] [Scilit]
- Krajewski, R.; Bock, J.; Kloeker, L.; Eckstein, L. The highD dataset: A drone dataset of naturalistic vehicle trajectories on German highways. In Proceedings of the IEEE International Conference on Intelligent Transportation Systems, Beijing, China, 12–15 October 2008; IEEE: New York, NY, USA, 2018; pp. 2118–2125. [Google Scholar]
- Federal Highway Administration. Next Generation Simulation (NGSIM) vehicle trajectory data; FHWA: Washington, DC, USA, 2007.
- Zhan, W.; Sun, L.; Wang, D.; Shi, H.; Clausse, A.; Naumann, M.; Kummerle, J.; Konigshof, H.; Stiller, C.; de La Fortelle, A.; et al. INTERACTION dataset: An international, adversarial and cooperative motion dataset in interactive driving scenarios with semantic maps. arXiv 2019, arXiv:1910.03088. [Google Scholar]
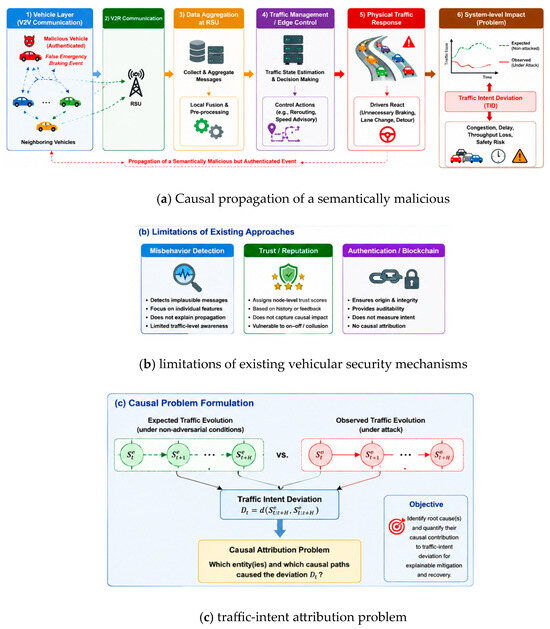
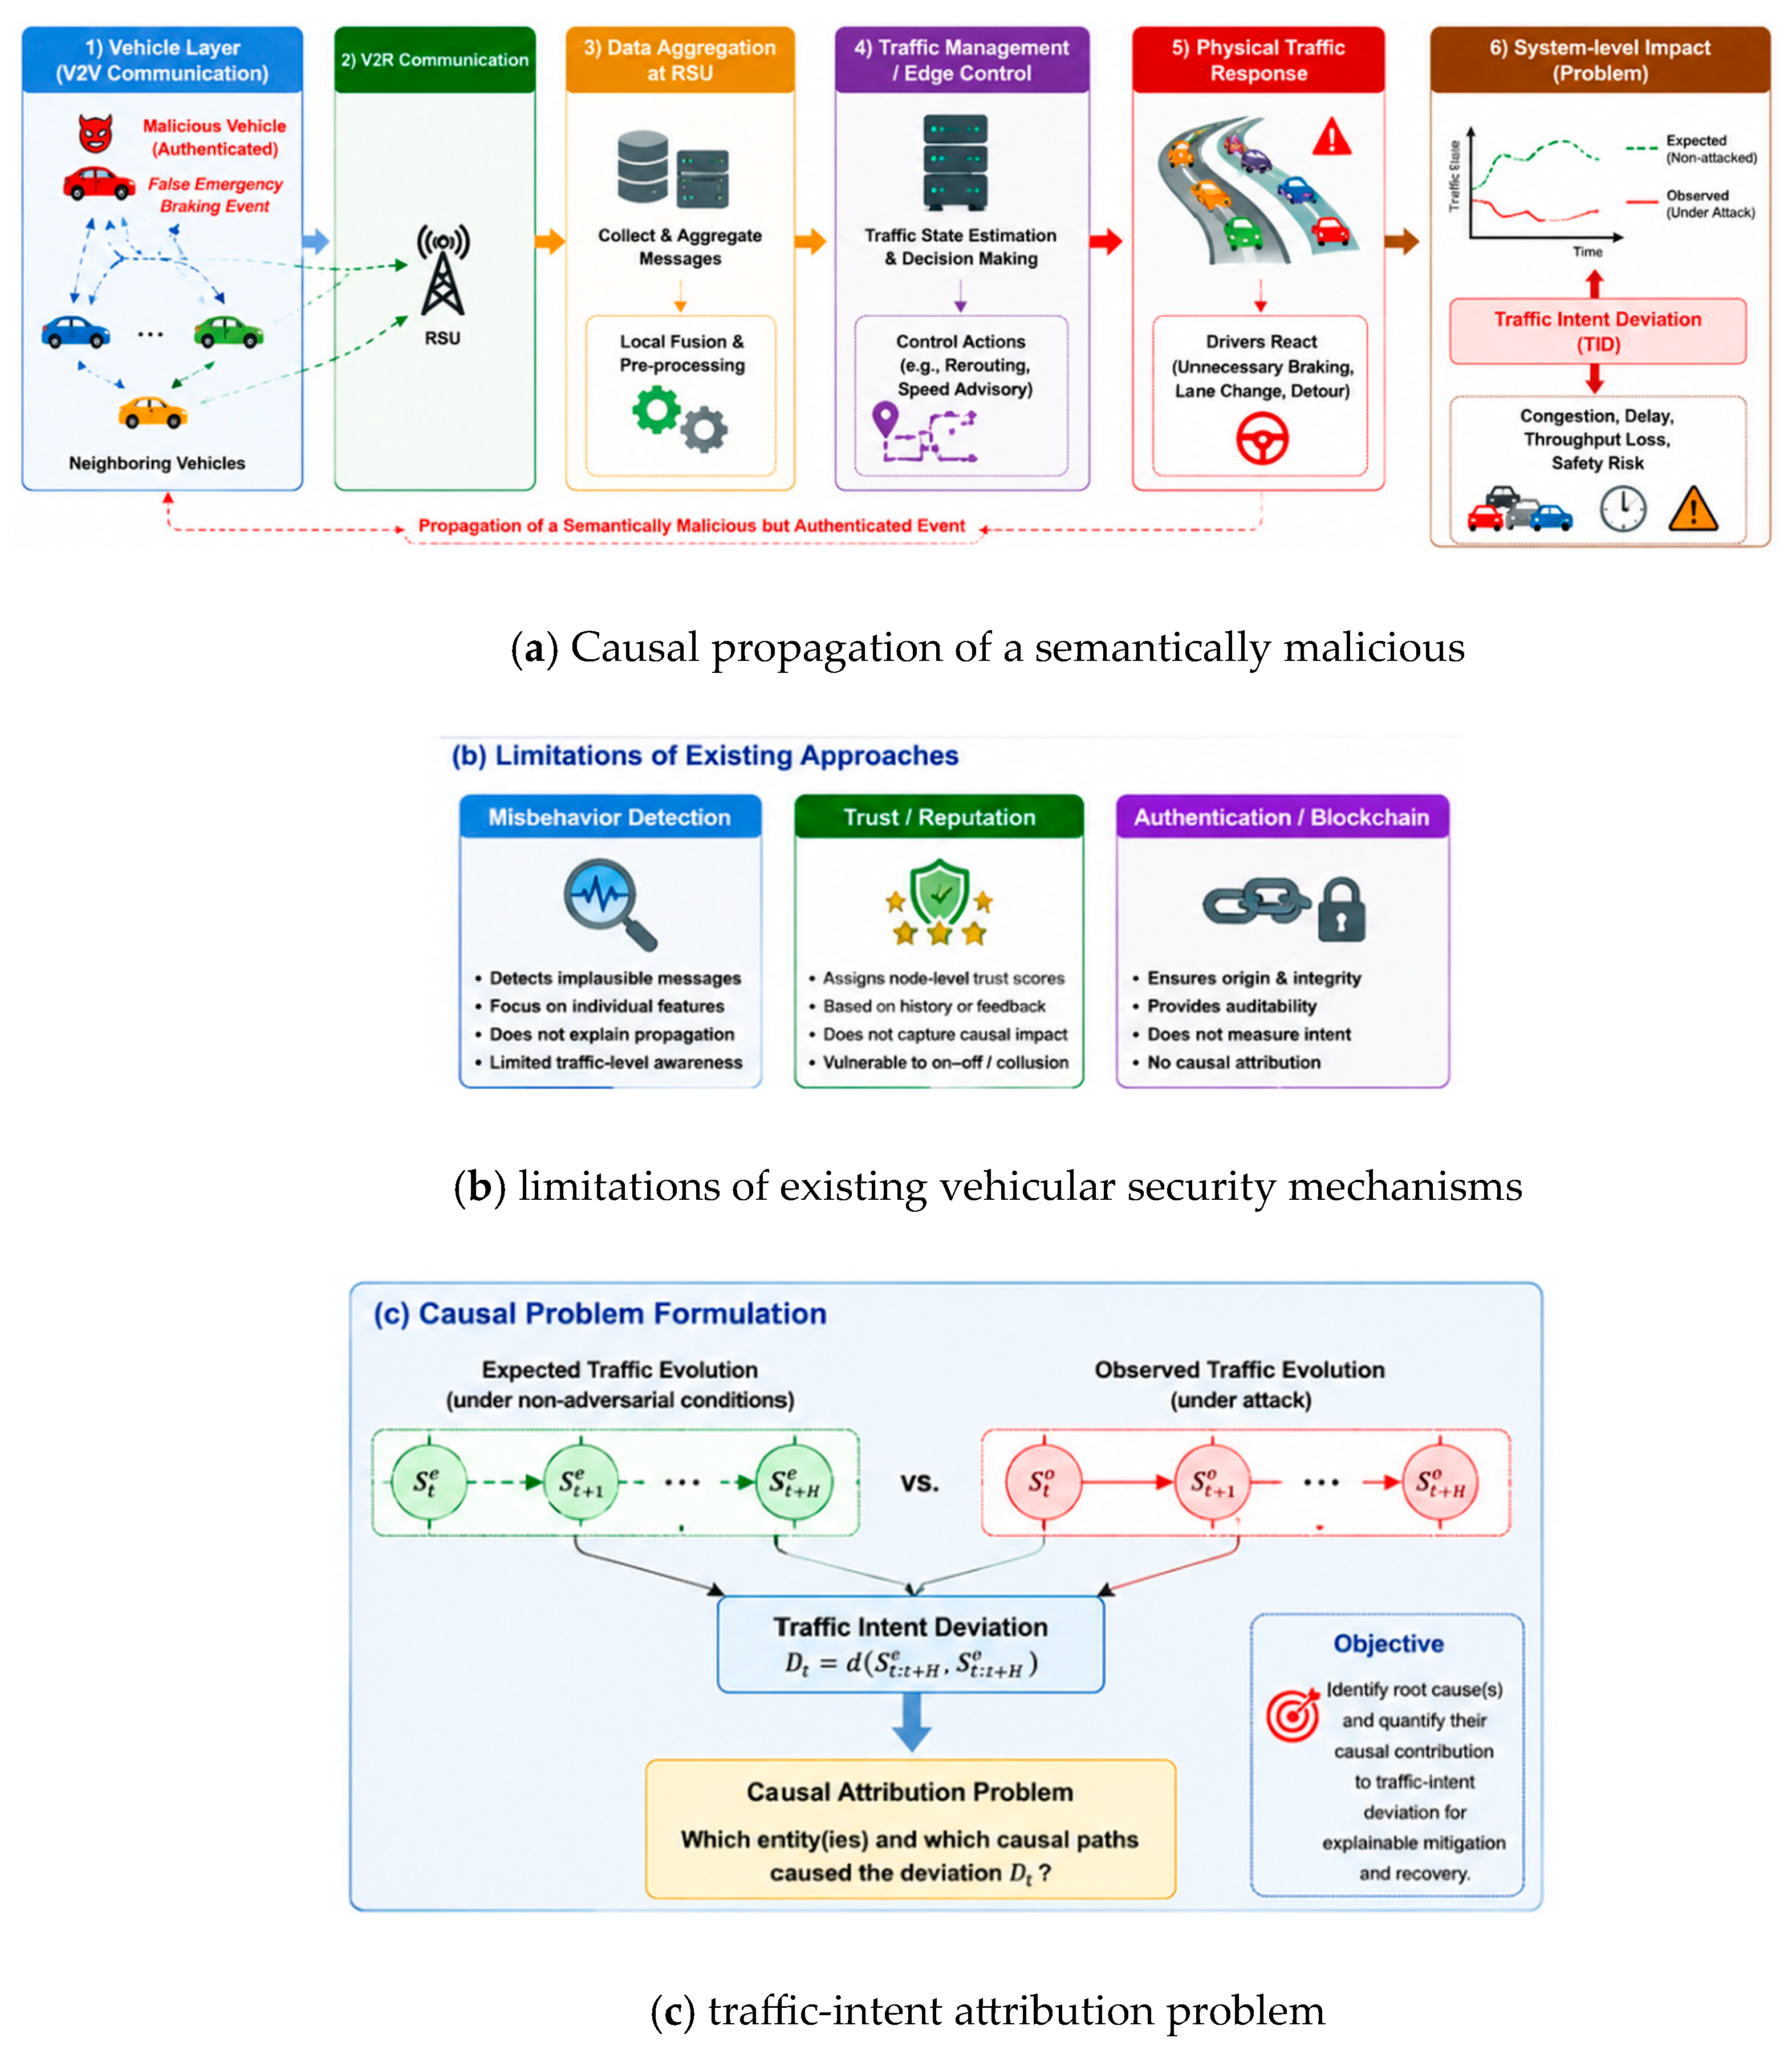
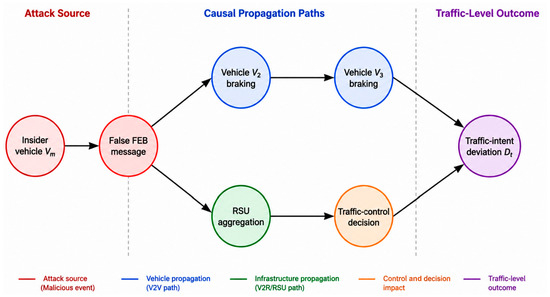
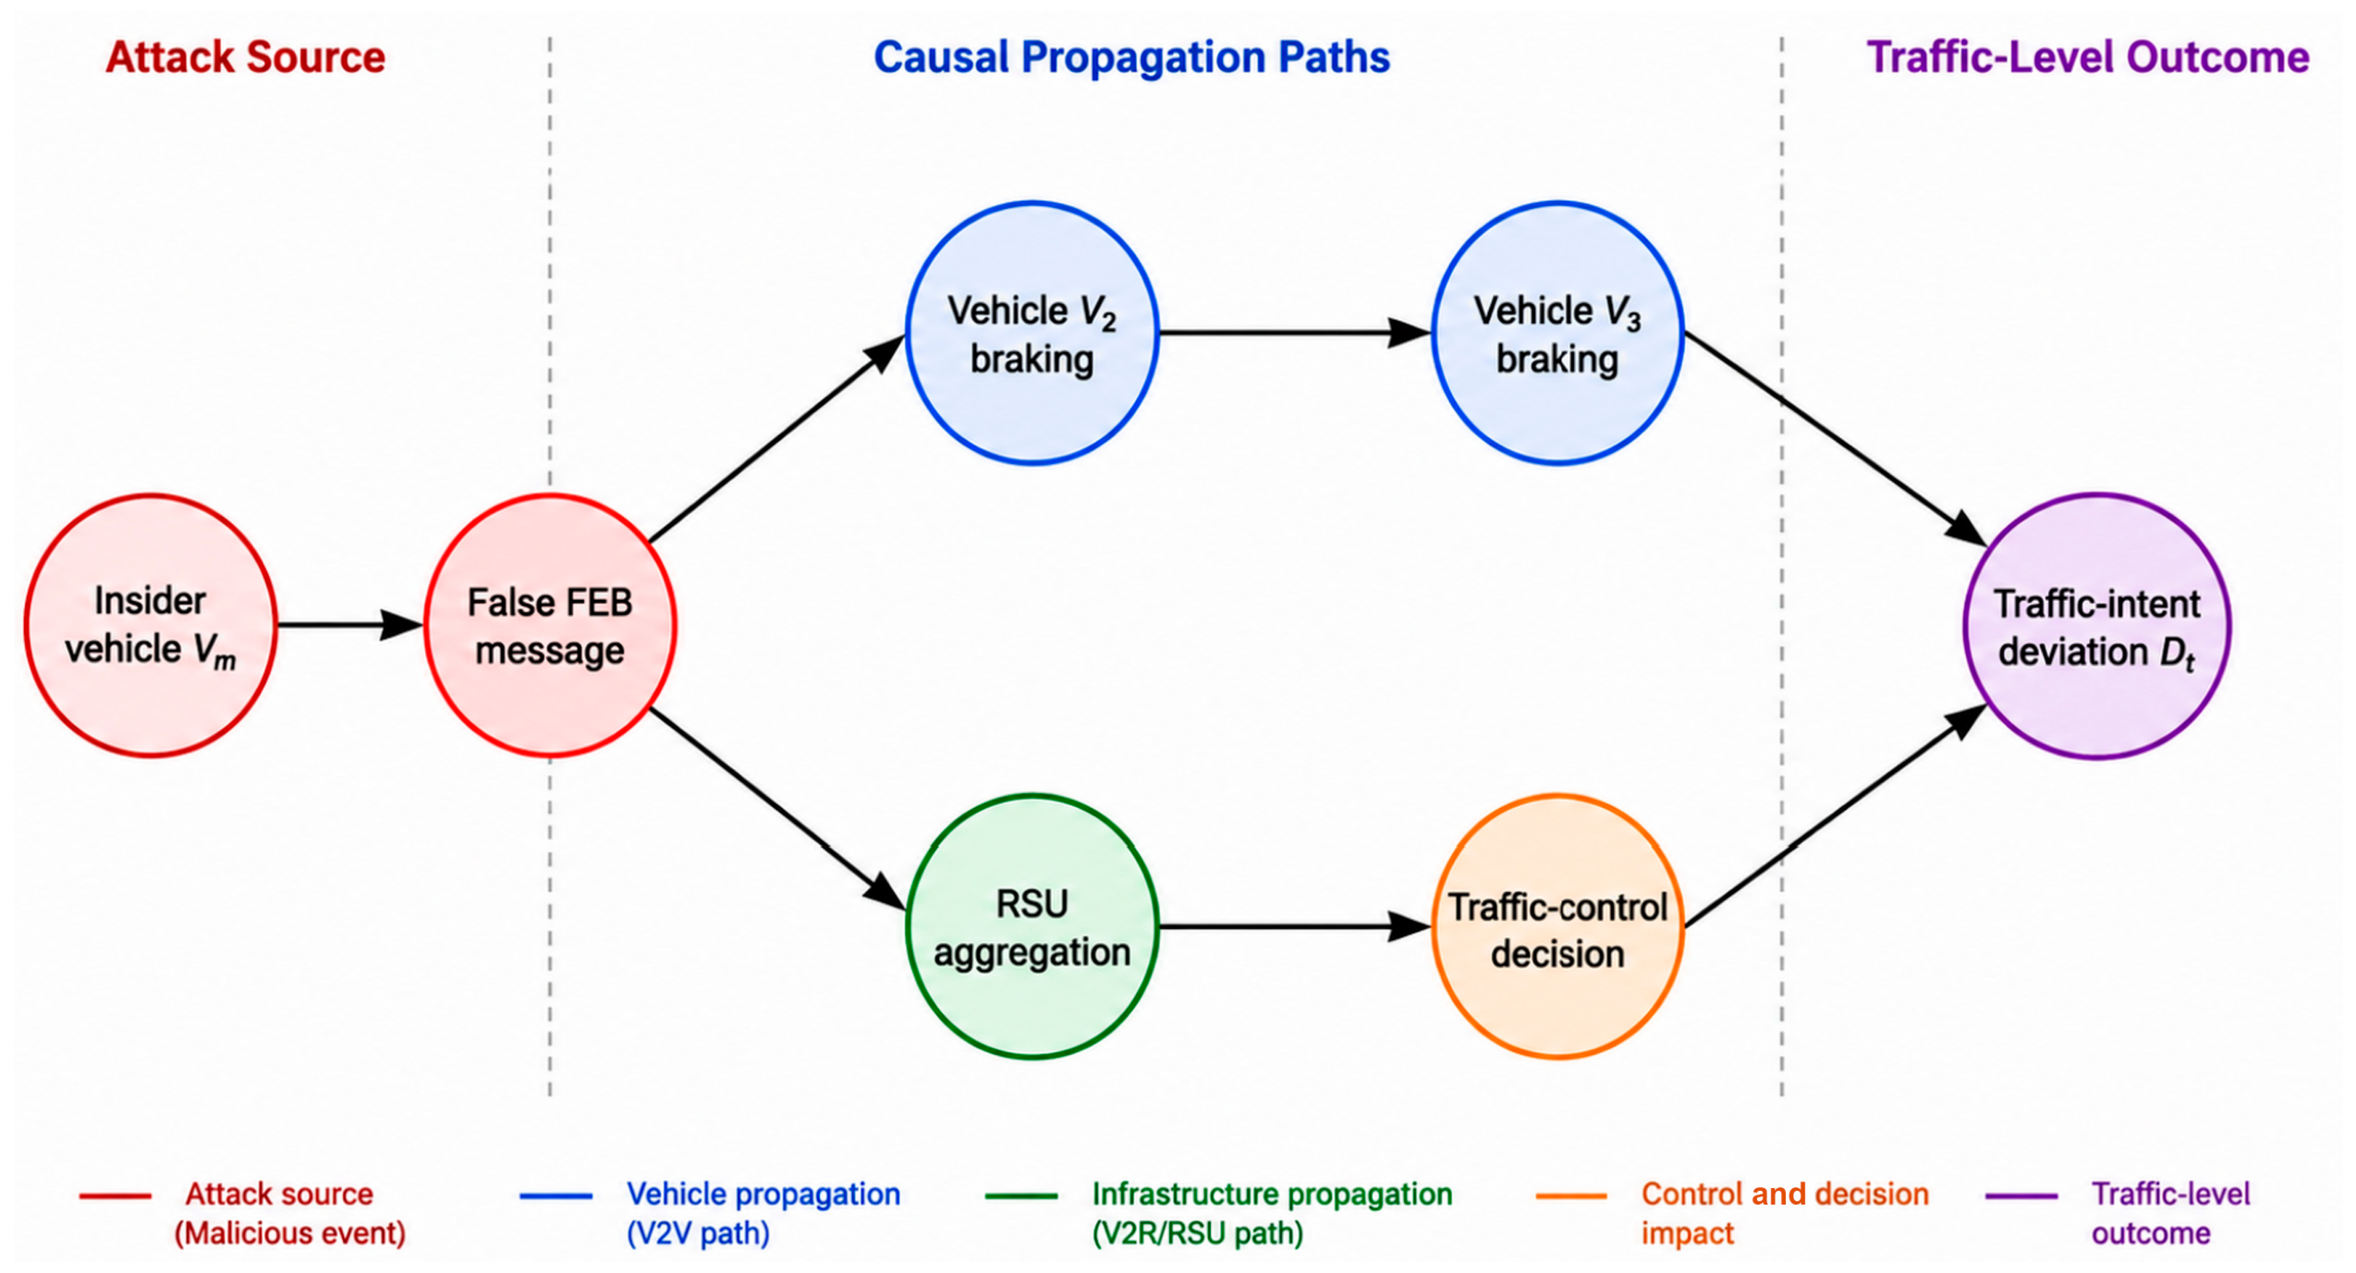
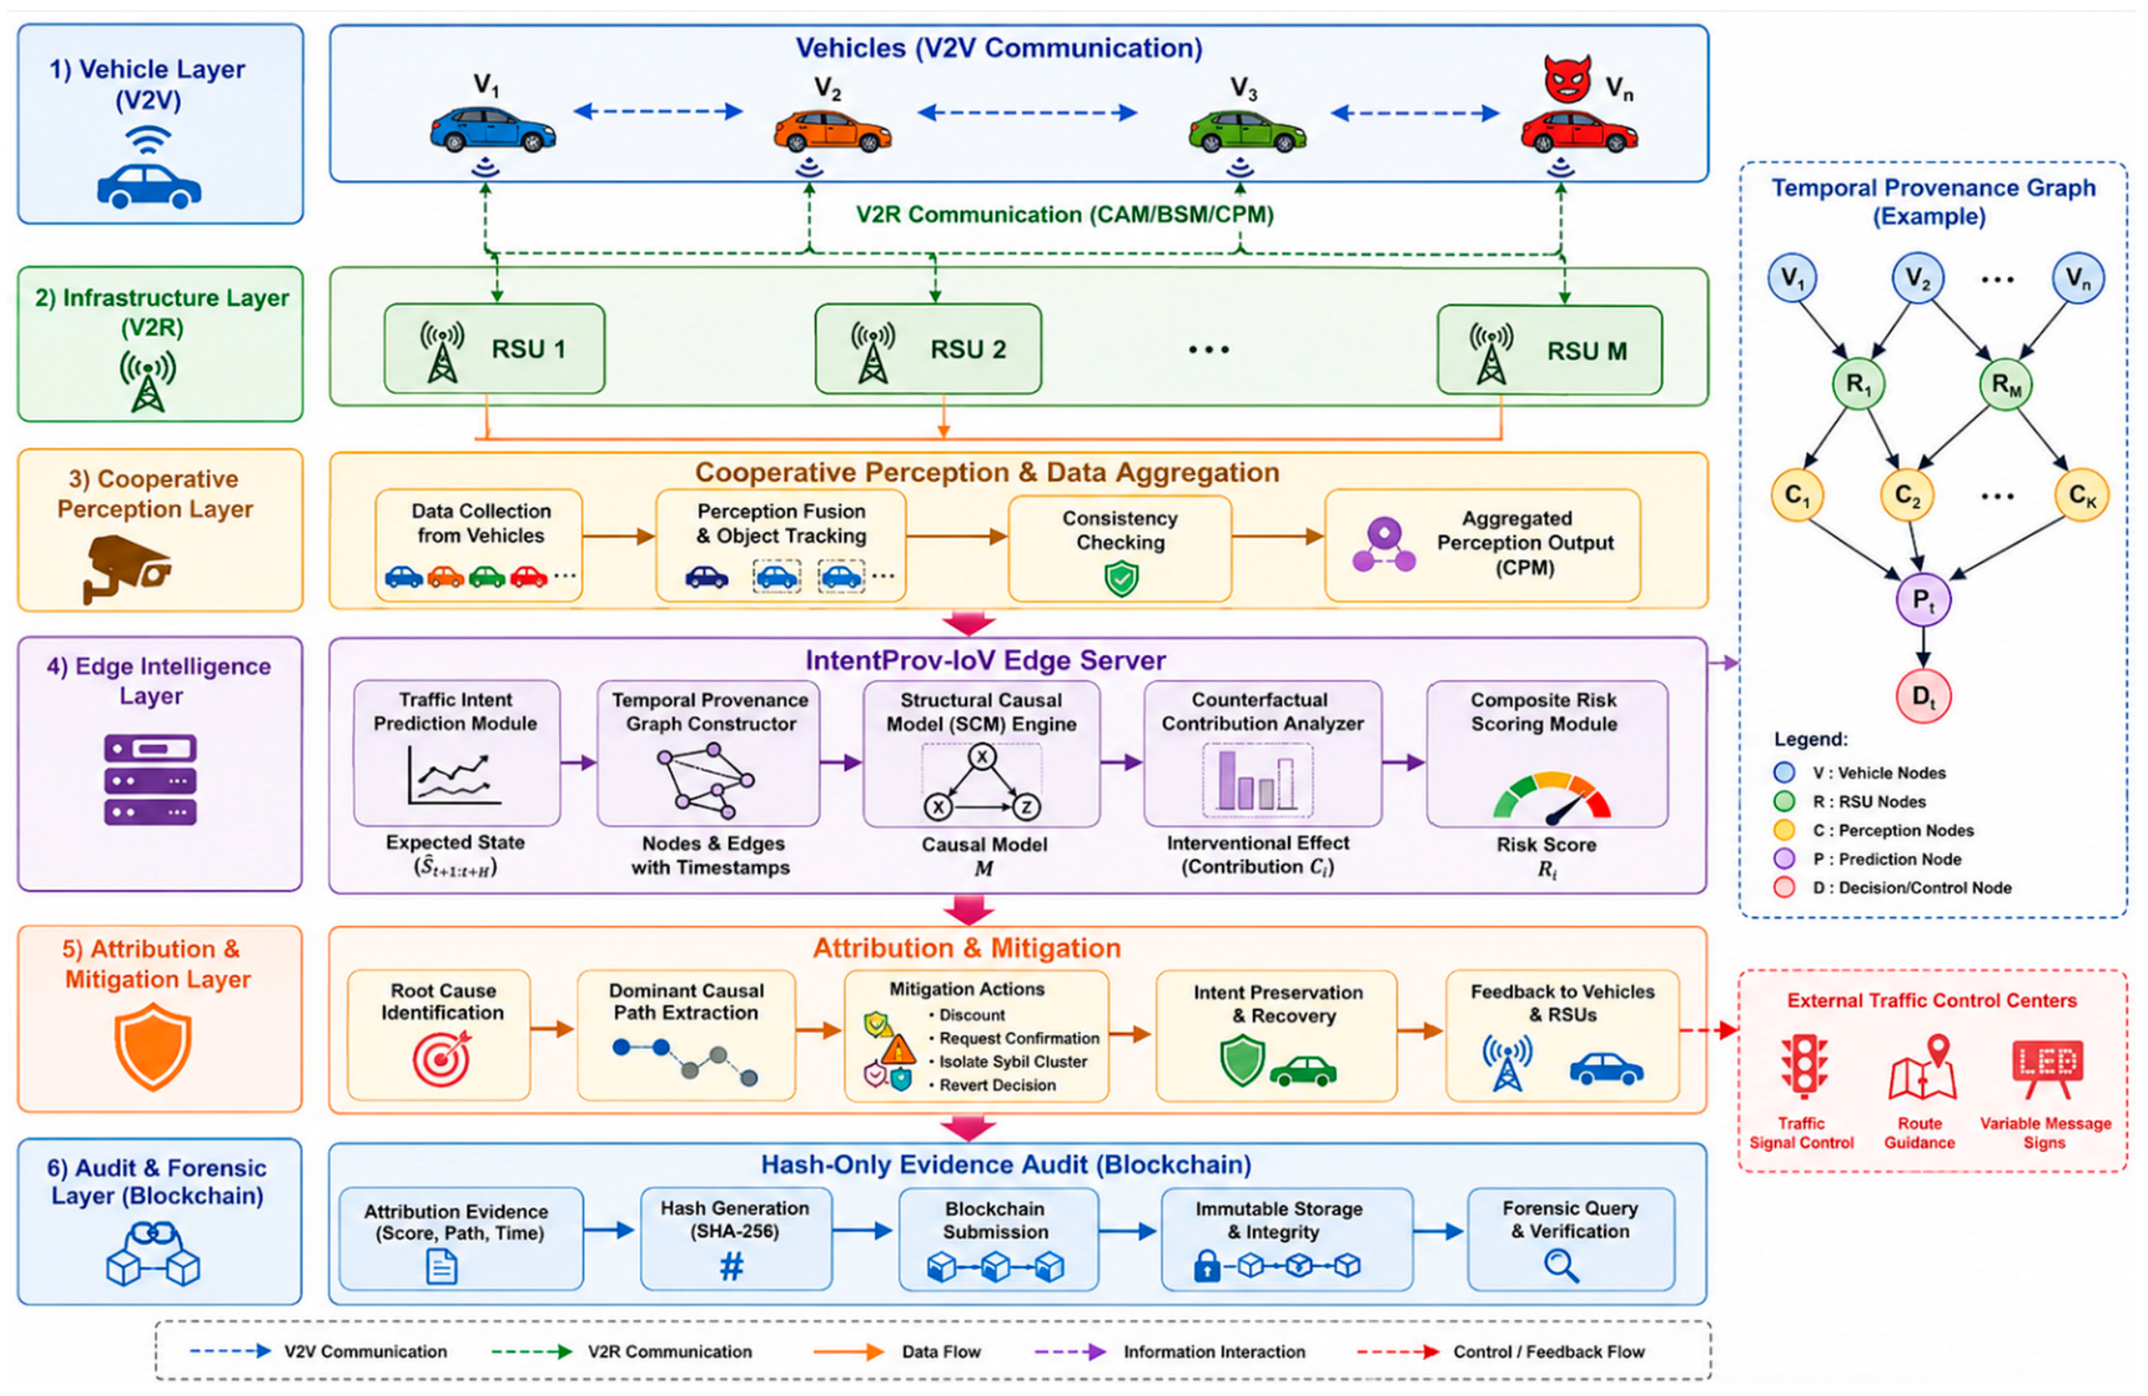
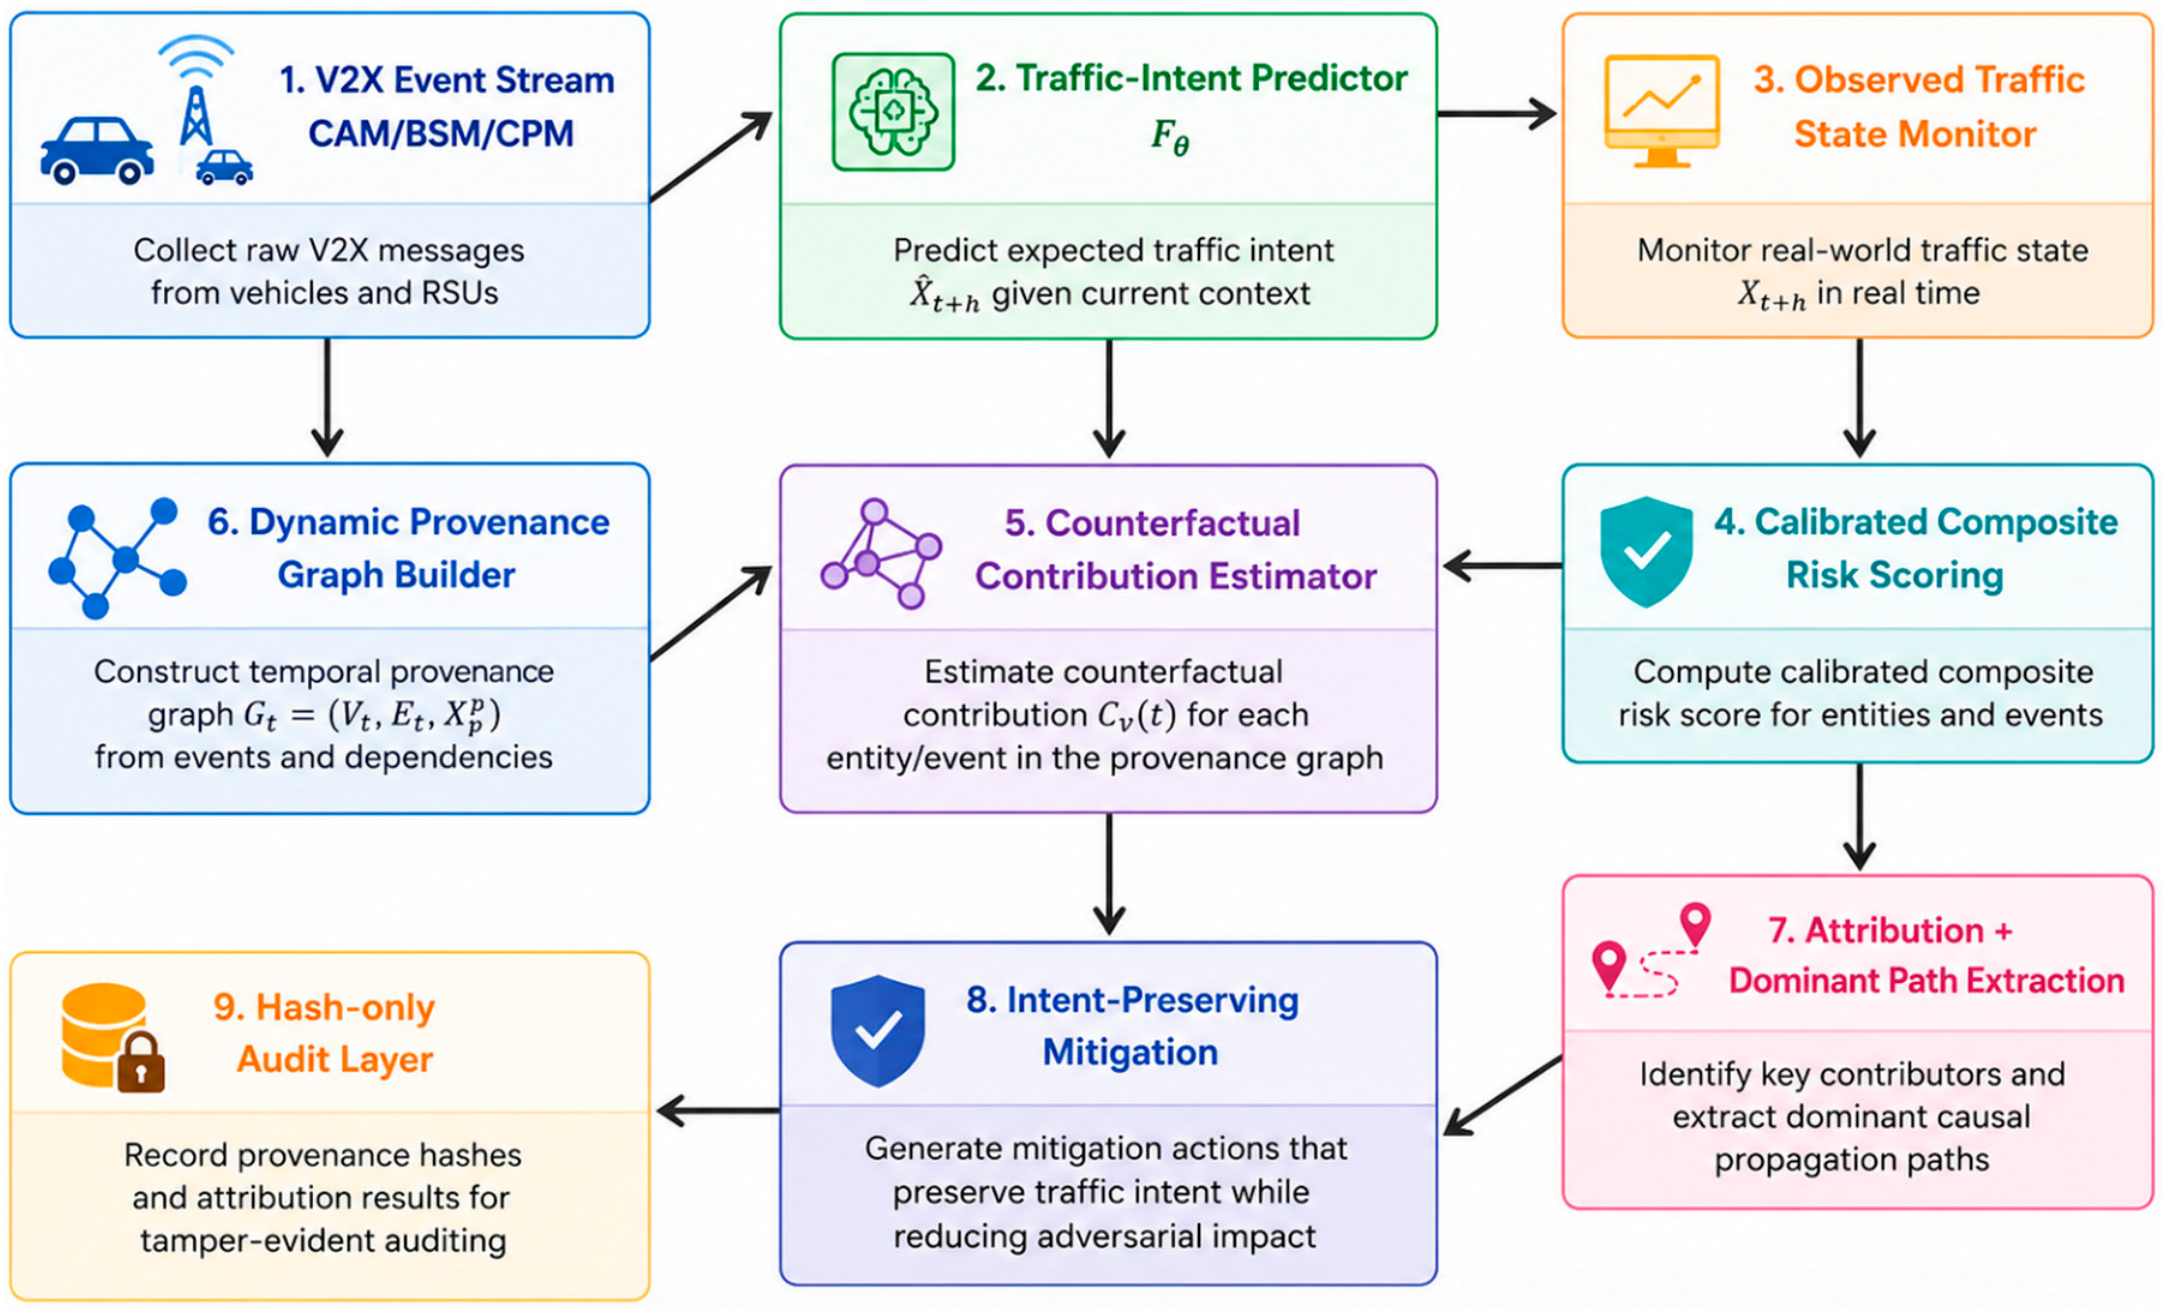
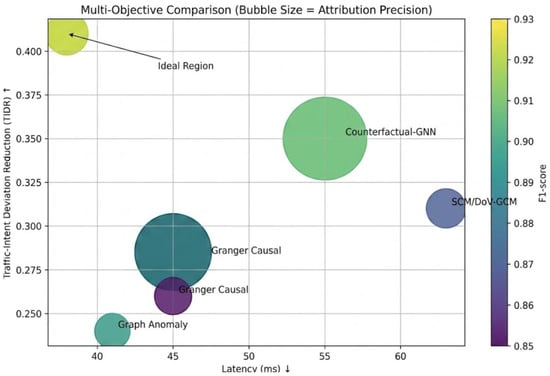
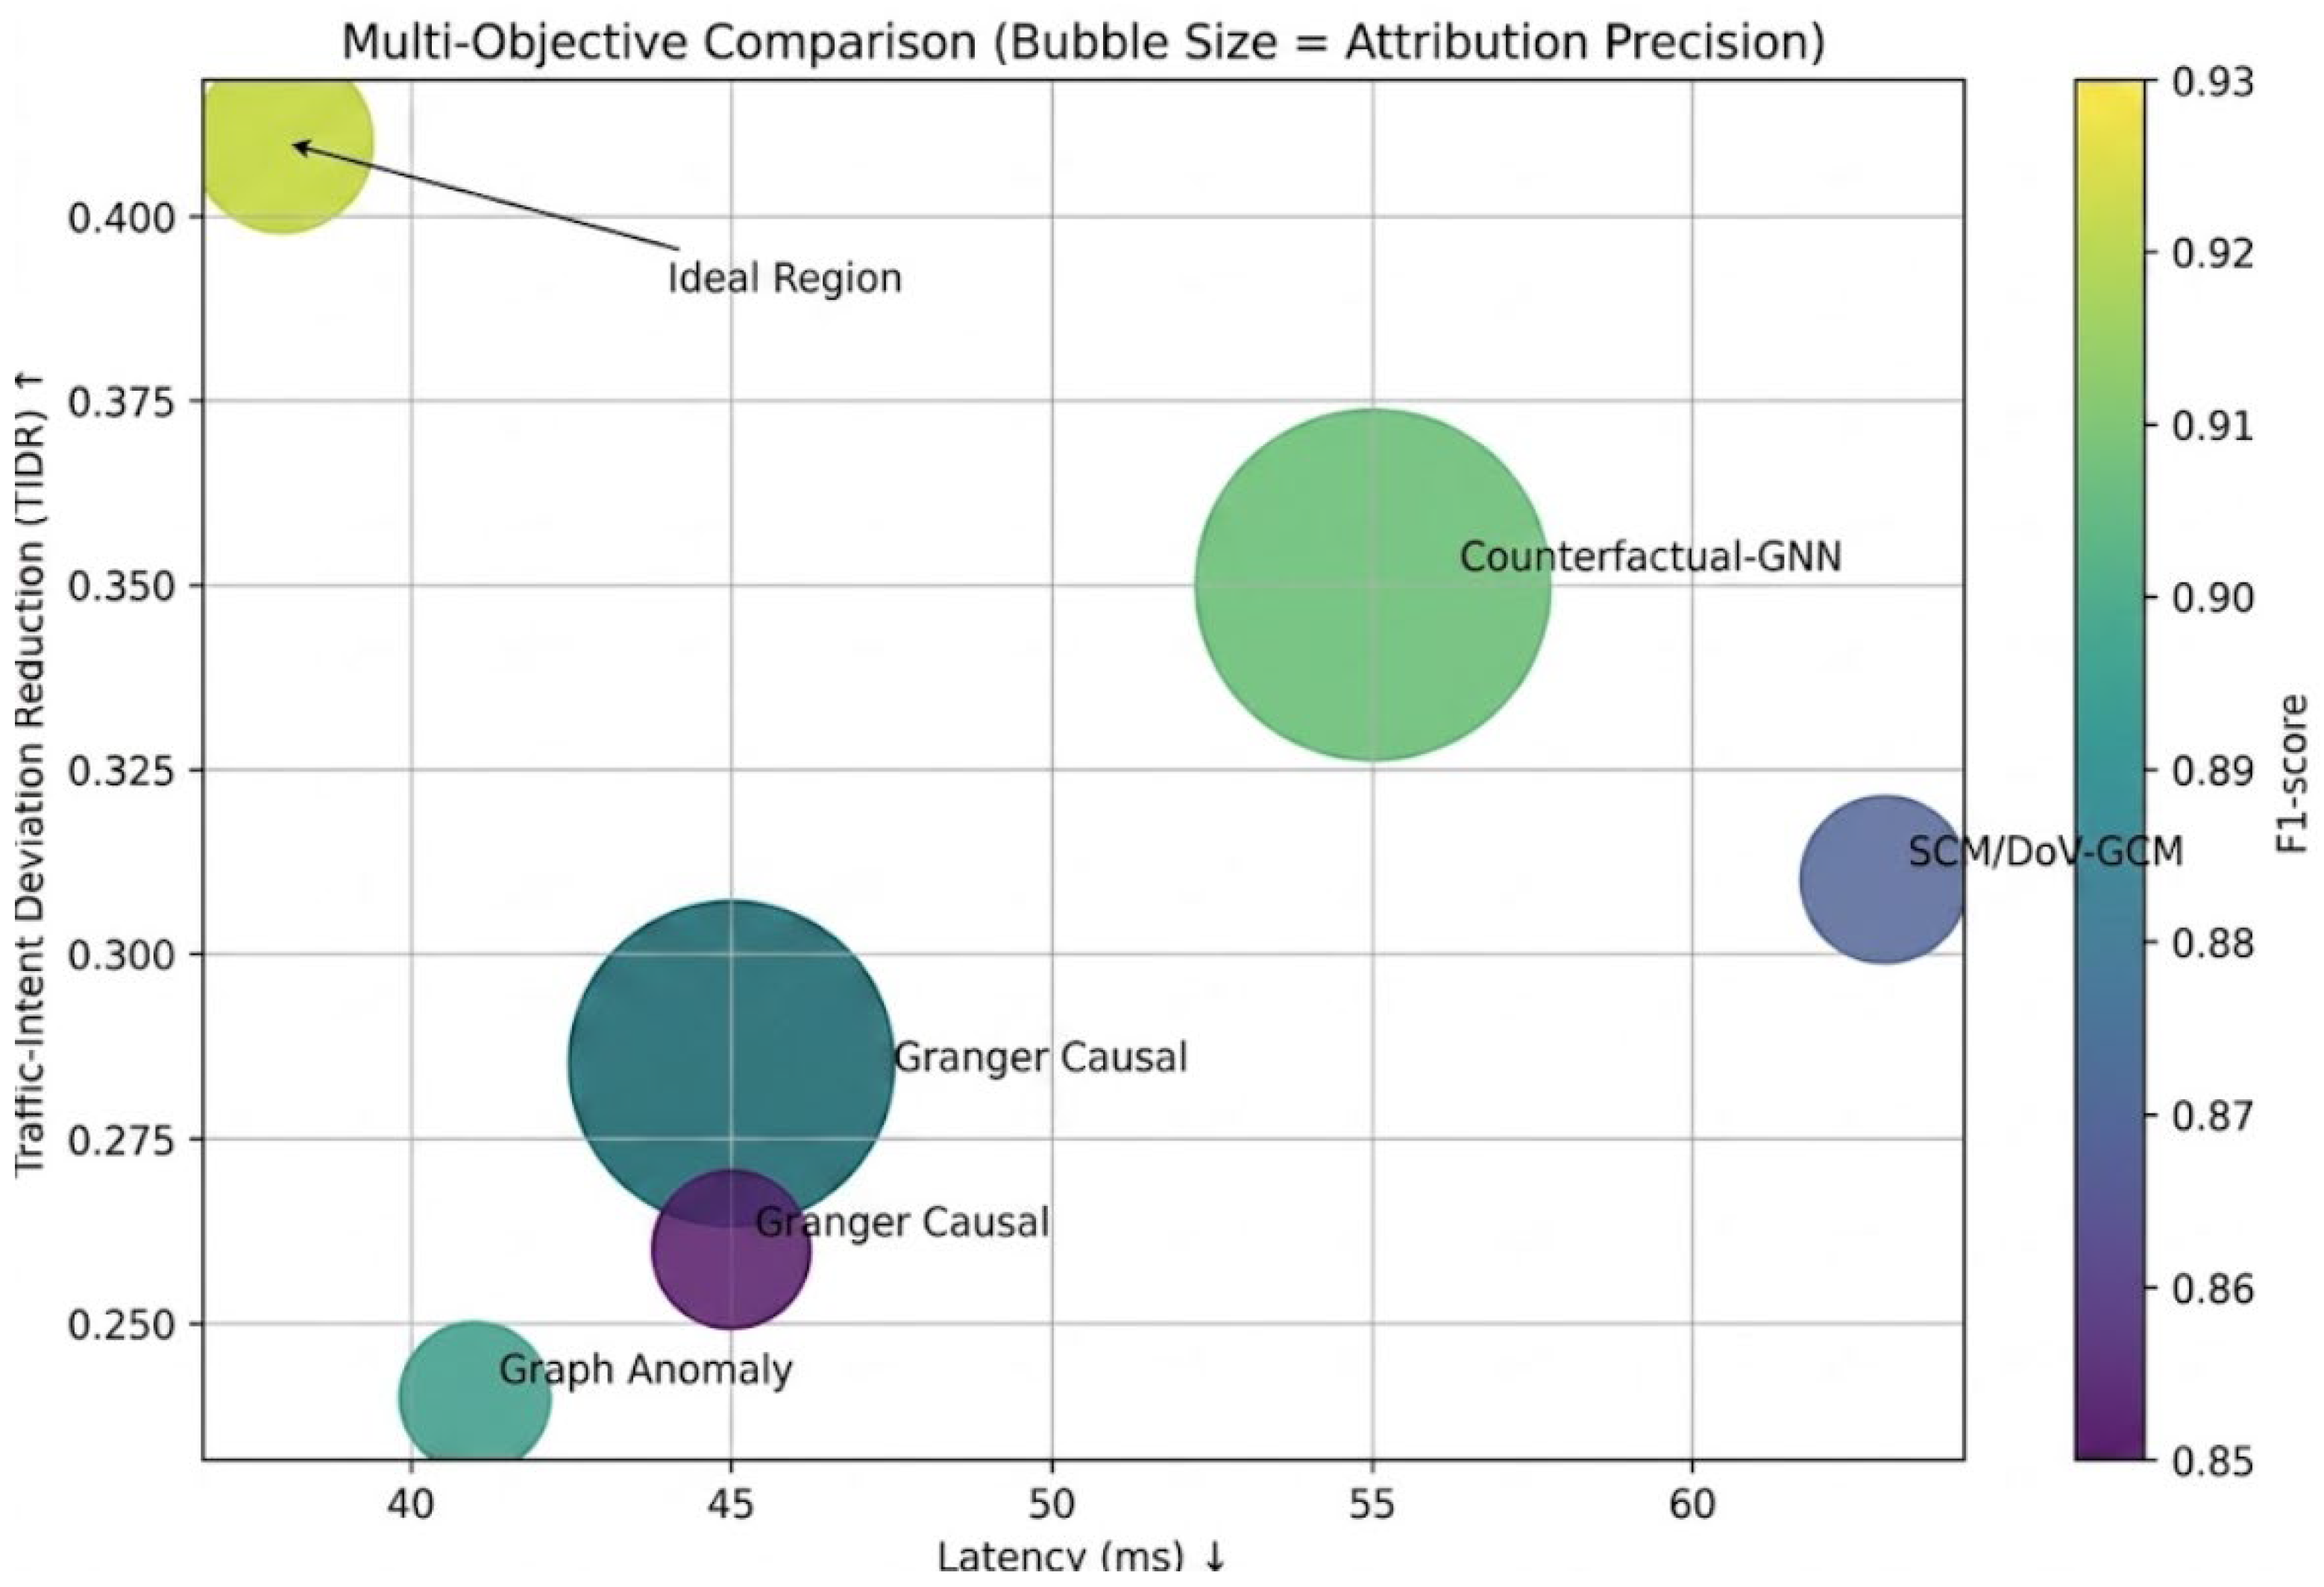
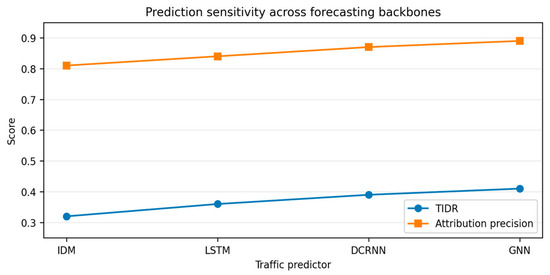
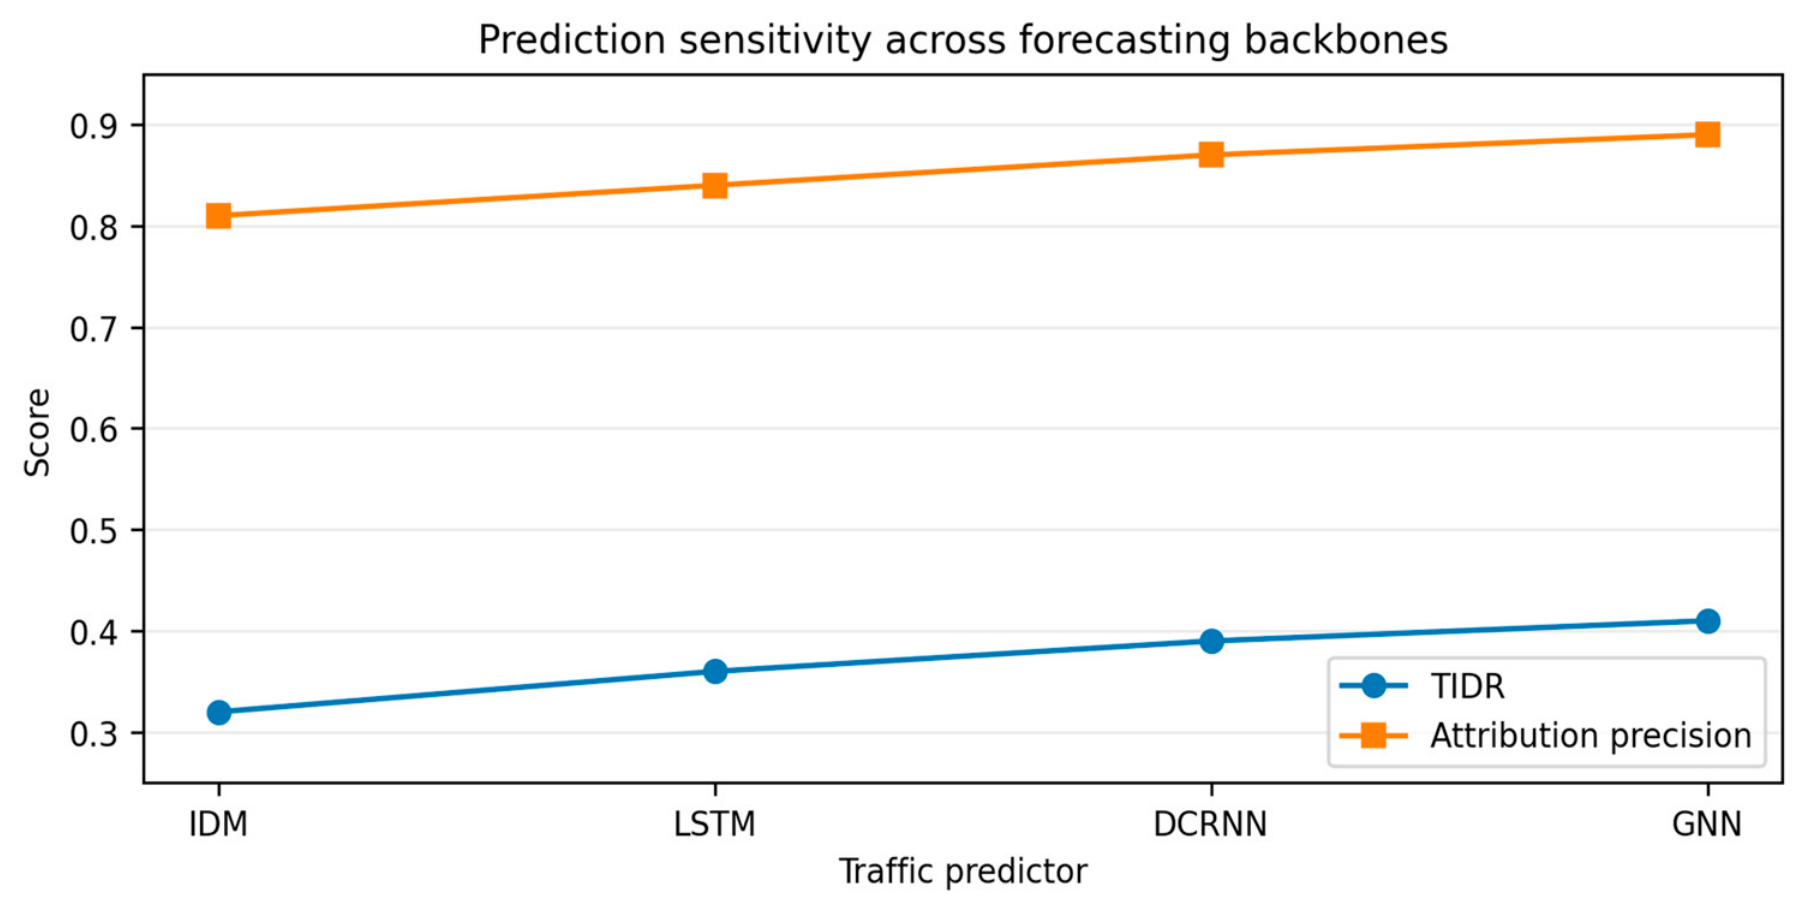
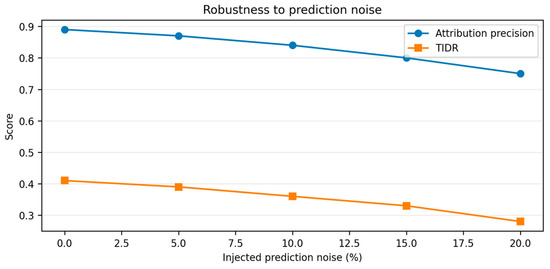
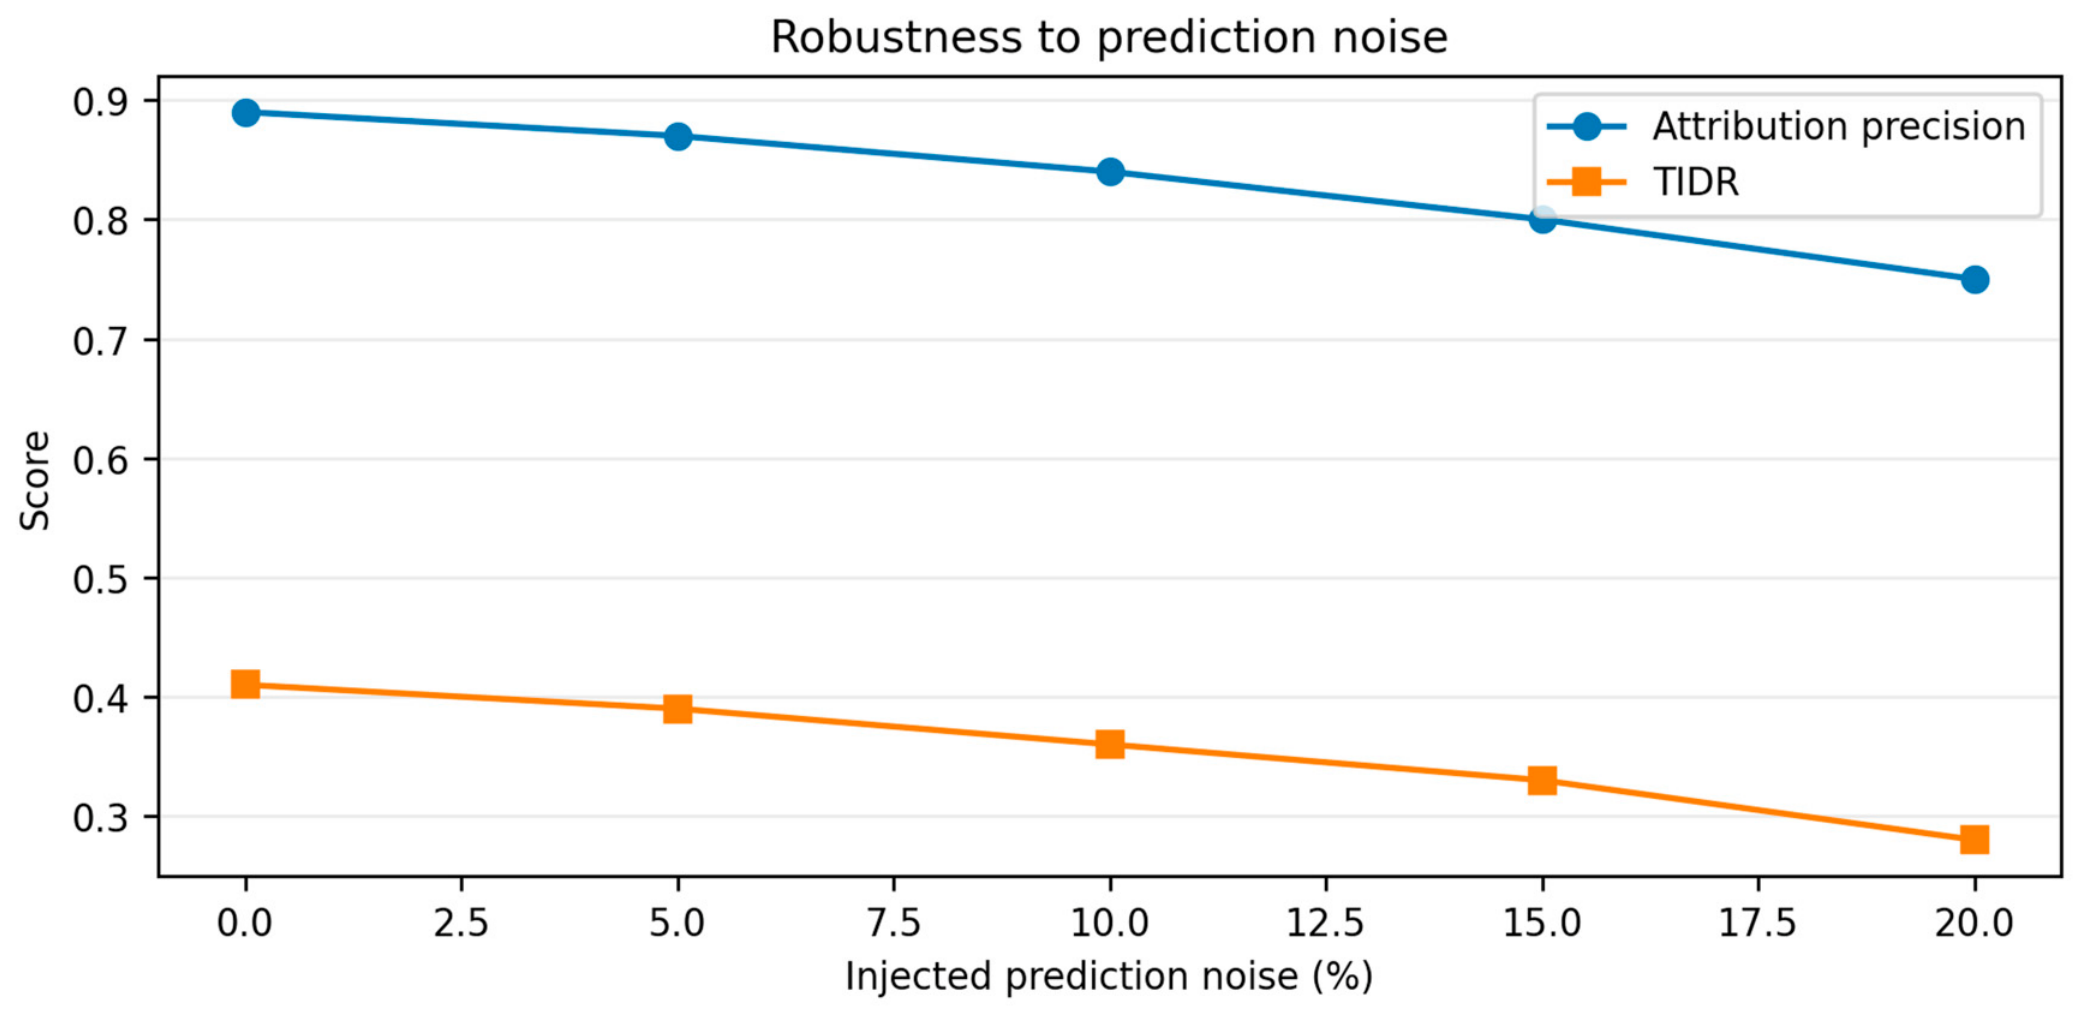
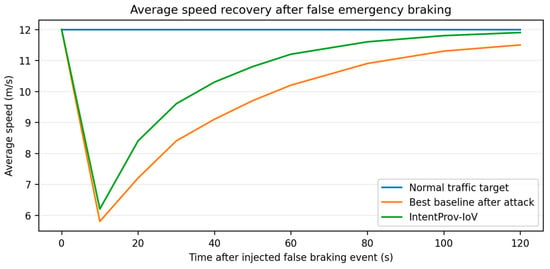
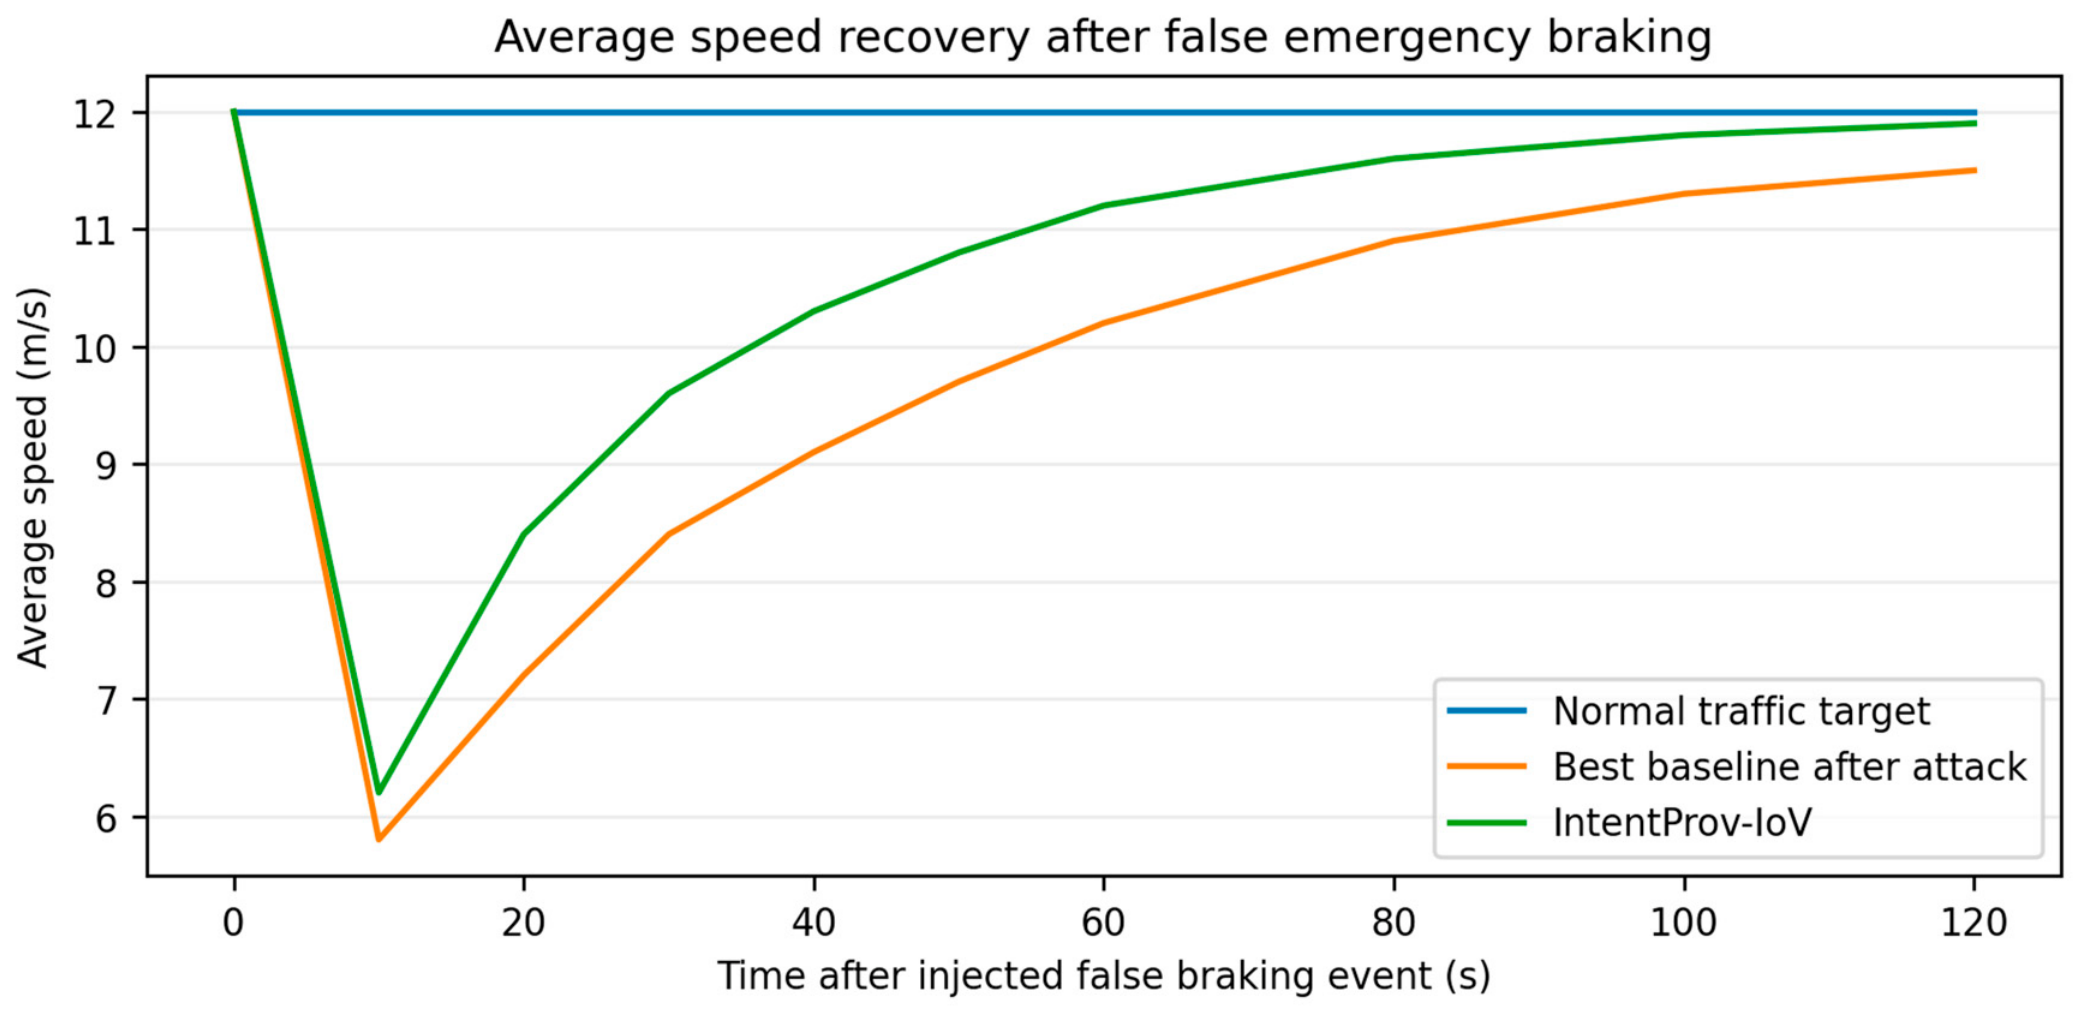
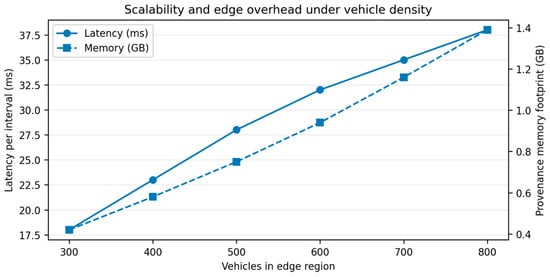
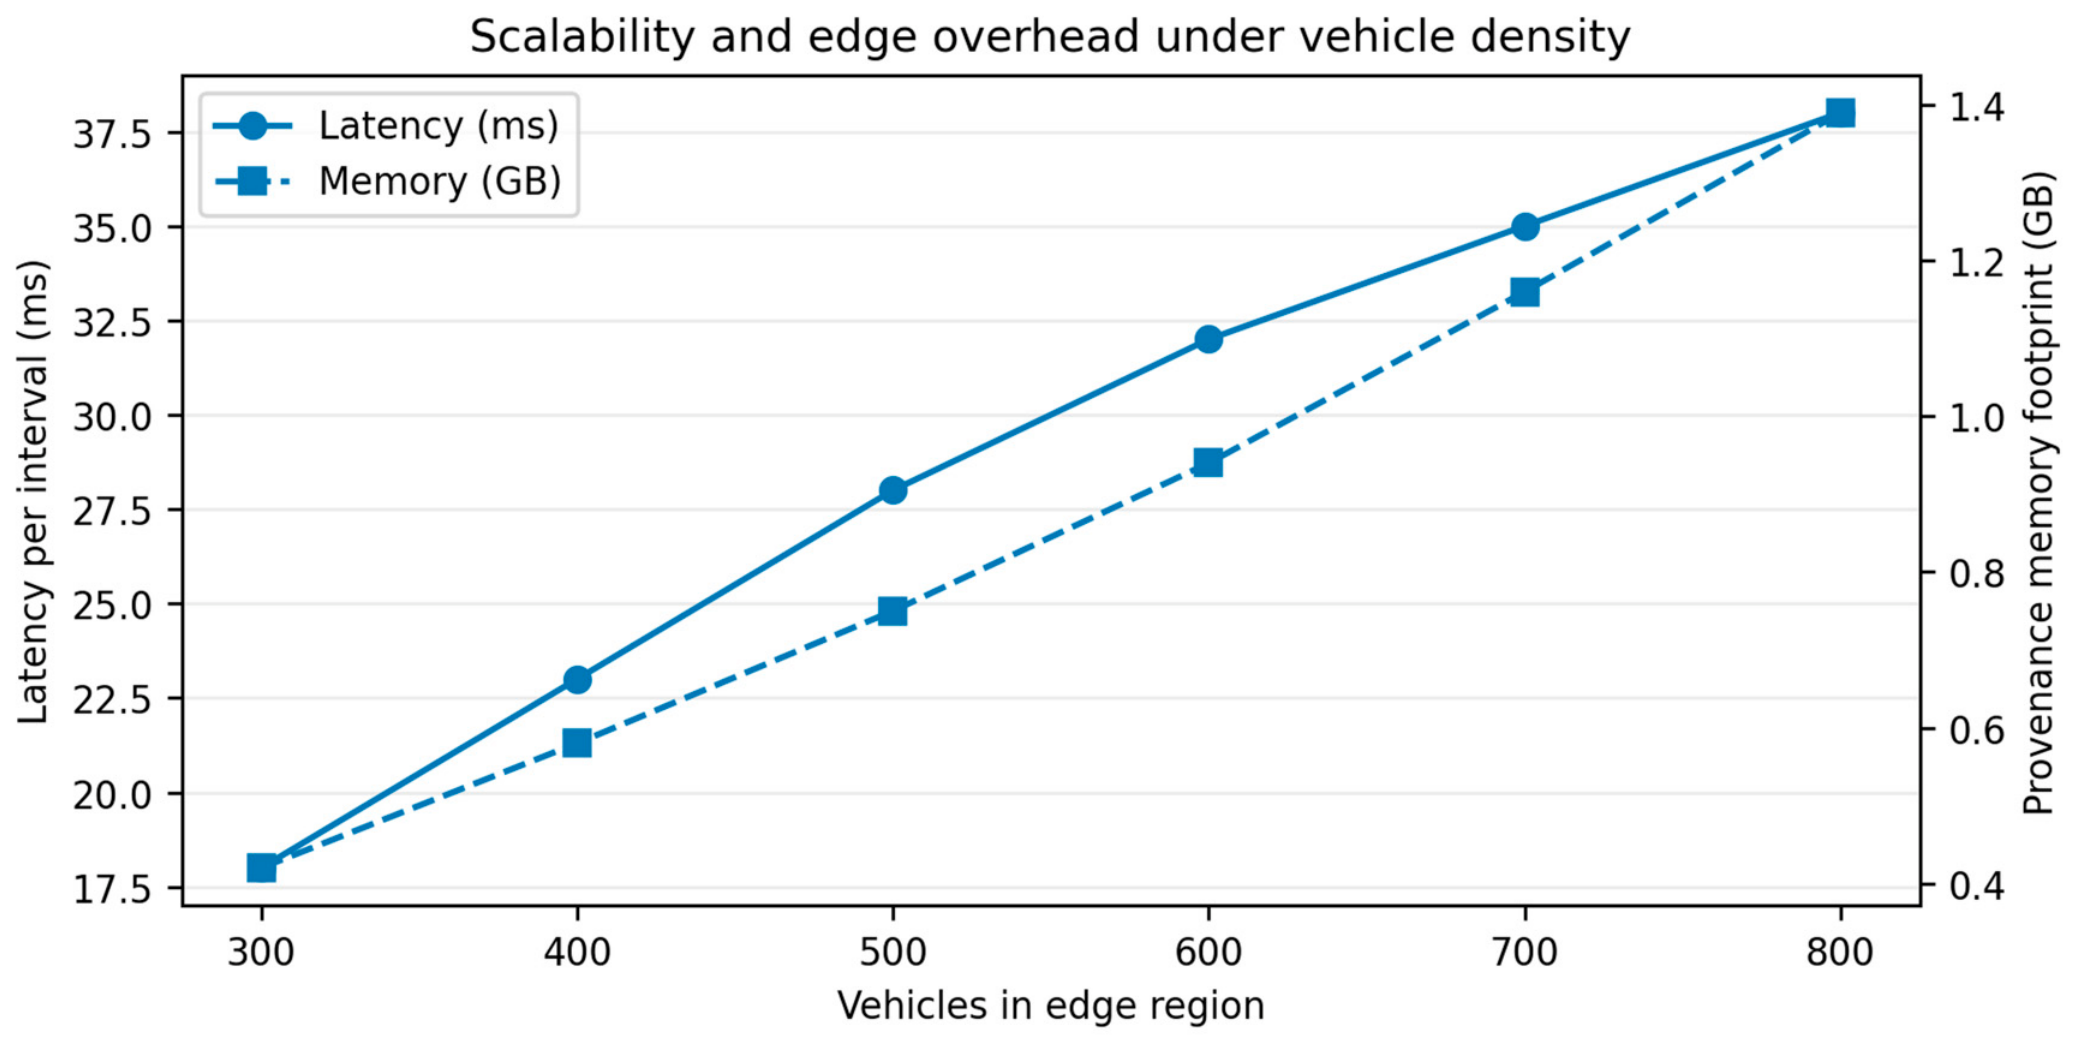
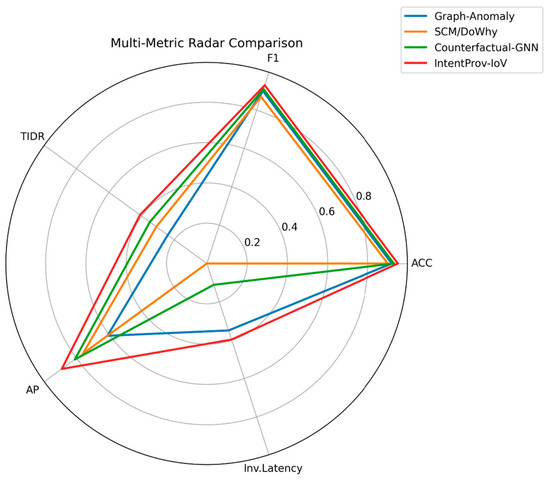
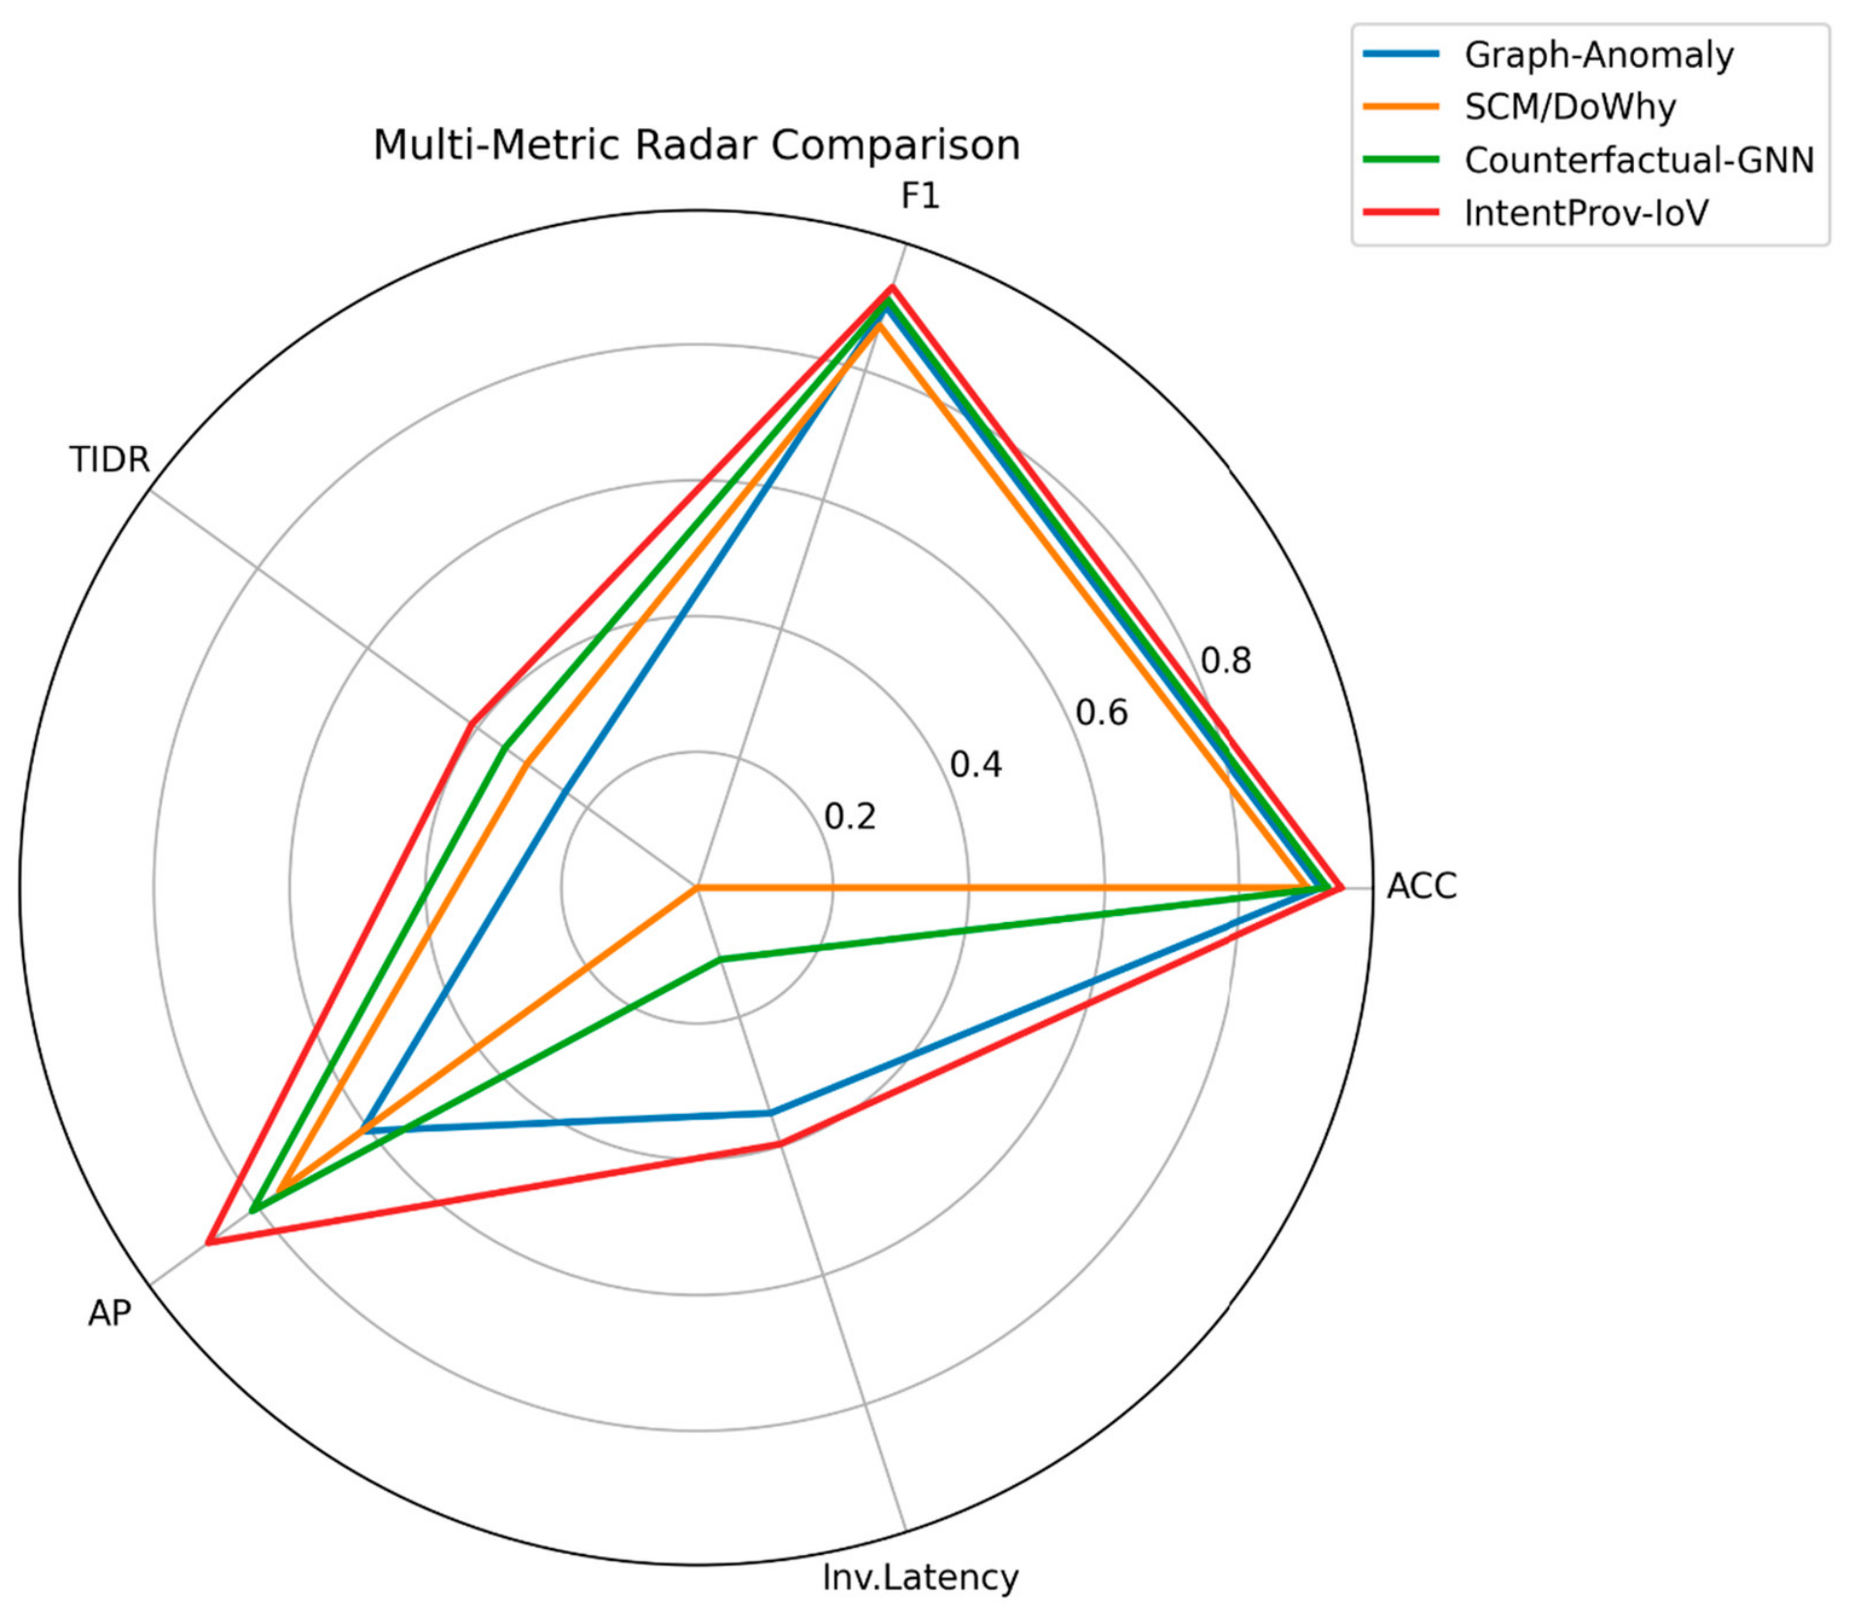

Disclaimer/Publisher’s Note: The statements, opinions and data contained in all publications are solely those of the individual author(s) and contributor(s) and not of MDPI and/or the editor(s). MDPI and/or the editor(s) disclaim responsibility for any injury to people or property resulting from any ideas, methods, instructions or products referred to in the content. |
© 2026 by the author. Licensee MDPI, Basel, Switzerland. This article is an open access article distributed under the terms and conditions of the Creative Commons Attribution (CC BY) license.