


Abstract
Driven by low-carbon mandates, hybrid power vessels integrating diesel, battery, shore-power, and photovoltaic vessel (PV) systems are emerging as a key green shipping pathway. However, operation scheduling is essentially complex due to the integration between supply-side routing and load-side energy dispatch, which is compounded by multi-dimensional uncertainties in PV generation, port-grid loads, and feeder delays. To address this, we formulate a unified two-stage robust optimization model. The objective is to simultaneously minimize operating costs and enhance port-grid friendliness by coordinating on-board energy management and shore-power interactions. In detail, the first stage determines routing and sailing speeds, while the second stage allocates multi-source power under a worst-case budgeted polyhedral uncertainty set. A piecewise-linearization scheme handles the cubic speed–power relation, rendering a tractable mixed-integer linear programming problem. The problem is efficiently solved via a tailored Benders decomposition algorithm, utilizing a genetic-algorithm warm-start to substantially accelerate convergence. Validated on three real-world networks via 1000 Monte Carlo scenarios, the proposed model reduces mean operating costs by 20.2–23.5% and suppresses cost variance by over 60% compared to deterministic approaches.
1. Introduction
Container liner shipping is the backbone of international trade and a core artery of modern global supply chains [1]. It provides the most cost-effective long-haul service mode for large-volume manufactured goods, moving more than 80% of world merchandise by volume through a tightly integrated network of fixed routes and schedules operated by liner companies [2]. The standardized container has dramatically reduced cargo damage during multimodal transfers between rail, road and maritime legs, and the periodic hub-and-spoke services connecting major trading centers form the principal logistical fabric of global commerce [3]. Within this fabric, an emerging structural shift is underway: as fuel costs, regulatory pressure on greenhouse-gas (GHG) emissions, and the social cost of port-area air pollution rise simultaneously, the propulsion architecture of container vessels is rapidly transitioning from single-fuel diesel–electric configurations to multi-source hybrid systems that combine marine diesel generators with lithium-ion battery storage, deck-mounted photovoltaic arrays and onshore power supplies (cold ironing) at berth [4].
The transition toward hybrid propulsion has been catalyzed by an unprecedented tightening of the international regulatory regime. Maritime transport currently accounts for approximately 3% of global carbon dioxide (CO2) emissions, and under a business-as-usual trajectory this share could rise to between 90% and 130% of the 2008 levels by 2050 [5]. In response, the International Maritime Organization (IMO) adopted its Revised GHG Strategy in 2023, committing the industry to net-zero emissions “by or around 2050”, with indicative reduction checkpoints of 20–30% by 2030 and 70–80% by 2040 relative to the 2008 baseline [6]. The IMO Net-Zero Framework approved at the 83rd session of the Marine Environment Protection Committee in April 2025 operationalizes these targets through a mandatory marine fuel intensity standard and a global emissions pricing mechanism that levies an initial USD 100 per ton of CO2 from 2028 [7]. Hybrid-powered liner shipping is no longer a speculative future scenario but an emerging operational reality [8].
Operating a hybrid-powered liner in a multi-port service, however, is operationally more complex than the sum of its parts. The first source of complexity arises from the well-known cubic relationship between sailing speed and propulsion power: a 10% reduction in cruising speed cuts fuel consumption and the associated emissions by roughly 20–27% [9,10]. Speed optimization is therefore the dominant short-run abatement lever and has been the subject of extensive operations research literature [11]. Sailing speed and on-board energy dispatch are thus inseparable in a hybrid setting, yet the existing literature almost universally treats them as independent decisions [12,13].
The second source of complexity arises from the multi-tier topology of modern container shipping. The dominant network architecture combines deep-sea mainline services between continental hubs with dense regional feeder services that consolidate cargo from smaller source ports onto the mainline calls. Hubs such as Shanghai, Singapore and Busan typically handle dozens of feeder rendezvous per week, and the synchronization of feeder arrivals with mainline departures is the single most important determinant of transshipment dwell time [14]. In this study, we explicitly model the hub–feeder–source network with three tiers of ports and embed feeder-arrival delays of up to four hours as one source of exogenous uncertainty.
The third source of complexity is the integration of cold ironing with port-side electrical infrastructure. When a large container vessel connects to shore power, its instantaneous demand can reach several megawatts, and the rate at which this load is brought on- or offline directly stresses the port distribution network. Modern port microgrids increasingly integrate rooftop photovoltaic generation, electric automated guided vehicles, electric quay cranes and refrigerated container loads [15,16]; in this environment, an uncoordinated shore-power demand from a single vessel can produce ramp rates that exceed the safe operating limits of the distribution network, triggering voltage flicker, frequency excursions and potential interruptions of other sensitive loads. Our model incorporates it through a quadratic penalty on the rate of change of shore-power draw, with the penalty coefficient set per terminal according to the local distribution-network limit.
Superimposed on these three couplings is a pervasive layer of uncertainty. PV output on the vessel’s deck can deviate by ±20% or more from forecast values within minutes due to passing cloud cover, vessel motion altering the panel inclination angle and ambient temperature affecting cell conversion efficiency [17]. Container handling demand at feeder and source ports fluctuates with seasonal, market and weather factors, and the demand-forecast error of even the best machine-learning models routinely exceeds 5% in absolute terms [18].
To address these challenges in a unified and computationally tractable manner, this paper develops a two-stage adaptive robust optimization model for the joint routing, speed and multi-source energy dispatch of hybrid-powered liner vessels. The first-stage decisions define routing, sailing speed, and planned port arrival times. The second-stage decisions allocate power among the diesel generator, lithium-ion battery, PV array, and shore power, responding to worst-case realizations of six uncertainties to ensure robust vessel operation under uncertainty. [19,20]. Uncertainty is characterized by a polyhedral set with an adjustable budget parameter Γ in the spirit of Bertsimas and Sim [21], which preserves the linearity of the robust counterpart and allows the level of conservativeness to be tuned by a single statistically interpretable parameter. Crucially, the budget boundaries are not chosen arbitrarily but are calibrated from the empirical error distribution of a long short-term memory (LSTM) forecasting model trained on monthly throughput data of the Shanghai, Yokohama and Busan ports [22], with Γ set to the 95th percentile of the empirical forecast-error distribution.
In this paper, based on the natural decomposability of the formulation, we design a tailored Benders decomposition algorithm in which a master problem handles the first-stage routing and speed decisions and a subproblem identifies the worst-case scenario and the associated energy-dispatch cost through duality [23,24]. To assess the practical value of the proposed framework, the model and the algorithm are validated on three real-world prototype networks of increasing scale: the Qingdao Port–Shandong Peninsula feeder network (one hub, 8 feeder ports, 10 source points), the East Asia–Southeast Asia regional network based on Sea Lead’s Intra Asia Service (two hubs, 10 feeder ports, 15 source points), and the Asia–East Coast South America deep-sea network based on the HMM FL2 service (two hubs, 15 feeder ports, 20 source points). A 1000-run Monte Carlo simulation is then conducted under three disturbance intensities to benchmark the robust model against a deterministic counterpart in terms of average cost, cost variability, schedule feasibility rate and shore-power ramp-rate violation probability.
Distinct from prior work, we herein introduce the main contributions of this work.
- (1)
- A two-stage robust co-optimization model was formulated for hybrid-powered container liners operating under multi-source uncertainties. The first stage determines routes, sailing speeds, and port arrival times. The second stage optimizes power allocation among diesel generators, batteries, and shore power under the worst-case disturbance scenario. The model integrates comprehensive physical and operational constraints such as power balance, equipment limits, battery state of charge, and grid safety constraints including a shore-power ramp-rate limit.
- (2)
- A polyhedral uncertainty set is constructed to explicitly model multi-source uncertainties originating from both external environments and internal equipment. This explicitly covers cargo handling variation, a photovoltaic output fluctuation of plus or minus 20%, feeder delays of up to 4 h, and port grid load fluctuations. This enables the model to withstand complex external environmental and logistic synchronization disruptions, ensuring system safety and stability in the worst-case scenarios.
- (3)
- The benders decomposition algorithm is devised. We decompose the original problem into a master problem for vessel scheduling and a subproblem for energy dispatch. By iteratively generating optimality and feasibility cuts, the algorithm achieves a hierarchical linkage between the first-stage integer decisions and the second-stage continuous adjustments. The real case results demonstrate that the robust model reduces the average total cost by 22.0% and decreases cost variability by 68.0% compared to the deterministic model.
The remainder of this paper is organized as follows. Section 2 reviews the relevant literature. Section 3 formalizes the problem and presents the two-stage robust optimization model, including the construction of the polyhedral uncertainty set. Section 4 introduces the Benders decomposition algorithm and discusses its convergence behavior. Section 5 describes the three real-world prototype networks and reports the computational results, the Monte Carlo robustness validation and sensitivity analyses with respect to the uncertainty budget. Section 6 concludes the paper and suggests directions for future research.
2. Literature Review
The literature review features three directions: liner shipping routing, scheduling and speed optimization; hybrid-power ship energy management together with the shoreside complement of cold ironing in port microgrids; and robust and stochastic optimization for maritime systems under multi-source uncertainty. Finally, Table 1 presents the features through the comparison at the end of Section 2.
2.1. Liner Shipping Routing, Scheduling and Speed Optimization
Liner shipping optimization has a long and distinguished tradition in operations research. The canonical liner shipping network design problem, first systematically articulated by Brouer et al. [2] and surveyed by Christiansen et al. [3], jointly determines the set of services, port-call sequences, vessel deployments and cargo flows so as to maximize profit subject to time-window, capacity and transshipment constraints. Because the underlying mixed-integer programming is NP-hard, exact and heuristic decomposition methods have proliferated. Column generation and branch-and-price approaches have proven particularly effective when the master problem coordinates routes and the subproblem generates negative-reduced-cost paths [25,26]. Plum et al. [11] proposed a service-flow model that admits efficient column generation, while Karsten et al. [26] developed a time-constrained multi-commodity network flow formulation specifically tailored to liner-shipping transshipment dynamics. Guericke and Tierney [25] integrated continuous speed and cargo allocation with service levels, demonstrating that the joint formulation yields a substantially lower total cost than sequential approaches.
Speed optimization, originally treated as a downstream operational decision, has progressively been integrated into network design since Fagerholt et al. [9] showed that exploiting the cubic speed–power relationship can yield double-digit fuel savings. Wang and Meng [13] embedded continuous speed within a liner network setting and proved the existence of polynomial-time algorithms for important special cases. Psaraftis and Kontovas [10] developed a comprehensive taxonomy of speed models that distinguishes single-leg, multi-leg and round-trip formulations and quantifies the trade-off between fuel cost, charter cost and inventory cost. Subsequent extensions have enriched the deterministic baseline with regulatory and behavioral realism: Du et al. [27] incorporated shipper-selection behavior into liner schedule design, Tamburini et al. [28] applied column generation to a rich tramp variant, and Chen et al. [29] developed a robust optimization of liner alliance fleet scheduling under sulphury emission control area restrictions with slot exchange, demonstrating that explicit cooperation can substantially reduce both fuel and compliance costs. Recovery-oriented works includes those of Elmi et al. [30], who developed an exact ε-constraint method for ship schedule recovery in liner shipping, and Liu et al. [31], who formulated an integer-programming approach to port vessel scheduling that mitigates extreme-weather impacts.
A small but growing subset of papers admits weather and ocean uncertainty in speed and routing decisions. Li et al. [32] formulated a robust liner routing and scheduling model under weather and ocean uncertainty using a polyhedral uncertainty set. Mahmoodi et al. [33] used an ensemble of meteorological forecasts to drive multi-objective speed-and-route optimization, and Golsefidi et al. [34] extended the idea to container ships by embedding weather-induced fuel-consumption uncertainty within a speed-optimization framework. He et al. [35] formulated a distributionally robust optimization of sailing speed, bunkering and fuel switching for dual-fuel liner services, demonstrating that even single-vessel dual-fuel decisions benefit substantially from explicit uncertainty modelling. These studies confirm that explicit uncertainty handling yields routes more robust to short-term forecast errors than nominal-weather optimization, but they continue to treat the on-board energy system either as a single-fuel black-box or as a binary dual-fuel choice, an assumption that breaks down once batteries, PV and shore power enter the picture. Despite the breadth of this stream, none of the surveyed study models address continuous speed jointly with multi-source on-board energy dispatch in a multi-tier network setting.
2.2. Hybrid-Power Ship Energy Management and Shoreside Cold Ironing
The second stream addresses the design and operation of hybrid-power ship systems. Geertsma et al. [12] provided the foundational review of hybrid power and propulsion architectures for smart ships, classifying configurations into mechanical-, electrical- and hybrid-propulsion types and identifying control-design challenges. Inal et al. [36] updated this picture with a comprehensive assessment of their current status and future challenges. Kasaeian et al. [37] reviewed solar PV applications in marine vessels and reported typical fuel savings of 5–15% depending on deck area, latitude and operating profile. The combination of diesel generators with energy storage, photovoltaic arrays and shore-power connectivity is widely recognized as a near-term pathway to compliance with the IMO CII and EEXI regulations [4,7], and the commissioning of the Blue Marlin in 2025 [8]—the world’s first inland cargo vessel capable of contributing solar power directly to high-voltage propulsion—marks a turning point in the technology’s commercial maturity.
On-board energy management has been the subject of extensive control and optimization literature. Model predictive control (MPC) variants are particularly prominent: Yang et al. [38] proposed a two-stage energy-management strategy combining mixed-integer nonlinear programming with MPC, demonstrating an offline–online optimization gap of less than 0.5% and explicitly modelling battery dynamic output characteristics. Wang et al. [39] cooperatively optimized course and speed for wing-diesel hybrid vessels with an improved A* algorithm; Lan et al. [40] proposed a fuel-consumption prediction method for wing-diesel hybrid ships using high-dimensional feature selection and blending ensemble learning.
Several recent papers begin to bridge on-board energy management and voyage planning. Luo et al. [13] proposed a two-stage optimization framework for hybrid-energy ships that jointly determines route, speed and energy management under sea-state constraints, and reported cost and GHG reductions of up to 15% against a route-only benchmark. Zhang et al. [41] developed an intelligent energy-management framework that predicts and optimizes solar, wind and diesel energy. Wang et al. [20] addressed multi-ship power sharing via two-stage robust optimization with a Shapley-value cost-allocation mechanism, exploiting nested column-and-constraint generation. Zhang et al. [42] proposed an improved NSGA-II for the optimal dispatch of hybrid-energy ship power systems with a two-stage robust optimization model considering PV uncertainty. These advances are important, but each one handles only one or two dimensions of the integrated problem: Luo et al. [13] integrate route, speed and energy management but omit shore-power ramp-rate and feeder-delay uncertainty.
2.3. Robust Optimization for Maritime Systems Under Uncertainty
Maritime operations are subject to multiple sources of uncertainty—demand fluctuation, weather and sea state, port congestion, fuel-price volatility and equipment failures—and the methodological response has produced a rich body of stochastic and robust optimization literature. Ksciuk et al. [43] catalogued the principal sources of uncertainty in maritime ship routing and scheduling and the methodological responses they have elicited. Three broad approaches dominate: stochastic programming, which requires explicit probability distributions; robust optimization (RO), which protects against the worst-case realization within a prescribed uncertainty set; and distributionally robust optimization (DRO), which interpolates between the two by hedging against the worst distribution within an ambiguity set [44].
Two-stage adaptive robust optimization has become particularly influential since the column-and-constraint generation method of Zeng and Zhao [19], which demonstrated order-of-magnitude speedups over Benders-style cutting-plane methods for two-stage robust problems with continuous recourse. Zhao and Zeng [45] subsequently extended the approach to mixed-integer recourse. The polyhedral or budgeted uncertainty set of Bertsimas and Sim [21], which controls conservativeness through a single parameter Γ representing the maximum number of parameters that can simultaneously take their worst-case values, has become the workhorse of practical applications because it preserves the linearity of the robust counterpart and admits efficient solution methods. Subsequent extensions include data-driven polyhedral sets calibrated from historical data and Wasserstein-distance-based ambiguity sets for DRO [46].
Within maritime applications, RO and DRO have been deployed in a number of subdomains. Yang et al. [47] addressed liner schedule design under accidental sailing-time uncertainty with cooperation agreements. Cao et al. [48] applied distributionally robust chance-constrained models to vessel deployment under demand uncertainty using second-order cone reformulation. Agra and Rodrigues [49] pioneered the application of DRO to berth allocation with a follow-up on quay-crane scheduling [50]. On the power-system side, two-stage robust formulations have been applied extensively to integrated energy systems with renewable generation, electric-vehicle charging and demand response, sharing important structural features with our problem. Despite this breadth, three properties of the present setting have not previously been addressed jointly. First, no existing maritime robust optimization study embeds continuous sailing speed, multi-source on-board energy dispatch (diesel, battery, PV and shore power), and shore-power ramp-rate protection within a single two-stage formulation. Second, the few studies that combine more than one of these elements [13,20,39] operate at the single-vessel or single-route level and do not incorporate multi-tier hub–feeder–source routing decisions. Third, the budget parameter Γ of the polyhedral uncertainty set is rarely calibrated from a data-driven forecasting model; in most applications it remains a free tuning parameter, severing the connection between empirical forecast error and decision conservativeness.
Table 1.
Comparison of relevant studies.
3. Mathematical Modeling
3.1. Problem Description
We assist a container liner shipping company that operates a fleet of hybrid power vessels across a multi-port navigation network, shown in Figure 1. Crucial to the operation is the dynamic management of power during two alternating phases for each vessel. During the sailing phase, the vessel cruises between consecutive ports along a leg of the route, drawing propulsion power from any combination of the on-board diesel generator, the battery, and the PV array. The sailing speed directly determines the voyage time and the nonlinear (cubic) propulsion power demand, and is bounded above by the design speed and below by the minimum maneuvering requirements. During the berthing phase, after docking, the vessel can additionally connect to the port shore-power system, either charging its batteries or feeding its hotel load directly from the grid. These two phases are inherently coupled: the sailing-speed decision on a leg determines the time of arrival at the next port and thus the duration of the available shore-charging window, while the state of the energy system at departure constrains the feasible speeds on the subsequent leg. Therefore, the routing and energy decisions must be co-optimized rather than treated sequentially.
Figure 1.
Multi-layer hierarchical network architecture for maritime resource management.
The environment, however, adds two critical complexities. First, the environment is rife with pervasive uncertainty: volatile PV output fluctuates with irradiance and cloud cover; stochastic arrival times of feeder vessels occur due to port congestion or adverse weather; and even port-grid background loads vary the available shore-power capacity from one hour to the next. Second, the port grid imposes a strict ramp-rate constraint on shore power (typically 100 kW/min at feeder ports (Ω) and 300 kW/min at hub ports (H)) to ensure contractual grid compliance, meaning an aggressive charging profile not only stresses on-board equipment but actually violates contractual interface specifications. A schedule performing well under nominal forecasts can therefore become infeasible or uneconomic once these factors deviate.
Building on the above considerations, our study is dedicated to simultaneously coping with three subproblems:
- (i)
- How to determine the routing and the leg-wise sailing speeds in the first stage, given the uncertain demand and weather conditions;
- (ii)
- How to allocate power among the diesel generator, battery, shore power and PV in the second stage, so that the operating cost is minimized under the worst-case realization of the uncertainty;
- (iii)
- How to enforce port-grid friendliness through an explicit constraint on the shore-power ramp rate.
3.2. Notations
The nature of relevant variables depends on objective functions. The variables that have a decisive impact on the objective function are defined as decision variables. Otherwise, other variables can be treated as inputs, derived from historical data or other literature. The notations used in this paper are presented in Table 2.
Table 2.
Notations of sets, parameters, and variables.
3.3. Modeling
This study tackles the integrated optimization of a hybrid power liner under multi-source uncertainty by formulating a two-stage robust optimization framework. The proposed model jointly improves operating economy and grid-friendliness while guaranteeing operational feasibility and resilience under a wide range of perturbations. The key idea is to decompose the complex coupled decision problem into two tightly linked stages.
3.3.1. First-Stage Energy-Dispatch Model
The first stage is a robust energy-dispatch model focusing on the coordinated management of the on-board multi-energy system. Decision variables include power allocation among the diesel generator, the battery storage system, the shore-power input and the PV output. Under physical constraints on device output bounds and battery SOC safety bounds, the model also explicitly captures internal uncertainties such as battery aging and device efficiency drift, in order to produce a robust baseline schedule that remains feasible and stable under external supply–demand fluctuations. The objective function and constraints are formulated as follows.
Objective 1 (operating cost). This objective quantifies the total economic expense of the vessel within the scheduling horizon. It covers direct energy-consumption costs and indirect device-usage costs, namely: fuel costs driven by diesel-generator output; shore-power costs driven by the time-of-use tariff and the energy drawn from shore; battery degradation costs depending on charge/discharge depth and cycle counts; and operation-and-maintenance costs depending on device operating intensity. Minimizing the total cost drives the model to prefer low-cost, high-efficiency energy sources and to extend equipment life:
where the overall first-stage cost objective is the sum of the energy-operating cost and the delay-penalty cost .
Objective 2 (port-grid friendliness). Objective 2 measures the friendliness and stability of the vessel as a controllable load on the port microgrid. Its core metric is the magnitude of the shore-power ramp rate during charging. Excessive ramp rates can induce voltage flicker and frequency oscillations that threaten the port grid and sensitive neighboring loads. Objective 2 thus reflects the active grid-supporting capability of the vessel and the role of green shipping in stabilizing port energy systems:
In addition, accurately characterizing the nonlinear relationship between sailing speed and propulsion power is essential for precise energy-consumption prediction and integrated optimization. We adopt a classical resistance-power model based on hydrodynamic principles:
For mixed-integer linear programming (MILP) formulations of vessel scheduling and energy optimization, the cubic and sinusoidal terms in (6) introduce significant nonlinearity. We therefore adopt piecewise linearization to approximate (6) while balancing model accuracy and tractability. Let
Partition the admissible speed range into N intervals and introduce the binary indicators satisfying , where each equals one if and only if v(t) lies in the i-th segment. The sailing speed and the propulsion-power surrogate are then expressed as weighted sums of the segment endpoints.
where and are segment-specific slopes and intercepts. The two constants are determined by matching the original cubic curve at the segment endpoints and , which yields the linear system
Solving Equations (10) and (11) by segment gives closed-form expressions for the coefficients without recourse to numerical optimization. The number of segments N controls the trade-off between approximation accuracy and computational burden: a larger N value reduces the maximum approximation error but proportionally inflates the number of binary variables . After empirical experiments we settled on N = 6, which keeps the maximum error below 1.5% while adding only a moderate number of binaries.
Increasing the number of segments can further reduce the approximation error; however, the improvement becomes marginal once the error falls below 1.5%. At the same time, additional segments increase the number of binary variables and linking constraints in the Benders master problem, leading to higher computational effort with limited gains in solution quality. Therefore, N = 6 is adopted as a practical compromise between approximation accuracy and computational efficiency.
The second step treats the residual sinusoidal wave load . Because this term depends on time but not on the decision variable , it cannot be replaced by piecewise linearization in the same way. We instead approximate it by a truncated Fourier expansion whose accuracy is controlled by the number of harmonics M:
The harmonic coefficients and are pre-computed offline. With M = 3, the residual error is below 0.2% across a full encounter period, which is more than adequate given the other uncertainties already present in the model. Combining Equations (8) and (9) with (12), the full propulsion-power of Equation (6) is replaced by an exact linear combination of the binary segment indicators , the pre-computed coefficients , , and , and the time variable t. The model belongs the MILP model. The numerical experiments reported in Section 5 confirm that this approximation has no perceptible impact on the qualitative behavior of the dispatch and changes the optimal objective value by less than 1.2% relative to a direct nonlinear solve of Equation (6).
To ensure that the dispatch decision is physically feasible, operationally safe and consistent with port rules, the proposed two-stage robust framework embeds the following constraints, covering sailing dynamics, energy-system physics, time-window requirements and equipment operating limits.
Constraint (13) is the core power-balance equation: at every time step , the propulsion power requirement plus other on-board loads must be covered by the total output of all the energy sources, including the diesel generator , the shore-power injection , the net battery power (positive for discharging, negative for charging) and the PV output . It guarantees instantaneous supply–demand matching and is the foundation of the energy-management problem.
Constraints (14)–(16) impose operating bounds on the three controllable sources: Constraint (14) keeps the diesel generator between its minimum stable load and rated power , avoiding uneconomic combustion at a low load and overloading at a high load. Constraint (15) limits the shore-power injection to the port-grid capacity . Constraint (16) keeps the battery SOC within the safe band to prevent over-charging or over-discharging damage.
Constraints (17)–(19) describe the battery energy accumulation: Constraint (17) is the discrete-time form of energy conservation, stating that the energy stored in the battery at the next time step equals the current stored energy plus the net charge/discharge increment. Constraint (18) is the linear conversion between energy and SOC(t). Constraint (19) translates the SOC safety band into explicit bounds on and is equivalent to Constraint (21) but more convenient for linearization.
Constraints (20) and (21) state the lower and upper sides of this same envelope separately.
Constraint (22) defines the net power as the difference between charging and discharging contributions, scaled by the respective round-trip efficiencies and .
Constraint (23) is the logical exclusivity condition ensuring the battery is never simultaneously charging and discharging—a state that is physically meaningless and numerically pathological.
Constraints (24) and (25) define the net battery power in terms of the charging and discharging powers and .
Constraints (26) and (27) bound each flow above by M times its own activating binary, so a flow can be non-zero only when its corresponding mode is switched on.
Constraint (28) restates the energy recursion in the decomposed variables for consistency.
Piecewise definition (29) makes the mode-dependent behavior explicit, recovering the efficiency-weighted charge increment when , the efficiency-weighted discharge decrement when and zero net flow otherwise.
3.3.2. Two-Stage Robust Formulation
Building on the first-stage robust energy dispatch, the second stage focuses on the interaction between sailing scheduling and external environmental disturbances. The challenge is that the actual operating environment is fraught with uncertainty: port-side load demand may spike due to surge operations, onshore PV output may fluctuate sharply with weather, and sea-state changes may indirectly affect propulsion energy. If the dispatch were optimized solely on deterministic forecasts, any deviation from expectations could lead to cost overruns, grid-impact violations or even energy shortages that endanger operational safety.
To address this risk, this study constructs an uncertainty-aware model and embeds it in a robust optimization framework so that a scheduling decision remains feasible and efficient under the worst realization of the uncertainty set. For the sake of comparison, we first specify a deterministic counterpart. The relationship between the deterministic model and the proposed two-stage robust model is as follows: mathematically, the deterministic model assumes that all uncertain parameters are exactly equal to their forecast expectations and uses a single-stage static decision, whereas the robust model further accounts for parameter fluctuations within an uncertainty set and adopts a two-stage adjustment mechanism to obtain a worst-case-feasible optimum. The deterministic model serves as a performance baseline under idealized information; by comparing both models in actual uncertainty scenarios in terms of running cost, feasibility ratio and grid-impact metrics, we quantitatively reveal the decision risk of ignoring uncertainty and verify the necessity and superiority of robust optimization in handling delays and multi-source supply fluctuations.
To rigorously verify the effectiveness of the proposed two-stage robust model and its Benders decomposition solver, we develop a scientific evaluation mechanism. The mechanism quantifies the stability, feasibility and economic conservatism of the dispatch scheme under uncertainty, and compares it with the deterministic model to expose the practical value of robust optimization for hybrid-power liner scheduling. Because robust optimization only targets the worst case inside an uncertainty set, a Monte Carlo simulation is used for posterior validation under general random scenarios.
Let the uncertainty vector be with the distribution . Generate M independently and identically distribute random scenarios , where each scenario takes the form
Fix the first-stage decision x* obtained from the robust model and solve the second-stage energy-dispatch subproblem in each scenario, obtaining the operating cost
The mean cost and the cost standard deviation across M scenarios are
The detailed analysis procedure is: (i) generate M random scenarios within the uncertainty set, with the PV fluctuation coefficient, port operation time perturbation and other variables following truncated normal distributions; (ii) fix the first-stage decision x* obtained from the robust solution and substitute it into each scenario; (iii) re-optimize the second-stage problem in every scenario and check the satisfaction of all constraints, producing the actual operating cost; (iv) summarize the M scenario results to compute the expected value of the constraint–deviation ratio, the constraint-violation rate and the probability of operational risk, assembling a robust-performance summary chart.
We classify the uncertainty affecting the model into two broad families, and within each family we identify three distinct factors. External (exogenous) uncertainty arises from the environment and from logistics synchronization, and the decision-maker has no direct control over it; internal (endogenous) uncertainty arises from device-side performance drift, and although it is in principle under the operator’s control, its short-term realization is essentially random. Modelling both families explicitly is necessary because they affect different parts of the model and respond differently to mitigation strategies.
- (i)
- PV-output uncertainty. The actual on-deck PV output is affected by irradiance, cloud cover and panel temperature, and exhibits significant fluctuations. Let denote the forecast PV output and the actual output. The uncertainty is described by a hybrid interval–probability model:
- (ii)
- Feeder synchronization-time uncertainty. The arrival time of feeder vessels directly constrains the operating window of the main line. Let denote the forecast feeder arrival time at port and the actual arrival time. The delay uncertainty is one-sided (only delays, not early arrivals, are considered):
- (iii)
- Port-grid background-load uncertainty. Fluctuation of the port-grid background load affects both the available shore-power capacity and the time-of-use tariff:
- (iv)
- Battery aging and efficiency drift. The actual usable capacity of the battery storage decays with cycle count:
- (v)
- Diesel efficiency and sensor noise. Small fluctuations in the diesel-engine fuel rate caused by load ratio, engine condition and sensor noise are captured through
The sixth factor—port-grid voltage fluctuation—follows a similar interval model and is bundled with (iii) inside the polyhedral uncertainty set defined next. We deliberately stop at six factors because adding further dimensions to the uncertainty set rapidly inflates the size of the worst-case subproblem without producing materially different solutions, as confirmed by preliminary sensitivity tests.
Based on the multi-source uncertainty modelling, six dominant uncertainty drivers, including both external environmental disturbances and internal operational variations, are explicitly considered to balance model fidelity and computational tractability. These uncertainties capture the primary factors affecting vessel routing and energy management, while introducing additional lower-impact uncertainty dimensions would enlarge the polyhedral uncertainty set, increase the computational burden of the worst-case subproblem, and provide only marginal improvements in solution robustness. Accordingly, the following uncertainty ranges are imposed. (i) Feeder synchronization uncertainty: The arrival time of the feeder at each feeder port is subject to random delays with a maximum allowed delay of 4 h, described by the polyhedral set (34). (ii) Energy uncertainty: The PV-output forecast error amplitude is set to ±20%. (iii) Port-grid uncertainty: The background load fluctuates by ±10%, and the shore-power ramp-rate limits are 100 kW/min at feeder ports and 300 kW/min at hub ports. The robust budget Γ is set to 1.5, calibrated to the 95th-percentile residual of the LSTM port-throughput forecast.
To quantify the practical value of explicitly accounting for uncertainty, a deterministic optimization model is introduced as a benchmark. It is identical to the proposed model except that all uncertain parameters are fixed at their forecast expectations and a single-stage static optimization strategy is adopted. Both models are evaluated under identical test scenarios using Monte Carlo simulations with 1000 random realizations per case. The Benders decomposition algorithm is implemented in Python with Gurobi 11.0 solving both the master and subproblems. The relative optimality gap is set to ε = 1%, with a maximum of 50 iterations, ensuring computational efficiency while maintaining solution quality under the selected six-dimensional uncertainty set.
Given the identified six uncertainty factors, robust optimization denotes handling the worst case. We adopt the budgeted polyhedral set originally proposed by Bertsimas and Sim [21].
We collect the six uncertainty factors into a single normalized vector
Define the budgeted polyhedral uncertainty set as the intersection of an L∞-ball with an L1-ball:
Constraint (40) plays complementary roles. The infinity-norm constraint keeps each individual component within its maximum deviation, preventing pathological worst cases in which a single factor reaches an unphysically large value. The one-norm constraint is the robust budget: it limits the total mass of deviations that can be attained simultaneously, thereby controlling the conservatism of the model. When , the set collapses to the single point and the model degenerates into the deterministic baseline; when (with N = 6 in our setting), the constraint is slack and U coincides with the full hypercube, recovering the fully box-robust formulation. For intermediate values , only a subset of components can reach their worst values at any one time, and the decision-maker can therefore trade off conservatism against economic efficiency through a single transparent parameter.
Figure 2 visualizes the geometry of U for three representative values of . Panel (a) corresponds to , the deterministic limit in which all uncertainties must take their nominal values; panel (b) shows , which produces a truncated cube—the intersection of the unit hypercube with a cross-polytope—which was adopted in our experiments because it covers the 95% percentile of LSTM forecasting residuals without becoming overly conservative; and panel (c) shows , in which the cross-polytope already contains the cube and the effective set is the full hypercube, equivalent in shape to the fully box-robust case at .
Figure 2.
Geometry of the uncertainty set U under three representative budgets: (a) —a deterministic single point; (b) —a truncated cube giving a balanced compromise; and (c) —a fully box-robust regime.
4. Algorithm Solution
Benders decomposition is a classical algorithm for large-scale structured optimization, which is particularly suitable for two-stage stochastic programming and robust optimization. Its core idea is to decompose the original problem into a master problem (MP) and one or more subproblems (SPs), and to gradually approach the optimum by iteratively generating Benders cuts. The master problem typically contains first-stage decision variables, aims to minimize first-stage costs, and includes an auxiliary variable that estimates second-stage costs. The subproblem optimizes the second-stage response under a fixed first-stage decision and evaluates the actual cost and feasibility. Two types of Benders cuts arise: feasibility cuts, generated when the subproblem is infeasible, exclude the offending first-stage decisions; and optimality cuts, generated when the subproblem is feasible but the master underestimates second-stage costs, raise the master’s lower bound. The algorithm alternates between the master and subproblem until convergence.
4.1. Benders Decomposition: Theory and Applicability
Benders decomposition, proposed by Benders in 1962 [11], rests on the ideas of projection and duality. Consider an optimization problem with a separable structure
where represents complex (e.g., integer) variables and represents continuous variables. If, for every fixed , the subproblem with respect to is convex and efficiently solvable, then its dual formulation can be embedded in the master, yielding an equivalent reformulation in alone. This reformulation uses Benders cuts to encode the implicit relationship between and the feasibility/optimality value of the subproblem. The effectiveness of Benders decomposition depends on two conditions: (i) the subproblem is convex for every fixed ; and (ii) the uncertainty set is polyhedral so that the worst-case subproblem still admits a linear dual reformulation. In our study, the energy-dispatch subproblem is a linear program (LP), and the uncertainty set is the polyhedron
4.2. Problem Definition
Master problem. The master problem optimizes the first-stage variables that must be determined before uncertainty is realized: the route-indicator variables, the planned sailing speed on each leg, and the planned arrival and departure times. Its objective is the sum of the fixed sailing cost, the fuel-consumption-related cost evaluated at the planned speed, and an auxiliary variable that estimates an upper bound on the worst-case second-stage energy cost. The constraints cover all route-, time-window- and port-sequence-related restrictions but do not directly involve the energy-side physics, which are deferred to the subproblem. As the iteration proceeds, Benders cuts pushed back by the subproblem progressively tighten the master’s feasible region and force its lower bound upward, driving the algorithm towards the global optimum.
Subproblem. For a given master decision and a worst-case scenario , the subproblem optimizes the second-stage variables, namely the diesel-generator output, battery charging/discharging power, shore-power injection, SOC trajectory, and fine-grained speed adjustments. Its objective is to minimize the operating cost under the worst case identified inside the uncertainty set. Because the subproblem itself contains an inner minimization (in ) and an outer maximization (in ), we use linear-programming duality to convert the inner minimization into a dual maximization, collapsing the bilevel structure into a single-level maximization problem that the solver can handle directly. Its constraints contain the full physical details of the energy system: power balance, battery dynamics, charge/discharge exclusivity, shore-power magnitude and ramp-rate limits.
4.3. Algorithmic Workflow
The algorithm alternates between the master problem and the subproblem, using Benders cuts to communicate dual information until the global lower bound and upper bound converge.
(1) Cut generation. Two kinds of Benders cuts are generated depending on the status of the subproblem.
Feasibility cuts are generated when the subproblem is infeasible under the current master decision; for example, when the energy system cannot satisfy the power balance or when the SOC trajectory violates its safety bounds. A feasibility cut excludes the offending master decisions and corrects the master feasible region. Optimality cuts are generated when the subproblem is feasible but the auxiliary variable in the master underestimates the true worst-case second-stage cost. An optimality cut of the form raises the lower bound of the master objective and forces it to search for a better schedule. We use the strengthened L-shaped cuts of Magnanti and Wong to reduce the number of major iterations whenever the subproblem dual has multiple optimal solutions. In the crossover operation, we exclude the port visit order, as this part is obtained as per B&B and does not require further optimization. For the other parts, we use a multipoint crossover strategy to explore a broader solution space.
(2) Convergence criterion. The algorithm maintains a global lower bound LB (from the master objective) and a global upper bound UB (from the worst-case subproblem cost). At each iteration:
Step 1: Solve the master problem to obtain the first-stage decision and the current lower bound LB.
Step 2: Pass to the subproblem, identify the worst-case scenario and the corresponding cost, and update the upper bound UB.
Step 3: Generate either a feasibility cut or an optimality cut according to the subproblem’s status, and add it to the master problem.
Step 4: Convergence check: If the relative gap (UB − LB)/UB falls below a preset threshold ε (set to 1% in our experiments), terminate and output the current solution; otherwise return to Step 1. A maximum iteration count is imposed to guarantee termination in pathological cases. The procedure is initialized with a feasible first-stage solution generated by a genetic-algorithm warm-start, which we found to reduce the average number of major iterations from 27.6 (cold start) to 11.3. The flowchart of the algorithm is illustrated in Figure 3.
Figure 3.
Flowchart of the benders decomposition algorithm.
5. Simulation Experiments
5.1. Parameters Setting
To verify the effectiveness of the proposed two-stage robust optimization model and its Benders decomposition solver, we test it on three real-world prototype networks of small, medium and large scales. Each is derived from a real commercial liner service and is exposed to joint perturbations of feeder synchronization delay, PV-output fluctuation, and port-grid background load. The detailed data and parameters refer to Appendix A.
By comparing the deterministic counterpart with the proposed robust model in 1000 Monte Carlo scenarios per case, we systematically assess economic performance, grid friendliness, and operational resilience across network scales. All computations are performed on a workstation with an Intel Core i9-13900HX @ 2.20 GHz processor and 16 GB of RAM, using Python 3.10 and Gurobi 11.0 as the underlying MILP solver. CPU runtimes are reported in seconds.
To fully validate the effectiveness and adaptability of the proposed two-stage robust optimization model across network scales, three test networks—small, medium and large—are constructed. All three follow a three-tier hub–feeder–source architecture and are derived from real domestic and international container feeder services. The number of hub ports, feeder ports and source points in each network is summarized in Table 3.
Table 3.
Scale parameters of the three prototype networks.
The small-scale case takes Qingdao Port as the central hub and the coastal port group of the Shandong Peninsula as the feeder network. Qingdao Port is an international container hub with dense ocean services and mature shore-power infrastructure, while surrounding ports such as Rizhao, Weihai and Yantai supply cargo through high-frequency “Shandong Port Express” feeder services—a typical hub-and-spoke configuration. Specifically, the hub port is in Qingdao, with a shore-power ramp-rate limit of 300 kW/min; the feeder ports are in Rizhao, Weihai, Yantai, Weifang, Dongying, Binzhou, Shidao and Lanshan, all with ramp-rate limits of 100 kW/min. The ten source points are distributed in the hinterlands of the feeder ports and cover tire, machinery, chemical and agricultural-product clusters. The planning horizon is 72 h with four available vessels. One-way sailing distances between feeder ports and Qingdao range from 80 to 200 nautical miles. The network operates several dozen voyages per week and supplies over 500,000 TEU per year of stable cargo flow into Qingdao.
The medium-scale case is based on the Intra Asia Service (SEA7) operated by SeaLead Shipping and extended to a broader East-Asia–Southeast-Asia feeder network. The network links major ports in Korea, China, Vietnam, Thailand, Malaysia and Indonesia, and is a typical regional container service. Two hub ports , are included: Shanghai Port (the international gateway of Northeast Asia) and the Port of Singapore (the world’s largest trans-shipment hub), both with a shore-power ramp-rate limit of 300 kW/min. Ten feeder ports are included—Busan, Ningbo, Guangzhou, Hong Kong, Ho Chi Minh, Laem Chabang, Port Klang, Jakarta, Surabaya and Tanjung Pelepas—all with ramp-rate limits of 100 kW/min. Fifteen source points cover electronics, textile, machinery and agricultural-product export clusters in the hinterlands.
The large-scale case is based on the Far-East-Asia–East-Latin-America Service 2 (FL2) launched by HMM in 2025 and integrates its self-operated South-American feeder network. The service connects Northeast Asia, Southeast Asia and the east coast of South America, with dense feeder services running in Brazil, Argentina and Uruguay. Two hub ports , are used (Shanghai and Singapore), both with shore-power ramp-rate limits of 300 kW/min. Fifteen feeder ports are included: Busan (Korea), Ningbo (China), Nansha (China), Shekou (China), Tanjung Pelepas (Malaysia), Rio Grande (Brazil), Santos (Brazil), Santa Catarina (Brazil), Navegantes (Brazil), Itapoá (Brazil), Paranaguá (Brazil), Montevideo (Uruguay), Buenos Aires (Argentina), La Plata (Argentina), and Salto (Uruguay), all with ramp-rate limits of 100 kW/min. Twenty source points cover East-Asian manufacturing clusters and South-American agricultural-export regions. Ten vessels are available; the full round-trip lasts about 77 days and is jointly operated by HMM and ONE.
Sailing distances among the ports in all three cases are computed from real geographic coordinates, and per-TEU handling times are set to 0.5–1.5 h depending on port efficiency. Container demand at each source point is generated by an LSTM forecasting model and perturbed by ±10% random noise to simulate demand uncertainty. The three real-world prototypes therefore allow us to systematically examine the impact of network complexity on the performance of the proposed robust optimization model.
Although the robust model formally optimizes against the worst case inside U, in practice the decision-maker also wants to evaluate how the resulting schedule performs across a broad sample of realistic scenarios. For the Monte Carlo posterior validation reported later, we therefore summarize the parameter ranges of the six uncertainty factors in Table 4. By varying these intervals and the budget Γ, different perturbation scenarios can be constructed and tested.
Table 4.
Parameter ranges of the six uncertainty factors.
5.2. Energy-Source Analysis
To verify the effectiveness of the proposed two-stage robust integrated optimization model, this section uses the regional feeder shipping network introduced above as the test bed. Through a series of simulation experiments, we compare the deterministic model and the robust model in terms of economic cost, grid safety, energy-dispatch flexibility and multi-scenario adaptability.
5.2.1. Diesel Generator
The diesel generator, as the core power source of the hybrid liner, has a fuel-consumption profile that directly drives the operating economy and is one of the key nonlinear components of the proposed two-stage robust model. Figure 4 respectively shows, for the small, medium and large cases, the hourly fuel consumption and the specific fuel-consumption rate of the diesel engine as functions of the load ratio.
Figure 4.
Diesel hourly fuel consumption and specific fuel consumption versus load ratio: (a) hourly consumption (small-scale case), (b) specific fuel consumption (small-scale case), (c) hourly consumption (medium-scale case), (d) specific fuel consumption (medium-scale case), (e) hourly consumption (large-scale case), and (f) specific fuel consumption (large-scale case).
In terms of hourly fuel consumption, all three cases exhibit increasing curves but with markedly different shapes. The small-scale case grows slowly at low loads—hourly consumption increases by 52% between load ratios of 0.2 and 0.4—and accelerates at high loads—rising by 31% between load ratios of 0.8 and 1.0—resulting in a slow–steep–slow S-shape. The medium-scale case grows nearly linearly, with comparable increases across all load intervals. The large-scale case is flat at low loads but steepens markedly after 0.5, with hourly consumption rising by 31% between load ratios of 0.8 and 1.0; absolute fuel consumption is much higher than in the other two cases. This pattern reflects the amplifying effect of engine power class on fuel consumption and provides baseline parameters for fuel-cost prediction across vessel scales in the robust model.
Specific fuel consumption follows a classical U-shape in all three cases: it decreases with the load ratio in the low- and mid-load regions, reaches a minimum, and then rises again at high loads. The minimum is located at a load ratio of 0.7 (120 g/kWh) for the small case, at load ratios of 0.75–0.8 (118 g/kWh) for the medium case, and at a load ratio of 0.8 load (115 g/kWh) for the large case. On the low side, at a load ratio of 0.2,the rate rises to 168, 172 and 175 g/kWh, respectively; on the high side, at a load ratio of 1.0, it rebounds to 130, 135 and 130 g/kWh.
This U-shape has two important implications for the robust model. First, the existence of an economic operating band (typically 60–80% load) means that a deterministic strategy minimizing only instantaneous cost may push the engine to deviate from the economic band, increasing actual fuel use. Second, the increasing fuel rate on either side implies that under PV shortfalls or feeder-delay-induced load shifts, efficiency can be maintained. It is rationale for introducing battery peak-shaving in the robust model: by modulating the load, the battery keeps the diesel engine in its economic band and absorbs the efficiency loss from external perturbations. The optimal economic load also differs across scales (0.7 for small, 0.75–0.8 for medium and 0.8 for large), implying that a robust strategy should set scale-specific target diesel load bands. The subsequent robustness experiments will verify that the proposed model keeps diesel load oscillations near the bottom of the U-shape, whereas the deterministic model is repeatedly pushed off the economic band, increasing fuel costs by 13.6–15.4%.
5.2.2. Battery SOC Dynamics
The battery storage system is the main energy buffer of the hybrid liner. Its SOC dynamics directly reveal the energy-dispatch strategy and the robust adaptive capacity of the system. In Figure 5, the discharging power is positive, and the charging power is plotted as negative; charge/discharge exclusivity (23)–(27) is clearly visible. The SOC trajectory follows energy constraint (17) and is automatically clipped by safety constraint (16).
Figure 5.
Battery SOC and charge/discharge dynamics: (a) small-scale case, (b) medium-scale case, and (c) large-scale case.
Figure 5 shows the evolution of SOC and the charge/discharge state in the small, medium and large cases, respectively. The three cases exhibit regular charge/discharge cycles: in the 2–5 h discharging phase, the battery releases energy at constant power and SOC decreases linearly; in the 7–9 h charging phase, it absorbs energy at constant power and SOC rises linearly. This linear behavior follows from the integral relationship between energy throughput and SOC and underpins the energy-balance constraints in the optimization model. The differences across scales lie mainly in the power level and the SOC change rate: the small case (1500 kWh battery, 300 kW discharge for 3 h) has a ΔSOC = 0.6 (rate 0.2/h); the medium case (2000 kWh, 400 kW for 3 h) has a ΔSOC = 0.6; and the large case (3000 kWh, 500 kW for 3 h) has a ΔSOC = 0.5 (rate 0.17/h). The larger battery in the large case yields a flatter SOC change at the same discharge duration, reflecting its stronger buffering capacity against load fluctuation.
SOC dynamics play a critical role in the robust model. First, the SOC safety band is the foundation of battery longevity and system safety. A deterministic strategy might push SOC close to its limit to chase short-term profit, but PV shortfalls or feeder delays can cause SOC to touch the lower bound of 0.1 and force the battery out of service, leaving the diesel engine to carry the full load. This is exactly why the robust model imposes a target SOC band [0.3, 0.8] with a reserved buffer, ensuring that the system remains operable under the worst perturbation. Second, the different charge/discharge rates require scale-matched strategies: the small case has a fast-changing SOC and requires more frequent regulation and higher forecast/response accuracy, whereas the large case has higher inertia and a slower response. In the proposed framework, first-stage speed and arrival-time decisions explicitly account for battery capability, leaving enough headroom for the second-stage energy dispatch. For example, in the large case the robust model proactively reduces speed to stretch the sailing time and obtain smoother charging, keeping SOC always inside the safe band; in the small case, it relies more on a rapid response to immediate optima.
The subsequent robustness experiments will confirm that, by reserving an SOC buffer and coordinating speed-energy allocation, the robust model keeps SOC in the 40–80% range, whereas the deterministic model produces SOC trajectories that approach 40% or exceed 90% under delay perturbations, with a real risk of diesel idle-mode activation.
5.2.3. Photovoltaic Generation
The on-deck PV system is the principal clean-energy source of the hybrid liner; its output is strongly weather-dependent and therefore intermittent and uncertain. Figure 6 shows the daily evolution of PV output under three typical weather conditions (sunny, cloudy and overcast) for the small, medium and large cases respectively. Under sunny conditions, the PV output follows a smooth bell-shaped curve consistent with a daily solar-irradiance profile, with midday peaks of about 200 kW (small), 300 kW (medium) and 400 kW (large), which are symmetric around 12:00 and drop to zero after sunset. Cloudy weather superimposes pronounced sinusoidal fluctuations on the bell, reducing the peaks to 150, 220 and 300 kW, respectively; the fluctuation amplitudes also grow with vessel scale (±20, ±30, ±40 kW). Overcast conditions yield a much flatter profile with peaks of only 70, 100 and 150 kW and much smaller fluctuations.
Figure 6.
Daily PV output under different weather conditions: (a) small-scale case, (b) medium-scale case, and (c) large-scale case.
The installed PV capacity scales with the vessel, so that the small case has a relatively low clean-energy penetration whereas the large case has the largest absolute PV contribution and the strongest influence on the system energy mix. The intermittency of PV imposes tangible constraints on energy management. Under sunny conditions PV provides a stable clean-electricity contribution that reduces fuel consumption; under cloudy conditions, the frequent oscillations require the battery storage to respond quickly to maintain power balance; and, under overcast conditions, the PV contribution is limited, and the system relies more heavily on the diesel engine and shore power. A deterministic strategy based only on forecast expectations may face genuine power shortfalls under cloudy or overcast realizations, forcing standby diesel start-up or deep battery discharge—both of which increase costs and shorten battery life.
5.2.4. Aggregate Energy Distribution
Figure 7 brings the four energy sources together by showing, for each case, the 24 h dynamic balance between source outputs and total load. From small to large, the load profile transforms from a smooth single peak to a sharply tri-peaked curve, and the battery charge/discharge strategy adapts accordingly: in the small case, the battery only discharges 80 kW during the single evening peak, with limited storage involvement; in the medium case, it discharges 150–200 kW during the morning and evening peaks, achieving peak-shaving; and, in the large case, it discharges 200–300 kW at the morning, midday and evening peaks, with significantly higher cycle frequency and depth.
Figure 7.
Aggregate energy distribution over 24 h: (a) small case; (b) medium case; and (c) large case.
At every time step, the total source output exactly covers the load curve, confirming that power-balance constraint (18) is satisfied in all three cases. This is not a trivial result: as PV penetration rises (12%, 15%, and 18% for the small, medium and large cases) and load complexity grows, a deterministic strategy is highly susceptible to power shortfalls caused by forecast errors. The robust model handles these constraints reliably. In the large case, the battery charges at 15:00–17:00 to exploit the predicted PV peak, leveraging the first-stage speed adjustment for the time window; in the medium case, it charges from shore at 01:00–05:00 to exploit the off-peak tariff; and, in the small case, the diesel-engine output is smoothed to reduce mechanical wear from frequent start/stop cycles.
5.3. Cost-Structure Analysis
Figure 8 shows the average operating-cost composition of the deterministic model and the proposed robust model over 1000 Monte Carlo scenarios; detailed data are summarized in Table 5 and Table 6. The robust model yields an average total operating cost of RMB 14.75 million, compared with RMB 18.90 million for the deterministic model—achieving an overall reduction of 22.0%.
Figure 8.
Operating-cost composition: deterministic vs. robust model.
Table 5.
Average operating-cost composition (104 RMB).
Table 6.
Cost decomposition by category (104 RMB).
Examining the cost structure in detail, the robust model actually incurs slightly higher shore-power and battery-degradation costs (RMB 2.60 and RMB 0.60 million) than the deterministic model (RMB 2.20 and RMB 0.40 million). This is a direct consequence of its conservative strategy: it deliberately raises shore-charging at grid-stable hub ports and uses the battery to buffer load fluctuations, producing extra device wear and shore-power purchase costs. However, this upfront investment substantially reduces fuel costs and delay penalties: fuel costs drop from RMB 12.50 to 10.80 million (a 13.6% reduction), and delay penalties drop from RMB 3.80 to 0.75 million (a striking 80.3% reduction). The deterministic model, which does not account for feeder delay risk, forces the vessel either to wait at the feeder-port anchorage or to sprint to catch up, producing high penalties and inefficient fuel burn.
Cost-stability analysis further confirms the advantage of the robust model: its cost standard deviation is RMB 0.80 million, compared with RMB 2.50 million for the deterministic model—a 68.0% reduction. The feasibility ratio across the 1000 scenarios rises from 53.0% (deterministic) to 89.0% (robust), and the probability of grid violation falls from 68.5% to 12.3%.
5.4. Robust-Performance Evaluation
To verify the adaptability of the proposed model to uncertainty across scales, 1000 Monte Carlo scenarios are simulated for each case, accounting jointly for demand fluctuation, PV-output fluctuation, feeder-delay uncertainty, port-grid background-load fluctuation, battery aging, and diesel-efficiency drift. Three perturbation levels (mild, moderate, severe) are first defined; the corresponding parameter ranges are listed in Table 7.
Table 7.
Disturbance-level parameters.
A scenario is judged feasible only if all five physical and operational constraints listed in Table 8 are satisfied simultaneously. The feasibility criteria are anchored in the physical and safety requirements of real hybrid-power liner operations. Power balance is the foundation of stable operations; the 1 kW tolerance matches typical control-system precision. The SOC safety band [0.1, 0.9] follows lithium-ion physics: below 0.1, over-discharging degrades battery life, and above 0.9, over-charging poses safety risks. The 800 kW diesel minimum stable load follows from observed unstable combustion and exploding specific consumption at lower loads. The shore-power ramp-rate limits of 100 and 300 kW/min for feeder and hub ports reflect port-grid safety standards on voltage flicker and frequency oscillation. The 2 h elasticity in the time window follows from real hub–feeder operations: feeder delays beyond 2 h cause the vessel to miss the main-line berth window and trigger extra penalties.
Table 8.
Feasibility criteria for scenario test.
Table 9 reports the number of feasible scenarios across the three cases and three disturbance levels. Two patterns are evident. First, deterministic feasibility decays sharply with both scale and severity: it drops from 94.5% to 32.0% in the small case, from 92.0% to 21.0% in the medium case, and from 89.5% to 15.0% in the large case, when moving from mild to severe disturbance. The robust model decays much more gently: from 99.8% to 81.5%, from 99.5% to 76.5%, and from 99.0% to 72.0% in the three cases, respectively. Second, the gap between the two models widens as the scale grows: under moderate disturbances, the deterministic-vs.-robust gap is 68.0% vs. 92.0% (small), 53.0% vs. 89.0% (medium), and 45.0% vs. 86.5% (large), and under severe disturbances, the gap reaches a striking 32.0% vs. 81.5%, 21.0% vs. 76.5%, and 15.0% vs. 72.0%. Thus, the robust model offers a stronger safety margin against extreme perturbations in large networks.
Table 9.
Number of feasible scenarios out of 1000 under different disturbance levels.
Figure 9 compares the cost distributions of the two models at three scales. In the small network, deterministic distribution exhibits a wide right tail, with a mean of RMB 10.80 million, a standard deviation of RMB 1.40 million, and a maximum of RMB 12.80 million, whereas robust distribution is highly concentrated, with a mean of RMB 8.62 million, a standard deviation of RMB 0.52 million, and a maximum of RMB 9.50 million. The robust model reduces the mean cost by RMB 2.18 million (20.2%) and the standard deviation by 62.9%. It effectively suppresses extreme scenarios, whereas the deterministic model exhibits a clear tail risk. In the medium network, the deterministic distribution spreads further (mean 18.90, standard deviation 2.50, maximum 23.10), while the robust distribution remains compact (mean 14.75, standard deviation 0.80, maximum 16.80), reducing the mean by 22.0% and the standard deviation by 68.0%. In the large network, the deterministic distribution is the most dispersed (mean 30.20, standard deviation 3.80, maximum 36.50), whereas the robust model achieves a mean of 23.10, a standard deviation of 1.30, and a maximum of 25.20, reducing the mean by 23.5%, the standard deviation by 65.8%, and the maximum cost by RMB 11.30 million (31.0%).
Figure 9.
Monte Carlo cost distributions for different cases: (a) small-size instances, (b) medium-size instances, and (c) large-size instances.
Several patterns emerge from this: Absolute costs increase with network scale for both models, but the relative advantage of the robust model becomes more pronounced as the scale increases. The mean cost reductions are 20.2%, 22.0%, and 23.5% for the small, medium, and large cases, respectively, indicating that the marginal benefit of robust optimization increases with network scale. Cost stability improves by more than 60% in all cases and is most pronounced in the large case, indicating that the robust model effectively mitigates the cost volatility induced by multi-source uncertainty. From the perspective of extreme-scenario control, the maximum cost reduction increases from 25.8% in the small case to 31.0% in the large case, confirming that the value of the robust model grows as the network scale increases.
Figure 10 shows the feasibility-ratio trends of the deterministic and robust models at three network scales under different disturbance intensities. As the disturbance intensity increases from mild to severe, the feasibility ratios of both models decrease, but at markedly different rates. The feasibility ratio of the deterministic model declines sharply, from 94.5% to 32.0% in the small case, from 92.0% to 21.0% in the medium case, and from 89.5% to 15.0% in the large case. In contrast, the robust model exhibits a much gentler decline, from 99.8% to 81.5% in the small case, from 99.5% to 76.5% in the medium case, and from 99.0% to 72.0% in the large case.
Figure 10.
Feasibility ratio comparison under different disturbance intensities: (a) small-size instances, (b) medium-size instances, and (c) large-size instances.
The amplifying effect of network scale on feasibility is particularly evident from the comparison between the two models. Under the same disturbance level, the feasibility gap increases with network scale. For moderate disturbances, the deterministic and robust models achieve feasibility ratios of 68.0% and 92.0% in the small case, 53.0% and 89.0% in the medium case, and 45.0% and 86.5% in the large case, respectively. The superior resilience of the robust model is most evident under severe disturbances in the large network, where the feasibility ratio of the deterministic model falls to only 15.0%, whereas the robust model maintains a feasibility ratio of 72.0%. Overall, the feasibility of the deterministic model decreases rapidly with an increasing network scale and disturbance intensity, whereas that of the robust model declines much more gradually. Consequently, the feasibility gap between the two models widens from approximately 5–10% under mild disturbances to 50–57% under severe disturbances.
Although the proposed model simultaneously considers all six uncertainty sources, their operational impacts differ qualitatively. Among them, feeder-delay uncertainty is expected to be the dominant contributor to schedule infeasibility because it directly affects vessel arrival times and may trigger violations of the berth time-window constraint, thereby propagating delays throughout the service network. By comparison, PV-output fluctuation primarily influences on-board energy dispatch rather than routing decisions. Owing to the battery peak-shaving strategy, the diesel generator is maintained close to its economic operating region despite renewable-energy fluctuations, substantially reducing the impact of PV uncertainty on total operating cost. The remaining uncertainty sources, including loading/unloading demand, port-grid fluctuation, battery aging, and diesel-efficiency drift, mainly affect operational costs through energy management rather than service feasibility. These observations suggest that improving feeder schedule reliability offers the greatest benefit for enhancing operational robustness, while the hybrid energy system effectively mitigates the influence of renewable-energy uncertainty.
6. Conclusions
This paper develops a two-stage robust optimization framework for the joint scheduling and on-board energy management of multi-port hybrid power vessels under multi-source uncertainty. The first stage commits to route, sailing speed and arrival-time decisions; the second stage allocates power among the diesel generator, battery storage, shore power and on-deck PV under the worst-case realization of a budgeted polyhedral uncertainty set built around six exogenous and endogenous factors. The cubic propulsion–power–speed relationship is rendered tractable through segment-based linearization, and the overall mixed-integer linear program is solved efficiently by a customized Benders decomposition algorithm that decomposes the problem into a routing master problem and an energy-dispatch subproblem, iteratively generating optimality and feasibility cuts, and exploiting a genetic-algorithm warm-start to accelerate convergence.
From the perspective of symmetry and asymmetry in intelligent transportation systems, the proposed framework explicitly captures the asymmetric interactions between uncertain energy supply, port-side demand fluctuations, and vessel operational states, while preserving the symmetric structure of network-wide service coordination through robust scheduling decisions. This balance between symmetry and asymmetry contributes to improving the adaptability, reliability, and resilience of intelligent maritime transportation systems.
Three directions deserve further investigation. First, the current cost-based objective could be extended to a multi-objective formulation that explicitly trades off carbon emissions, operating cost and grid friendliness under emerging carbon-pricing regimes such as the EU Emissions Trading System for maritime transport. Second, the polyhedral uncertainty set could be replaced by a data-driven distributionally robust formulation that better exploits historical operational data while retaining out-of-sample guarantees. Third, the impact of external factors such as geopolitical disruptions, environmental restrictions and emerging alternative fuels (LNG, methanol, ammonia and hydrogen) on routing and energy-mix decisions deserves dedicated study. Together, these directions can yield a more comprehensive understanding of green and resilient hybrid-power liner operations in the decade ahead.
Author Contributions
Conceptualization, Z.C., A.X., T.Q., J.C., X.C. and Y.Z.; methodology, Z.C., A.X., T.Q., J.C., X.C. and Y.Z.; software, Z.C., A.X., T.Q., J.C., X.C. and Y.Z.; validation, Z.C., A.X., T.Q., J.C., X.C. and Y.Z.; formal analysis, Z.C., A.X., T.Q., J.C., X.C. and Y.Z.; investigation, Z.C., A.X., T.Q., J.C., X.C. and Y.Z.; resources, Z.C., A.X., T.Q., J.C., X.C. and Y.Z.; data curation, Z.C., A.X., T.Q., J.C., X.C. and Y.Z.; writing—original draft preparation, Z.C., A.X., T.Q., J.C., X.C. and Y.Z.; writing—review and editing, Z.C., A.X., T.Q., J.C., X.C. and Y.Z.; visualization, Z.C., A.X., T.Q., J.C., X.C. and Y.Z.; supervision, Z.C. and J.C.; project administration, Z.C. and J.C.; funding acquisition, Z.C. and J.C. All authors have read and agreed to the published version of the manuscript.
Funding
The work was supported by the Innovation Driven Development Special Project for the Guangxi Science and Technology Program: Construction of China-ASEAN International Joint Laboratory for Comprehensive Transportation (Phase I) (No. GK AA21077011), by the Jiangsu Provincial Social Science Foundation Project (25ZHB022), by the 2025 Nantong Natural Science Foundation and the Social and Livelihood Science and Technology Program (MS2025007), and by the Postgraduate Research & Practice Innovation Program of Jiangsu Province (SJCX25_2056).
Data Availability Statement
Data are contained within the article.
Acknowledgments
During the preparation of this manuscript, the authors used ChatGPT (OpenAI, GPT-5.5) to improve the clarity, grammar, and academic expression of the manuscript. The authors carefully reviewed and edited all AI-generated suggestions and take full responsibility for the content of this publication.
Conflicts of Interest
The authors declare no conflicts of interest.
Appendix A
Energy-System Parameters
A 5000-DWT hybrid container vessel is used as the study object. The rated power of its main diesel engine is 4000 kW; the peak rating of the on-board PV system is about 300 kW; the battery storage system has a capacity of 2000 kWh and a maximum charging/discharging power of 500 kW; and the shore-power interface has a maximum input of 1000 kW. The full set of coefficients used by the two-stage robust optimization model is summarized in Table A1, grouped by vessel basic parameters, battery storage, PV generation, shore power, and cost/penalty coefficients.
The battery capacity of 2000 kWh combined with a maximum charge/discharge of 500 kW covers 10–15% of the propulsion power fluctuation range, and the round-trip efficiency of 0.95 is consistent with typical lithium-ion characteristics. The safe SOC band [0.1, 0.9] prevents over-charging and over-discharging, while the target SOC band [0.3, 0.8] preserves a ±0.1 buffer for robust optimization, accommodating PV fluctuations and feeder delays. The battery degradation cost coefficient of 0.5 RMB/kWh is derived from a cycle life of about 5000 cycles and converted from purchase cost, translating device wear into an economic indicator.
The PV peak power of 300 kW, the deployed area of 2000 m2, and the conversion efficiency of 18% are baseline values under standard test conditions. Three typical weather profiles—sunny, cloudy and overcast—respectively simulate clean-energy availability. The ±20% output fluctuation range is calibrated to historical irradiance statistics and is used to build the PV uncertainty set.
The shore-power maximum input of 1000 kW satisfies the charging demand during berthing. The ramp-rate limits at feeder and hub ports are set to 100 kW/min and 300 kW/min, respectively, reflecting the different load-bearing capacities of port grids of different scales. The shore-power time-of-use tariff incentivizes charging during the off-peak hours (00:00–06:00) to reduce operating costs; the off-peak rate 0.2 RMB/kWh and the peak rate 0.5 RMB/kWh follow typical domestic port tariffs. In the cost/penalty group, the fuel-cost coefficient 0.8 RMB/kWh is converted by energy, the delay-penalty coefficient 1000 RMB/h quantifies the economic loss of exceeding the planned arrival time, and the O&M coefficient 0.05 RMB/kWh is a weighted average across all sources covering routine maintenance. These parameters serve as inputs to the two-stage robust optimization model and are scaled proportionally for the small, medium and large cases.
Table A1.
Parameters of the two-stage robust optimization model.
References
- UNCTAD. Review of Maritime Transport 2024; United Nations Conference on Trade and Development: Geneva, Switzerland, 2024. [Google Scholar]
- Brouer, B.D.; Karsten, C.V.; Pisinger, D. Optimization in liner shipping. 4OR 2017, 15, 1–35. [Google Scholar] [CrossRef] [Scilit]
- Christiansen, M.; Hellsten, E.; Pisinger, D.; Sacramento, D.; Vilhelmsen, C. Liner shipping network design. Eur. J. Oper. Res. 2020, 286, 1–20. [Google Scholar] [CrossRef] [Scilit]
- Wang, H.; Yan, R.; Wang, S.; Zhen, L. Innovative approaches to addressing the tradeoff between interpretability and accuracy in ship fuel consumption prediction. Transp. Res. Part C Emerg. Technol. 2023, 157, 104361. [Google Scholar] [CrossRef] [Scilit]
- International Maritime Organization (IMO). Fourth Imo Ghg Study 2020; International Maritime Organization: London, UK, 2020. [Google Scholar]
- International Maritime Organization (IMO). 2023 Imo Strategy on Reduction of Ghg Emissions from Ships, Resolution mepc.377(80); International Maritime Organization: London, UK, 2023. [Google Scholar]
- International Maritime Organization (IMO). Imo approves net-zero regulations for global shipping. In Marine Environment Protection Committee MEPC 83 Press Briefing, 7–11 April; International Maritime Organization: London, UK, 2025. [Google Scholar]
- HGK Shipping. Blue Marlin: World’s First Hybrid Solar-Powered Inland Shipping Vessel Begins Operations. In Maritime Executive; HGK Shipping: Cologne, Germany, 2025. [Google Scholar]
- Fagerholt, K.; Laporte, G.; Norstad, I. Reducing fuel emissions by optimizing speed on shipping routes. J. Oper. Res. Soc. 2010, 61, 523–529. [Google Scholar] [CrossRef] [Scilit]
- Psaraftis, H.N.; Kontovas, C.A. Speed models for energy-efficient maritime transportation: A taxonomy and survey. Transp. Res. Part C Emerg. Technol. 2013, 26, 331–351. [Google Scholar] [CrossRef] [Scilit]
- Plum, C.E.M.; Pisinger, D.; Sigurd, M.M. A service flow model for the liner shipping network design problem. Eur. J. Oper. Res. 2014, 235, 378–386. [Google Scholar] [CrossRef] [Scilit]
- Geertsma, R.D.; Negenborn, R.R.; Visser, K.; Hopman, J.J. Design and control of hybrid power and propulsion systems for smart ships: A review of developments. Appl. Energy 2017, 194, 30–54. [Google Scholar] [CrossRef] [Scilit]
- Luo, X.; Wang, J.; Wang, X.; Cheng, J.; Han, Y. Two-stage optimization of route, speed, and energy management for hybrid energy ship under sea conditions. iEnergy 2025, 4, 174–192. [Google Scholar] [CrossRef] [Scilit]
- Notteboom, T.; Pallis, A.; Rodrigue, J.P. Port Economics, Management and Policy, 2nd ed.; Routledge: London, UK, 2022. [Google Scholar]
- Zhang, K.; Wang, Y.; Chen, Z. A Multi-Attribute Decision-Making Approach for International Shipping Operator Selection Based on Single-Valued Neutrosophic Power Hamy Mean Operators. Symmetry 2024, 16, 706. [Google Scholar] [CrossRef] [Scilit]
- Ma, K.; Feng, Y.; Yang, J.; Cai, Y.; Yang, B.; Guan, X. Two-stage distributionally robust optimization for port integrated energy system with berth allocation under uncertainties. Energy 2025, 322, 135602. [Google Scholar] [CrossRef] [Scilit]
- Tian, Z.; Jiang, H.; Qiu, Y.; Yuan, C. Optimal sizing of energy storage system for marine photovoltaic systems with MP-DPC: A case study. Results Eng. 2026, 29, 109327. [Google Scholar] [CrossRef] [Scilit]
- Stroe, D.I.; Knap, V.; Swierczynski, M.; Stroe, A.I.; Teodorescu, R. Operation of a grid-connected lithium-ion battery energy storage system for primary frequency regulation: A battery lifetime perspective. IEEE Trans. Ind. Appl. 2017, 53, 430–438. [Google Scholar] [CrossRef] [Scilit]
- Zeng, B.; Zhao, L. Solving two-stage robust optimization problems using a column-and-constraint generation method. Oper. Res. Lett. 2013, 41, 457–461. [Google Scholar] [CrossRef] [Scilit]
- Yang, J.; Zhang, Z.; Ma, K.; Yang, K.; Guo, S.; Li, H. A multi-ship power sharing strategy: Using two-stage robust optimization and Shapley value approach. Renew. Energy 2024, 232, 121046. [Google Scholar] [CrossRef] [Scilit]
- Bertsimas, D.; Sim, M. The price of robustness. Oper. Res. 2004, 52, 35–53. [Google Scholar] [CrossRef] [Scilit]
- Wang, J.; Shao, Y.; Jiang, H.; An, Y. A multi-variable hybrid system for port container throughput deterministic and uncertain forecasting. Expert Syst. Appl. 2024, 237, 121546. [Google Scholar] [CrossRef] [Scilit]
- Benders, J.F. Partitioning procedures for solving mixed-variables programming problems. Numer. Math. 1962, 4, 238–252. [Google Scholar] [CrossRef] [Scilit]
- Rahmaniani, R.; Crainic, T.G.; Gendreau, M.; Rei, W. The Benders decomposition algorithm: A literature review. Eur. J. Oper. Res. 2017, 259, 801–817. [Google Scholar] [CrossRef] [Scilit]
- Guericke, S.; Tierney, K. Liner shipping cargo allocation with service levels and speed optimization. Transp. Res. Part E Logist. Transp. Rev. 2015, 84, 40–60. [Google Scholar] [CrossRef] [Scilit]
- Karsten, C.V.; Pisinger, D.; Ropke, S.; Brouer, B.D. The time-constrained multi-commodity network flow problem and its application to liner shipping network design. Transp. Res. Part E Logist. Transp. Rev. 2015, 76, 122–138. [Google Scholar] [CrossRef] [Scilit]
- Du, J.; Wu, N.; Zhao, X.; Wang, J.; Guo, L. Container liner shipping schedule optimization with shipper selection behavior considered. Marit. Policy Manag. 2024, 51, 1385–1409. [Google Scholar]
- Tamburini, A.; Lange, N.; Pisinger, D. A rich model for the tramp ship routing and scheduling problem—Solved through column generation. Transp. Res. Part E Logist. Transp. Rev. 2025, 198, 104019. [Google Scholar] [CrossRef] [Scilit]
- Chen, J.; Ye, J.; Liu, A.; Fei, Y.; Wan, Z.; Huang, X. Robust optimization of liner shipping alliance fleet scheduling with consideration of sulfur emission restrictions and slot exchange. Ann. Oper. Res. 2024, 343, 1013–1043. [Google Scholar] [CrossRef] [Scilit]
- Elmi, Z.; Li, B.; Liang, B.; Lau, Y.Y.; Borowska-Stefańska, M.; Wiśniewski, S.; Dulebenets, M.A. An epsilon-constraint-based exact multi-objective optimization approach for the ship schedule recovery problem in liner shipping. Comput. Ind. Eng. 2023, 183, 109472. [Google Scholar] [CrossRef] [Scilit]
- Liu, Y.; Pang, K.W.; Jin, Y.; Wang, S.; Zhen, L. Optimizing vessel scheduling in ports: An integer programming approach to mitigating extreme weather impacts. Comput. Ind. Eng. 2025, 205, 111134. [Google Scholar] [CrossRef] [Scilit]
- Li, M.; Xie, C.; Li, X.; Karoonsoontawong, A.; Ge, Y.E. Robust liner ship routing and scheduling schemes under uncertain weather and ocean conditions. Transp. Res. Part C Emerg. Technol. 2022, 137, 103593. [Google Scholar] [CrossRef] [Scilit]
- Mahmoodi, K.; Boling, J.; Vettor, R. Ensemble-based ship weather multi-objective route optimization. J. Ind. Inf. Integr. 2026, 50, 101075. [Google Scholar] [CrossRef] [Scilit]
- Golsefidi, M.M.; Sharifi, M.A.; Ghader, S. Containerships routing problem: Incorporating uncertain weather impact on fuel consumption by considering speed optimization. Ocean Eng. 2025, 340, 122410. [Google Scholar] [CrossRef] [Scilit]
- He, P.; Wu, L.; Jin, J.; Zhou, S.; Schulte, F. Distributionally robust optimization of sailing speed, bunkering, and fuel switching for dual-fuel liner services. Transp. Res. Part C Emerg. Technol. 2026, 184, 105528. [Google Scholar] [CrossRef] [Scilit]
- Inal, O.B.; Charpentier, J.F.; Deniz, C. Hybrid power and propulsion systems for ships: Current status and future challenges. Renew. Sustain. Energy Rev. 2022, 156, 111965. [Google Scholar] [CrossRef] [Scilit]
- Kasaeian, A.; Zarkhah, N.; Dezfouli, P.A.; Samankan, S.; Yan, W. A review of the applications of solar photovoltaic in marine vessels and ships. Appl. Therm. Eng. 2025, 396, 126178. [Google Scholar] [CrossRef] [Scilit]
- Yang, Q.; Zhang, S.; Zhao, W.; Tao, J.; Lu, X.; Meng, C.; Zhao, Y.; Zhang, H.; Zhao, G.; Jiang, C.; et al. A two-stage energy management strategy for hybrid ship power systems considering the dynamic output characteristics of batteries. Appl. Energy 2025, 396, 126232. [Google Scholar] [CrossRef] [Scilit]
- Wang, C.; Huang, L.; Ma, R.; Wang, K.; Sheng, J.; Ruan, Z.; Hua, Y.; Zhang, R. A novel cooperative optimization method of course and speed for wing-diesel hybrid ship based on improved A* algorithm. Ocean Eng. 2024, 302, 117669. [Google Scholar] [CrossRef] [Scilit]
- Lan, T.; Huang, L.; Ma, R.; Wang, K.; Sheng, J.; Ruan, Z.; Hua, Y.; Zhang, R. A novel method of fuel consumption prediction for wing-diesel hybrid ships based on high-dimensional feature selection and improved blending ensemble learning method. Ocean Eng. 2024, 307, 118156. [Google Scholar] [CrossRef] [Scilit]
- Zhang, Q.; Bao, C.; Han, P. Towards intelligent energy management in hybrid ships: Predicting and optimizing solar, wind, and diesel energy. Ocean Eng. 2025, 339, 122092. [Google Scholar] [CrossRef] [Scilit]
- Zhang, H.; Yu, Q.; Liu, Y.; Jiang, J.; Chen, H.; Liu, R. A novel optimal dispatch strategy for hybrid energy ship power system based on the improved NSGA-II algorithm. Electr. Power Syst. Res. 2024, 231, 110369. [Google Scholar] [CrossRef] [Scilit]
- Ksciuk, J.; Kuhlemann, S.; Tierney, K.; Koberstein, A. Uncertainty in maritime ship routing and scheduling: A literature review. Eur. J. Oper. Res. 2023, 308, 499–524. [Google Scholar] [CrossRef] [Scilit]
- Rahimian, H.; Mehrotra, S. Frameworks and results in distributionally robust optimization. Open J. Math. Optim. 2022, 3, 1–85. [Google Scholar] [CrossRef] [Scilit]
- Zhao, L.; Zeng, B. An Exact Algorithm for Two-Stage Robust Optimization with Mixed Integer Recourse Problems. University of South Florida, 2012. Available online: http://www.optimization-online.org/DB_FILE/2012/01/3310.pdf (accessed on 2 October 2018).
- Mohajerin Esfahani, P.; Kuhn, D. Data-driven distributionally robust optimization using the Wasserstein metric: Performance guarantees and tractable reformulations. Math. Program. 2018, 171, 115–166. [Google Scholar] [CrossRef] [Scilit]
- Zhao, S.; Yang, H.; Zheng, J. A two-step approach for deploying heterogeneous vessels and designing reliable schedule in liner shipping services. Transp. Res. Part E Logist. Transp. Rev. 2024, 182, 103416. [Google Scholar] [CrossRef] [Scilit]
- Cao, M.; Wang, K.; Wang, S. Vessel deployment with limited information: Distributionally robust chance-constrained models. Transp. Res. Part B Methodol. 2022, 161, 207–228. [Google Scholar] [CrossRef] [Scilit]
- Agra, A.; Rodrigues, F. Distributionally robust optimization for the berth allocation problem under uncertainty. Transp. Res. Part B Methodol. 2022, 164, 1–24. [Google Scholar] [CrossRef] [Scilit]
- Liu, C.; Wang, Z.; Yang, J.; Yang, R. A novel hybrid deep-learning framework for medium-term container throughput forecasting: An application to China’s Guangzhou, Qingdao and Shanghai hub ports. Marit. Econ. Logist. 2024, 26, 44–69. [Google Scholar] [CrossRef] [Scilit]
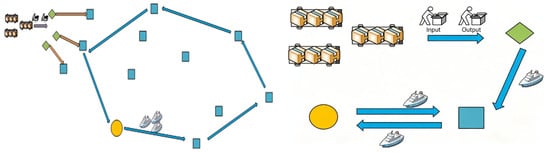
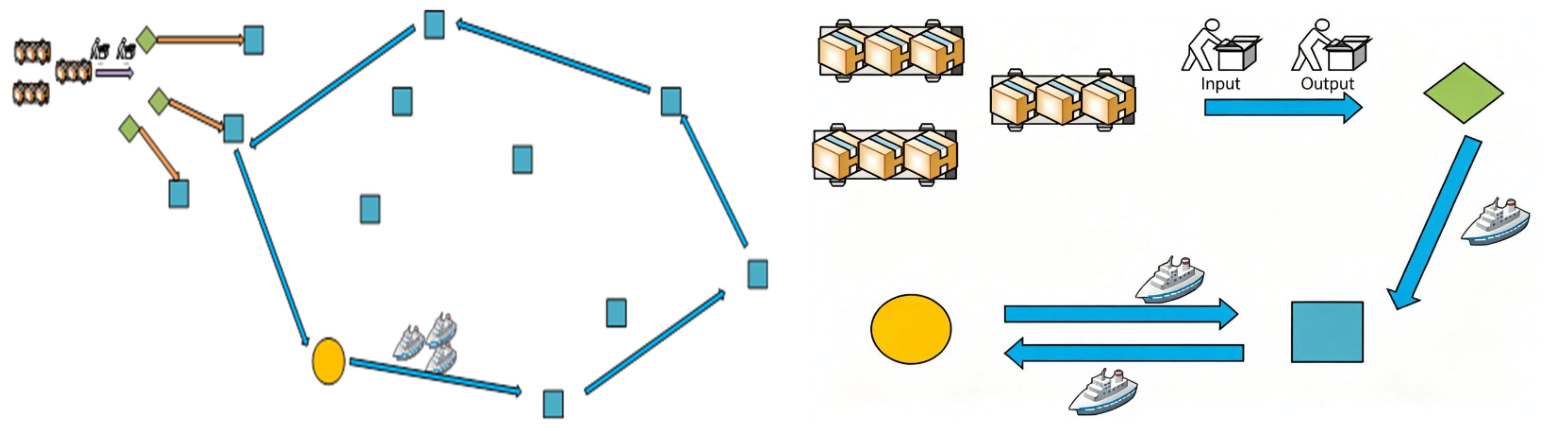
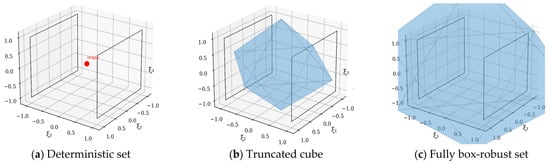
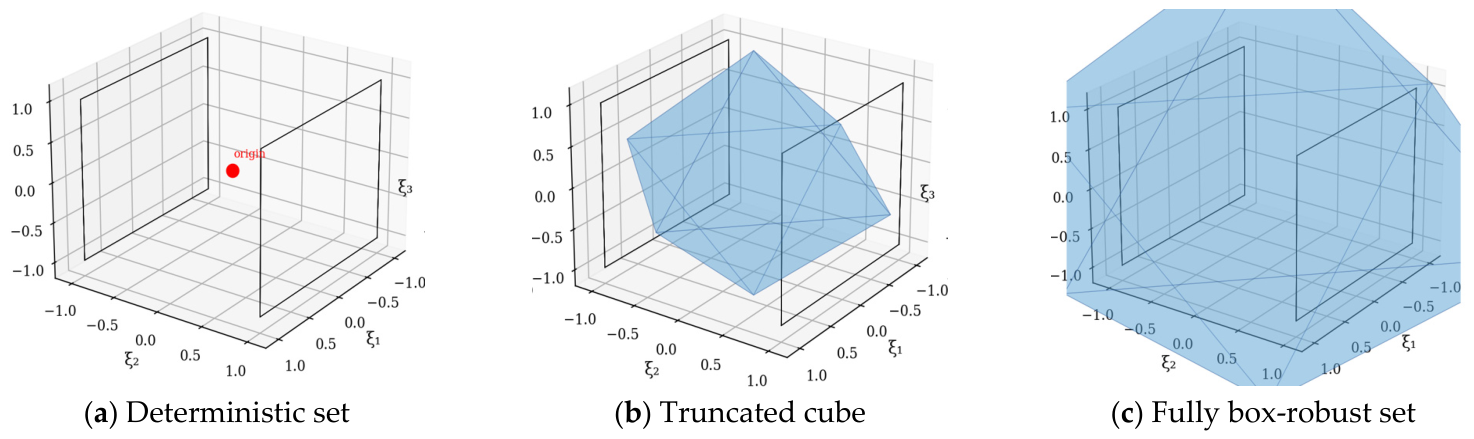
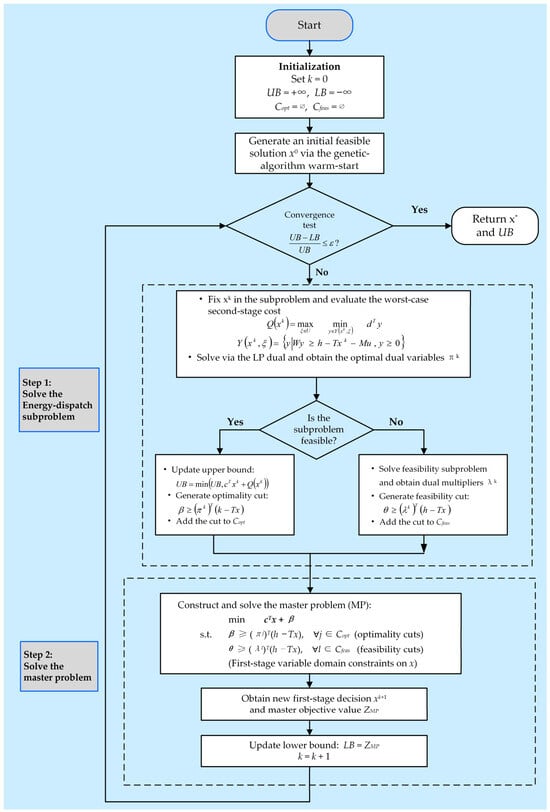
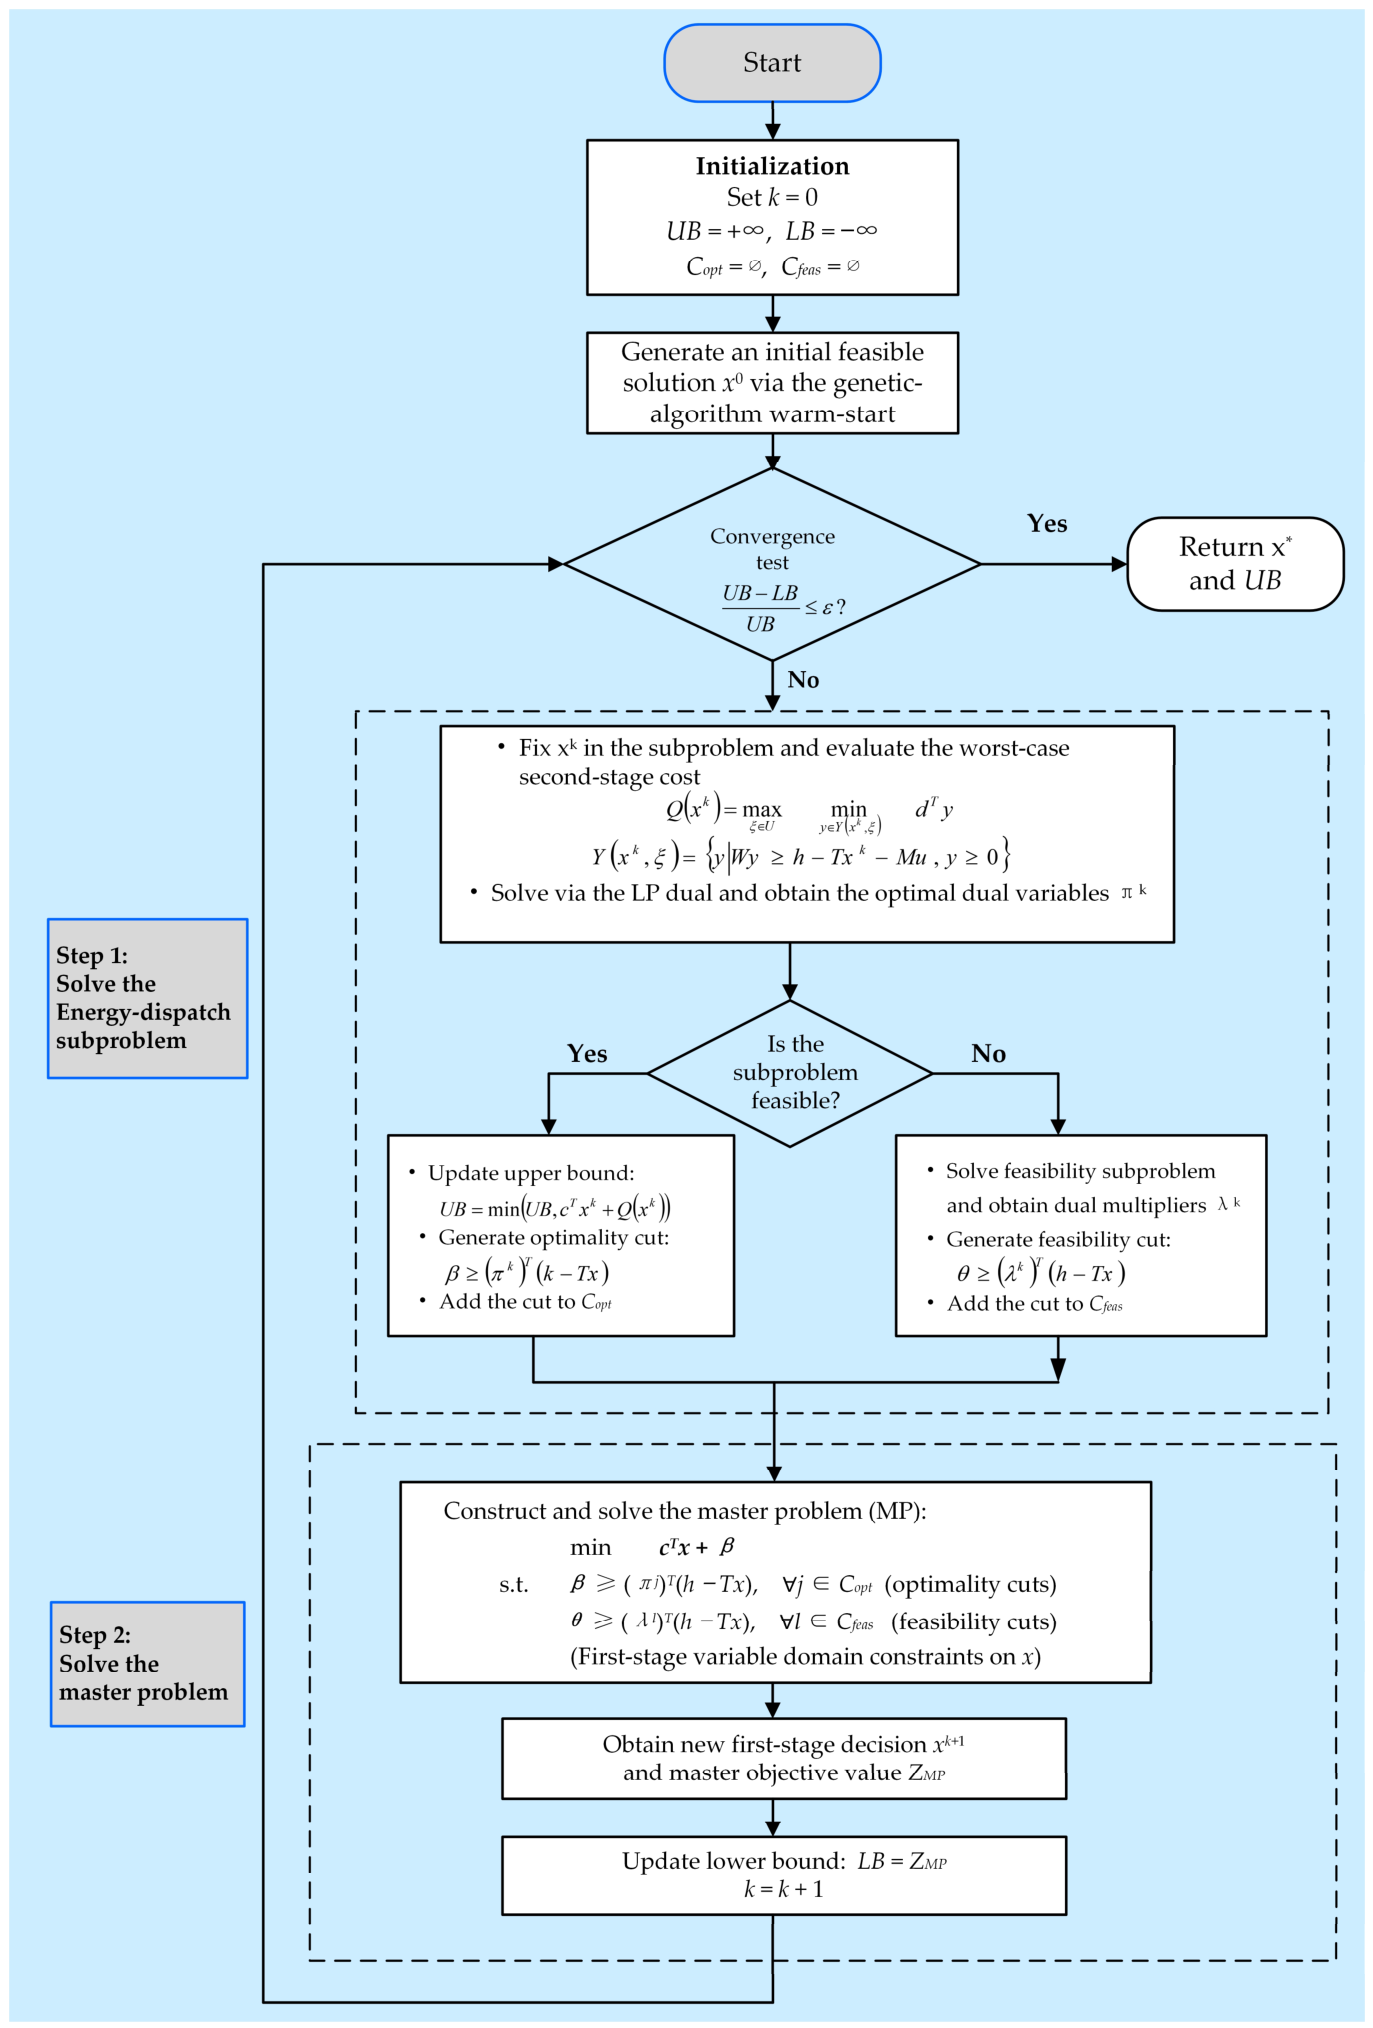
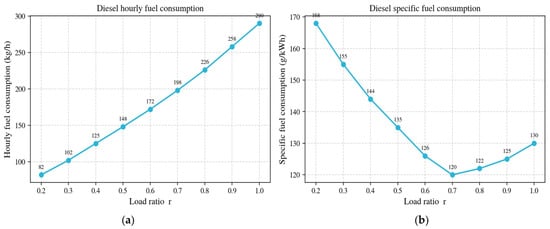
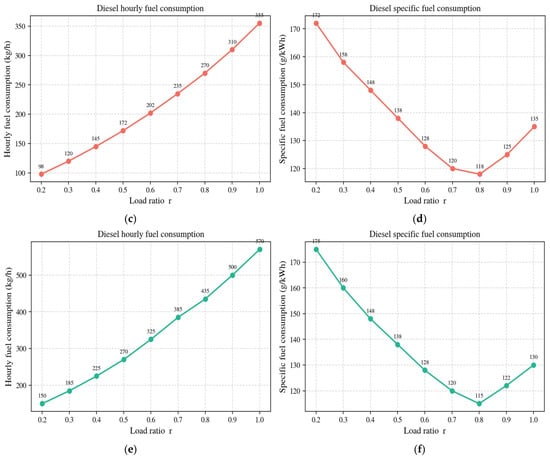
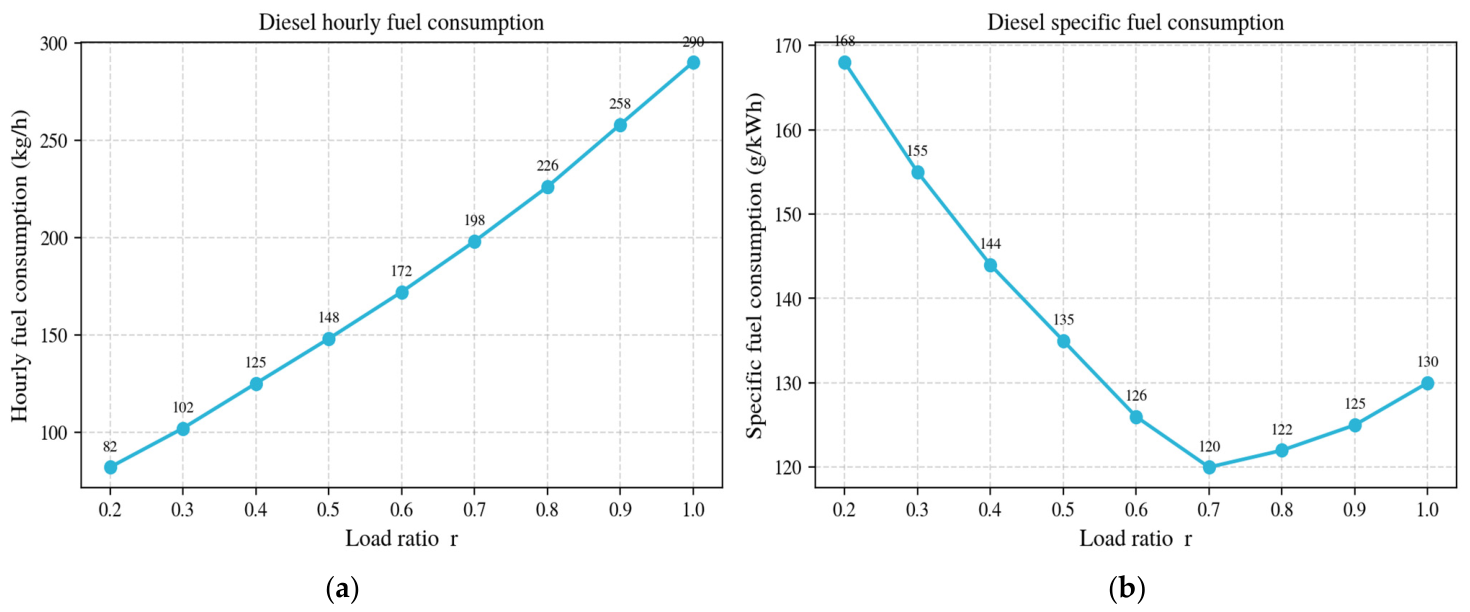
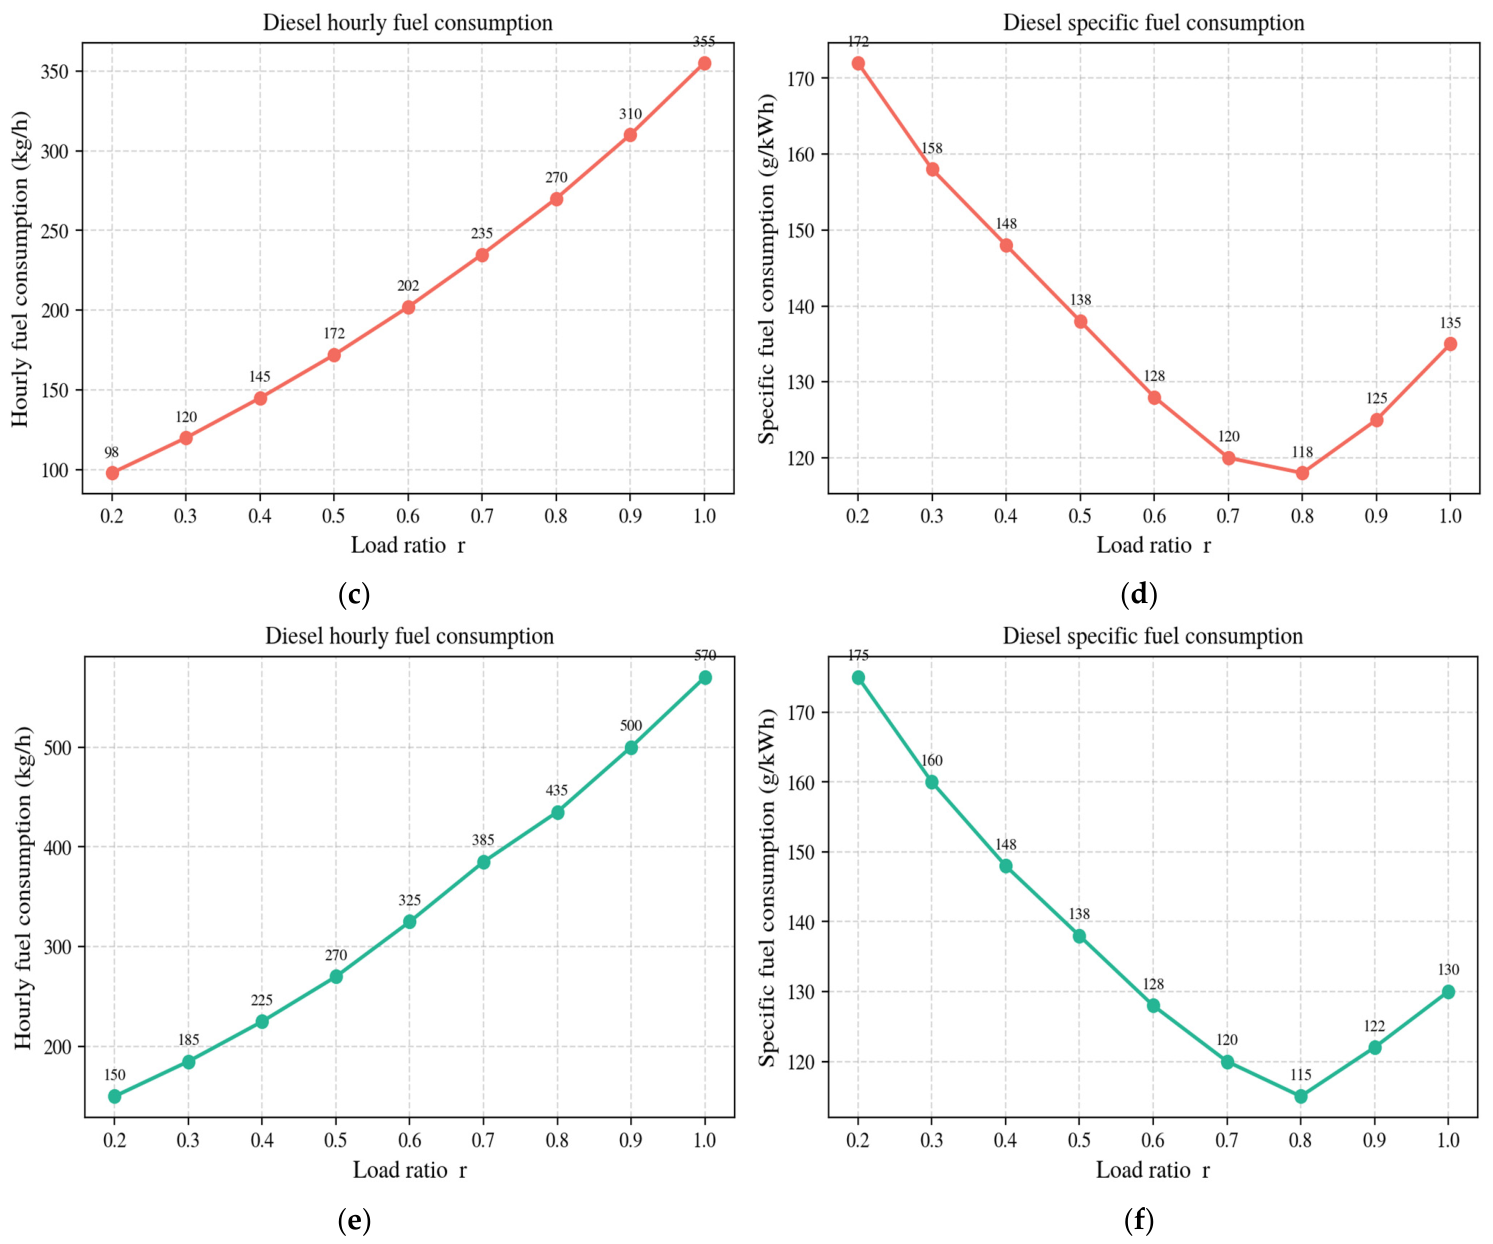
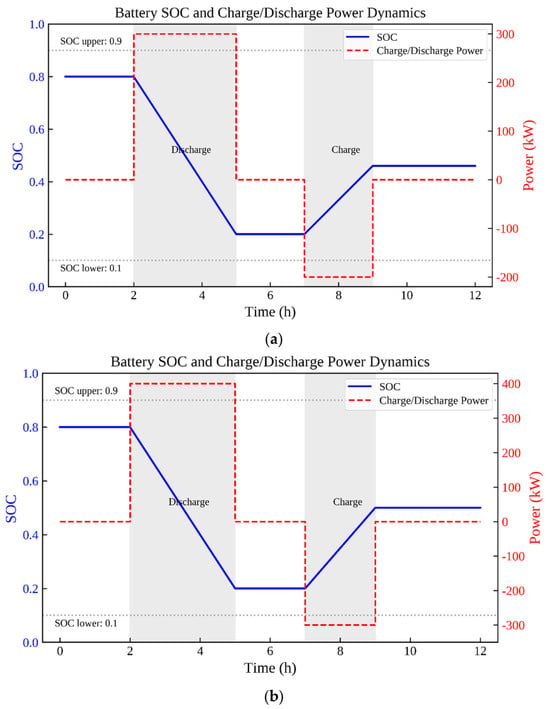
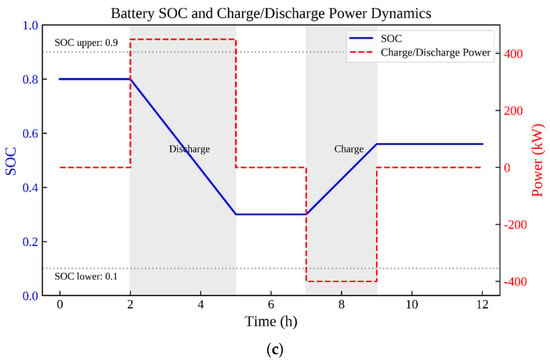
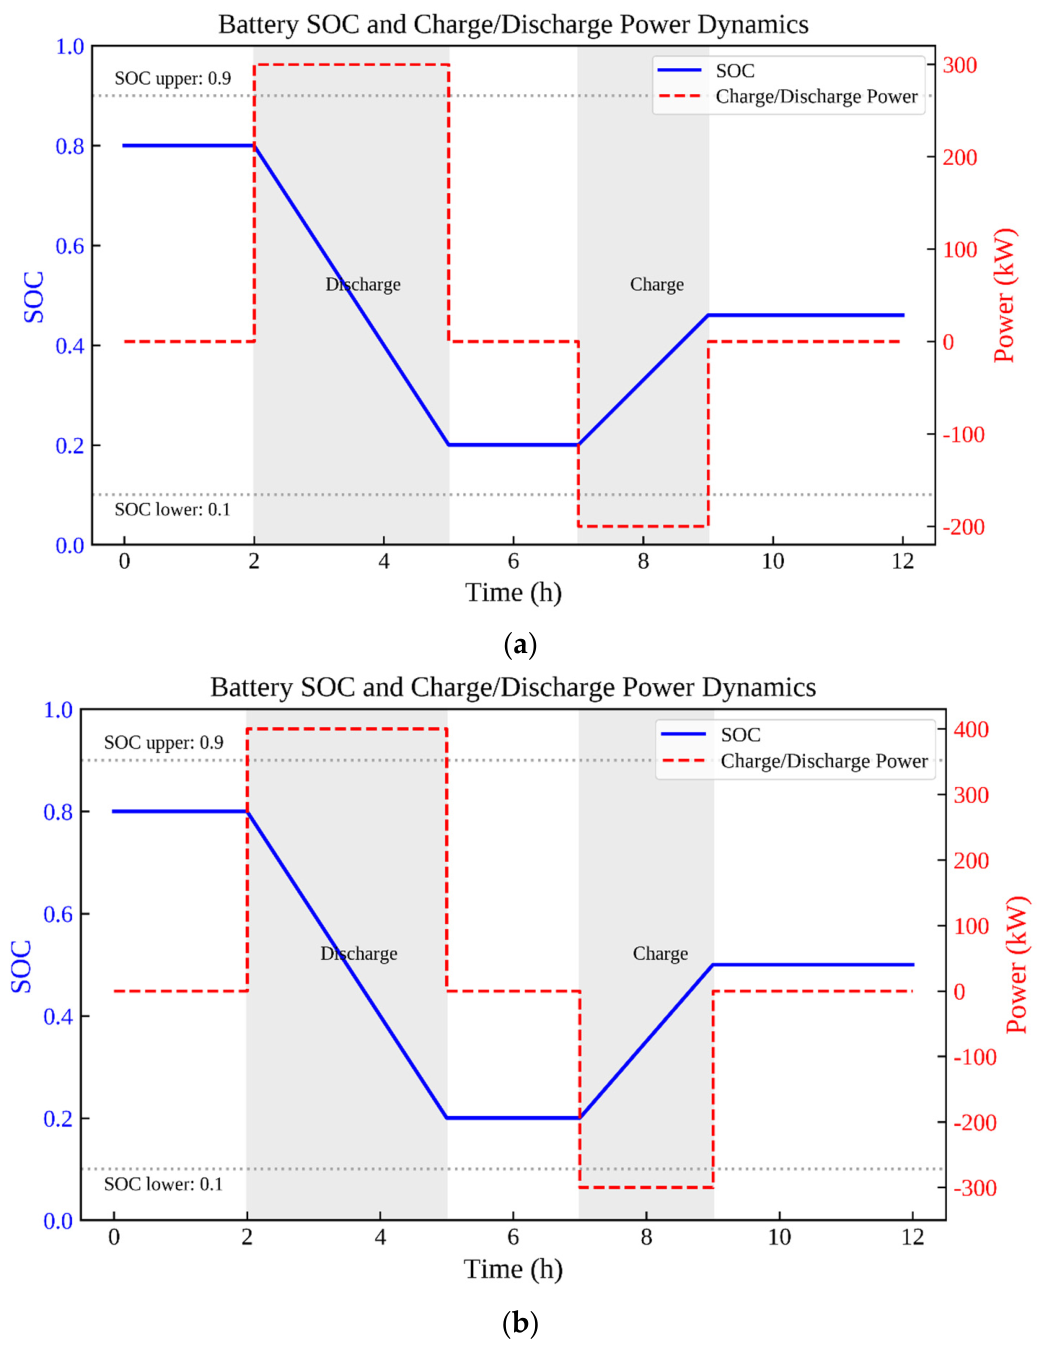
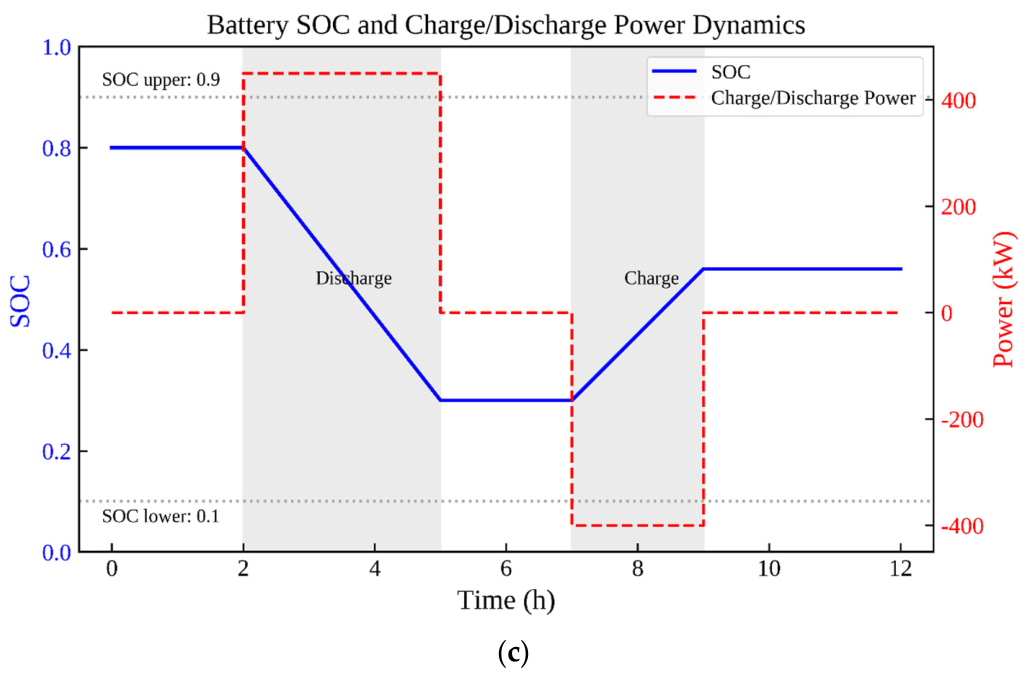
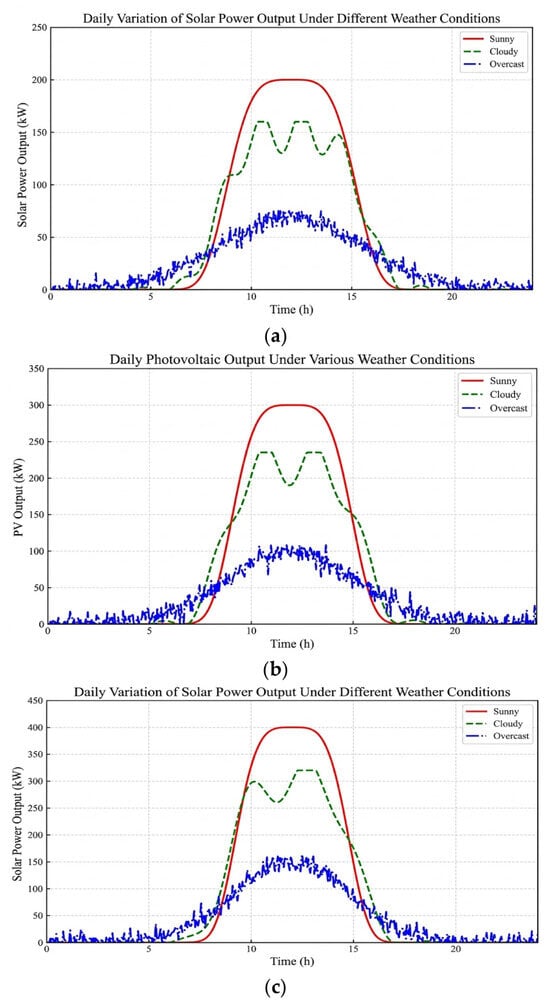
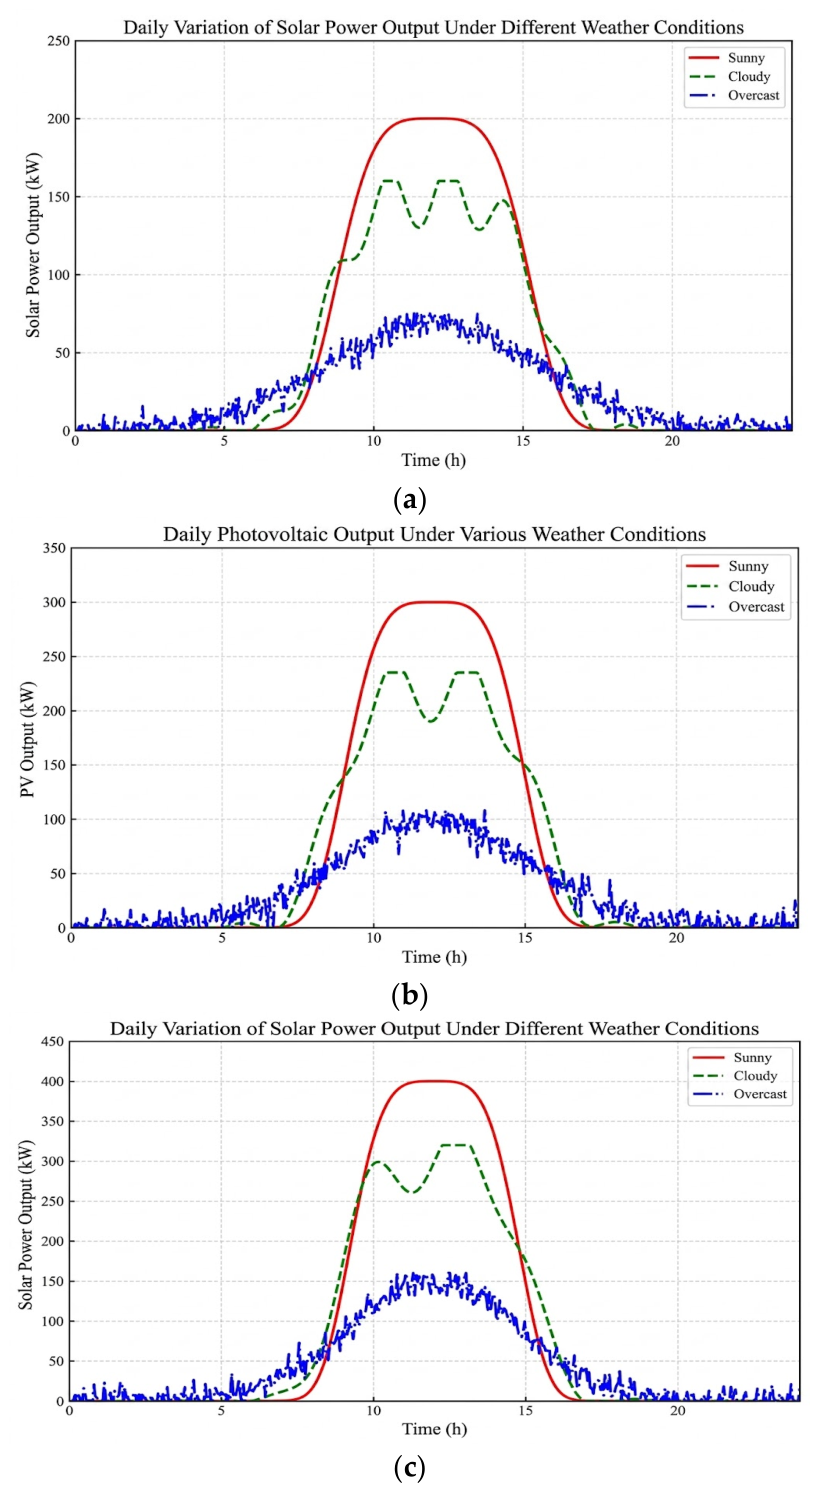
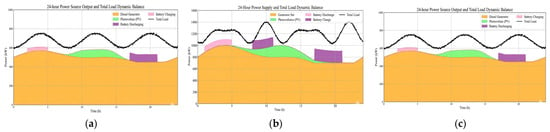
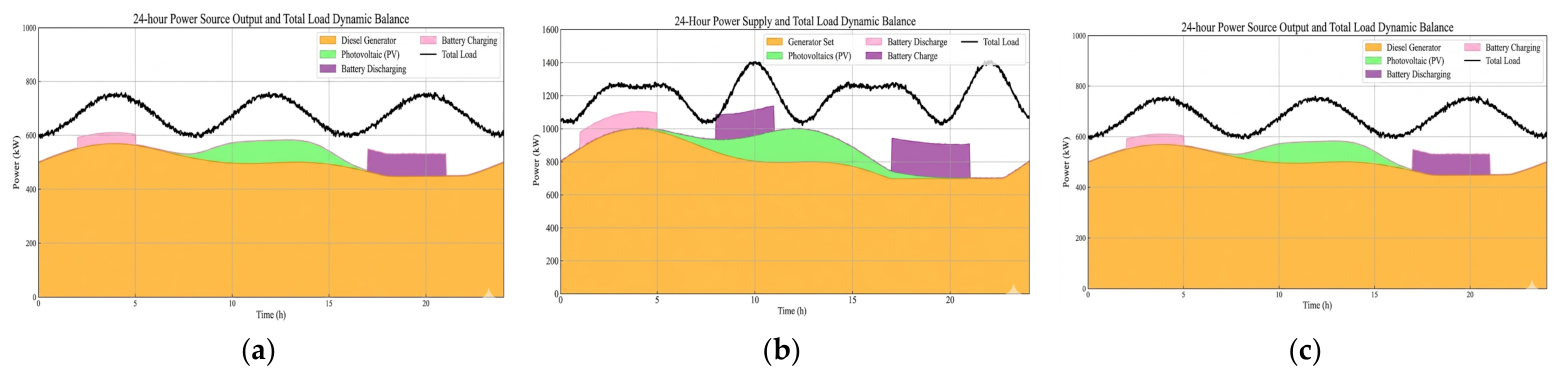
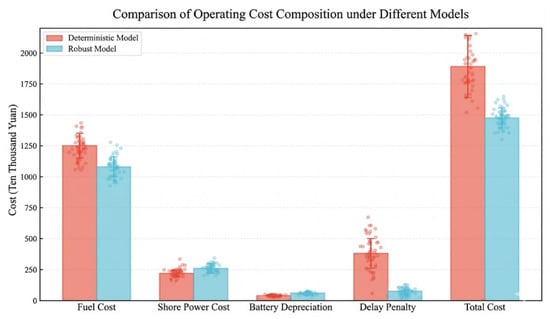
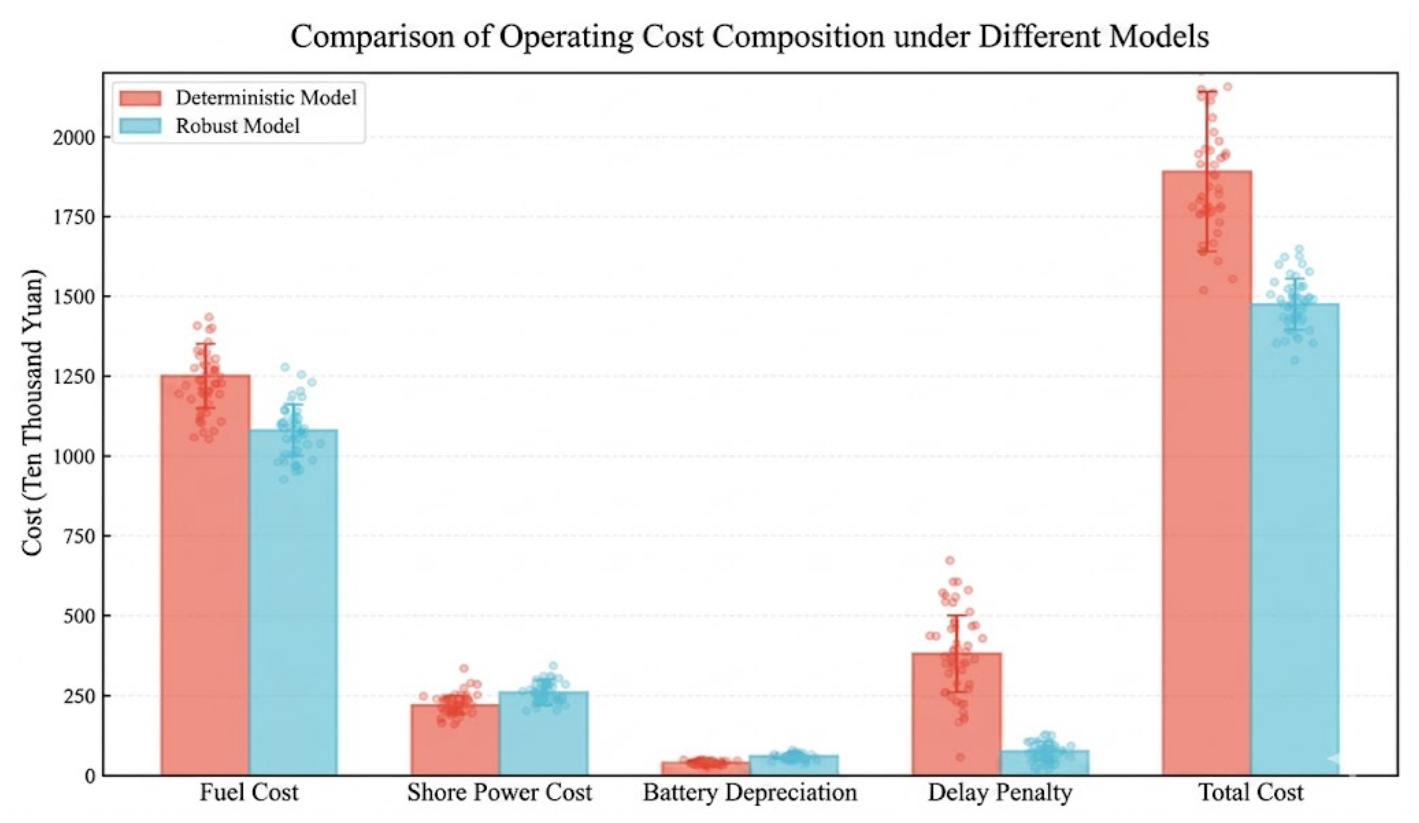
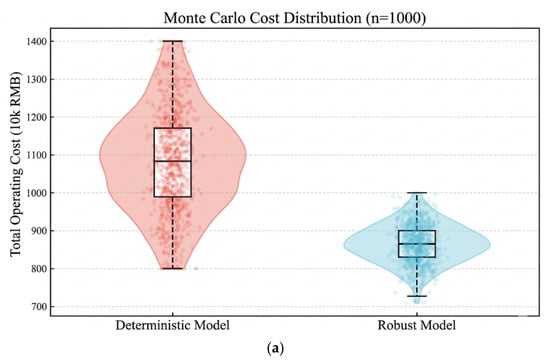
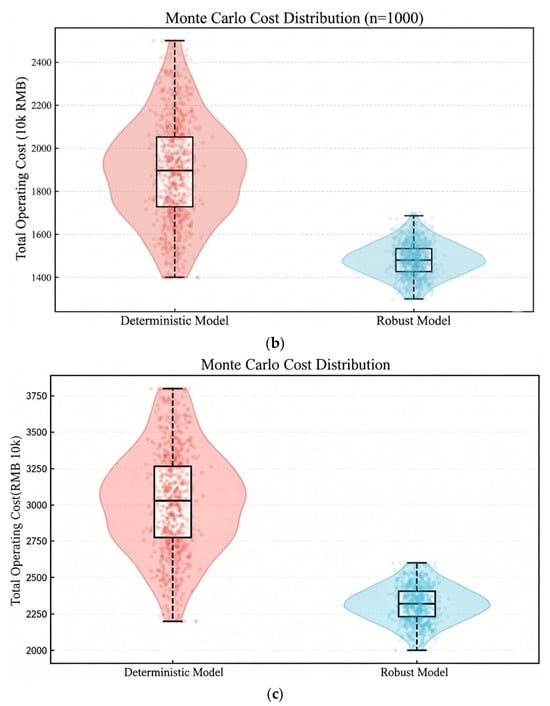
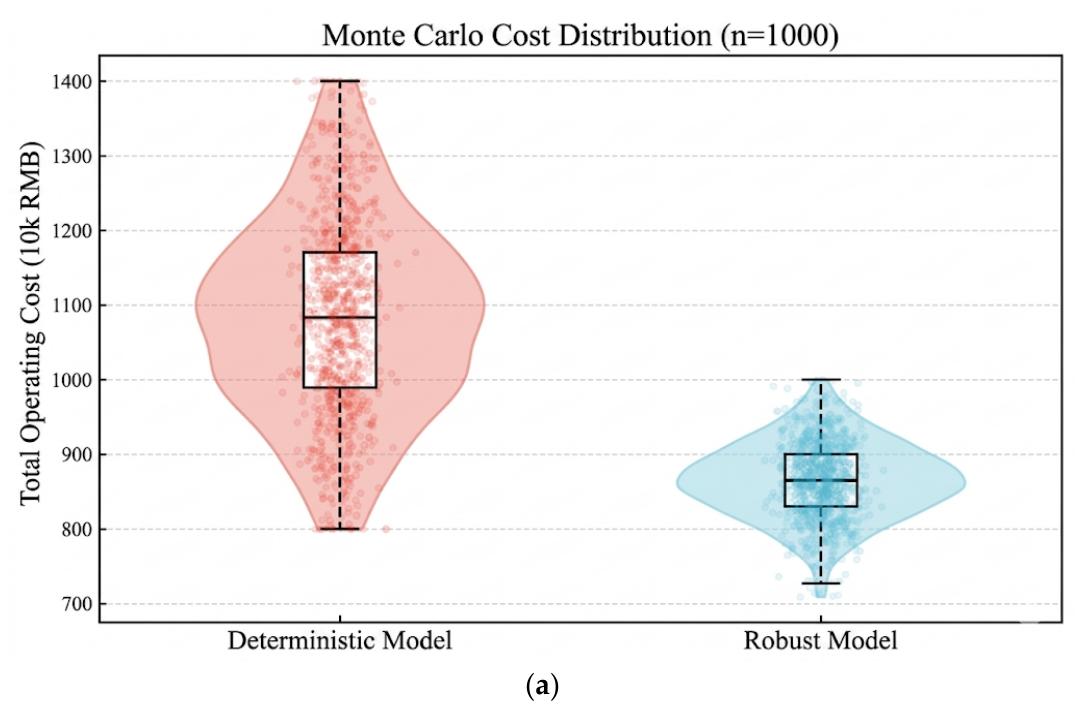
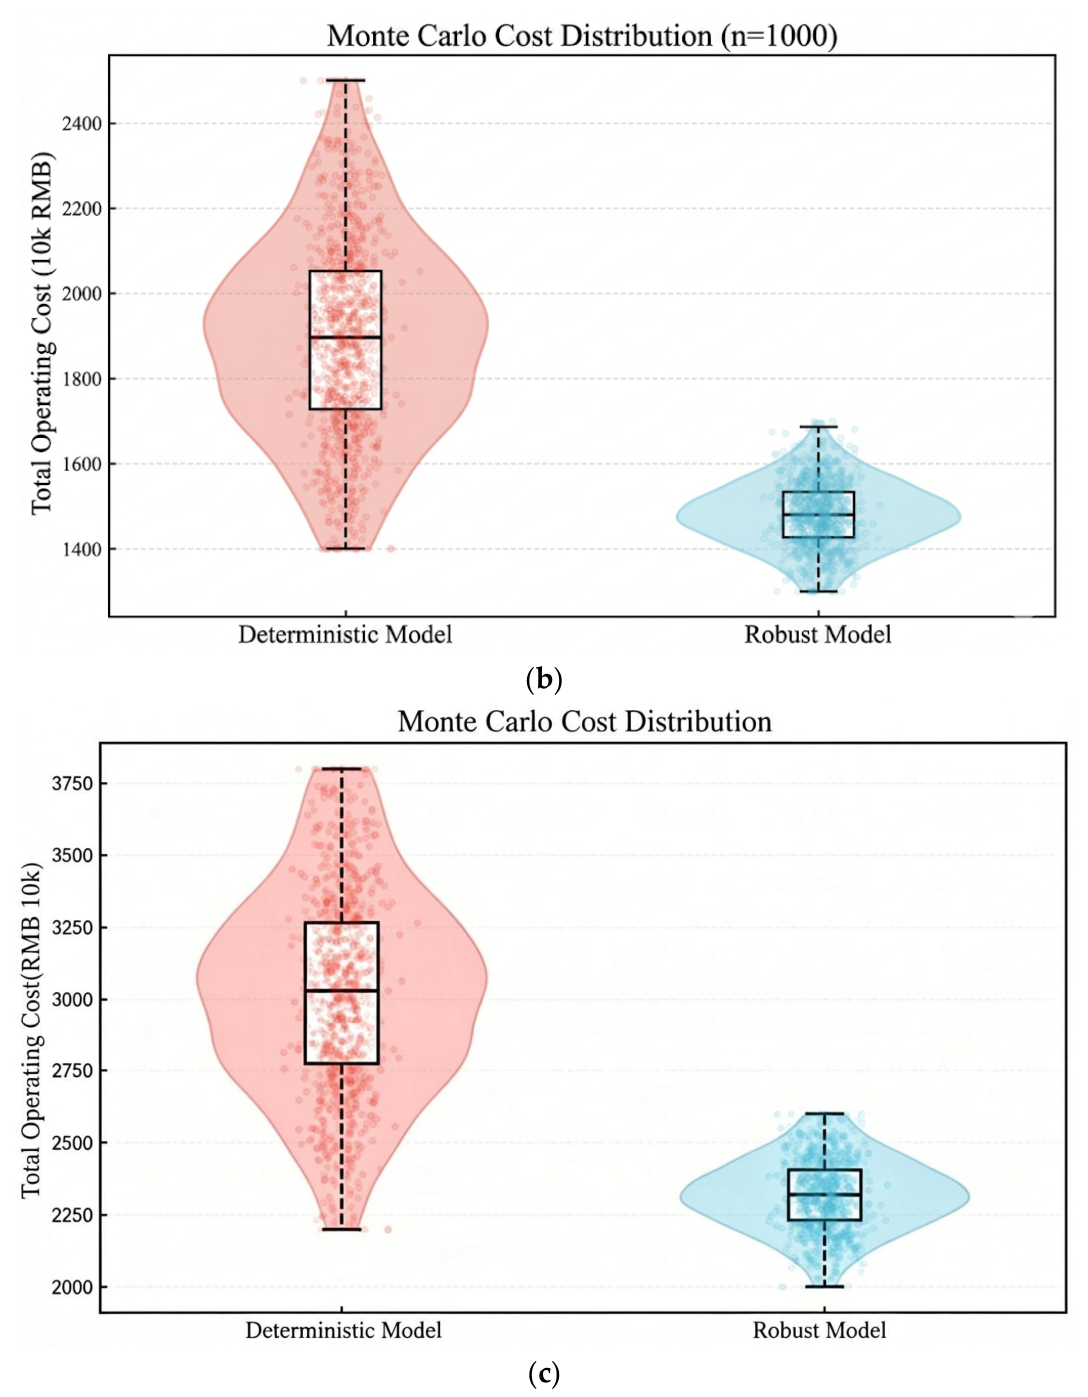
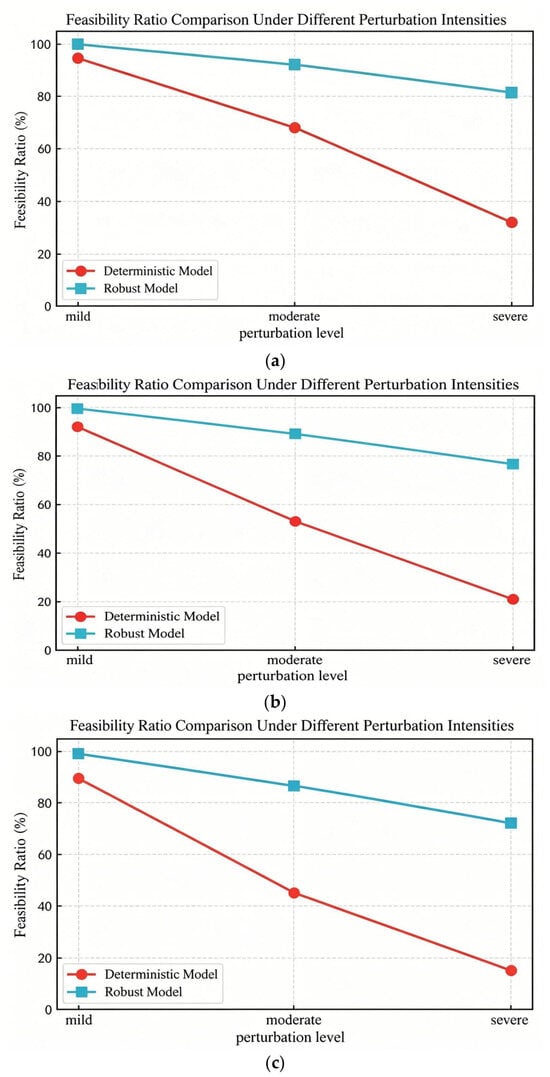
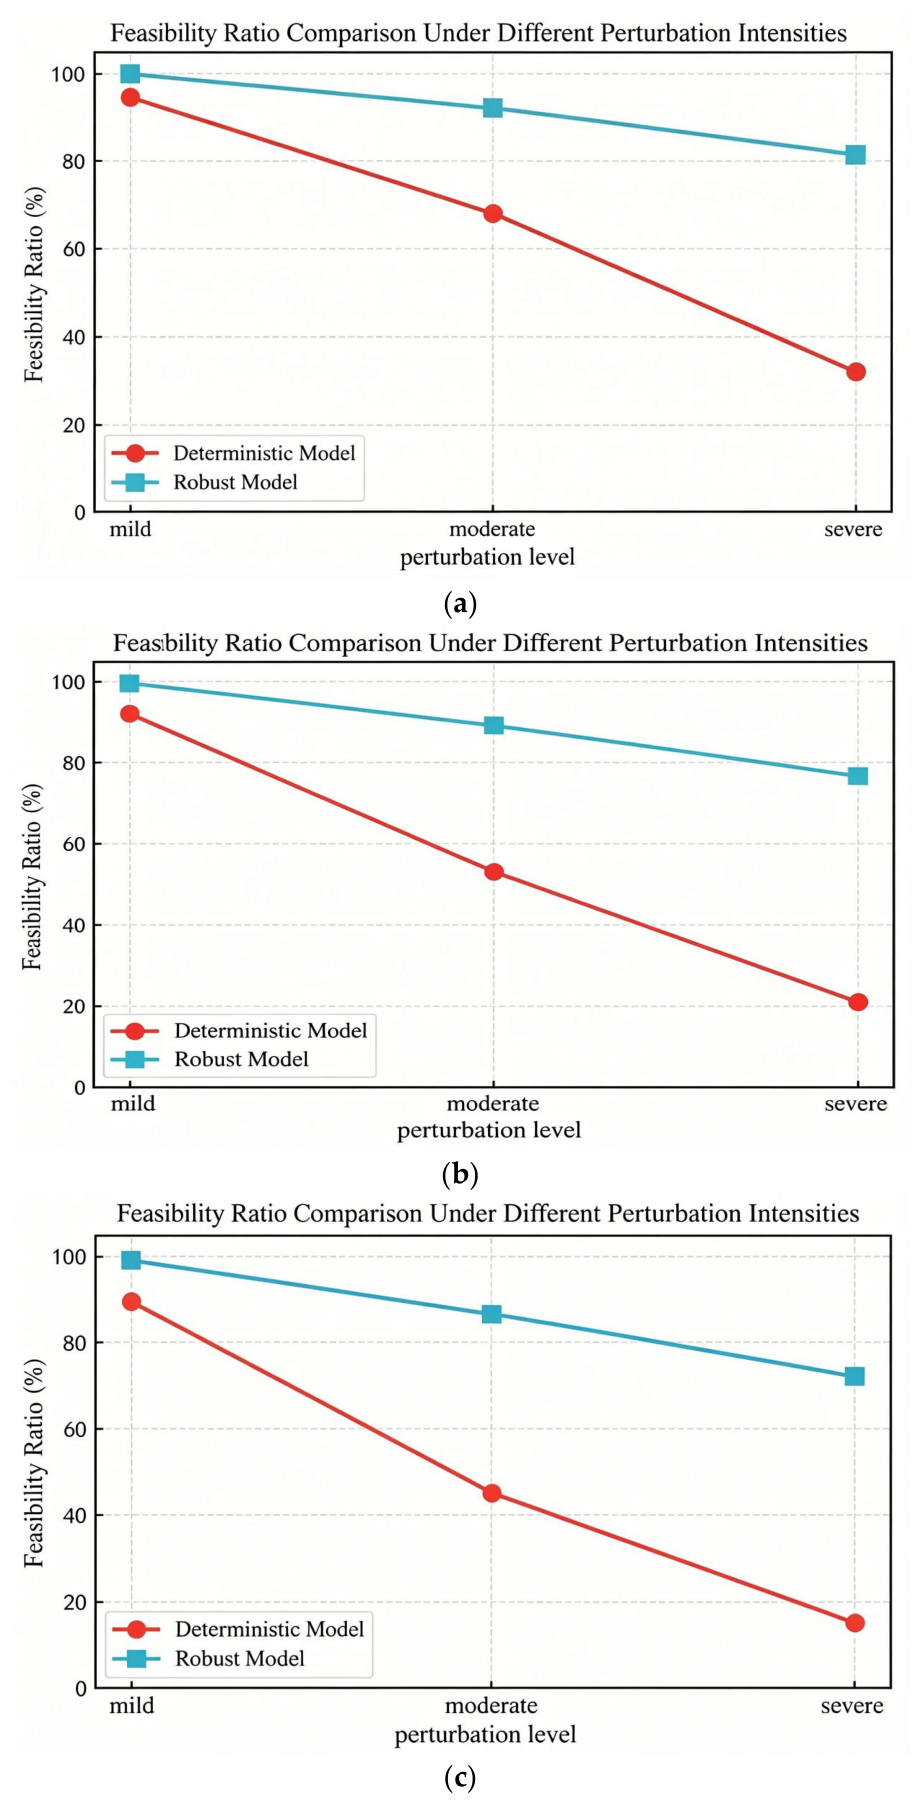

Disclaimer/Publisher’s Note: The statements, opinions and data contained in all publications are solely those of the individual author(s) and contributor(s) and not of MDPI and/or the editor(s). MDPI and/or the editor(s) disclaim responsibility for any injury to people or property resulting from any ideas, methods, instructions or products referred to in the content. |
© 2026 by the authors. Licensee MDPI, Basel, Switzerland. This article is an open access article distributed under the terms and conditions of the Creative Commons Attribution (CC BY) license.