


Abstract
Station Signal Layout Plans (SSLPs) are pivotal engineering drawings used in the design of railway signaling systems. Accurate recognition of such drawings is essential for enabling intelligent railway operations and supporting digital management. However, the inherent complexity of engineering drawings—characterized by diverse object categories and significant scale variations—substantially increases the difficulty of detection tasks. To address these challenges, this paper proposes an improved YOLOv8-based algorithm for rapid and accurate object detection. First, to enhance the detection of small objects in engineering drawings, a cross-scale attention mechanism is introduced into the mid-scale detection head. During prediction, this mechanism leverages fine-grained details from lower-level features to improve small-object detection. In addition, to suppress noise and blurred edges in drawings, the YOLOv8 neck network is enhanced with a DWRSeg-based design. This structure enlarges the receptive field while preserving local details, thereby effectively reducing the impact of noise on localization. To evaluate the proposed method, a complex dataset was constructed from station signal layout plans provided by a railway bureau, featuring substantial variations in target scale, diverse categories, and densely distributed objects. Experimental results demonstrate that, compared with YOLOv8n, the proposed DCS-YOLO model improves precision, recall, and mAP@0.5 by 3.1%, 0.8%, and 2.1%, respectively, while maintaining a comparable mAP@0.5:0.95. Comparative experiments with representative object detection methods demonstrate that the proposed algorithm achieves competitive detection accuracy and real-time performance for SSLP symbol recognition, providing a practical technical solution for the intelligent analysis of engineering drawings in the railway industry.
1. Introduction
Railway stations play a pivotal role in the railway network, serving as critical nodes in integrated transportation systems. As hubs for both passenger and freight services, their layout and operational processes significantly influence the overall efficiency and capacity of the railway network [1]. Station Signal Layout Plans (SSLPs) are indispensable throughout the construction, operation, and maintenance of stations. In the field of rail transit, these plans not only define the spatial and topological distribution of key equipment—including signals, turnouts, balises, and buffer stops—but also provide an essential basis for ensuring railway transportation safety and operational efficiency. With the ongoing digitalization and intelligent development of railway engineering, the digital delivery of SSLPs has become an inevitable trend for improving engineering management efficiency and operational safety. However, the automatic recognition of these plans still faces multiple challenges, including large drawing sizes, densely distributed equipment symbols, and complex backgrounds. At present, the verification and interpretation of such drawings still rely heavily on manual inspection, which is inherently subjective, prone to inconsistency and error, and has become a critical bottleneck restricting the timeliness and quality of engineering data management.
Research on the digitalization of engineering drawings has shown that traditional construction drawing review processes suffer from significant efficiency bottlenecks. Current practices still rely heavily on manual visual inspection, in which designers must interpret drawing content manually to perform equipment classification, quantity estimation, and bill-of-materials preparation [2,3,4]. With the advancement of digitalization and automation technologies, the extraction of information from engineering drawings has become increasingly important. Existing studies on the intelligent processing of engineering drawings have mainly focused on three technical pathways: reverse three-dimensional modeling based on two-dimensional drawings, semantic parsing algorithms for piping and instrumentation diagrams (P&IDs), and the development of cost estimation models and risk quantification systems for construction drawings [5,6,7,8,9].
In recent decades, artificial intelligence—particularly deep learning approaches such as convolutional neural networks—has achieved major breakthroughs in image recognition [10]. Numerous deep learning methods have also been applied to the analysis of large-scale technical drawings. For example, ref. [11] proposed a combined object detection and text detection approach for pattern recognition in complex, large-format technical drawings, while [12] employed a method that integrates deep learning-based object detection with OCR to automatically detect and recognize text of arbitrary size, position, and orientation in engineering drawings, thereby advancing the digital transformation of engineering documents. The digitalization of drawings also requires the application of digital image processing techniques across multiple stages, including preprocessing, symbol detection, classification, and, in some cases, inference of relationships among symbols [13]. Despite the progress made in applying deep learning to the automation of engineering drawing digitalization, several key challenges remain. Engineering drawings often contain complex backgrounds, overlapping symbols, and target information that is highly susceptible to noise interference [14]. Moreover, the lack of publicly available datasets continues to hinder progress in this field, posing a particular challenge to the digitalization and intelligent development of railway systems.
To address these challenges, this study constructs an SSLP dataset that incorporates complex background information and proposes an improved deep learning-based object detection method for automated recognition. The proposed approach not only enables accurate identification of equipment in SSLPs under complex conditions but also effectively overcomes the low efficiency and limited accuracy of traditional manual verification methods, thereby providing a feasible solution for the intelligent processing of railway drawings.
The main contributions of this study are summarized as follows:
- 1.
- For SSLPs with complex backgrounds, a dedicated dataset covering 20 typical categories of signal equipment symbols was constructed to support subsequent model training and performance evaluation.
- 2.
- To improve the feature representation capability and multi-scale adaptability of the baseline YOLOv8n model, the DWR module was integrated into the C2f module in the neck network. This modification enhances the model’s ability to recognize multi-scale objects more accurately.
- 3.
- To further improve boundary localization, multi-scale feature fusion, and small-object detection under complex scenarios, the original detection head was replaced with a Cross-Level Local Attention Head (CLLAHead) combined with a Distribution Focal Loss (DFL) mechanism and the Slide Loss function. These improvements effectively strengthen the model’s feature representation and boundary localization performance.
2. Related Work
In recent decades, with the rapid advancement of deep learning, machine-based drawing recognition has gradually emerged as an important research direction with the potential to replace manual interpretation. Current drawing recognition methods mainly rely on deep learning models. Extensive studies have been conducted in fields such as P&IDs [15,16,17], architectural drawings [18,19], and railway technical drawings [20], collectively demonstrating that deep learning provides an effective pathway for automated drawing processing. However, detecting symbols in engineering drawings with complex backgrounds still presents many challenges, including symbol overlap, excessively large target sizes, a large number of symbol categories, and high shape similarity. These factors can severely degrade detection performance. In addition, the lack of annotated drawing datasets and pre-trained deep learning models specifically designed for the architecture, engineering, construction, and operations domains poses a major obstacle to building general feature extraction models for plan views [21]. Addressing these issues therefore depends on the construction of a general-purpose engineering drawing dataset, on which symbol detection algorithms can be further improved. In this context, deep learning techniques have become an important advancement by leveraging the strong feature extraction capability of convolutional neural networks. These techniques have promoted the widespread adoption of object detection methods for recognizing drawing symbols and elements [22,23]. Object detection algorithms are generally divided into two main categories: single-stage and two-stage methods. Single-stage object detection algorithms extract features in a single pass, with representative examples including SSD [24] and the YOLO series [25,26,27].
Two-stage object detection methods typically first generate a set of region proposals and then use a convolutional neural network (CNN) to extract features from these proposals for classification and bounding-box regression. Representative methods include the SPPNet [28] and R-CNN [29,30] series of algorithms. Traditionally, single-stage object detection methods have offered higher detection speed than two-stage approaches, although their accuracy has often been relatively lower. However, with the continuous evolution of the YOLO series, substantial progress has been made in achieving high-precision detection performance. As a result, these methods have attracted widespread attention and have been applied in numerous domains.
Furthermore, the YOLO series has demonstrated strong performance and robust generalization capability in object detection, giving it considerable potential for the automatic recognition and parsing of engineering drawings. Elyan et al. [31] proposed a YOLOv3-based detection method that enables automatic symbol recognition in real-world P&ID diagrams. To address the challenges of symbol recognition in engineering drawing digitalization, particularly small inter-class differences and category imbalance, Jamieson et al. [32] proposed an end-to-end bounding-box detection method combined with data augmentation based on Generative Adversarial Networks (GANs). Gao et al. [33] addressed the challenge of automatically identifying P&ID components and their associated information by developing a detection model based on Faster R-CNN and ResNet-50. Through data augmentation, their method achieved a substantial improvement in the recognition performance of small-scale symbols. Mani et al. [34] proposed a method for the joint detection of symbols, text, and connections, thereby enabling the associated recognition of symbols and their corresponding text. However, their approach considered only two symbol categories, which limited its broader applicability. In recent years, deep learning has also been widely applied to the digitalization of architectural drawings. To address the challenges of symbol detection in architectural floor plans, Rezvanifar et al. [35] proposed a YOLO-based deep learning method for detecting small symbols in drawings. The main challenges they identified included low intra-class similarity, severe symbol occlusion, cluttered backgrounds, and varying graphic complexity. Jakubik et al. [36] employed the Faster R-CNN model to automate symbol detection in architecture, engineering, and construction drawings, demonstrating its effectiveness in reducing manual intervention and improving automation. Dzhusupova et al. [37] showed that an automated detection method based on YOLOv4 can efficiently identify design errors in drawings, thereby addressing the time-consuming manual review of P&IDs in engineering practice. A review of the relevant literature indicates that deep learning approaches have been extensively applied across a wide range of digitalization tasks. Research in engineering drawing and technical document processing spans multiple sectors, including oil and gas, construction, and others. However, studies on the automatic recognition of engineering drawings in the railway industry remain relatively limited, indicating the need for further in-depth investigation.
Although existing object detection methods have made progress in the analysis of engineering drawings, their performance in recognizing and interpreting equipment symbols in complex railway diagrams remains limited. To address this issue, this paper proposes an improved algorithm, DCS-YOLO, which enhances detection accuracy while maintaining model simplicity. Given the lack of annotated datasets and suitable pretrained models for SSLPs, a dedicated dataset is constructed and an end-to-end detection framework is developed. This approach effectively addresses the key challenges of symbol recognition in railway engineering drawings.
3. Materials and Methods
3.1. Data Collection
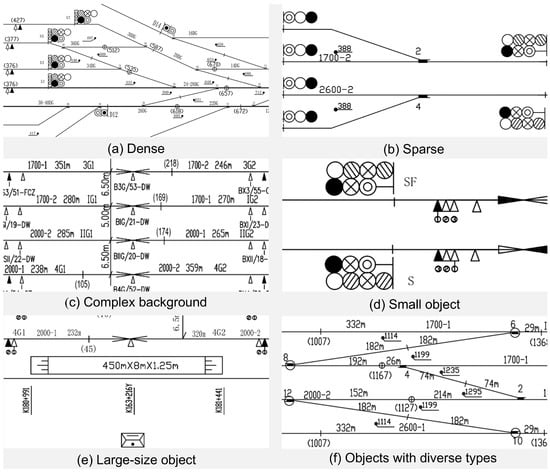
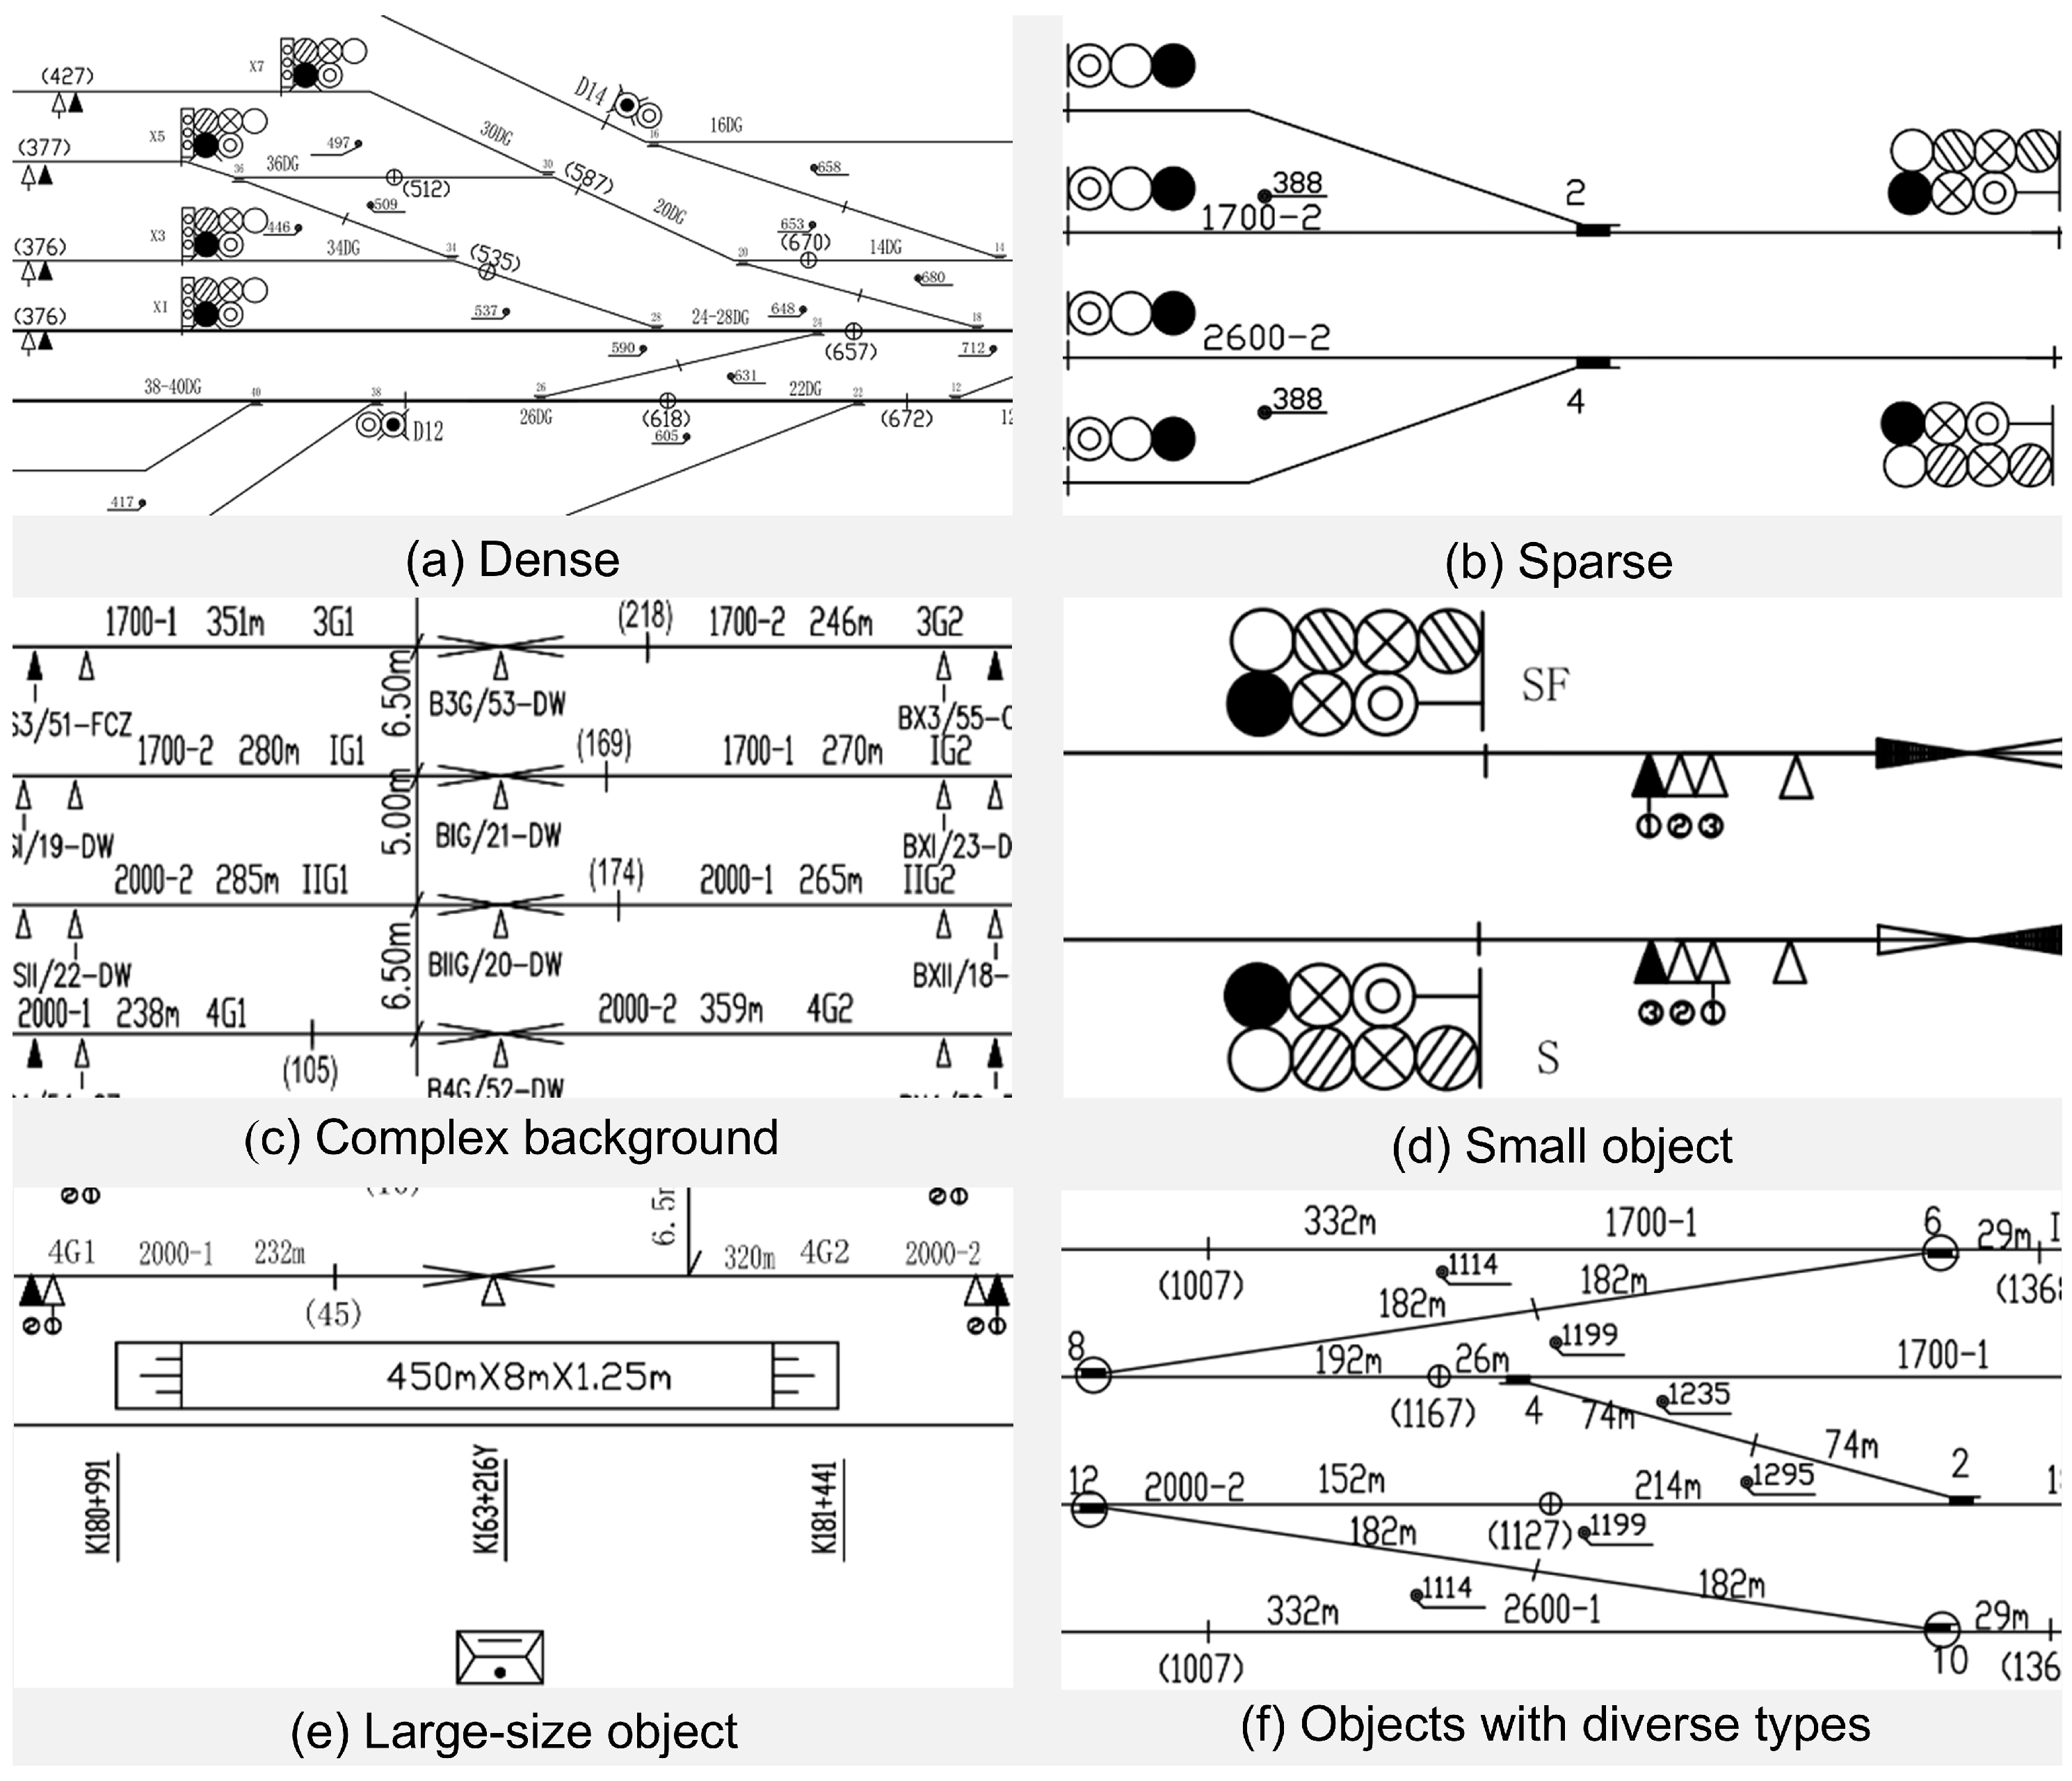
The dataset used in this study was obtained from a domestic railway bureau and consists of signal layout plans from 60 real stations across the railway network. These samples cover station scenarios of varying complexity and therefore comprehensively reflect the characteristics and complexity of actual engineering drawings. An SSLP is an engineering drawing used by station technical personnel to visually represent the interlocking logic of tracks, switches, and signals. It serves as a basis for station operators and dispatchers to arrange train routes. SSLPs abstract complex equipment arrangements into intuitive symbolic representations, enabling designers to quickly understand the overall structure and fundamental functions of a station. Moreover, such drawings span the entire life cycle of the signaling system, including design, construction, operation, and maintenance, and serve as essential technical references for ensuring operational safety and improving transportation efficiency. Therefore, accurate and automated recognition of SSLPs is of great significance for advancing the intelligence and digitalization of railway signaling engineering. A representative local region of an SSLP is shown in Figure 1, where typical station equipment, such as departure signals, balises, platforms, and turnouts, can be observed.
Figure 1.
Representative local samples of SSLPs.
3.2. Image Preprocessing and Dataset Partitioning
The original images collected in this study had a resolution of approximately 8000 × 3500 pixels. As large-scale engineering drawings, directly using these images for model training would increase computational cost and memory consumption while reducing training efficiency. In addition, target symbols in station signal layout plans are often distributed across different regions, and some occupy only a small portion of the image. Therefore, appropriate preprocessing was required to make the data more suitable for object detection.
Specifically, a sliding-window method was used to divide the original high-resolution images into 1280 × 1280 patches, with an overlap ratio of 0.1. The overlapping regions helped reduce the risk of cutting off key symbols at patch boundaries, thereby preserving the integrity of object instances. This strategy also maintained contextual continuity between adjacent patches. Through this preprocessing step, the original large-scale drawings were converted into fixed-resolution image patches for subsequent model training and evaluation.
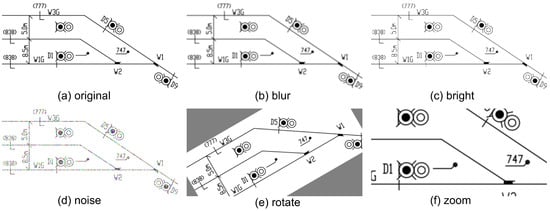
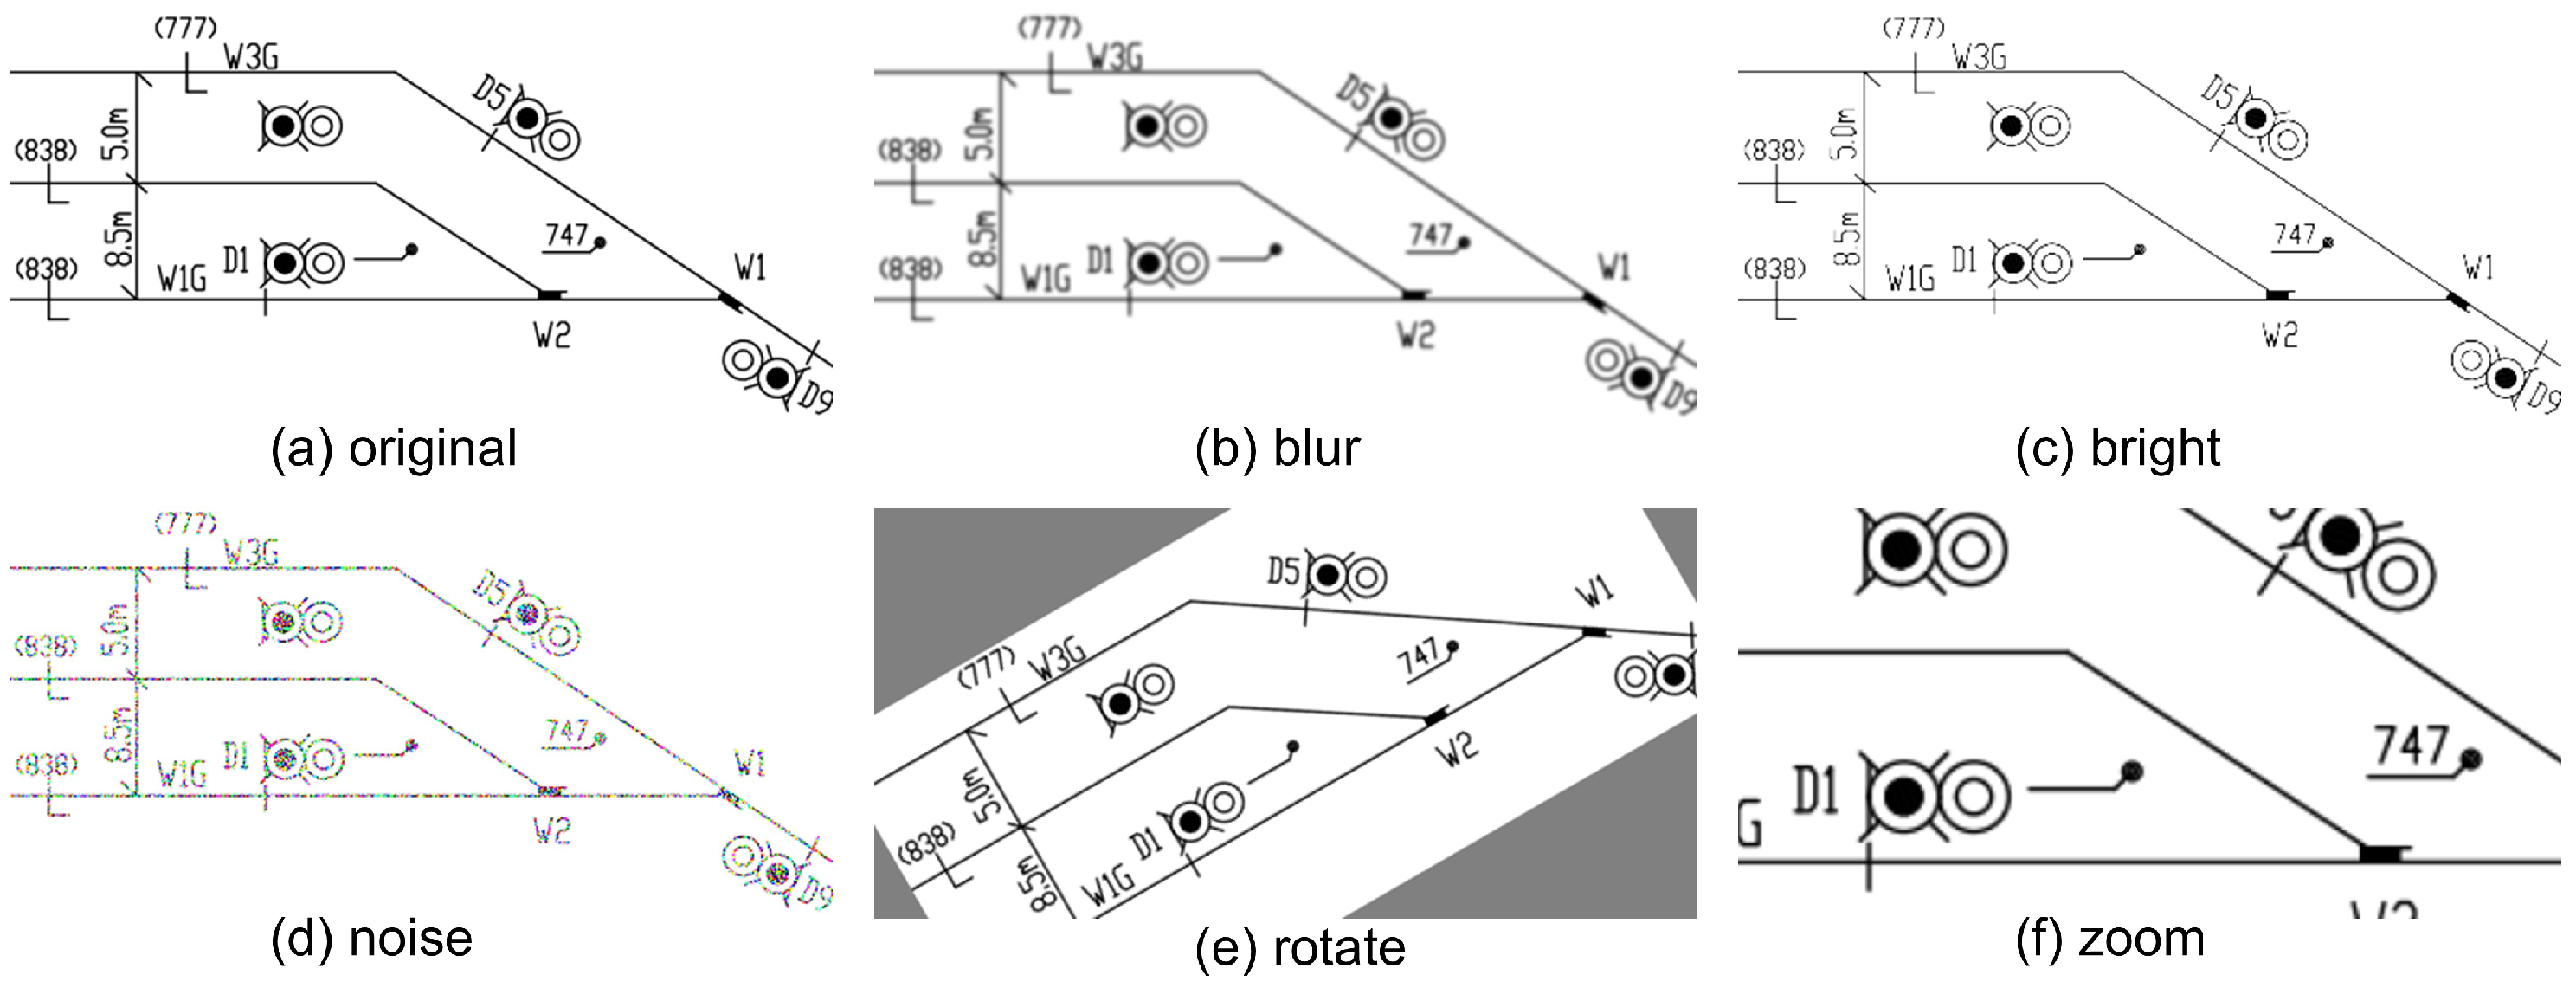
Since training deep neural networks with limited image data can easily lead to overfitting, data augmentation was further applied to increase sample diversity and alleviate data scarcity. Specifically, multimodal augmentation operations, including rotation, blurring, and noise injection, were performed on the cropped images. The augmentation strategy considered the characteristics of station signal layout plans, such as similar symbol morphologies, significant scale variations, dense object distributions, and susceptibility to noise interference. As shown in Figure 2, the augmented samples provide more diverse visual representations of the original data and better reflect the complexity and diversity of real engineering drawings.
Figure 2.
Results of local enhancement.
Through the above augmentation operations, a total of 2100 images were obtained, each with a resolution of 1280 × 1280 pixels and uniformly saved in JPG format.
LabelImg version 1.8.6 was used for annotation. The dataset included 20 categories, which were named by capitalizing the first letter of the corresponding Chinese equipment designation. Across the 2100 images in the dataset, a total of 57,318 equipment targets were annotated, and the corresponding annotation files were saved in YOLO format. The constructed dataset was divided into training, validation, and test sets at a ratio of 8:1:1. Detailed annotation information for the dataset is provided in Table 1.
Table 1.
Types and Quantities of Symbols in the Station Signal Layout Plan Dataset.
3.3. DCS-YOLO for the Detection of SSLPs
YOLOv8, an object detection framework released by the Ultralytics team in 2023, represents an upgraded version of YOLOv5 [38]. Through modular restructuring and algorithmic optimization, it significantly improves model performance and extends its capabilities to tasks such as image classification and instance segmentation. Although YOLOv8 follows a multi-scale detection paradigm similar to that of YOLOv5, namely Backbone–Neck–Head, it incorporates several key architectural and training-strategy improvements, resulting in substantial gains in both speed and accuracy.
YOLOv8 provides five predefined model variants, namely YOLOv8n, YOLOv8s, YOLOv8m, YOLOv8l, and YOLOv8x, in which network scale is controlled by depth and width multipliers. These variants share the same overall architecture and differ only in the number of layers and the scale of channel parameters. Given the real-time requirements of engineering drawing recognition in practical applications, YOLOv8n was selected as the baseline model in this study.
3.3.1. Overview of the DCS-YOLO Model
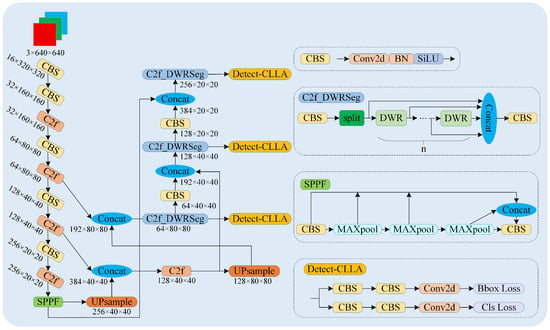
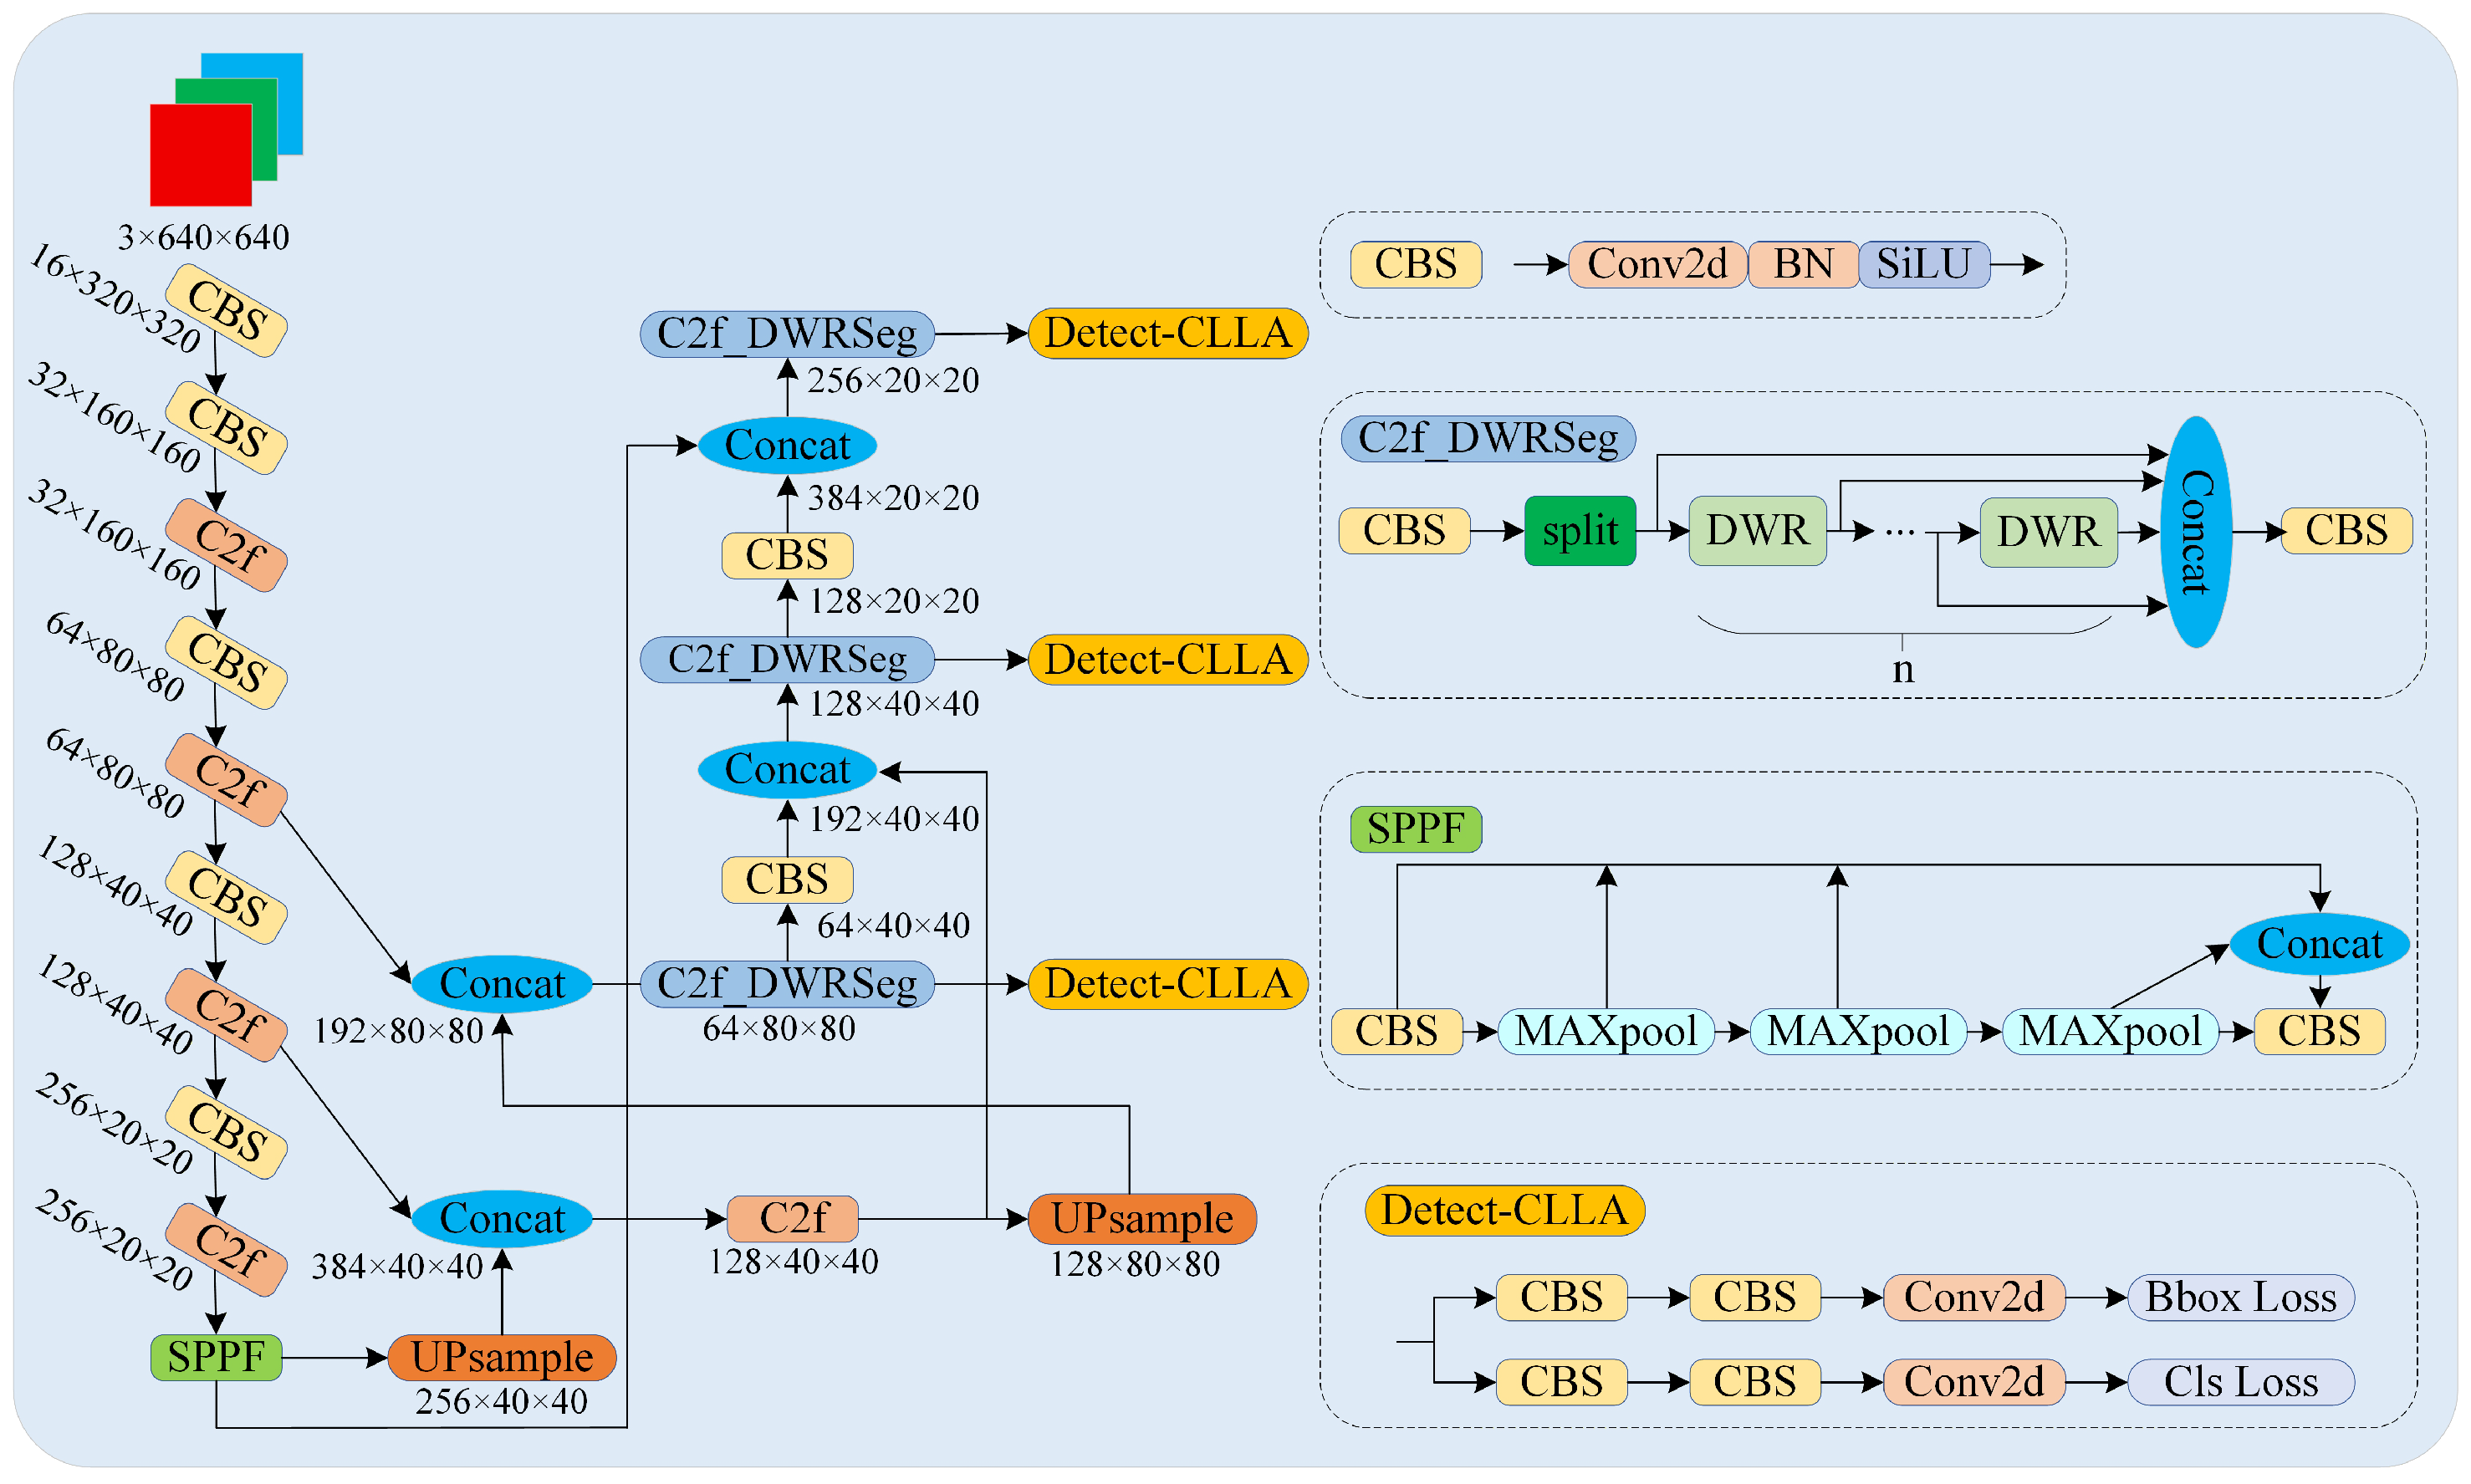
This paper proposes a novel and efficient DCS-YOLO model for equipment detection in SSLPs. Specifically, a scalable residual attention module based on DWRSeg is integrated into the neck feature-processing network of YOLOv8 to enhance and optimize its performance. This module enables more effective feature extraction and improves detection capability for objects at different scales. In addition, a CLLAHead module incorporating a DFL mechanism is introduced to refine the intermediate detection heads of YOLOv8, thereby addressing the challenge of detecting small objects in station signal layout plans. Furthermore, the Slide Loss function is incorporated into the detection head to alleviate sample imbalance in the dataset. By measuring the discrepancy between predicted and ground-truth bounding boxes during training, this function adaptively adjusts the loss contribution of different samples, thereby improving detection accuracy. The overall architecture and key improved components of the proposed DCS-YOLO model are illustrated in Figure 3. The detailed structures of these components are further described in the following subsections.
Figure 3.
Overall architecture and key improved components of the proposed DCS-YOLO model.
3.3.2. Dilated Residual Feature Fusion Module Based on C2f
YOLOv8 incorporates multiple cross-stage feature fusion C2f modules, which improve model performance and efficiency by integrating features from different stages. However, symbols in station signal layout plans often exhibit high visual similarity, large scale variation, and complex background interference. During feature extraction, the C2f modules may introduce redundant information and fail to preserve critical features, thereby reducing the detection accuracy of small and easily confused symbols. To address this issue, the C2f structure must be improved to strengthen the model’s capabilities in multi-scale feature representation and discriminative feature extraction, making it better suited for railway signal drawing detection tasks. To this end, this study proposes a specially designed DWR module to replace the original bottleneck structure. This module adopts a two-stage feature extraction strategy and leverages carefully designed dilation rates, together with the advantages of dilated convolutions, to fully exploit feature maps at different spatial scales. As a result, an extensible residual attention module, termed C2f_DWR, is constructed, which significantly improves the efficiency of multi-scale information capture for small-object detection.
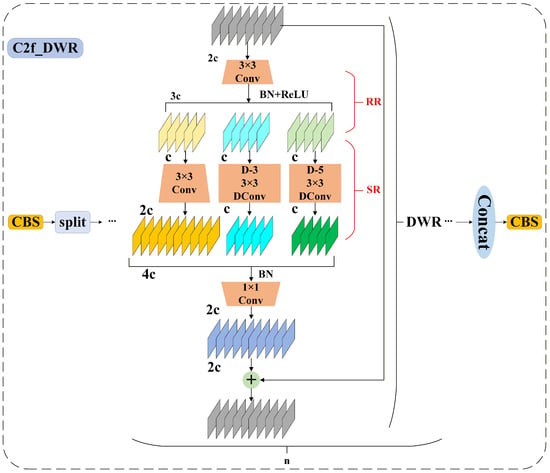
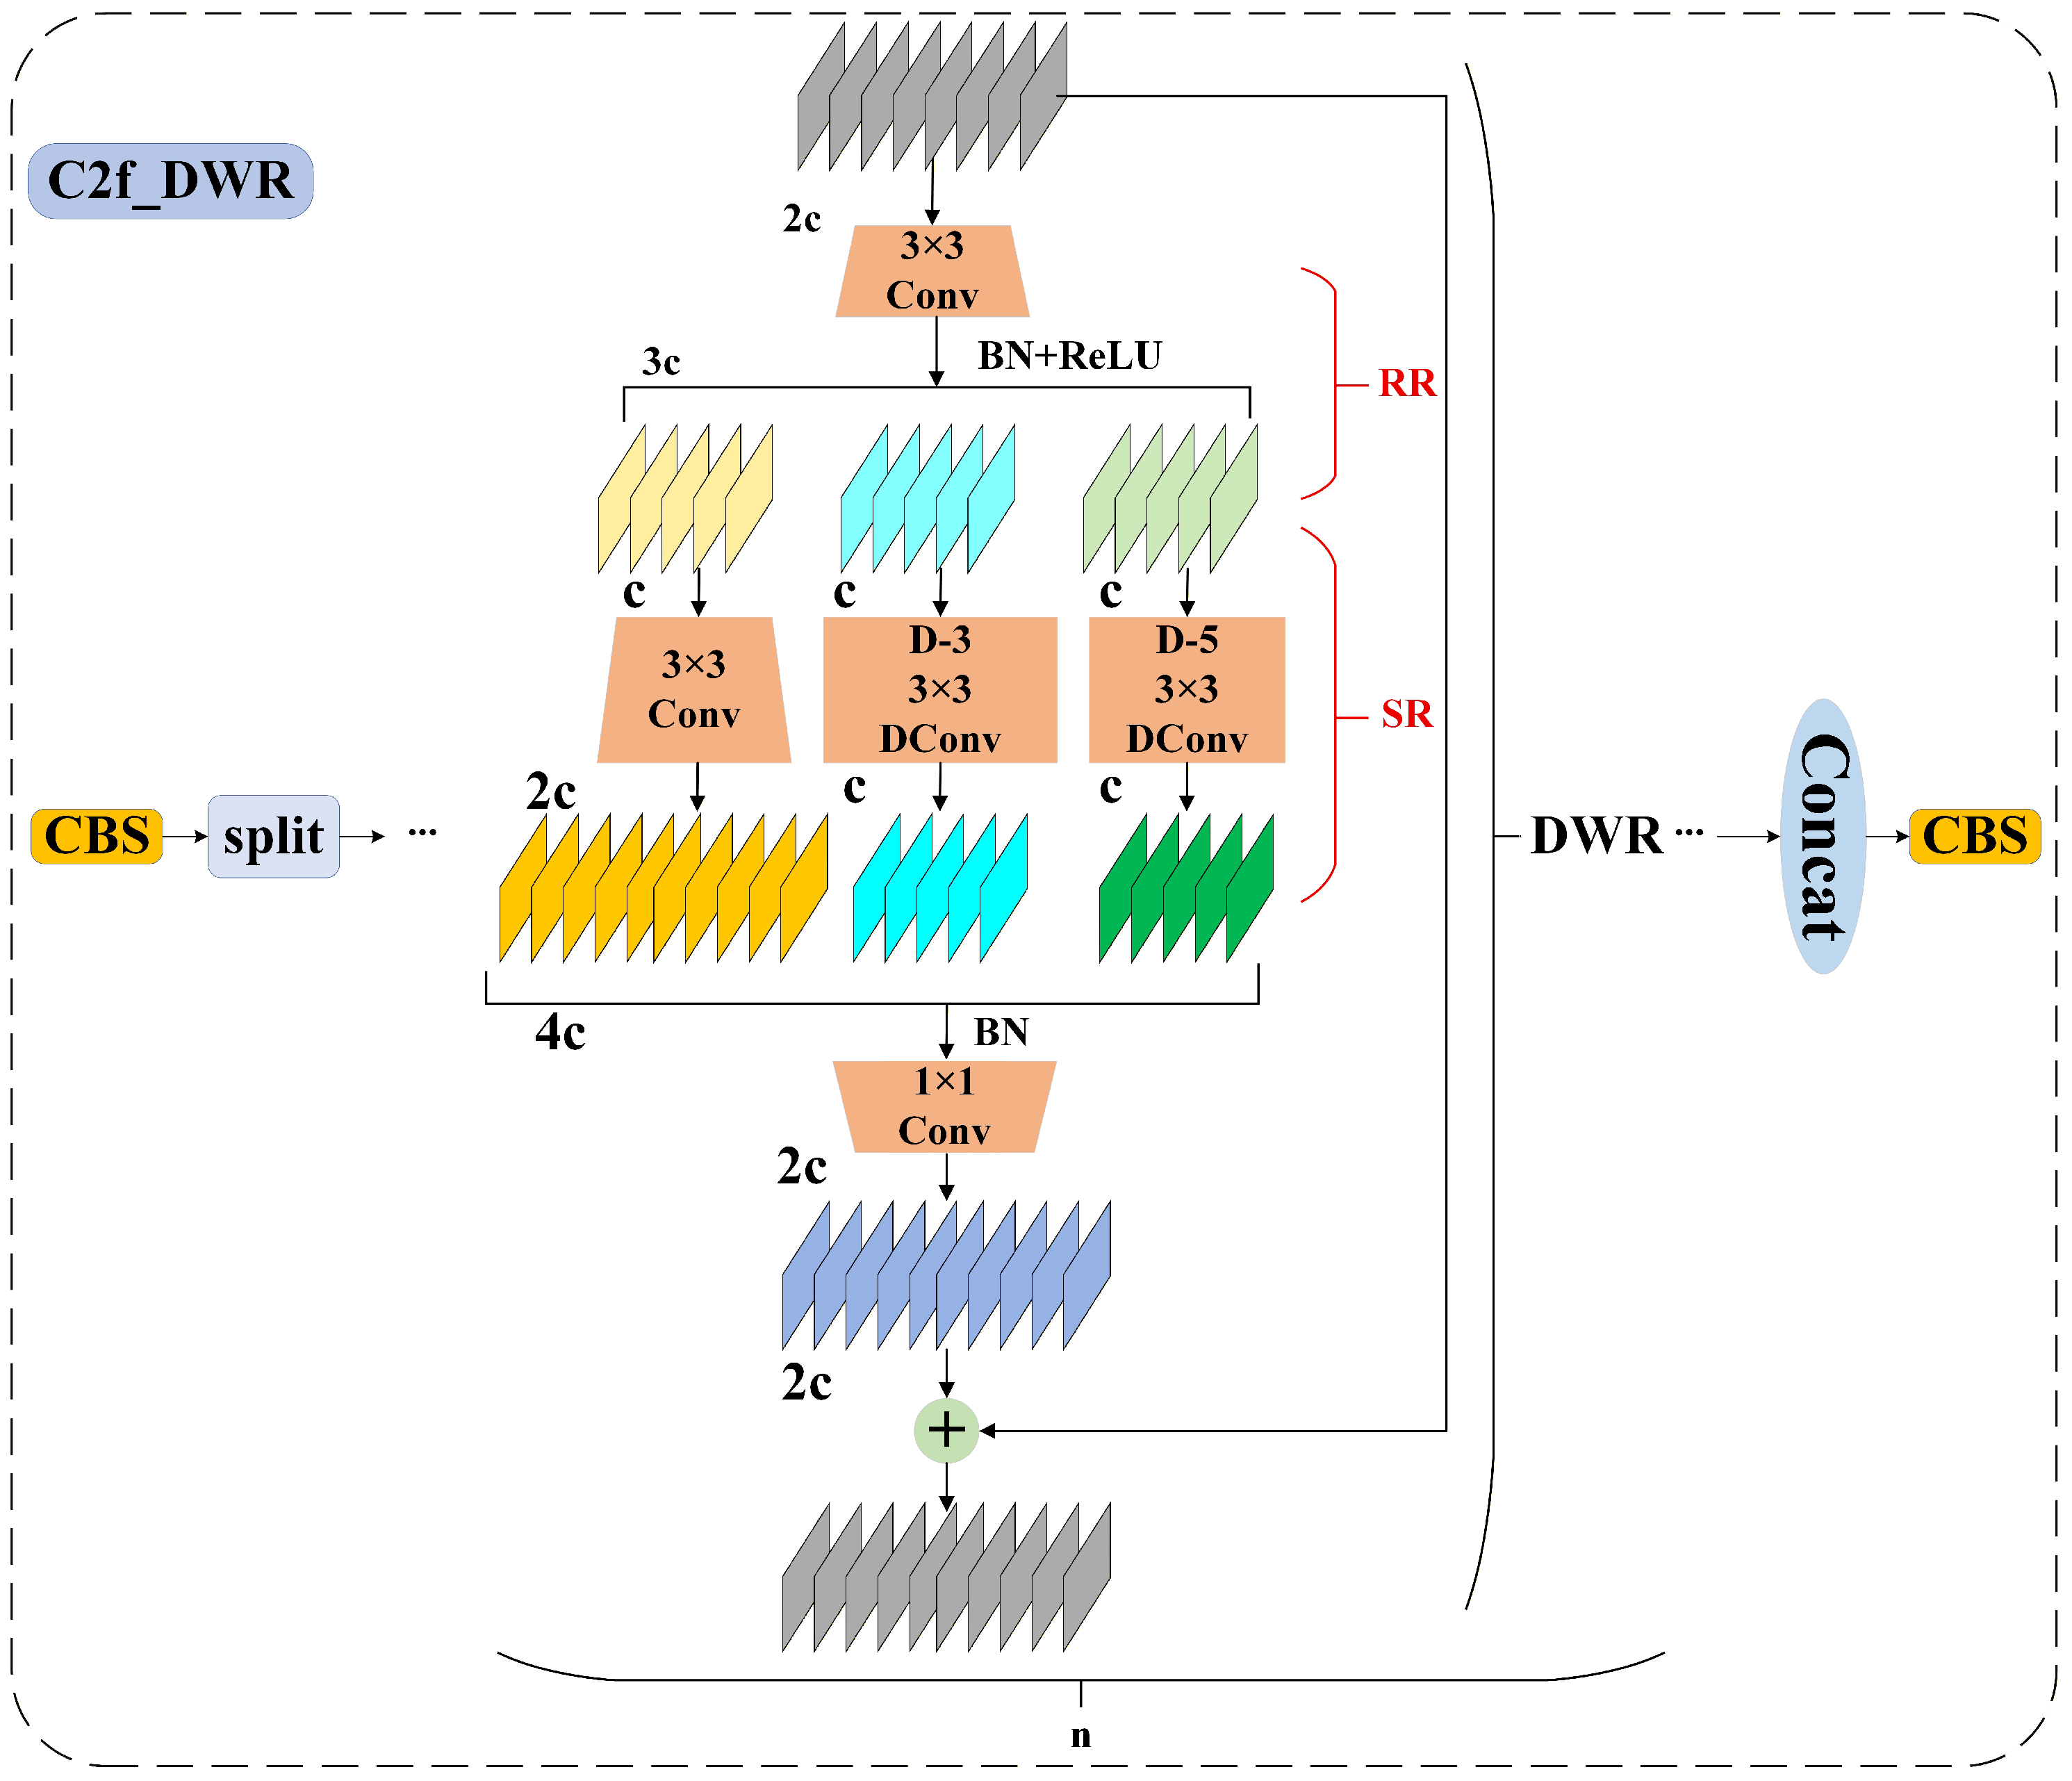
The C2f_DWR module is derived from the dilated residual design proposed in DWRSeg [39]. This design adopts a multi-branch architecture to expand and regulate the model’s receptive field by introducing dilated convolutions with different dilation rates (D) in the upper layers. Furthermore, to capture multi-scale contextual information more effectively, the conventional single-stage multi-scale feature extraction process is decomposed into two stages, and the resulting feature maps with different receptive fields are subsequently fused. The structure of the improved C2f module is illustrated in Figure 4.
Figure 4.
Improved C2f structure.
Specifically, a standard 3 × 3 convolution is first applied to reduce the number of channels in the input feature map by half. Batch Normalization (BN) and the Rectified Linear Unit (ReLU) activation function are then used for feature extraction, producing a series of compact feature maps of different sizes, referred to as residual region (RR) features. These RR feature maps are subsequently grouped, and depthwise dilated convolutions with different dilation rates are applied to each group. Smaller dilation rates (e.g., 1) produce narrower receptive fields, which help preserve fine-grained object details and are therefore well suited for detecting small objects. In contrast, larger dilation rates (e.g., 3 or 5) enlarge the receptive field, enabling the model to capture broader contextual information that is beneficial for detecting large or sparsely distributed objects. This strategy allows the model to capture contextual information at multiple scales and generate richer semantic features. After these features are concatenated along the channel dimension, a 1 × 1 convolution is applied to restore the feature map to its original channel dimension (2c). The residual features are then added back to the input feature map to produce a more robust and comprehensive output. This design mitigates the information loss caused by dimensionality reduction by preserving both local and global features. In addition, the regional feature map representation simplifies depthwise dilated convolutions into a form of morphological filtering, thereby streamlining the learning process and ensuring efficient feature extraction.
3.3.3. Detection Head Based on Cross-Level Local Attention and Distribution Focal Loss
In recent years, attention mechanisms have become a major focus in network design in both natural language processing and computer vision, and they have been widely applied [40]. By enabling networks to dynamically focus on target-relevant regions within an image, attention mechanisms effectively enhance useful features while suppressing irrelevant information, thereby improving feature extraction and significantly increasing the accuracy of object localization [41]. In complex station signal layout plans, small objects are often difficult to localize accurately. To improve boundary localization precision and multi-scale feature fusion under such conditions, this study introduces two key components into the detection head: a Cross-Level Local Attention (CLLA) mechanism and a Distribution Focal Loss (DFL) mechanism. While the classification branch retains its conventional design, the regression branch is restructured to incorporate local attention fusion, probability distribution prediction, and continuous bounding-box mapping. This redesign substantially enhances the model’s ability to capture fine-grained boundary details and structural information.
- (1)
- CLLAHead
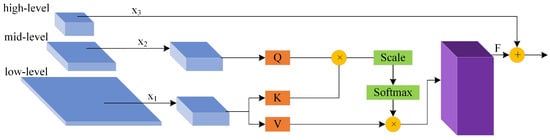
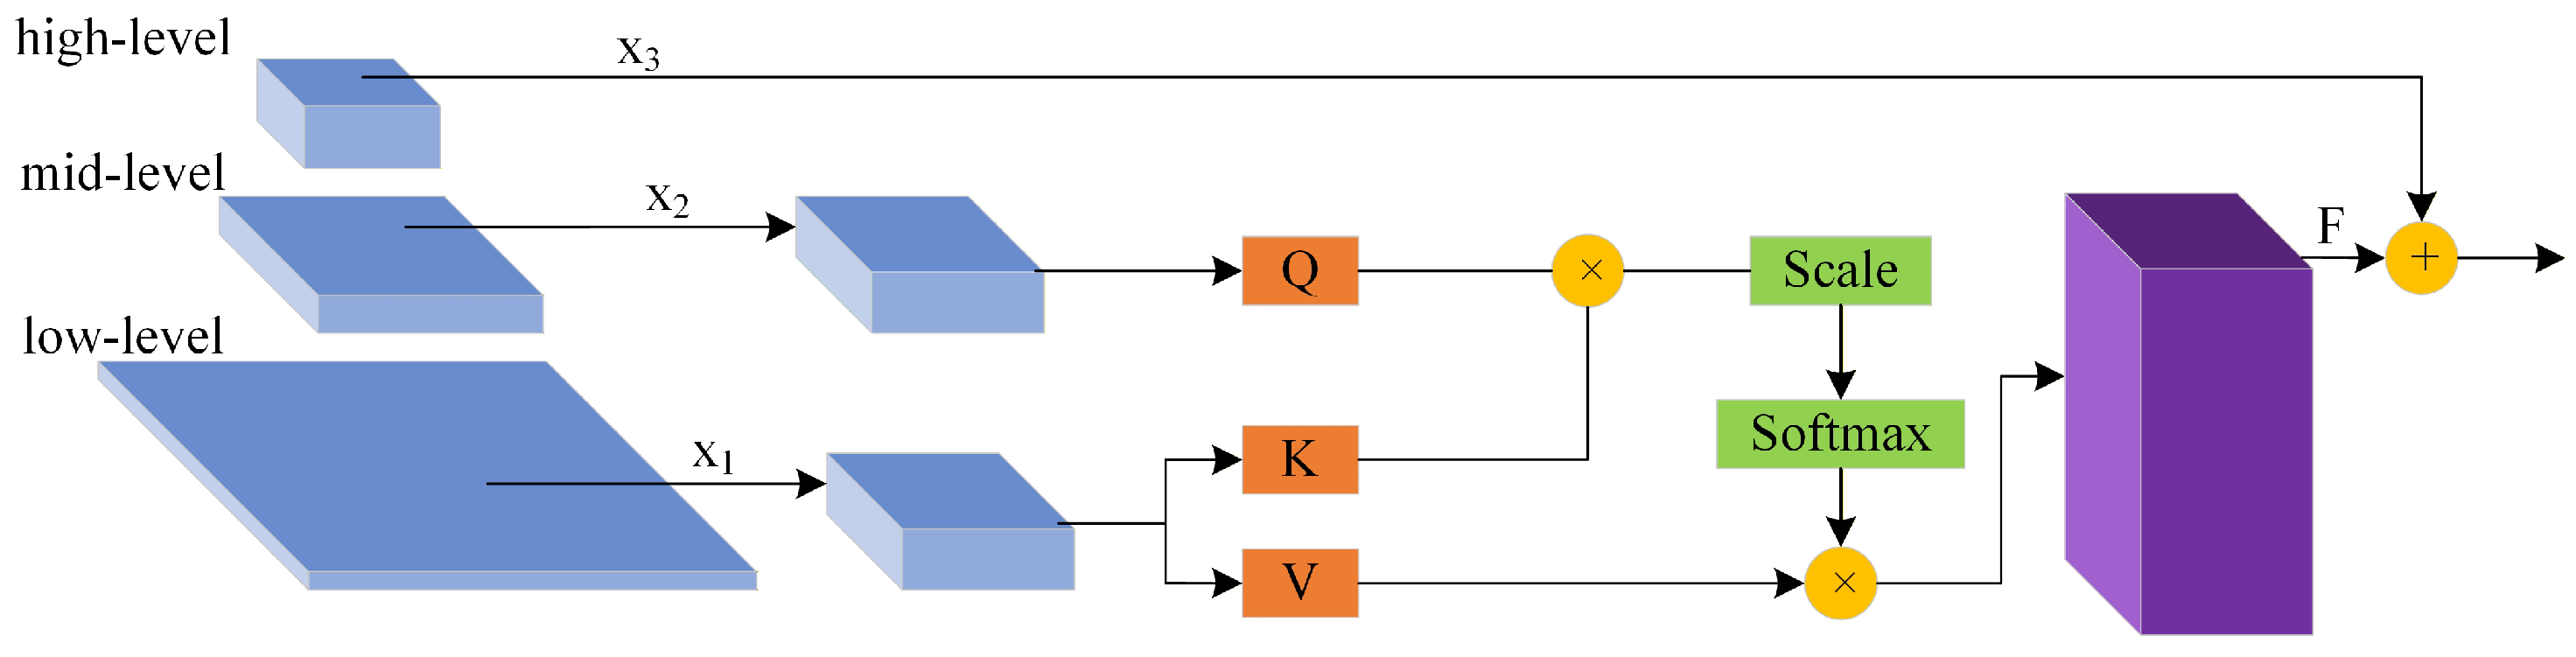
Traditional YOLOv8 detection heads often struggle to balance the semantic representation of high-level features with the spatial details of low-level features during multi-scale feature fusion. To address this issue, this paper introduces the CLLA module. By employing a cross-scale attention mechanism, the CLLA module establishes direct information interaction between high-level and low-level features, thereby incorporating finer-grained boundary information into the object localization process. The detailed structure of the CLLA module is shown in Figure 5.
Figure 5.
CLLA structure.
Let the high-level feature satisfy the condition given in Equation (1):
and the low-level feature be defined as in Equation (2):
In Equations (1) and (2), B denotes the batch size, C denotes the number of channels in the feature map, and denote the width and height of the high-level feature map, respectively, and denote the width and height of the low-level feature map, respectively, and denotes the set of real numbers.
Let Q denote the query vector obtained by applying a linear mapping to the high-level feature . Here, denotes the linear mapping operation, as expressed in Equation (3):
As shown in Equation (4), denotes the size of the local sliding window, denotes the total number of sampled positions within the local window, and denotes the local region feature of the low-level feature. and denote the key vector and value vector at the p-th position, respectively, where p is the index of the local sampled position.
Let denote the dot-product similarity between the query vector Q and the p-th key vector . Here, is the scaling factor. The expression of is given in Equation (5):
Let denote the similarity after mean correction, denote the original similarity at the i-th position, and i be the summation index. The expression of is given in Equation (6):
denotes the attention weight corresponding to the p-th position, and j denotes the summation index in the softmax normalization. After the softmax operation, the attention weight is obtained, as shown in Equation (7).
The final output is first obtained through weighted summation to produce the local fusion output O, as expressed in Equation (8). Then, O is fused with the high-level feature through a residual connection to obtain the fused cross-scale enhanced feature F, as expressed in Equation (9):
The output feature F simultaneously preserves high-level semantics and low-level details. In other words, the detection head can maintain semantic consistency while incorporating local structural information from low-level features, thereby effectively improving boundary sensitivity and feature representation capability.
- (2)
- Distribution Focal Loss
In the object detection task for station signal layout drawings, the targets mainly consist of various standardized engineering symbols, such as signals, balises, and turnouts. These symbols are typically composed of thin lines and regular geometric structures, with relatively fine boundary contours, and are often densely distributed throughout the drawings. Under such conditions, the small spacing and structural similarity among targets pose significant challenges to the localization capability of the detection model. If a conventional bounding-box regression method is used to directly predict the continuous coordinates of target boxes, the prediction can be easily affected by factors such as imbalanced sample distribution and coordinate discretization errors, which may cause deviations at symbol boundaries and consequently reduce localization accuracy.
To address this limitation, this subsection introduces the DFL mechanism into the regression branch of the detection head to improve localization accuracy through a distribution-based bounding-box regression strategy. Unlike traditional methods that directly regress a single coordinate value, DFL reformulates bounding-box position prediction as a probability distribution learning problem. Specifically, a discrete probability distribution is established for each boundary position, and the true coordinate is approximated by optimizing this distribution. In this way, the model can learn a probability distribution that is more concentrated around the ground-truth label, thereby achieving more precise bounding-box localization. Studies have shown that this distribution-based regression strategy can effectively reduce errors caused by coordinate quantization and improve the prediction accuracy of bounding boxes.
In the specific implementation, let the ground-truth label position be denoted by y, where y falls within the discrete interval . The network predicts the probabilities corresponding to the two endpoint positions and , and obtains the associated probability values and through the function. A cross-entropy-based loss function is then used to jointly optimize these two positions, so that the predicted probability distribution gradually concentrates around the true label position. The mathematical expression is given in Equation (10):
3.3.4. Slide Loss
In object detection, imbalance in the number of samples across categories is a common issue. In the station signal layout plan dataset used in this study, the number of samples varies significantly among different categories. For example, the number of samples in the “WYYDQ” category reaches the order of tens of thousands, whereas the number of samples in the “YGXHJ” category is fewer than one hundred. Such a disparity in sample quantity may cause the model to focus more during training on categories with larger sample sizes and relatively simpler features, thereby weakening its ability to learn minority-class samples and hard samples and ultimately limiting the overall improvement in detection performance.
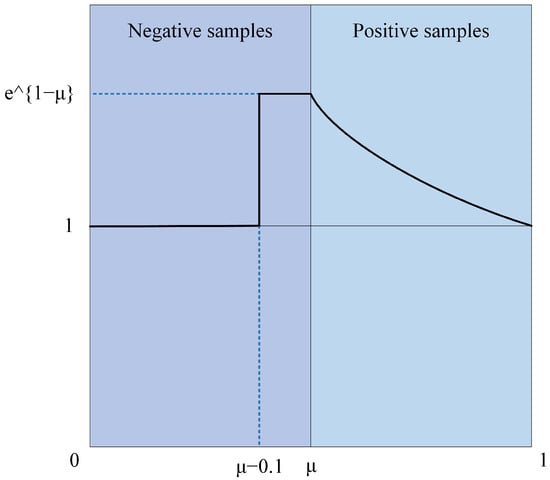
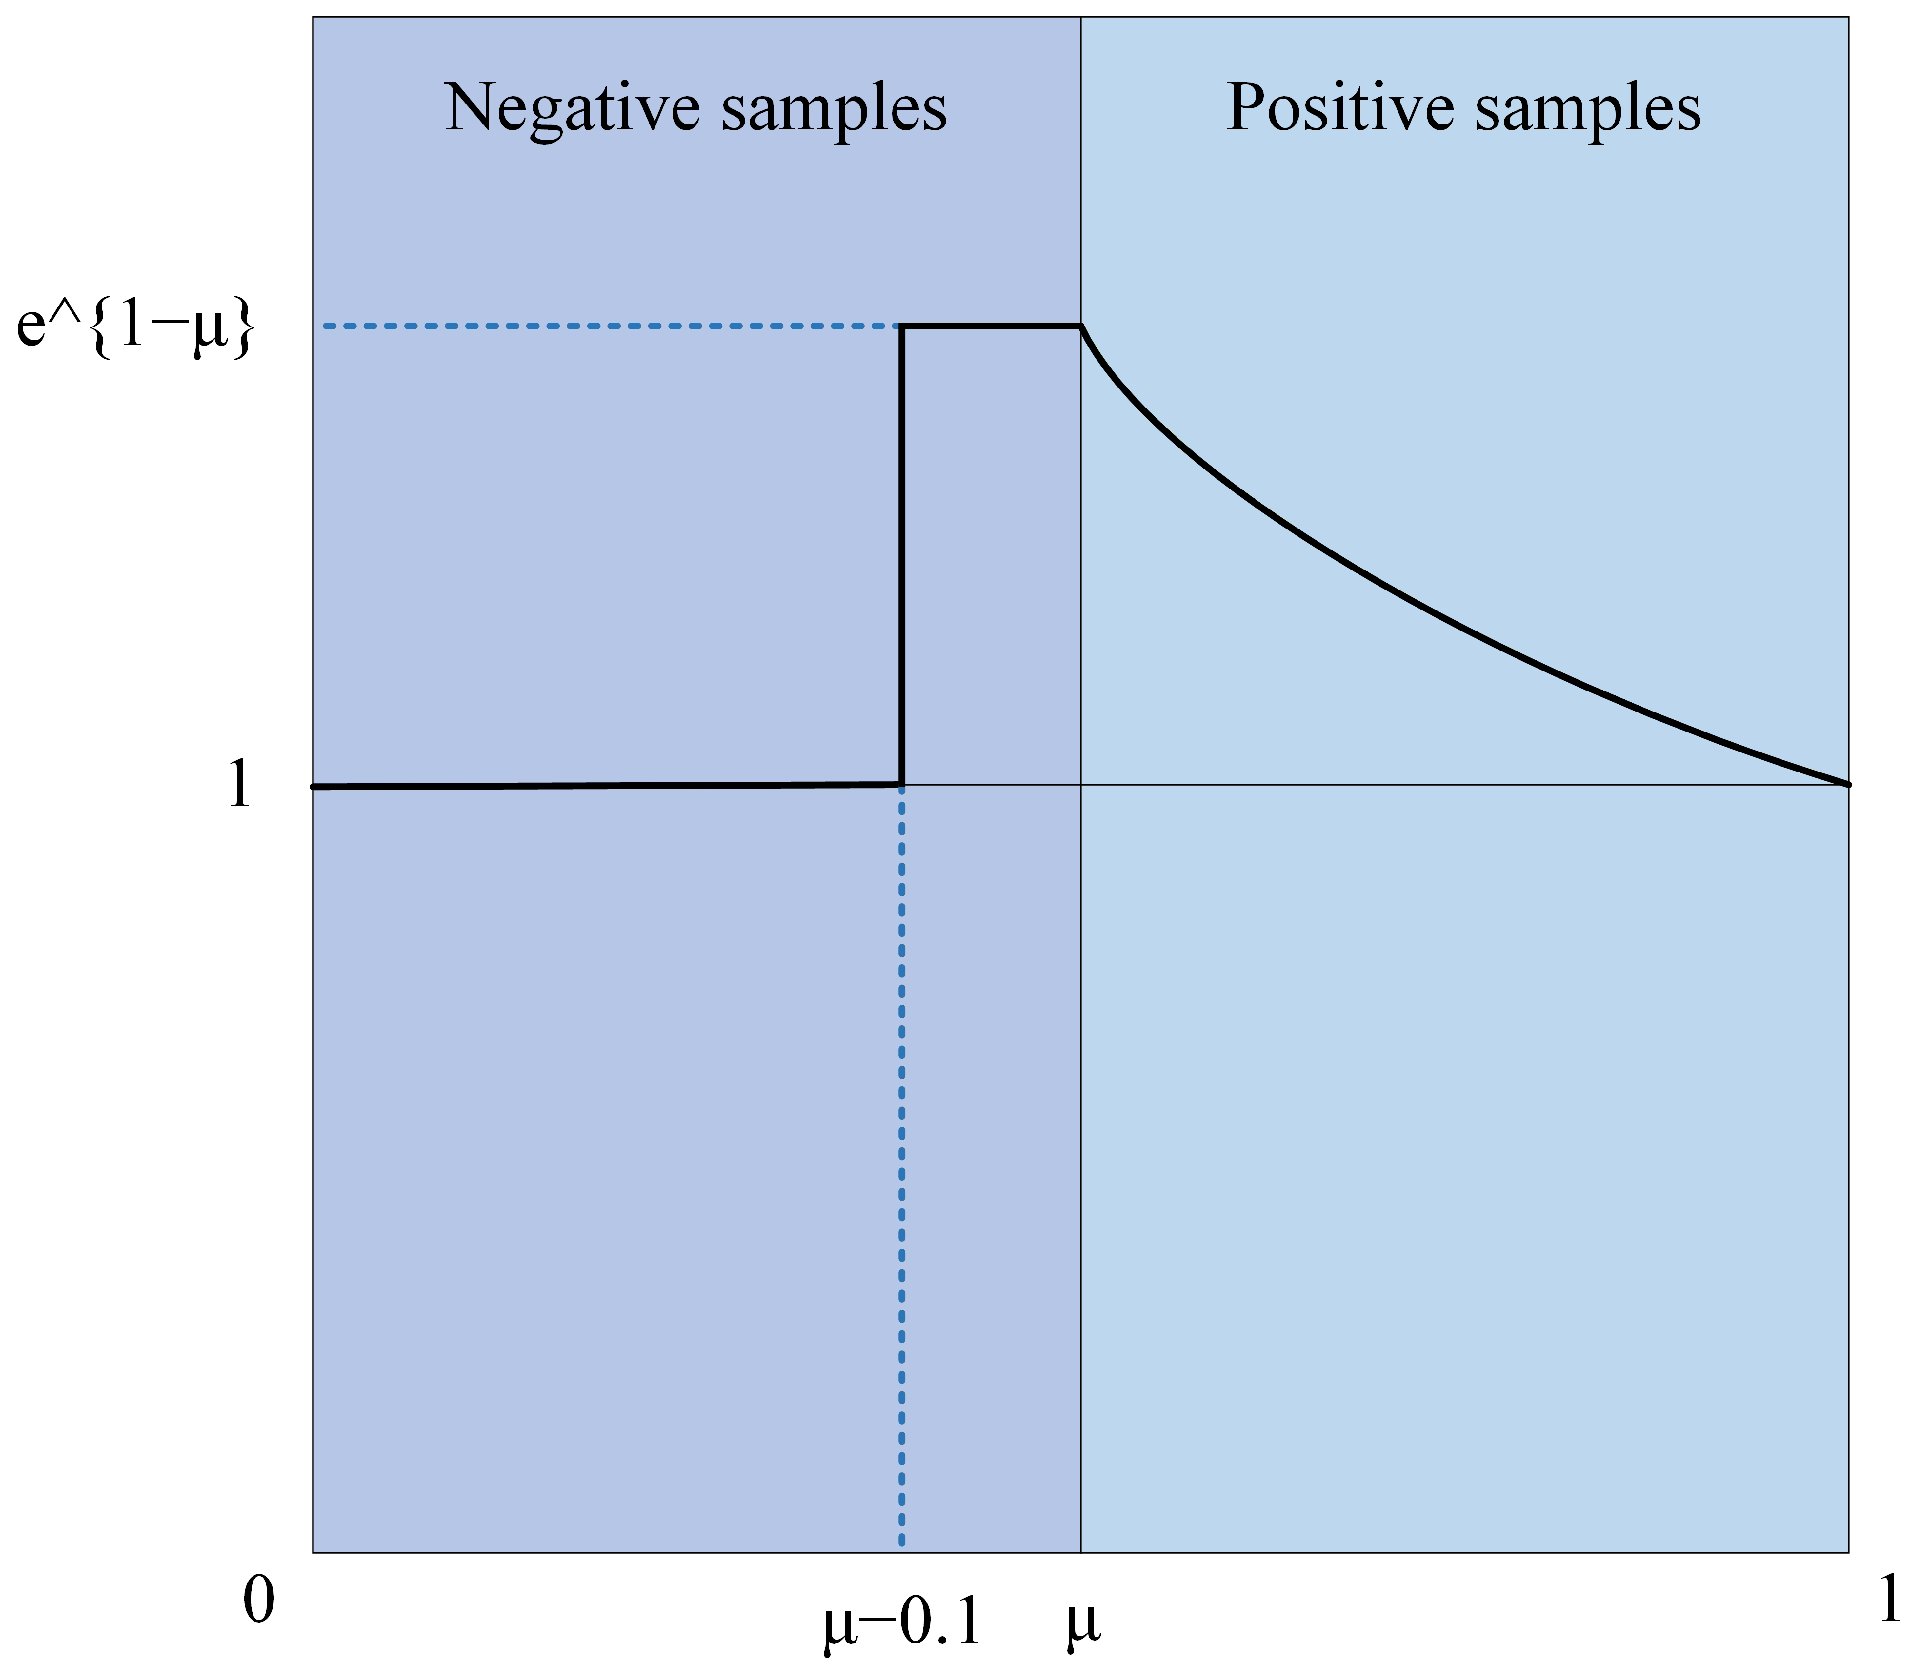
To address this issue, Slide Loss is incorporated into the original YOLOv8 loss function. During loss computation, Slide Loss introduces a weighting function similar to a “sliding slope,” which uses the IoU between the predicted box and the ground-truth box to divide samples according to difficulty and assign different weights to different sample types. Specifically, the average IoU between the predicted boxes and the ground-truth boxes is calculated and defined as the threshold . When the IoU of a sample is smaller than , it is treated as a negative sample; when the IoU is greater than , it is treated as a positive sample. In this way, the threshold can be adaptively determined according to the sample distribution, enabling dynamic partitioning of sample difficulty and improving the model’s ability to learn from hard samples. It should be noted that, during actual training, boundary samples near the threshold often exhibit relatively high uncertainty, and their classification results are more prone to error. Although the number of such samples is relatively small, they have an important influence on the robustness and generalization ability of the model. To address this issue, Slide Loss increases the loss contribution of samples near the threshold, guiding the model to focus more on these difficult-to-classify samples and thereby further enhancing its ability to learn from hard samples and improve overall detection performance, as illustrated in Figure 6.
Figure 6.
Principle of the Slide Loss function.
The mathematical expression of Slide Loss is given in Equation (11), where denotes the threshold used to distinguish different sample categories. This method assigns different weights to samples according to different IoU intervals, allowing hard samples near the threshold to contribute more to the loss during training. In addition, it alleviates the limitation of traditional loss functions, which often pay insufficient attention to samples with ambiguous boundaries, thereby improving the detection stability of the model under imbalanced sample distributions. Previous studies have shown that Slide Loss dynamically adjusts sample weights according to the IoU relationship between the predicted box and the ground-truth box. Therefore, Slide Loss is introduced as a complementary optimization strategy. Rather than directly increasing the feature representation capability of the network, it adjusts the loss contribution of samples with different localization difficulties and encourages the model to pay more attention to hard samples and minority-category samples during training.
3.4. Experimental Environment
This experiment was conducted using the PyTorch deep learning framework, version 2.5.0, and the PyCharm integrated development environment, version 2024.1. YOLOv8n was employed as the baseline network model for training. Table 2 details the hardware platform and environmental parameters utilized during the experimental training phase.
Table 2.
Experimental Platform Configuration.
During training of the improved YOLOv8 model, a batch size of 8 was used and the learning rate was set to 0.001. Gradient descent was performed using the SGD optimizer and the training was conducted for 300 epochs.
3.5. Evaluation Metrics
In this study, several widely used evaluation metrics were adopted to assess model performance, including average precision (), mean average precision (), precision (P), recall (R), and the score. Among these metrics, and were used to evaluate detection accuracy, while frames per second () was used to measure inference speed. The formulas for precision P and recall R are given as follows:
In Equations (12) and (13), denotes the number of true positive samples, namely, the cases in which the model predicts a positive target and the ground truth is also positive; denotes the number of false positive samples, namely, the cases in which the model predicts a positive target while the ground truth is negative; and denotes the number of false negative samples, namely, the cases in which the model predicts a negative target while the ground truth is positive.
Since in detection tasks there is often a trade-off between P and R, their harmonic mean, namely the score, was introduced to provide a comprehensive evaluation of the model’s detection performance. The formula is given in Equation (14).
The for each category is calculated as shown in Equation (15):
Here, m denotes the number of positive samples, represents the precision among the first r retrieved results, denotes the corresponding change in recall, and indicates the precision at a given recall level R. The is obtained by integrating the precision–recall curve, and the is then calculated by averaging the values over all categories.
In Equation (16), n denotes the number of target categories annotated in the engineering drawings (), and represents the average precision of the i-th category. Whether a target is considered successfully detected is determined by computing the Intersection over Union () between the predicted bounding box and the ground-truth bounding box. denotes the mean average precision when the threshold is set to 0.5; that is, a prediction is regarded as correct if the is greater than or equal to 0.5, and incorrect otherwise. :0.95 refers to the average computed over multiple thresholds, typically ranging from 0.5 to 0.95. A higher :0.95 indicates that the model performs well across a range of thresholds. In particular, maintaining high accuracy at high thresholds suggests that the predicted bounding boxes overlap more closely with the ground-truth boxes and therefore provide more precise localization.
4. Experiments and Results
4.1. Comparison of Detection Performance
To validate the effectiveness of the proposed method, this study compares it with several representative object detection algorithms, including Faster R-CNN, YOLOv3, YOLOv4, YOLOv5, YOLOv8n, YOLOv10n, YOLOv11n, and YOLOv12n. All models were trained under identical experimental settings using default hyperparameters for 300 epochs. The corresponding detection results are summarized in Table 3.
Table 3.
Comparison of Results from Different Algorithms.
The experimental results show that DCS-YOLO achieves the best performance in terms of precision, recall, F1 score, and mAP@0.5, with values of 0.957, 0.927, 0.942, and 0.963, respectively. Compared with the baseline YOLOv8n, the proposed model improves precision, recall, F1 score, and mAP@0.5 by 3.1%, 0.8%, 1.9%, and 2.1%, respectively. Although its mAP@0.5:0.95 is slightly lower than that of some compared models, DCS-YOLO maintains a favorable balance between detection accuracy and inference speed, achieving 95 FPS, which fully satisfies the real-time requirements of automated detection in intelligent railway engineering drawings.
To comprehensively evaluate the detection performance of the proposed model on the SSLP dataset, this paper analyzes three aspects: the training and validation performance curves, the precision–recall (P–R) curves, and the normalized confusion matrix.
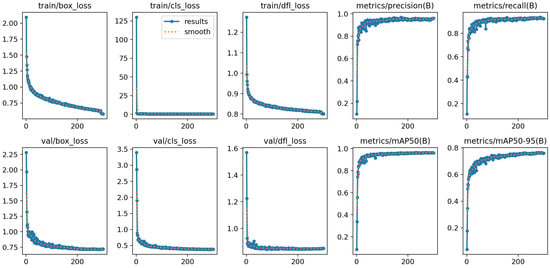
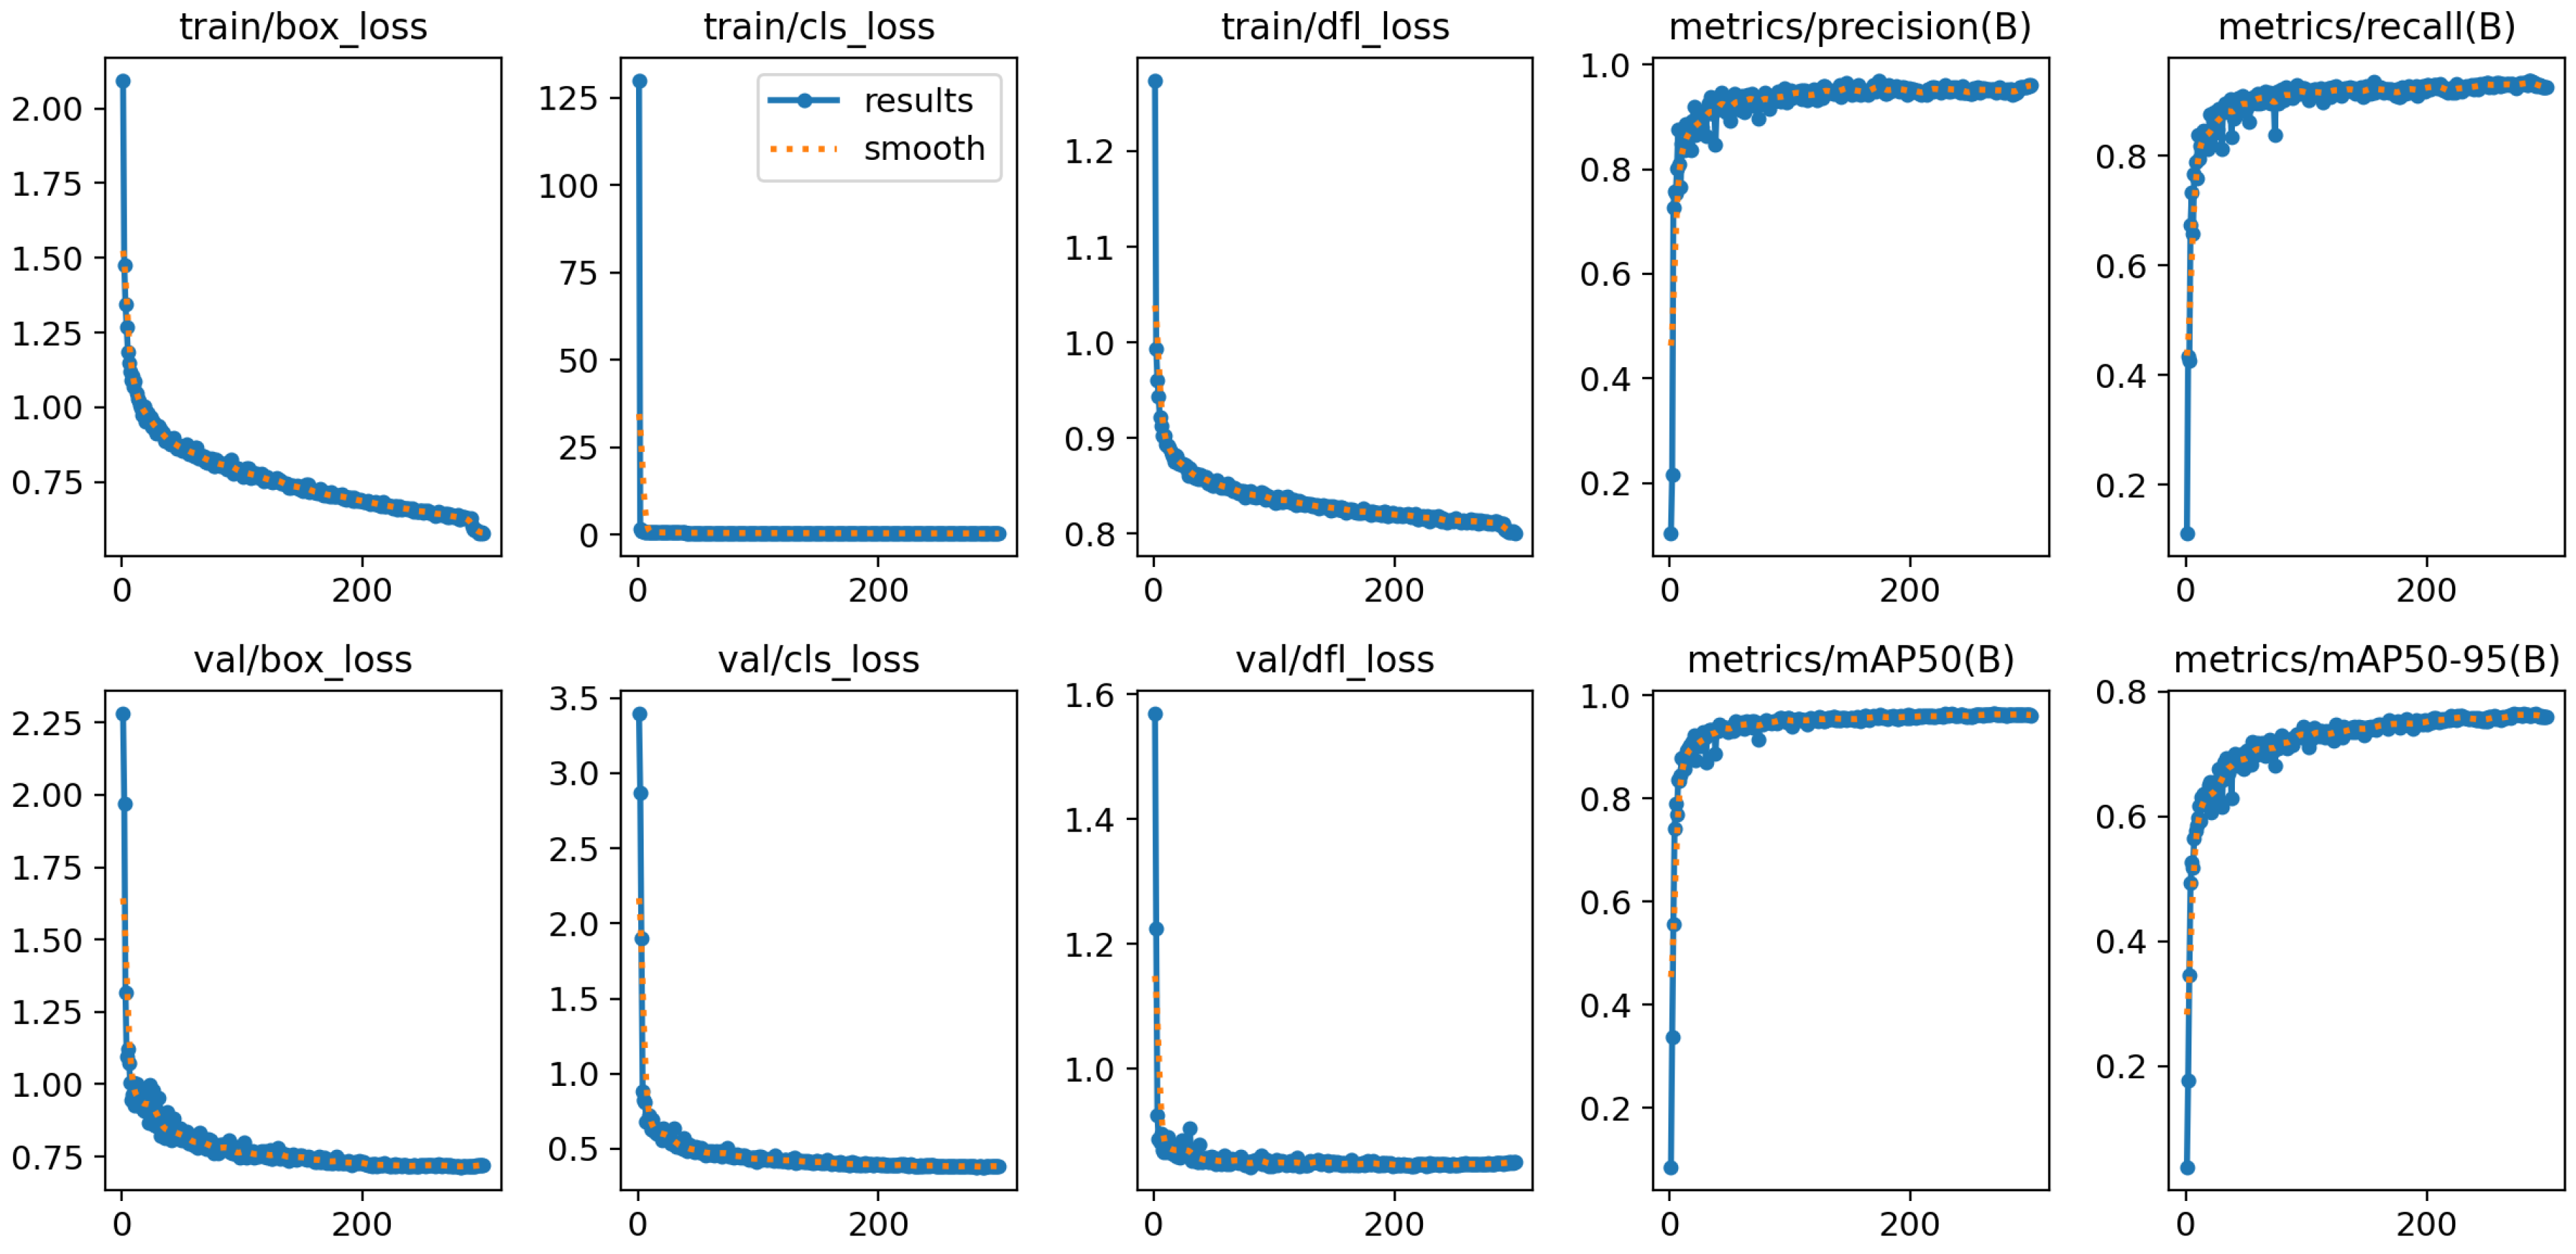
As shown in Figure 7, the training losses, including box loss, classification loss, and distribution focal loss, decrease rapidly in the early training stage and then gradually converge as the number of epochs increases. The validation losses exhibit a similar downward trend and remain stable in the later stage, indicating that the model does not show obvious overfitting. Meanwhile, precision, recall, mAP@0.5, and mAP@0.5:0.95 increase sharply during the initial epochs and then stabilize at high levels. These results demonstrate that the proposed DCS-YOLO model has good convergence stability and reliable detection performance on the SSLP dataset.
Figure 7.
Training and validation performance curves of the proposed DCS-YOLO model.
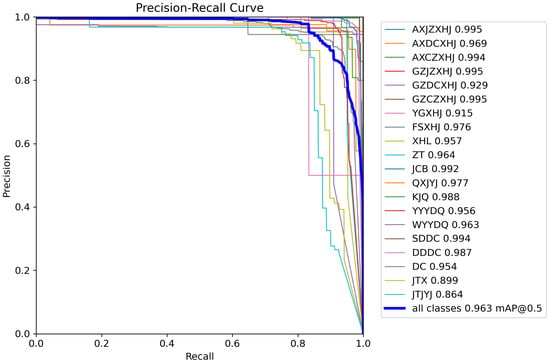
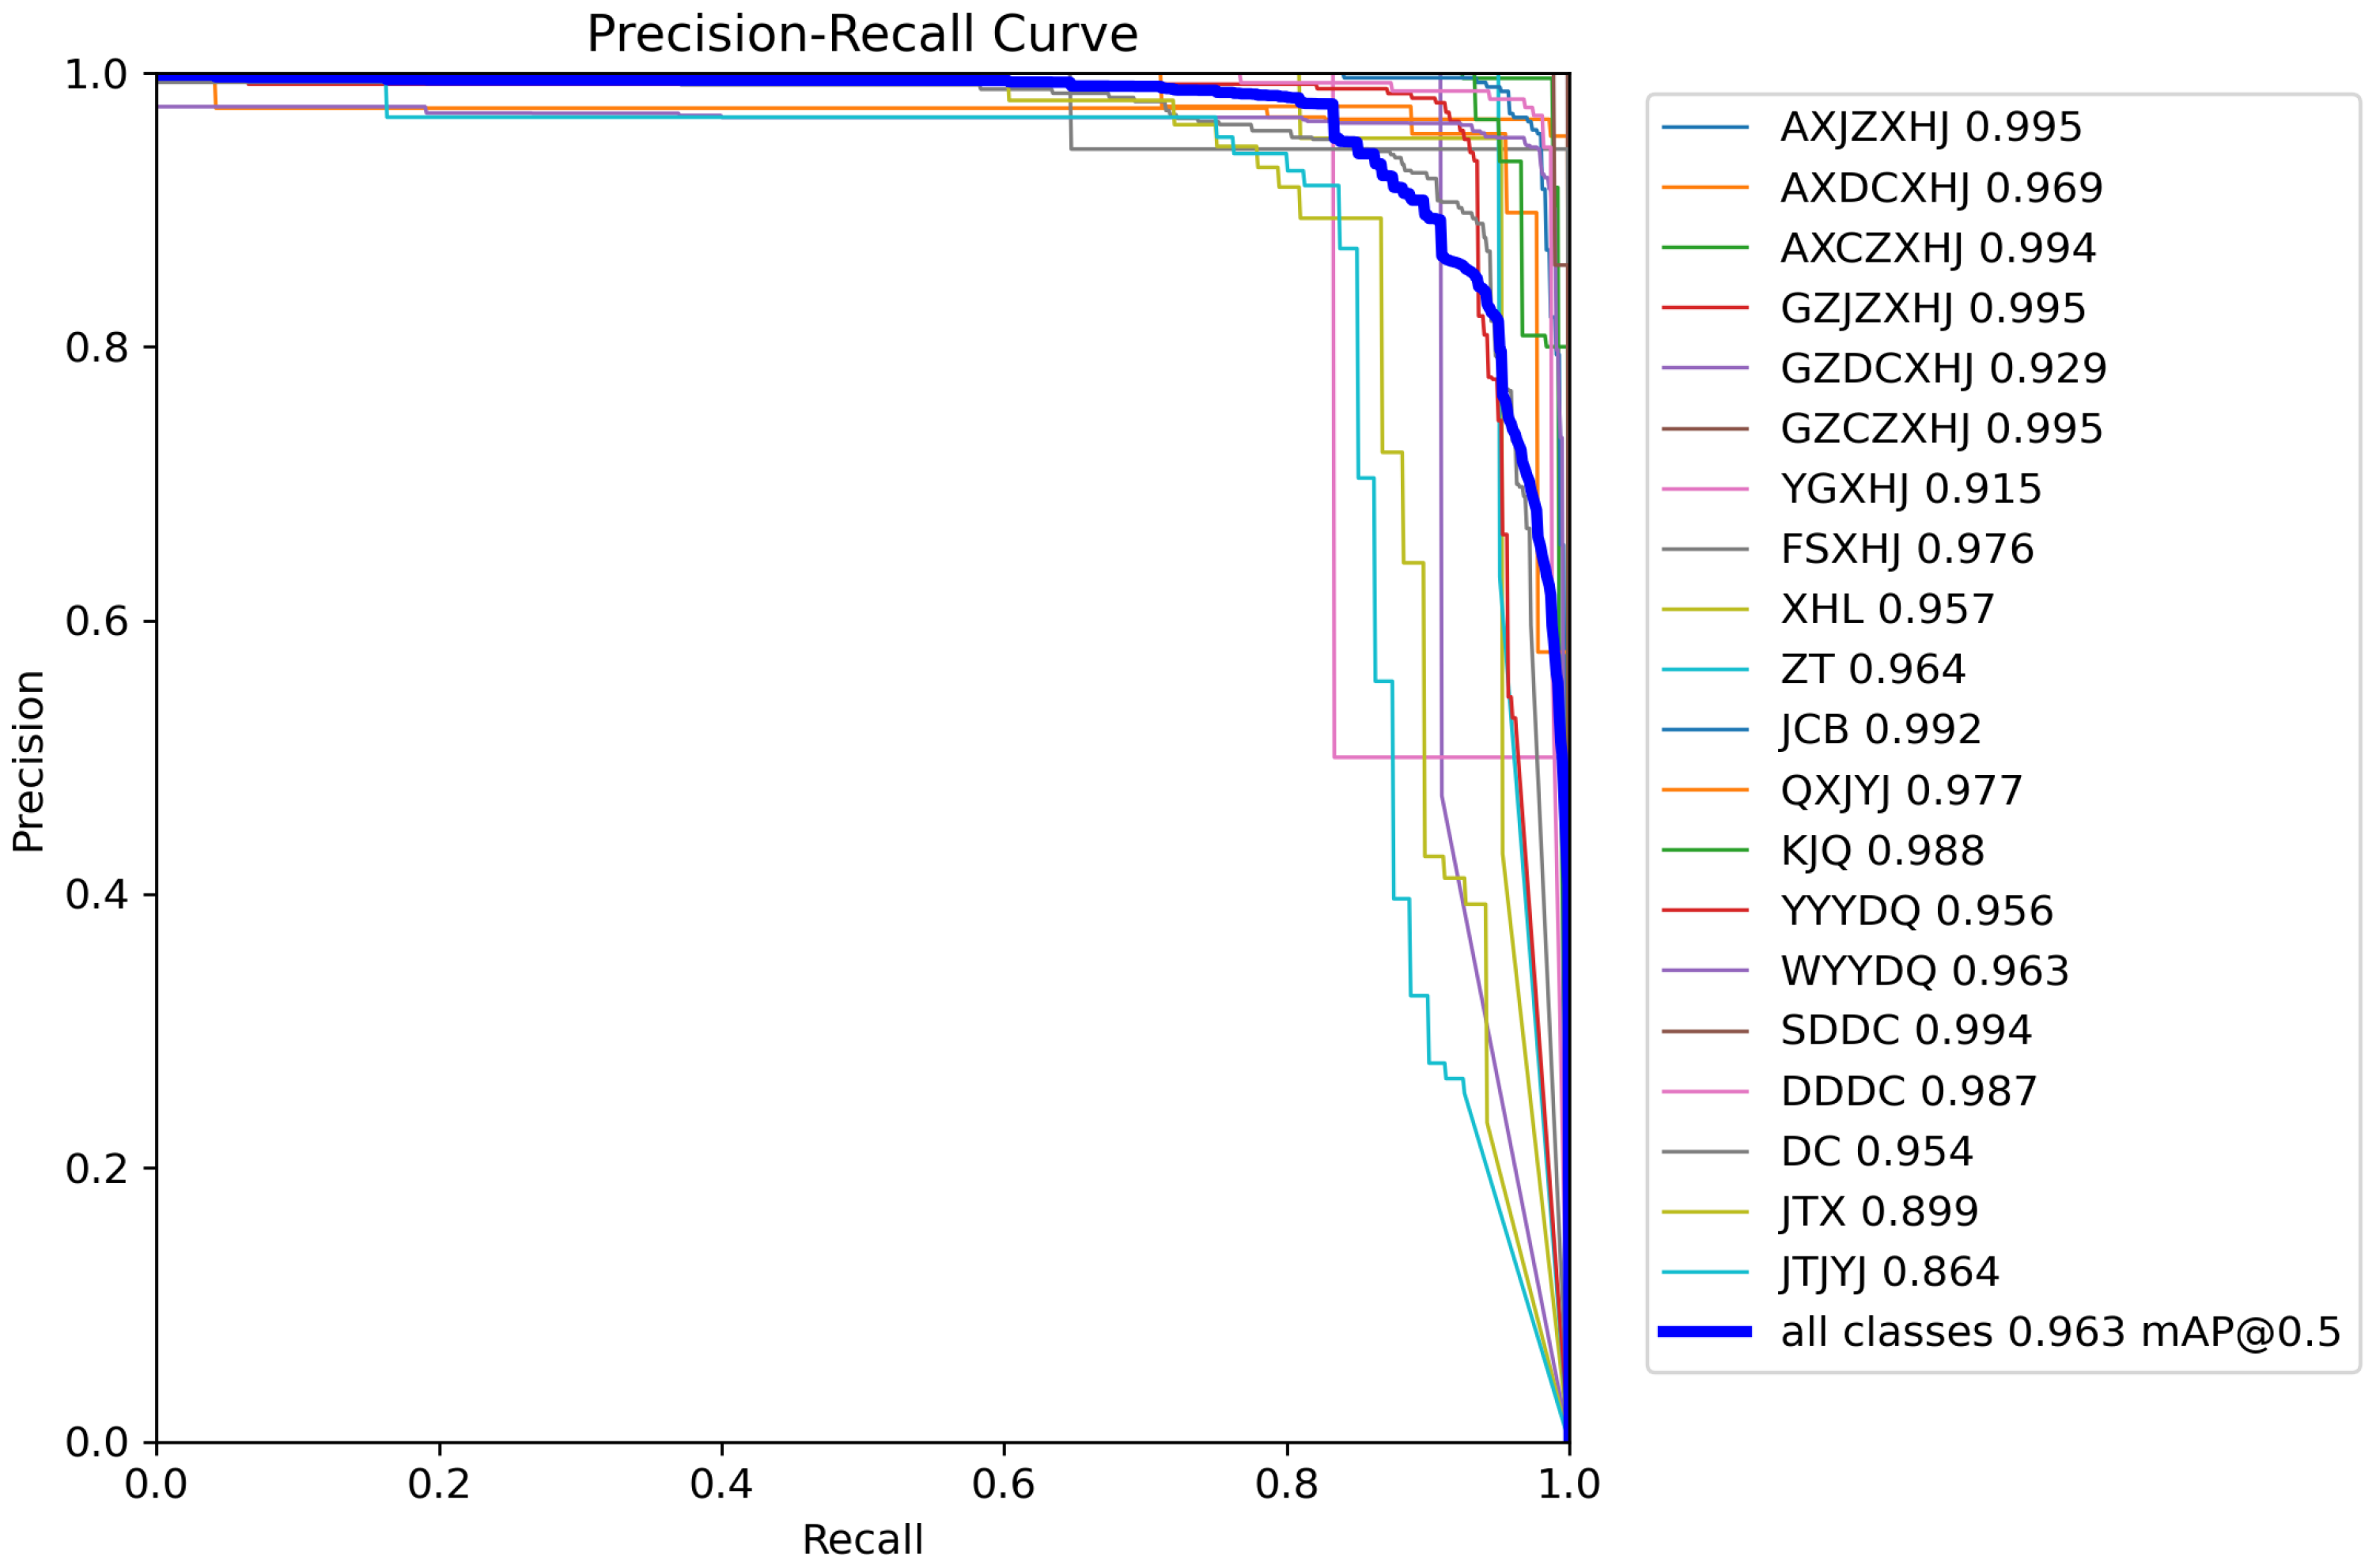
To further evaluate the class-wise detection performance of the proposed DCS-YOLO model, the precision–recall (P–R) curves obtained during model evaluation are analyzed, as shown in Figure 8. The bold blue curve indicates the overall performance across all categories, while the legend reports the AP@0.5 value for each symbol category. Most categories maintain high precision across a broad recall range, demonstrating the strong capability of DCS-YOLO in detecting equipment symbols in station signal layout plans.
Figure 8.
Precision–recall curves generated by the proposed DCS-YOLO model on the SSLP dataset.
As shown in Figure 8, the proposed DCS-YOLO model achieves an overall mAP@0.5 of 0.963, indicating strong class-wise detection performance on the SSLP dataset. Several categories, including “AXJZXHJ”, “AXCZXHJ”, “GZJZXHJ”, “GZCZXHJ”, “JCB”, and “SDDC”, obtain AP@0.5 values above 0.99, demonstrating highly stable detection performance for these symbols. For relatively complex categories such as “JTJYJ”, “JTX”, and “YGXHJ”, the model also maintains effective detection capability, with AP@0.5 values of 0.864, 0.899, and 0.915, respectively. Among them, “YGXHJ” contains only 98 annotated instances, while “JTJYJ” and “JTX” are small line-based symbols embedded in dense track structures. The results indicate that DCS-YOLO can achieve robust detection performance not only for categories with clear structural features, but also for low-frequency, small-scale, and visually similar symbols in complex SSLPs.
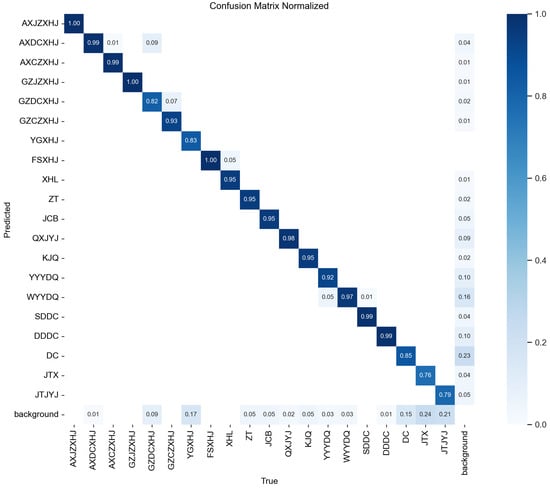
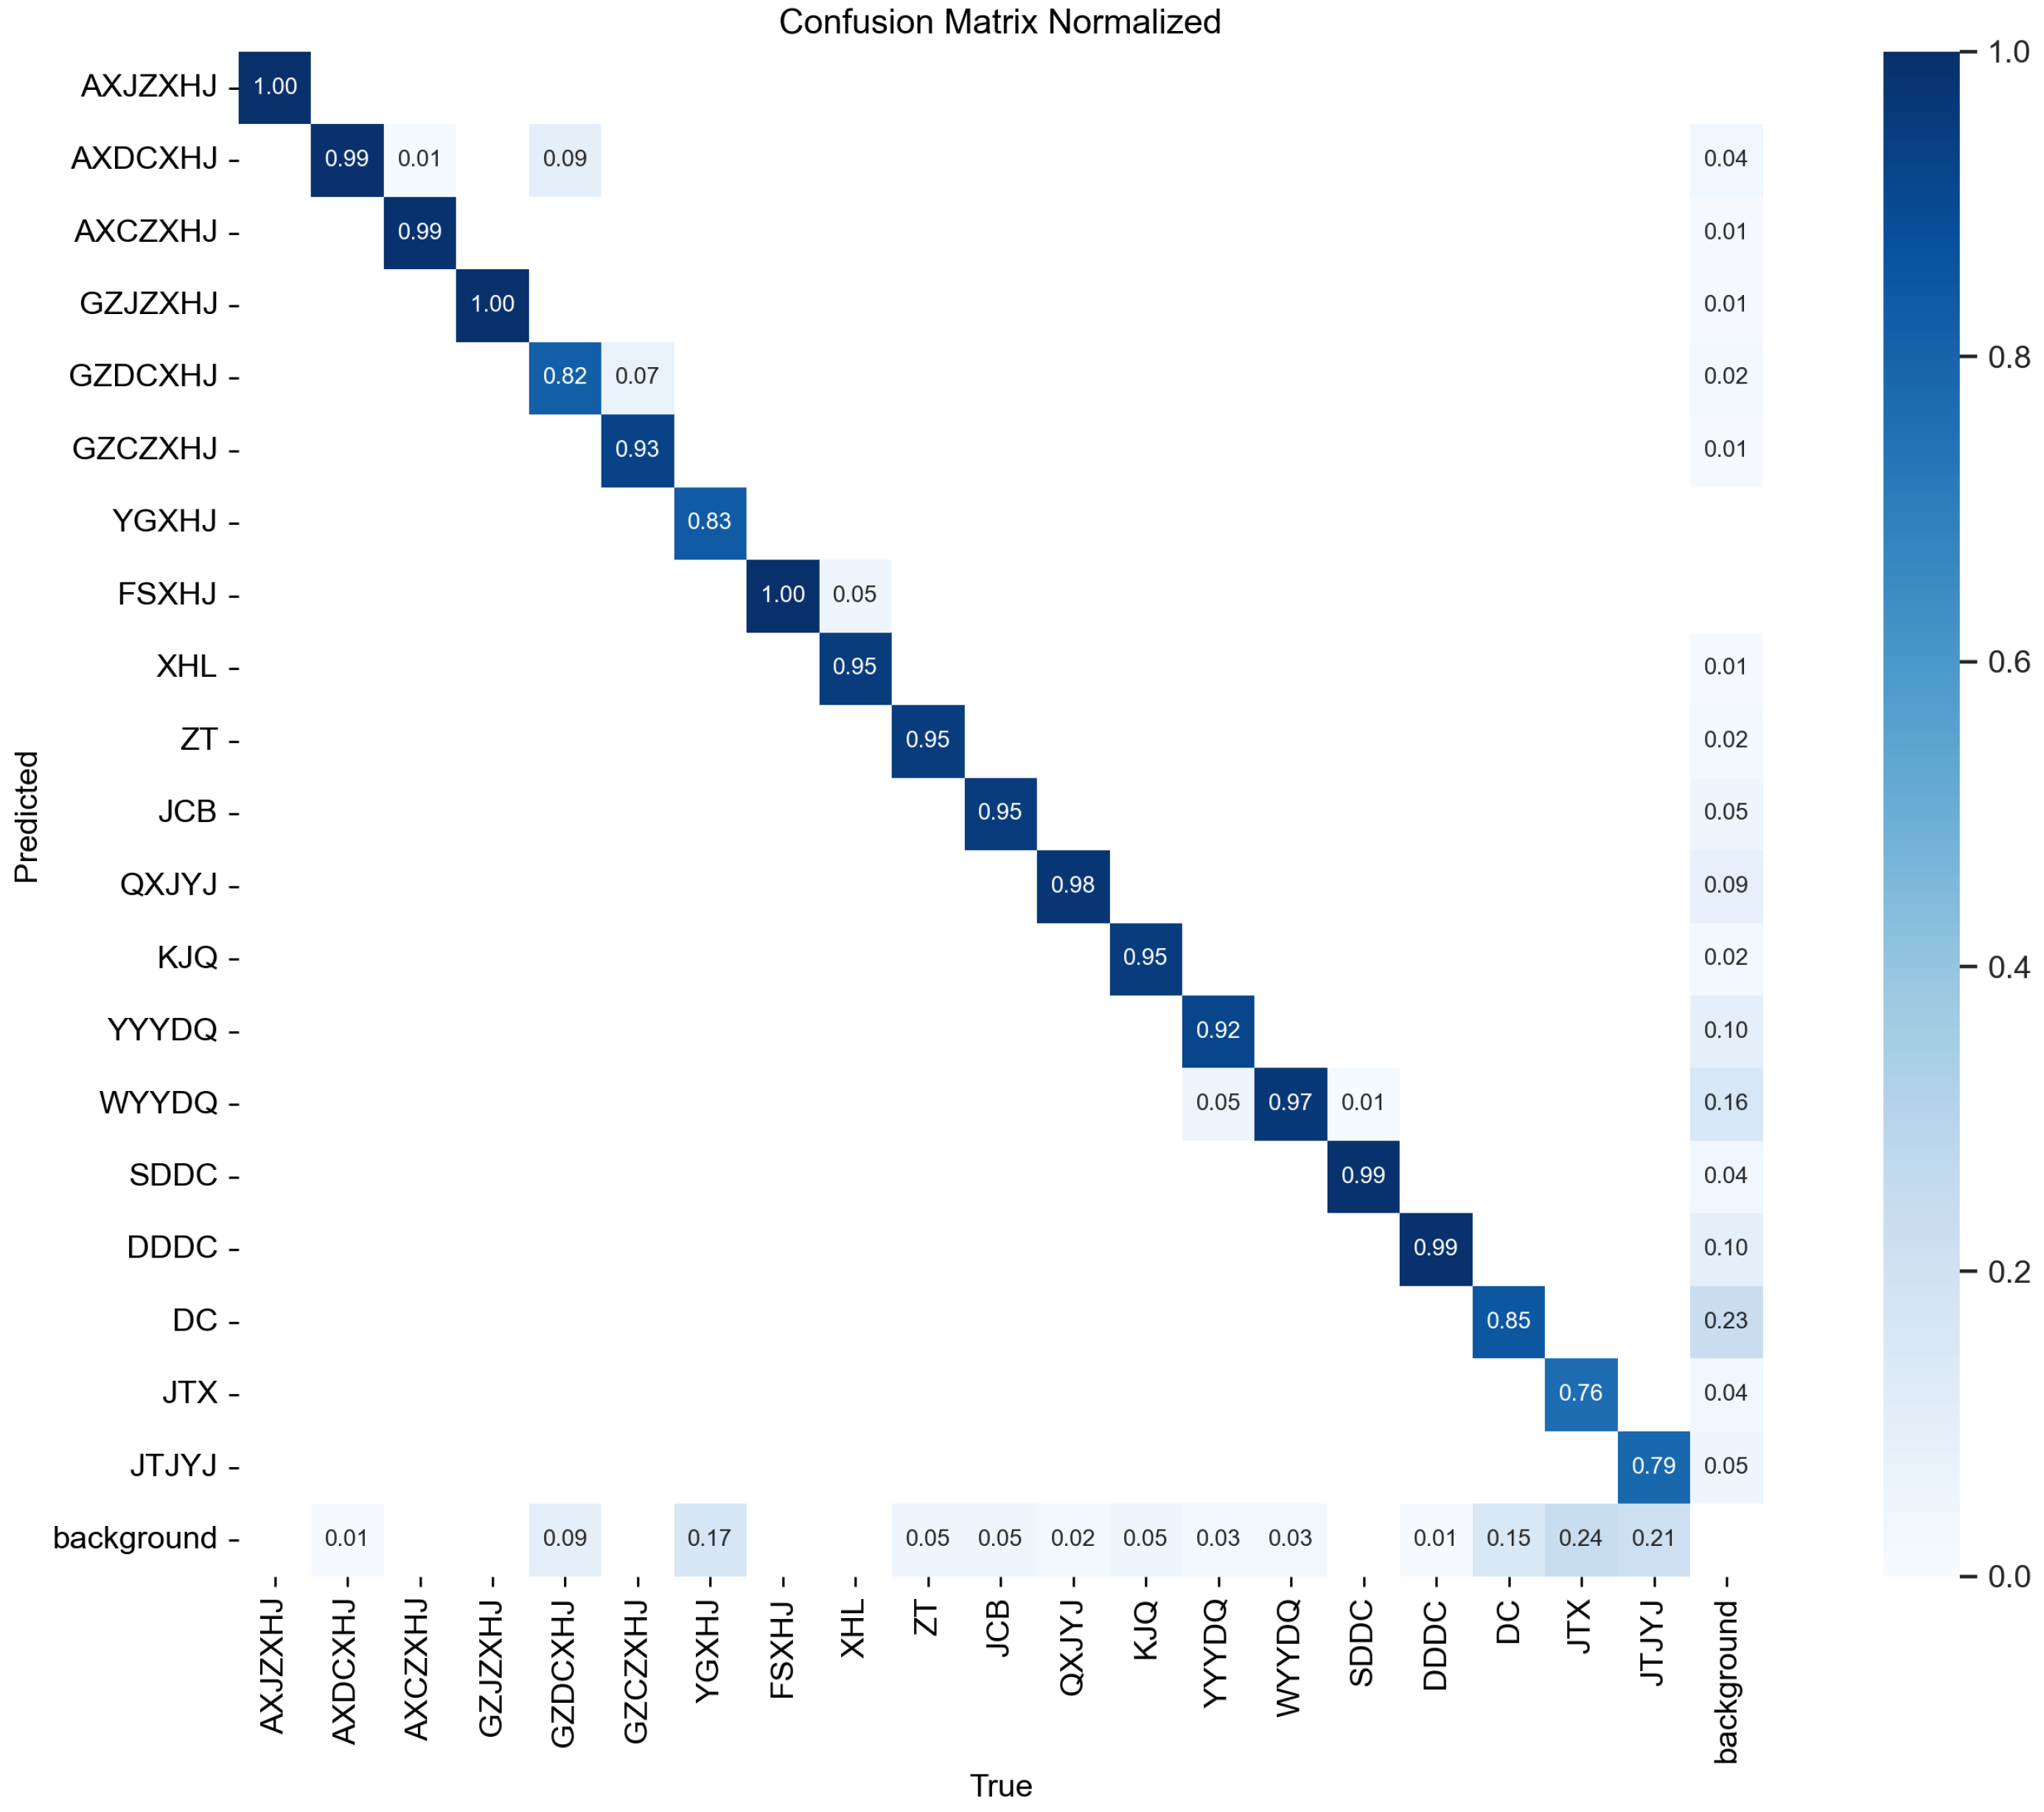
To further analyze the class-wise error distribution of the proposed DCS-YOLO model, the normalized confusion matrix generated during model evaluation is shown in Figure 9. The horizontal axis represents the true categories, while the vertical axis represents the predicted categories. The diagonal values indicate the proportion of correctly classified samples for each category, whereas the off-diagonal values reflect misclassification or missed detection cases.
Figure 9.
Normalized confusion matrix generated by the proposed DCS-YOLO model.
As shown in Figure 9, the normalized confusion matrix exhibits clear diagonal dominance, indicating that DCS-YOLO can effectively distinguish most symbol categories in SSLPs. Most categories achieve high diagonal values, demonstrating stable class-discrimination performance. For categories with relatively lower diagonal values, “JTX” and “JTJYJ” obtain 0.76 and 0.79, respectively, mainly because these dead-end track-related symbols are small and embedded in dense track lines. “YGXHJ” obtains 0.83, which is related to its limited number of annotated samples. These results are consistent with the class-wise AP results shown in Figure 8, further confirming the robustness and effectiveness of DCS-YOLO in complex SSLP symbol recognition.
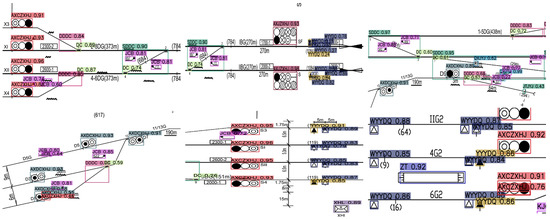
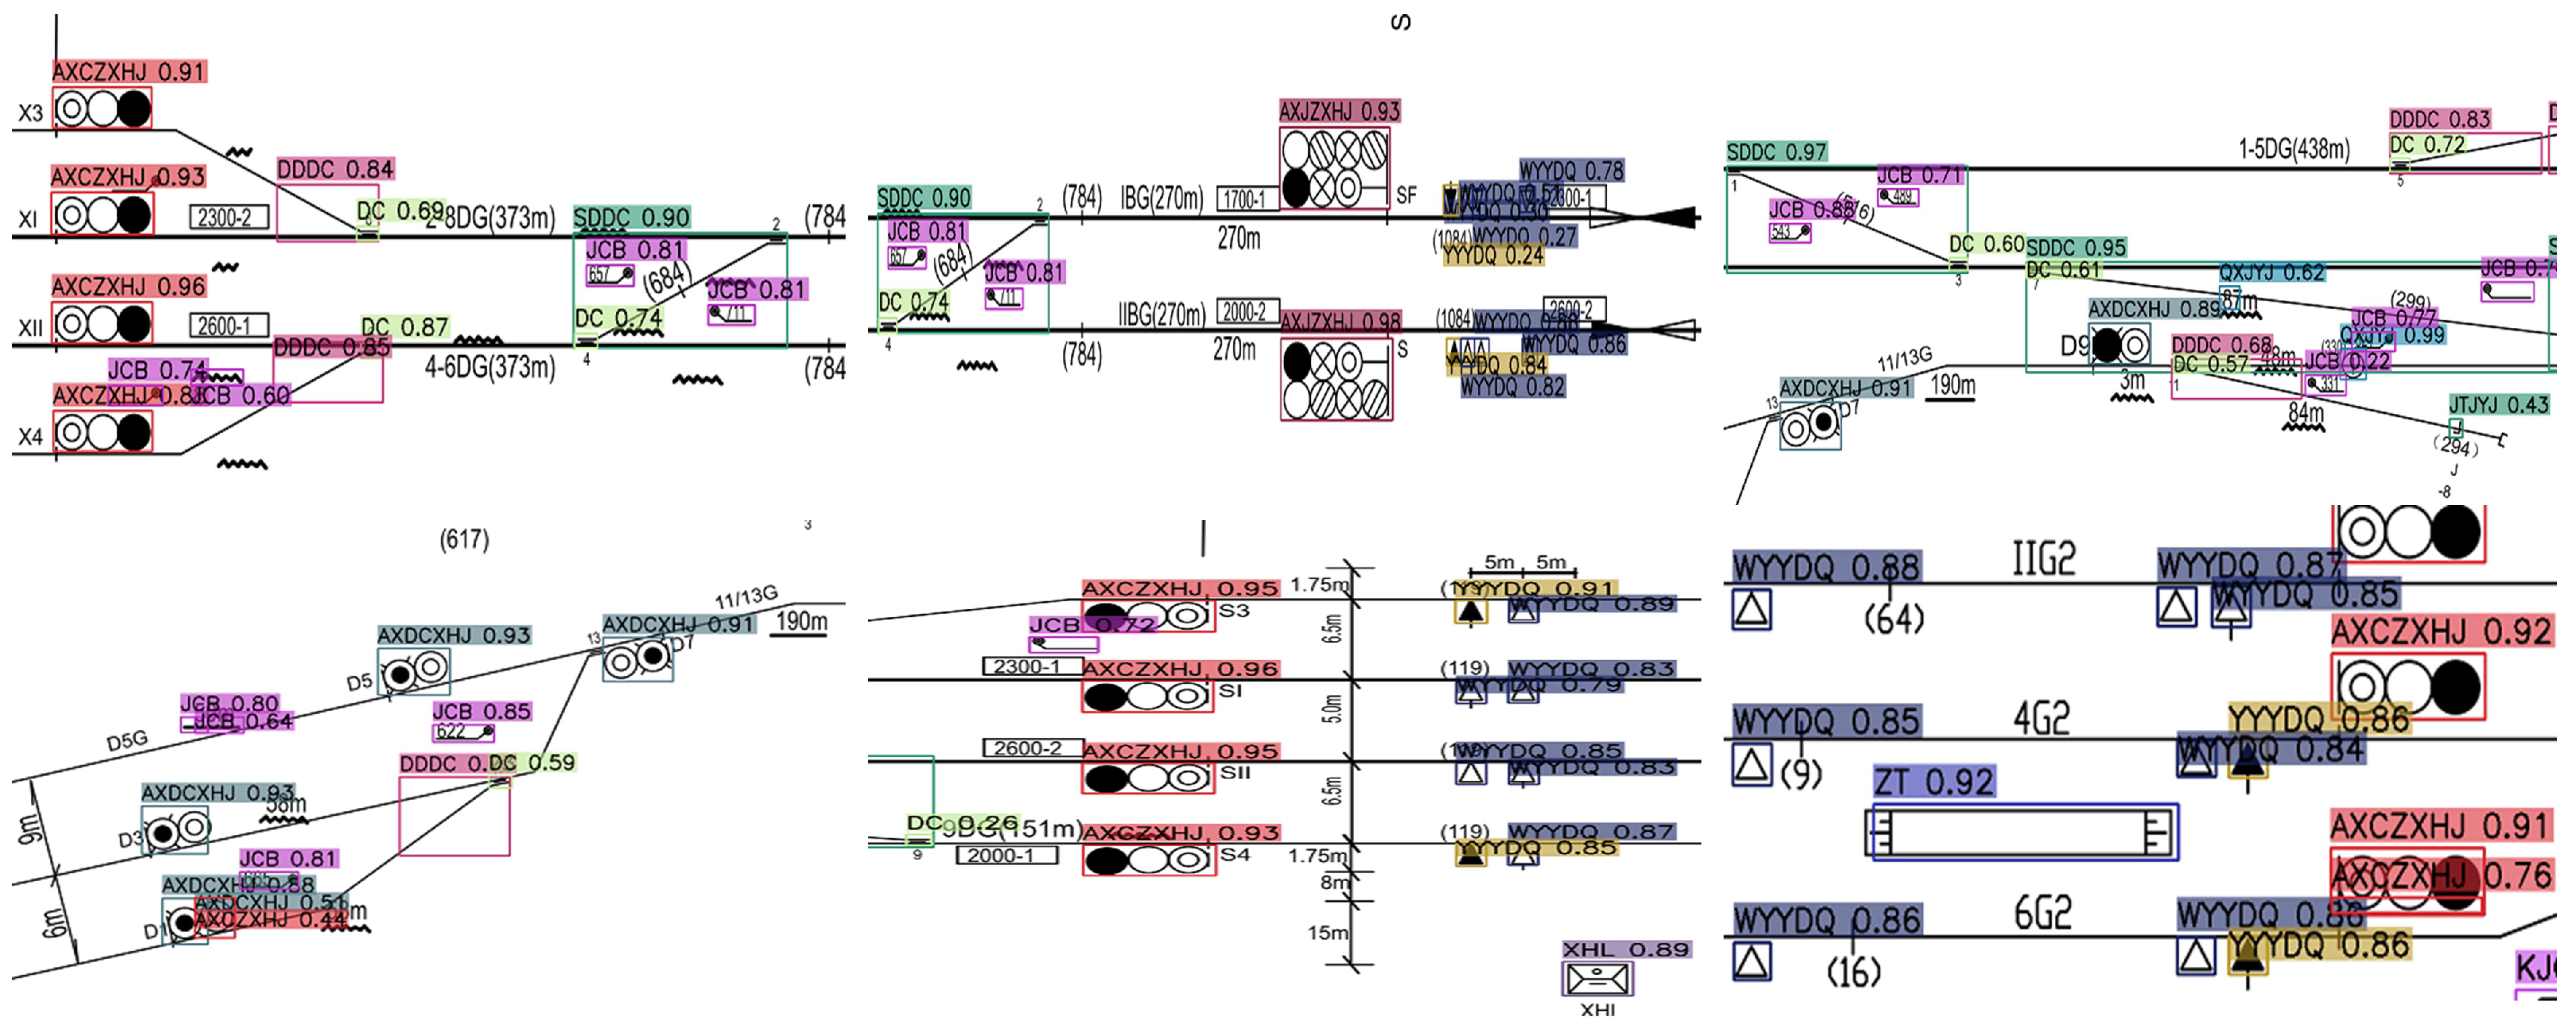
Based on the above results, DCS-YOLO was selected for further visualization of detection performance. Representative detection results from selected SSLPs are shown in Figure 10.
Figure 10.
Representative detection results on SSLPs.
4.2. Comparison of Experimental Detection Results
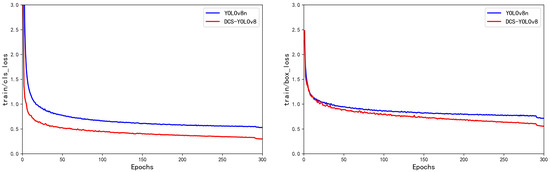
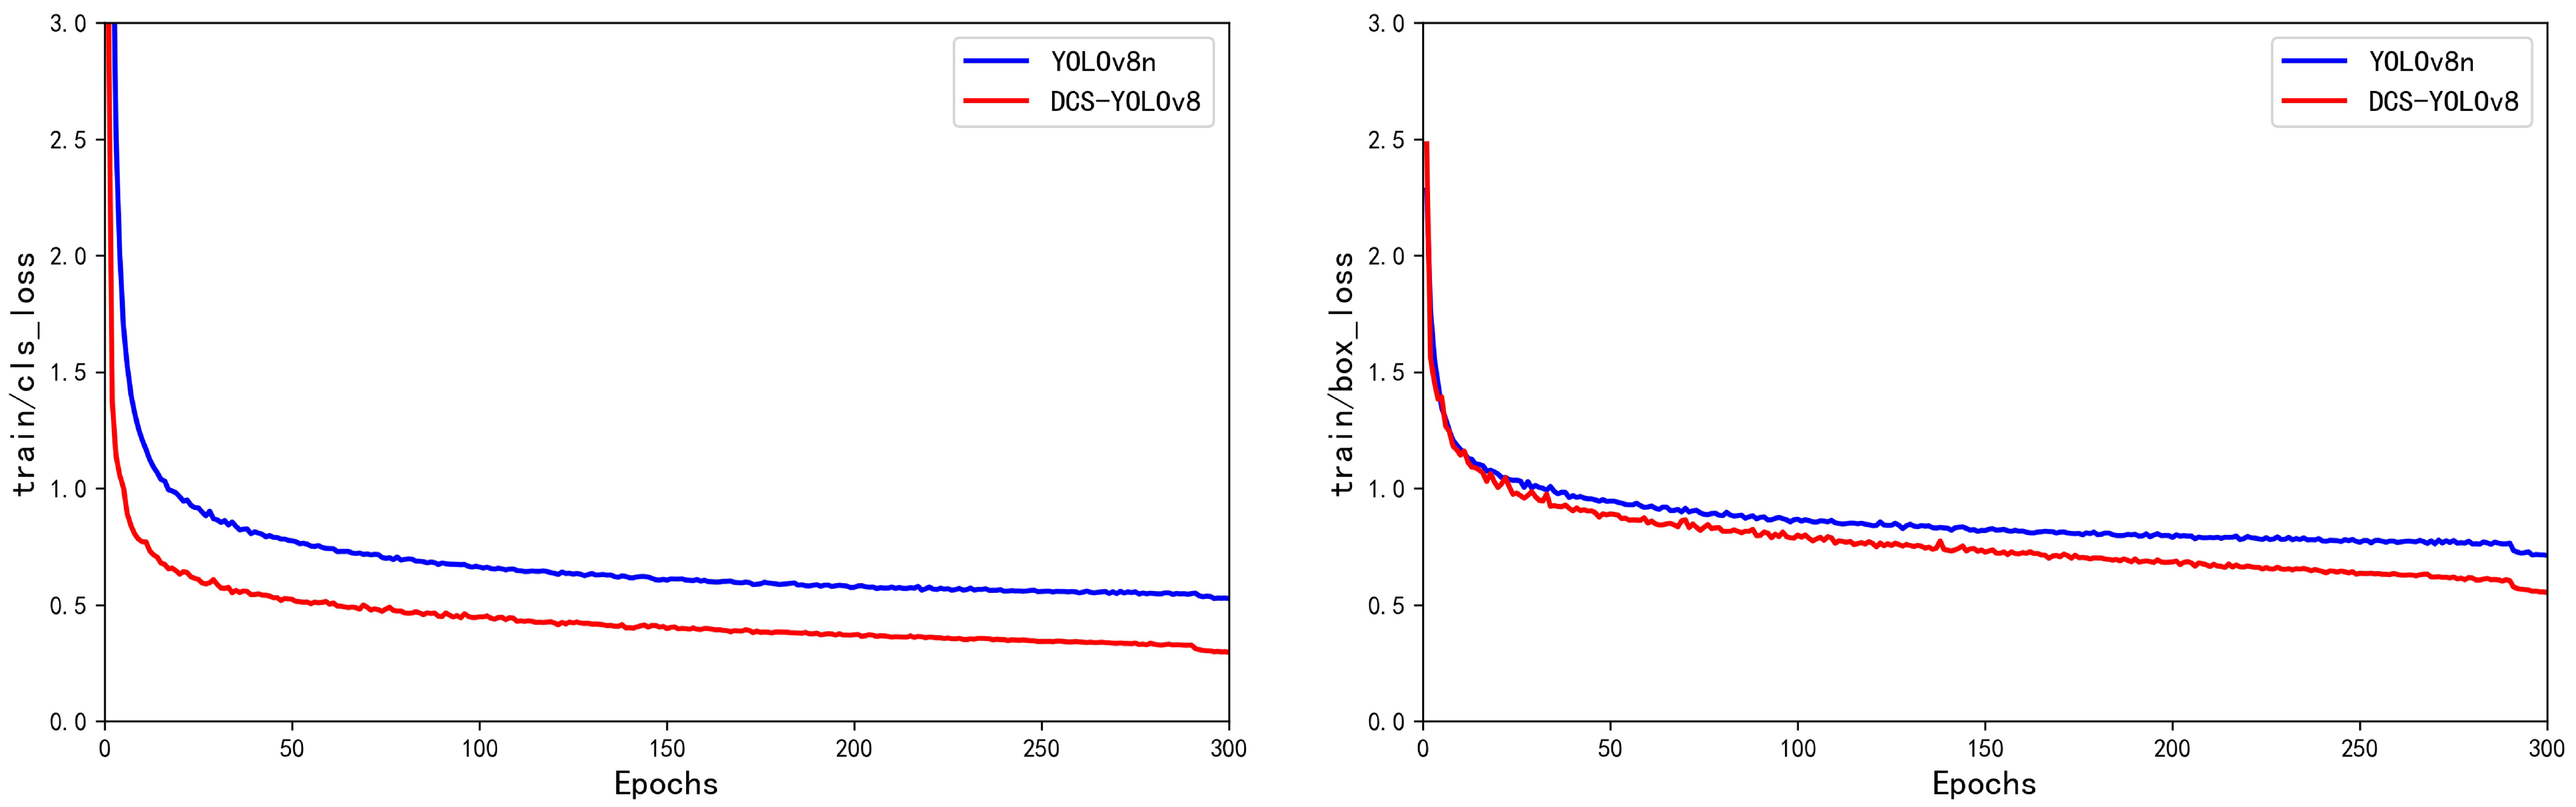
To further evaluate the effectiveness of the proposed algorithm, the training curves are shown in Figure 11. The figure presents the training results of both the baseline and improved models over 300 epochs. Comparative analysis reveals a clear reduction in both classification loss and bounding-box loss during training, demonstrating that the proposed enhancements substantially improve object detection performance on SSLPs.
Figure 11.
Training curve comparison of baseline and improved models.
4.3. Ablation Experiments
To comprehensively evaluate the performance gains brought by the three optimization strategies, namely DWRSeg, CLLAHead, and Slide Loss, a series of ablation experiments were conducted on the SSLP dataset. The results are summarized in Table 4.
Table 4.
Performance Comparison of Different YOLOv8n Variants.
As shown in Table 4, incorporating DWRSeg improves the F1 score from 0.923 to 0.934 and increases mAP@0.5 from 0.942 to 0.947, indicating that this module enhances multi-scale contextual feature extraction. When CLLAHead is used alone, the F1 score increases from 0.923 to 0.936 and mAP@0.5:0.95 increases from 0.743 to 0.757, whereas mAP@0.5 decreases from 0.942 to 0.935. This result suggests that CLLAHead improves localization quality under stricter IoU thresholds by introducing low-level spatial details into the detection head. However, when used alone, it may also change the confidence distribution of some easy samples, leading to a slight decrease under the relatively loose IoU threshold of 0.5.
The effect of Slide Loss is relatively limited in terms of global metrics when it is used alone, with F1 increasing from 0.923 to 0.926 and mAP@0.5 increasing from 0.942 to 0.943. This is because Slide Loss does not introduce additional feature extraction layers. Instead, it adjusts the loss contributions of samples with different localization difficulties and guides the model to pay more attention to hard samples during training. Slide Loss does not uniformly improve the AP@0.5 values of all categories. Some majority or easily recognized categories show slight AP decreases, while several difficult or low-frequency categories, such as GZDCXHJ, GZCZXHJ, YGXHJ, and FSXHJ, obtain clear improvements. This indicates that Slide Loss mainly provides a targeted optimization effect for selected hard categories rather than uniformly improving all classes, as shown in Table 5.
Table 5.
Per-class AP@0.5 comparison of YOLOv8n, YOLOv8n + Slide Loss, and DCS-YOLO.
The three modules are complementary. DWRSeg enhances multi-scale contextual representation in the neck network, CLLAHead refines local boundary information in the detection head, and Slide Loss adjusts the optimization focus toward difficult samples. As a result, the full DCS-YOLO model achieves the best comprehensive performance, with an F1 score of 0.942 and mAP@0.5 of 0.963.
4.4. Visualization of Experimental Results
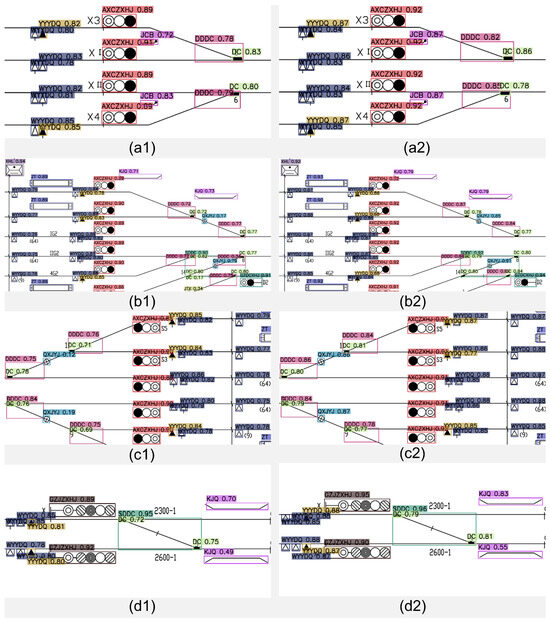
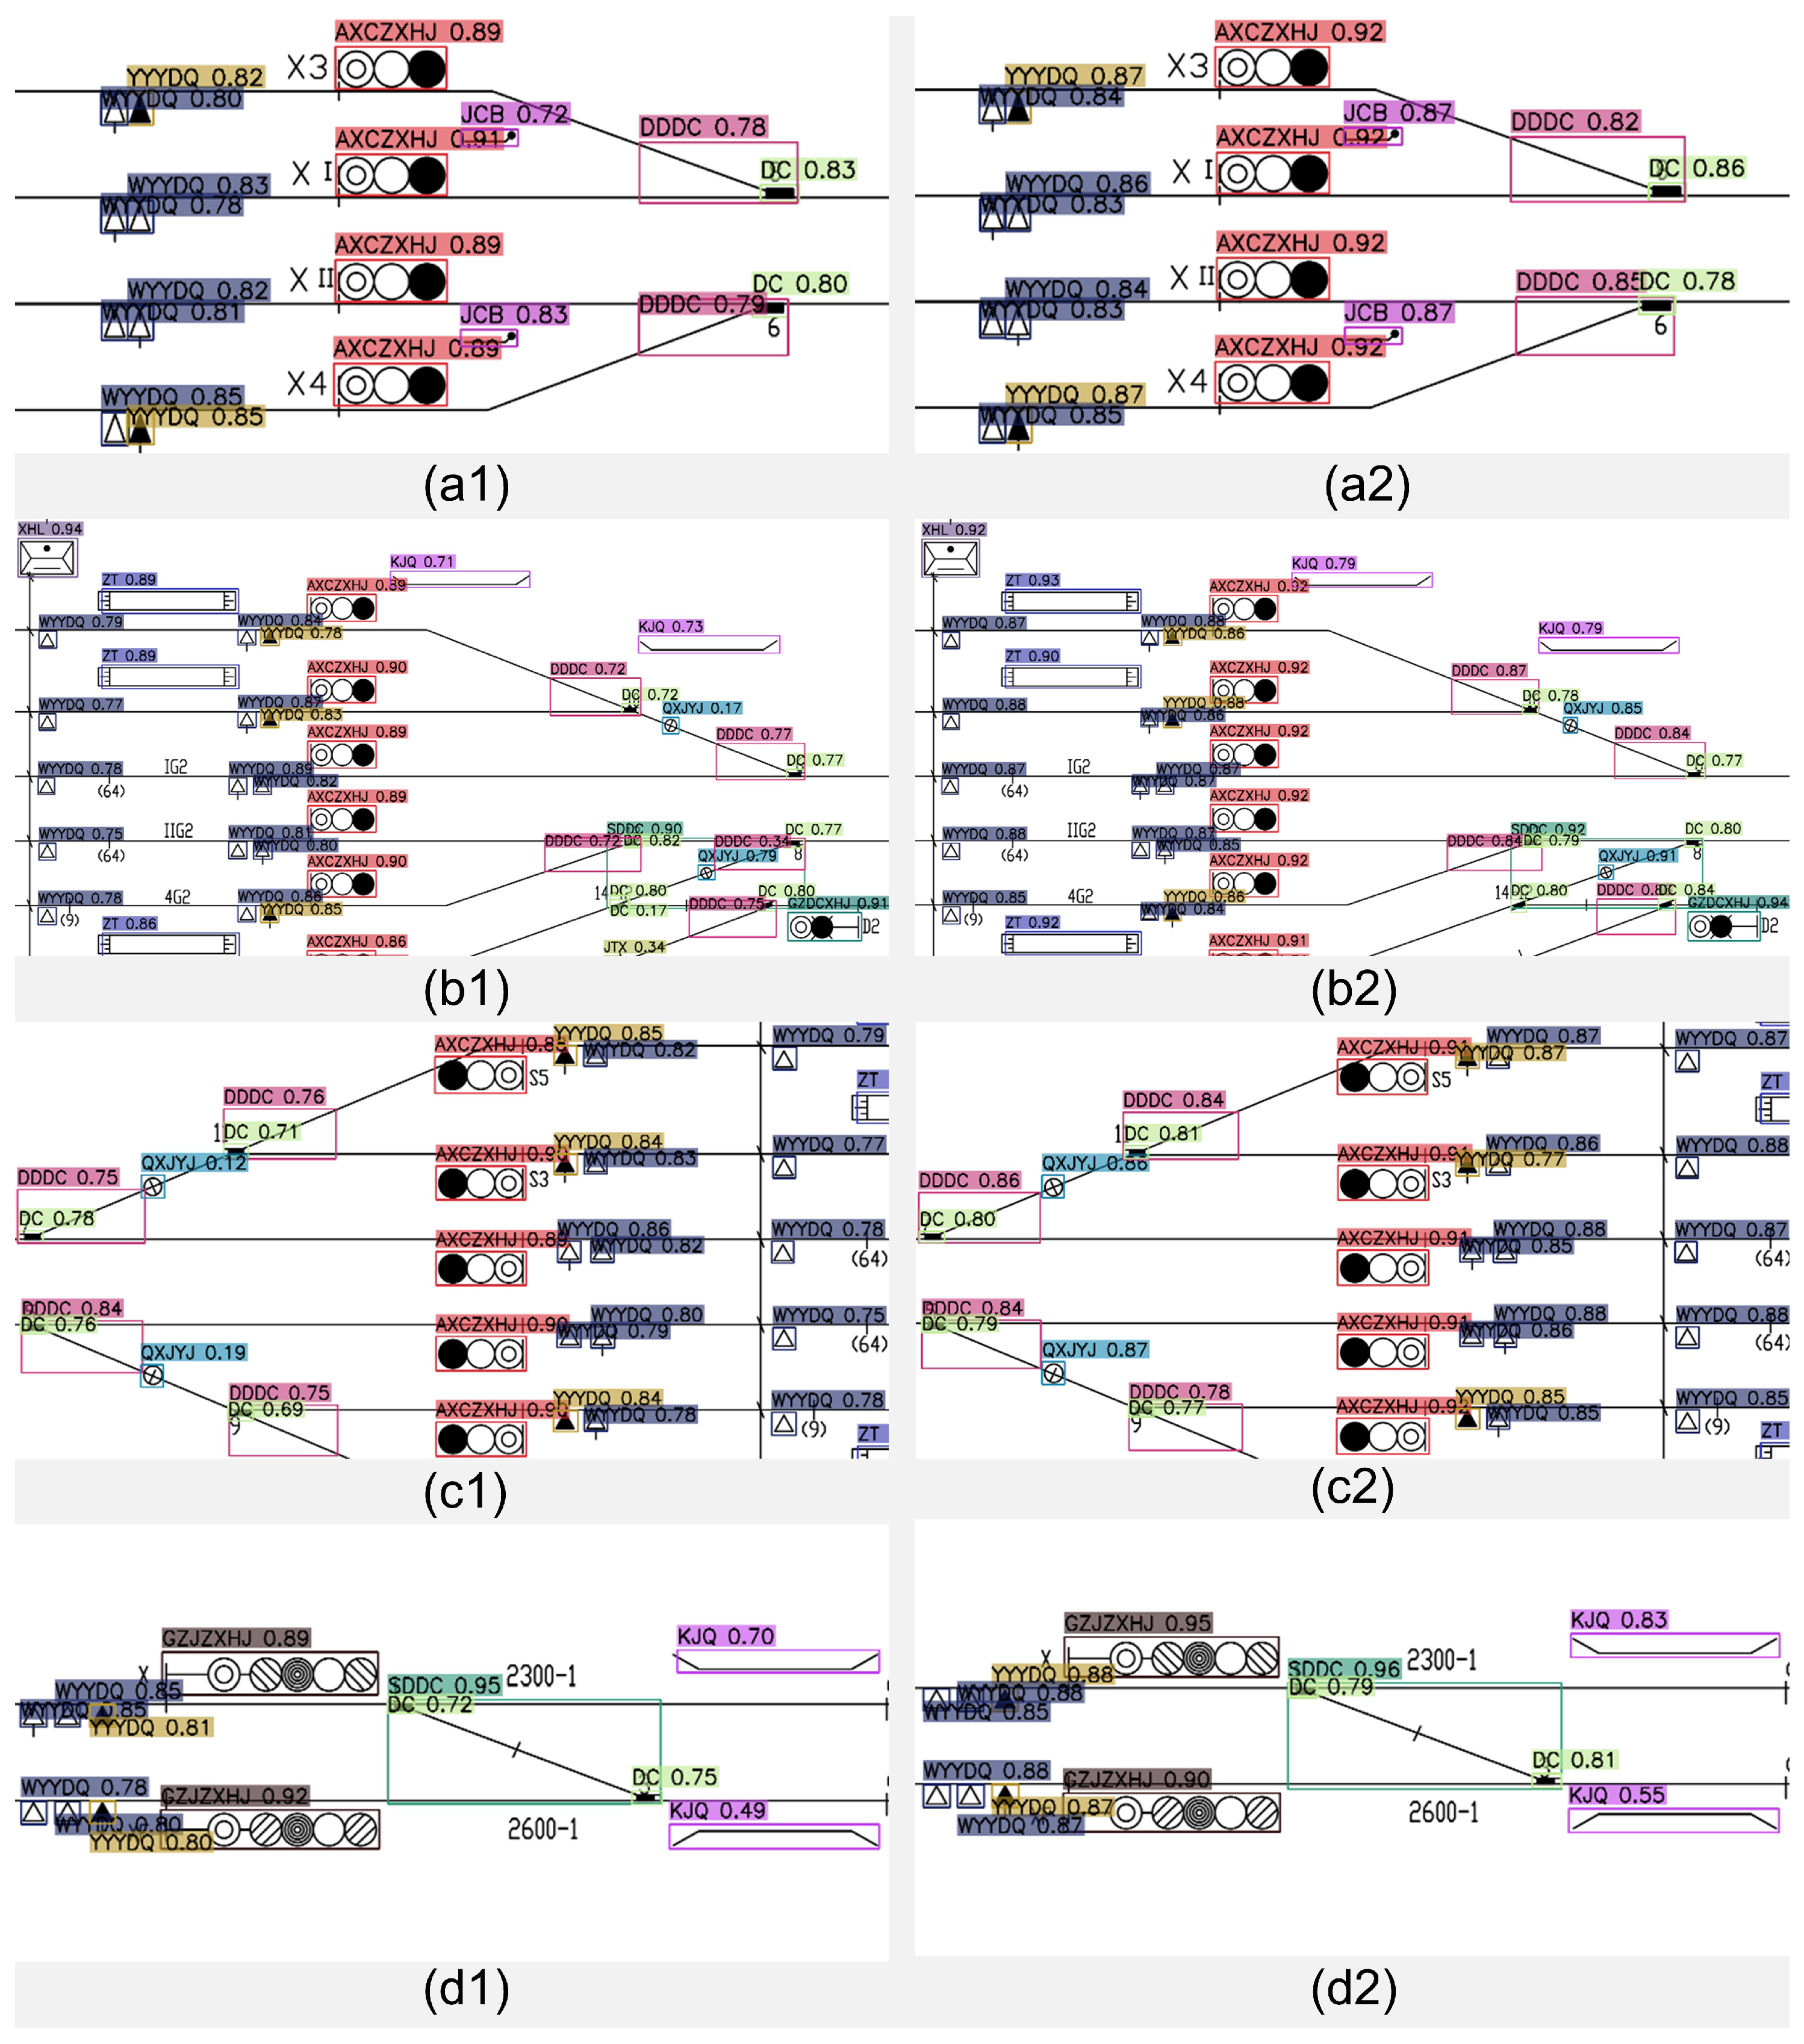
To further demonstrate the enhanced detection capability of the proposed model for railway station signal layout diagrams, we visually compared the results of the original YOLOv8n model and the improved DCS-YOLO model on the constructed dataset, as shown in Figure 12. The left column shows the detection results of YOLOv8n, while the right column presents those of DCS-YOLO. Overall, DCS-YOLO achieves better detection performance across targets of different scales, including small objects such as fouling posts, active balises, and passive balises; medium-sized objects such as signal buildings; and large objects such as frame bridges.
Figure 12.
Comparison of partial inspection results for SSLPs.
As shown in Figure 12, the improved model generally produces higher confidence scores and more reliable detection results. For example, in the comparison between (a1) and (a2), the confidence scores of several targets, including “AXCZXHJ”, “JCB”, and “DDDC”, increase after introducing DCS-YOLO. In (b1) and (b2), although the confidence score of “XHL” slightly decreases from 0.94 to 0.92, the improved model still demonstrates better overall detection performance. More notably, in (c1) and (c2), YOLOv8n detects the small target “QXJYJ” with confidence scores of only 0.12 and 0.19, whereas DCS-YOLO increases these values to 0.86 and 0.87, respectively. This substantial improvement indicates that the proposed model greatly enhances small-object detection. Moreover, the results in (d1) and (d2) show that DCS-YOLO maintains stable detection performance for larger objects, such as “GZJZXHJ”, “SDDC”, and “KJQ”. These visual comparisons demonstrate that the proposed model improves small-object detection while maintaining strong overall performance, thereby confirming its effectiveness over the original YOLOv8n model.
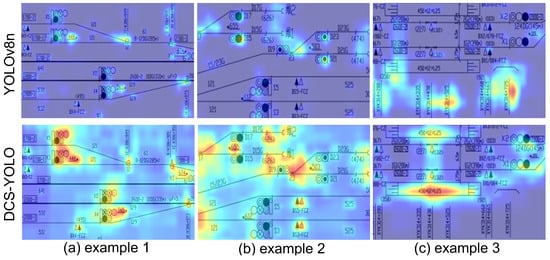
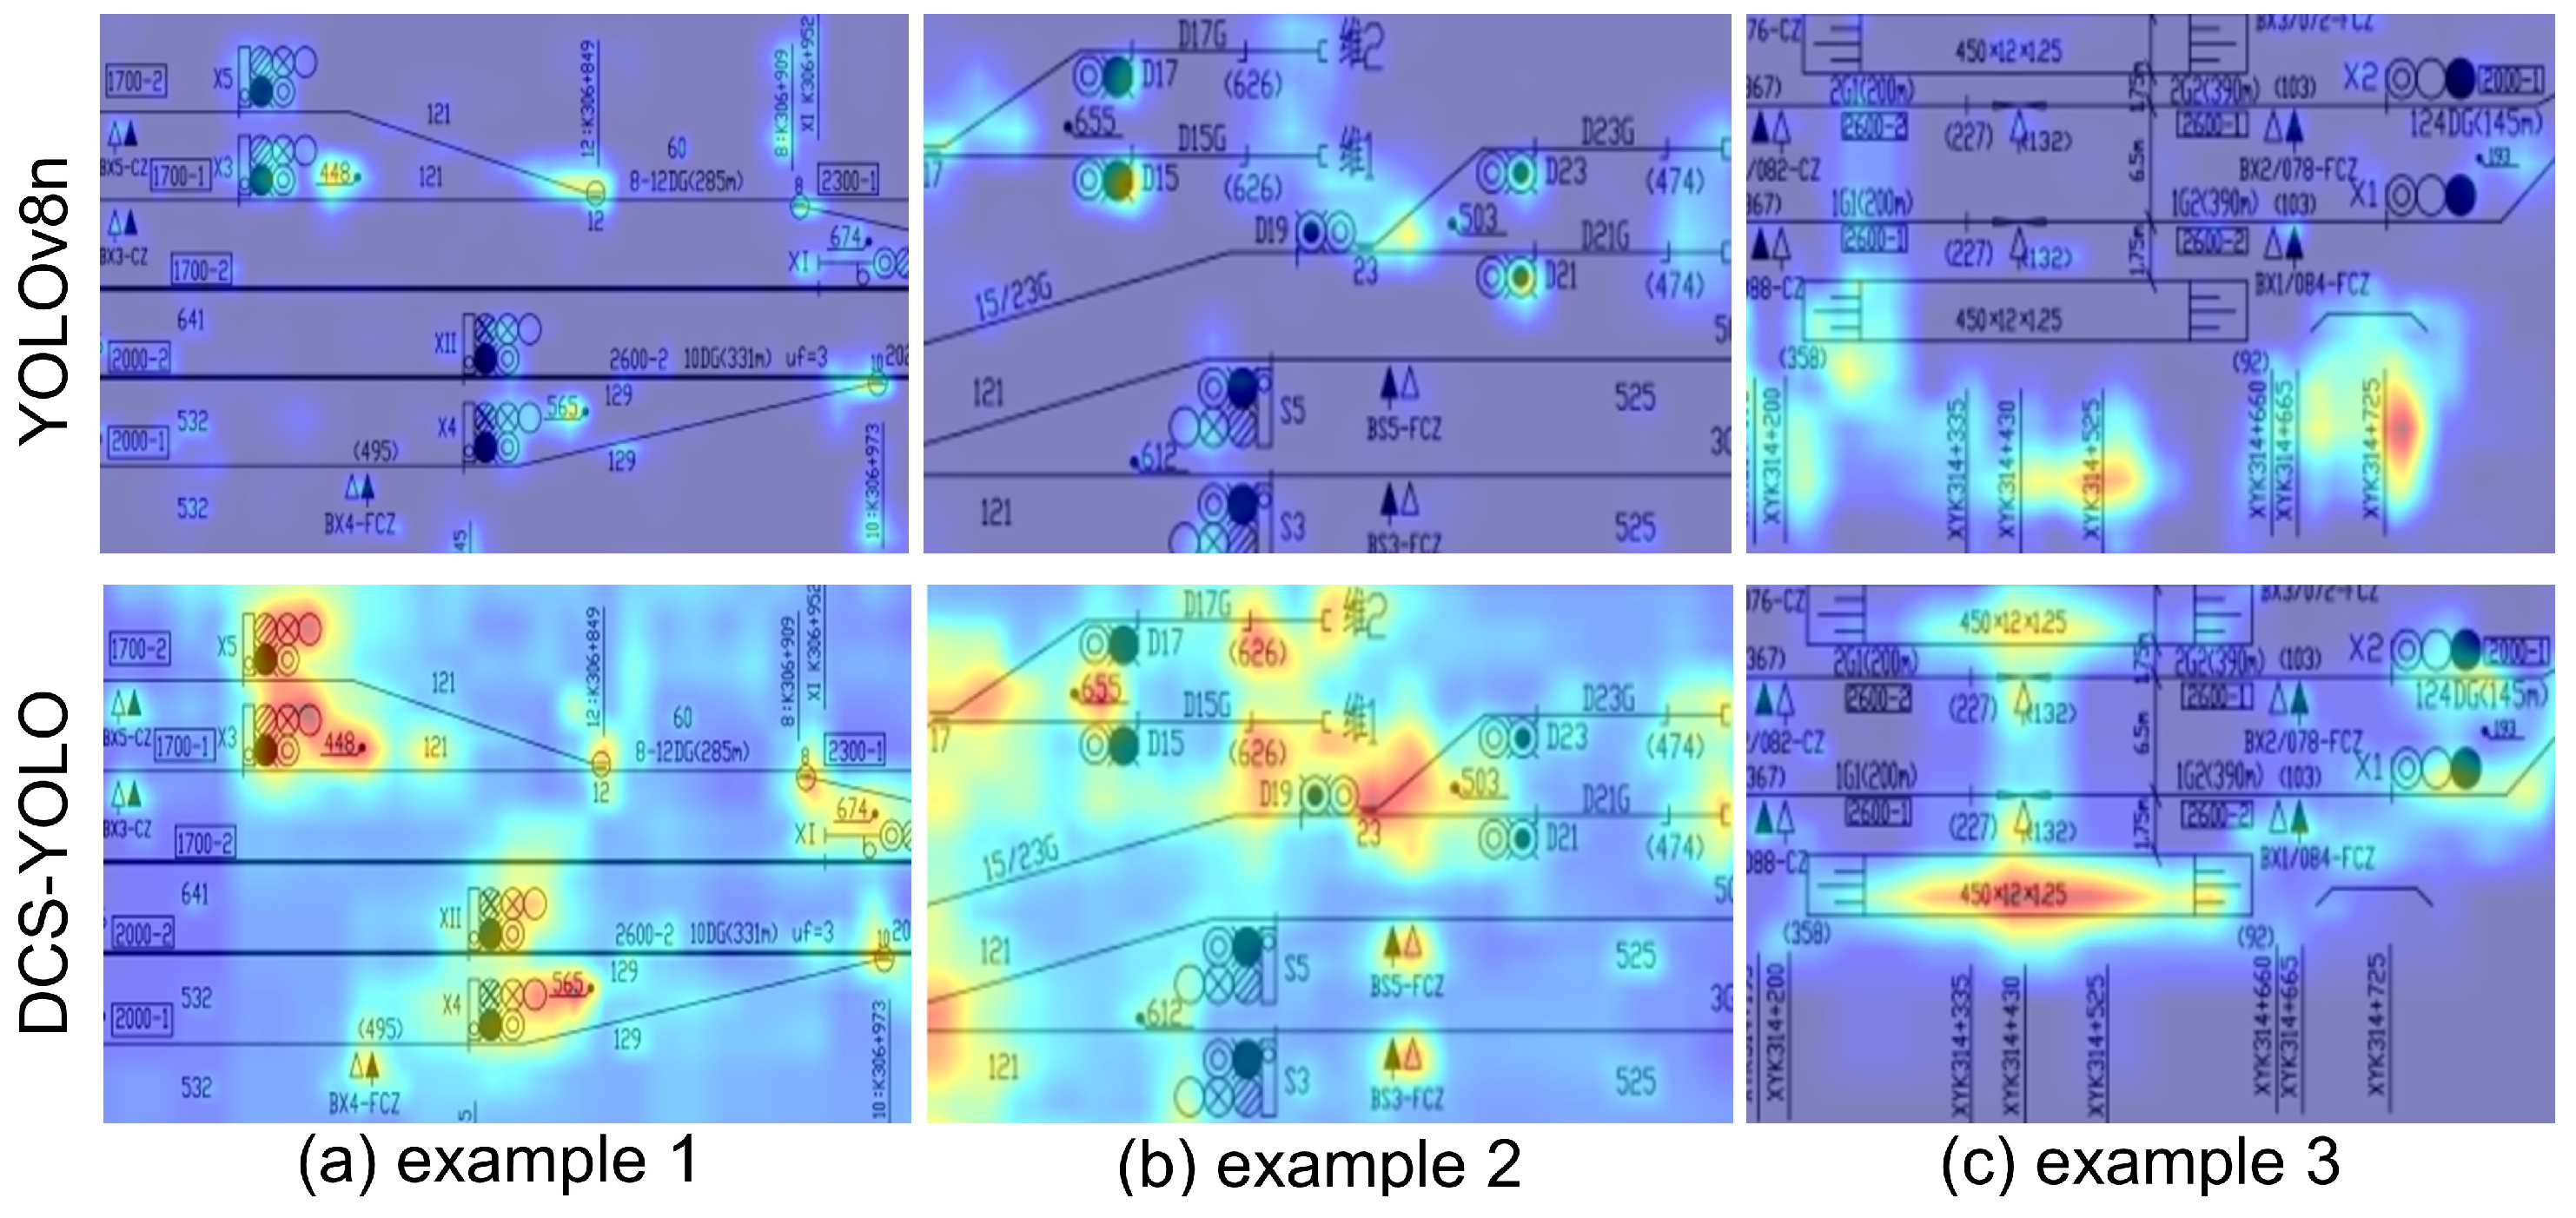
To further analyze the improvements introduced by DCS-YOLO, the outputs of the last three detection heads were visualized using heatmaps, as shown in Figure 13. To improve interpretability and provide deeper insight into the model’s feature extraction process, Grad-CAM (Gradient-weighted Class Activation Mapping) was incorporated into the object detection framework.
Figure 13.
Grad-CAM visualization comparison of YOLOv8n and DCS-YOLO.
The basic principle of Grad-CAM is to compute the gradients of category predictions with respect to convolutional feature maps, thereby deriving importance weights for each feature map in predicting specific categories. These weights are then combined with the corresponding feature maps to generate category-specific visual heatmaps. In this process, the output score of the predicted category reflects detection performance, convolutional feature maps capture the model’s responses at different spatial locations, and gradients indicate the contributions of these responses to the final prediction. The importance weights quantify the contribution of each feature map to the target category, while the activation function ensures that only positive influences are retained. Through this mechanism, Grad-CAM highlights the critical regions to which the model attends during detection, effectively emphasizing target objects while suppressing irrelevant background information.
Figure 13 shows that incorporating the Grad-CAM visualization module into both YOLOv8n and DCS-YOLO provides an intuitive representation of the models’ attention distributions in complex scenarios. As shown in panel (c), the baseline model is noticeably affected by background interference in SSLPs, including textual annotations and irrelevant markings. In contrast, DCS-YOLO effectively suppresses such interference and focuses on the target symbols during detection, thereby demonstrating the effectiveness and superiority of the proposed enhancement strategy.
5. Conclusions
To enable the automated detection of signal equipment in SSLPs, this study proposes an enhanced object detection model, DCS-YOLO, which substantially improves both localization accuracy and detection efficiency. Specifically, the DWR module is embedded into the C2f architecture of YOLOv8 to strengthen multi-scale feature extraction and thereby enhance the detection of small objects. In addition, a local attention-based CLLAHead is incorporated into the intermediate detection head and combined with a Distribution Focal Loss (DFL) mechanism to improve object boundary localization and multi-scale feature fusion in complex scene images. Finally, the Slide Loss function is introduced to further improve bounding-box accuracy and training efficiency. Under the constructed dataset and experimental design, the proposed DCS-YOLO achieves an F1 score of 0.942 and a mAP@0.5 of 0.963, significantly outperforming several widely used state-of-the-art object detection algorithms. The model demonstrates strong capability in detecting small and densely clustered objects in complex environments, substantially improving both detection accuracy and boundary localization performance. These results provide a practical technical solution for the automatic recognition and digital processing of SSLPs.
However, the limitations of the current study should also be acknowledged. The scale of the dataset and the diversity of the samples remain limited, which may restrict the model’s generalization ability across different drawing styles. In future work, the SSLP dataset will be expanded by collecting additional real engineering drawings from railway sites and incorporating a wider range of object detection tasks. These efforts are expected to further improve the model’s adaptability and generalization across diverse drawing styles. In conclusion, the proposed DCS-YOLO provides an accurate and efficient solution for the automatic detection of SSLPs, laying a solid foundation for large-scale deployment and practical engineering applications.
Author Contributions
Conceptualization, Q.S.; methodology, W.D.; software, W.D. and M.Z.; validation, W.D. and W.F.; formal analysis, W.F.; investigation, T.L.; resources, W.D. and T.L.; data curation, W.D. and M.Z.; writing—original draft preparation, W.D.; writing—review and editing, Q.S., T.L. and M.Z.; supervision, Q.S. All authors have read and agreed to the published version of the manuscript.
Funding
This research was funded by the Central Government Guides Local Science and Technology Development Fund Project, Key Technologies Research on Intelligent Operation, Maintenance, and Control of Western Railways, grant number 24ZYQA044.
Data Availability Statement
The data presented in this study were provided by Beijing Railway Signal and Communication Research and Design Institute Group Co., Ltd. Due to confidentiality and data ownership restrictions, these data are not publicly available. Requests for access to the data should be directed to the data provider.
Conflicts of Interest
The authors declare no conflicts of interest.
References
- Gao, P.; Zheng, W.; Liu, J.; Wu, D. Research on Modeling and Analysis Methods of Railway Station Yard Diagrams Based on Multi-Layer Complex Networks. Appl. Sci. 2025, 15, 2324. [Google Scholar] [CrossRef] [Scilit]
- Stefenon, S.F.; Cristoforetti, M.; Cimatti, A. Towards automatic digitalization of railway engineering schematics. In International Conference of the Italian Association for Artificial Intelligence; Springer: Cham, Switzerland, 2023; pp. 453–466. [Google Scholar]
- Moreno-García, C.F.; Elyan, E.; Jayne, C. New trends on digitisation of complex engineering drawings. Neural Comput. Appl. 2019, 31, 1695–1712. [Google Scholar] [CrossRef] [Scilit]
- Pizarro, P.N.; Hitschfeld, N.; Sipiran, I.; Saavedra, J.M. Automatic floor plan analysis and recognition. Autom. Constr. 2022, 140, 104348. [Google Scholar] [CrossRef] [Scilit]
- Schoenfelder, P.; Aziz, A.; Faltin, B.; König, M. Automating the retrospective generation of As-is BIM models using machine learning. Autom. Constr. 2023, 152, 104937. [Google Scholar] [CrossRef] [Scilit]
- Zhang, C.; Zou, Y.; Dimyadi, J. A systematic review of automated BIM modelling for existing buildings from 2D documentation. In ISARC: International Symposium on Automation and Robotics in Construction; IAARC Publications: Lyon, France, 2021; Volume 38, pp. 220–226. [Google Scholar]
- Kang, S.O.; Lee, E.B.; Baek, H.K. A digitization and conversion tool for imaged drawings to intelligent piping and instrumentation diagrams (P&ID). Energies 2019, 12, 2593. [Google Scholar] [CrossRef] [Scilit]
- Chowdhury, A.h.M.; Moon, S. Generating integrated bill of materials using mask R-CNN artificial intelligence model. Autom. Constr. 2023, 145, 104644. [Google Scholar] [CrossRef] [Scilit]
- Tian, Y. Artificial intelligence image recognition method based on convolutional neural network algorithm. IEEE Access 2020, 8, 125731–125744. [Google Scholar] [CrossRef] [Scilit]
- Manakitsa, N.; Maraslidis, G.S.; Moysis, L.; Fragulis, G.F. A review of machine learning and deep learning for object detection, semantic segmentation, and human action recognition in machine and robotic vision. Technologies 2024, 12, 15. [Google Scholar] [CrossRef] [Scilit]
- Nguyen, M.T.; Pham, V.L.; Nguyen, C.C.; Nguyen, V.V. Object detection and text recognition in large-scale technical drawings. In Proceedings of the 10th International Conference on Pattern Recognition Applications and Methods, Online, 4–6 February 2021; pp. 612–619. [Google Scholar]
- Francois, M.; Eglin, V.; Biou, M. Text detection and post-OCR correction in engineering documents. In International Workshop on Document Analysis Systems; Springer: Cham, Switzerland, 2022; pp. 726–740. [Google Scholar]
- Castellano, G.; Vessio, G. Deep learning approaches to pattern extraction and recognition in paintings and drawings: An overview. Neural Comput. Appl. 2021, 33, 12263–12282. [Google Scholar] [CrossRef] [Scilit]
- Jamieson, L.; Francisco Moreno-García, C.; Elyan, E. A review of deep learning methods for digitisation of complex documents and engineering diagrams. Artif. Intell. Rev. 2024, 57, 136. [Google Scholar] [CrossRef] [Scilit]
- Paliwal, S.; Sharma, M.; Vig, L. OSSR-PID: One-Shot symbol recognition in P&ID sheets using path sampling and GCN. In Proceedings of the 2021 International Joint Conference on Neural Networks (IJCNN), Shenzhen, China, 18–22 July 2021; IEEE: Piscataway, NJ, USA, 2021; pp. 1–8. [Google Scholar]
- Rica, E.; Moreno-García, C.F.; Alvarez, S.; Serratosa, F. Reducing human effort in engineering drawing validation. Comput. Ind. 2020, 117, 103198. [Google Scholar] [CrossRef] [Scilit]
- Rica, E.; Alvarez, S.; Serratosa, F. Group of components detection in engineering drawings based on graph matching. Eng. Appl. Artif. Intell. 2021, 104, 104404. [Google Scholar] [CrossRef] [Scilit]
- Kim, H.; Kim, S.; Yu, K. Automatic extraction of indoor spatial information from floor plan image: A patch-based deep learning methodology application on large-scale complex buildings. ISPRS Int. J. Geo-Inf. 2021, 10, 828. [Google Scholar] [CrossRef] [Scilit]
- Renton, G.; Balcilar, M.; Héroux, P.; Gaüzère, B.; Honeine, P.; Adam, S. Symbols detection and classification using graph neural networks. Pattern Recognit. Lett. 2021, 152, 391–397. [Google Scholar] [CrossRef] [Scilit]
- Rochana Rumalshan, O.; Weerasinghe, P.; Shaheer, M.; Gunathilake, P.; Dayaratna, E. Transfer Learning Approach for Railway Technical Map (RTM) Component Identification. arXiv 2024, arXiv:2405.13229. [Google Scholar] [CrossRef] [Scilit]
- Ying, D.; Lyu, G.; He, Z.; Hasan, R.; Shah, S.H.H. Automated Detection and Recognition of Steel Rebar Annotations in Engineering Drawings Using Deep Learning. SSRN Electron. J. 2025. [Google Scholar] [CrossRef] [Scilit]
- Yang, L.; Xu, S.; Yu, X.; Long, H.; Zhang, H.; Zhu, Y. A new model based on improved VGG16 for corn weed identification. Front. Plant Sci. 2023, 14, 1205151. [Google Scholar] [CrossRef] [Scilit] [PubMed]
- Zhang, J.; Gong, J.; Zhang, Y.; Mostafa, K.; Yuan, G. Weed identification in maize fields based on improved Swin-Unet. Agronomy 2023, 13, 1846. [Google Scholar] [CrossRef] [Scilit]
- Liu, W.; Anguelov, D.; Erhan, D.; Szegedy, C.; Reed, S.; Fu, C.Y.; Berg, A.C. SSD: Single shot multibox detector. In European Conference on Computer Vision; Springer: Cham, Switzerland, 2016; pp. 21–37. [Google Scholar]
- Redmon, J.; Divvala, S.; Girshick, R.; Farhadi, A. You only look once: Unified, real-time object detection. In Proceedings of the IEEE Conference on Computer Vision and Pattern Recognition, Las Vegas, NV, USA, 27–30 June 2016; pp. 779–788. [Google Scholar]
- Alif, M.A.R.; Hussain, M. YOLOv1 to YOLOv10: A comprehensive review of YOLO variants and their application in the agricultural domain. arXiv 2024, arXiv:2406.10139. [Google Scholar] [CrossRef] [Scilit]
- Terven, J.; Córdova-Esparza, D.M.; Romero-González, J.A. A comprehensive review of yolo architectures in computer vision: From yolov1 to yolov8 and yolo-nas. Mach. Learn. Knowl. Extr. 2023, 5, 1680–1716. [Google Scholar] [CrossRef] [Scilit]
- Edozie, E.; Shuaibu, A.N.; John, U.K.; Sadiq, B.O. Comprehensive review of recent developments in visual object detection based on deep learning. Artif. Intell. Rev. 2025, 58, 277. [Google Scholar] [CrossRef] [Scilit]
- Sun, X.; Wu, P.; Hoi, S.C. Face detection using deep learning: An improved faster RCNN approach. Neurocomputing 2018, 299, 42–50. [Google Scholar] [CrossRef] [Scilit]
- Cheng, B.; Wei, Y.; Shi, H.; Feris, R.; Xiong, J.; Huang, T. Revisiting rcnn: On awakening the classification power of faster rcnn. In Proceedings of the European Conference on Computer Vision (ECCV), Munich, Germany, 8–14 September 2018; pp. 453–468. [Google Scholar]
- Elyan, E.; Jamieson, L.; Ali-Gombe, A. Deep learning for symbols detection and classification in engineering drawings. Neural Netw. 2020, 129, 91–102. [Google Scholar] [CrossRef] [Scilit]
- Jamieson, L.; Moreno-Garcia, C.F.; Elyan, E. Deep learning for text detection and recognition in complex engineering diagrams. In Proceedings of the 2020 International Joint Conference on Neural Networks (IJCNN), Glasgow, UK, 19–24 July 2020; IEEE: Piscataway, NJ, USA, 2020; pp. 1–7. [Google Scholar]
- Gao, W.; Zhao, Y.; Smidts, C. Component detection in piping and instrumentation diagrams of nuclear power plants based on neural networks. Prog. Nucl. Energy 2020, 128, 103491. [Google Scholar] [CrossRef] [Scilit]
- Mani, S.; Haddad, M.A.; Constantini, D.; Douhard, W.; Li, Q.; Poirier, L. Automatic digitization of engineering diagrams using deep learning and graph search. In Proceedings of the IEEE/CVF Conference on Computer Vision and Pattern Recognition Workshops, Seattle, WA, USA, 14–19 June 2020; pp. 176–177. [Google Scholar]
- Rezvanifar, A.; Cote, M.; Albu, A.B. Symbol spotting on digital architectural floor plans using a deep learning-based framework. In Proceedings of the IEEE/CVF Conference on Computer Vision and Pattern Recognition Workshops, Seattle, WA, USA, 14–19 June 2020; pp. 568–569. [Google Scholar]
- Jakubik, J.; Hemmer, P.; Vössing, M.; Blumenstiel, B.; Bartos, A.; Mohr, K. Designing a human-in-the-loop system for object detection in floor plans. Proc. AAAI Conf. Artif. Intell. 2022, 36, 12524–12530. [Google Scholar] [CrossRef] [Scilit]
- Dzhusupova, R.; Banotra, R.; Bosch, J.; Olsson, H.H. Pattern recognition method for detecting engineering errors on technical drawings. In Proceedings of the 2022 IEEE World AI IoT Congress (AIIoT), Seattle, WA, USA, 6–9 June 2022; IEEE: Piscataway, NJ, USA, 2022; pp. 642–648. [Google Scholar]
- Sohan, M.; Sai Ram, T.; Rami Reddy, C.V. A review on yolov8 and its advancements. In Proceedings of the International Conference on Data Intelligence and Cognitive Informatics, Tirunelveli, India, 18–20 November 2024; Springer: Cham, Switzerland, 2024; pp. 529–545. [Google Scholar]
- Wei, H.; Liu, X.; Xu, S.; Dai, Z.; Dai, Y.; Xu, X. DWRSeg: Rethinking efficient acquisition of multi-scale contextual information for real-time semantic segmentation. arXiv 2022, arXiv:2212.01173. [Google Scholar]
- Cheng, W.; Ma, T.; Wang, X.; Wang, G. Anomaly detection for internet of things time series data using generative adversarial networks with attention mechanism in smart agriculture. Front. Plant Sci. 2022, 13, 890563. [Google Scholar] [CrossRef] [Scilit]
- Shi, J.; Bai, Y.; Zhou, J.; Zhang, B. Multi-crop navigation line extraction based on improved YOLO-v8 and threshold-DBSCAN under complex agricultural environments. Agriculture 2023, 14, 45. [Google Scholar] [CrossRef] [Scilit]

Disclaimer/Publisher’s Note: The statements, opinions and data contained in all publications are solely those of the individual author(s) and contributor(s) and not of MDPI and/or the editor(s). MDPI and/or the editor(s) disclaim responsibility for any injury to people or property resulting from any ideas, methods, instructions or products referred to in the content. |
© 2026 by the authors. Licensee MDPI, Basel, Switzerland. This article is an open access article distributed under the terms and conditions of the Creative Commons Attribution (CC BY) license.