


Abstract
Accurate prediction of ultra-high-performance concrete (UHPC) compressive strength is essential for optimizing mixture design and reducing experimental iterations. Existing machine learning approaches suffer from limited algorithm diversity, insufficient statistical validation, and inadequate uncertainty quantification. This study presents a comprehensive framework through systematic evaluation of 20 algorithms across seven categories on 863 experimental observations. Six physically meaningful composite features (such as water-cement ratio, total binder content, and fiber aspect ratio) are engineered to capture intrinsic material relationships, with the Boruta algorithm employed for feature selection. Statistical robustness is ensured through 30 repeated experiments analyzed using both frequentist (p-value, effect size, 95% CI) and Bayesian approaches. CatBoost achieves optimal performance (R2 = 0.8979 ± 0.0239, RMSE = 10.58 ± 1.45 MPa), with curing age, sand content, and steel fiber volume identified as dominant predictors through multi-perspective interpretability analysis integrating SHAP, ALE, permutation importance, and LIME. External validation on 810 independent samples yields R2 = 0.5923 (RMSE = 25.68 MPa) under significant cross-dataset conditions, with performance reduction attributed to feature availability differences and distribution shift. Comprehensive uncertainty quantification yields prediction uncertainty of 3.48%, substantially below previously reported thresholds. The proposed framework offers practitioners a reliable tool for UHPC mixture screening while maintaining prediction confidence for structural engineering applications.
1. Introduction
Ultra-high-performance concrete (UHPC) represents a paradigm shift in construction materials, offering compressive strength (CS) exceeding 150 MPa through optimized particle packing, reduced water-cement ratios, and strategic fiber reinforcement [1,2]. This advanced cementitious composite addresses critical limitations of conventional concrete by integrating four fundamental design principles: microstructure refinement, porosity minimization, toughness enhancement, and compositional homogeneity [3,4]. The resulting material exhibits exceptional CS under standard 28-day curing conditions, coupled with superior workability and extended service life [5,6]. These exceptional properties enable construction of structures with reduced weight, extended spans, and diminished carbon footprints [7,8].
The mechanical performance of UHPC critically depends on fiber reinforcement, which addresses the inherent brittleness arising from its dense microstructure [9]. While steel fibers dominate current applications due to their superior crack-bridging capacity, alternative reinforcements—basalt, glass, and polypropylene fibers—offer distinct advantages in corrosion resistance, electromagnetic transparency, and cost-effectiveness [10,11]. However, the complex interplay between mixture proportions, fiber characteristics, and resulting mechanical properties creates a high-dimensional optimization problem. Traditional experimental approaches require extensive laboratory testing, with each mixture design iteration demanding weeks for curing and mechanical characterization [12,13].
Machine learning algorithms have catalyzed transformative opportunities in civil engineering applications [14,15]. These computational frameworks excel at capturing nonlinear, multifactorial relationships within large-scale datasets [16,17]. Recent investigations have demonstrated the efficacy of machine learning in concrete research: predicting CS [18,19], optimizing mixture proportions [20,21], and assessing workability characteristics [22,23]. Within the UHPC domain, studies have employed convolutional neural networks [24], random forests [25], gradient boosting methods [26,27], and hybrid ensemble approaches [28] to establish predictive models. However, systematic evaluation reveals critical methodological limitations in algorithm diversity [29,30], feature engineering [31,32], statistical validation [33], interpretability [34,35], external validation [36], and uncertainty quantification [37], which collectively undermine model reliability and practical applicability [38].
To address these limitations, this investigation develops a comprehensive machine learning (CS) framework for UHPC CS prediction. The study leverages 863 experimental observations encompassing diverse fiber types (steel, basalt, glass, polypropylene) and comprehensive mixture parameters (cement, silica fume, quartz powder, fly ash, slag, metakaolin, sand, quartz sand, water, superplasticizer, age, fiber geometry). Five-fold cross-validation is employed to evaluate model performance. The principal contributions encompass: (1) comprehensive benchmarking across 20 algorithms spanning seven distinct families to identify the optimal predictor for UHPC CS; (2) domain-informed feature engineering creating six physically meaningful composite variables to enhance both accuracy and interpretability; (3) rigorous statistical validation through 30 repeated experiments coupled with frequentist and Bayesian inference; (4) multi-perspective interpretability analysis integrating SHAP, ALE, permutation importance, and LIME to identify dominant predictors; (5) external validation on 810 independent samples to evaluate cross-dataset generalization capability; and (6) comprehensive uncertainty quantification employing Monte Carlo simulation, bootstrap resampling, prediction intervals, and Bayesian credible intervals. The resulting framework provides practitioners with a scientifically validated, computationally efficient tool for UHPC mixture optimization. Codes, datasets, and graphical user interface are publicly available at https://github.com/hollisterwong/UHPC-ML (accessed on 12 March 2026) to facilitate research reproducibility and practical implementation.
It should be noted that this study does not collect new experimental data; the primary dataset of 863 UHPC samples is compiled from Bolbolvand et al. [7], and the proposed framework is evaluated on this existing dataset together with an independent external validation set of 810 samples [39].
2. Related Works
The application of ML to predict concrete compressive strength has evolved substantially over the past decade [39,40,41,42,43,44]. Jamal et al. [18] demonstrated that properly configured regression trees could achieve prediction accuracies exceeding 94% for high-performance concrete. Zhen et al. [43] subsequently introduced visualization workflows integrating PDP, ICE, and SHAP analyses for feature contribution interpretation. The emergence of gradient boosting algorithms marked a significant advancement, with Khan et al. [20] demonstrating the effectiveness of XGBoost, achieving R2 = 0.969 and RMSE = 4.626 MPa on 761 UHPC samples.
Gradient boosting algorithms have consistently demonstrated superior performance for UHPC CS prediction. Katlav et al. [19] compared CatBoost models optimized using different metaheuristic algorithms, with DMO-CatBoost achieving R2 = 0.993 (training) and R2 = 0.978 (testing). Kashem et al. [45] introduced hybrid PSO approaches achieving R2 = 0.9804 with SHAP and PDP analyses. Wijesundara et al. [36] focused on UHPFRC with XGBoost, achieving R2 = 0.905, identifying steel fiber content and curing age as dominant predictors. Bolbolvand et al. [7] extended the scope to multiple fiber types, with CatBoost achieving R2 = 0.931. Rong et al. [27] integrated strength prediction with sustainability analysis. Yosri et al. [22] demonstrated optimized ML with partial dependence plots for alkali-activated binders, and Abdellatief et al. [1] assessed advanced ML models for UHPC across diverse mixture formulations.
Beyond conventional ML algorithms, Xu et al. [37] developed a CNN model achieving R2 = 0.959 on tabular UHPC data, while Yan et al. [38] proposed a physics-informed neural network incorporating domain knowledge through soft monotonicity constraint. Gazi et al. [46] introduced meta-learning approaches to address data scarcity, and Kazemi et al. [47] developed active learning frameworks on stacked ML techniques for alkali-activated UHPC.
Feature engineering and interpretability have received increasing attention. Abioye et al. [2] proposed optimized ML algorithms with systematic SHAP integration, and Taffese et al. [48] demonstrated explainable ML using CatBoost with SHAP and ICE plots for flexural capacity prediction. These studies consistently identify curing age, cement content, silica fume, and fiber dosage as influential predictors. However, existing approaches predominantly rely on SHAP as a single explainability method, while alternative techniques such as ALE, permutation importance, and LIME remain largely unexplored.
Generalization capability represents a critical concern for engineering applications. Chen et al. [8] investigated dataset representation bias, demonstrating that biased training data significantly undermines generalizability. Ibrahim et al. [49] presented uncertainty quantification using hybrid ML approaches with Monte Carlo simulation, and Hao et al. [16] extended ML to self-shrinkage prediction, achieving R2 = 0.937 using physically meaningful feature ratios. Recent research has additionally emphasized sustainability, with Khan et al. [50] developing XGBoost models for UHPC with low-carbon cementitious materials, Bu et al. [51] proposing a unified framework integrating Bayesian model updating with life cycle assessment, Sun et al. [31] combining ML prediction with cost and carbon emission analysis, and Mahjoubi et al. [24] introducing auto-tune frameworks with unsupervised anomaly detection.
Despite substantial progress, critical limitations persist: (1) limited algorithm diversity, as most studies evaluate fewer than ten models, predominantly gradient boosting variants, neglecting comprehensive cross-category comparisons; (2) absence of domain-driven feature engineering, as existing approaches directly utilize raw mixture parameters without incorporating physically meaningful composite features; (3) single-run validation, with prevalent reliance on single train–test splits introducing statistical uncertainty; (4) insufficient interpretability, as existing approaches lack a systematic multi-method interpretability framework that integrates complementary global and local explanation techniques; (5) lack of external validation, as models are evaluated only on internal test sets; and (6) inadequate uncertainty quantification, as prediction frameworks neglect systematic uncertainty analysis. This study addresses these gaps through a comprehensive machine learning framework that systematically tackles each identified limitation. Table 1 summarizes the methodological comparison with prior studies.
Table 1.
Comparison of present study with existing UHPC CS prediction research.
3. Preliminary
3.1. Data Overview
Table 2 summarizes the variables employed in this study. The dataset comprises 863 experimental observations of ultra-high-performance concrete (UHPC) CS, compiled from the peer-reviewed study [7]. No new experimental data were collected in this study. Seventeen predictor variables are incorporated, encompassing cementitious constituents (cement, silica fume, fly ash, slag, and metakaolin), aggregate components (sand and quartz sand), mixture proportions (water and superplasticizer dosage), curing duration, and fiber reinforcement parameters, including four fiber types (steel, basalt, glass, and polypropylene) with their respective geometric characteristics. The target variable is the 28-day CS measured on 100 × 100 × 100 mm cubic specimens. Notably, several supplementary cementitious materials and fiber variables exhibit sparse distributions, reflecting the heterogeneous mixture designs reported across different experimental investigations.
Table 2.
Variables for UHPC CS prediction. Note: “–” indicates no zero values in the dataset. Zero (%) represents the percentage of samples with zero values for each variable.
3.2. Exploratory Data Analysis
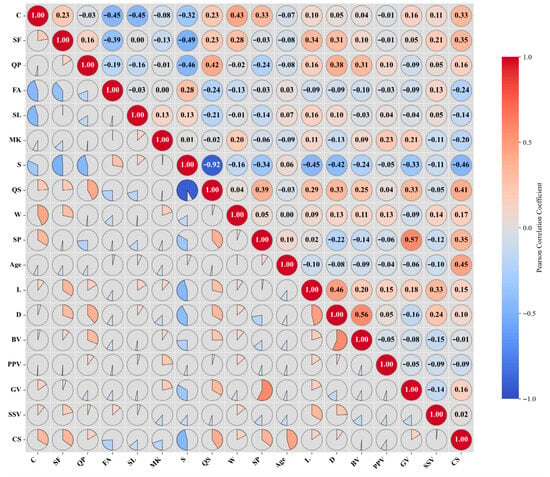
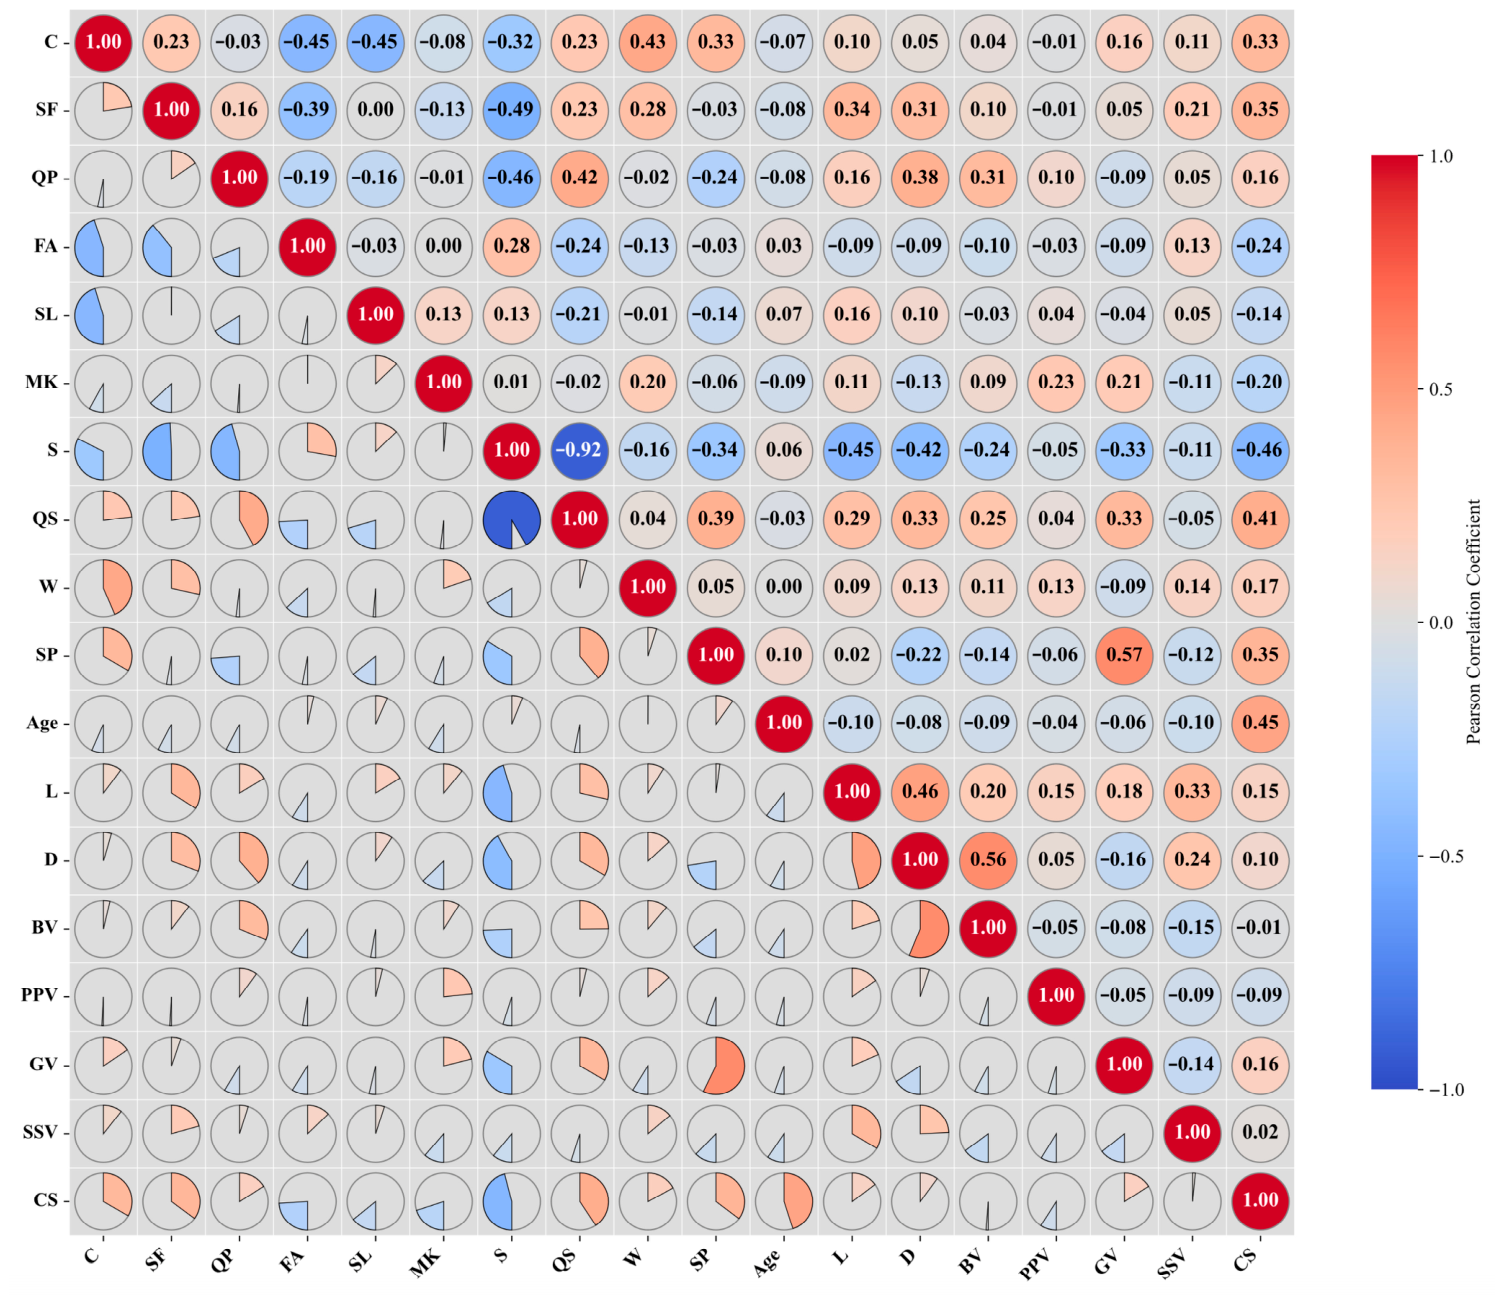
Figure 1 presents the Pearson correlation matrix for all input variables against CS. Curing age exhibits the strongest positive correlation with CS (r = +0.45), followed by quartz sand (r = +0.41), superplasticizer dosage (r = +0.35), and silica fume (r = +0.35). Sand content demonstrates the most pronounced negative correlation (r = −0.46), attributable to its diluting effect on the cementitious binder system. Among inter-parameter relationships, sand and quartz sand display a strong negative correlation (r = −0.92), reflecting their mutually exclusive roles as competing fine aggregate components in UHPC mix design. Additionally, glass fiber volume fraction and superplasticizer exhibit moderate positive correlation (r = +0.57), and fiber diameter and basalt fiber volume show a moderate positive relationship (r = +0.56), consistent with the physical coupling between fiber geometry and fiber type in the dataset.
Figure 1.
Pearson correlation matrix heatmap.
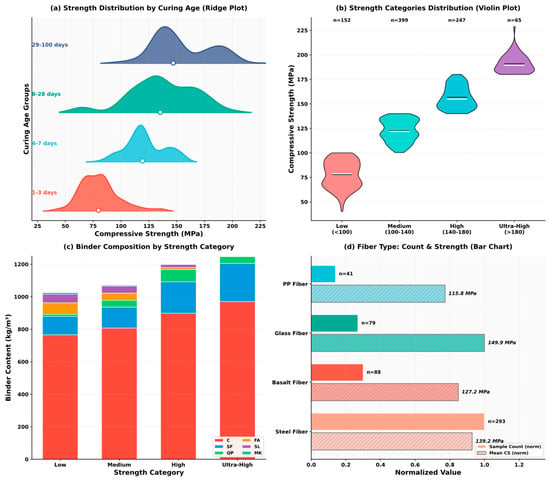
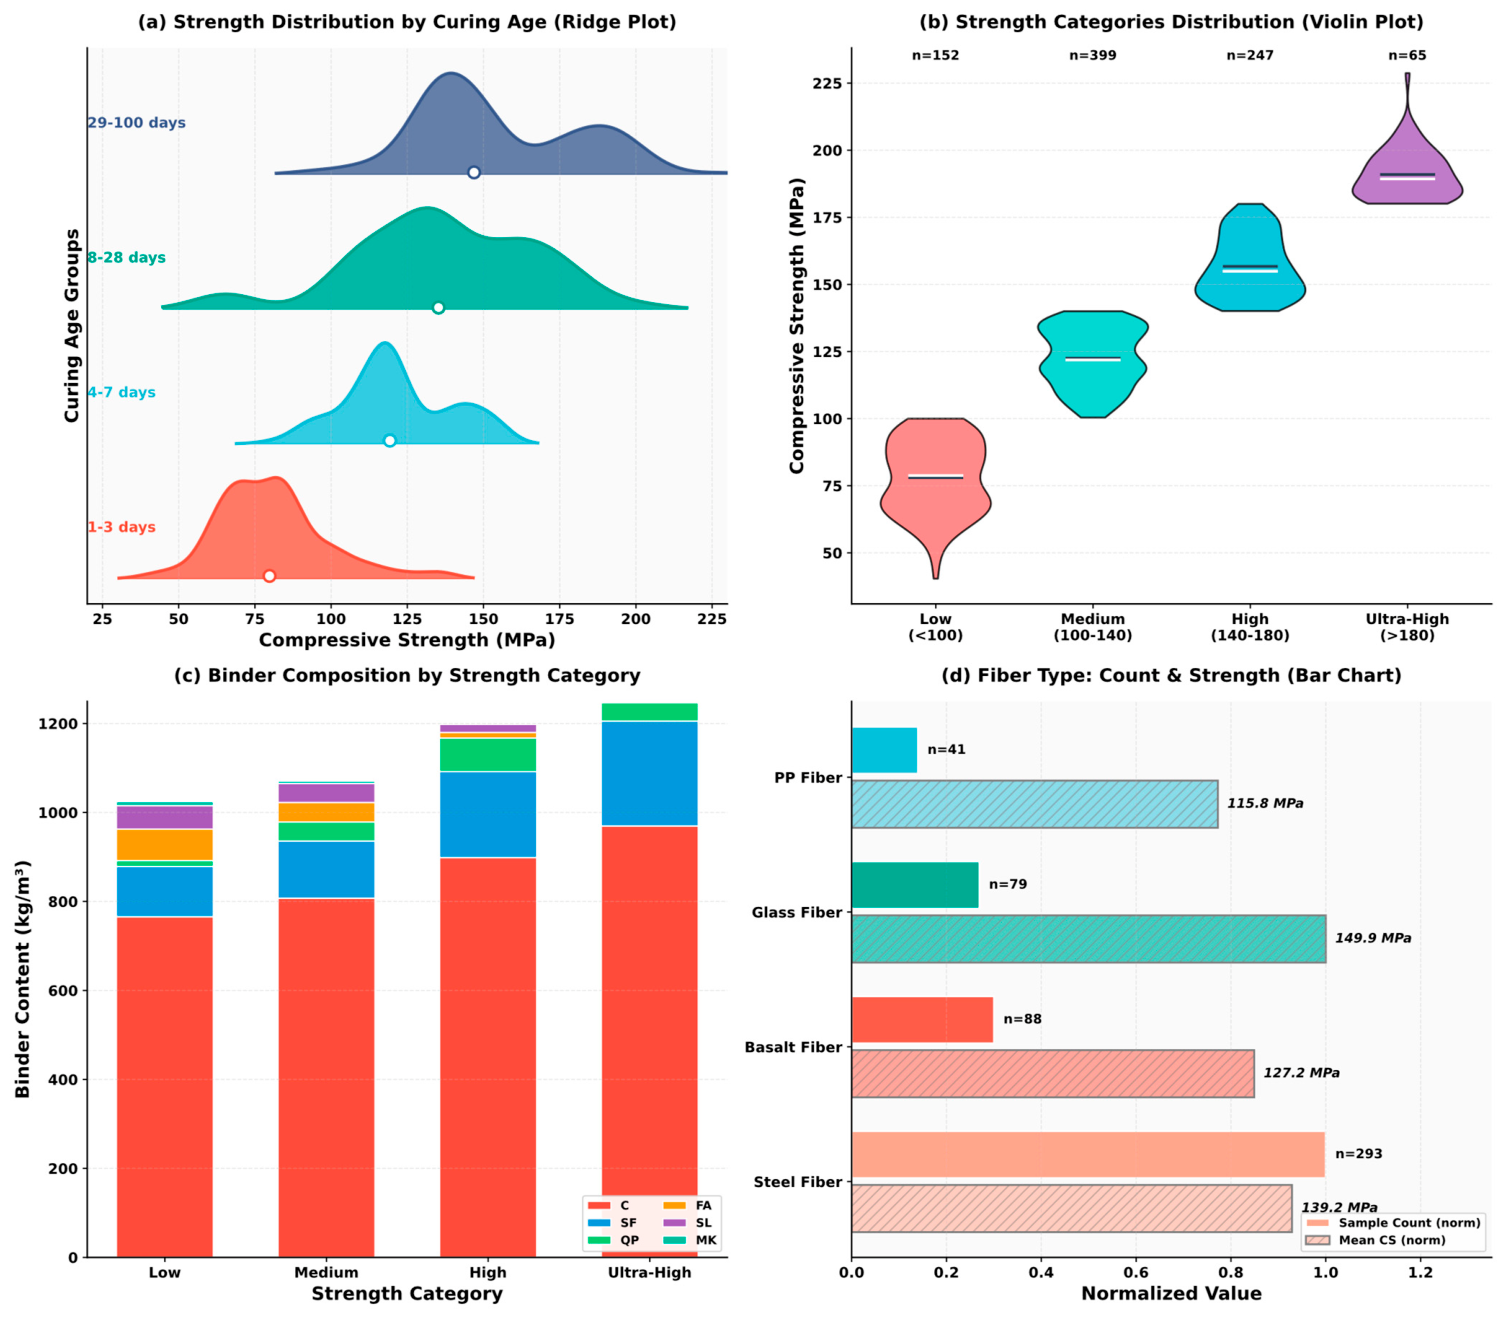
Figure 2 presents the statistical distribution of CS and constituent materials. (a) Ridge plot displaying CS distribution stratified by curing age, where early-age specimens (1–3 days) exhibit median strength around 73 MPa, progressively increasing to approximately 155 MPa at extended curing (29–100 days); white markers indicate median values. (b) Violin plot illustrating sample distribution across four strength categories: low (<100 MPa, n = 152), medium (100–140 MPa, n = 399), high (140–180 MPa, n = 247), and ultra-high (>180 MPa, n = 65). (c) Stacked bar chart depicting mean binder composition by strength category, with cement (C) as the dominant constituent and total binder content increasing from approximately 1020 kg/m3 (low) to 1240 kg/m3 (ultra-high). (d) Horizontal bar chart comparing fiber type prevalence (solid bars) and mean CS (hatched bars): steel fiber is most utilized (n = 293, 139.2 MPa), followed by basalt fiber (n = 88, 127.2 MPa), glass (n = 79, 149.9 MPa), and polypropylene (n = 41, 115.8 MPa).
Figure 2.
Compressive strength distribution and material composition characteristics.
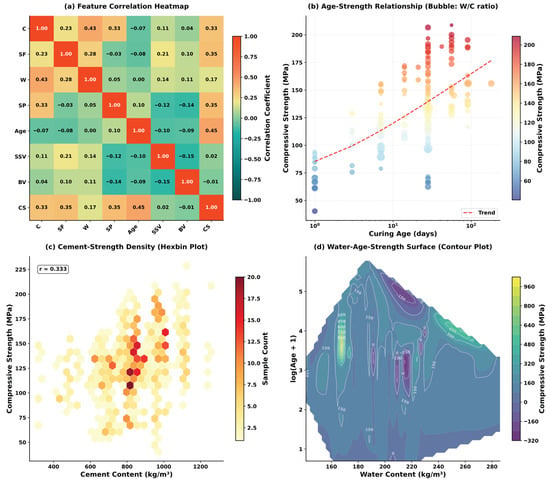
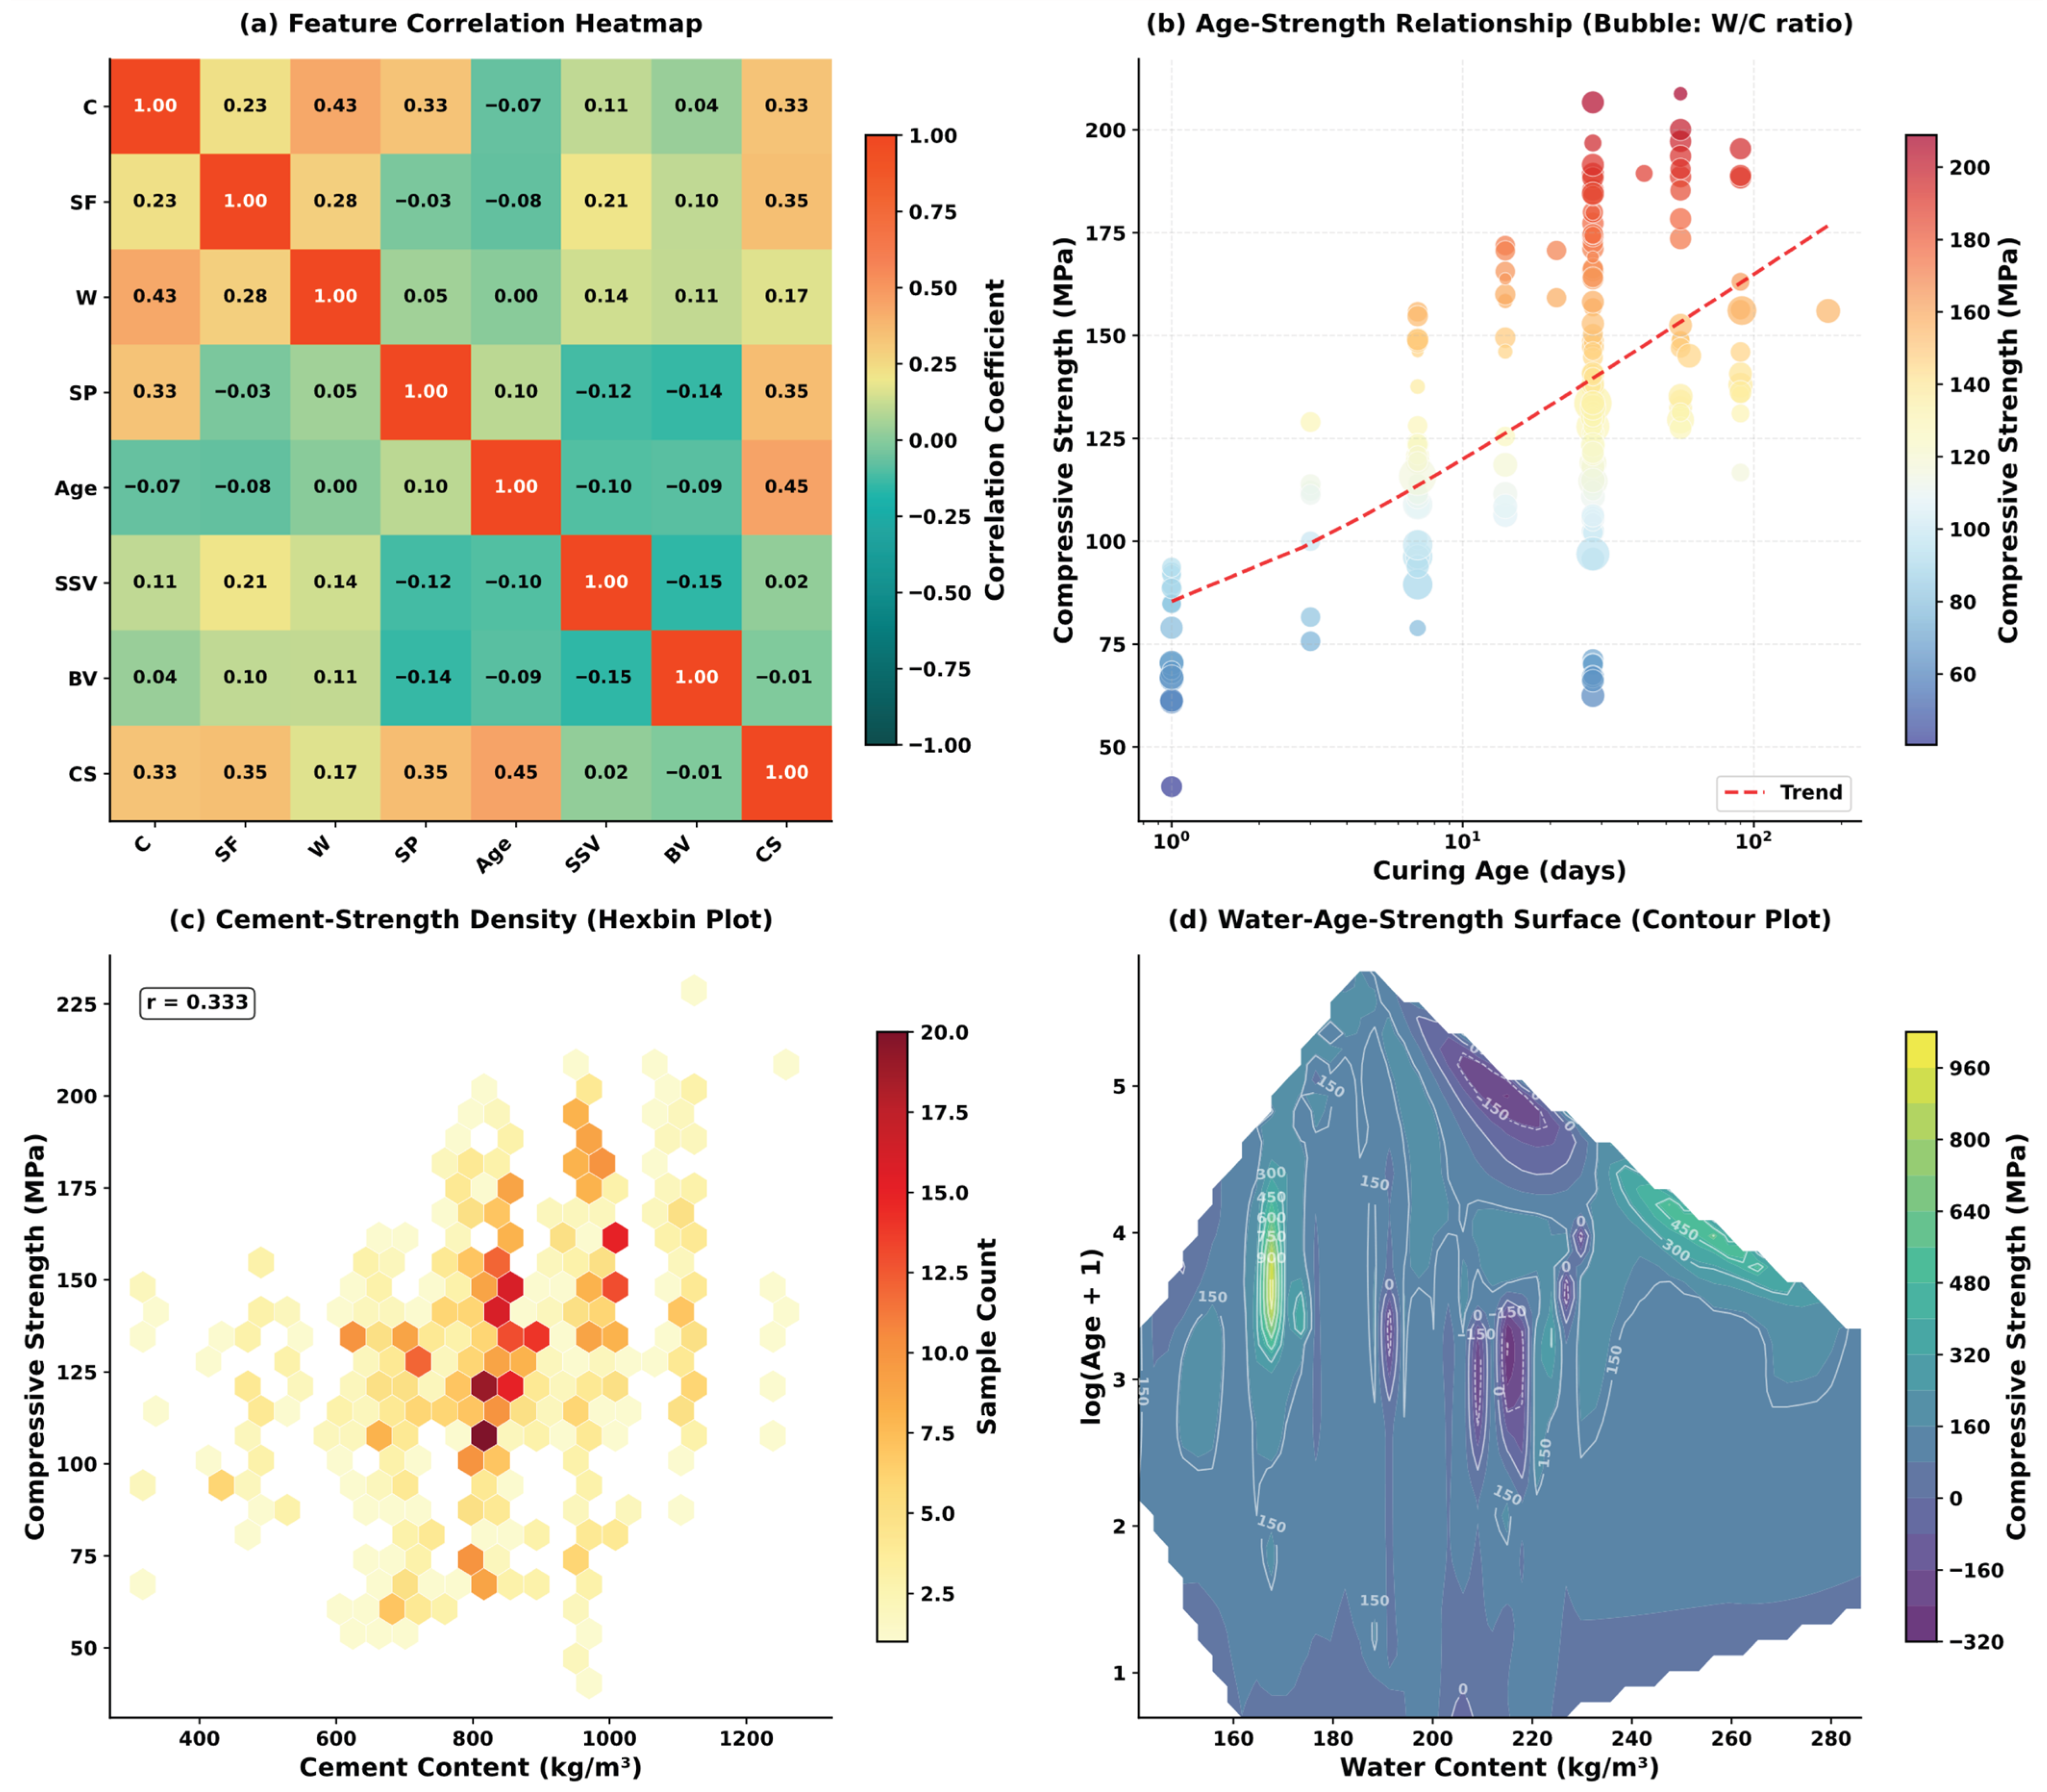
Figure 3 examines the correlations among key variables and their relationships with CS. (a) Pearson correlation heatmap for selected features, where curing age exhibits the strongest positive correlation with CS (r = 0.45), followed by superplasticizer (r = 0.35), silica fume (r = 0.35), and cement (r = 0.33); fiber parameters (SSV, BV) show weak correlations (r < 0.05). (b) Bubble plot of age–strength relationship on a logarithmic scale, with bubble size representing W/C ratio and color indicating CS magnitude; the dashed trend line confirms positive logarithmic correlation between curing age and strength development. (c) Hexbin density plot revealing cement-strength distribution, with sample concentration in the 700–1000 kg/m3 range; the weak correlation (r = 0.33) and high variability suggest that cement content alone is an insufficient predictor of CS. (d) Contour plot depicting the combined effect of water content and log-transformed age on CS, with contour labels showing strength values; optimal strength regions (>150 MPa) occur at moderate water content (180–220 kg/m3) combined with extended curing.
Figure 3.
Correlation analysis and parameter–strength relationship.
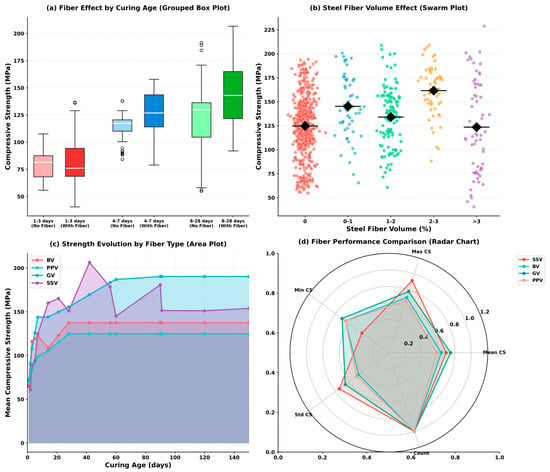
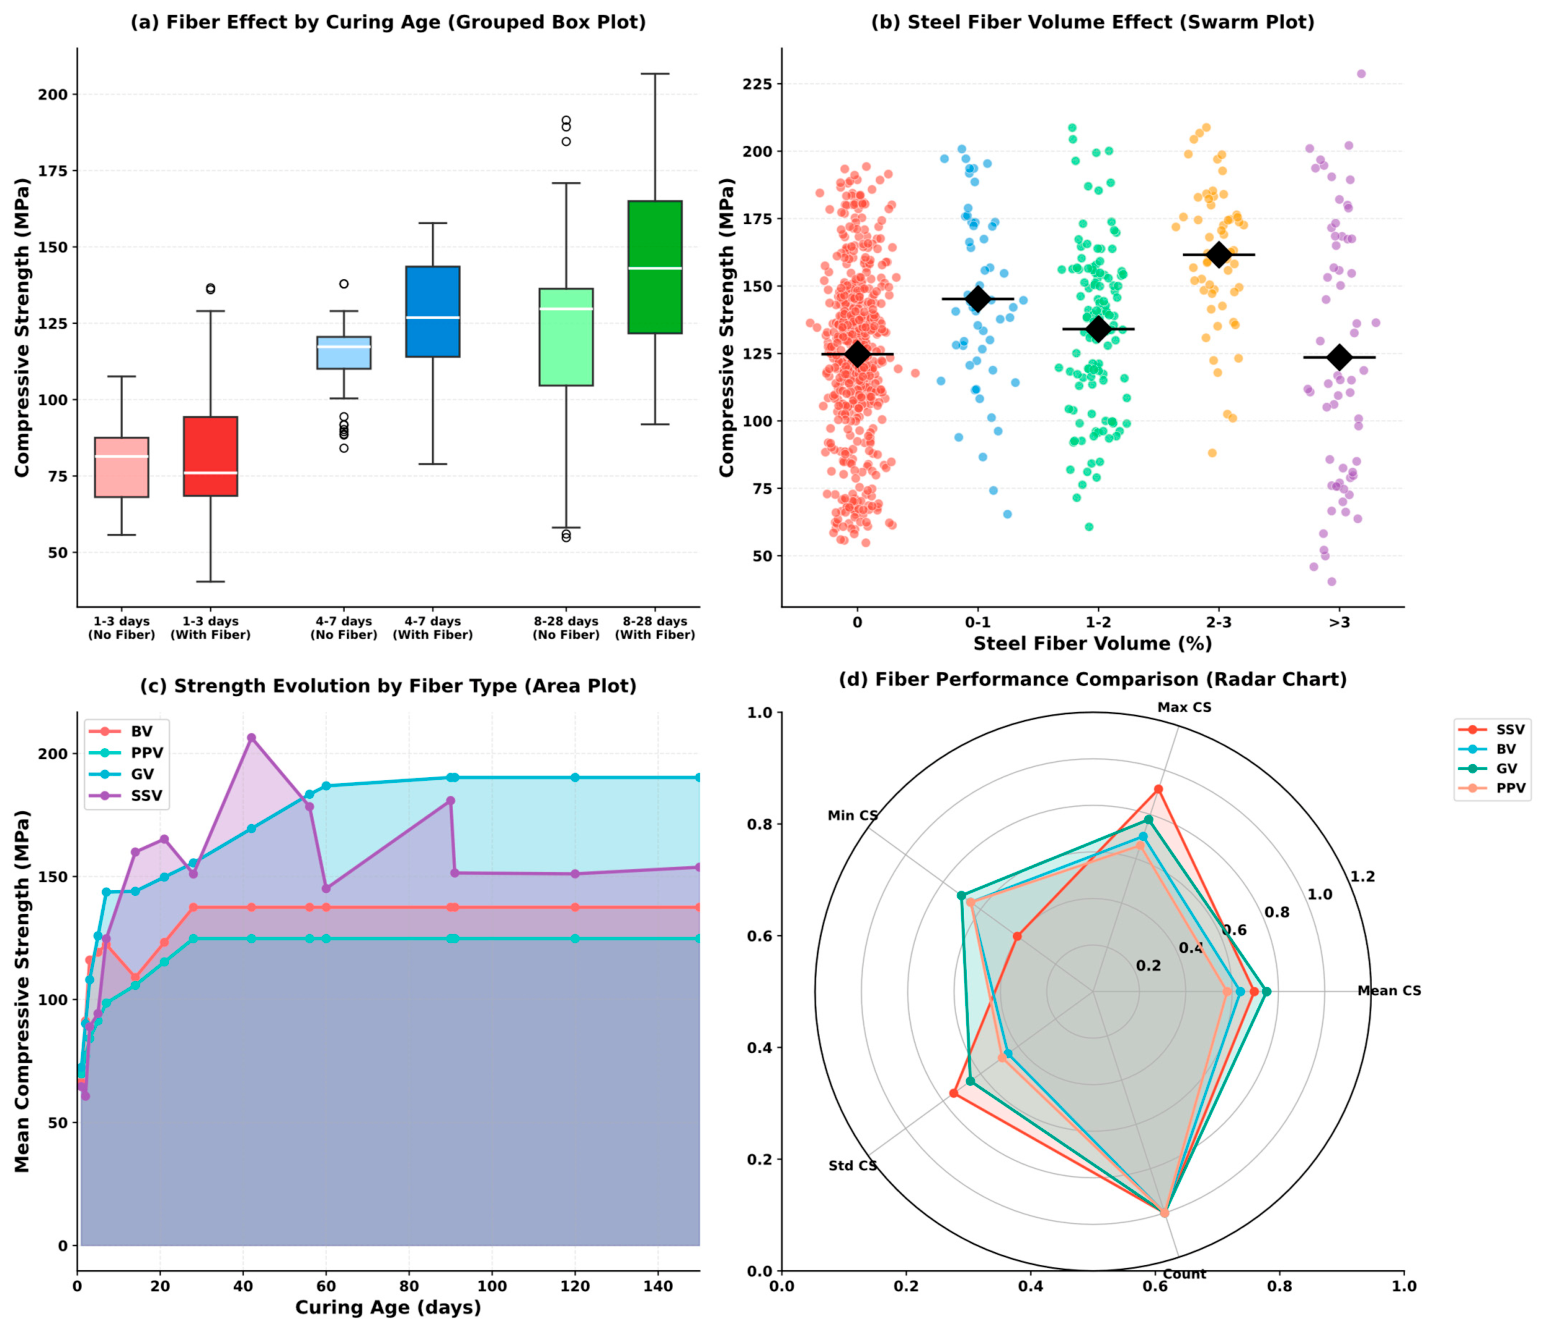
Figure 4 investigates the influence of fiber reinforcement on CS. (a) Grouped box plot comparing CS between non-fiber and fiber-reinforced specimens across three curing periods: at 1–3 days, both groups show similar median strength (~75–80 MPa); at 4–7 days, fiber-reinforced specimens exhibit slightly higher median (~120 MPa) than non-fiber specimens (~115 MPa); at 8–28 days, fiber incorporation yields notable enhancement, with median increasing from ~130 MPa (no fiber) to ~140 MPa (with fiber), accompanied by greater variability. (b) Swarm plot illustrating steel fiber volume effect on CS, where mean values (black diamonds) show non-monotonic behavior: strength increases from no fiber (mean, ~125 MPa) to 0–1% (~145 MPa), peaks at 2–3% (~160 MPa), and then decreases at >3% (~115 MPa), suggesting an optimal dosage around 2–3%. (c) Area plot tracking mean CS evolution over curing age by fiber type: SSV (steel) demonstrates the highest strength development, reaching ~200 MPa at 90 days, while BV (basalt) and GV (glass) plateau around 125–140 MPa; PPV (polypropylene) shows intermediate performance. (d) Radar chart comparing normalized performance metrics across fiber types: SSV exhibits the highest Max CS and count values; BV shows balanced performance with moderate variability; GV achieves high Max CS but lower sample count; PPV displays lowest overall metrics with minimal standard deviation.
Figure 4.
Fiber reinforcement effects on UHPC CS.
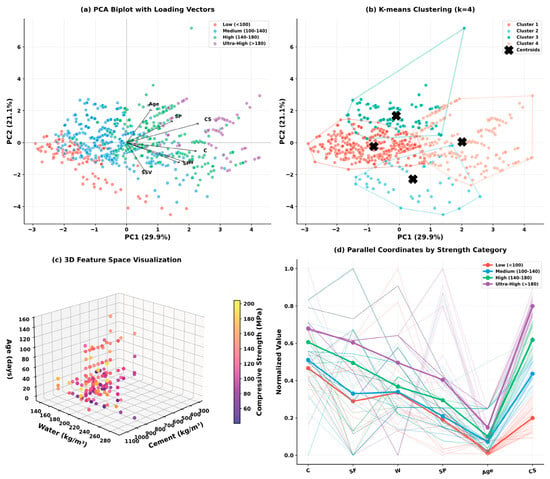
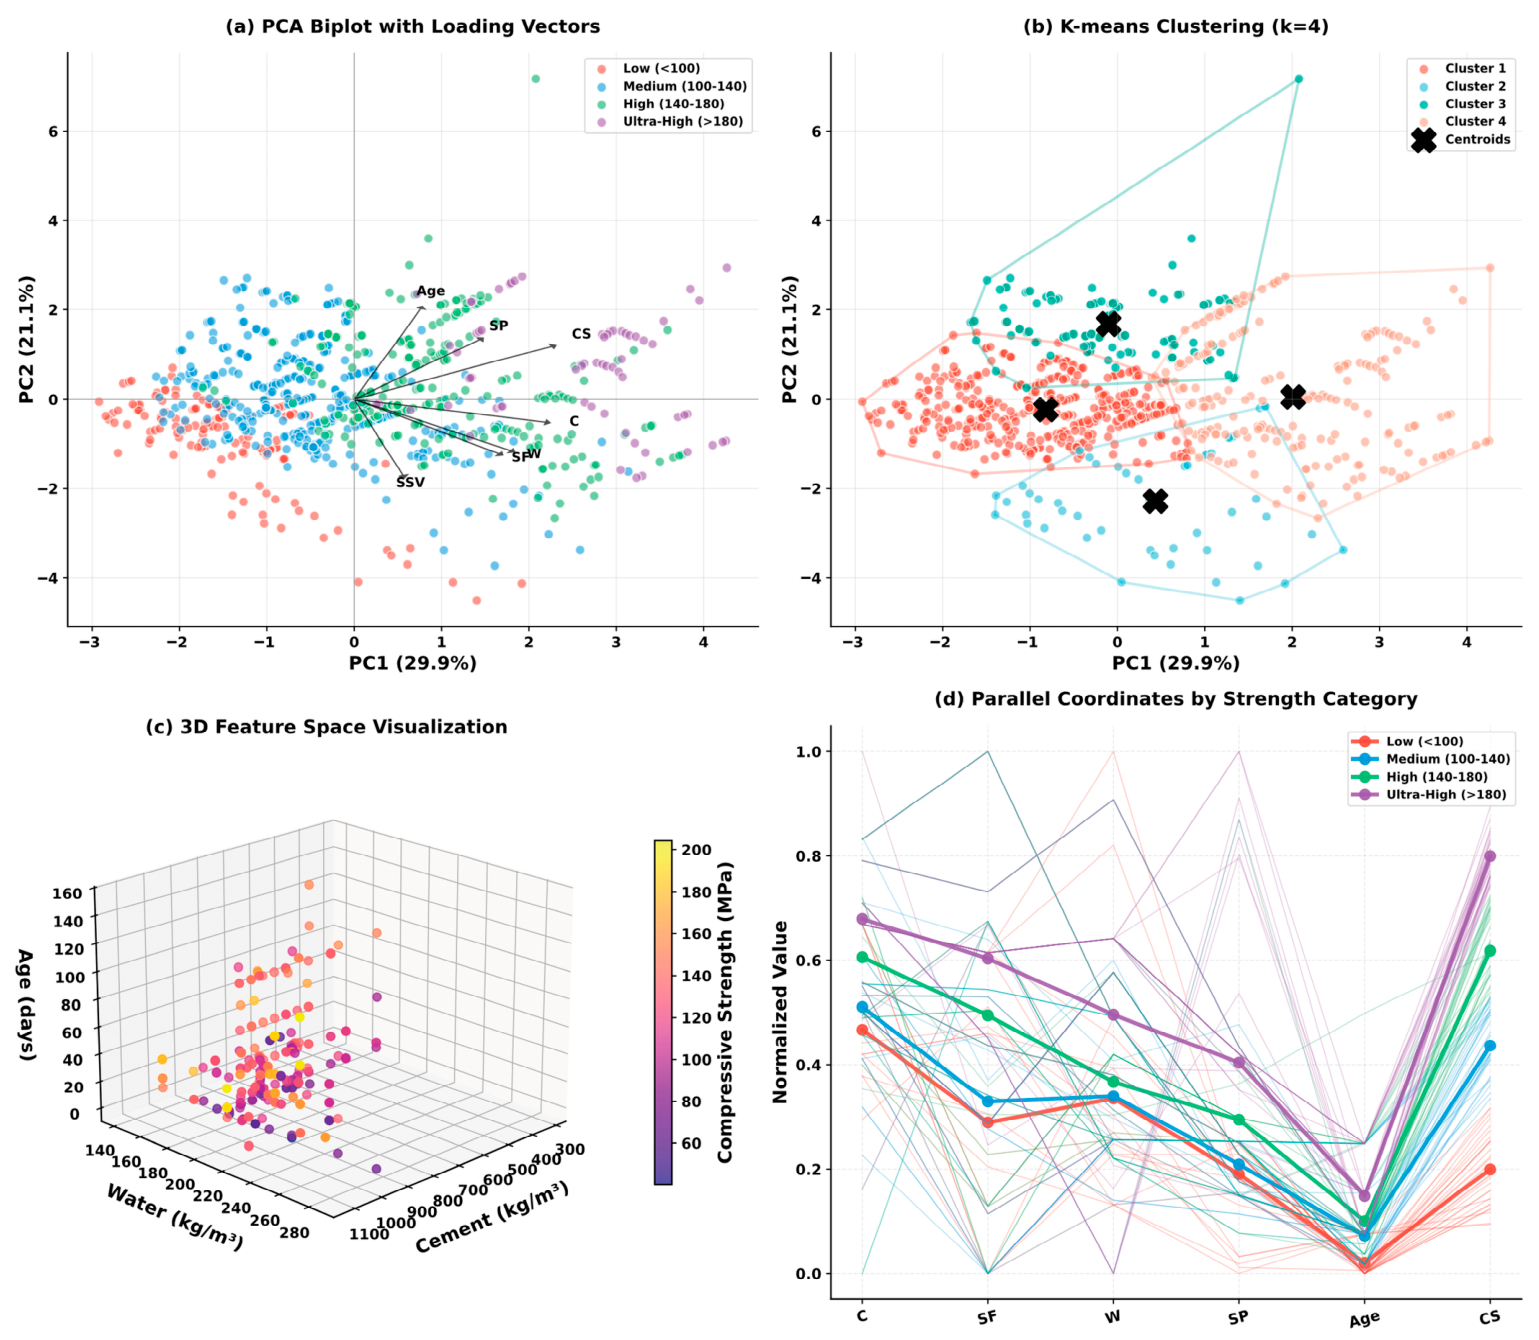
Figure 5 presents multivariate statistical analysis of the UHPC dataset. (a) PCA biplot with loading vectors, where PC1 (29.9%) and PC2 (21.1%) collectively explain 51.0% of total variance; loading vectors indicate that age, SP, and CS contribute positively to PC2, while C, SF, W, and SSV align primarily with PC1; samples are colored by strength category showing gradual transition from low (red) to ultra-high (purple) along the PC1–PC2 space. (b) K-means clustering (k = 4) revealing four distinct mixture groups with centroids marked by black crosses; cluster boundaries (convex hulls) demonstrate moderate overlap, suggesting continuous variation in mix design parameters. (c) 3D scatter plot visualizing the feature space of cement (300–1100 kg/m3), water (140–280 kg/m3), and age (0–160 days), with color gradient representing CS magnitude (60–200 MPa); high-strength specimens cluster at moderate water content with extended curing. (d) Parallel coordinates plot comparing normalized feature profiles across strength categories, where ultra-high specimens (purple) exhibit distinctly higher age and CS values, while low-strength specimens (red) show lower normalized values across most parameters.
Figure 5.
Multivariate analysis and clustering of UHPC CS dataset.
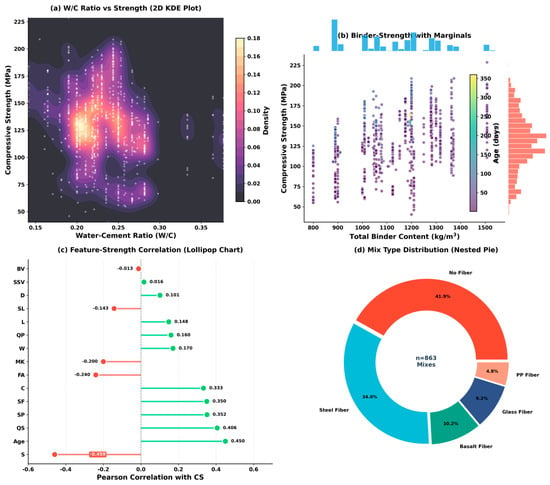
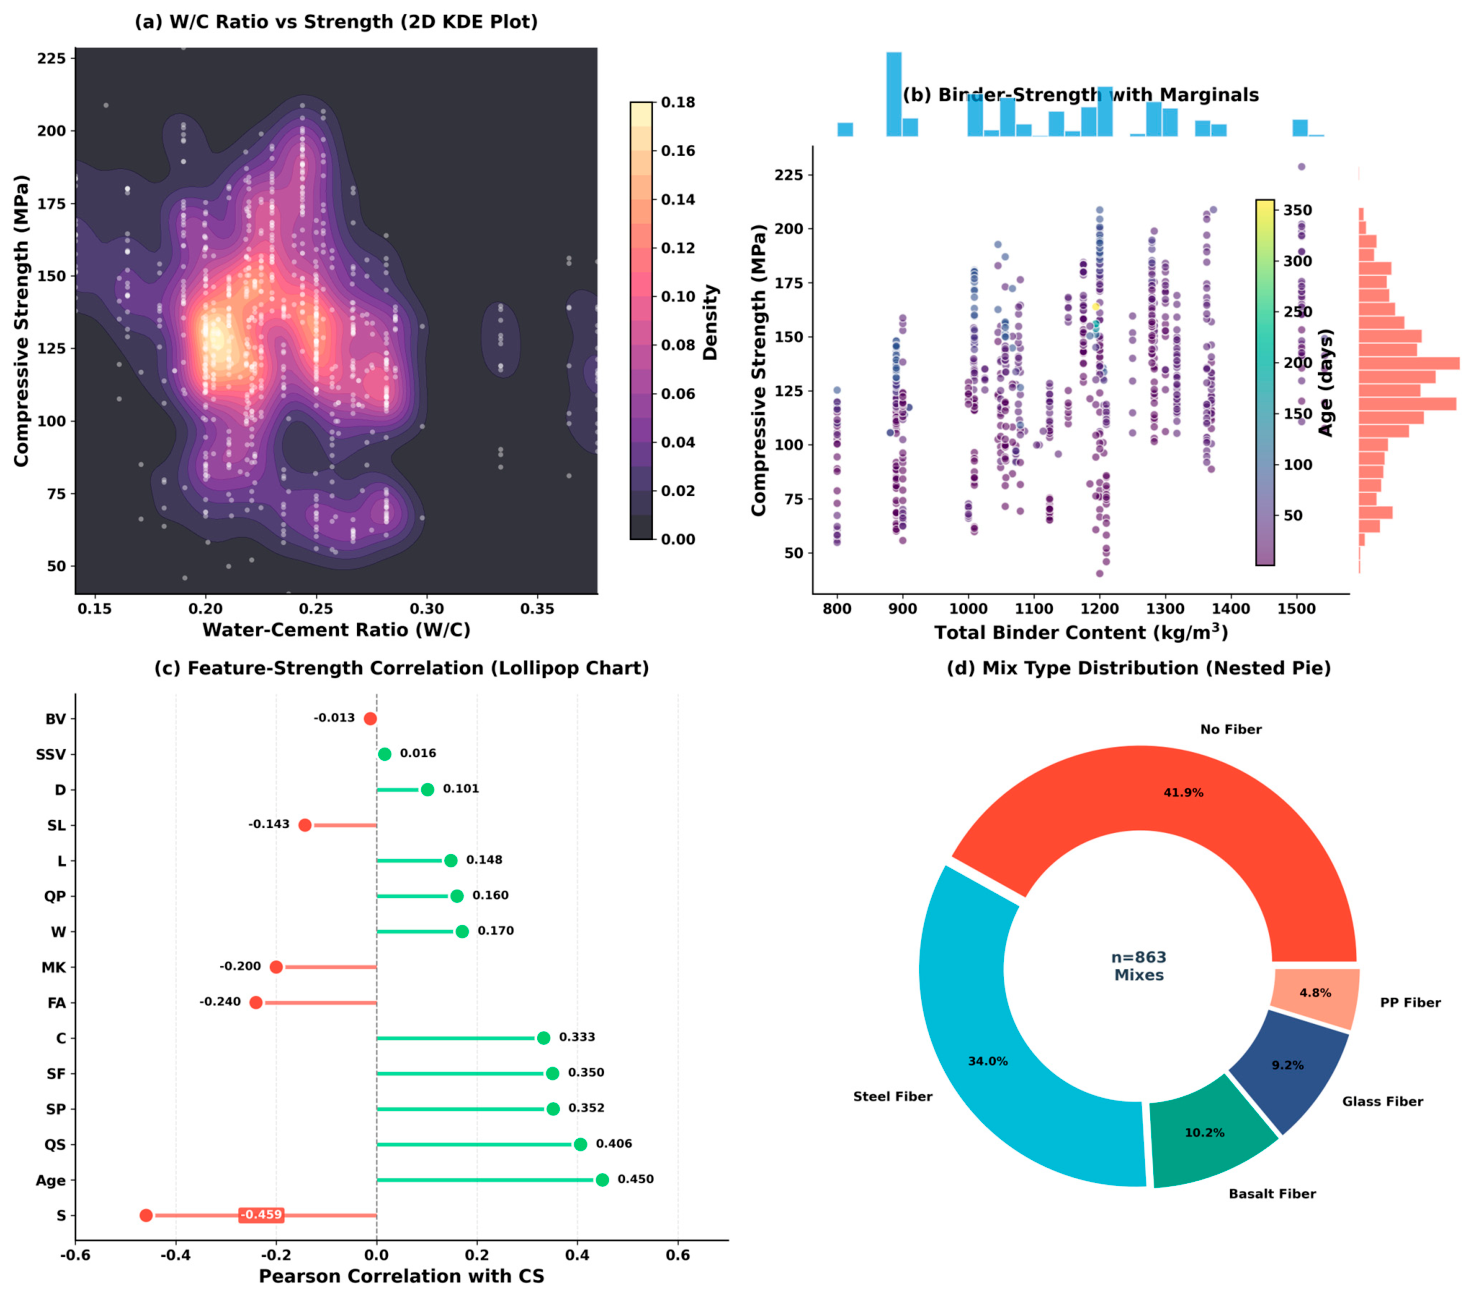
Figure 6 examines mix design characteristics and feature correlations with CS. (a) 2D kernel density estimation plot of W/C ratio versus CS, revealing sample concentration at W/C ratios of 0.22–0.28 with strength ranging 100–175 MPa; highest density region (yellow) occurs around W/C ≈ 0.25 and CS ≈ 125–150 MPa. (b) Scatter plot with marginal histograms showing total binder content versus CS colored by curing age; binder content clusters between 1000 and 1300 kg/m3, with extended curing (yellow points) associated with higher strength values. (c) Lollipop chart ranking Pearson correlations with CS: sand (S) exhibits the strongest negative correlation (r = −0.46), while age (r = 0.45), quartz sand (QS, r = 0.41), superplasticizer (SP, r = 0.35), silica fume (SF, r = 0.35), and cement (C, r = 0.33) show positive correlations; fiber parameters (SSV, BV) demonstrate negligible linear correlations (|r| < 0.02). (d) Donut chart illustrating mix type distribution: no-fiber specimens dominate (41.9%), followed by steel fiber (34.0%), basalt fiber (10.2%), glass fiber (9.2%), and PP fiber (4.8%), totaling n = 863 samples.
Figure 6.
Mix design parameters and feature importance analysis.
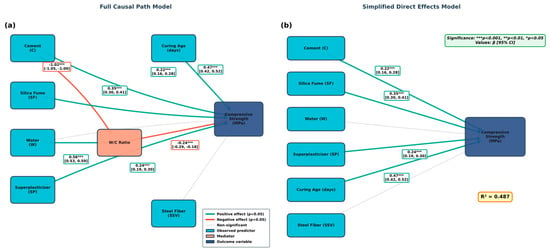
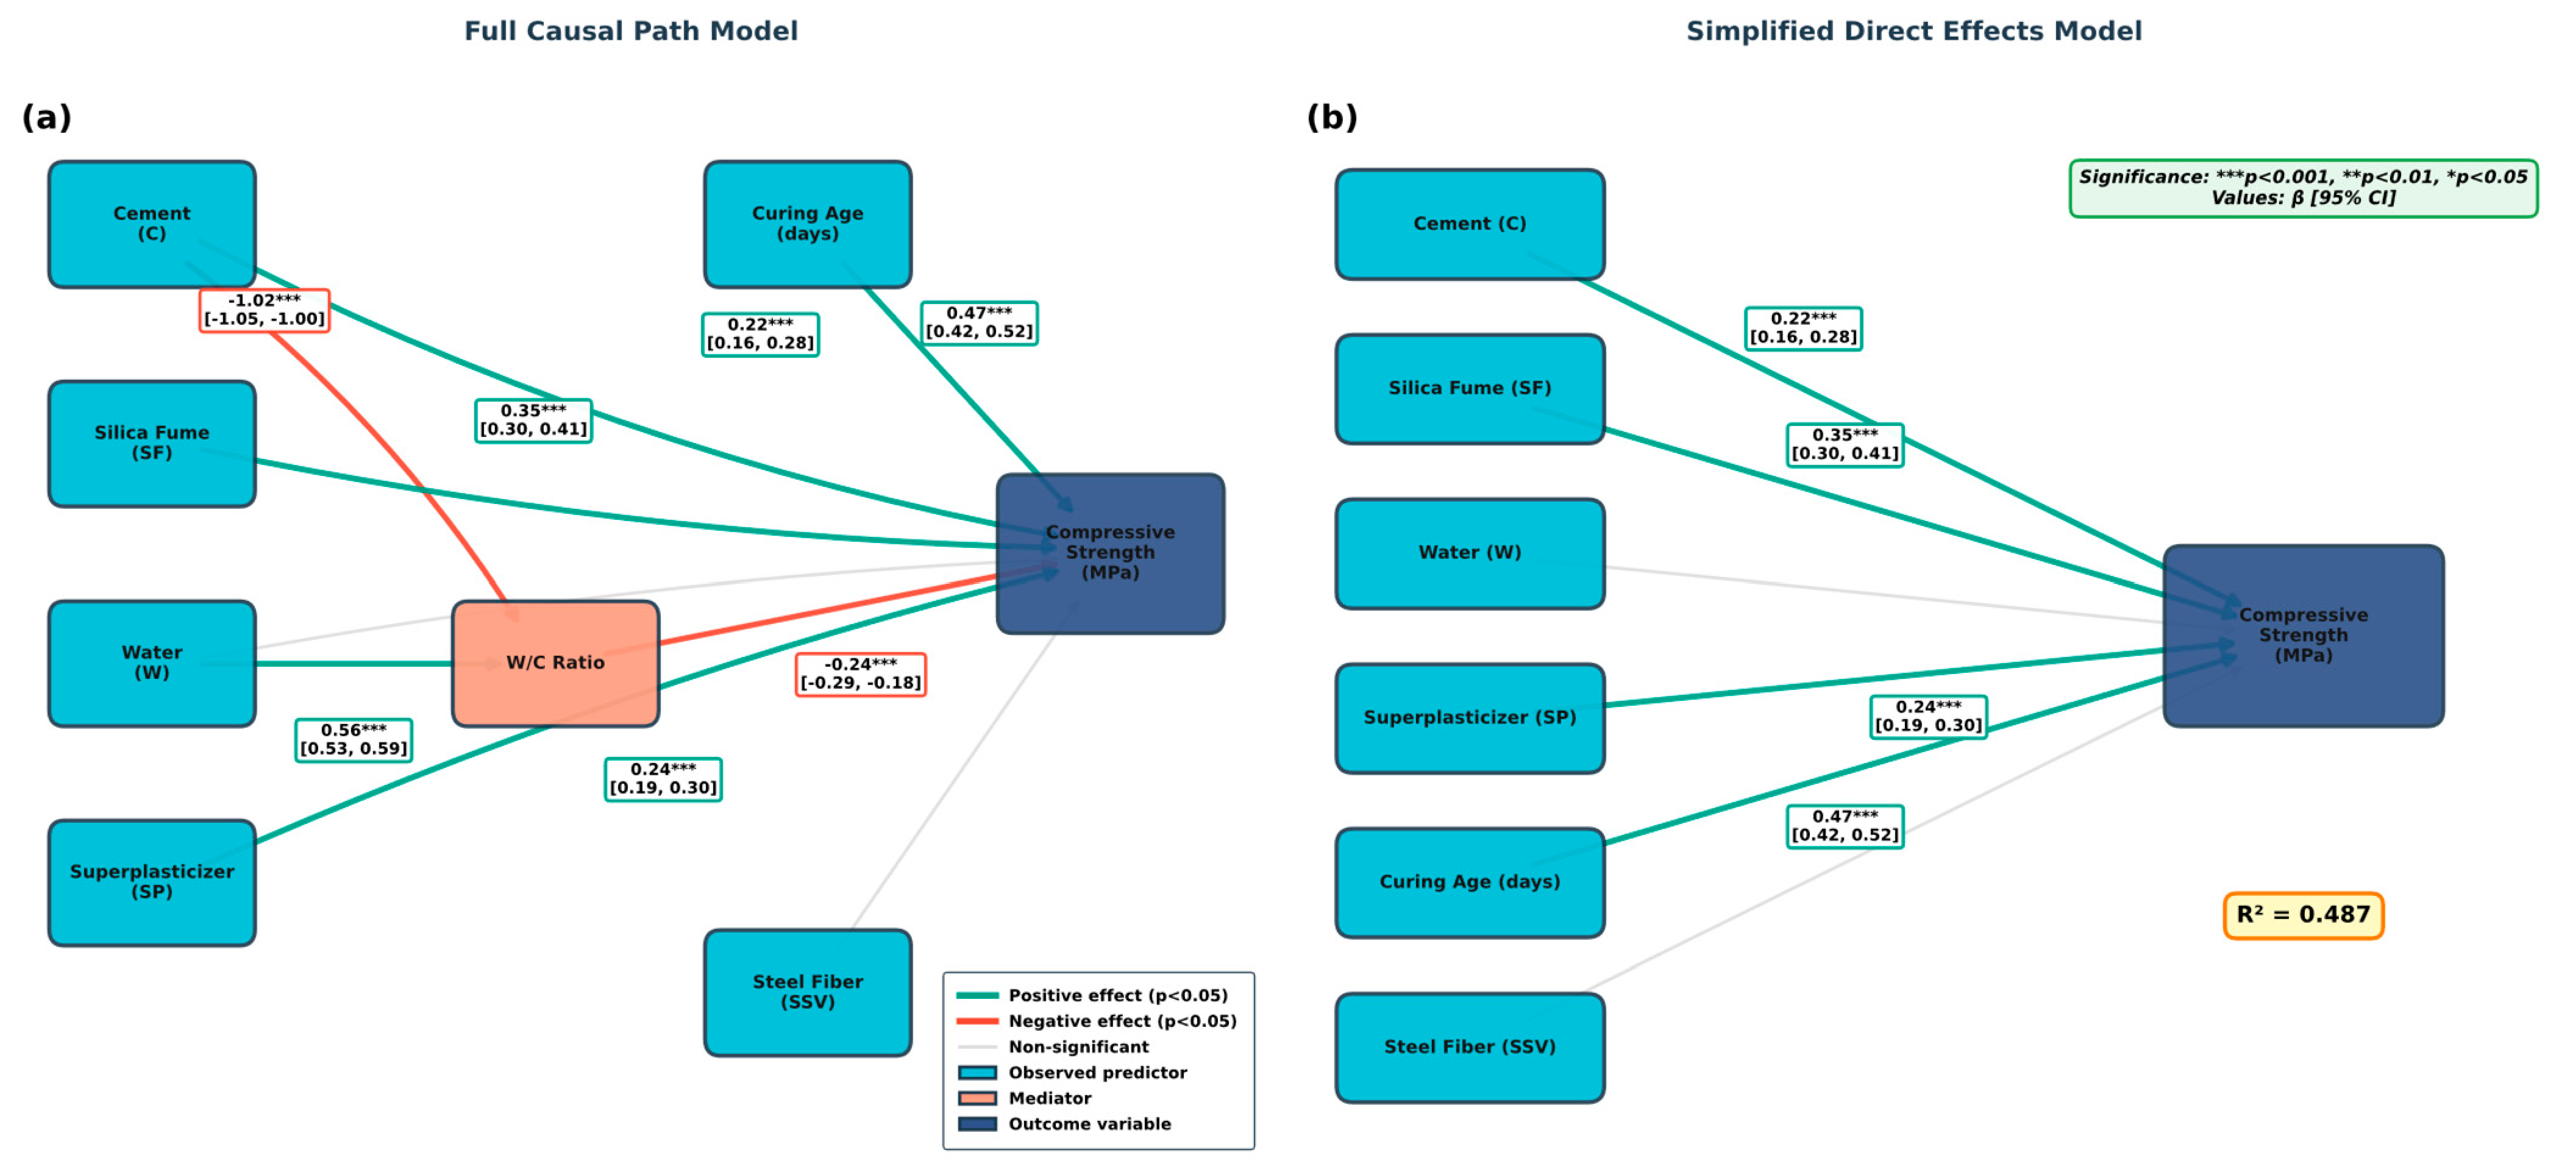
Figure 7 presents the structural equation model (SEM) illustrating causal pathways influencing UHPC CS, constructed using standardized path coefficients with 95% confidence intervals (n = 863). (a) Full causal path model incorporating both direct and mediated effects through water-cement ratio (W/C). Cement exhibits a strong negative effect on W/C ratio (β = −1.02 ***, 95% CI [−1.05, −1.00]), while water shows a positive effect (β = 0.56 ***, [0.53, 0.59]). The W/C ratio demonstrates significant negative influence on CS (β = −0.24 ***, [−0.29, −0.18]), confirming its role as a mediator. Direct positive effects on CS are observed for curing age (β = 0.47 ***, [0.42, 0.52]), silica fume (β = 0.35 ***, [0.30, 0.41]), superplasticizer (β = 0.24 ***, [0.19, 0.30]), and cement (β = 0.22 ***, [0.16, 0.28]). Water and steel fiber (SSV) show non-significant direct effects (gray arrows). (b) Simplified direct effects model displaying standardized regression coefficients from six predictors to CS. Age emerges as the strongest predictor (β = 0.47), followed by SF (β = 0.35), SP (β = 0.24), and C (β = 0.22). The model explains 48.7% of variance in compressive strength (R2 = 0.487). Green and red arrows indicate positive and negative significant effects (p < 0.05), respectively; gray arrows denote non-significant paths.
Figure 7.
Structural equation modeling: causal pathways and direct effects.
4. Methods
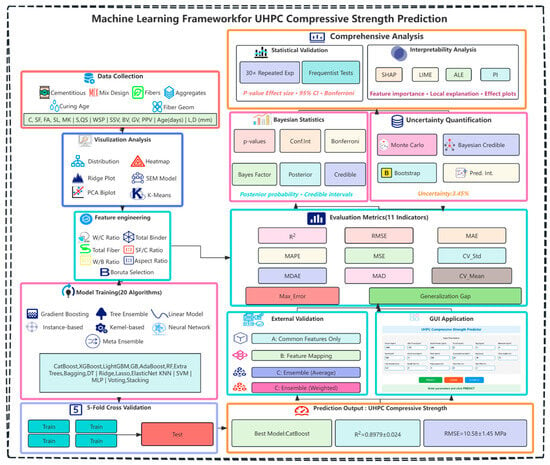
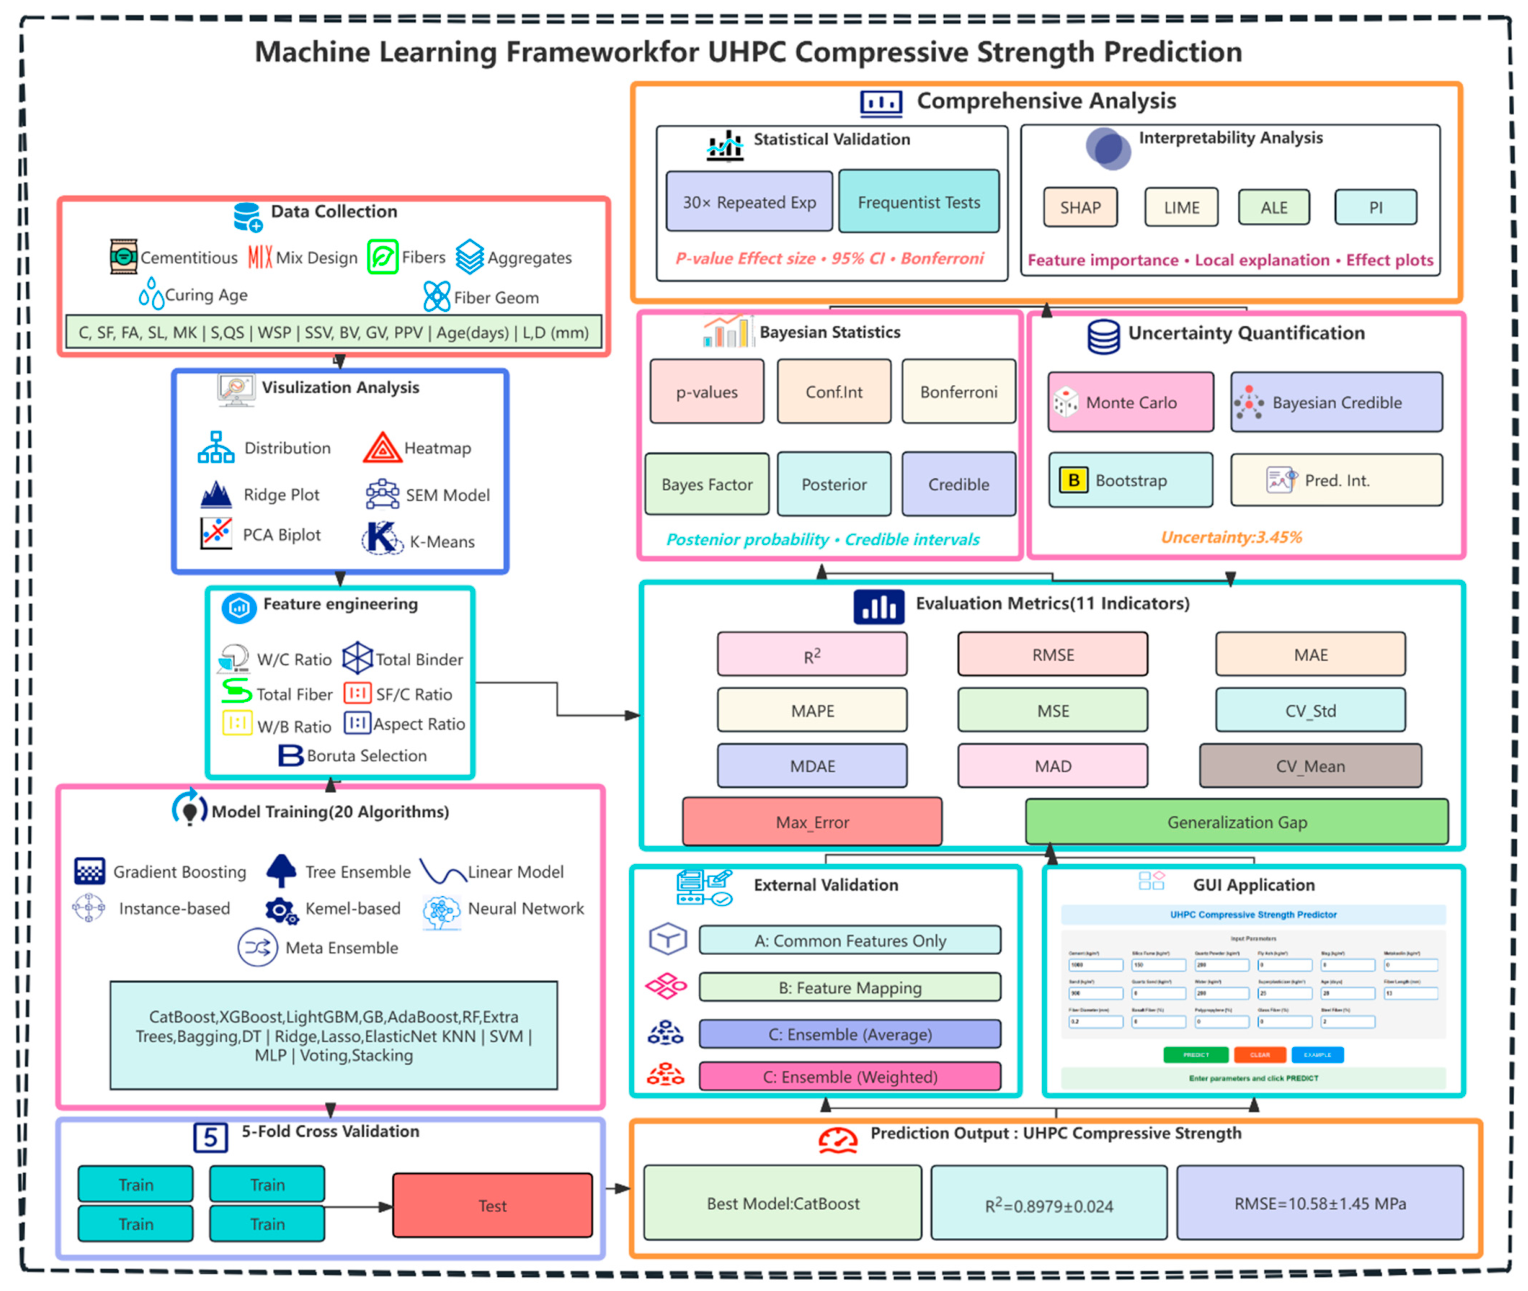
Figure 8 illustrates the end-to-end machine learning framework for UHPC CS prediction. The workflow initiates with data collection encompassing cementitious materials, aggregates, mix design parameters, fiber properties, and curing conditions. Exploratory analysis employs correlation heatmaps, distribution plots, PCA biplots, and structural equation modeling to elucidate data patterns. Feature engineering constructs six domain-informed composite variables with Boruta-based feature selection. Model training benchmarks 20 algorithms across seven categories using 5-fold cross-validation. Statistical validation employs repeated experiments with both frequentist and Bayesian inference for robust model comparison. Uncertainty quantification integrates Monte Carlo, bootstrap, and Bayesian credible intervals. Model interpretability combines SHAP, LIME, ALE, and permutation importance for comprehensive feature analysis. External validation confirms generalization capability, and a graphical user interface enables practical strength prediction.
Figure 8.
Schematic workflow of the machine learning framework.
4.1. Machine Learning Models
To comprehensively evaluate predictive performance, this study employs 20 machine learning models spanning seven categories: (1) gradient boosting methods (CatBoost, XGBoost, LightGBM, GradientBoosting, AdaBoost), known for their sequential ensemble learning with decision trees; (2) tree-based ensemble models (RandomForest, ExtraTrees, Bagging, DecisionTree) utilizing bootstrap aggregation; (3) linear models (LinearRegression, Ridge, Lasso, ElasticNet, BayesianRidge, SGD) with varying regularization strategies; (4) instance-based learning (KNeighbors); (5) kernel-based method (SVM with RBF kernel); (6) neural network (MLP); and (7) meta ensemble approaches (VotingRegressor, StackingRegressor) combining multiple base learners. Table 3 summarizes the model configurations and key hyperparameters.
Table 3.
Summary of machine learning models.
4.2. Feature Engineering and Selection
Six engineered features are derived from domain knowledge of UHPC mix design, as summarized in Table 4. These composite features capture intrinsic physical relationships governing UHPC performance, enhancing both model interpretability and predictive accuracy compared to raw input variables alone.
Table 4.
Engineered features for UHPC strength prediction.
4.3. Boruta Feature Selection
The Boruta algorithm is applied to identify statistically relevant features by iteratively comparing original variables against randomly shuffled shadow features. The selection criterion is based on Z-score comparison:
where denotes the variable importance measure of feature , and and represent the mean and standard deviation of shadow feature importances, respectively.
As shown in Table 5, all 15 features retained in the final model carry a confirmed status (ranking = 1), with no tentative features included.
Table 5.
Boruta feature selection results for all 23 input features.
4.4. 5-Fold Cross-Validation
Model generalization was assessed through 5-fold cross-validation. The dataset was randomly partitioned into five disjoint subsets:
Each fold served as the validation set once, with performance metrics averaged across all iterations.
5. Experiment
5.1. Experimental Configuration and Setup
The computational framework is implemented in Python 3.13 with scikit-learn 1.6.1, CatBoost 1.2.8, XGBoost 3.1.2, LightGBM 4.6.0, and Boruta 0.4.3. The dataset is partitioned into training (80%) and test (20%) sets with fixed random seed (random_state = 42) for reproducibility. Model robustness is assessed using five-fold cross-validation with shuffle splitting.
5.2. Performance Metrics
Model performance is assessed using eleven evaluation metrics: coefficient of determination (R2), root mean square error (RMSE), mean absolute error (MAE), mean absolute percentage error (MAPE), mean squared error (MSE), maximum error (MaxError), median absolute error (MdAE), median absolute deviation (MAD), cross-validation mean (CV_Mean), cross-validation standard deviation (CV_Std), and generalization gap. The formulations are defined as follows:
where denotes the observed value, represents the predicted value, is the mean of observed values, is the sample size, is the number of cross-validation folds, and quantifies the generalization gap between training and testing performance.
5.3. Model Performance Comparison and Analysis
Table 6 presents the performance comparison of 20 machine learning models for UHPC CS prediction. LightGBM achieves superior performance (R2 = 0.9345, RMSE = 8.90 MPa, CV_Mean = 0.9046 ± 0.0192), demonstrating robust generalization capability. Gradient boosting variants, including GradientBoosting (R2 = 0.9301), CatBoost (R2 = 0.9247), and XGBoost (R2 = 0.9226), exhibit comparable high accuracy, with RMSE ranging from 9.19 to 9.68 MPa. Meta-ensemble approaches—StackingRegressor (R2 = 0.9221) and VotingRegressor (R2 = 0.9113)—achieve competitive results through model combination.
Table 6.
Comparison of 20 machine learning models.
Traditional ensemble methods (Bagging, AdaBoost, DecisionTree) attain moderate performance (R2 ≈ 0.84–0.89), while kernel-based SVM (R2 = 0.7841) and instance-based KNeighbors (R2 = 0.7417) show acceptable but inferior accuracy. Linear models exhibit limited predictive capacity (R2 = 0.49–0.56, RMSE > 23 MPa), reflecting the inherent nonlinearity of UHPC strength behavior. MLP demonstrates poor performance (R2 = 0.2051) with severe overfitting (generalization gap = −0.1892). It should be noted that the MLP configuration used here (two hidden layers of 100 and 50 neurons, max_iter = 500) represents a minimal baseline setting and does not reflect the method’s full capability under systematic hyperparameter optimization. All top five models maintain generalization gaps below 0.06, confirming practical reliability.
Statistical metrics were calculated using the following formulas:
where μ_posterior and σ_posterior represent the mean and standard deviation of the analytically derived Gaussian posterior, obtained from a conjugate Gaussian prior N (0, 0.12) combined with a Gaussian likelihood, yielding a closed-form Gaussian posterior. The 1.96 multiplier is therefore exact under this formulation, not a normal approximation.
Where and denote the mean performance of two models, is the pooled standard deviation, is the mean difference, is the number of experimental runs, and and represent the posterior mean and standard deviation, respectively.
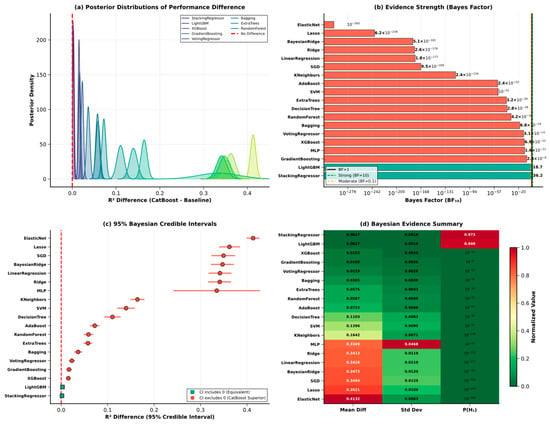
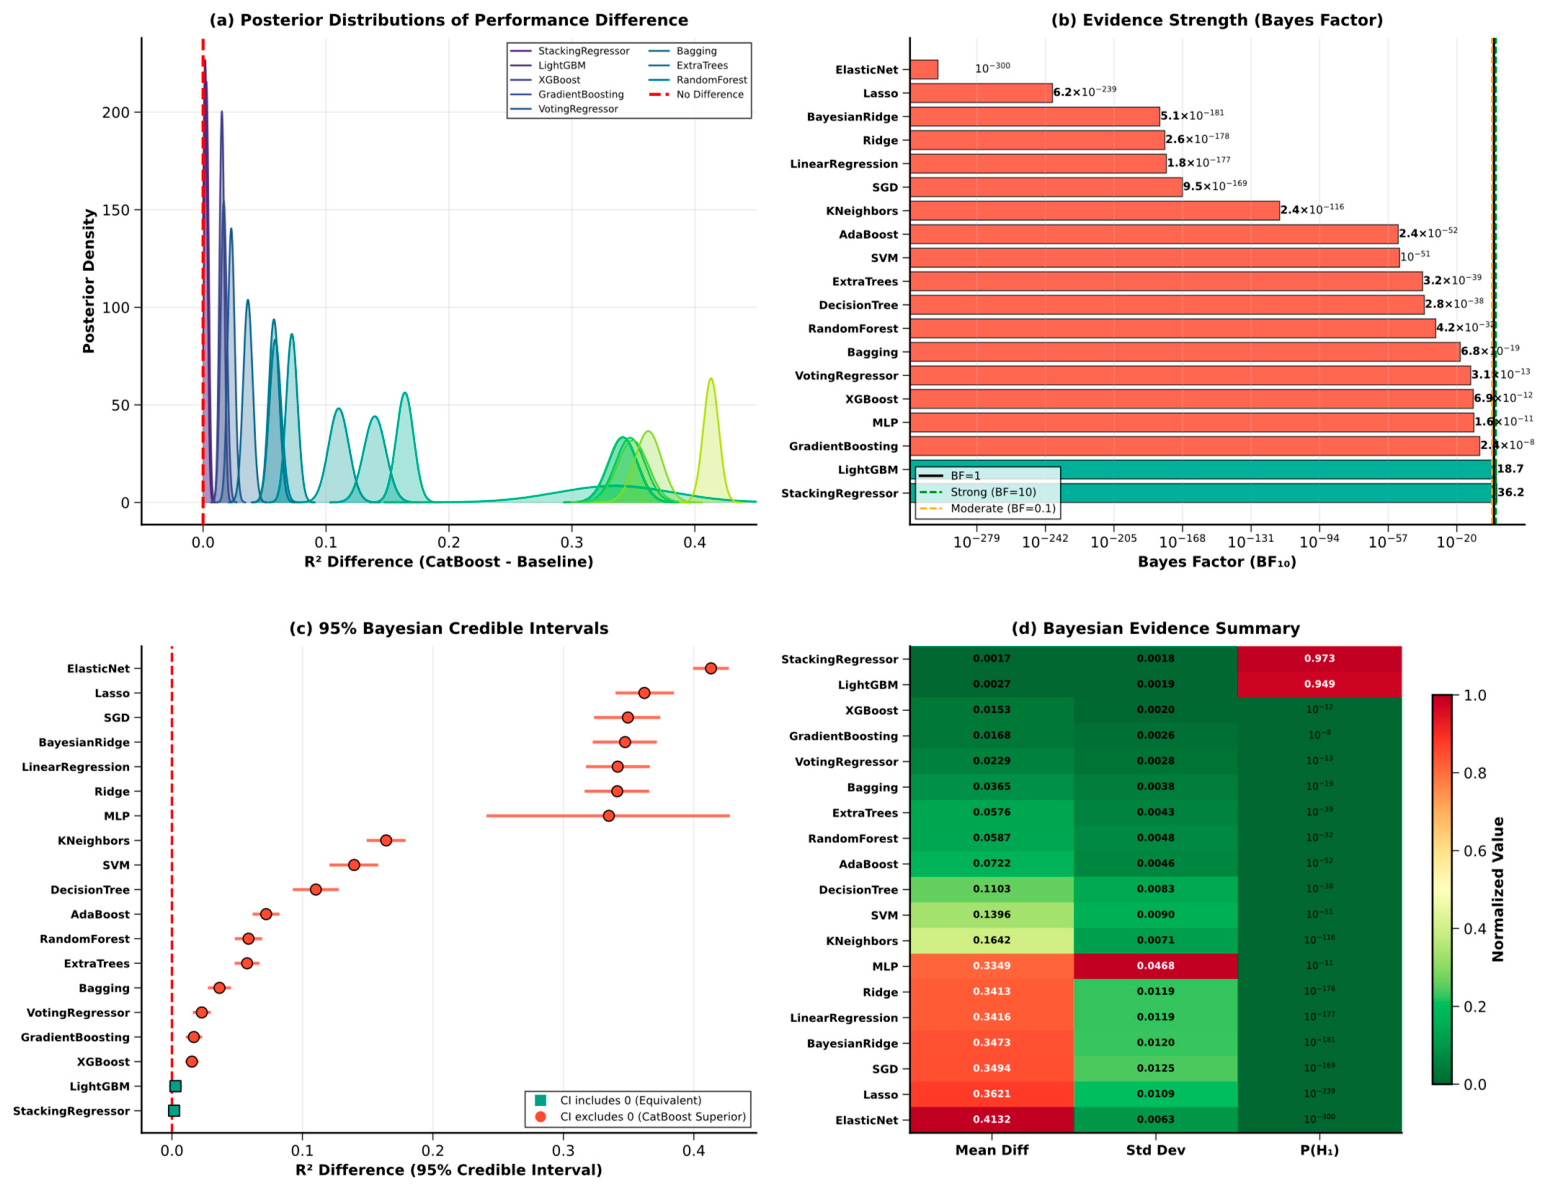
Figure 9 shows Bayesian statistical analysis comparing CatBoost against 19 baseline algorithms across 30 repeated experiments. (a) Posterior distributions of R2 performance difference, where positive values indicate CatBoost superiority; distributions clustered near zero (StackingRegressor, LightGBM) suggest statistical equivalence, while distributions shifted rightward indicate significant inferiority of baseline models. (b) Bayes factor (BF10) forest plot quantifying evidence strength: StackingRegressor (BF = 36.2) and LightGBM (BF = 18.7) demonstrate strong-to-very-strong evidence for equivalence (green bars), while remaining models exhibit decisive evidence against H1 with BF values from 10−8 (GradientBoosting) to 10−300 (ElasticNet), shown as red bars; (c) 95% Bayesian credible intervals for mean R2 difference; square markers indicate statistical equivalence (StackingRegressor, LightGBM), circular markers confirm CatBoost’s significant superiority over 17 baseline models. (d) Heatmap of posterior statistics: Mean Diff (R2 improvement), Std Dev (estimation uncertainty), and P(H1) (posterior probability of equivalence); linear models show the largest gaps (Mean Diff > 0.34) with near-zero posterior probabilities.
Figure 9.
Bayesian statistical validation of model performance.
Table 7 presents comprehensive statistical validation across 30 independent experimental runs, comparing CatBoost against 19 baseline algorithms using both frequentist and Bayesian inference. CatBoost achieves optimal predictive performance (R2 = 0.8979 ± 0.0239, RMSE = 10.58 ± 1.45 MPa, CV_R2 = 0.8899 ± 0.0122), demonstrating robust generalization capability. Statistical testing reveals no significant differences from StackingRegressor (p = 0.350, BF = 36.25, d = 0.068) and LightGBM (p = 0.156, BF = 18.70, d = 0.109), with Bayes factors providing moderate-to-strong evidence for model equivalence.
Table 7.
Comparison of 20 models with frequentist and Bayesian analysis (30 repeated experiments).
All remaining 17 models exhibit statistically significant inferiority (p < 0.001, Bonferroni-corrected α = 0.0025), with effect sizes ranging from 0.64 (XGBoost) to 13.85 (ElasticNet), indicating small-to-very-large practical differences. Bayesian posterior probabilities of CatBoost superiority exceed 0.99 for these models, with 95% credible intervals entirely above zero, corroborating frequentist conclusions. Linear models demonstrate substantially poor performance (R2 = 0.47–0.55, d > 7.0), confirming their limited capacity for this nonlinear regression task. MLP exhibits high variance (R2 = 0.4691 ± 0.2912), reflecting unstable convergence across random initializations.
While prior studies have reported higher single-run R2 values (e.g., Katlav et al. [19], R2 = 0.993; Khan et al. [20], R2 = 0.969; Kashem et al. [45], R2 = 0.9804), these point estimates are obtained from individual train–test splits on different datasets and are not directly comparable to the mean R2 = 0.8979 ± 0.0239 derived from 30 repeated experiments in this study. Single-run metrics are known to be sensitive to random seed selection and cannot capture model variance across different data partitions.
Given that CatBoost achieves the highest mean R2 (0.8979 ± 0.0239) across 30 repeated experiments, superior to LightGBM (R2 = 0.8952 ± 0.0256) despite their statistical equivalence on individual runs, CatBoost is selected as the optimal model for all subsequent analyses.
5.4. Uncertainty Analysis
Uncertainty quantification is essential for evaluating the reliability of machine learning predictions. To comprehensively assess the prediction uncertainty of the optimized CatBoost model, four complementary methods are employed: Monte Carlo simulation (n = 100), bootstrap analysis (n = 1000), frequentist prediction intervals, and Bayesian credible intervals. The test dataset comprising 173 samples is used for this analysis, and the results are summarized in Table 8 and visualized in Figure 9.
Table 8.
Uncertainty analysis results for the CatBoost model.
Uncertainty analysis results were calculated using the following formulas:
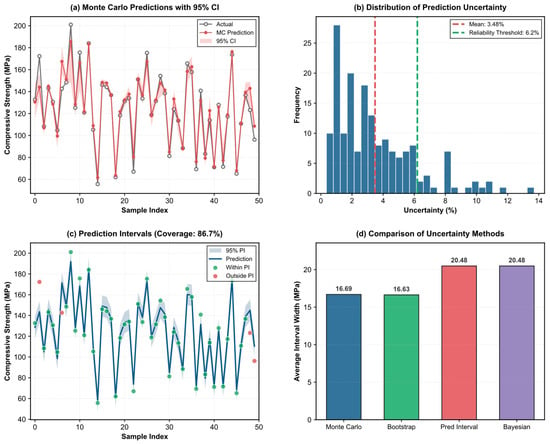
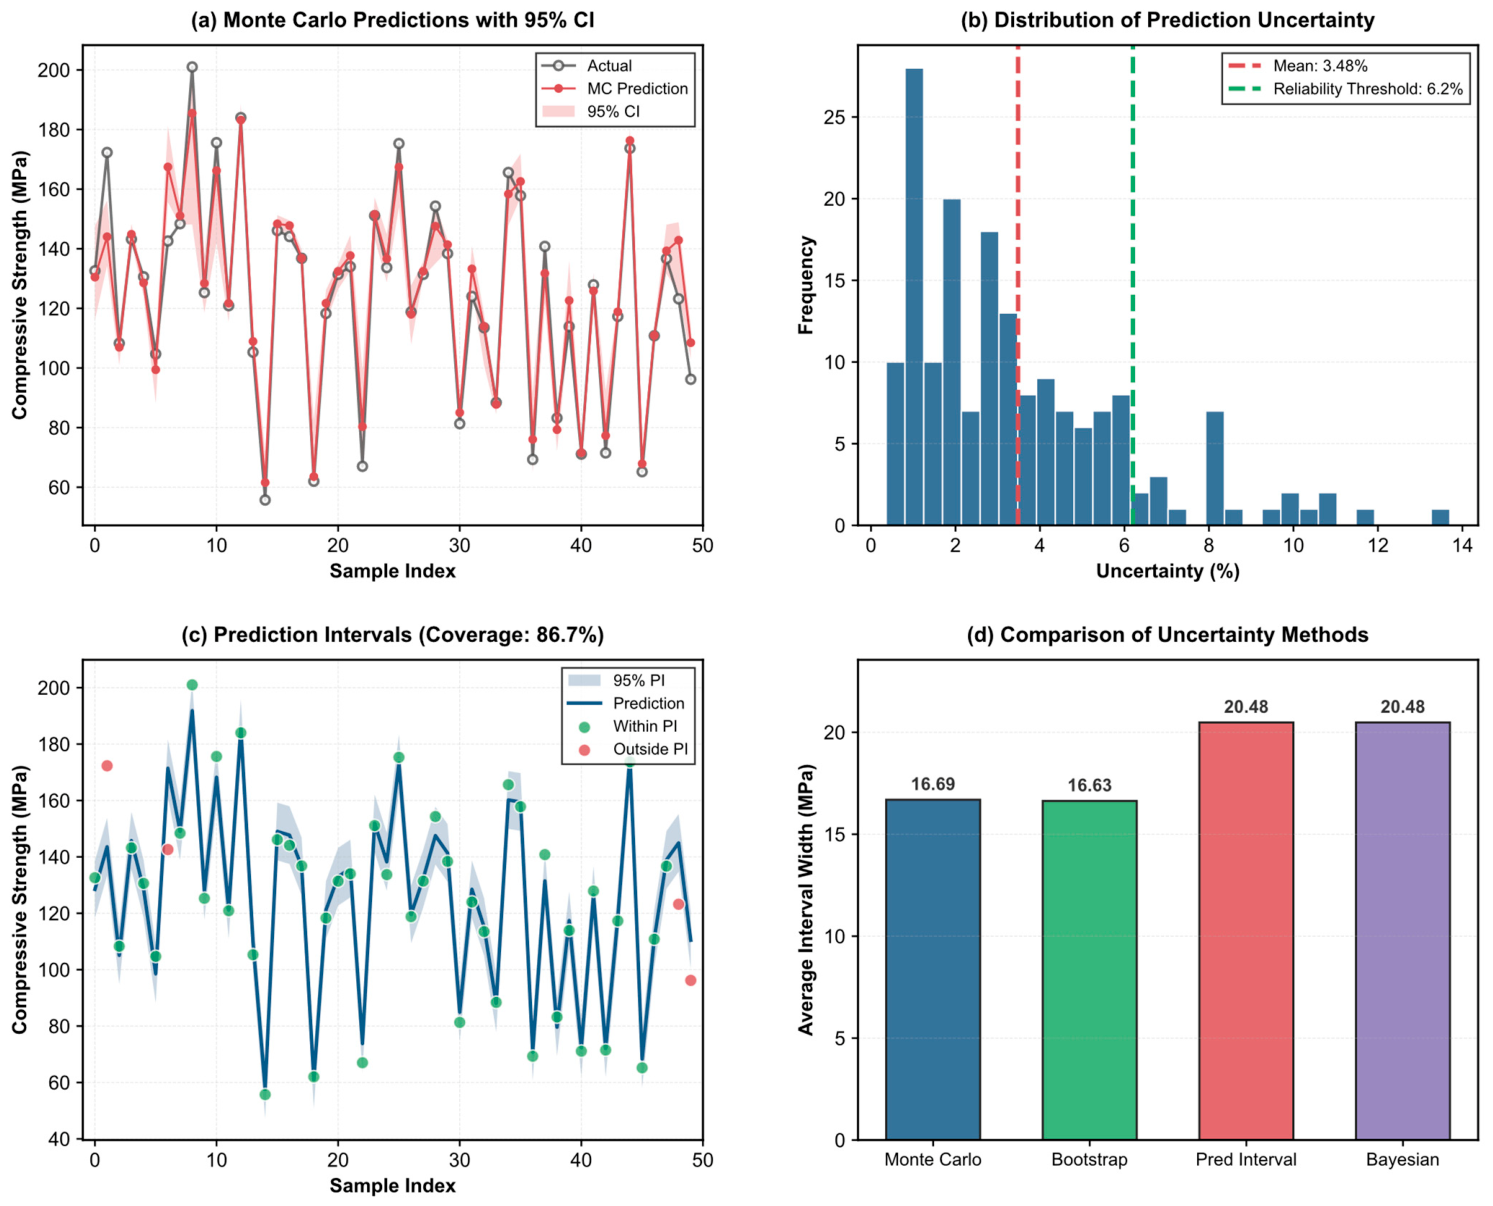
The Monte Carlo simulation (n = 1000 iterations) yields a mean predicted CS of 132.33 MPa with an overall uncertainty of 3.48%, which is substantially lower than previously reported thresholds and below the stringent criterion of 6.2% reported in previous studies [7]. As shown in Figure 10a, the Monte Carlo predictions closely track the actual values with narrow 95% confidence bands. The uncertainty distribution in Figure 10b reveals that the majority of predictions exhibit uncertainty below 6%, with a mean of 3.48% (red dashed line) well within the reliability threshold of 6.2% (green dashed line).
Figure 10.
Uncertainty quantification of CatBoost model predictions.
The bootstrap analysis confirms these findings with consistent mean prediction (132.32 MPa) and similar confidence interval width (16.63 MPa). The prediction interval analysis achieves an 86.7% coverage rate, as illustrated in Figure 10c, where green points indicate samples within the 95% prediction interval, and red points represent outliers. The comparison of all four methods in Figure 10d demonstrates that Monte Carlo and bootstrap produce narrower intervals (16.63–16.69 MPa) compared to the prediction interval and Bayesian methods (both 20.48 MPa), indicating lower epistemic uncertainty in the resampling-based approaches.
The consistency across all four methods and the low uncertainty percentage (3.48%) confirm the high reliability of the CatBoost model. This performance can be attributed to the Boruta feature selection, which eliminates irrelevant predictors, and the optimized CatBoost algorithm, which effectively captures complex nonlinear relationships between mix design parameters and CS.
5.5. Model Interpretability Analysis
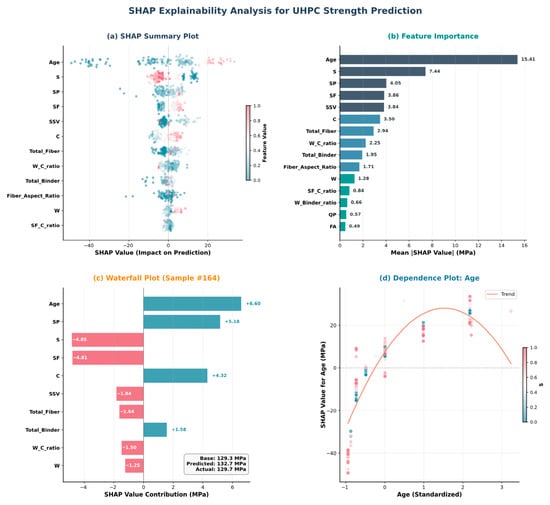
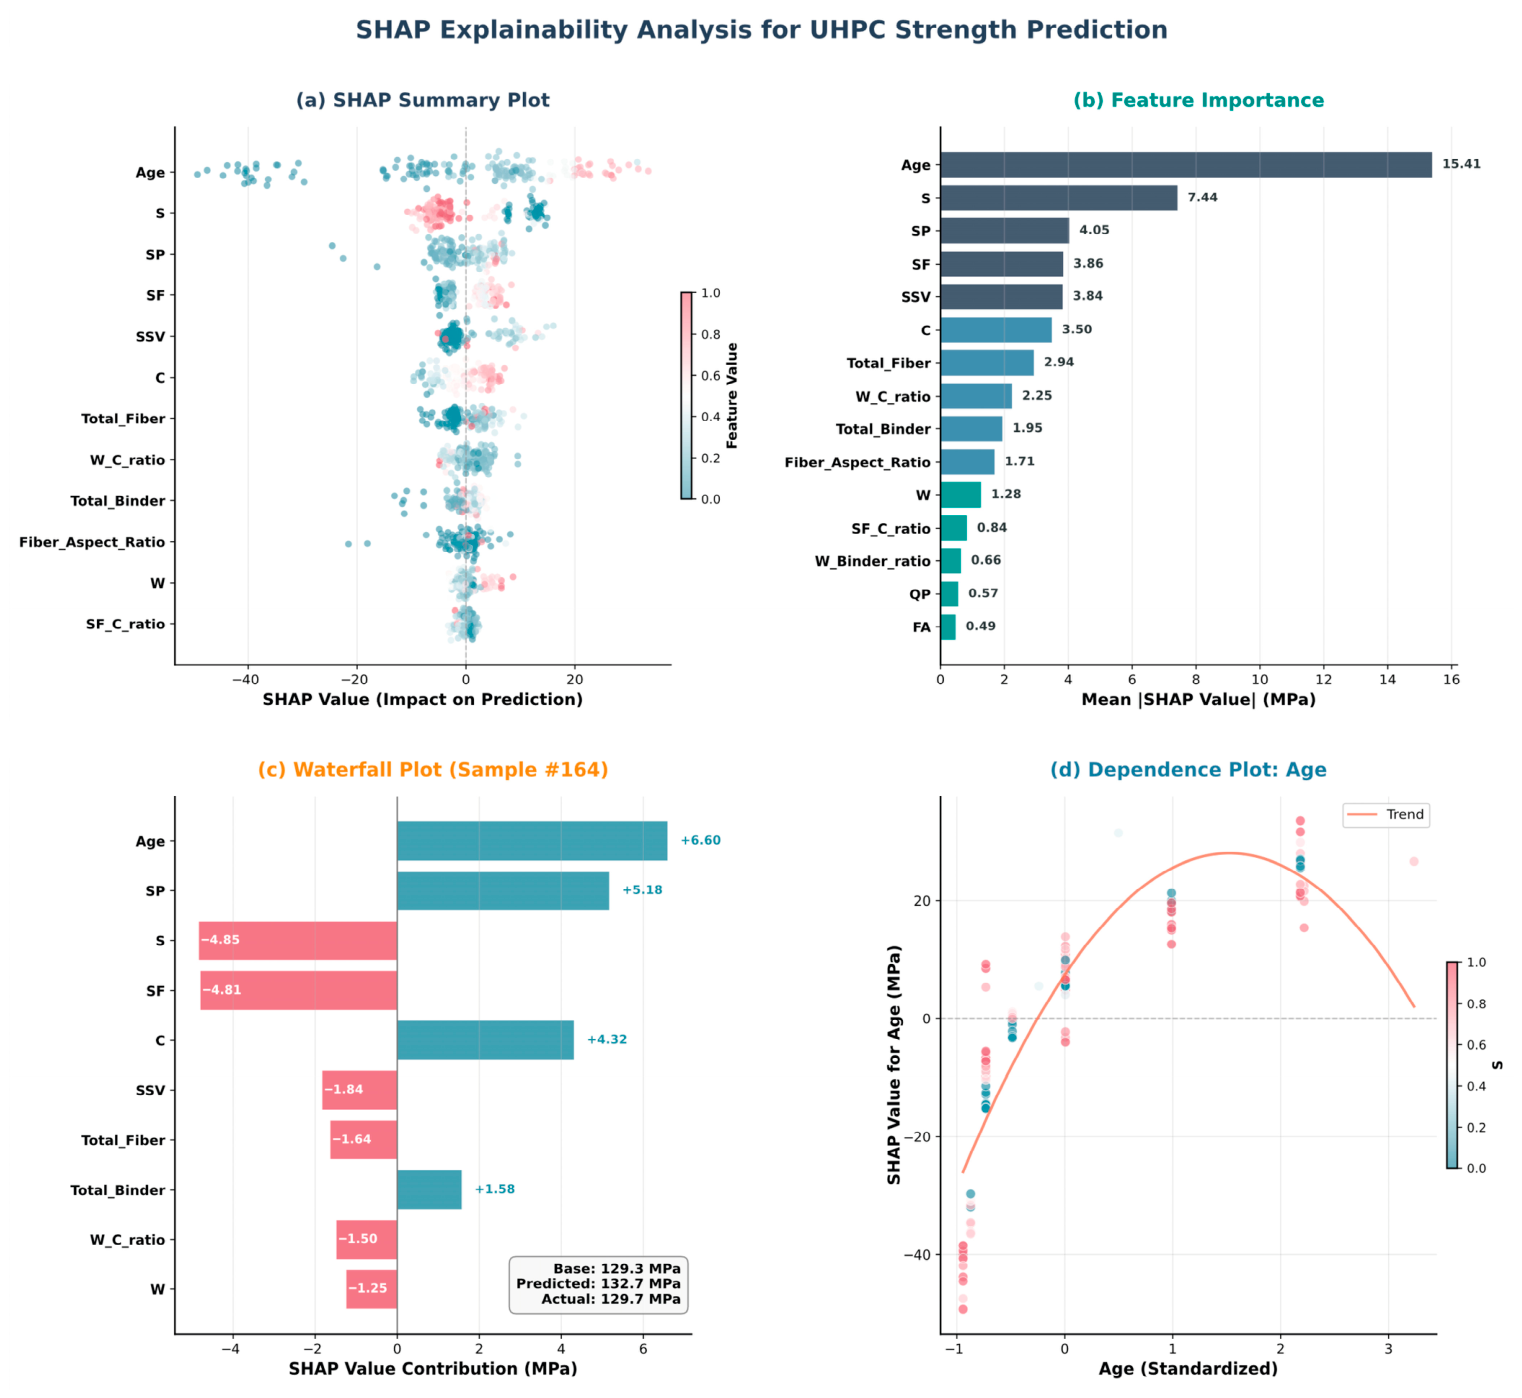
Figure 11 presents a comprehensive SHAP explainability analysis for the CatBoost-based UHPC CS prediction model. (a) The summary plot reveals curing age as the dominant predictor, exhibiting wide SHAP value dispersion (−40 to +25 MPa), with high feature values (red) consistently driving positive contributions. Sand content (S) and superplasticizer (SP) demonstrate secondary importance with bidirectional impacts. (b) Feature importance ranking confirms age as the most influential factor (mean |SHAP| = 15.41 MPa), followed by S (7.44 MPa), SP (4.05 MPa), silica fume (SF, 3.86 MPa), and steel fiber volume (SSV, 3.84 MPa), collectively capturing material composition and hydration kinetics effects.
Figure 11.
SHAP value distribution.
This ranking is consistent with the SEM direct effects model (Figure 7), where age (β = 0.47), SF (β = 0.35), SP (β = 0.24), and C (β = 0.22) were identified as the dominant predictors, confirming cross-method agreement between the hypothesis-driven causal model and the data-driven interpretability analysis. (c) Waterfall plot for a representative sample (#164) illustrates individual prediction decomposition, where age (+6.60 MPa) and SP (+5.18 MPa) provide positive contributions while S (−4.85 MPa) and SF (−4.81 MPa) exert negative influences, yielding a predicted strength of 132.7 MPa against the 129.3 MPa baseline. (d) Dependence plot demonstrates a nonlinear relationship between age and its SHAP contribution, showing accelerated strength gains at extended curing periods (standardized age> 1), with interaction effects from sand content indicated by color gradients.
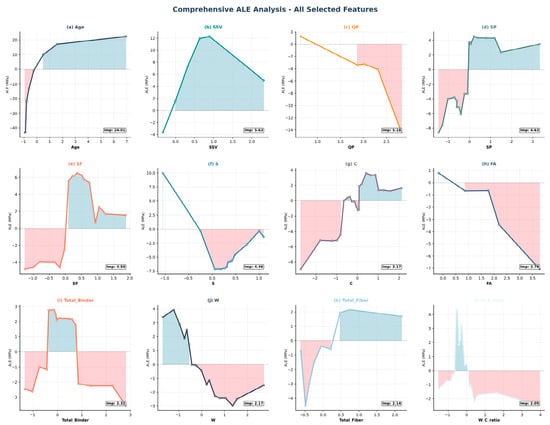
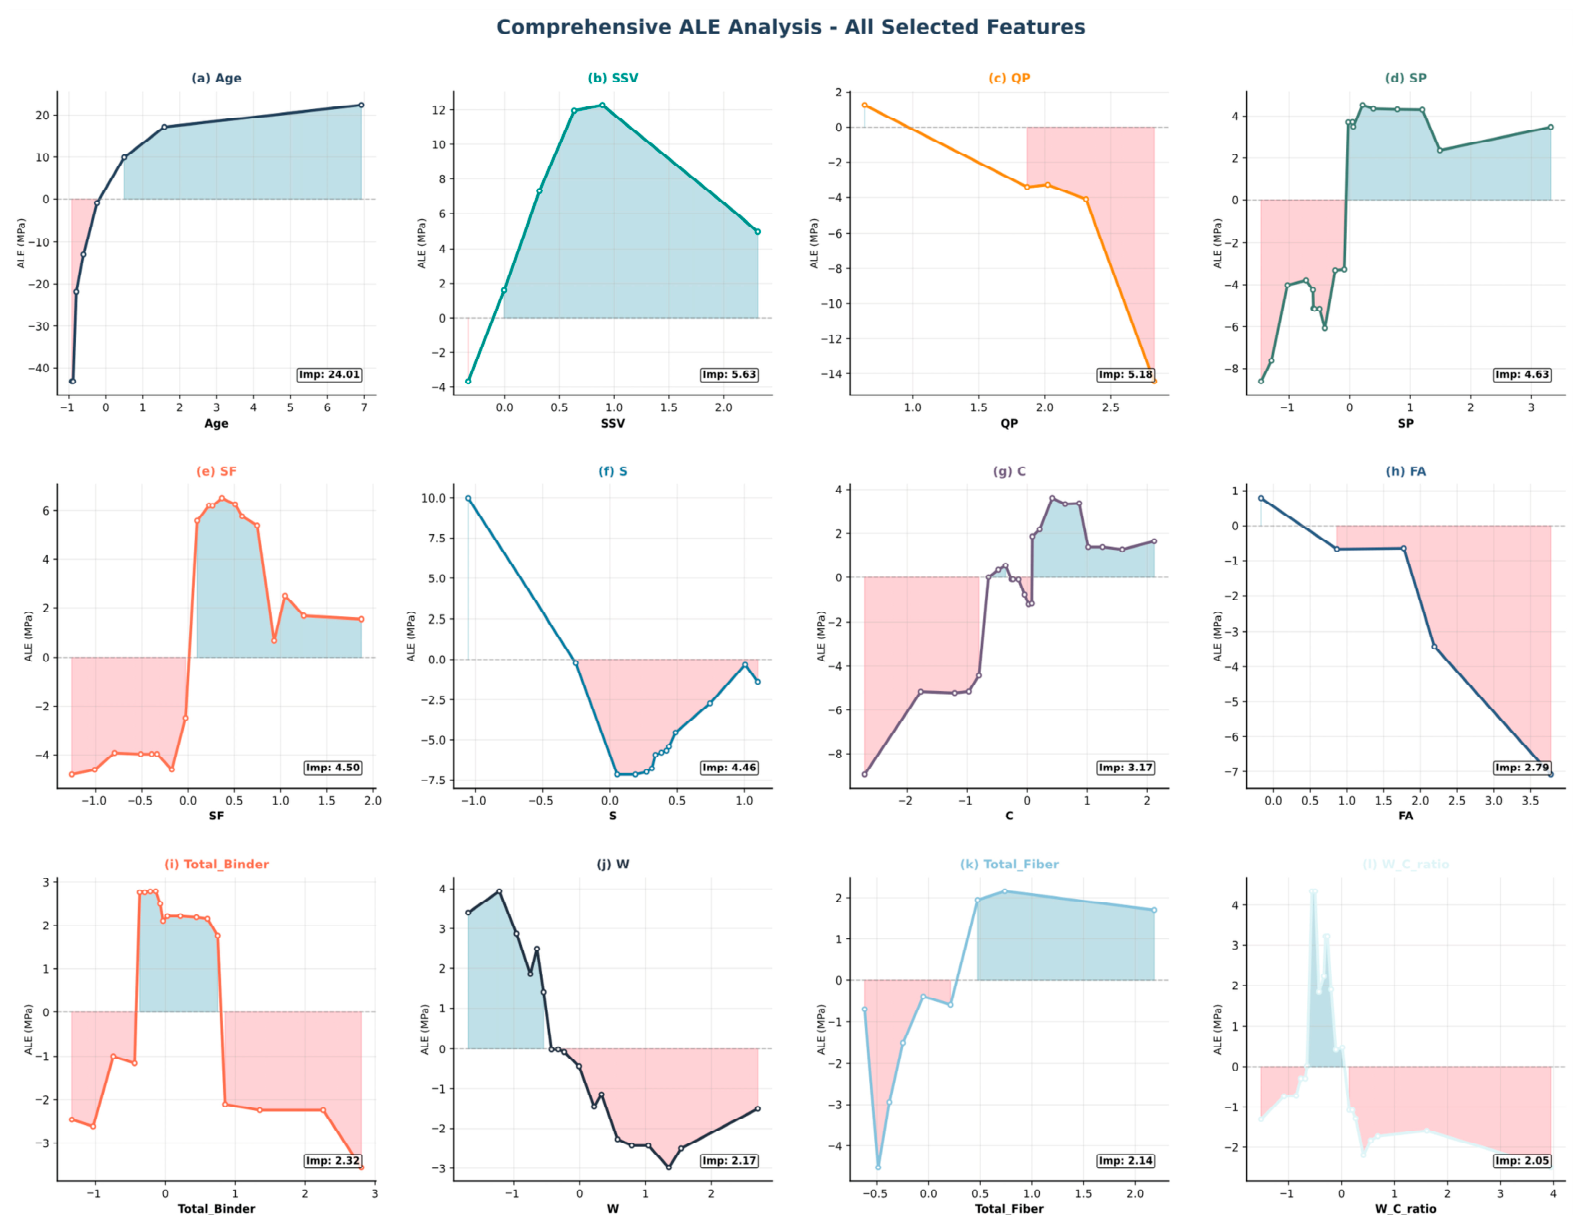
Figure 12 presents comprehensive ALE plots for the twelve most influential features identified through Boruta selection in the CatBoost prediction model. (a) Curing age exhibits the most pronounced nonlinear effect (importance = 24.01 MPa), demonstrating rapid strength gains from early curing (ALE ≈ −43 MPa at standardized age < 0) to a plateau region (ALE ≈ +22 MPa at age > 2), consistent with cement hydration kinetics. (b) Steel fiber volume fraction (SSV) shows monotonic positive contribution up to intermediate dosages (ALE peak ≈ +12 MPa at SSV ≈ 1.0), followed by diminishing returns at higher contents. (c) Quartz powder (QP) displays predominantly negative effects (ALE ≈ −14 MPa) at elevated concentrations, suggesting dilution of reactive binder phases. (d) Superplasticizer (SP) exhibits a U-shaped response pattern with negative effects at low dosages transitioning to positive contributions at higher contents. (e) Silica fume (SF) demonstrates an optimal dosage effect with peak contribution (ALE ≈ +6 MPa) at intermediate levels before declining. (f) Sand content (S) reveals strong nonlinearity with positive effects at low values diminishing toward negative contributions at higher aggregate ratios. (g–l) Secondary features, including cement (C), fly ash (FA), Total_Binder, water (W), Total_Fiber, and W_C_ratio, display moderate ALE variations (importance: 2.05–3.17 MPa), collectively reflecting the complex interplay between mixture proportioning and mechanical performance in UHPC systems.
Figure 12.
Accumulated local effects (ALE) analysis across selected features.
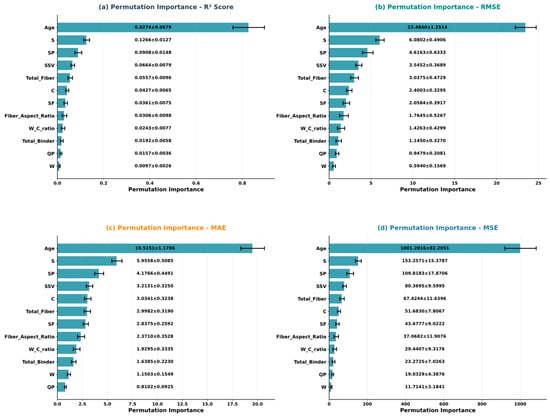
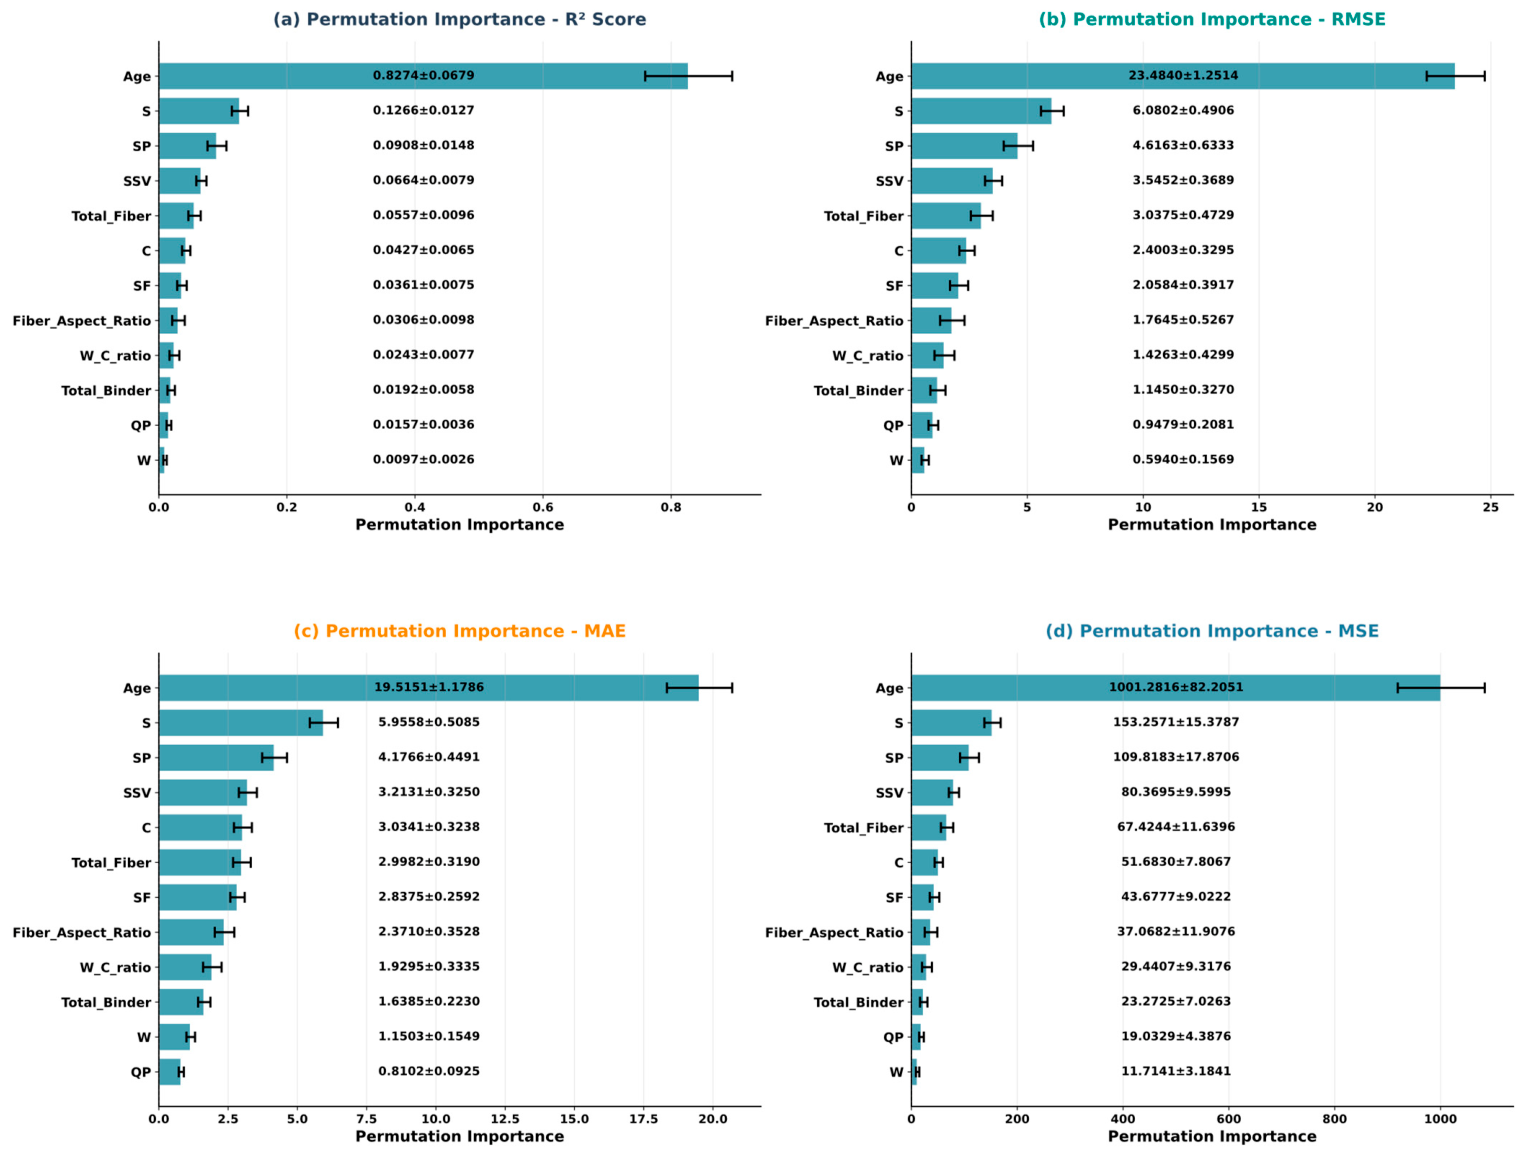
Figure 13 presents permutation-based feature importance evaluated using four distinct scoring metrics for the CatBoost regression model (R2 = 0.9247). (a) R2 score metric reveals curing age as the overwhelmingly dominant predictor (importance = 0.8274 ± 0.0679), indicating that permuting age values reduces explained variance by approximately 83%. Sand content (S, 0.1266 ± 0.0127) and superplasticizer (SP, 0.0908 ± 0.0148) demonstrate secondary importance, followed by steel fiber volume (SSV, 0.0664 ± 0.0079) and Total_Fiber (0.0557 ± 0.0096). (b) RMSE-based evaluation confirms the feature hierarchy, with age exhibiting the largest prediction error increase upon permutation (23.48 ± 1.25 MPa), while S (6.08 ± 0.49 MPa) and SP (4.62 ± 0.63 MPa) maintain consistent secondary rankings. (c) The MAE metric demonstrates comparable patterns, with age contributing 19.52 ± 1.18 MPa to prediction accuracy, followed by S (5.96 ± 0.51 MPa), SP (4.18 ± 0.45 MPa), and SSV (3.21 ± 0.33 MPa). (d) MSE-based analysis amplifies the dominance of age (1001.28 ± 82.21), reflecting quadratic sensitivity to prediction errors. The consistent feature ranking across all metrics (correlation with SHAP: r = 0.94; with ALE: r = 0.98) validates the robustness of identified predictors, with curing duration, aggregate content, and admixture dosage constituting the primary determinants of UHPC mechanical performance.
Figure 13.
Permutation importance analysis.
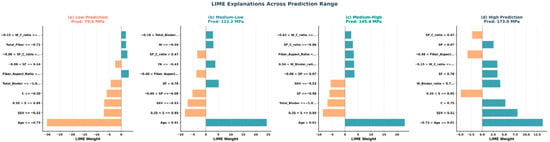
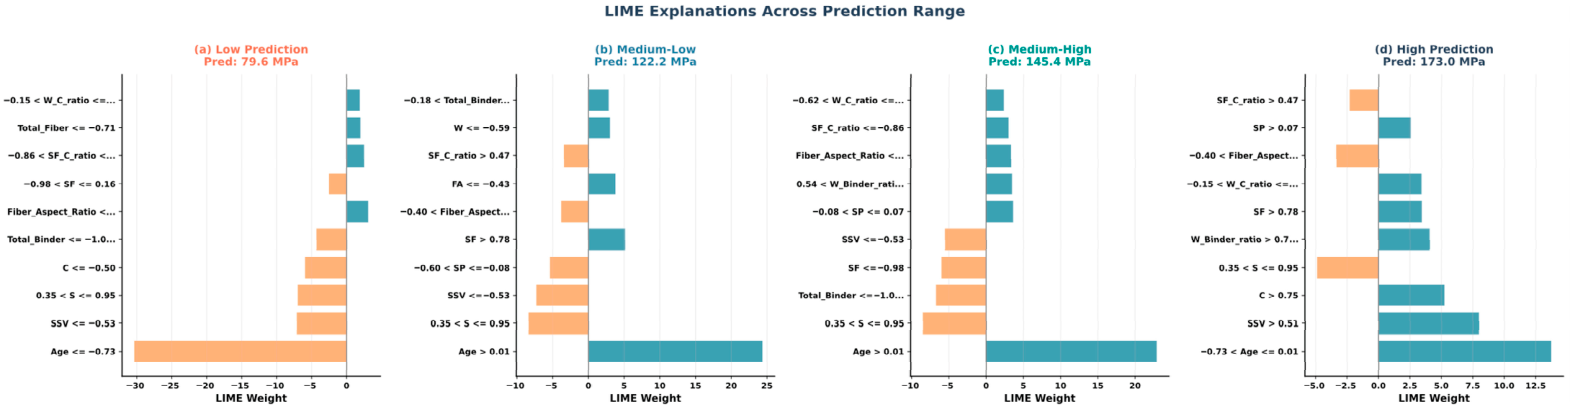
Figure 14 presents local interpretable model-agnostic explanations (LIME) for representative samples spanning the full prediction spectrum of the CatBoost model (R2 = 0.9247). (a) Low prediction sample (79.6 MPa) exhibits dominant negative contributions from early curing age (age ≤ −0.73, weight ≈ −28), with secondary negative influences from steel fiber volume (SSV ≤ −0.53), sand content (0.35 < S ≤ 0.95), cement (C ≤ −0.50), total binder (Total_Binder ≤ −1.0), and fiber aspect ratio, collectively explaining the below-average strength prediction. (b) Medium-low prediction sample (122.2 MPa) demonstrates a pivotal transition where extended curing (age > 0.01, weight ≈ +22) becomes the primary positive driver, while negative contributions from sand content (0.35 < S ≤ 0.95), steel fiber volume (SSV ≤ −0.53), superplasticizer (−0.60 < SP ≤ −0.08), and fiber aspect ratio partially offset the strength gains. (c) Medium-high prediction sample (145.4 MPa) shows sustained curing age dominance (age > 0.01, weight ≈ +18) with attenuated negative effects from sand, total binder, silica fume (SF ≤ −0.98), and steel fiber volume (SSV ≤ −0.53), reflecting transitional mixture optimization. (d) High prediction sample (173.0 MPa) reveals a fundamentally different explanatory structure characterized by distributed positive contributions across steel fiber volume (SSV > 0.51, weight ≈ +11), cement content (C > 0.75), sand proportion (0.35 < S ≤ 0.95), silica fume (SF > 0.78), water-binder ratio (W_Binder_ratio > 0.7), and moderate curing effects (−0.73 < age ≤ 0.01), while negative influences from water-cement ratio (W_C_ratio) and fiber aspect ratio remain minor. The transition from single-feature dominance (age) in lower strength predictions to multi-feature positive synergy in high-strength predictions demonstrates the model’s capacity to capture the complex compositional optimization characteristic of ultra-high-performance concrete formulations.
Figure 14.
LIME local explanations across prediction range.
5.6. External Validation
To rigorously evaluate the generalization capability of the proposed prediction model, external validation is conducted using an independent dataset comprising 810 UHPC samples sourced from [39]. This external dataset presents notable differences from the training dataset in terms of feature availability and mixture composition ranges.
The training dataset contains 863 samples with 17 input features, while the external validation dataset includes 810 samples with only 13 features. As summarized in Table 9, only eight features are directly comparable between the two datasets: C (cement), SF (silica fume), FA (fly ash), QP (quartz powder), S (sand), W (water), SP (superplasticizer), and age (curing age).
Table 9.
Feature availability comparison between training and external validation datasets.
To address the feature mismatch, a domain knowledge-based feature mapping strategy is developed: nano-silica (NS) is combined with silica fume (SF) due to their similar pozzolanic reactivity and micro-filling effects; limestone powder (LP) is partially mapped to slag (SL) with a coefficient of 0.3 based on the EN 206 k-value framework (LP: k = 0.15; GGBFS: k = 0.60, ratio ≈ 0.25), with a slight upward adjustment to account for LP’s additional filler and nucleation effects [52]; aggregate (A) is proportionally distributed to sand (S, 60%) and quartz sand (QS, 30%); fiber content (Fi) is mapped to steel fiber volume (SSV), assuming steel fiber dominance in UHPC applications.
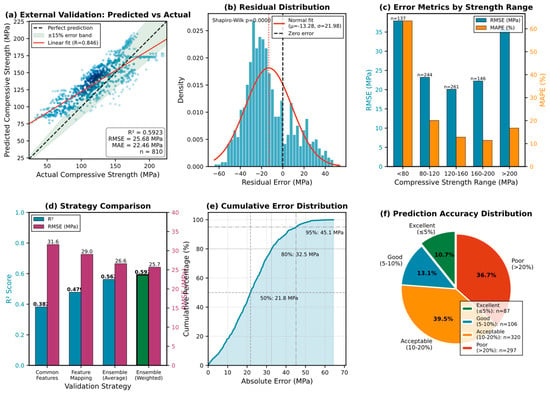
Four validation strategies are implemented to comprehensively assess model transferability: Strategy A using only the eight common features, Strategy B applying domain knowledge-based mapping, and Strategy C combining multiple base models with ensemble approaches. As presented in Table 10, the weighted ensemble strategy achieves the best external validation performance, with R2 = 0.5923, RMSE = 25.68 MPa, MAE = 22.46 MPa, and MAPE = 23.41%.
Table 10.
External validation performance metrics by strategy.
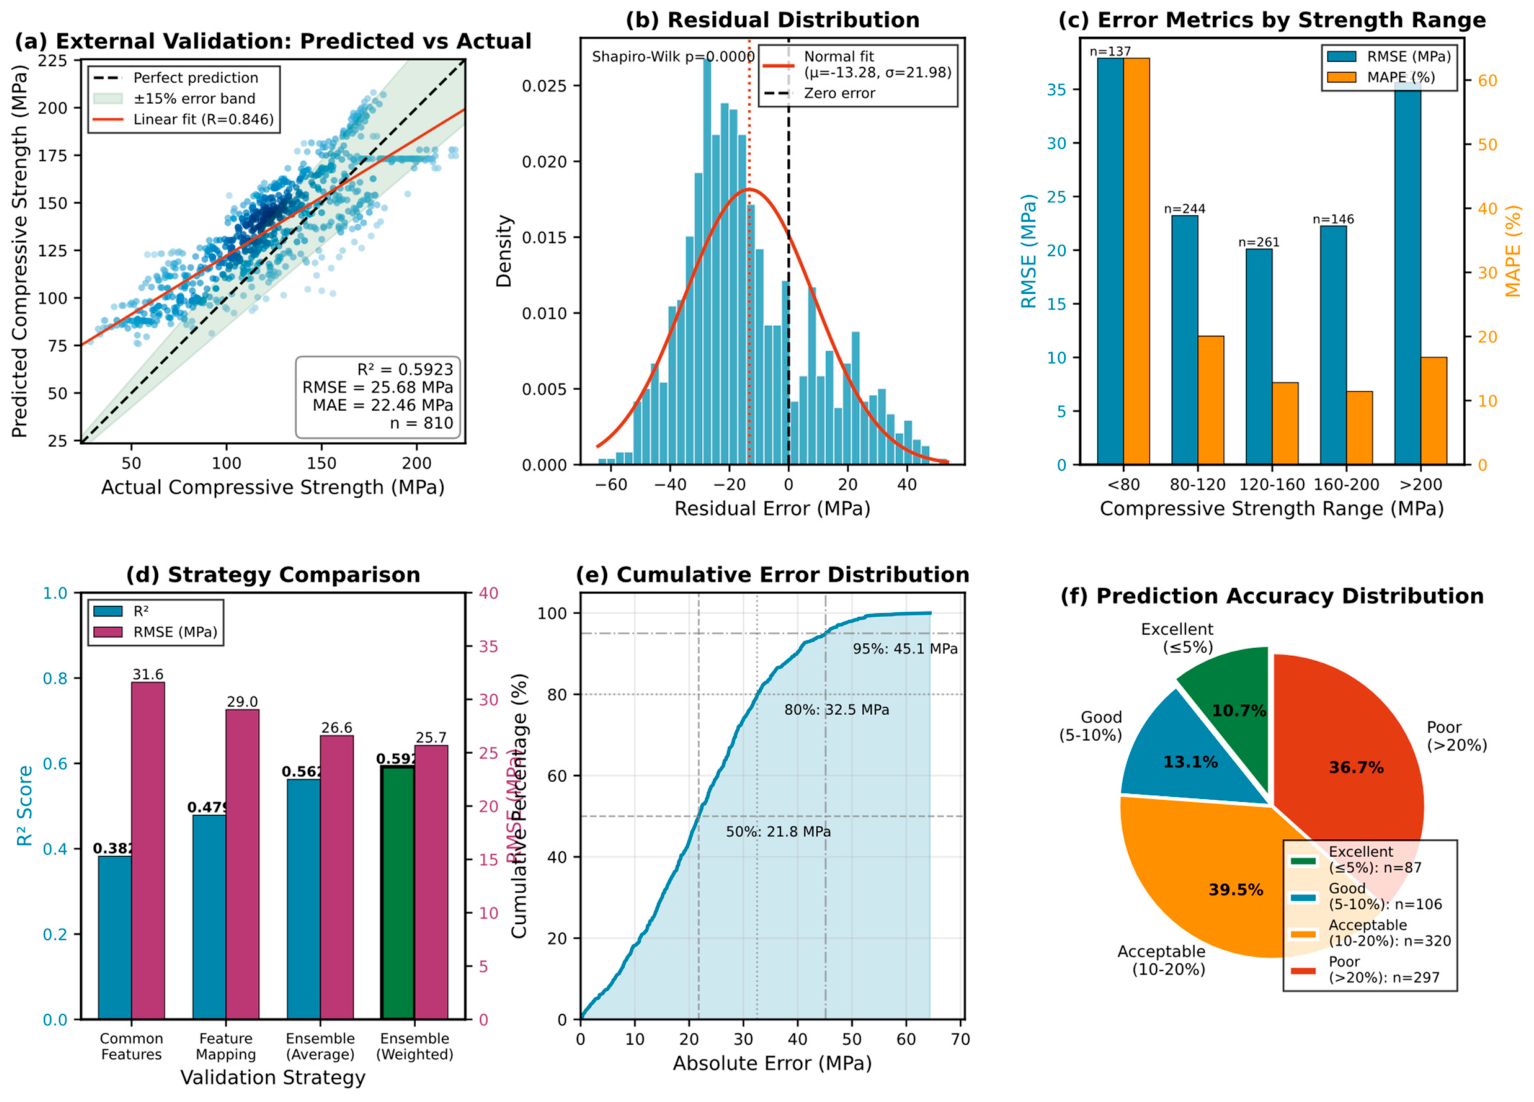
The external validation results reveal several important findings as illustrated in Figure 15. The scatter plot of predicted versus actual CS (Figure 15a) demonstrates that the model captures the general trend of UHPC strength development, with linear regression yielding R = 0.846. The residual analysis (Figure 15b) shows an approximately normal distribution with mean bias of −13.28 MPa and standard deviation of 21.98 MPa.
Figure 15.
External validation comprehensive analysis.
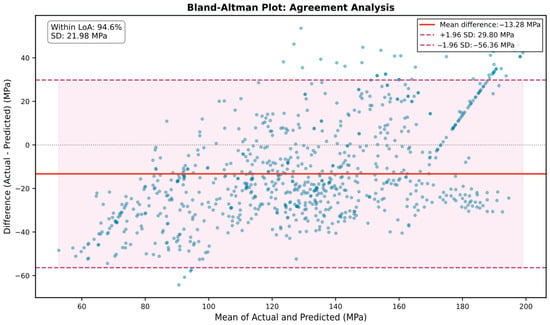
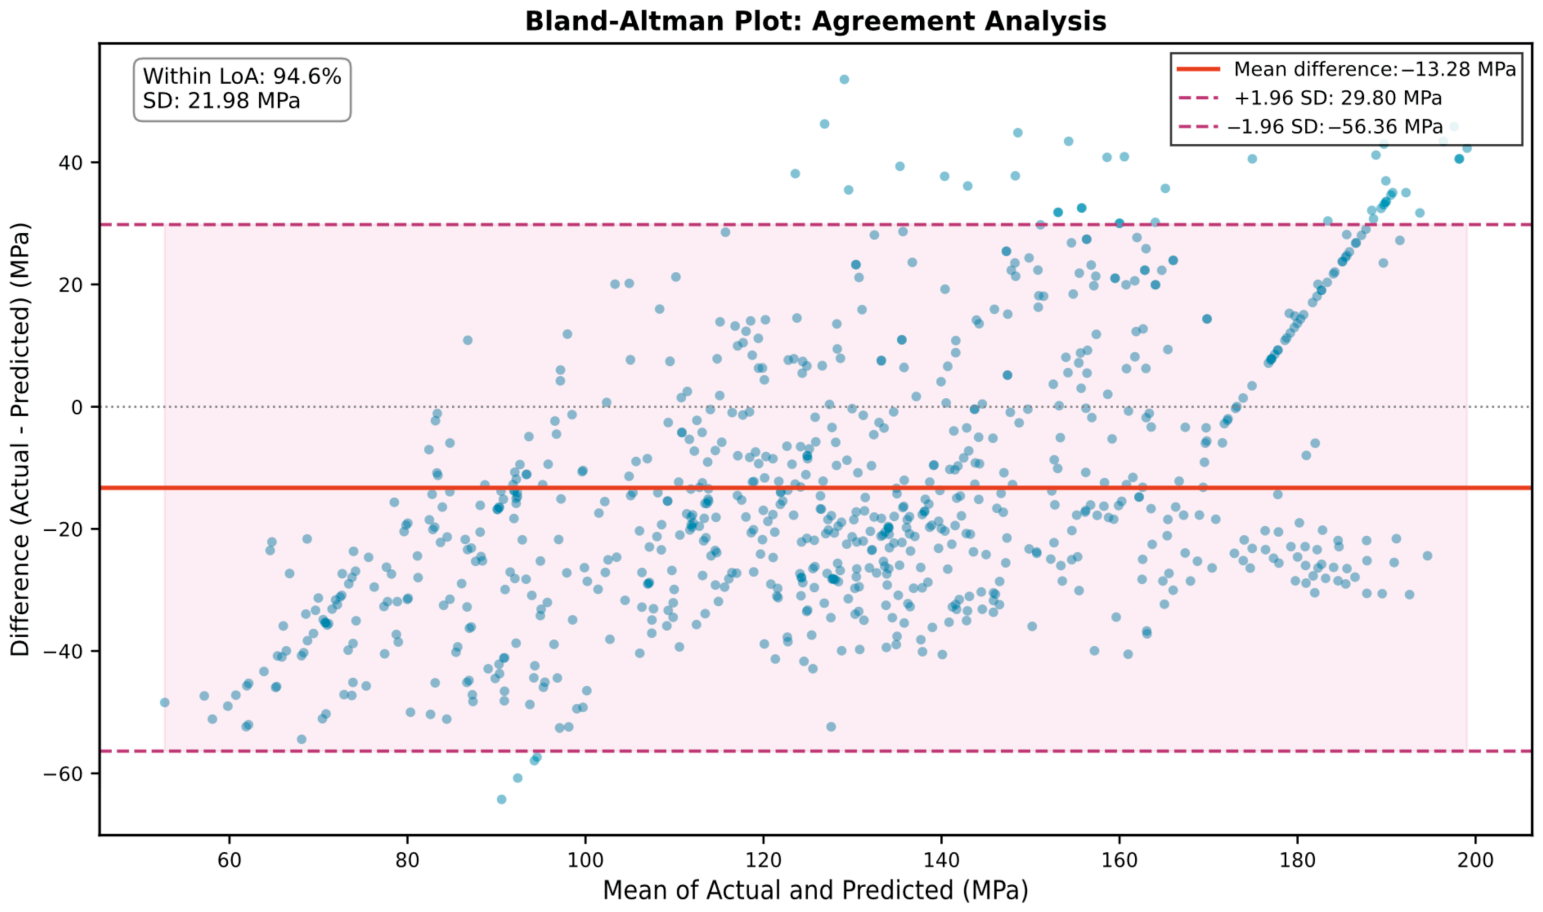
Prediction accuracy varies across strength ranges (Figure 15c), with best performance in the 120–160 MPa range. The error distribution analysis (Figure 15d) indicates that 10.7% of predictions achieve excellent accuracy (≤5% error), 13.1% are good (5–10% error), 39.5% are acceptable (10–20% error), and 36.7% exceed 20% error. Collectively, 63.3% of predictions fall within the ±20% threshold. The Bland–Altman plot (Figure 16) demonstrates that 94.6% of predictions fall within the 95% limits of agreement ([−56.36, 29.80] MPa), confirming acceptable agreement despite the domain shift.
Figure 16.
Bland–Altman agreement analysis.
The observed reduction in R2 from 0.9247 (internal test set) to 0.5923 (external validation), approximately 36%, is consistent with cross-dataset validation in concrete strength prediction studies [8,46,53]. This performance gap can be attributed to: (1) feature information loss—nine features present in the training set are unavailable in the external dataset; (2) distribution shift—the water-to-binder ratio ranges differ substantially between datasets (training: [0.12, 0.24] vs. external: [0.13, 0.50]); (3) mapping approximation errors introduced by feature transformation; and (4) source heterogeneity from different experimental protocols and material sources.
Despite these challenges, the model’s ability to explain 59.2% of variance in the external dataset—while losing access to 53% of original features—demonstrates that the learned patterns reflect genuine physical relationships rather than dataset-specific artifacts. This level of cross-dataset transferability supports the model’s utility for preliminary mix design screening in practical applications.
5.7. GUI Development
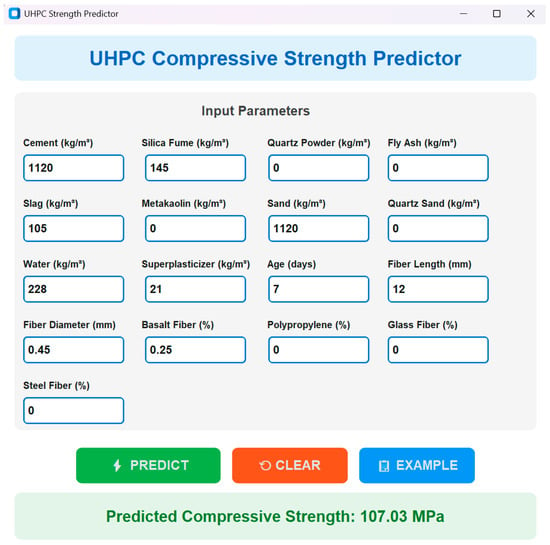
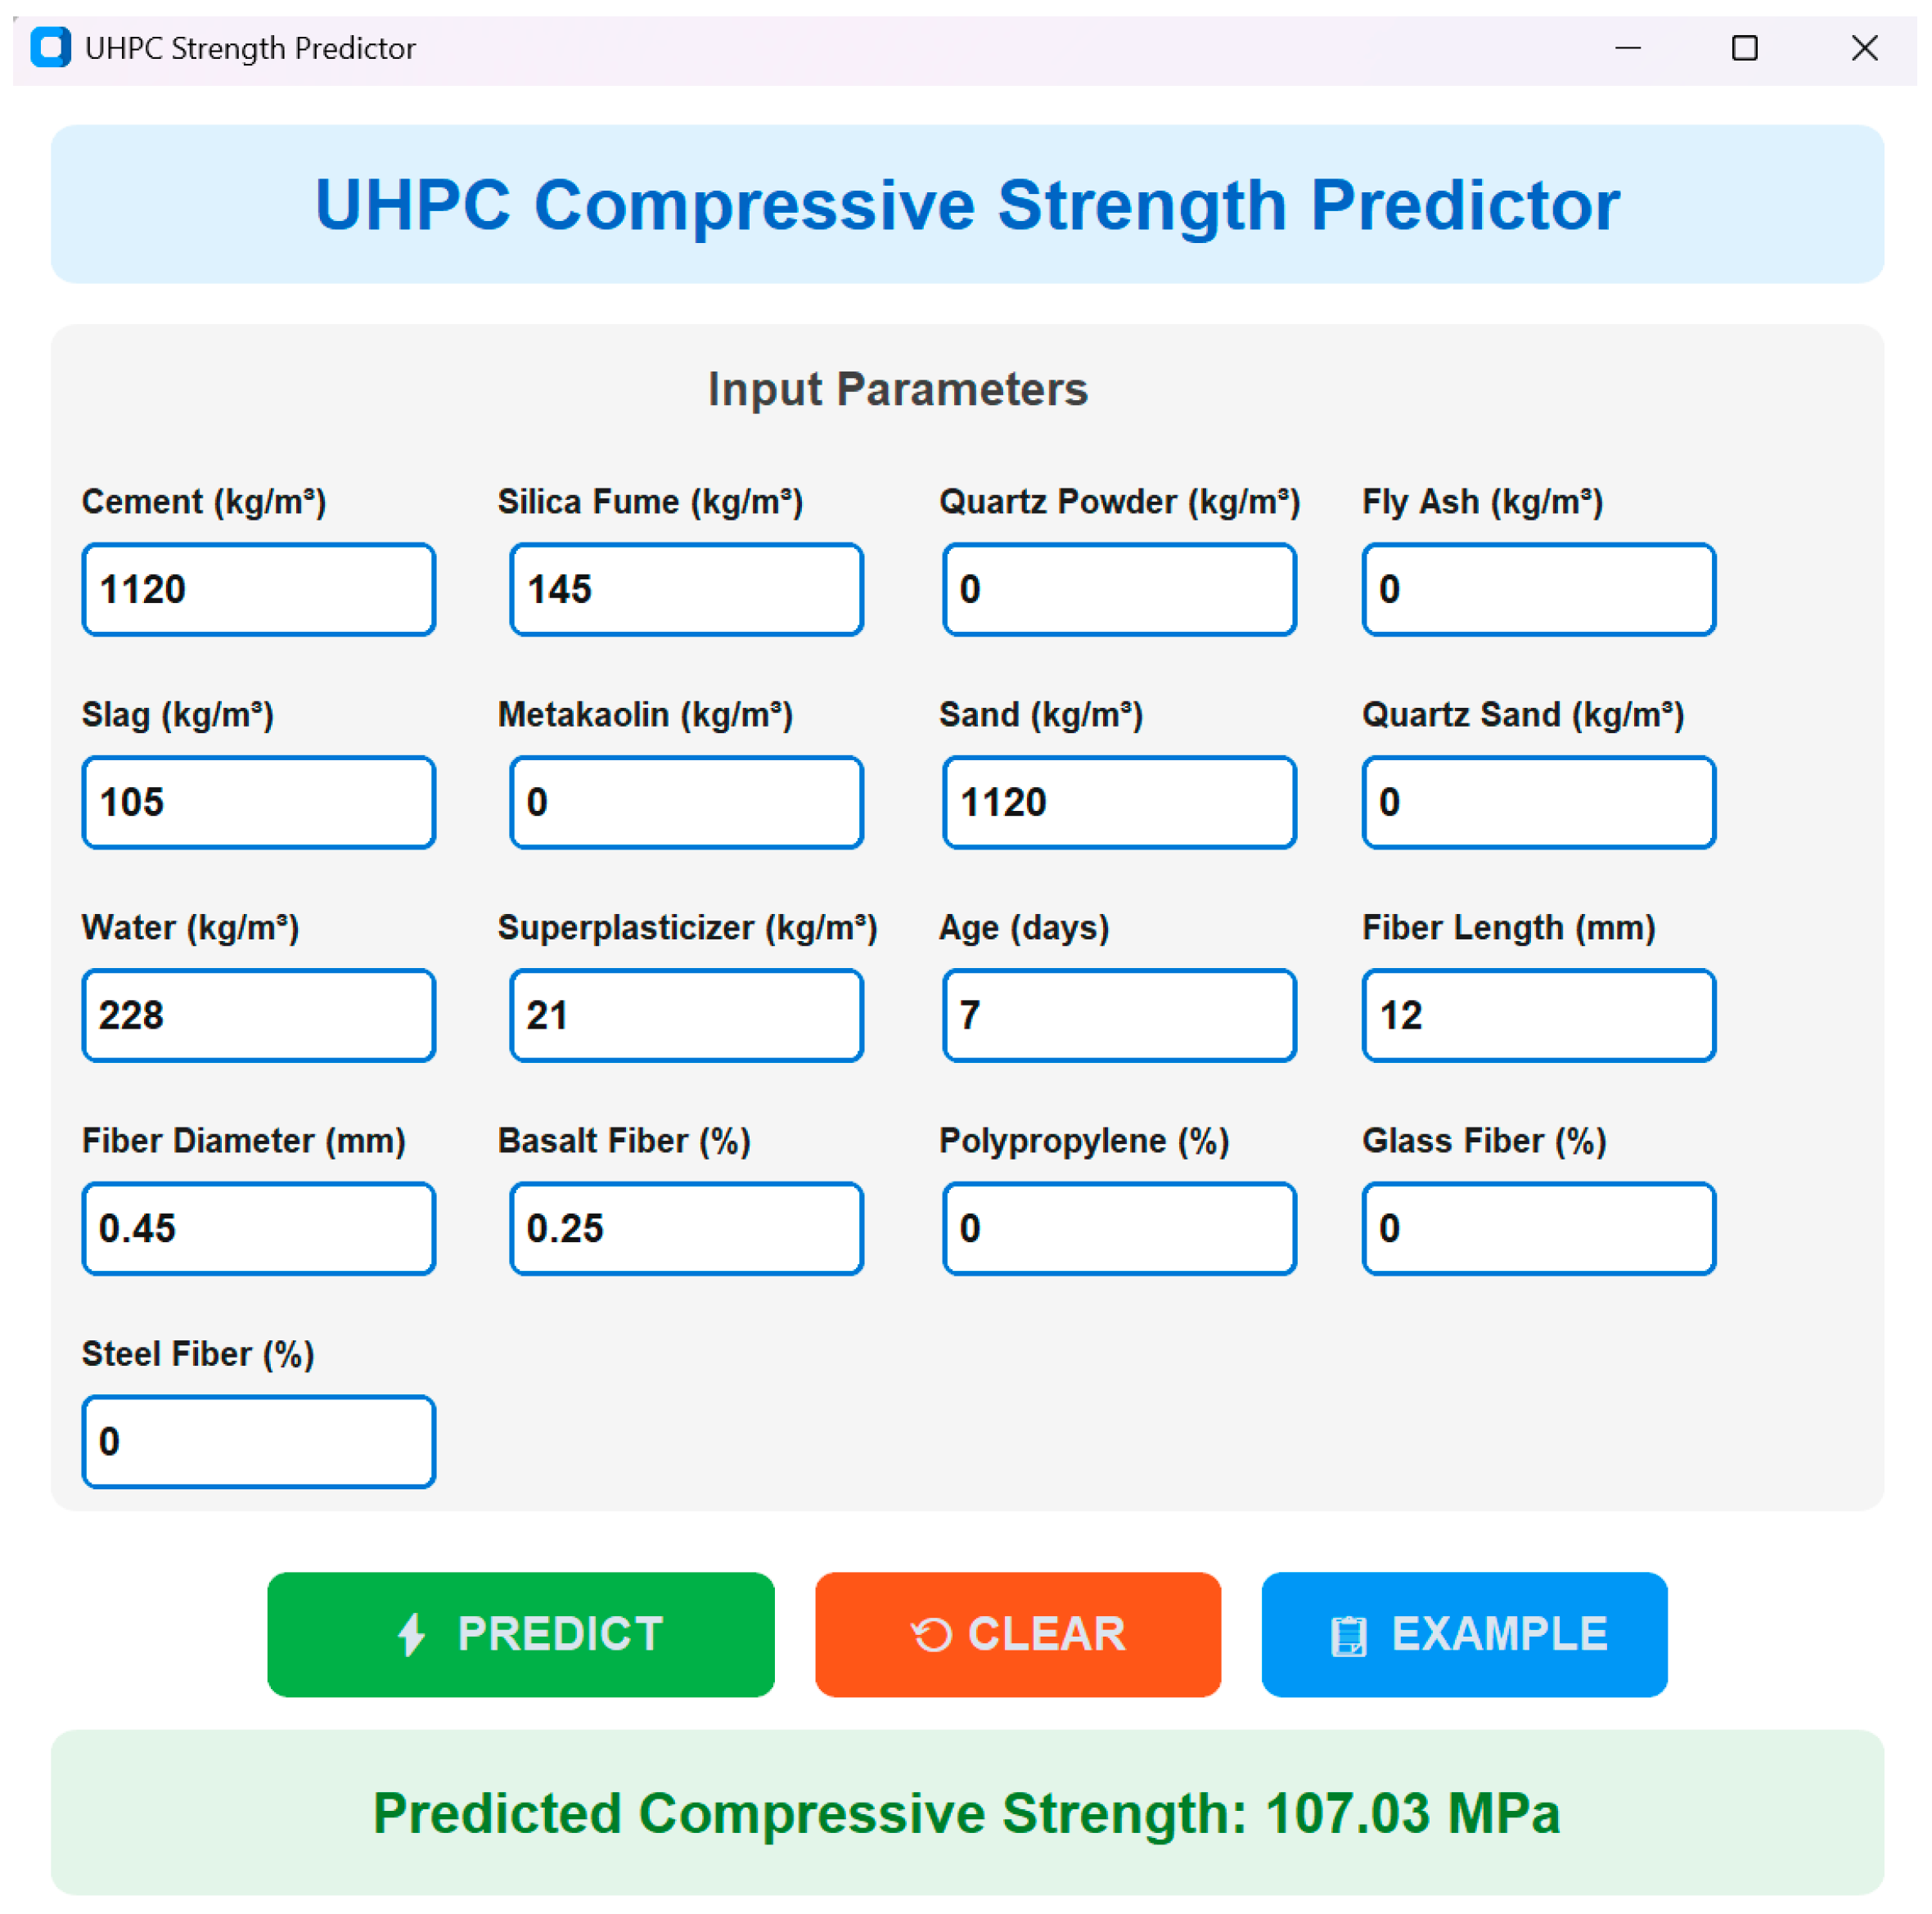
As shown in Figure 17, a user-friendly graphical user interface was developed to facilitate practical application of the trained CatBoost prediction model. The GUI enables real-time strength prediction by inputting 17 mixture design parameters, including cementitious materials (cement, silica fume, quartz powder, fly ash, slag, metakaolin), aggregates (sand, quartz sand), water content, superplasticizer dosage, curing age, and fiber reinforcement specifications (fiber length, fiber diameter, basalt fiber, polypropylene, glass fiber, steel fiber). As demonstrated in Figure 16, a representative UHPC mixture with C = 1120 kg/m3, SF = 145 kg/m3, SL = 105 kg/m3, S = 1120 kg/m3, W = 228 kg/m3, SP = 21 kg/m3, age = 7 days, L = 12 mm, D = 0.45 mm, and BV = 0.25% yielded a predicted CS of 107.03 MPa, demonstrating excellent agreement with the experimental value of 107.5 MPa (prediction error = 0.44%). The interface incorporates PREDICT, CLEAR, and EXAMPLE functions for enhanced usability. The standalone GUI application can be downloaded and used directly from https://github.com/hollisterwong/UHPC-ML (accessed on 12 March 2026), enabling practitioners to perform UHPC strength predictions without programming expertise.
Figure 17.
Graphical user interface (GUI) for UHPC CS prediction.
6. Conclusions
Ultra-high-performance concrete (UHPC) represents a transformative advancement in construction materials, offering compressive strengths exceeding 150 MPa through optimized particle packing and fiber reinforcement. However, the complexity of UHPC mixture design—involving numerous constituents and their nonlinear interactions—necessitates computationally efficient predictive tools to reduce extensive experimental iterations. This study develops a comprehensive machine learning framework for predicting the CS of fiber-reinforced UHPC through systematic evaluation of 20 algorithms across 863 experimental observations. The following conclusions are drawn:
(1) CatBoost demonstrates the highest mean performance among all evaluated algorithms, achieving R2 = 0.8979 ± 0.0239 and RMSE = 10.58 ± 1.45 MPa across 30 repeated experiments. Statistical validation confirms no significant difference from LightGBM (p = 0.156) and StackingRegressor (p = 0.350), while CatBoost significantly outperforms conventional methods, including SVM, linear models, and neural networks.
(2) Domain-informed feature engineering substantially enhances model performance. The incorporation of physically meaningful variables—water-cement ratio, total binder content, and fiber aspect ratio—combined with Boruta feature selection, improves prediction accuracy while maintaining interpretability aligned with established cement hydration and fiber–matrix interaction mechanisms.
(3) Curing age emerges as the dominant predictor (SHAP importance = 15.41 MPa), consistent with the time-dependent strength development governed by C-S-H gel formation. Secondary contributors include sand content, superplasticizer dosage, and steel fiber volume, reflecting the critical roles of aggregate packing density, workability optimization, and crack-bridging reinforcement in UHPC mechanical behavior.
(4) External validation on 810 independent samples under significant cross-dataset conditions (nine unavailable features, substantial distribution shift) yields 63.3% of predictions within the ±20% error threshold. The remaining 36.7% exceeding this threshold reflects the inherent challenges of cross-dataset transfer rather than in-domain model capability, and practitioners are advised to apply this model for preliminary mixture screening only, not for structural design verification.
(5) Comprehensive uncertainty quantification yields a prediction uncertainty of 3.48%, substantially below the 6.2% threshold reported in previous studies, indicating reliable strength estimation suitable for preliminary mix design optimization and quality control applications.
The proposed framework offers practitioners a computationally efficient tool for UHPC mixture screening, potentially reducing experimental iterations during mix design development. Future work should incorporate curing regime parameters, extend the fiber content range beyond 3%, and validate predictions through targeted laboratory experiments. The integration of multi-objective optimization considering strength, cost, and carbon footprint represents a promising direction for sustainable UHPC design.
Author Contributions
J.H.: writing—original draft, methodology, software. G.H.: funding acquisition, supervision, project administration, resources. Z.L.: visualization, software, data curation. M.H.: visualization, writing—original draft, formal analysis. All authors have read and agreed to the published version of the manuscript.
Funding
This research was funded by the Natural Science Foundation of Guangxi Zhuang Autonomous Region (2025JJH170118), the Youth Research Project of Wuzhou University (2025QN028), the Research Project of Wuzhou University (2023B003), and the Guangxi Regional Innovation Capacity Enhancement Plan Project (2026XT1502035).
Data Availability Statement
The source codes, trained models, and datasets used in this study are publicly available at https://github.com/hollisterwong/UHPC-ML (accessed on 12 March 2026). The repository includes the complete machine learning pipeline, feature engineering scripts, visualization codes, and a graphical user interface (GUI) for practical applications. Researchers can access and reproduce the results presented in this paper.
Conflicts of Interest
The authors declare no conflicts of interest.
References
- Abdellatief, M.; Murali, G.; Dixit, S. Leveraging machine learning to evaluate the effect of raw materials on the compressive strength of ultra-high-performance concrete. Results Eng. 2025, 25, 104542. [Google Scholar] [CrossRef] [Scilit]
- Abioye, S.O.; Babatunde, Y.O.; Abikoye, O.A.; Shaibu, A.N.; Bankole, B.J. Optimized machine learning algorithms with SHAP analysis for predicting compressive strength in high-performance concrete. AI Civ. Eng. 2025, 4, 16. [Google Scholar] [CrossRef] [Scilit]
- Abuodeh, O.R.; Abdalla, J.A.; Hawileh, R.A. Assessment of compressive strength of Ultra-high Performance Concrete using deep machine learning techniques. Appl. Soft Comput. 2020, 95, 106552. [Google Scholar] [CrossRef] [Scilit]
- Afroughsabet, V.; Biolzi, L.; Ozbakkaloglu, T. High-performance fiber-reinforced concrete: A review. J. Mater. Sci. 2016, 51, 6517–6551. [Google Scholar] [CrossRef] [Scilit]
- Alsalman, A.; Assi, L.; Carter, K.; Mousa, M.A.; Dang, C.N.; Hale, W.M.; Al-Yousuf, A. Comparative Sustainability Assessment of Proprietary and Non-Proprietary Ultra-High Performance Concrete Mixtures. Infrastructures 2025, 10, 245. [Google Scholar] [CrossRef] [Scilit]
- Asteris, P.G.; Mokos, V.G. Concrete compressive strength using artificial neural networks. Neural Comput. Appl. 2020, 32, 11807–11826. [Google Scholar] [CrossRef] [Scilit]
- Bolbolvand, M.; Tavakkoli, S.M.; Alaee, F.J. Prediction of compressive and flexural strengths of ultra-high-performance concrete (UHPC) using machine learning for various fiber types. Constr. Build. Mater. 2025, 493, 143135. [Google Scholar] [CrossRef] [Scilit]
- Chen, J.; Bao, Y. Effect of dataset representation bias on generalizability of machine learning models in predicting flexural properties of ultra-high-performance concrete (UHPC) beams. Eng. Struct. 2025, 326, 119508. [Google Scholar] [CrossRef] [Scilit]
- Zhou, M.; Hrynyk, T.D. Interface shear behaviour of ultra-high performance concrete under combined shear and lateral loads. Eng. Struct. 2026, 346, 121613. [Google Scholar] [CrossRef] [Scilit]
- Das, P.; Kashem, A. Hybrid machine learning approach to prediction of the compressive and flexural strengths of UHPC and parametric analysis with shapley additive explanations. Case Stud. Constr. Mater. 2024, 20, e02723. [Google Scholar] [CrossRef] [Scilit]
- Duan, J.; Asteris, P.G.; Nguyen, H.; Bui, X.-N.; Moayedi, H. A novel artificial intelligence technique to predict compressive strength of recycled aggregate concrete using ICA-XGBoost model. Eng. Comput. 2021, 37, 3329–3346. [Google Scholar] [CrossRef] [Scilit]
- Escalante-Tovar, J.D.; Abellán-García, J.; Fernández-Gómez, J. Predicting and Unraveling Flexural Behavior in Fiber-Reinforced UHPC Through Based Machine Learning Models. J. Compos. Sci. 2025, 9, 333. [Google Scholar] [CrossRef] [Scilit]
- Feng, D.-C.; Liu, Z.-T.; Wang, X.-D.; Chen, Y.; Chang, J.-Q.; Wei, D.-F.; Jiang, Z.-M. Machine learning-based compressive strength prediction for concrete: An adaptive boosting approach. Constr. Build. Mater. 2020, 230, 117000. [Google Scholar] [CrossRef] [Scilit]
- Guo, P.; Mahjoubi, S.; Liu, K.; Meng, W.; Bao, Y. Self-updatable AI-assisted design of low-carbon cost-effective ultra-high-performance concrete (UHPC). Case Stud. Constr. Mater. 2023, 19, e02625. [Google Scholar] [CrossRef] [Scilit]
- Habel, K.; Viviani, M.; Denarié, E.; Brühwiler, E. Development of the mechanical properties of an Ultra-High Performance Fiber Reinforced Concrete (UHPFRC). Cem. Concr. Res. 2006, 36, 1362–1370. [Google Scholar] [CrossRef] [Scilit]
- Hao, J.; Jiao, W.; Xie, X.; Man, D.; Huang, S. Intelligent prediction and understanding of self-shrinkage in ultra-high performance concrete based on machine learning. Case Stud. Constr. Mater. 2025, 22, e04255. [Google Scholar] [CrossRef] [Scilit]
- Hassan, A.M.T.; Jones, S.W.; Mahmud, G.H. Experimental test methods to determine the uniaxial tensile and compressive behaviour of ultra high performance fibre reinforced concrete (UHPFRC). Constr. Build. Mater. 2012, 37, 874–882. [Google Scholar] [CrossRef] [Scilit]
- Jamal, A.S.; Ahmed, A.N. Estimating compressive strength of high-performance concrete using different machine learning approaches. Alex. Eng. J. 2025, 114, 256–265. [Google Scholar] [CrossRef] [Scilit]
- Katlav, M.; Ergen, F. Improved forecasting of the compressive strength of ultra-high-performance concrete (UHPC) via the CatBoost model optimized with different algorithms. Struct. Concr. 2025, 26, 212–235. [Google Scholar] [CrossRef] [Scilit]
- Khan, A.Q.; Muhammad, S.G.; Raza, A.; Chaimahawan, P.; Pimanmas, A. Advanced machine learning techniques for predicting compressive strength of ultra-high performance concrete. Front. Struct. Civ. Eng. 2025, 19, 503–523. [Google Scholar] [CrossRef] [Scilit]
- Kumar, R.; Kumar, D.R.; Wipulanusat, W.; Thongchom, C.; Samui, P.; Rai, B. Estimation of the compressive strength of ultrahigh performance concrete using machine learning models. Intell. Syst. Appl. 2025, 25, 200471. [Google Scholar] [CrossRef] [Scilit]
- Yosri, A.M.; Sakthieswaran, N.; Ray, S.; Das, P.; Alshammari, T.O.; Abdelmongy, M.; Elkady, M. Prediction of mechanical strength and performance of alkali-activated binders concrete using optimized machine learning with partial dependence plot. Structures 2026, 84, 110896. [Google Scholar] [CrossRef] [Scilit]
- Thai, H.-T. Machine learning for structural engineering: A state-of-the-art review. Structures 2022, 38, 448–491. [Google Scholar] [CrossRef] [Scilit]
- Mahjoubi, S.; Meng, W.; Bao, Y. Auto-tune learning framework for prediction of flowability, mechanical properties, and porosity of ultra-high-performance concrete (UHPC). Appl. Soft Comput. 2022, 115, 108182. [Google Scholar] [CrossRef] [Scilit]
- Ngo, T.V.; Tran, V.B.; Le, B.H.; Dang, H.T.; Matos, J.; Tran, M.Q.; Dang, S.N. An Assessment of the Impact of Locally Recycled Cementitious Replacement Materials on the Strength of the Ultra-High-Performance Concrete. Appl. Sci. 2024, 14, 7484. [Google Scholar] [CrossRef] [Scilit]
- Richard, P.; Cheyrezy, M. Composition of reactive powder concretes. Cem. Concr. Res. 1995, 25, 1501–1511. [Google Scholar] [CrossRef] [Scilit]
- Rong, H.; Sun, W.; Ma, H.; Luo, M.; You, Z.; Zhang, G.; Zhu, P.; Liu, Z.; Gómez-Zamorano, L.Y. Machine Learning-Driven Strength Prediction and Sustainability Analysis of Ultra-High-Performance Concrete. Materials 2025, 18, 5116. [Google Scholar] [CrossRef] [Scilit]
- Sarmiento-Pupo, K.D.; Escalante-Tovar, J.D.; Altamiranda, J.E.; Abellan-Garcia, J.; Vélez, J.I. Predicting flexural strength in fiber-reinforced UHPC via random forest. Sci. Rep. 2025, 15, 42045. [Google Scholar] [CrossRef] [Scilit]
- Shi, C.; Wu, Z.; Xiao, J.; Wang, D.; Huang, Z.; Fang, Z. A review on ultra high performance concrete: Part I. Raw materials and mixture design. Constr. Build. Mater. 2015, 101, 741–751. [Google Scholar] [CrossRef] [Scilit]
- Shrestha, A.; Sapkota, S.C. Hybrid machine learning model to predict the mechanical properties of ultra-high-performance concrete (UHPC) with experimental validation. Asian J. Civ. Eng. 2024, 25, 5227–5244. [Google Scholar] [CrossRef] [Scilit]
- Sun, C.; Wang, K.; Liu, Q.; Wang, P.; Pan, F. Machine-Learning-Based Comprehensive Properties Prediction and Mixture Design Optimization of Ultra-High-Performance Concrete. Sustainability 2023, 15, 15338. [Google Scholar] [CrossRef] [Scilit]
- Wakjira, T.G.; Kutty, A.A.; Alam, M.S. A novel framework for developing environmentally sustainable and cost-effective ultra-high-performance concrete (UHPC) using advanced machine learning and multi-objective optimization techniques. Constr. Build. Mater. 2024, 416, 135114. [Google Scholar] [CrossRef] [Scilit]
- Wang, D.; Shi, C.; Wu, Z.; Xiao, J.; Huang, Z.; Fang, Z. A review on ultra high performance concrete: Part II. Hydration, microstructure and properties. Constr. Build. Mater. 2015, 96, 368–377. [Google Scholar] [CrossRef] [Scilit]
- Wang, S.; Wang, B.; Zhu, H.; Chen, G.; Li, Z.; Yang, L.; Zhang, Y.; Zhou, X. Ultra-high performance concrete: Mix design, raw materials and curing regimes-A review. Mater. Today Commun. 2023, 35, 105468. [Google Scholar] [CrossRef] [Scilit]
- Wang, Z.; Sun, T.; Sun, Y.; Liu, N. Evaluating the strength properties of high-performance concrete in the form of ensemble and hybrid models using deep learning techniques. Sci. Rep. 2025, 15, 25453. [Google Scholar] [CrossRef] [Scilit]
- Wijesundara, S.; Wijesundara, K.; Bandara, S. Machine learning approach for predicting the compressive strength of ultra-high performance fiber reinforced concrete (UHPFRC). Structures 2025, 75, 108704. [Google Scholar] [CrossRef] [Scilit]
- Xu, L.; Yu, X.; Zhu, C.; Wang, L.; Yang, J. Prediction of Ultra-High-Performance Concrete (UHPC) Compressive Strength Based on Convolutional Neural Networks. Materials 2025, 18, 2851. [Google Scholar] [CrossRef] [Scilit]
- Yan, L.; Liu, P.; Yao, Y.; Yang, F.; Feng, X. Physics-Informed Multi-Task Neural Network (PINN) Learning for Ultra-High-Performance Concrete (UHPC) Strength Prediction. Buildings 2025, 15, 4243. [Google Scholar] [CrossRef] [Scilit]
- Kashem, A. Ultra-High-Performance Concrete (UHPC); Shahjalal University of Science and Technology: Sylhet, Bangladesh, 2023. [Google Scholar] [CrossRef]
- Young, B.A.; Hall, A.; Pilon, L.; Gupta, P.; Sant, G. Can the compressive strength of concrete be estimated from knowledge of the mixture proportions?: New insights from statistical analysis and machine learning methods. Cem. Concr. Res. 2019, 115, 379–388. [Google Scholar] [CrossRef] [Scilit]
- Zhang, Y.-X.; Zhang, Q.; Xu, L.-Y.; Hou, W.; Miao, Y.-S.; Liu, Y.; Huang, B.-T. Transfer learning for intelligent design of lightweight Strain-Hardening Ultra-High-Performance Concrete (SH-UHPC). Autom. Constr. 2025, 175, 106241. [Google Scholar] [CrossRef] [Scilit]
- Zhao, X.; Nematollahi, B.; Chougan, M.; Xiao, J. Approaches to reduce cost and environmental impacts of UHPC production: A review. Case Stud. Constr. Mater. 2025, 22, e04644. [Google Scholar] [CrossRef] [Scilit]
- Zhen, L.; Qu, C.; Tang, M.-L.; Yin, J. High-Performance Concrete Strength Regression Based on Machine Learning with Feature Contribution Visualization. Mathematics 2025, 13, 3965. [Google Scholar] [CrossRef] [Scilit]
- Yoo, D.-Y.; Banthia, N. Mechanical properties of ultra-high-performance fiber-reinforced concrete: A review. Cem. Concr. Compos. 2016, 73, 267–280. [Google Scholar] [CrossRef] [Scilit]
- Kashem, A.; Karim, R.; Malo, S.C.; Das, P.; Datta, S.D.; Alharthai, M. Hybrid data-driven approaches to predicting the compressive strength of ultra-high-performance concrete using SHAP and PDP analyses. Case Stud. Constr. Mater. 2024, 20, e02991. [Google Scholar] [CrossRef] [Scilit]
- Gazi, M.U.; Hasan, T.; Debnath, P. Few-shot meta-learning for concrete strength prediction: A model-agnostic approach with SHAP analysis. AI Civ. Eng. 2025, 4, 20. [Google Scholar] [CrossRef] [Scilit]
- Kazemi, F.; Shafighfard, T.; Jankowski, R.; Yoo, D.-Y. Active learning on stacked machine learning techniques for predicting compressive strength of alkali-activated ultra-high-performance concrete. Arch. Civ. Mech. Eng. 2024, 25, 24. [Google Scholar] [CrossRef] [Scilit]
- Taffese, W.Z.; Zhu, Y. Explainable machine learning for predicting flexural capacity of reinforced UHPC beams. Eng. Struct. 2025, 343, 121188. [Google Scholar] [CrossRef] [Scilit]
- Ibrahim Bibi Farouk, A.; Zhu, J.; Ding, J.; Haruna, S.I. Prediction and uncertainty quantification of ultimate bond strength between UHPC and reinforcing steel bar using a hybrid machine learning approach. Constr. Build. Mater. 2022, 345, 128360. [Google Scholar] [CrossRef] [Scilit]
- Khan, M.I.; Abbas, Y.M.; Fares, G.; Alqahtani, F.K. Strength prediction and optimization for ultrahigh-performance concrete with low-carbon cementitious materials—XG boost model and experimental validation. Constr. Build. Mater. 2023, 387, 131606. [Google Scholar] [CrossRef] [Scilit]
- Bu, Y.; Cai, Z.; Peng, J.; Yu, Y.; Xu, J. Data-driven compressive strength estimation and mix optimization for ultra-high-performance concrete. J. Build. Eng. 2025, 114, 114253. [Google Scholar] [CrossRef] [Scilit]
- Herget, C.; Proske, T.; Rezvani, M.; Graubner, C.-A. Limestone Powder for the Cement Reduction—Approach for the Creditability Using k-Value Concept and Decrease of CO2 Emissions. J. Sustain. Cem.-Based Mater. 2025, 14, 2310–2321. [Google Scholar] [CrossRef] [Scilit]
- Fu, H.; Zhou, X.; Xu, P.; Sun, D. Prediction of Compressive Strength of Concrete Using Explainable Machine Learning Models. Materials 2025, 18, 5009. [Google Scholar] [CrossRef] [Scilit] [PubMed]

Disclaimer/Publisher’s Note: The statements, opinions and data contained in all publications are solely those of the individual author(s) and contributor(s) and not of MDPI and/or the editor(s). MDPI and/or the editor(s) disclaim responsibility for any injury to people or property resulting from any ideas, methods, instructions or products referred to in the content. |
© 2026 by the authors. Licensee MDPI, Basel, Switzerland. This article is an open access article distributed under the terms and conditions of the Creative Commons Attribution (CC BY) license.