


Abstract
Multi-threshold image segmentation is an important research topic in the fields of computer vision and image processing. Its core objective is to efficiently determine the optimal threshold combination within a high-dimensional and complex search space. However, as the number of thresholds and image complexity increase, the computational cost of traditional exhaustive search methods grows exponentially. Meanwhile, conventional swarm intelligence algorithms often suffer from unstable convergence, premature stagnation, and parameter sensitivity when dealing with high-dimensional composite functions. To address these issues, this paper proposes an enhanced optimization algorithm termed the Parrot Optimizer with Artistic Design Strategy (PO-ADS). The proposed method constructs a multi-strategy cooperative optimization framework that integrates an Evolution Feedback–Based Adaptive Control Strategy (EFACS), a Multi-Operator Cooperative Evolution Strategy (MOCES), and an Artistic Design Strategy (ADS). These strategies enable dynamic parameter adjustment, adaptive balance between global exploration and local exploitation, and structured perturbation enhancement mechanisms. Experimental results on the CEC2020 and CEC2022 benchmark suites demonstrate that PO-ADS significantly outperforms seven state-of-the-art optimization algorithms across different dimensional settings in terms of optimization accuracy, convergence speed, and stability. The Friedman test results show that, on the CEC2020 benchmark suite, PO-ADS achieves average ranks of 1.72 (30-dimensional) and 1.85 (50-dimensional), both statistically superior to the comparative algorithms. Furthermore, PO-ADS is applied to multi-threshold image segmentation based on the Otsu criterion. The results indicate that the proposed method achieves optimal or near-optimal performance in terms of SSIM, PSNR, FSIM, and objective function values. Overall, the experimental findings confirm that PO-ADS not only possesses strong numerical optimization capability but also demonstrates robust and practical applicability in real-world image segmentation tasks.
1. Introduction
With the rapid development of energy systems, intelligent manufacturing, image processing, and complex engineering structures, real-world optimization problems have continuously increased in scale, dimensionality, and complexity [1,2]. These problems are typically characterized by strong nonlinearity, multimodal landscapes, and complex constraints, which make it difficult for traditional gradient-based or analytical optimization methods to simultaneously achieve high solution accuracy and computational efficiency. Particularly in high-dimensional and multimodal environments, conventional approaches often rely on strict mathematical assumptions, and are prone to being trapped in local optima or experiencing significant performance degradation in convergence speed [3,4,5,6]. Consequently, intelligent optimization algorithms with strong global search capability and adaptive mechanisms have become essential tools for solving complex engineering optimization problems.
Swarm intelligence algorithms, as an important branch of intelligent optimization, simulate collective behaviors observed in natural systems to explore complex search spaces effectively [7]. Representative algorithms include Particle Swarm Optimization (PSO) [8], Harris Hawks Optimization (HHO) [9], Sparrow Search Algorithm (SSA) [10], Ant Colony Optimization (ACO) [11], Whale Optimization Algorithm (WOA) [12], and Grey Wolf Optimizer (GWO) [13], as well as many newly proposed variants in recent years. Owing to their relatively simple structures, limited control parameters, and low requirements on function continuity and differentiability, these algorithms have been widely applied in numerical optimization, system scheduling, engineering design, and energy management [14,15,16].
However, as problem dimensionality and landscape complexity increase, traditional swarm intelligence algorithms gradually expose several inherent limitations, including imbalance between exploration and exploitation, oscillatory behavior in later search stages, unstable solution quality, and insufficient robustness [17,18,19]. To address these deficiencies, numerous improved and hybrid algorithms have been developed in recent years by incorporating behavioral modeling, elite-guided learning mechanisms, hybrid operator strategies, and adaptive control schemes, aiming to establish a more stable dynamic balance between global exploration and local exploitation [20,21].
Over the past two to three years, significant research efforts have focused on enhancing the exploration–exploitation trade-off. For instance, the Newton Downhill Optimizer [22] strengthens local exploitation through linearized iterative updates. The Philosophical Proposition Optimizer [23] introduces cognition-inspired knowledge acquisition mechanisms. The Griffon Vultures Optimization Algorithm (GVOA) [24] models intelligent group foraging behavior of griffon vultures, while the Supercell Thunderstorm Algorithm (STA) [25] simulates supercell thunderstorm dynamics. The Farthest Better or Nearest Worse Optimizer [26] constructs search strategies based on distance–fitness relationships, the Hippopotamus Optimization Algorithm (HOA) [27], draws inspiration from inherent behaviors of hippopotamuses, and the Cuckoo Catfish Optimizer (CCO) [28] mimics the searching, predation, and parasitic behaviors of cichlid fish. Although these methods demonstrate advantages in specific scenarios, extensive experimental studies indicate that most newly proposed algorithms remain problem-dependent and may still suffer from unstable convergence, premature stagnation, or oscillatory search directions in high-dimensional, multimodal, or strongly coupled environments.
According to the No Free Lunch (NFL) theorem [29], no optimization algorithm can achieve superior performance across all possible problem domains. Therefore, designing problem-oriented enhancement mechanisms has become a critical research direction in swarm intelligence [30]. Recent studies have investigated elite utilization strategies, adaptive parameter control, and cooperative co-evolution mechanisms, achieving certain improvements. Nevertheless, in high-dimensional and composite function environments, many algorithms still exhibit insufficient exploitation capability in later search stages and reduced convergence stability [31,32,33].
In addition to numerical optimization benchmarks, intelligent optimization and learning-based models have shown substantial practical value in medical image analysis. Recent studies have reported effective frameworks for cervical cancer segmentation and classification, MR brain tumor detection using optimized CNN–SVM architectures, and brain tissue segmentation for medical decision-support systems [34,35,36]. These application-oriented studies indicate that robust optimization and segmentation strategies are highly relevant not only to synthetic benchmark landscapes but also to real-world medical imaging tasks, where image heterogeneity, noise, and structural ambiguity often increase the difficulty of accurate region extraction. Therefore, improving the stability, adaptability, and segmentation precision of optimization-based thresholding methods remains meaningful for broader practical scenarios, including medical image processing.
The Parrot Optimizer (PO) [37], proposed in recent years, is a population-based metaheuristic inspired by parrot behaviors such as foraging, communication, and avoidance. By constructing multiple behavioral update mechanisms, PO demonstrates promising global search capability in continuous optimization problems. However, due to the high randomness in behavior selection, the absence of adaptive parameter adjustment, and the lack of elite reinforcement and structured perturbation mechanisms, the original PO may exhibit limited convergence accuracy and unstable performance when handling complex optimization landscapes.
To overcome these limitations, this paper proposes a multi-strategy cooperative enhancement framework termed PO-ADS (Parrot Optimizer with Artistic Design Strategy), without altering the original behavioral structure of PO. Specifically, an Evolution Feedback–Based Adaptive Control Strategy (EFACS) is introduced to enable dynamic learning of control parameters. A Multi-Operator Cooperative Evolution Strategy (MOCES) is incorporated to enhance population diversity and search intensity. In addition, an Artistic Design Strategy (ADS) is developed to strengthen fine-grained exploitation capability in the later search stages. The synergistic interaction among these three strategies establishes a stable and adaptive balance between global exploration and local exploitation.
The main contributions of this study can be summarized as follows:
- (1)
- A PO-oriented multi-strategy cooperative enhancement framework is proposed, in which EFACS, MOCES, and ADS are integrated in a behavior-compatible manner rather than simply superimposed. The uniqueness of this framework lies in the tight coupling among adaptive parameter learning, heterogeneous operator cooperation, and structured late-stage refinement, enabling PO-ADS to achieve a more stable exploration–exploitation balance than existing single-strategy or loosely hybridized approaches.
- (2)
- Comprehensive experimental validation is conducted on the CEC2020 and CEC2022 benchmark suites, and statistical tests are employed to rigorously evaluate performance significance.
- (3)
- A mathematical model for multi-threshold image segmentation is established, and PO-ADS is applied to the segmentation task. Experimental results on multiple benchmark grayscale images verify its practical effectiveness, providing an efficient solution paradigm for complex engineering optimization problems.
The remainder of this paper is organized as follows. Section 2 introduces the original Parrot Optimizer and the proposed PO-ADS framework. Section 3 presents benchmark experimental design and performance analysis. Section 4 formulates the mathematical model for multi-threshold image segmentation and evaluates the proposed algorithm in this practical task. Finally, Section 5 concludes the paper and discusses future research directions.
2. Parrot Optimizer and the Proposed PO-ADS
2.1. Parrot Optimizer
The Parrot Optimizer (PO) [37] is a population-based metaheuristic inspired by the social behaviors of parrots, including cooperative foraging, social communication, and adaptive avoidance. These behaviors are abstracted into multiple position update mechanisms, enabling PO to balance global exploration and local exploitation.
Let denote the population size and the problem dimension. The position of the -th parrot at iteration is denoted as:
where each dimension is constrained by the lower and upper bounds and , respectively.
2.1.1. Population Initialization
At the initial iteration (), all individuals are randomly initialized within the feasible search space [37]:
where generates a vector of independent uniformly distributed random numbers, and denotes element-wise multiplication.
After initialization, the fitness values of all individuals are evaluated, and the best solution is recorded as .
2.1.2. Behavioral Update Mechanisms
During each iteration , each parrot randomly selects one of four behavioral strategies to update its position [37].
- (1)
- Foraging Behavior
The foraging behavior models exploratory movements guided by the global best solution and the population tendency [37]:
where denotes a Lévy flight vector, and is a random scalar.
- (2)
- Perching (Staying) Behavior
This behavior represents local exploitation around promising regions [37]:
where is a random variable drawn from a standard normal distribution, and is a -dimensional vector of ones.
- (3)
- Communication Behavior
The communication behavior reflects information exchange among individuals [37]:
where is a control coefficient, , and .
- (4)
- Neophobia (Fear of Strangers) Behavior
This behavior describes adaptive avoidance of unfamiliar regions [37]:
where and .
After updating positions, the fitness values are then re-evaluated, and the global best solution is updated if a better solution is found.
2.2. Improved Parrot Optimizer with Artistic Design Strategy
To address the limitations of the original Parrot Optimizer (PO) in terms of convergence stability, parameter sensitivity, and premature stagnation when solving complex high-dimensional problems (e.g., CEC2017 benchmarks), this paper proposes an enhanced variant named PO-ADS (Parrot Optimizer with Artistic Design Strategy).
The core idea of PO-ADS is to construct a multi-strategy cooperative optimization framework, in which multiple complementary search mechanisms cooperate and compete under unified adaptive coordination. From a technical-boundary perspective, PO-ADS should be regarded as a PO-oriented reconstruction rather than a variant of SHADE or a differential-evolution derivative. The essential difference is that PO-ADS preserves the original behavioral semantics of PO and enhances them through three cooperative mechanisms: EFACS for adaptive control, MOCES for heterogeneous behavioral cooperation, and ADS for structured local refinement. In other words, the proposed method does not replace PO with DE-style evolution; instead, it improves the internal regulation capability of PO while maintaining its original population behavior model. This reconstruction allows the algorithm to retain the exploration characteristics of PO and simultaneously overcome its shortcomings in parameter rigidity, weak late-stage exploitation, and unstable convergence. Specifically, PO-ADS integrates three essential components:
- (1)
- Evolution Feedback–Based Adaptive Control Strategy (EFACS),
- (2)
- Multi-Operator Cooperative Evolution Strategy (MOCES), and
- (3)
- Artistic Design Strategy (ADS).
These strategies are designed to jointly enhance global exploration, local exploitation, and search adaptability throughout the optimization process.
2.2.1. Evolution Feedback–Based Adaptive Control Strategy (EFACS)
In complex optimization problems, fixed or purely random control parameters often fail to adapt to different landscape characteristics and search stages, leading to unstable convergence or inefficient exploration. To overcome this issue, PO-ADS introduces an Evolution Feedback–Based Adaptive Control Strategy (EFACS), which dynamically adjusts control parameters according to historical evolutionary success.
- (1)
- Parameter Sampling Mechanism
For each individual iii at iteration , two control parameters are generated: a scaling factor and a crossover probability . Two memory vectors with capacity are maintained:
An index is randomly selected, and the parameters are sampled as
The heavy-tailed Cauchy distribution enables occasional large steps, while the Gaussian perturbation provides stable crossover control.
- (2)
- Success-Driven Memory Update
A successful update is defined as
where is the trial solution generated for individual .
For each successful update, the fitness improvement is
Normalized weights are calculated as
where is the set of successful individuals.
The memory is updated using weighted statistics:
This feedback-driven adaptation allows PO-ADS to automatically learn effective parameter distributions, significantly improving robustness and convergence stability.
2.2.2. Multi-Operator Cooperative Evolution Strategy (MOCES)
The original PO mainly relies on stochastic behaviors or single learning sources, which may cause inefficient exploitation or premature convergence. To enhance adaptability across diverse landscapes, PO-ADS introduces a Multi-Operator Cooperative Evolution Strategy (MOCES), in which multiple heterogeneous search operators are embedded into the parrot behavioral framework.
- (1)
- Elite Subset and -best Selection
At iteration , the population is sorted by fitness, and an elite individual is randomly selected from the top individuals:
- (2)
- Operator Pool under Four Parrot Behaviors
For each individual, one behavior is randomly selected, and a mutation vector is generated. An external archive stores replaced individuals to enhance diversity.
Foraging Behavior (Convergence–Diversity Balanced Operator):
Perching (Staying) Behavior (Strong Exploitation Operator):
Communication Behavior (Strong Exploration Operator):
Neophobia (Fear of Strangers) Behavior (Balanced Cooperative Operator):
where .
- (3)
- Crossover and Greedy Selection
Binomial crossover is applied:
Greedy selection ensures monotonic improvement:
2.2.3. Artistic Design Strategy (ADS)
Although EFACS and MOCES significantly enhance search efficiency, complex hybrid and composition functions may still cause stagnation in later stages. Inspired by the progressive process of artistic creation, PO-ADS introduces the Artistic Design Strategy (ADS), which provides structured perturbations guided by aesthetic principles.
The term “Artistic Design Strategy” is used to describe a structured refinement philosophy inspired by artistic composition rather than pure random perturbation. In artistic creation, a designer usually starts from a visual anchor, adjusts the overall composition according to a harmonious proportion, and then performs local brushstroke-like refinements to improve details. ADS follows a similar idea in the optimization process. The artistic anchor plays the role of a composition center, the golden-ratio-guided direction provides a proportionally balanced search tendency, and the brushstroke perturbation corresponds to fine local adjustments around promising regions. Therefore, the “artistic design” terminology is not merely metaphorical; it reflects the organized, directional, and harmony-oriented refinement mechanism embedded in the search process.
- (1)
- Artistic Anchor
A dynamic anchor is defined as
where is the population mean.
- (2)
- Golden-Ratio Direction
Using the golden ratio , a quasi-spiral direction is constructed:
which is normalized as
- (3)
- Brushstroke Perturbation and Composition Scaling
ADS is applied with probability
The brushstroke perturbation is defined as
A composition scaling factor is introduced:
The final ADS-enhanced solution is
By integrating EFACS, MOCES, and ADS, PO-ADS achieves a synergistic balance between adaptive parameter control, cooperative multi-operator search, and structured artistic perturbation, resulting in improved convergence stability and robustness on complex high-dimensional benchmark problems.
In summary, the pseudocode of the proposed PO-ADS algorithm is presented in Algorithm 1, and its overall framework is illustrated in Figure 1.
| Algorithm 1: The pseudo-code of the PO-ADS |
| Input: Population size N; maximum number of iterations T; problem dimension D; lower and upper bounds lb,ub. and its fitness . 1:. 2:. 3:. 4: do 5: and determine elite subset size 6: 7: do 8: from using EFACS according to Equations (7)–(11). 9: from the top individuals according to Equation (13). 10:. 11: do 12: according to Foraging Behavior (Equation (14)). 13: do 14: according to Perching (Staying) Behavior (Equation (15)). 15: do 16: according to Communication Behavior (Equation (16)). 17: do 18: according to Neophobia (Fear of Strangers) Behavior (Equation (17)). 19: end if 20:according to Equation (18). 21: with probability according to Equations (20)–(26). 22: Greedy selection: 23: then 24: to archive according to Equation (19). 25: and fitness improvement 26: if necessary. 27: else 28:. 29: end if 30: end for 31: 32: according to Equation (12). 33: end while 34: and . |
Figure 1.
Overall framework of the proposed PO-ADS algorithm.
It should be emphasized that the proposed PO-ADS is not a direct transplantation of adaptive differential evolution mechanisms such as SHADE into the PO framework. Although EFACS borrows the idea of success-history-based parameter adaptation, its role, triggering condition, and interaction pattern are fundamentally different from those in canonical differential evolution. In SHADE-like algorithms, adaptive parameters are designed for mutation and crossover operators defined on the DE search paradigm. By contrast, in PO-ADS, EFACS is embedded into the behavior-driven updating structure of the Parrot Optimizer, where the sampled parameters regulate heterogeneous parrot behavioral operators rather than standard DE mutation alone. Therefore, the adaptive memory mechanism in PO-ADS serves as a cross-behavior coordination tool instead of a single-operator controller.
Moreover, MOCES and ADS are not independent add-on operators stacked without structural consideration. MOCES establishes cooperation among heterogeneous search behaviors inside the original PO framework, enabling the algorithm to dynamically switch among exploration-oriented, exploitation-oriented, and balanced update patterns according to population evolution status. ADS is further introduced as a late-stage structured perturbation mechanism, which differs from conventional random perturbation or restart strategies because it employs an anchor-guided and directionally organized refinement process. Therefore, the novelty of PO-ADS lies not in inventing an entirely isolated adaptive component, but in constructing a behavior-compatible multi-strategy cooperative framework inside the PO architecture, where adaptive parameter learning, multi-operator collaboration, and structured perturbation reinforcement are tightly coupled.
The distinctiveness of the proposed framework lies in the fact that the three strategies are functionally differentiated yet evolutionarily coupled: EFACS regulates how the search is controlled, MOCES regulates how the population evolves, and ADS regulates how promising regions are refined.
2.2.4. Theoretical Interpretation of the Three Strategies
Although a complete convergence proof of PO-ADS is beyond the scope of this study, the roles of the three strategies can be interpreted from the perspective of search dynamics.
First, EFACS introduces a success-history-based adaptation mechanism that continuously updates the sampling center of control parameters according to historically effective search behaviors. This mechanism increases the probability of reusing beneficial parameter regions and reduces ineffective parameter fluctuations. Therefore, EFACS improves the stability of parameter evolution and enhances the consistency of population updating.
Second, MOCES improves the exploration–exploitation balance by embedding multiple heterogeneous operators into the PO behavioral framework. Since different operators exhibit different search radii and directional biases, their cooperative use enlarges the reachable search region in the early stage while preserving exploitation capability in later iterations. From this viewpoint, MOCES can be understood as a diversity-preserving and search-bias-adjusting mechanism.
Third, ADS introduces a structured perturbation around promising regions. Unlike purely random mutation, its anchor-guided and direction-normalized perturbation provides a controlled local search bias. This increases the probability of escaping weak stagnation states and improves fine-grained exploitation precision near high-quality solutions.
Therefore, from a search-mechanism perspective, EFACS contributes adaptive regulation, MOCES contributes operator-level diversity and balance, and ADS contributes structured refinement and stagnation alleviation. Their cooperation provides a reasonable theoretical explanation for the observed empirical superiority of PO-ADS, although a rigorous mathematical convergence proof remains a subject for future work.
2.3. Complexity Analysis of PO-ADS
The time complexity of the proposed PO-ADS algorithm is analyzed using Big-O notation by examining its dominant computational operations. Let denote the population size, represent the problem dimensionality, denote the computational cost of a single fitness evaluation, and denote the maximum number of iterations.
Similar to the original PO, PO-ADS performs population initialization with a computational cost of , followed by an initial fitness evaluation requiring . During each iteration, all individuals are updated and re-evaluated, leading to a per-iteration fitness evaluation cost of . The vector operations involved in position updating, including mutation, crossover, anchor-guided perturbation, and boundary handling, are linear with respect to the problem dimension, resulting in a computational cost of per iteration.
Compared with the original PO, PO-ADS introduces additional adaptive mechanisms, including evolution feedback-based parameter control (EFACS), multi-operator cooperative search (MOCES), and the artistic design strategy (ADS). These mechanisms mainly involve parameter sampling, simple statistical updates, archive maintenance, and vector-based perturbations. The associated computational cost is linear with respect to the population size or dimensionality, i.e., or , and does not change the overall order of complexity. Population sorting, when required for elite selection, incurs a cost of per iteration, which remains modest compared with the dominant term in practical optimization problems where fitness evaluation is typically the most expensive operation.
Therefore, the overall time complexity of PO-ADS over iterations can be expressed as . When the fitness evaluation dominates computational cost, the complexity simplifies to .
This analysis indicates that although PO-ADS incorporates multiple adaptive and cooperative strategies, it preserves the same asymptotic complexity as the original PO while introducing only a modest additional computational overhead. The added cost is justified by the significant improvements in convergence stability, exploration–exploitation balance, and adaptability achieved by the proposed algorithm.
3. Numerical Experiments of CEC2020 and CEC2022
3.1. Comparative Methods and Parameter Settings
In this section, the effectiveness of the proposed PO-ADS approach is examined using two highly demanding benchmark suites for numerical optimization, namely CEC2020 and CEC2022 [38]. The performance of PO-ADS is compared with a range of advanced optimization methods. The comparison algorithms include Adaptive Acceleration-based Collaborative Particle Swarm Optimization (AAPSO) [39], Improved multi-strategy adaptive Grey Wolf Optimization (IAGWO) [40], Kangaroo Escape Optimization (KEO) [41], Dhole Optimization Algorithm (DOA) [42], Whale Migration Algorithm (WMA) [43], the original Parrot Optimizer (PO) [37] and the Multi-Strategy Enhanced Parrot Optimizer (ECPO) [44]. For the control parameters of the compared algorithms, we strictly followed the recommended settings reported in their original references whenever available. For algorithms with flexible parameter ranges, the default or commonly adopted settings in the source literature were used to avoid unfair manual over-tuning toward any particular benchmark. Therefore, the comparative study was conducted under a unified and literature-consistent protocol. Detailed parameter settings and implementation specifications for all competing algorithms are summarized in Table 1.
Table 1.
Configuration for evaluated method parameters.
To ensure fairness, reproducibility, and consistency of the experimental comparisons, all algorithms were implemented and executed under the same hardware and software environment, using the same population size, dimensional setting, termination criterion, and number of independent runs. Unless otherwise stated in the original references, the population size was uniformly set to 30 and the maximum number of iterations was set to 500 for all compared methods. Each algorithm was independently executed 30 times on every test function, and the mean and standard deviation of the obtained results were recorded, and the optimal outcomes were emphasized in bold type. All experiments were performed on a Windows 11 system powered by an Intel Core i7-12700 processor running at 2.1 GHz, equipped with 16 GB of RAM. The simulation programs were developed and executed in MATLAB R2023b.
3.2. Ablation Study: Contribution of Individual Strategies
To evaluate the individual improvements and synergistic effects of the three strategies—EFACS, MOCES, and ADS—on the original Parrot Optimization (PO) algorithm, ablation experiments were conducted on the 20-dimensional CEC2020 benchmark suite. The results are illustrated in Figure 2.
Figure 2.
Convergence curves of fitness values for different PO variants.
The convergence curves clearly show that the original PO exhibits slow convergence in the middle and later stages, is prone to being trapped in local optima, and demonstrates relatively poor stability. Variants incorporating a single strategy (PO-S1, PO-S2, and PO-S3) all achieve performance improvements to varying degrees. Specifically, PO-S1 (with EFACS only) enhances search stability by adaptively adjusting parameters through evolutionary feedback; PO-S2 (with MOCES only) strengthens global exploration capability via multi-operator cooperative evolution, significantly accelerating convergence in the early stage; and PO-S3 (with ADS only) alleviates premature stagnation in the later stage through structured perturbations introduced by the artistic design strategy.
In contrast, the integrated variant PO-ADS, which combines all three strategies, demonstrates the best overall performance. It achieves rapid descent in the early iterations, stable convergence in the middle stage, and sustained fine-grained optimization in the later stage, without noticeable oscillations or premature convergence. Its final fitness values are significantly lower than those of other variants. These results indicate that EFACS, MOCES, and ADS are not merely additive but form a complementary synergistic mechanism through adaptive parameter control, multi-operator cooperative search, and refined local perturbation. This synergy comprehensively enhances the original PO in terms of exploration–exploitation balance, convergence stability, and optimization accuracy, thereby validating the necessity and effectiveness of the proposed multi-strategy collaborative framework.
3.3. Experimental Design and Result Analysis on the CEC2020 Benchmark
To systematically validate the performance of the PO-ADS algorithm across different dimensionalities and various types of optimization problems, experiments were conducted on the CEC2020 benchmark suite. Two problem scales, 10-dimensional and 20-dimensional, were selected, and PO-ADS was compared horizontally with seven mainstream metaheuristic algorithms, including AAPSO, IAGWO, and KEO. The average fitness value (Ave) and standard deviation (Std) were adopted as the primary quantitative metrics. Convergence curves and boxplots were further employed to comprehensively evaluate global optimization accuracy, convergence stability, and robustness. The detailed numerical results are presented in Table 2 and Table 3, and the visualization results are shown in Figure 3 and Figure 4. In the tables, bold values are used to indicate the best-performing result in that row or column.
Table 2.
Performance Comparison on the CEC2020 Benchmark in 10 Dimensions.
Table 3.
Performance Comparison on the CEC2020 Benchmark in 20 Dimensions.
Figure 3.
Convergence curves of the compared algorithms on the CEC2020 benchmark functions under 10-dimensional and 20-dimensional settings.
Figure 4.
Boxplot comparison of the compared algorithms on the CEC2020 benchmark functions over 30 independent runs.
In the 10-dimensional experiments, PO-ADS achieved the best performance on all ten benchmark functions (F1–F10). Its average fitness values were the lowest among all competing algorithms, and its standard deviations were generally smaller, demonstrating superior optimization accuracy and stability. For the high-dimensional unimodal function F1, PO-ADS attained an average fitness value of 1.5175E+02, significantly outperforming the second-best ECPO (2.8537E+03), corresponding to a reduction of 94.68%. Moreover, its standard deviation (1.1717E+02) was only 4.46% of that of ECPO (2.6271E+03), indicating stronger global search capability and higher solution consistency in unimodal optimization problems.
For multimodal functions F3, F4, and F6, PO-ADS also demonstrated outstanding performance. On F3, the average fitness value was 7.2064E+02, representing a 1.20% improvement over the second-best AAPSO (7.2937E+02), while the standard deviation (2.8949E+00) was only 37.82% of that of AAPSO (7.6537E+00). On F4, PO-ADS achieved an average fitness value of 1.9014E+03, being the only algorithm with a value below 1.9020E+03; its standard deviation (4.6295E−01) was merely 10.59% of that of PO (4.3736E+00). On F6, the average fitness value was 1.6006E+03, and the standard deviation (4.0183E−01) was substantially lower than those of IAGWO (7.5249E+00) and ECPO (1.2352E+01), reflecting its enhanced ability to escape local optima in complex multimodal landscapes.
For composite functions F5 and F7, the advantages of PO-ADS were even more pronounced. On F5, the average fitness value was 1.9000E+03, representing a 62.10% reduction compared with KEO (5.0119E+03), while the standard deviation (1.4225E+02) was only 4.23% of that of KEO (3.3662E+03). On F7, PO-ADS achieved an average fitness value of 2.1831E+03, which was 12.99% lower than KEO (2.5113E+03); its standard deviation (1.0049E+02) was merely 0.48% of that of AAPSO (2.1082E+04), verifying its efficiency in handling highly complex composite optimization problems.
When the problem dimension increased to 20, the optimization difficulty for all algorithms rose significantly, as reflected by generally higher average fitness values. Nevertheless, PO-ADS maintained a clear performance advantage, demonstrating excellent scalability in high-dimensional settings. For the unimodal function F1, PO-ADS achieved an average fitness value of 1.6914E+03, which was 49.16% lower than that of the second-best KEO (3.3272E+03). Its standard deviation (2.0533E+03) was only 0.0004% of that of PO (5.0582E+08), highlighting its remarkable convergence stability in high-dimensional unimodal problems.
For multimodal functions F3 and F4, PO-ADS remained competitive. On F3, the average fitness value was 7.4421E+02, slightly higher than that of AAPSO (7.4178E+02), yet its standard deviation (4.8308E+00) was only 60.37% of that of AAPSO (8.0015E+00). On F4, PO-ADS achieved an average fitness value of 1.9034E+03, being the only algorithm whose performance remained close to that observed in the 10-dimensional case. Its standard deviation (8.3352E−01) was substantially lower than that of PO (8.1562E+01), indicating that high local exploitation accuracy was preserved even in high-dimensional spaces.
For composite functions F5 and F7, the superiority of PO-ADS became even more evident. On F5, the average fitness value was 3.0896E+04, corresponding to an 84.23% reduction compared with KEO (1.9594E+05), while the standard deviation (3.9633E+04) was only 3.10% of that of AAPSO (1.2778E+06). On F7, PO-ADS achieved an average fitness value of 4.1062E+03, representing a 94.87% improvement over KEO (8.0109E+04); its standard deviation (1.7755E+03) was merely 0.31% of that of AAPSO (5.7181E+05). These results indicate that the multi-strategy cooperative mechanism of PO-ADS effectively alleviates the performance degradation commonly encountered by conventional algorithms in high-dimensional spaces.
It is noteworthy that for function F6, where all algorithms exhibited similar performance, PO-ADS maintained comparable average fitness and standard deviation values without any performance degradation, demonstrating its general applicability across diverse optimization scenarios.
The convergence curves in Figure 3 intuitively illustrate the dynamic optimization processes of all algorithms. In both 10- and 20-dimensional scenarios, PO-ADS exhibits the desirable characteristic of “rapid convergence followed by stable refinement.” During the early iterations (0–100), the fitness value decreases sharply, quickly approaching the global optimum; in the middle and later stages (100–500 iterations), the convergence trend becomes gradual, effectively avoiding premature stagnation. For example, on F1 (10D), PO-ADS reduces the fitness value below 2.0000E+02 within 50 iterations, whereas ECPO and KEO require more than 200 iterations to reach a comparable level. On F5 (20D), PO-ADS stabilizes below 4.0000E+04 after 100 iterations, while AAPSO and WMA still exhibit divergent trends, validating the synergistic effects of EFACS, MOCES, and ADS.
The boxplot analysis in Figure 4 further quantifies algorithmic robustness. PO-ADS consistently shows the narrowest interquartile ranges and the lowest medians across all benchmark functions. For instance, on F3 (10D), the box range of PO-ADS is only 2.8949E+00, significantly smaller than that of IAGWO (1.0927E+01) and ECPO (2.5191E+01). On F7 (20D), the box range of PO-ADS is 1.7755E+03, which is merely 0.31% of that of AAPSO (5.7181E+05), indicating minimal solution variability and the highest consistency across 30 independent runs. Moreover, no outliers are observed in the boxplots of PO-ADS, whereas AAPSO and WMA present numerous outliers on F1 and F5, further confirming the robustness advantage of PO-ADS.
The consistent superiority of PO-ADS can be explained by the complementary roles of its three components during different search stages. In the early stage, MOCES increases operator diversity and enlarges the effective search coverage, which helps the algorithm avoid premature concentration around suboptimal regions. In the middle stage, EFACS gradually biases the control parameters toward historically successful configurations, thereby improving convergence stability and reducing ineffective fluctuations. In the late stage, ADS performs structured refinement around promising solutions, which enhances local exploitation precision without completely destroying population diversity. This stage-wise coordination explains why PO-ADS can simultaneously achieve fast convergence, low variance, and strong robustness across unimodal, multimodal, and composite functions.
In summary, across both 10- and 20-dimensional scenarios of the CEC2020 benchmark suite, PO-ADS significantly outperforms the comparative algorithms in terms of optimization accuracy, convergence speed, stability, and robustness. Its multi-strategy cooperative framework effectively balances global exploration and local exploitation, providing an efficient solution paradigm for complex high-dimensional optimization problems.
3.4. Experimental Design and Result Analysis on the CEC2022 Benchmark
To further validate the general applicability of the PO-ADS algorithm in more complex optimization scenarios, experiments were conducted on the CEC2022 benchmark suite. The problem dimensionalities of 10 and 20 were retained, and PO-ADS was compared with seven representative algorithms, including AAPSO and IAGWO, under identical experimental conditions. The mean fitness value (Mean) and standard deviation (Std) were adopted as the primary quantitative metrics. Convergence curves (Figure 5) and boxplots (Figure 6) were additionally employed to comprehensively evaluate solution accuracy, convergence efficiency, and robustness in high-complexity optimization tasks. The detailed numerical results are presented in Table 4 and Table 5.
Figure 5.
Convergence curves of the compared algorithms on the CEC2022 benchmark functions under 10-dimensional and 20-dimensional settings.
Figure 6.
Boxplot comparison of the compared algorithms on the CEC2022 benchmark functions over 30 independent runs.
Table 4.
Performance Comparison on the CEC2022 Benchmark in 10 Dimensions.
Table 5.
Performance Comparison on the CEC2022 Benchmark in 20 Dimensions.
In the 10-dimensional CEC2022 experiments, PO-ADS achieved optimal or near-optimal performance across all 12 benchmark functions (F1–F12). In particular, it attained clear superiority on key functions such as F1, F3, and F5, while maintaining substantially lower standard deviations than the competing algorithms, demonstrating high accuracy and stability in medium- and low-dimensional complex optimization problems.
For the unimodal function F1, PO-ADS achieved a mean fitness value of 3.0001E+02, nearly identical to the second-best ECPO (3.0003E+02). However, its standard deviation was only 1.5288E−02, which is 21.35% of ECPO’s (7.1613E−02), indicating significantly improved solution consistency.
On the multimodal function F3, PO-ADS achieved a mean fitness value of 6.0000E+02, being the only algorithm to reach the theoretical optimum. Its standard deviation was merely 1.9307E−03, substantially outperforming AAPSO (1.0700E−01) and IAGWO (3.3711E+00), demonstrating excellent local exploitation precision and global search capability.
For composite and highly complex functions F5 and F6, the advantages of PO-ADS became even more pronounced. On F5, the mean fitness value was 9.0006E+02, representing a 0.69% improvement over the second-best DOA (9.0627E+02). The standard deviation was only 1.3933E−01, significantly lower than DOA (1.6375E+01) and IAGWO (3.5908E+01), effectively avoiding entrapment in local optima. On F6, PO-ADS achieved a mean fitness value of 1.8288E+03, which is 36.58% lower than KEO (2.8836E+03). Its standard deviation (1.7124E+01) was only 0.05% of that of AAPSO (3.2297E+04), confirming its efficiency in handling high-dimensional composite functions.
For conventional complex functions such as F9 and F12, PO-ADS achieved mean fitness values equal to those of the best-performing algorithms while maintaining the lowest standard deviations, further demonstrating its general applicability across diverse optimization scenarios.
When the dimensionality increased to 20, the optimization difficulty of the CEC2022 benchmark suite further intensified, and the mean fitness values of all algorithms increased to varying degrees. Nevertheless, PO-ADS maintained leading performance on the majority of test functions, with performance degradation significantly smaller than that of the competing algorithms, highlighting its excellent scalability and adaptability in high-dimensional settings.
For the unimodal function F1, PO-ADS achieved a mean fitness value of 5.5372E+03, nearly identical to the second-best KEO (5.5517E+03), and only 9.72% of WMA (5.6961E+04), representing nearly an order-of-magnitude improvement in solution accuracy.
On the multimodal function F3, PO-ADS maintained a mean fitness value of 6.0004E+02, close to the theoretical optimum, with a standard deviation of only 6.8002E−02, substantially lower than IAGWO (7.7265E+00) and PO (8.6340E+00), demonstrating outstanding stability in high-dimensional search spaces.
On key complex functions F5, F7, and F9, the superiority of PO-ADS became even more evident. On F5, the mean fitness value was 9.0733E+02, corresponding to a 31.51% improvement over KEO (1.3247E+03). The standard deviation was only 8.9873E+00, which is 0.87% of ECPO (1.0275E+03), indicating significantly reduced solution variability. On F7, PO-ADS achieved a mean fitness value of 2.0469E+03, slightly lower than AAPSO (2.0484E+03), while its standard deviation (8.7218E+00) was only 15.62% of that of IAGWO (5.5847E+01), demonstrating markedly superior convergence stability. On F9, PO-ADS attained a mean fitness value of 2.4808E+03, reaching the theoretical optimum with an extremely low standard deviation of 5.9636E−04, making it the only algorithm to achieve high-precision and stable optimization simultaneously.
Even on functions such as F6, where PO-ADS did not achieve the best performance, its results remained at an above-average level without evident weaknesses, further reflecting its robustness.
It should be noted that several extremely small standard deviation values (e.g., on the order of 10−12 mainly indicate that the algorithm repeatedly converged to the same or nearly identical threshold solution over 30 independent runs under the floating-point precision of the MATLAB environment, rather than implying any abnormal numerical behavior. In such cases, the corresponding image histogram usually contains a highly stable threshold configuration under the Otsu criterion, and the strong exploitation ability of PO-ADS enables the algorithm to repeatedly locate that configuration with negligible fluctuation. Therefore, these near-zero deviations should be interpreted as evidence of high repeatability and solution consistency, although they are also naturally bounded by machine precision.
The convergence curves in Figure 5 clearly illustrate the dynamic optimization processes on the CEC2022 benchmark suite. In both 10- and 20-dimensional scenarios, PO-ADS exhibits rapid convergence in the early stage, stable refinement in the later stage, and no divergence trend. During the initial iterations (0–100), the fitness value of PO-ADS decreases sharply, quickly establishing a performance gap over other algorithms. For example, on 10D F1 and F3, PO-ADS approaches the theoretical optimum within 50 iterations, whereas AAPSO and WMA require more than 200 iterations to reach comparable levels.
In the middle and later stages (100–500 iterations), the convergence curve of PO-ADS becomes smooth and enters a fine-tuning phase without noticeable oscillations or performance degradation. In contrast, the original PO and WMA exhibit stagnation or even fitness deterioration on complex functions such as F5 and F7. In the 20-dimensional case, the convergence advantage of PO-ADS remains evident; on F5 and F9, it stabilizes near the optimal solution within 200 iterations, while competing algorithms continue to fluctuate at relatively high fitness levels. These results validate the effectiveness of the synergistic mechanisms of EFACS, MOCES, and ADS within PO-ADS, which ensure efficient global exploration in early iterations and precise local exploitation in later stages.
The boxplot analysis in Figure 6 further quantifies robustness over 30 independent runs. Across all test functions, PO-ADS consistently exhibits the narrowest interquartile ranges, the lowest medians, and no outliers. The variability and dispersion of solution quality are significantly lower than those of the comparative algorithms.
In 10D F1 and F3, the box range of PO-ADS is nearly zero, markedly narrower than the wide distributions of AAPSO and IAGWO, indicating highly consistent results across repeated runs. In 20D F5 and F7, the boxplots of PO-ADS show no whisker extensions and no outliers, whereas AAPSO and WMA exhibit numerous outliers and wide box ranges, reflecting inferior stability and reliability. Moreover, for all test functions in both 10- and 20-dimensional scenarios, PO-ADS consistently achieves the lowest median values, indicating sustained superiority in average performance across independent trials.
In summary, on the CEC2022 benchmark suite under both 10- and 20-dimensional settings, PO-ADS significantly outperforms the seven comparative algorithms in terms of solution accuracy, convergence speed, stability, and robustness. Even under higher-complexity optimization tasks, its multi-strategy cooperative framework effectively balances global exploration and local exploitation, mitigates performance degradation in high-dimensional spaces, and provides an efficient solution paradigm for more challenging real-world engineering optimization problems.
3.5. Statistical Analysis of Algorithm Performance Based on the Friedman Test
To objectively quantify the overall performance differences among the algorithms on the CEC2020 and CEC2022 benchmark suites from a statistical perspective, the Friedman average rank test was employed. Under both 10- and 20-dimensional settings, all test functions were ranked and statistically analyzed. The results are summarized in Table 6, and the rank distribution characteristics across different test functions are visually illustrated in Figure 7. The Friedman test adopts the mean rank (M.R.) and total rank (T.R.) as the core indicators; smaller rank values indicate better overall algorithmic performance. This non-parametric statistical method effectively eliminates random interference and provides a rigorous evaluation of overall optimization capability.
Table 6.
Friedman mean rank test results on the CEC2020 and CEC2022 benchmarks.
Figure 7.
Ranking distribution of different algorithms across various test functions.
As shown in Table 6, PO-ADS consistently achieved the lowest mean ranks and total ranks across all test scenarios, significantly outperforming the other seven comparative algorithms. Moreover, its rank superiority was maintained in high-dimensional scenarios, confirming both its statistical significance and dimensional adaptability.
In the 10-dimensional CEC2020 benchmark, PO-ADS achieved a mean rank of 1.00 and a total rank of 1, substantially lower than the second-best KEO (M.R. = 3.10, T.R. = 2), forming a clear performance gap. When extended to 20 dimensions, PO-ADS still ranked first with a mean rank of 2.00 and a total rank of 1. Compared with the second-best AAPSO (M.R. = 3.20, T.R. = 2), the rank advantage remained evident, indicating statistically significant superiority in high-dimensional complex optimization tasks.
On the CEC2022 benchmark suite, the rank advantage of PO-ADS became even more pronounced. In the 10-dimensional scenario, PO-ADS achieved a mean rank of only 1.08 and a total rank of 1, creating a gap of nearly 2.5 rank positions compared with the second-best IAGWO (M.R. = 3.58, T.R. = 2). In the 20-dimensional case, PO-ADS obtained a mean rank of 1.33 and a total rank of 1, significantly outperforming KEO (M.R. = 3.42, T.R. = 2).
In contrast, WMA consistently recorded the highest mean and total ranks (7.60–8.00) across all test scenarios, indicating the weakest overall performance. The original PO and ECPO remained in the lower-middle range (PO: 6.33–6.67; ECPO: 5.00–6.00) without substantial performance improvement. Although AAPSO, IAGWO, KEO, and DOA occasionally performed well on specific functions, their overall ranks remained considerably higher than those of PO-ADS, and none demonstrated a global performance advantage.
Further analysis of rank variations across dimensions reveals that the mean rank of PO-ADS increased only slightly—from 1.00 to 2.00 in CEC2020 and from 1.08 to 1.33 in CEC2022—representing the smallest increase among all algorithms. In contrast, WMA, PO, and others exhibited significant rank deterioration as dimensionality increased. This indicates that PO-ADS experiences substantially lower performance degradation when optimization difficulty escalates due to increased dimensionality, demonstrating superior high-dimensional adaptability from a statistical standpoint.
The rank distribution visualization in Figure 6 further highlights performance differences across functions. PO-ADS achieved rank 1 on nearly all test functions, with highly concentrated and stable rank distributions and no significant fluctuations. In contrast, the comparative algorithms exhibited dispersed and highly variable rank distributions, confirming the robustness and general applicability of PO-ADS.
On the CEC2020 benchmark (10D and 20D, F1–F10), PO-ADS consistently maintained rank 1 across all functions, with no decline in any case. KEO and AAPSO achieved favorable ranks only on a limited number of relatively simple functions, while their ranks increased substantially on complex composite functions such as F1, F5, and F7.
On the CEC2022 benchmark (10D and 20D, F1–F12), PO-ADS maintained rank 1 on almost all functions, with only occasional slight increases to rank 2. Its rank stability was markedly superior to that of other algorithms. By comparison, IAGWO and DOA exhibited rank fluctuations between 2 and 7 across functions, while the original PO and ECPO remained between ranks 5 and 7. WMA consistently ranked 8th across all functions, indicating persistent performance deficiencies. None of the comparative algorithms achieved stable performance across all function types.
From the overall trend of rank distribution, PO-ADS consistently achieved optimal ranks across unimodal, multimodal, and composite functions, demonstrating that its multi-strategy cooperative mechanism (EFACS, MOCES, and ADS) effectively adapts to optimization problems of varying complexity and type, dynamically balancing global exploration and local exploitation. In contrast, the other algorithms rely primarily on single or limited strategies and therefore perform well only on specific function types, exhibiting clear limitations in complex and heterogeneous scenarios. For example, the original PO lacks adaptive adjustment in its stochastic update mechanism, making it prone to premature convergence in high-dimensional complex landscapes, resulting in rank deterioration. Similarly, WMA suffers from an imbalance between exploration and exploitation, leading to consistently inefficient optimization performance and persistent bottom ranking.
The superior performance of PO-ADS is not attributed to a single modification, but to the coordinated interaction of the three strategies. EFACS improves search adaptability by continuously biasing control parameters toward historically effective settings; MOCES enhances population diversity and search direction richness through heterogeneous operator cooperation; ADS strengthens late-stage refinement by introducing structured perturbations around promising regions. Their functions are complementary: EFACS stabilizes the control process, MOCES prevents search impoverishment, and ADS improves local exploitation precision. Therefore, the advantage of PO-ADS comes from the cooperative coupling of adaptive learning, operator-level diversity, and structured exploitation rather than from any isolated mechanism alone.
In summary, both the Friedman rank test and the rank distribution visualization demonstrate that PO-ADS possesses statistically significant superiority in overall optimization performance compared with the other algorithms. Its rank advantage is consistently maintained across 10- and 20-dimensional settings and across both the CEC2020 and CEC2022 benchmark suites. Moreover, it exhibits remarkable robustness and general applicability across different types of test functions, and its superiority is rigorously validated by statistical analysis.
3.6. Analysis of Average Runtime
To comprehensively evaluate the practical applicability of the PO-ADS algorithm, this study further quantified the average runtime of all algorithms in addition to optimization accuracy, convergence stability, and robustness. The results are illustrated in Figure 8. As a core indicator of computational efficiency, runtime directly determines the feasibility of deploying an algorithm in real-world engineering problems. All runtime measurements were conducted under identical hardware and software environments to ensure objectivity and fairness.
Figure 8.
Average running time of different algorithms (CEC2022 20-Dimensional Scenario).
Figure 8 presents the average runtime of each algorithm in the CEC2022 20-dimensional scenario. This metric directly reflects computational efficiency and serves as a critical dimension for assessing engineering applicability. As shown in the figure, substantial differences exist among the algorithms in terms of runtime. Notably, PO-ADS demonstrates a favorable balance between computational efficiency and the superior optimization performance validated in previous experiments.
Specifically, AAPSO and IAGWO exhibit the longest runtimes, reaching 0.2234 s and 0.2211 s, respectively. Their population update mechanisms involve extensive complex vector operations and cooperative computations, with limited optimization of redundant calculations, resulting in significantly increased computational overhead.
WMA records the shortest runtime at only 0.0474 s. However, as evidenced in earlier experiments, its optimization performance ranks last among all comparative algorithms, representing a typical trade-off of “accuracy for efficiency,” which limits its practical engineering value.
In contrast, PO-ADS achieves a runtime of 0.1069 s, placing it in the lower-middle range among all algorithms. Its runtime is only slightly higher than that of KEO (0.0844 s), WMA (0.0474 s), ECPO (0.0902 s), and the original PO (0.1046 s), while remaining significantly lower than that of AAPSO, IAGWO, and DOA (0.1122 s). This result indicates that the incorporation of EFACS, MOCES, and ADS does not introduce substantial computational overhead. More specifically, the additional operations introduced by ADS, such as golden-ratio-based coefficient generation, direction normalization, and structured perturbation computation, only involve simple scalar arithmetic and linear vector operations. These operations contribute only constant-level or O(D)-level overhead for each individual, which is quantitatively much smaller than the repeated fitness evaluations required by the benchmark functions. Therefore, although ADS increases the algorithmic execution steps, its practical time cost remains limited. This observation is consistent with the runtime results in Figure 7, where PO-ADS achieves substantially better optimization performance than PO and ECPO while showing only a slight increase in runtime. All three strategies are efficiently reconstructed within the original PO framework. For example, the adaptive parameter adjustment in EFACS involves only linear statistical operations, while the structured perturbation in ADS consists of simple dimension-related operations. These mechanisms effectively reduce redundant random searches in the original PO, thereby enhancing optimization performance while maintaining controlled computational cost.
Comparing PO-ADS with the original PO and its improved variant ECPO further illustrates this balance. Although the runtime of PO-ADS (0.1069 s) is slightly higher than that of ECPO (0.0902 s) and PO (0.1046 s), its overall optimization performance is substantially superior to both. This demonstrates that the multi-strategy cooperative mechanism significantly improves accuracy without incurring excessive efficiency loss. In contrast, AAPSO and IAGWO require nearly twice the runtime of PO-ADS without achieving corresponding performance gains, further highlighting the advantage of PO-ADS in balancing performance and efficiency.
Overall, among all comparative algorithms, PO-ADS is the only method that simultaneously achieves optimal optimization performance and moderate runtime. Its efficient strategy reconstruction not only guarantees high solution accuracy but also effectively controls computational overhead, thereby establishing a practical efficiency foundation for real-world engineering optimization applications.
4. Mathematical Model of Multi-Threshold Image Segmentation
4.1. Problem Description
Image segmentation aims to partition an image into several homogeneous and meaningful regions according to pixel intensity distribution. In multi-threshold segmentation, the objective is to determine a set of optimal thresholds that divide the grayscale histogram into multiple classes such that inter-class separability is maximized [45].
Let denote a grayscale image of size , where each pixel intensity belongs to the discrete set , and typically . The total number of pixels is:
Let denote the number of pixels with gray level iii. The normalized histogram (probability distribution) is defined as:
The multi-threshold segmentation problem consists of finding an ordered threshold vector:
which partitions the image into classes:
The goal is to determine the optimal threshold vector that produces the best segmentation quality according to a defined objective criterion.
4.2. Mathematical Model
To measure class separability, the multi-threshold Otsu criterion is adopted.
The probability of class is defined as:
The mean gray level of class is:
The global mean intensity of the image is:
The between-class variance is given by:
The multi-threshold image segmentation problem can therefore be formulated as the following constrained optimization model:
This model represents a nonlinear, high-dimensional combinatorial optimization problem. The search space size is:
which increases exponentially with respect to the number of thresholds . Therefore, exhaustive search becomes computationally infeasible when is large, and intelligent optimization algorithms are required.
After obtaining the optimal threshold vector , the segmented image is reconstructed as:
where denotes the representative intensity value of class , usually chosen as the class mean .
4.3. Algorithm Design Framework
To efficiently solve the above optimization model, a population-based metaheuristic optimization strategy is adopted.
Each individual in the population is encoded as a -dimensional solution vector:
where each dimension corresponds to a threshold value. The search domain is defined as:
To guarantee feasibility, the threshold vector is sorted after each update to satisfy:
The fitness function is defined according to the Otsu between-class variance:
The general optimization procedure can be summarized as show in Figure 9.
Figure 9.
Flowchart of multi-threshold image segmentation.
This framework transforms the multi-threshold image segmentation task into a structured optimization problem, enabling efficient solution via intelligent metaheuristic search mechanisms.
4.4. Experimental Results and Analysis
To verify the effectiveness and robustness of the proposed algorithm in multi-level threshold image segmentation, a series of experiments were conducted on six widely used grayscale benchmark images with different characteristics, namely baboo, camera, columbia, elaine, lake, and woman. The sample images are illustrated in Figure 10. Otsu’s maximum between-class variance criterion was adopted as the objective function for threshold optimization. Four different threshold levels, including 4, 6, 8, and 10, were considered to evaluate the segmentation performance under varying problem dimensions.
Figure 10.
Images for Multi-Threshold Image Segmentation.
The intelligence algorithms were selected as competing methods, including AAPSO, IAGWO, KEO, DOA, WMA, PO, ECPO, and PO-ADS. To ensure fairness and consistency, all algorithms were executed under the same experimental conditions. Specifically, the population size was set to , and the maximum number of iterations was fixed at . The search range of thresholds was limited to [1, 256], and each algorithm was independently run 30 times to reduce the influence of randomness. The final results were reported in terms of the mean and standard deviation over 30 independent runs.
In addition, the Structural Similarity Index (SSIM), Peak Signal-to-Noise Ratio (PSNR), and Feature Similarity Index (FSIM) were employed to quantitatively evaluate segmentation quality. Higher values of these metrics indicate superior segmentation performance. The standard deviation (Std) reported in each table directly reflects the stability of the segmentation results, with lower values indicating more consistent performance across repeated experiments. Furthermore, the Friedman test was conducted to statistically analyze the overall ranking performance of different algorithms across multiple threshold levels.
The experimental results are summarized in Table 7, Table 8, Table 9, Table 10 and Table 11, while the fitness curves and metric-based ranking visualizations are presented in Figure 9 and Figure 10.
Table 7.
Evaluation results for multilevel thresholding based on the Otsu fitness function by PO-ADS.
Table 8.
Statistical results (Mean ± Std) of the best Otsu objective function values.
Table 9.
SSIM performance based on Otsu’s method.
Table 10.
PSNR performance based on Otsu’s method.
Table 11.
FSIM performance based on Otsu’s method.
Using Otsu multi-threshold segmentation as a practical engineering validation scenario, Table 7, Table 8, Table 9, Table 10 and Table 11 comprehensively quantify the fine-grained performance of PO-ADS and seven comparative algorithms across four dimensions: segmentation accuracy, structural consistency, pixel fidelity, and feature similarity. The experiments were conducted on six representative images (baboo, camera, columbia, elaine, lake, and woman), covering texture-intensive, luminance-balanced, and structurally complex scenes, under 4-, 6-, 8-, and 10-level threshold settings. The core evaluation metrics include the Otsu objective function value (between-class variance), Structural Similarity Index (SSIM), Peak Signal-to-Noise Ratio (PSNR), and Feature Similarity Index (FSIM). Higher values indicate superior segmentation quality, while the standard deviation (Std) reported in each table directly reflects the stability of the segmentation results.
With respect to the Otsu objective function value (between-class variance), which serves as the primary segmentation accuracy indicator, PO-ADS achieved the optimal or near-optimal mean values across all images and threshold levels, with standard deviations significantly lower than those of the comparative algorithms. For the texture-rich baboo image, under the 4-threshold setting, PO-ADS achieved a between-class variance of 3.3008E+03, matching AAPSO and ECPO in mean performance, yet with an extremely small standard deviation of 1.8501E−12—substantially lower than AAPSO (2.6124E−03) and ECPO (2.3276E−02), indicating nearly zero fluctuation. When the threshold number increased to 10, the segmentation complexity rose markedly; nevertheless, PO-ADS maintained a high variance of 3.4159E+03, slightly exceeding KEO (3.4153E+03), while its standard deviation (1.5267E−01) was only 3.76% of that of the original PO (4.0547E+00), demonstrating precise and stable threshold search capability in high-level segmentation scenarios.
For the luminance-balanced camera image under 6 thresholds, PO-ADS achieved a between-class variance of 4.6517E+03, being the only algorithm to exceed 4.6516E+03. Its standard deviation (3.8299E−03) was substantially lower than that of KEO (7.4458E−02) and ECPO (4.9421E−02), verifying its adaptability to images with diverse brightness characteristics.
SSIM and FSIM, which measure structural consistency and detail preservation relative to the original image, further highlight the superiority of PO-ADS. For the detail-rich elaine image under 8 thresholds, PO-ADS achieved an SSIM of 0.8942, slightly outperforming IAGWO (0.8911) and KEO (0.8919), with a standard deviation of 0.0023—only 9.71% of DOA (0.0237)—indicating minimal structural fluctuation. In terms of FSIM, PO-ADS achieved 0.8455 on the woman image under 10 thresholds, marginally higher than ECPO (0.8453), with a standard deviation of only 0.0012, significantly lower than WMA’s 0.0175 in comparable scenarios, reflecting more stable feature preservation across varying image types.
PSNR, which reflects pixel-level fidelity and noise suppression capability, also confirms the effectiveness of PO-ADS. On the lake image under 8 thresholds, PO-ADS achieved a PSNR of 22.4438 dB, representing a 1.18% improvement over KEO (22.1824 dB), with a standard deviation (0.2485 dB) only 19.81% of that of the original PO (1.2545 dB). On the peppers image under 10 thresholds, PO-ADS achieved 24.4377 dB, further surpassing IAGWO (24.4047 dB), demonstrating outstanding pixel-level fidelity.
It is noteworthy that as the number of thresholds increased from 4 to 10, all algorithms exhibited varying degrees of performance degradation; however, PO-ADS consistently showed the smallest decline and maintained more pronounced advantages in high-threshold scenarios. For example, on the columbia image, the SSIM of PO-ADS increased from 0.7197 (4 thresholds) to 0.8620 (10 thresholds), maintaining superior structural similarity stability compared to DOA and WMA, which exhibited larger performance fluctuations. Regarding the Otsu objective value on the house image, PO-ADS increased from 1.9636E+03 (4 thresholds) to 2.0576E+03 (10 thresholds), reflecting effective scalability in high-threshold segmentation tasks, whereas WMA exhibited significantly smaller improvements, indicating limited adaptability.
From the perspective of image segmentation quality, the advantage of PO-ADS is closely related to its ability to produce more stable and discriminative threshold combinations. A better exploration–exploitation balance allows the algorithm to search the threshold space more thoroughly in the early stage and to refine candidate thresholds more accurately in the later stage. As a result, the obtained thresholds can better preserve inter-class separability in the Otsu sense, which is further reflected by competitive or superior SSIM, PSNR, and FSIM values. In other words, the optimization advantage of PO-ADS is not limited to benchmark functions; it is effectively transferred to segmentation quality through more reliable threshold determination.
The Friedman ranking results reported in Table 7, Table 8, Table 9, Table 10 and Table 11 further demonstrate that PO-ADS achieved the first overall rank across all four evaluation metrics (Otsu objective value, SSIM, PSNR, and FSIM). The Friedman mean rank for the Otsu objective value was only 2.04, substantially lower than AAPSO (2.88). Similarly, PO-ADS ranked first in SSIM (3.82), PSNR (3.69), and FSIM (3.22), statistically confirming its comprehensive superiority in multi-threshold image segmentation tasks. Importantly, its performance advantage is not limited to specific images or threshold settings but remains consistent across all scenarios and evaluation criteria.
The convergence curves in Figure 11 further reveal the optimization efficiency of PO-ADS. Under both 4- and 10-threshold settings across all test images, PO-ADS exhibits the characteristic pattern of “rapid convergence followed by stable refinement.” For instance, on the baboo image under 4 thresholds, PO-ADS reached the optimal Otsu objective value (3.3008E+03) within 30 iterations, maintaining stability thereafter, whereas AAPSO and IAGWO required more than 60 iterations to approach comparable performance, and WMA exhibited persistent fluctuations. Under 10 thresholds for the camera image, PO-ADS stabilized near 4.6807E+03 within 50 iterations, while PO and ECPO continued a gradual descent. This behavior stems from the synergistic mechanisms of EFACS, MOCES, and ADS: EFACS dynamically adjusts control parameters based on evolutionary feedback to accelerate convergence; MOCES balances global exploration and local exploitation via multi-operator collaboration; and ADS provides structured perturbations that enhance fine-grained search under high-threshold conditions.
Figure 11.
Convergence behavior of different algorithms across multiple test images (TH = 4/10).
Figure 12 further quantifies the overall performance through average ranking values of SSIM, FSIM, PSNR, and Fitness. Smaller ranking values indicate better comprehensive performance. PO-ADS achieved optimal or near-optimal rankings across all metrics, significantly outperforming other algorithms. In particular, it ranked first in FSIM (3.22), substantially ahead of KEO (3.42) and far surpassing WMA (7.66), demonstrating superior detail preservation. In SSIM, PO-ADS (3.82) slightly outperformed ECPO (3.89) and KEO (3.87), reflecting strong structural consistency. In terms of Fitness (2.04), PO-ADS showed a clear advantage over AAPSO (2.88), PO (5.89), and WMA (8.00), indicating more accurate global threshold search. For PSNR (3.69), it ranked second, slightly behind KEO (3.73), yet significantly ahead of IAGWO (4.10) and DOA (5.90).
Figure 12.
Comparative average ordinal rankings under diverse assessment measures.
Notably, PO-ADS is the only algorithm ranking within the top three across all four metrics, without any indicator falling below rank 4. In contrast, other algorithms exhibit evident performance deficiencies: KEO performs well in FSIM and PSNR but less prominently in Fitness and SSIM; AAPSO ranks second only in Fitness; WMA consistently ranks last or near last across all metrics. These findings demonstrate that the multi-strategy cooperative framework of PO-ADS effectively balances segmentation accuracy, structural similarity, detail preservation, and noise suppression, while other algorithms, relying on limited strategies, fail to achieve multidimensional optimality.
In conclusion, the statistical ranking results in Figure 11 confirm the comprehensive superiority of PO-ADS in multi-threshold image segmentation tasks. Across all four core metrics, PO-ADS maintains leading average rankings without notable weaknesses, further validating its robustness, reliability, and practical applicability in real-world engineering scenarios.
Overall, PO-ADS simultaneously achieves higher segmentation accuracy, superior visual quality, and more stable statistical performance in multi-threshold image segmentation tasks. Its quantitative metrics (FSIM, PSNR, and SSIM) consistently outperform those of the comparative algorithms across all scenarios, while the visual segmentation results exhibit more complete structural details and clearer regional boundaries. Furthermore, its average ranking remains consistently first across all evaluation criteria, demonstrating comprehensive superiority.
This performance advantage originates from its multi-strategy cooperative mechanism. The adaptive parameter adjustment strategy (EFACS) dynamically aligns the search behavior with the evolving requirements of threshold optimization, thereby enhancing convergence efficiency and precision. The multi-operator cooperative evolution strategy (MOCES) effectively balances global region partitioning and local detail refinement, ensuring both coarse-grained structural segmentation and fine-grained boundary preservation. Meanwhile, the adaptive disturbance strategy (ADS) introduces structured perturbations that help the algorithm escape local optima, particularly under high-threshold scenarios where the search space becomes increasingly complex.
Through the coordinated interaction of these mechanisms, PO-ADS successfully transfers its numerical optimization advantages to practical engineering applications, achieving robust and high-quality performance in real-world multi-threshold image segmentation tasks.
5. Conclusions and Future Work
This study addressed several inherent limitations of the original Parrot Optimizer (PO), including insufficient convergence stability in complex high-dimensional optimization problems, lack of adaptive parameter regulation, and limited exploitation capability in the later search stages. To overcome these deficiencies, a multi-strategy cooperative enhancement algorithm termed PO-ADS was proposed. Without modifying the original behavioral framework of PO, the proposed method incorporates three complementary mechanisms: an Evolution Feedback-Based Adaptive Control Strategy (EFACS), a Multi-Operator Cooperative Evolution Strategy (MOCES), and an Artistic Design Strategy (ADS). These mechanisms enhance algorithm performance from three perspectives, namely adaptive parameter learning, diversified search operators, and structured perturbation reinforcement.
Extensive experimental evaluations on the CEC2020 and CEC2022 benchmark suites demonstrate that PO-ADS consistently achieves superior average ranking performance across different dimensional settings. The Friedman test results further confirm its statistically significant advantage over the original PO and several state-of-the-art comparative algorithms. In addition, the application of PO-ADS to Otsu-based multi-threshold image segmentation verifies its effectiveness in practical image processing tasks. The experimental findings indicate that PO-ADS achieves substantial improvements in optimization accuracy, convergence speed, solution stability, and segmentation quality, thereby validating the effectiveness of the proposed multi-strategy cooperative framework.
Nevertheless, several limitations should be noted. First, the current validation is mainly limited to continuous single-objective benchmark functions and Otsu-based multi-threshold image segmentation, and the applicability of PO-ADS to multi-objective, dynamic, discrete, and constrained optimization problems still requires further verification. Second, although EFACS improves adaptive parameter learning, some control parameters still need to be preset, and their sensitivity may affect the robustness of the algorithm across different problem types. Third, while the proposed strategies do not increase the asymptotic computational complexity, they introduce additional constant-level overhead due to memory updating, operator coordination, archive maintenance, and structured perturbation execution, which may reduce the relative efficiency advantage in lightweight tasks. In addition, a dedicated parameter sensitivity study has not yet been fully conducted for all key control variables, and this may influence the transferability of the current parameter configuration to other problem classes. Finally, the effectiveness of EFACS, MOCES, and ADS is mainly supported by empirical evidence, and a rigorous theoretical convergence analysis has not yet been fully established.
Future work will therefore focus on extending PO-ADS to constrained, dynamic, and multi-objective optimization problems, enhancing self-adaptive and problem-feature-driven parameter regulation, developing more rigorous theoretical analysis of convergence and stability, and exploring hybridization with surrogate modeling and learning-based methods to improve efficiency in large-scale and computationally expensive optimization tasks. Through these efforts, the theoretical foundation and engineering applicability of PO-ADS are expected to be further strengthened, broadening its potential in complex real-world optimization scenarios.
Author Contributions
Conceptualization, X.W. and H.Z.; methodology, X.W. and H.Z.; software, X.W. and H.Z.; validation, X.W. and H.Z.; formal analysis, X.W. and H.Z.; investigation, X.W. and H.Z.; resources, X.W. and H.Z.; data curation, X.W. and H.Z.; writing—original draft preparation, X.W. and H.Z.; writing—review and editing, X.W. and H.Z.; visualization, X.W. and H.Z.; supervision, X.W. and H.Z.; project administration, X.W. and H.Z.; funding acquisition, X.W. and H.Z. All authors have read and agreed to the published version of the manuscript.
Funding
This research received no external funding.
Data Availability Statement
Data is contained within the article.
Acknowledgments
The all authors would like to express their sincere gratitude to all those who contributed to the completion of this work.
Conflicts of Interest
The authors declare no conflicts of interest.
References
- Fu, Y.; Liu, D.; Chen, J.; He, L. Secretary bird optimization algorithm: A new metaheuristic for solving global optimization problems. Artif. Intell. Rev. 2024, 57, 123. [Google Scholar] [CrossRef] [Scilit]
- Yu, M.; Yang, H.; Zhang, J.; Ouyang, K.; Fu, S.; Tan, P.; Jiang, F.; Xu, J. Bounty hunter optimizer: A novel metaheuristic with an application to multi-UAV mobile edge computing and path planning. Knowl.-Based Syst. 2026, 341, 115836. [Google Scholar] [CrossRef] [Scilit]
- Cao, L.; Wei, Q. SZOA: An Improved Synergistic Zebra Optimization Algorithm for Microgrid Scheduling and Management. Biomimetics 2025, 10, 664. [Google Scholar] [CrossRef] [Scilit] [PubMed]
- Chen, Y.; Sun, R.; Zheng, J.; Shao, Y.; Zhou, H. MEIAO: A Multi-Strategy Enhanced Information Acquisition Optimizer for Global Optimization and UAV Path Planning. Biomimetics 2025, 10, 765. [Google Scholar] [CrossRef] [Scilit] [PubMed]
- Yu, M.; Du, J.; Xu, X.; Xu, J.; Jiang, F.; Fu, S.; Zhang, J.; Liang, A. A multi-strategy enhanced Dung Beetle Optimization for real-world engineering problems and UAV path planning. Alex. Eng. J. 2025, 118, 406–434. [Google Scholar] [CrossRef] [Scilit]
- Zhang, J.; Qi, H.; Wu, J.J.; Mao, X.; Zhang, H.; Amin, N.; Xu, F.; Dong, C.; Wang, C.; Wang, P.; et al. Disposable Peptidoglycan-Specific Biosensor for Noninvasive Real-Time Detection of Broad-Spectrum Gram-Positive Bacteria in Exhaled Breath Condensates. Anal. Chem. 2024, 96, 9817–9825. [Google Scholar] [CrossRef] [Scilit]
- Yu, M.; Yang, H.; Wei, X.; Fu, S.; Xu, J.; Zhang, J. Carbon Footprint Efficiency Ratio: A Unified Indicator for Green Evaluation of Evolutionary Algorithms. IEEE Trans. Emerg. Top. Comput. Intell. 2026, 1–14. [Google Scholar] [CrossRef] [Scilit]
- Kennedy, J.; Eberhart, R. Particle swarm optimization. In Proceedings of the ICNN’95—International Conference on Neural Networks, Perth, WA, Australia, 27 November–1 December 1995; Volume 4, pp. 1942–1948. [Google Scholar]
- Heidari, A.A.; Mirjalili, S.; Faris, H.; Aljarah, I.; Mafarja, M.; Chen, H. Harris hawks optimization: Algorithm and applications. Future Gener. Comput. Syst. 2019, 97, 849–872. [Google Scholar] [CrossRef] [Scilit]
- Xue, J.; Shen, B. A novel swarm intelligence optimization approach: Sparrow search algorithm. Syst. Sci. Control Eng. 2020, 8, 22–34. [Google Scholar] [CrossRef] [Scilit]
- Dorigo, M.; Birattari, M.; Stützle, T. Ant Colony Optimization. IEEE Comput. Intell. Mag. 2006, 1, 28–39. [Google Scholar] [CrossRef] [Scilit]
- Mirjalili, S.; Lewis, A. The Whale Optimization Algorithm. Adv. Eng. Softw. 2016, 95, 51–67. [Google Scholar] [CrossRef] [Scilit]
- Mirjalili, S.; Mirjalili, S.M.; Lewis, A. Grey Wolf Optimizer. Adv. Eng. Softw. 2014, 69, 46–61. [Google Scholar] [CrossRef] [Scilit]
- Chen, H.; Luo, M. MECOA: A Multi-Strategy Enhanced Coati Optimization Algorithm for Global Optimization and Photovoltaic Models Parameter Estimation. Biomimetics 2025, 10, 839. [Google Scholar] [CrossRef] [Scilit] [PubMed]
- Yu, M.; Zhang, J.; Yu, L.; Yang, H.; Lu, H.; Wei, X.; Xu, J. Alzheimer’s disease brain image segmentation using multi-feature fusion in 3D Rényi entropy model and quantum hybrid optimization. Artif. Intell. Rev. 2026, 59, 95. [Google Scholar] [CrossRef] [Scilit]
- Liu, D.; Shen, Q.; Liu, J. The Health-Wealth Gradient in Labor Markets: Integrating Health, Insurance, and Social Metrics to Predict Employment Density. Computation 2026, 14, 22. [Google Scholar] [CrossRef] [Scilit]
- Wu, X.; Wang, H.; Zhang, Y.; Zou, B.; Hong, H. A Tutorial-Generating Method for Autonomous Online Learning. IEEE Trans. Learn. Technol. 2024, 17, 1532–1541. [Google Scholar] [CrossRef] [Scilit]
- Wu, X.; Dong, J.; Bao, W.; Zou, B.; Wang, L.; Wang, H. Augmented Intelligence of Things for Emergency Vehicle Secure Trajectory Prediction and Task Offloading. IEEE Internet Things J. 2024, 11, 36030–36043. [Google Scholar] [CrossRef] [Scilit]
- Fan, D.; Zhu, X.; Xiang, Z.; Lu, Y.; Quan, L. Dimension-Reduction Many-Objective Optimization Design of Multimode Double-Stator Permanent Magnet Motor. IEEE Trans. Transp. Electrif. 2025, 11, 1984–1994. [Google Scholar] [CrossRef] [Scilit]
- Fan, D.; Miao, D.; Shan, W.; Xiang, Z.; Zhu, X. Short-Circuit Fault Demagnetization Assessment and Optimization of Double-Electrical-Port Vernier Permanent Magnet Motor. IEEE Trans. Ind. Appl. 2025, 1–10. [Google Scholar] [CrossRef] [Scilit]
- Yi, X.; Li, C. A Multi-Strategy Augmented Newton–Raphson-Based Optimizer for Global Optimization Problems and Robot Path Planning. Symmetry 2026, 18, 280. [Google Scholar] [CrossRef] [Scilit]
- Xiao, W.; Lian, J.J.; Ouyang, K.; Gu, S.; Ke, Z.; Wei, D.; Sha, X.; Wang, J.; Fu, S.; Qiu, M.; et al. Newton downhill optimizer with application to engineering optimization and breast cancer feature selection. Biomed. Signal Process. Control 2026, 117, 109184. [Google Scholar] [CrossRef] [Scilit]
- Talatahari, S.; Bayazidi, H.; Sareh, P. Philosophical proposition optimizer (ΦPO): An epistemology-inspired algorithm for numerical optimization. Artif. Intell. Rev. 2025, 58, 405. [Google Scholar] [CrossRef] [Scilit]
- Hasan, D.O.; Mohammed, H.M.; Abdul, Z.K. Griffon vultures optimization algorithm for solving optimization problems. Expert Syst. Appl. 2025, 276, 127206. [Google Scholar] [CrossRef] [Scilit]
- Hassan, M.H.; Kamel, S. Supercell thunderstorm algorithm (STA): A nature-inspired metaheuristic algorithm for engineering optimization. Neural Comput. Appl. 2025, 37, 7207–7260. [Google Scholar] [CrossRef] [Scilit]
- Taheri, A.; RahimiZadeh, K.; Baumbach, J.; Beheshti, A.; Zolotareva, O.; Al-Betar, M.A.; Mirjalili, S.; Gandomi, A.H. Farthest better or nearest worse optimizer: A novel metaheuristic algorithm. Artif. Intell. Rev. 2026, 59, 79. [Google Scholar] [CrossRef] [Scilit]
- Amiri, M.H.; Hashjin, N.M.; Montazeri, M.; Mirjalili, S.; Khodadadi, N. Hippopotamus optimization algorithm: A novel nature-inspired optimization algorithm. Sci. Rep. 2024, 14, 5032. [Google Scholar] [CrossRef] [Scilit]
- Wang, T.-L.; Gu, S.-W.; Liu, R.-J.; Chen, L.-Q.; Wang, Z.; Zeng, Z.-Q. Cuckoo catfish optimizer: A new meta-heuristic optimization algorithm. Artif. Intell. Rev. 2025, 58, 326. [Google Scholar] [CrossRef] [Scilit]
- Wolpert, D.H.; Macready, W.G. No free lunch theorems for optimization. IEEE Trans. Evol. Comput. 1997, 1, 67–82. [Google Scholar] [CrossRef] [Scilit]
- Shen, Q.; Zhang, J. MFTFormer: Meteorological-Frequency-Temporal Transformer with Block-Aligned Fusion for Traffic Flow Prediction. 2026. Available online: https://www.researchsquare.com/article/rs-8770196/v1 (accessed on 19 April 2026).
- Chen, Z.; Fu, B.; Yang, Y. A Novel Elite-Guided Hybrid Metaheuristic Algorithm for Efficient Feature Selection. Biomimetics 2025, 10, 747. [Google Scholar] [CrossRef] [Scilit]
- Huang, T.; Huang, F.; Qin, Z.; Pan, J. An improved polar lights optimization algorithm for global optimization and engineering applications. Sci. Rep. 2025, 15, 11581. [Google Scholar] [CrossRef] [Scilit]
- Shen, Q.; Liu, D.; Zou, Y.; Xiao, Z.; Zhang, T. Business Resilience Index (BRI): Evaluating Economic Recovery Through Event-Study Heterogeneity. Sustainability 2026, 18, 3980. [Google Scholar] [CrossRef] [Scilit]
- Francis, D.; Subramani, B. A hybrid deep learning approach for cervical cancer segmentation and classification. Int. J. Ad Hoc Ubiquitous Comput. 2024, 47, 209–226. [Google Scholar] [CrossRef] [Scilit]
- Ragupathy, B.; Subramani, B.; Arumugam, S. A novel approach for MR brain tumor classification and detection using optimal CNN-SVM model. Int. J. Imaging Syst. Technol. 2022, 33, 746–759. [Google Scholar] [CrossRef] [Scilit]
- Veluchamy, M.; Subramani, B. Brain tissue segmentation for medical decision support systems. J. Ambient. Intell. Humaniz. Comput. 2020, 12, 1851–1868. [Google Scholar] [CrossRef] [Scilit]
- Lian, J.; Hui, G.; Ma, L.; Zhu, T.; Wu, X.; Heidari, A.A.; Chen, Y.; Chen, H. Parrot optimizer: Algorithm and applications to medical problems. Comput. Biol. Med. 2024, 172, 108064. [Google Scholar] [CrossRef] [Scilit]
- Luo, W.; Lin, X.; Li, C.; Yang, S.; Shi, Y. Benchmark functions for CEC 2022 competition on seeking multiple optima in dynamic environments. arXiv 2022, arXiv:2201.00523. [Google Scholar] [CrossRef] [Scilit]
- Fu, W.-Y. Adaptive-acceleration-empowered collaborative particle swarm optimization. Inf. Sci. 2025, 721, 122621. [Google Scholar] [CrossRef] [Scilit]
- Yu, M.; Xu, J.; Liang, W.; Qiu, Y.; Bao, S.; Tang, L. Improved multi-strategy adaptive Grey Wolf Optimization for practical engineering applications and high-dimensional problem solving. Artif. Intell. Rev. 2024, 57, 277. [Google Scholar] [CrossRef] [Scilit]
- Almutairi, S.Z.; Shaheen, A.M. A novel kangaroo escape optimizer for parameter estimation of solar photovoltaic cells/modules via one, two and three-diode equivalent circuit modeling. Sci. Rep. 2025, 15, 32669. [Google Scholar] [CrossRef] [Scilit]
- Mohammed, B.O.; Aghdasi, H.S.; Salehpour, P. Dhole optimization algorithm: A new metaheuristic algorithm for solving optimization problems. Clust. Comput. 2025, 28, 430. [Google Scholar] [CrossRef] [Scilit]
- Ghasemi, M.; Deriche, M.; Trojovský, P.; Mansor, Z.; Zare, M.; Trojovská, E.; Abualigah, L.; Ezugwu, A.E.; Mohammadi, S.K. An efficient bio-inspired algorithm based on humpback whale migration for constrained engineering optimization. Results Eng. 2025, 25, 104215. [Google Scholar] [CrossRef] [Scilit]
- Chen, T.; Yi, Y. Multi-Strategy Enhanced Parrot Optimizer: Global Optimization and Feature Selection. Biomimetics 2024, 9, 662. [Google Scholar] [CrossRef] [Scilit]
- Zhu, Q.; Gong, M.; Wang, Y.; Yang, Z. Multi-Threshold Image Segmentation Based on the Hybrid Strategy Improved Dingo Optimization Algorithm. Biomimetics 2026, 11, 52. [Google Scholar] [CrossRef] [Scilit]
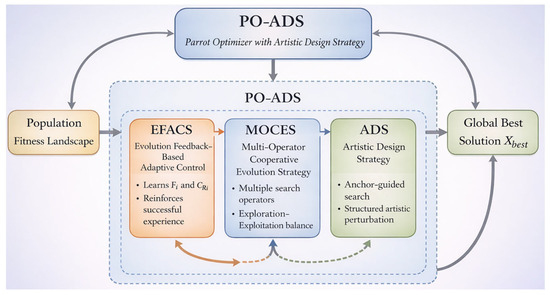
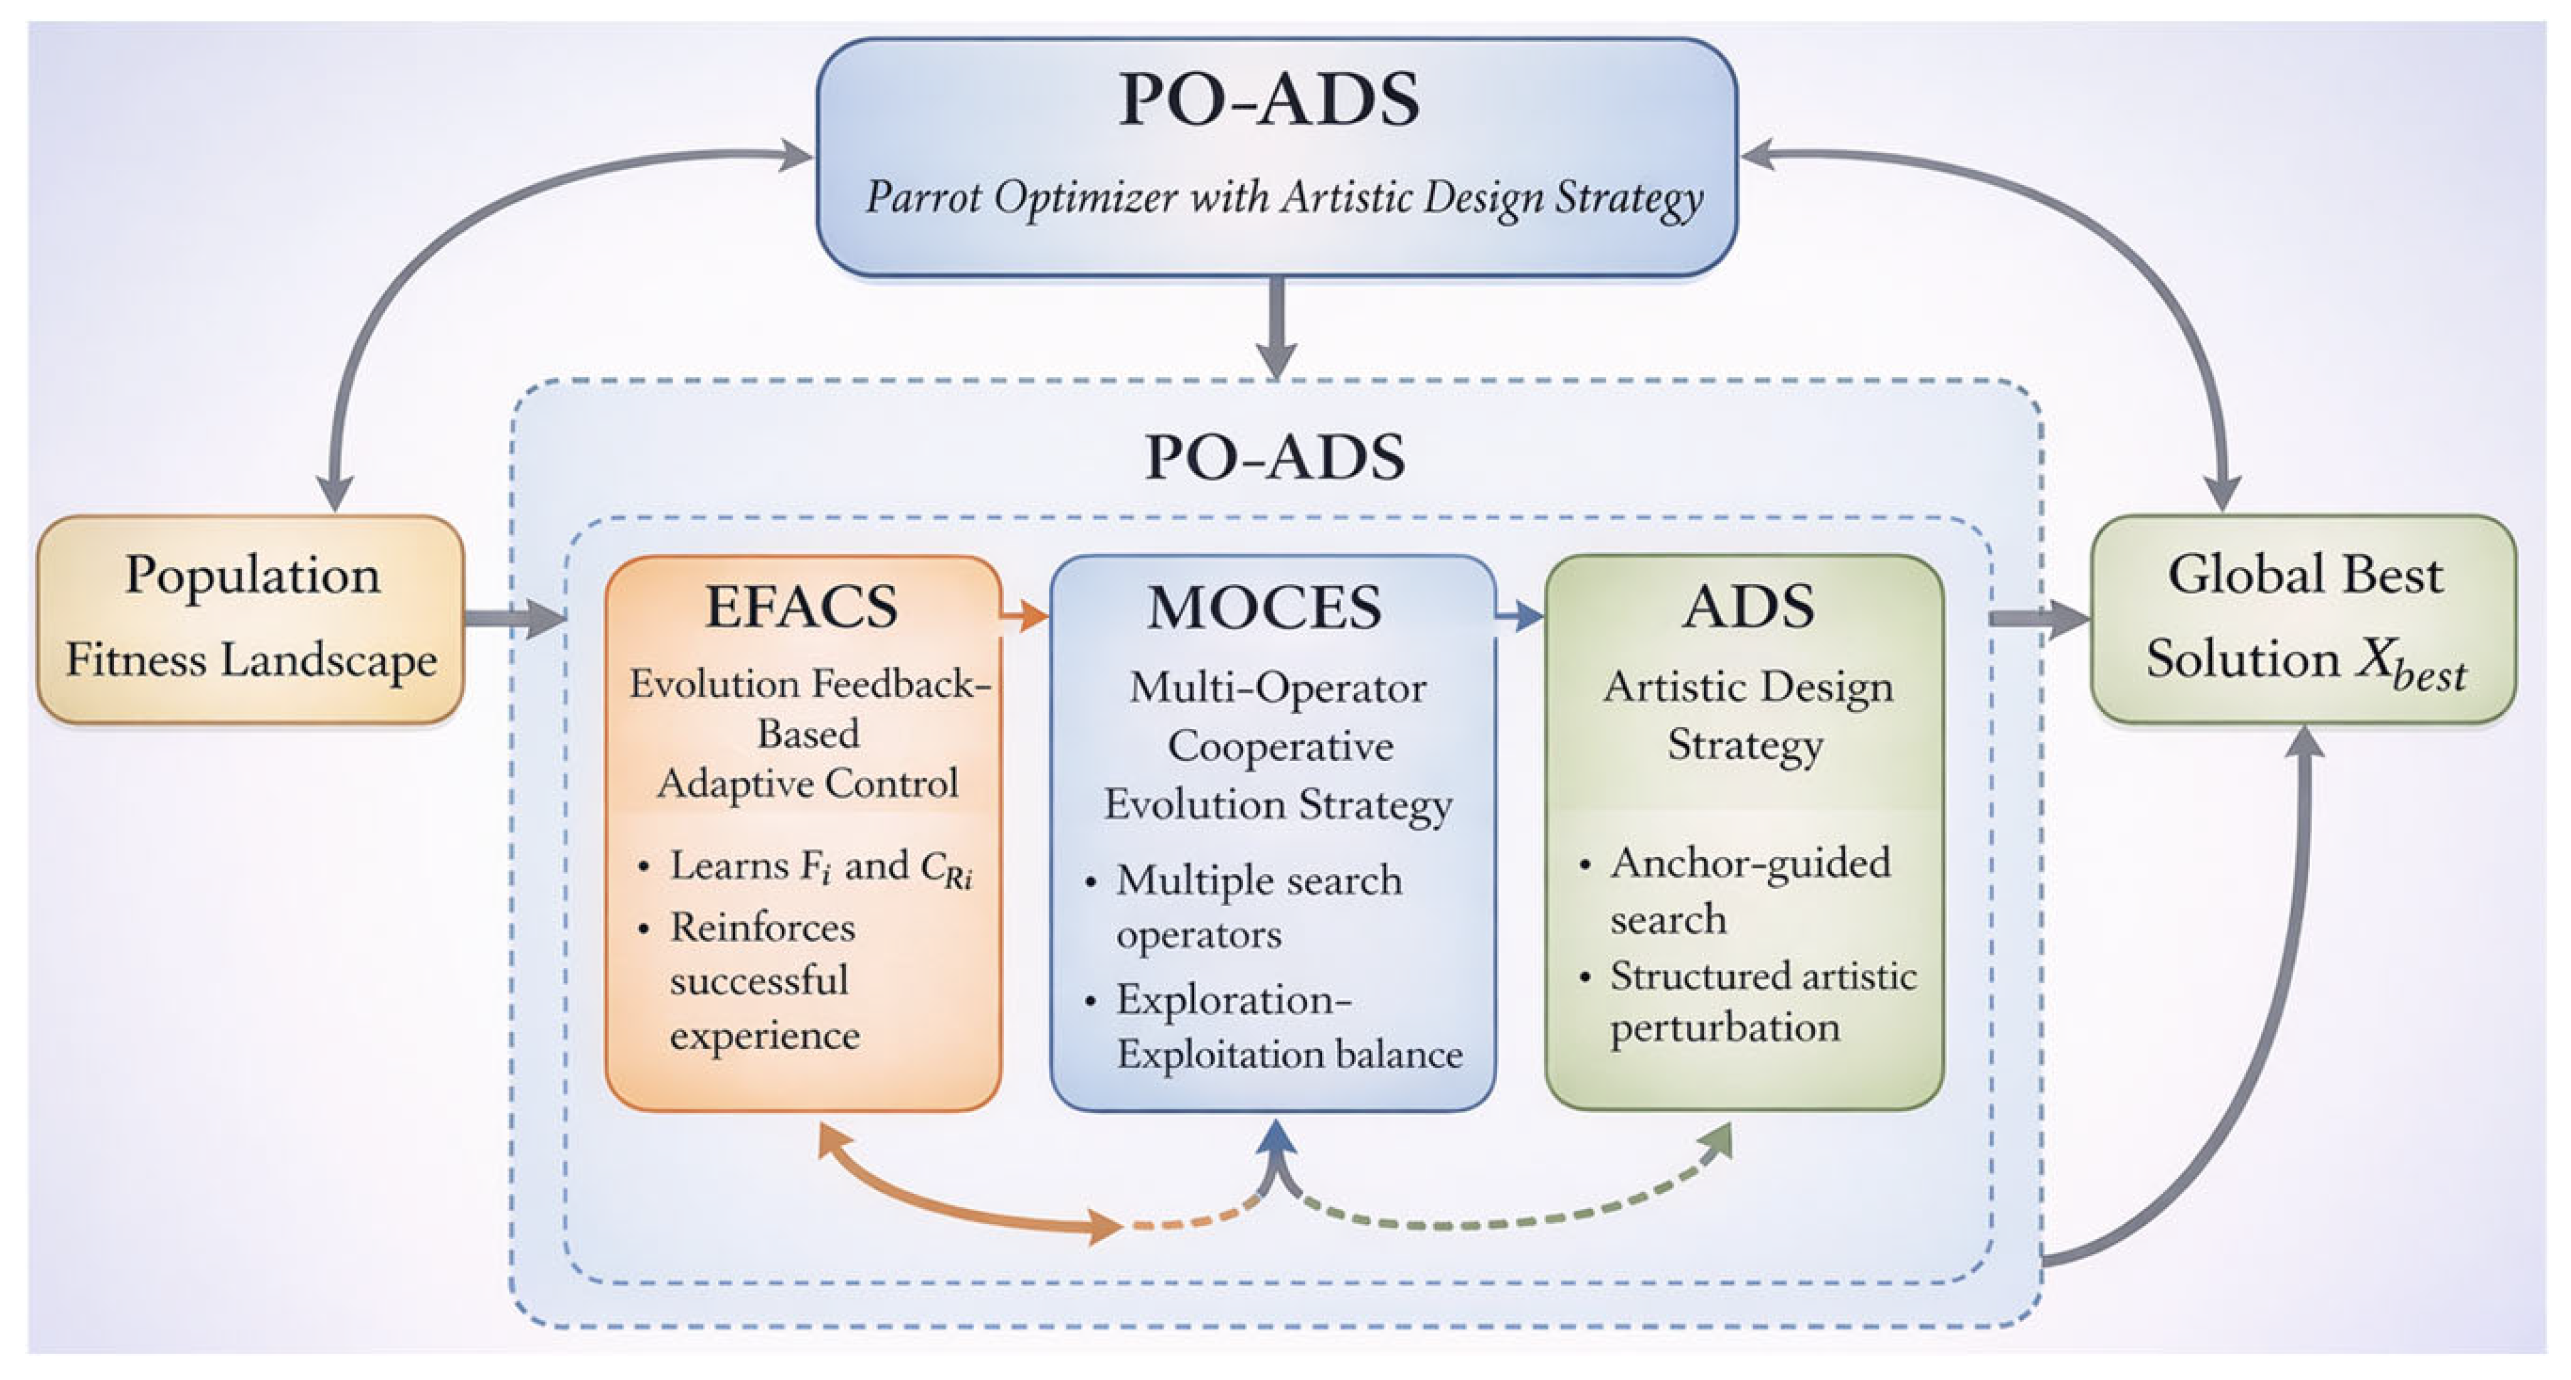
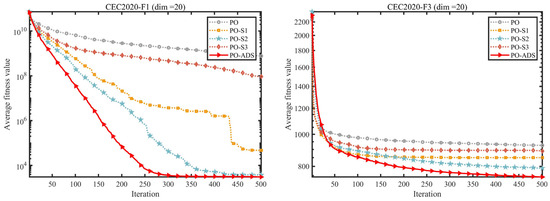
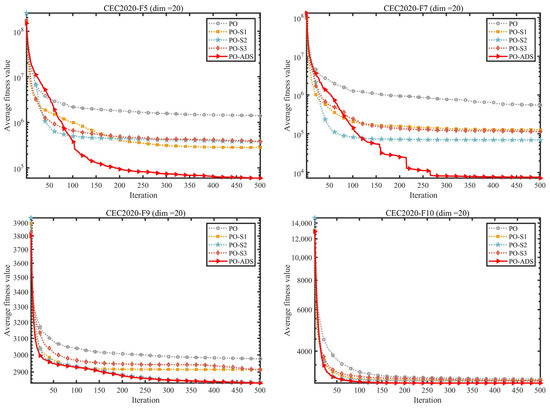
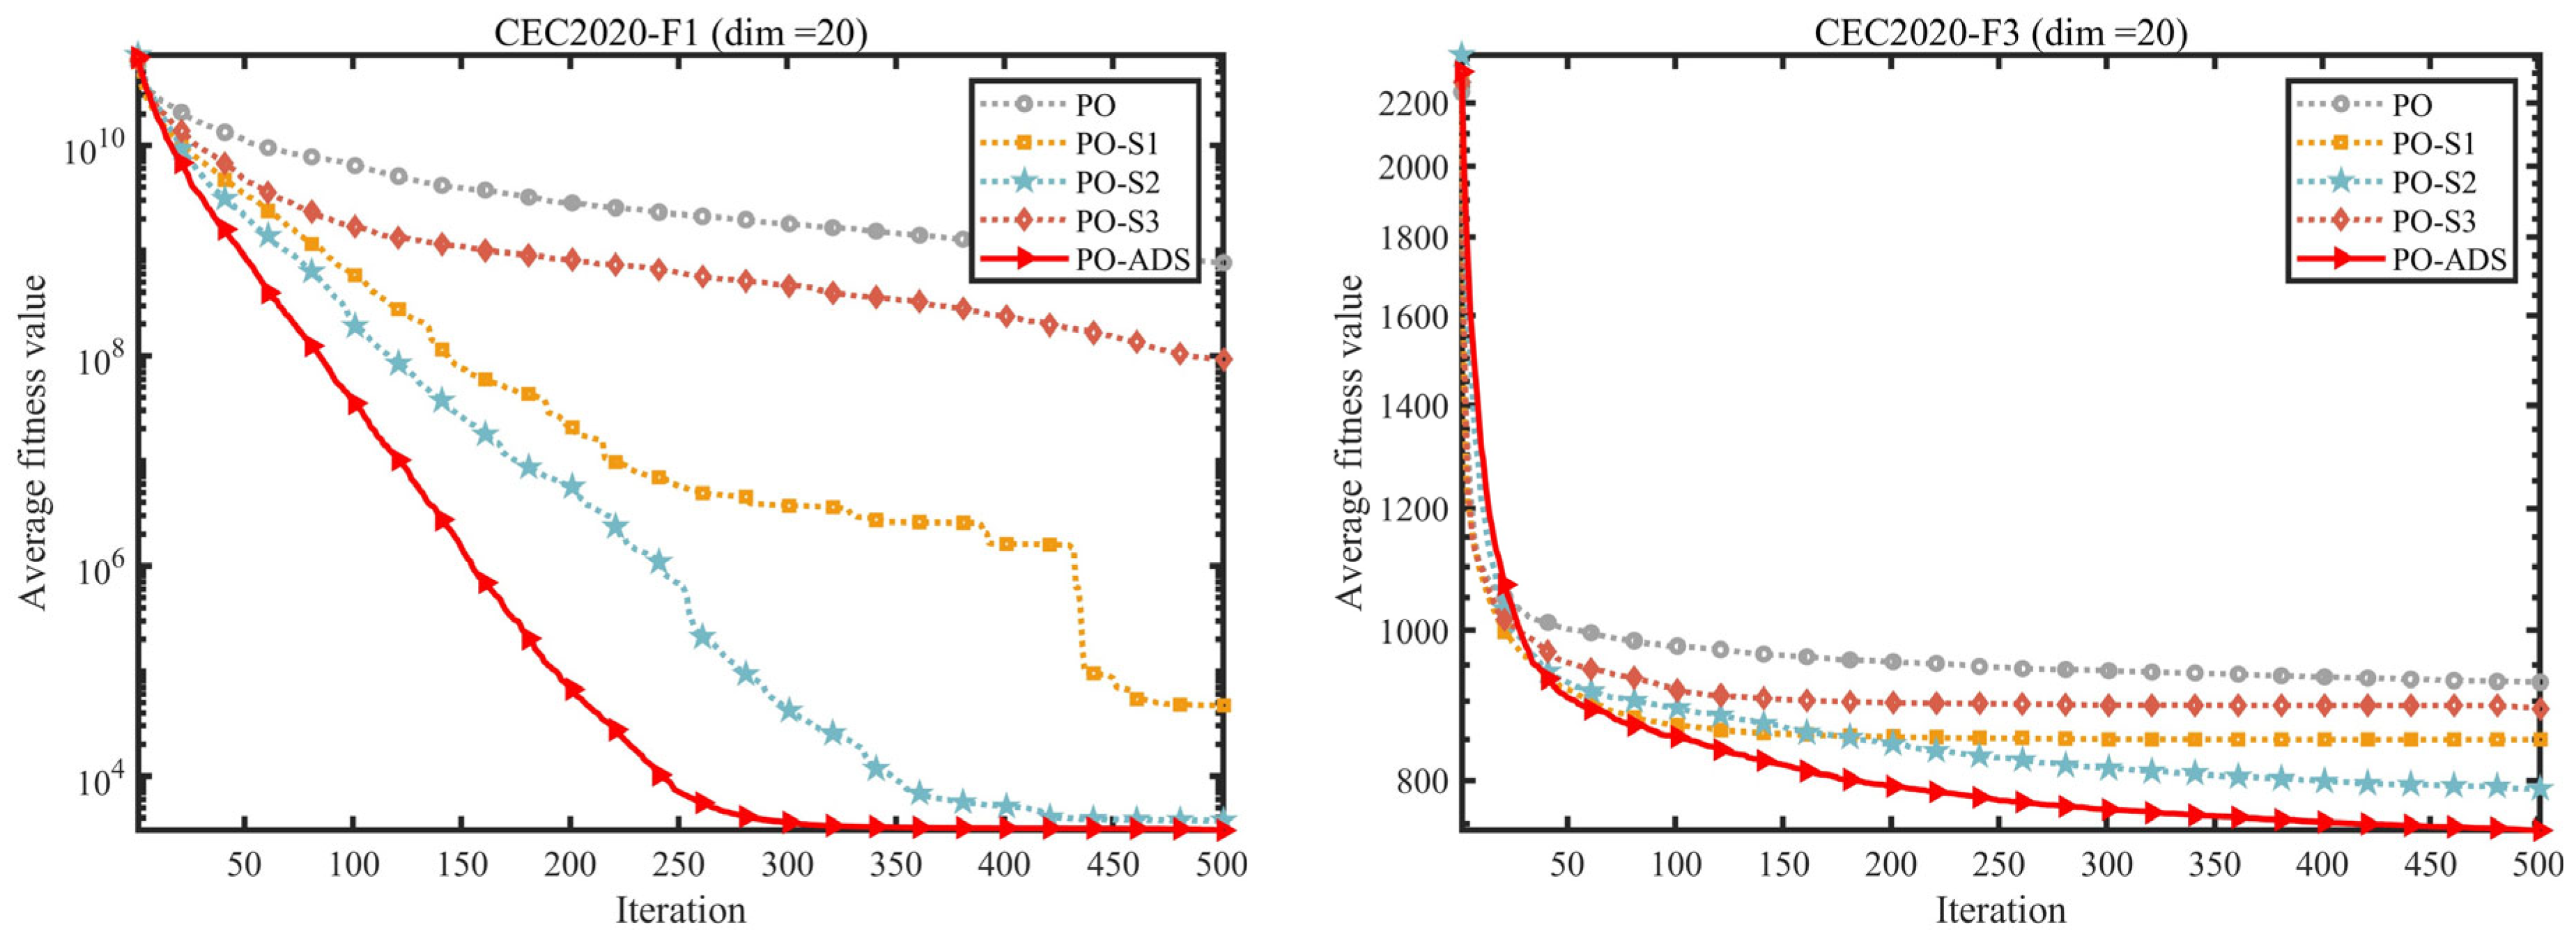
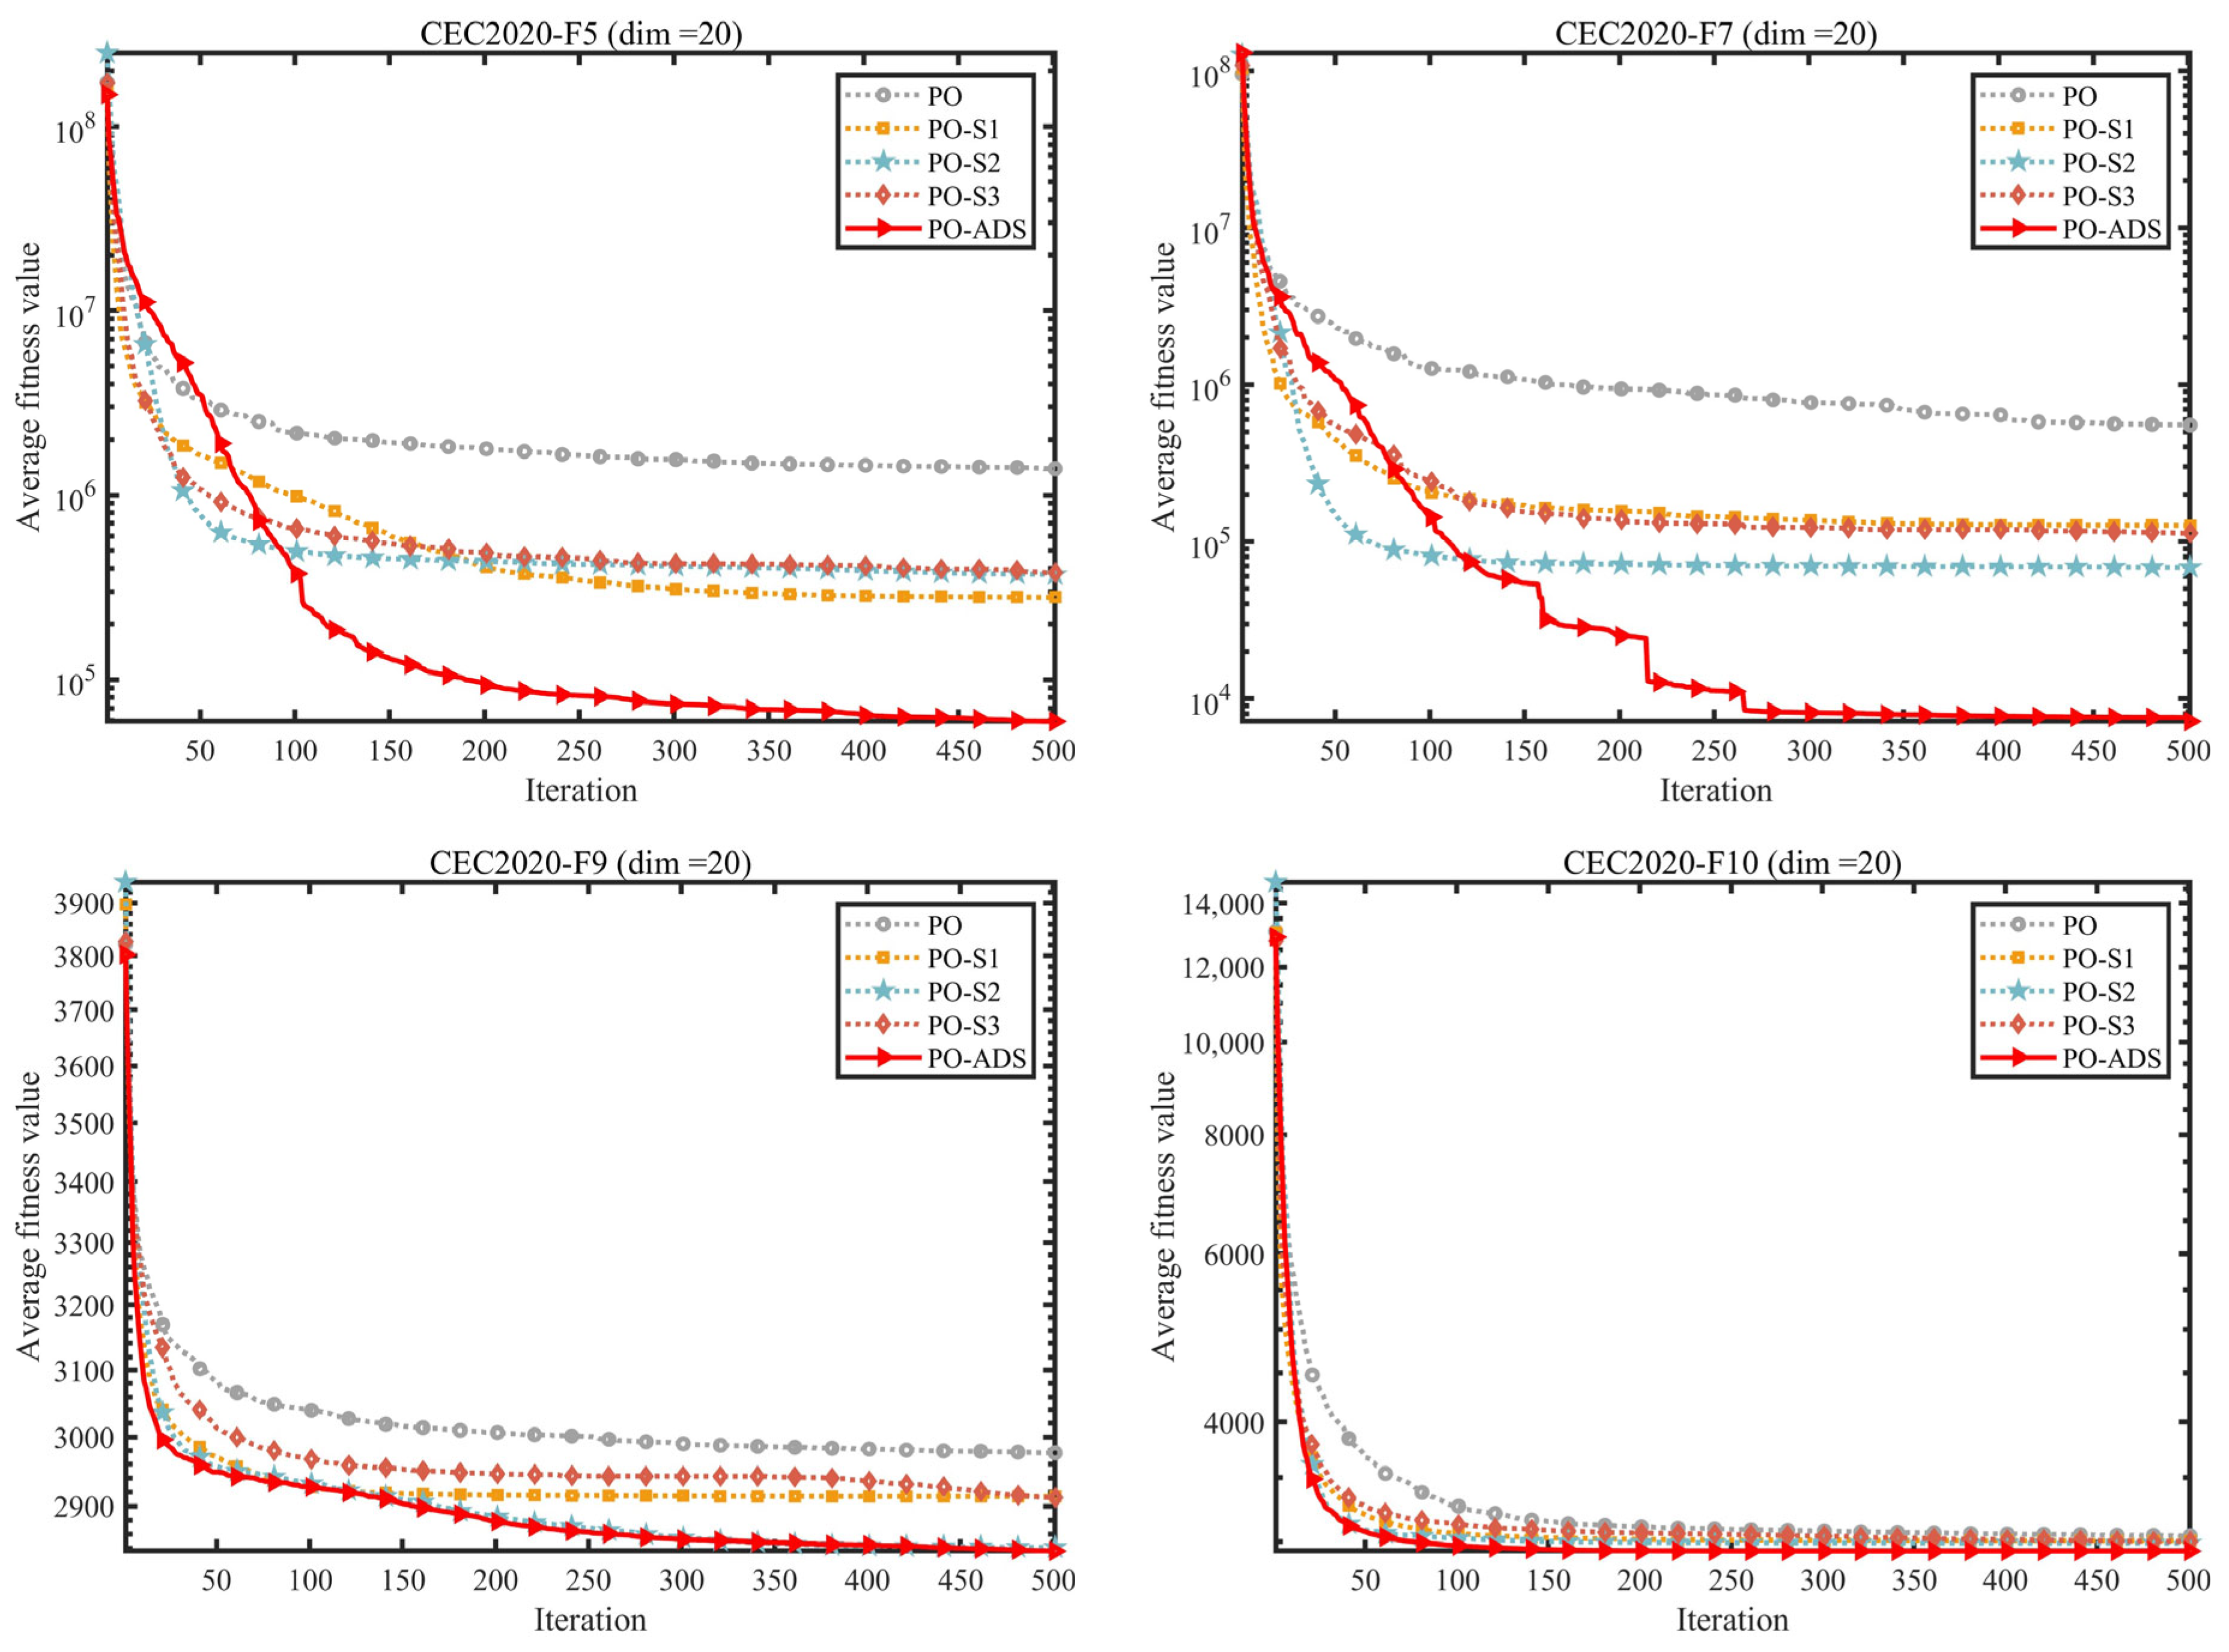
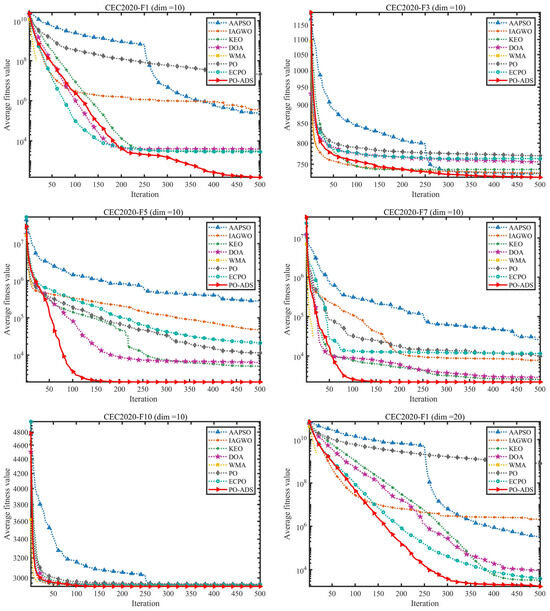
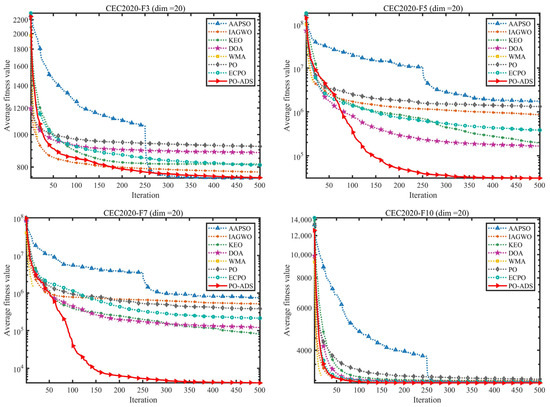
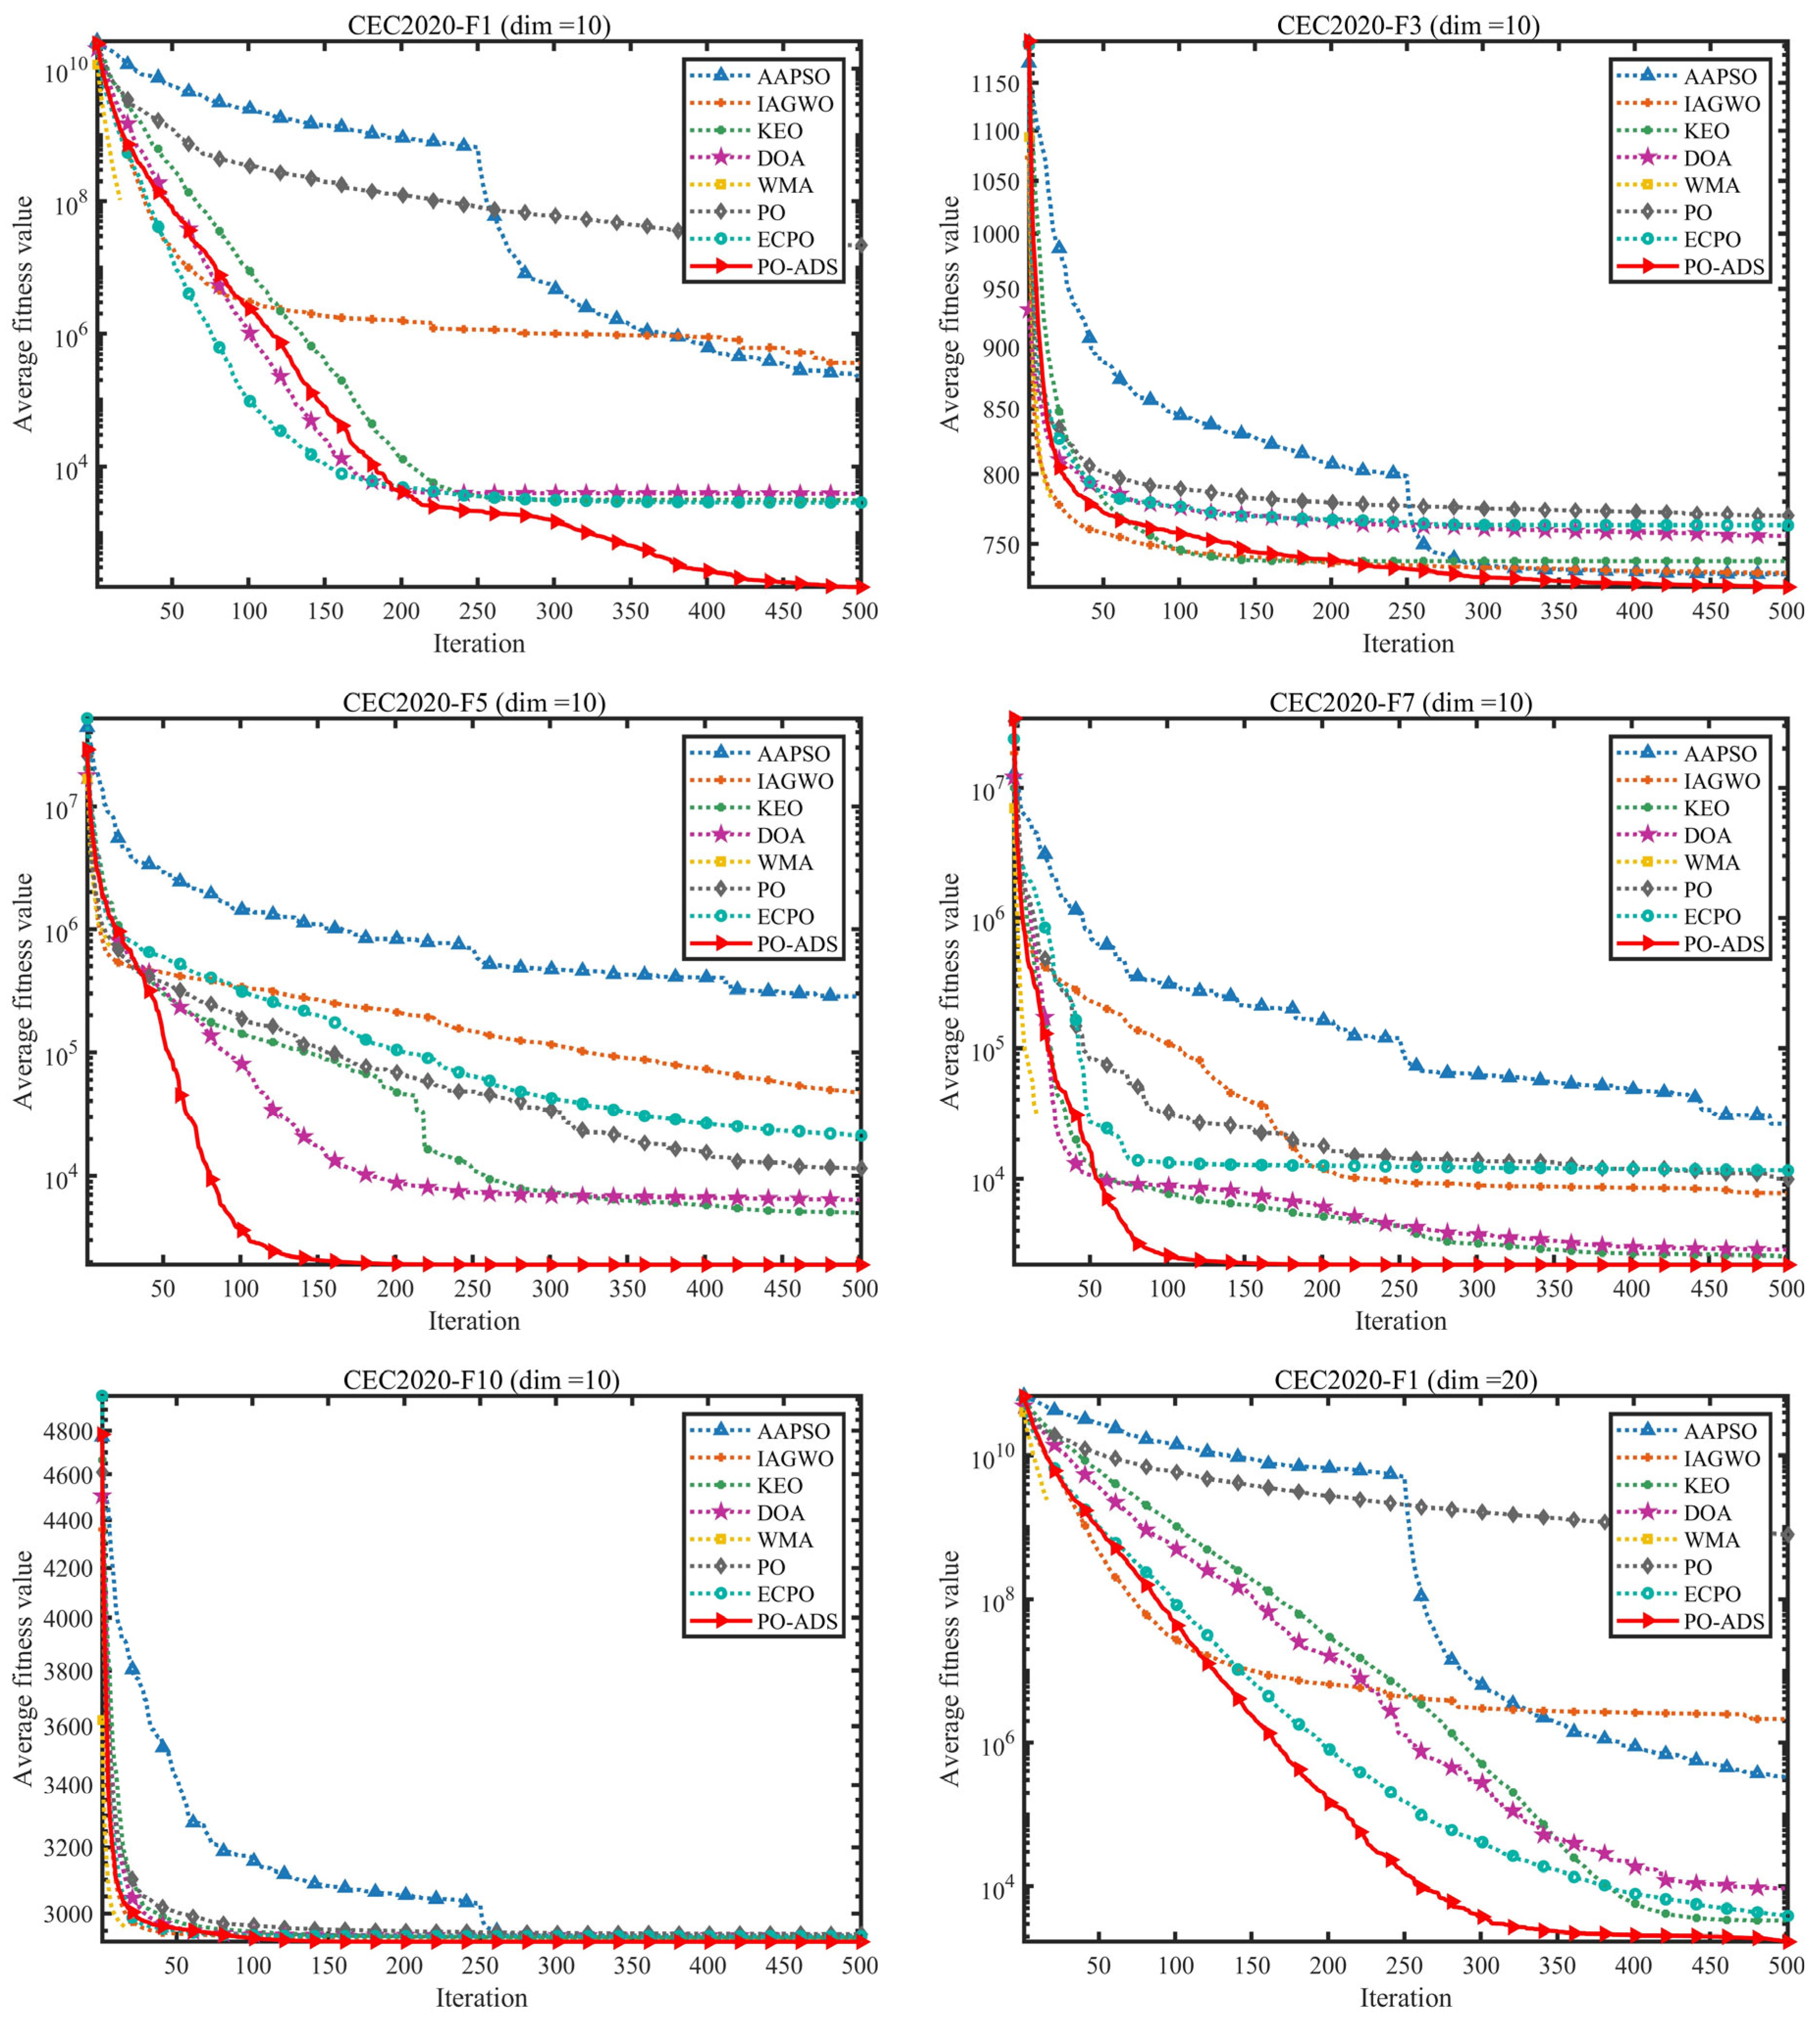
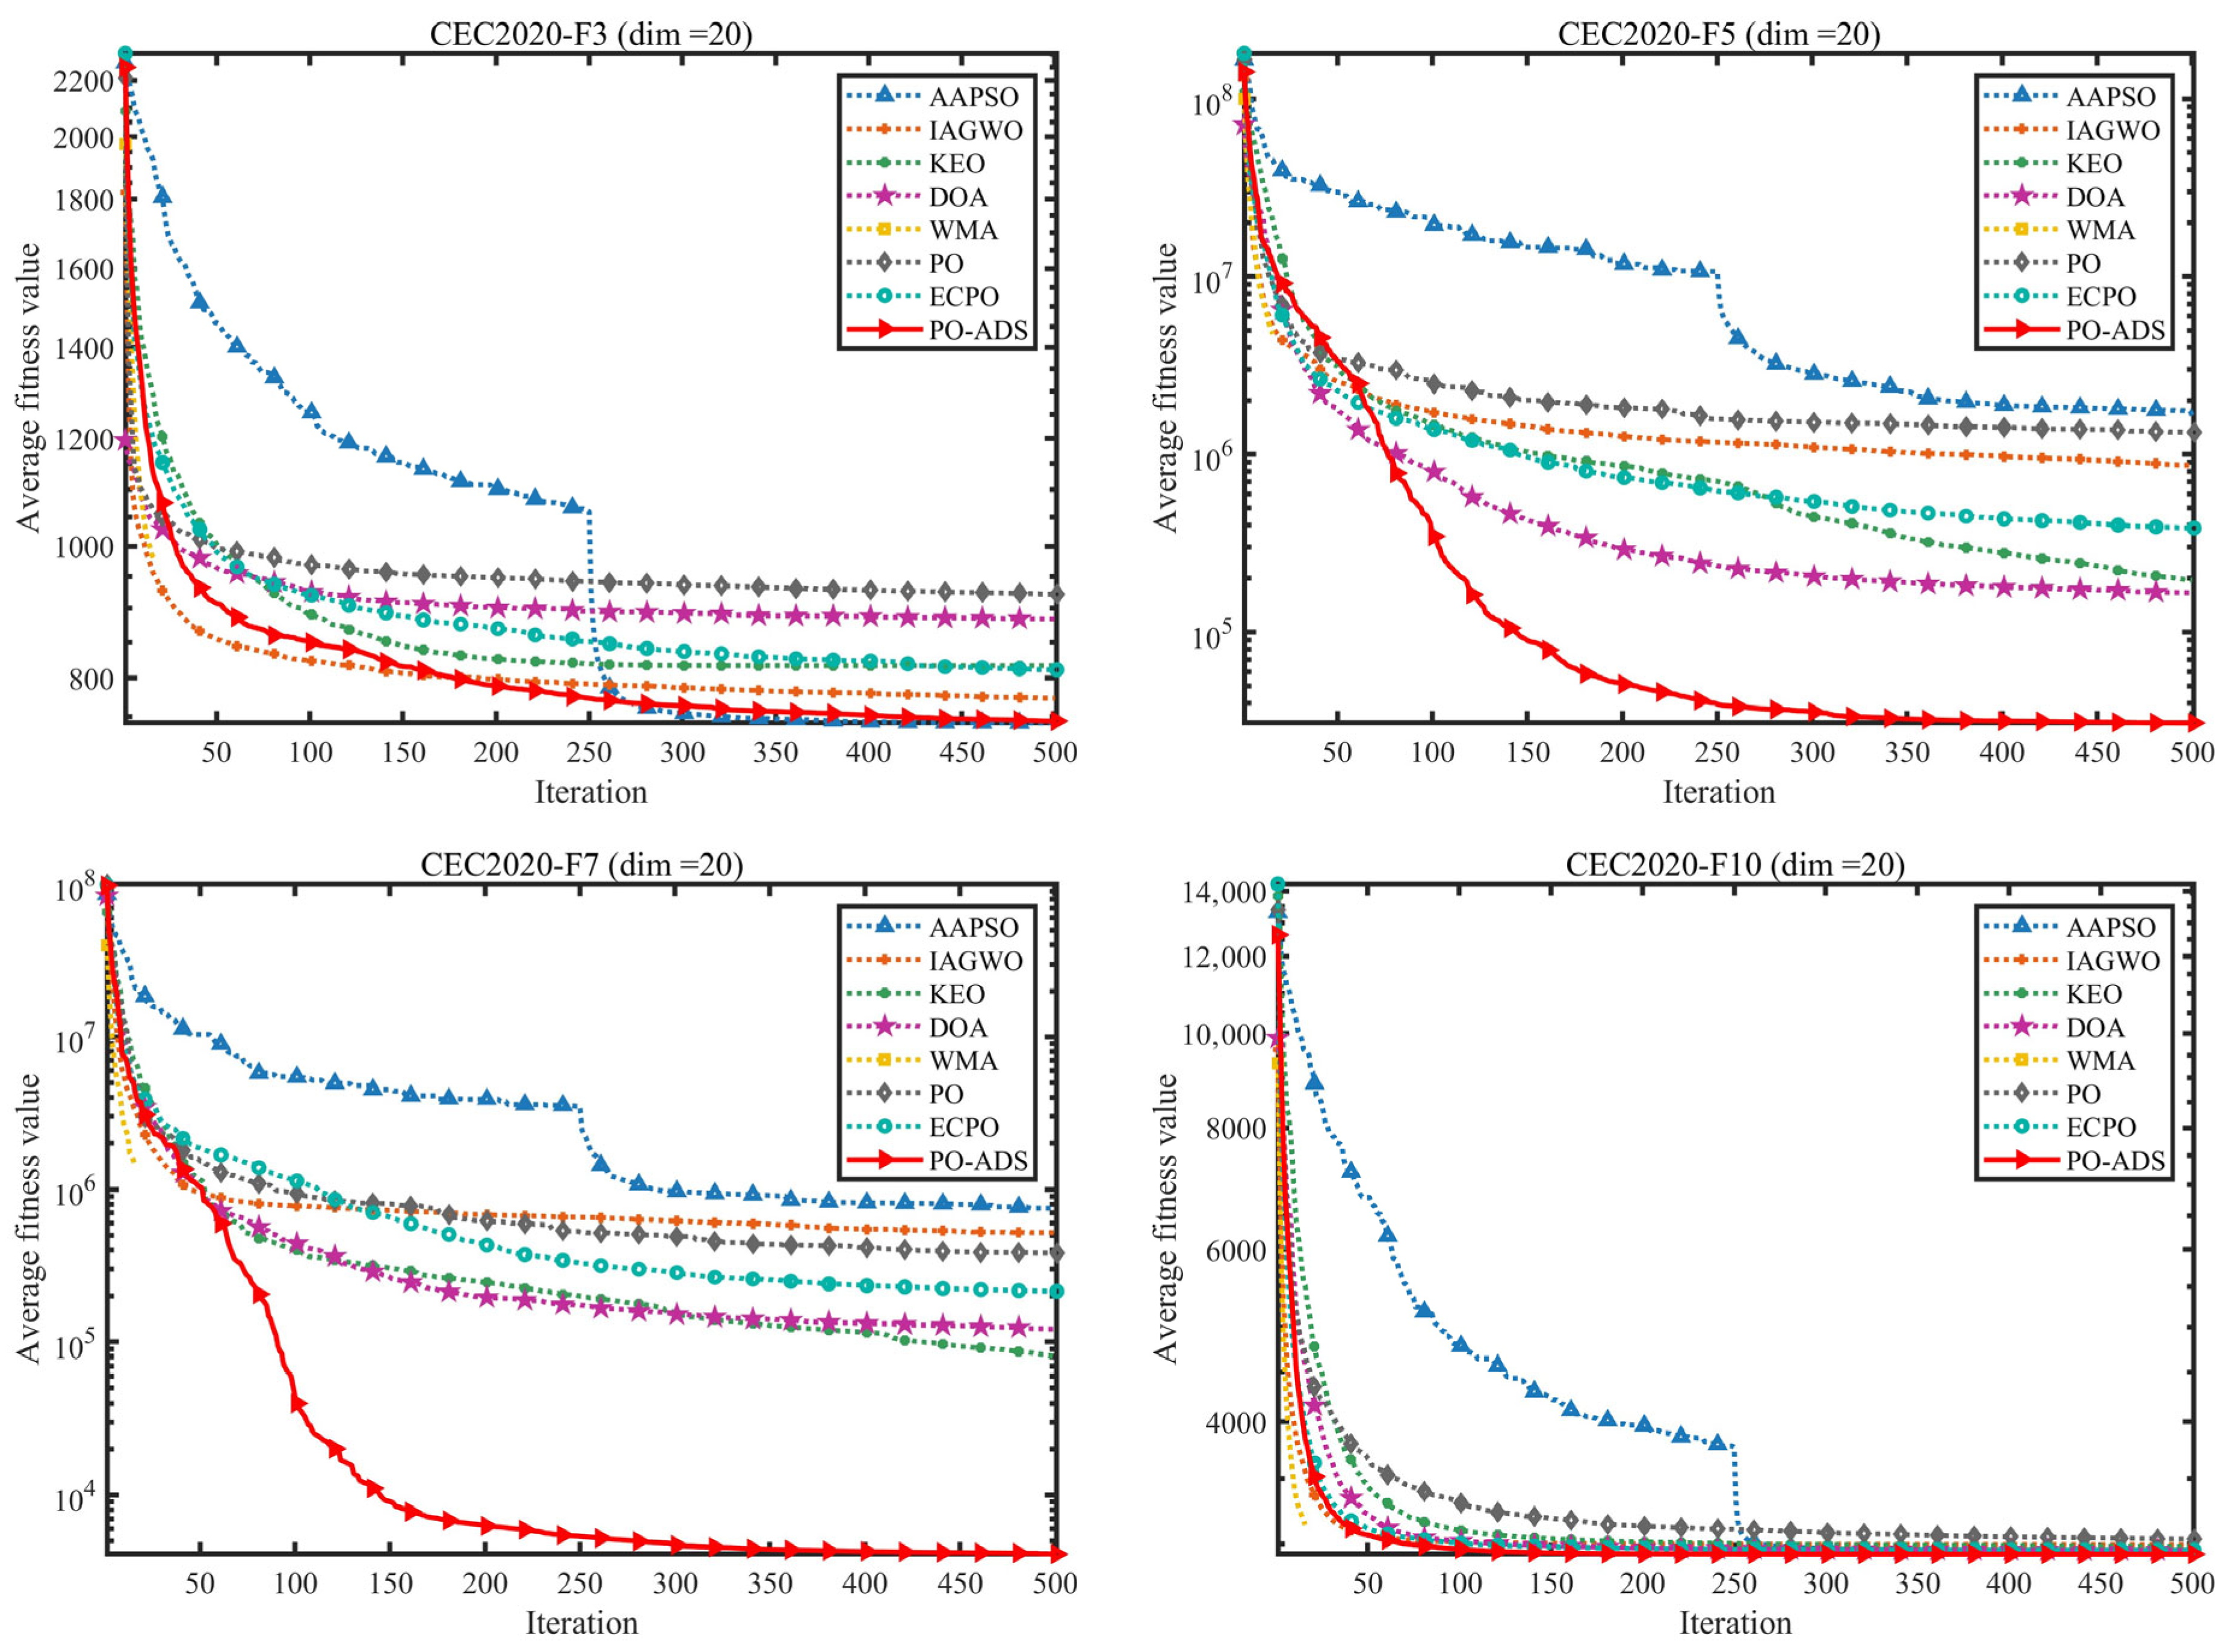
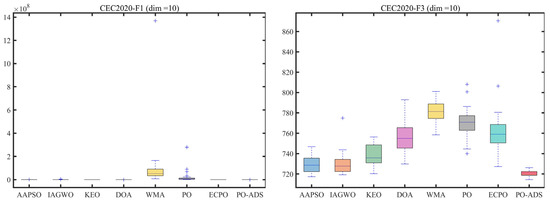
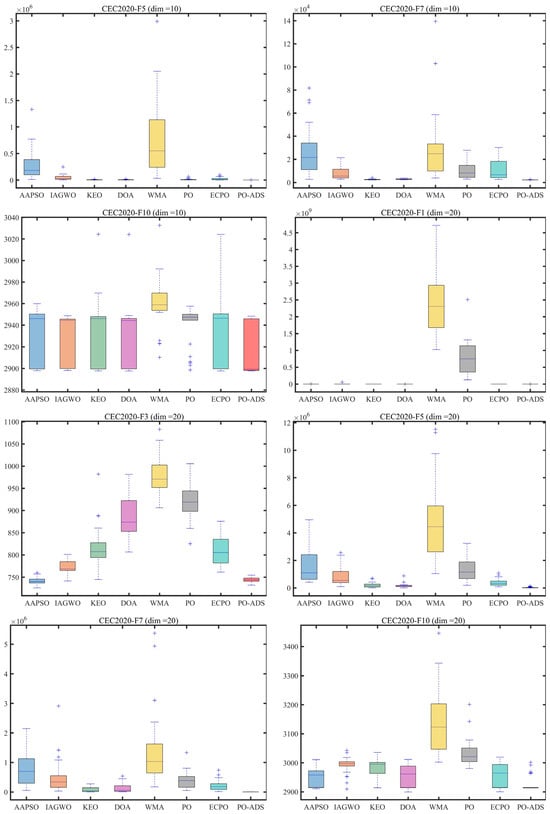
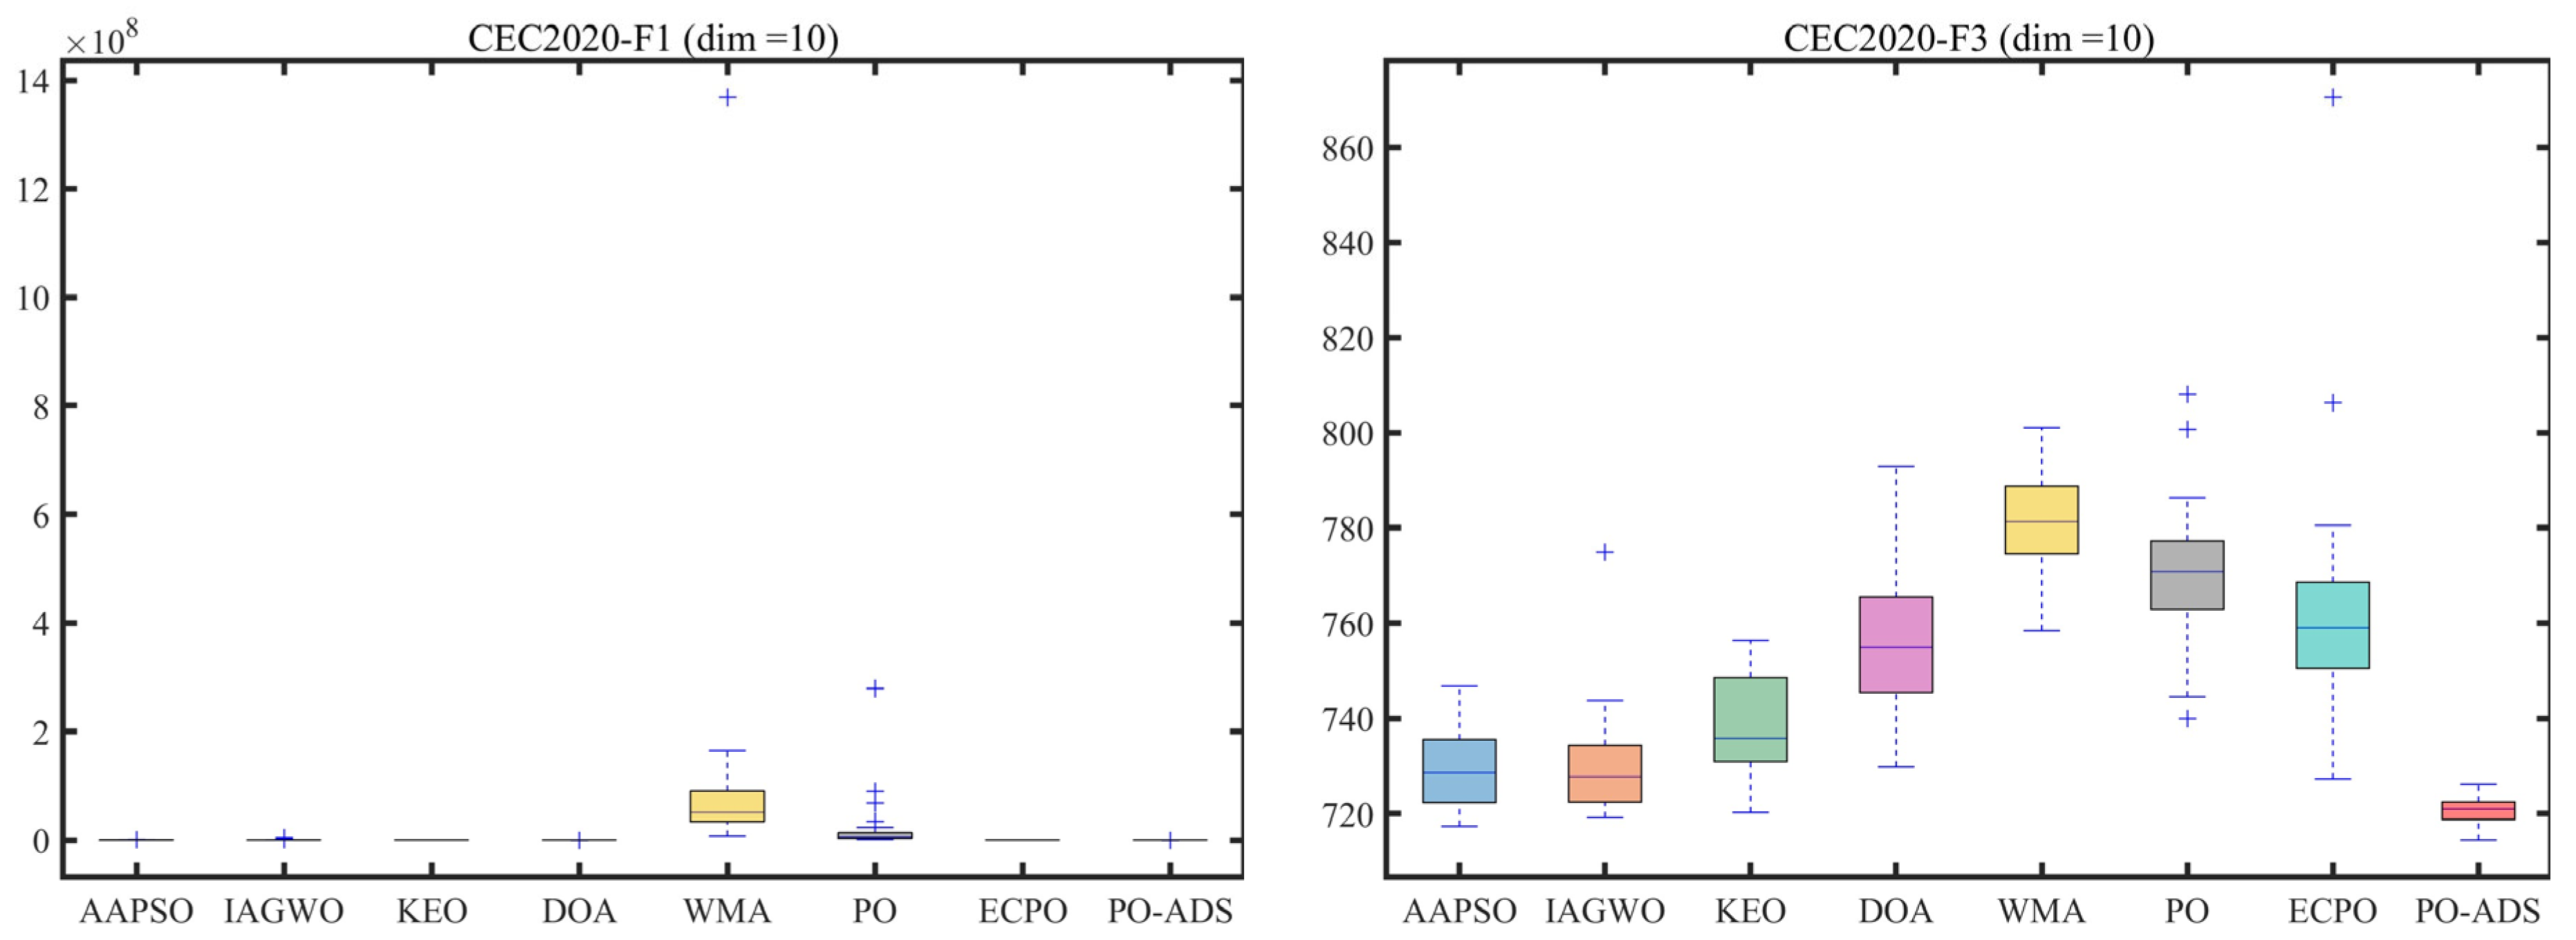
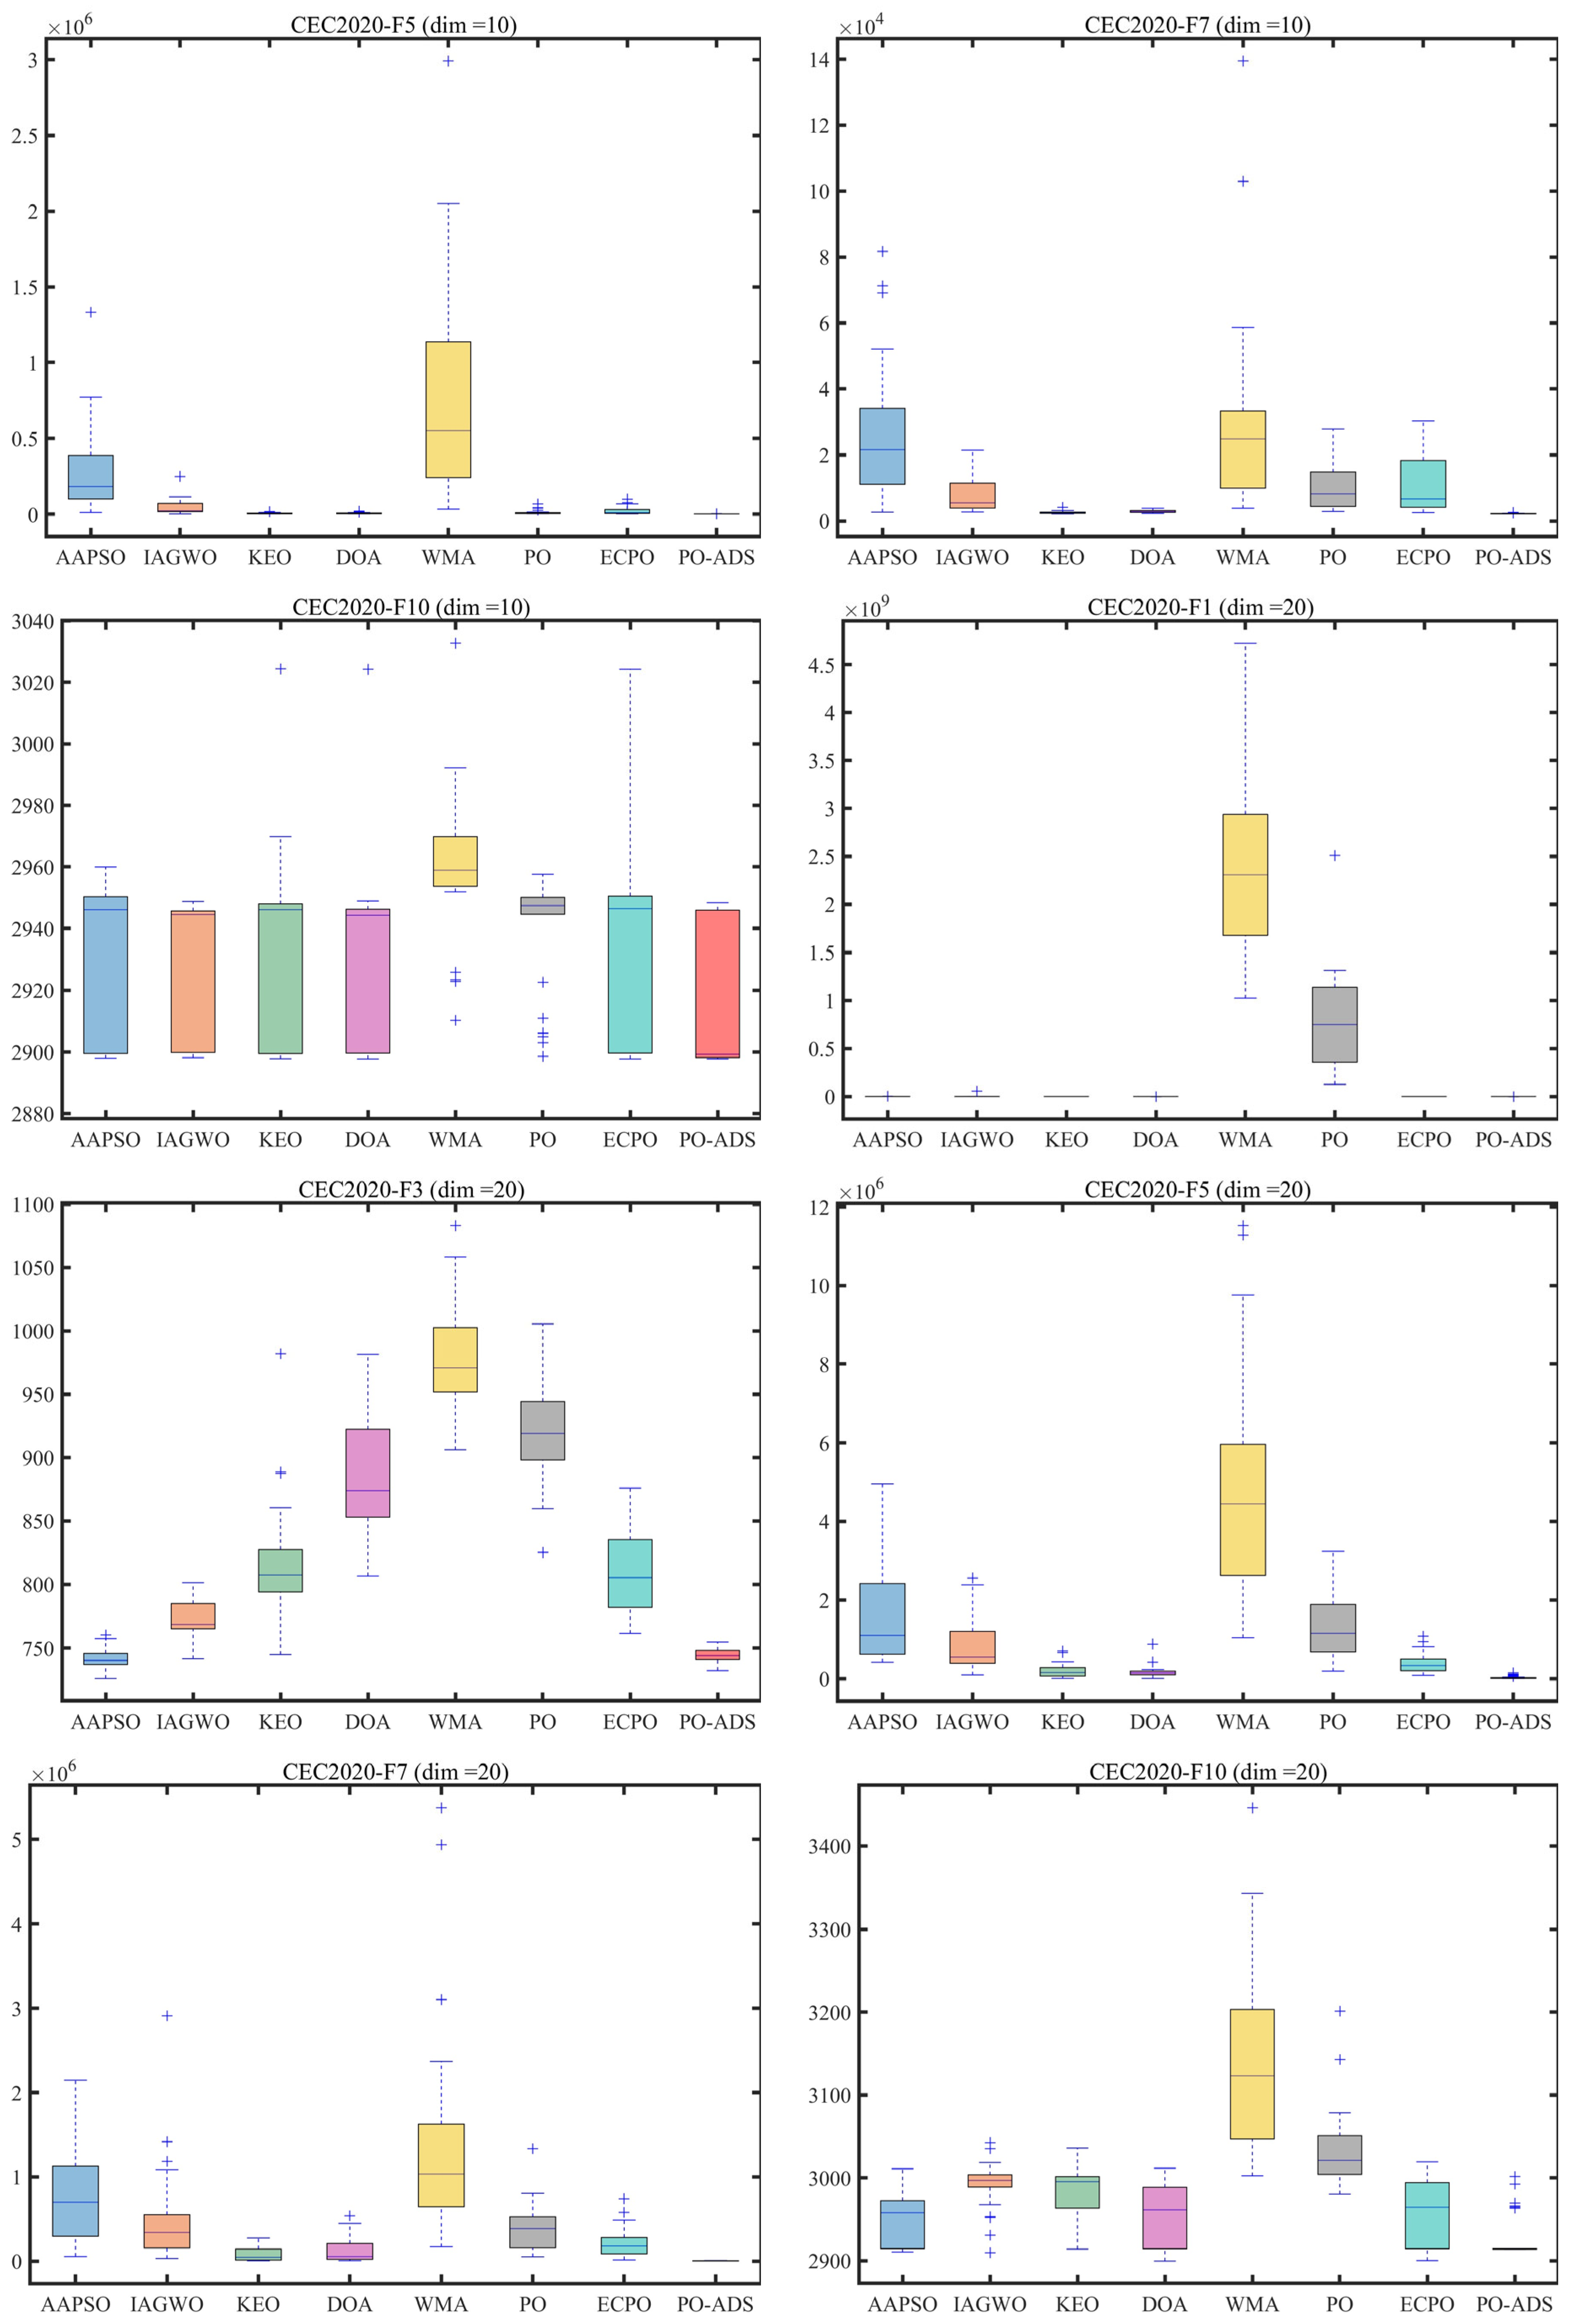
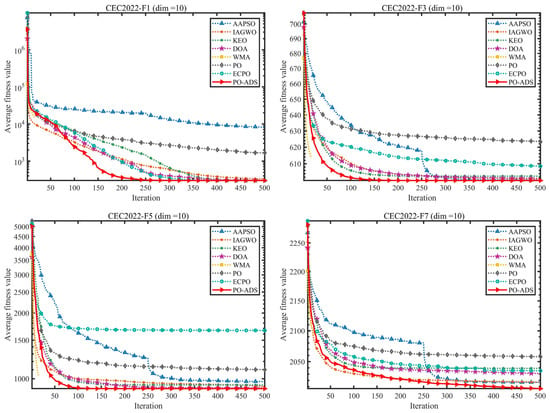
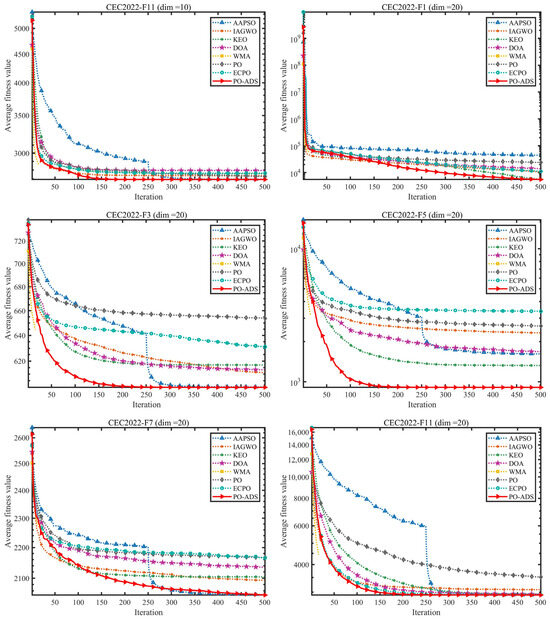
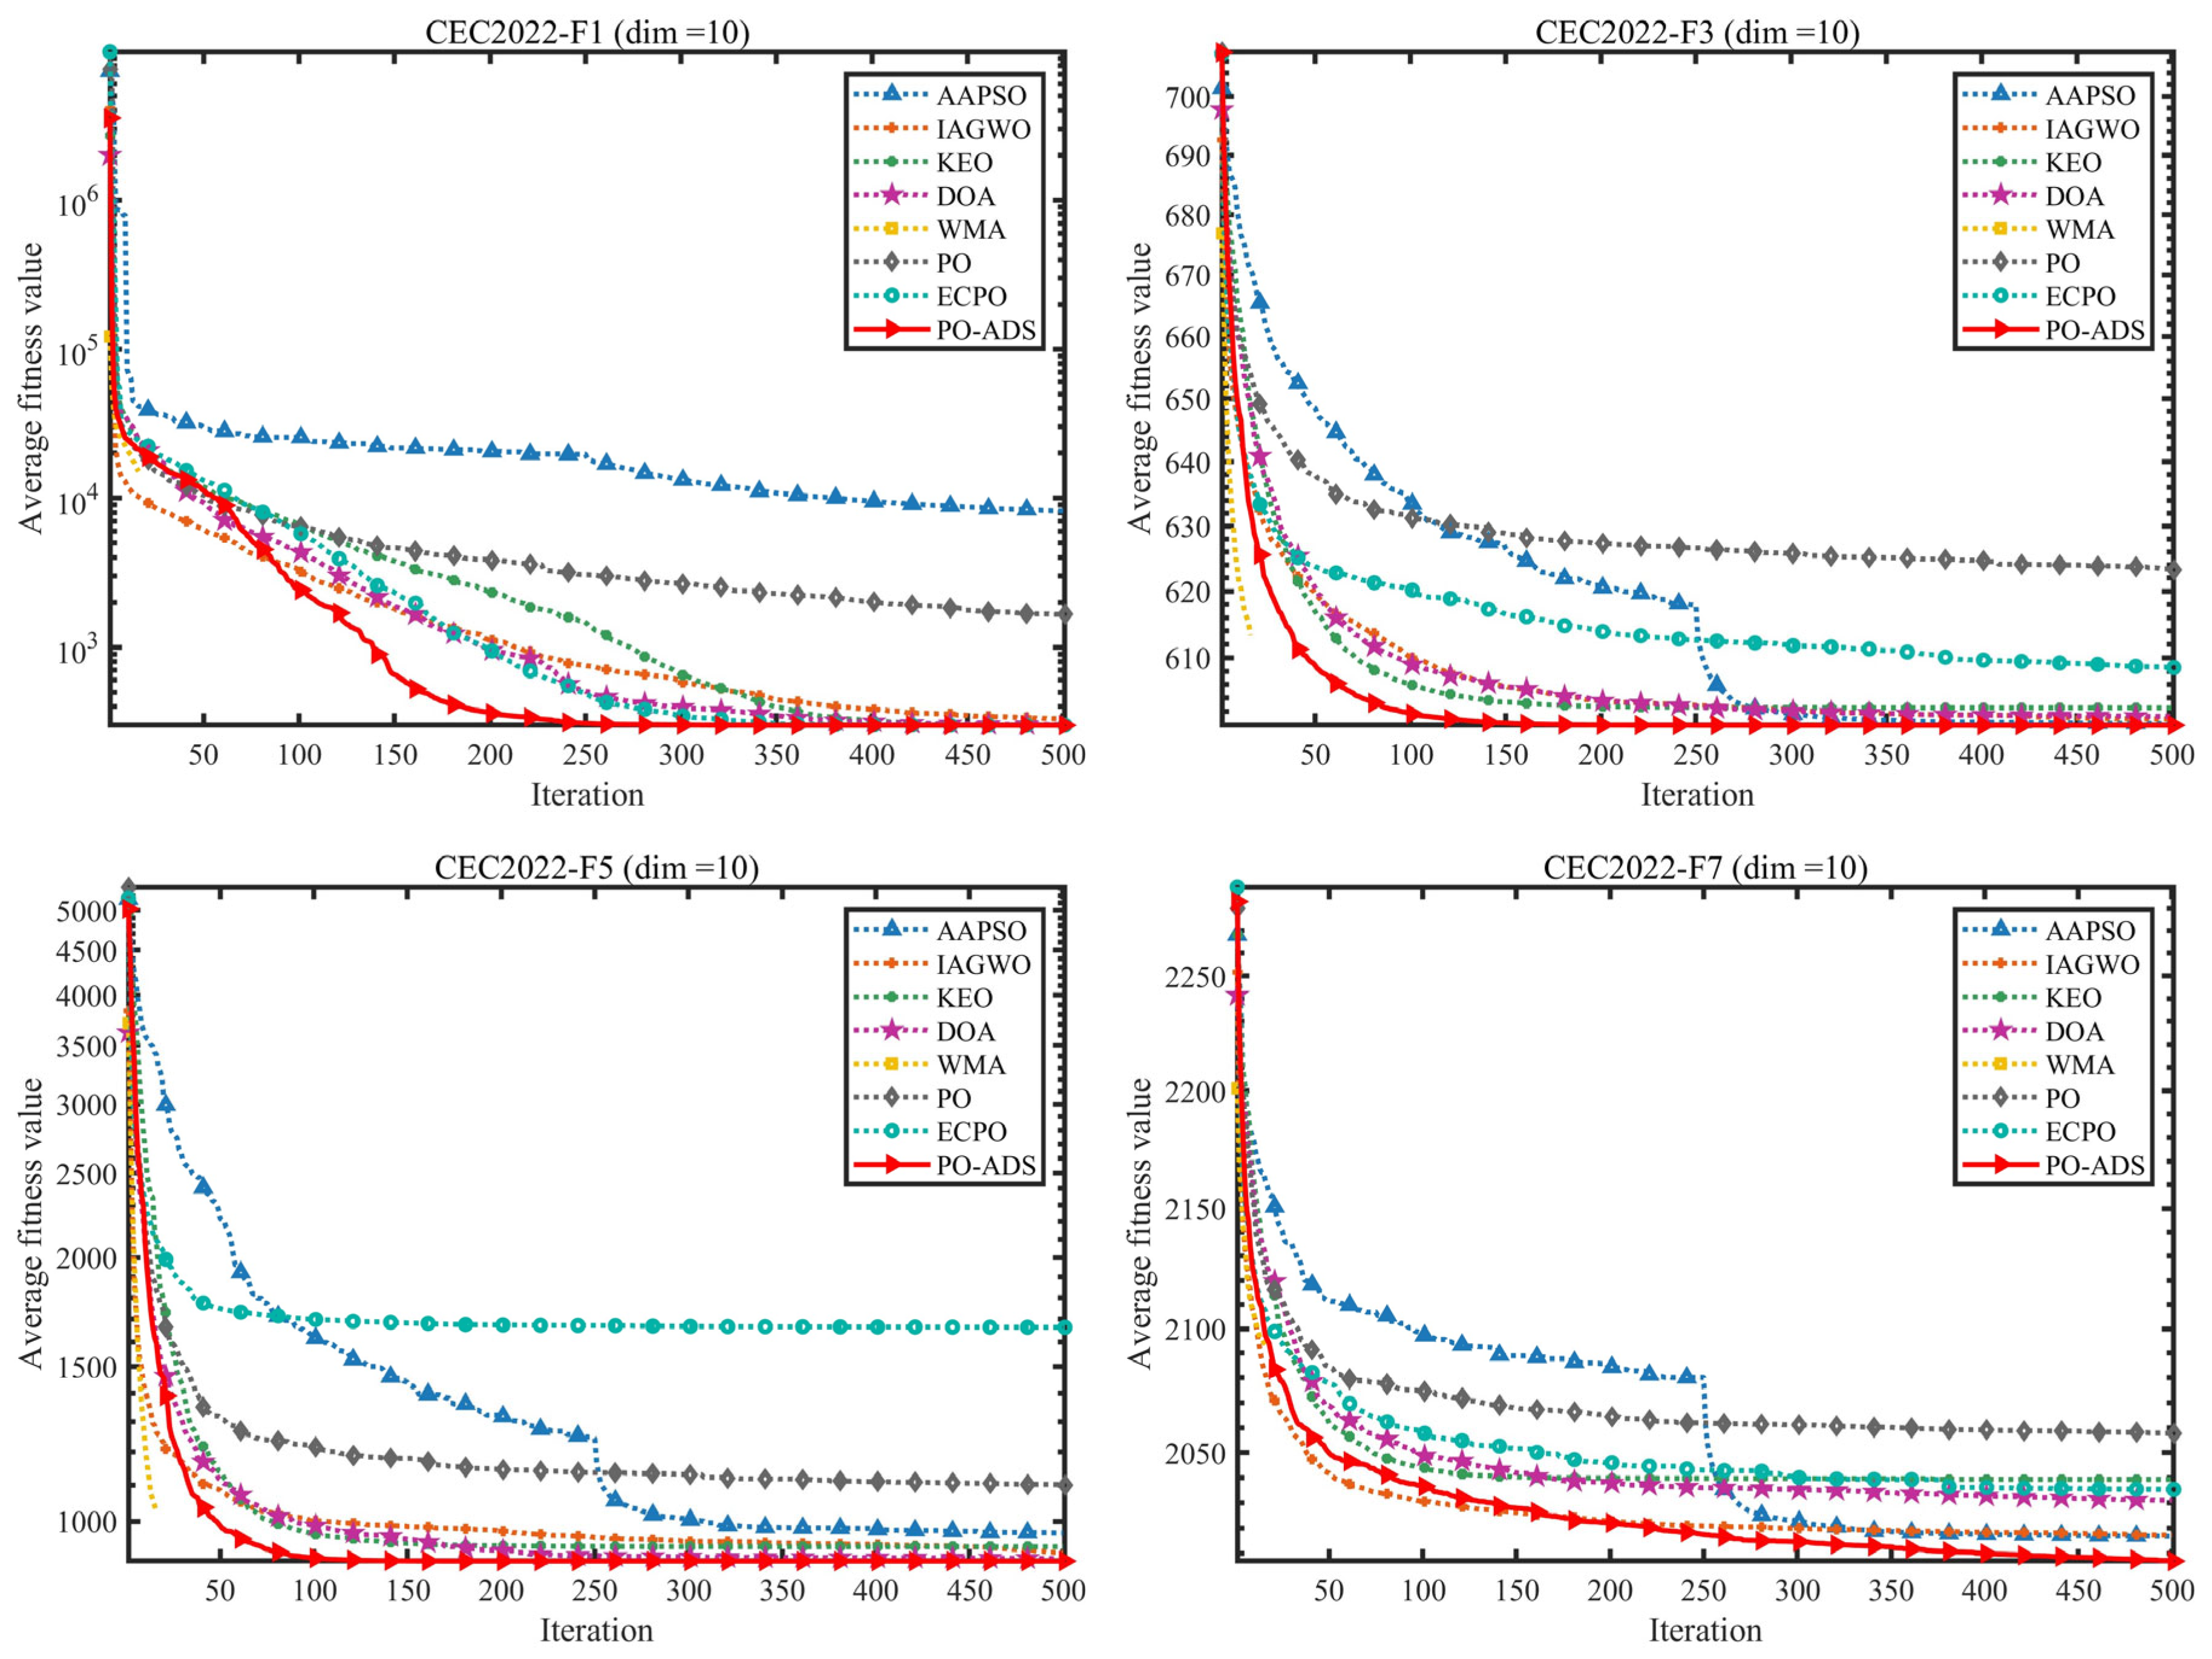
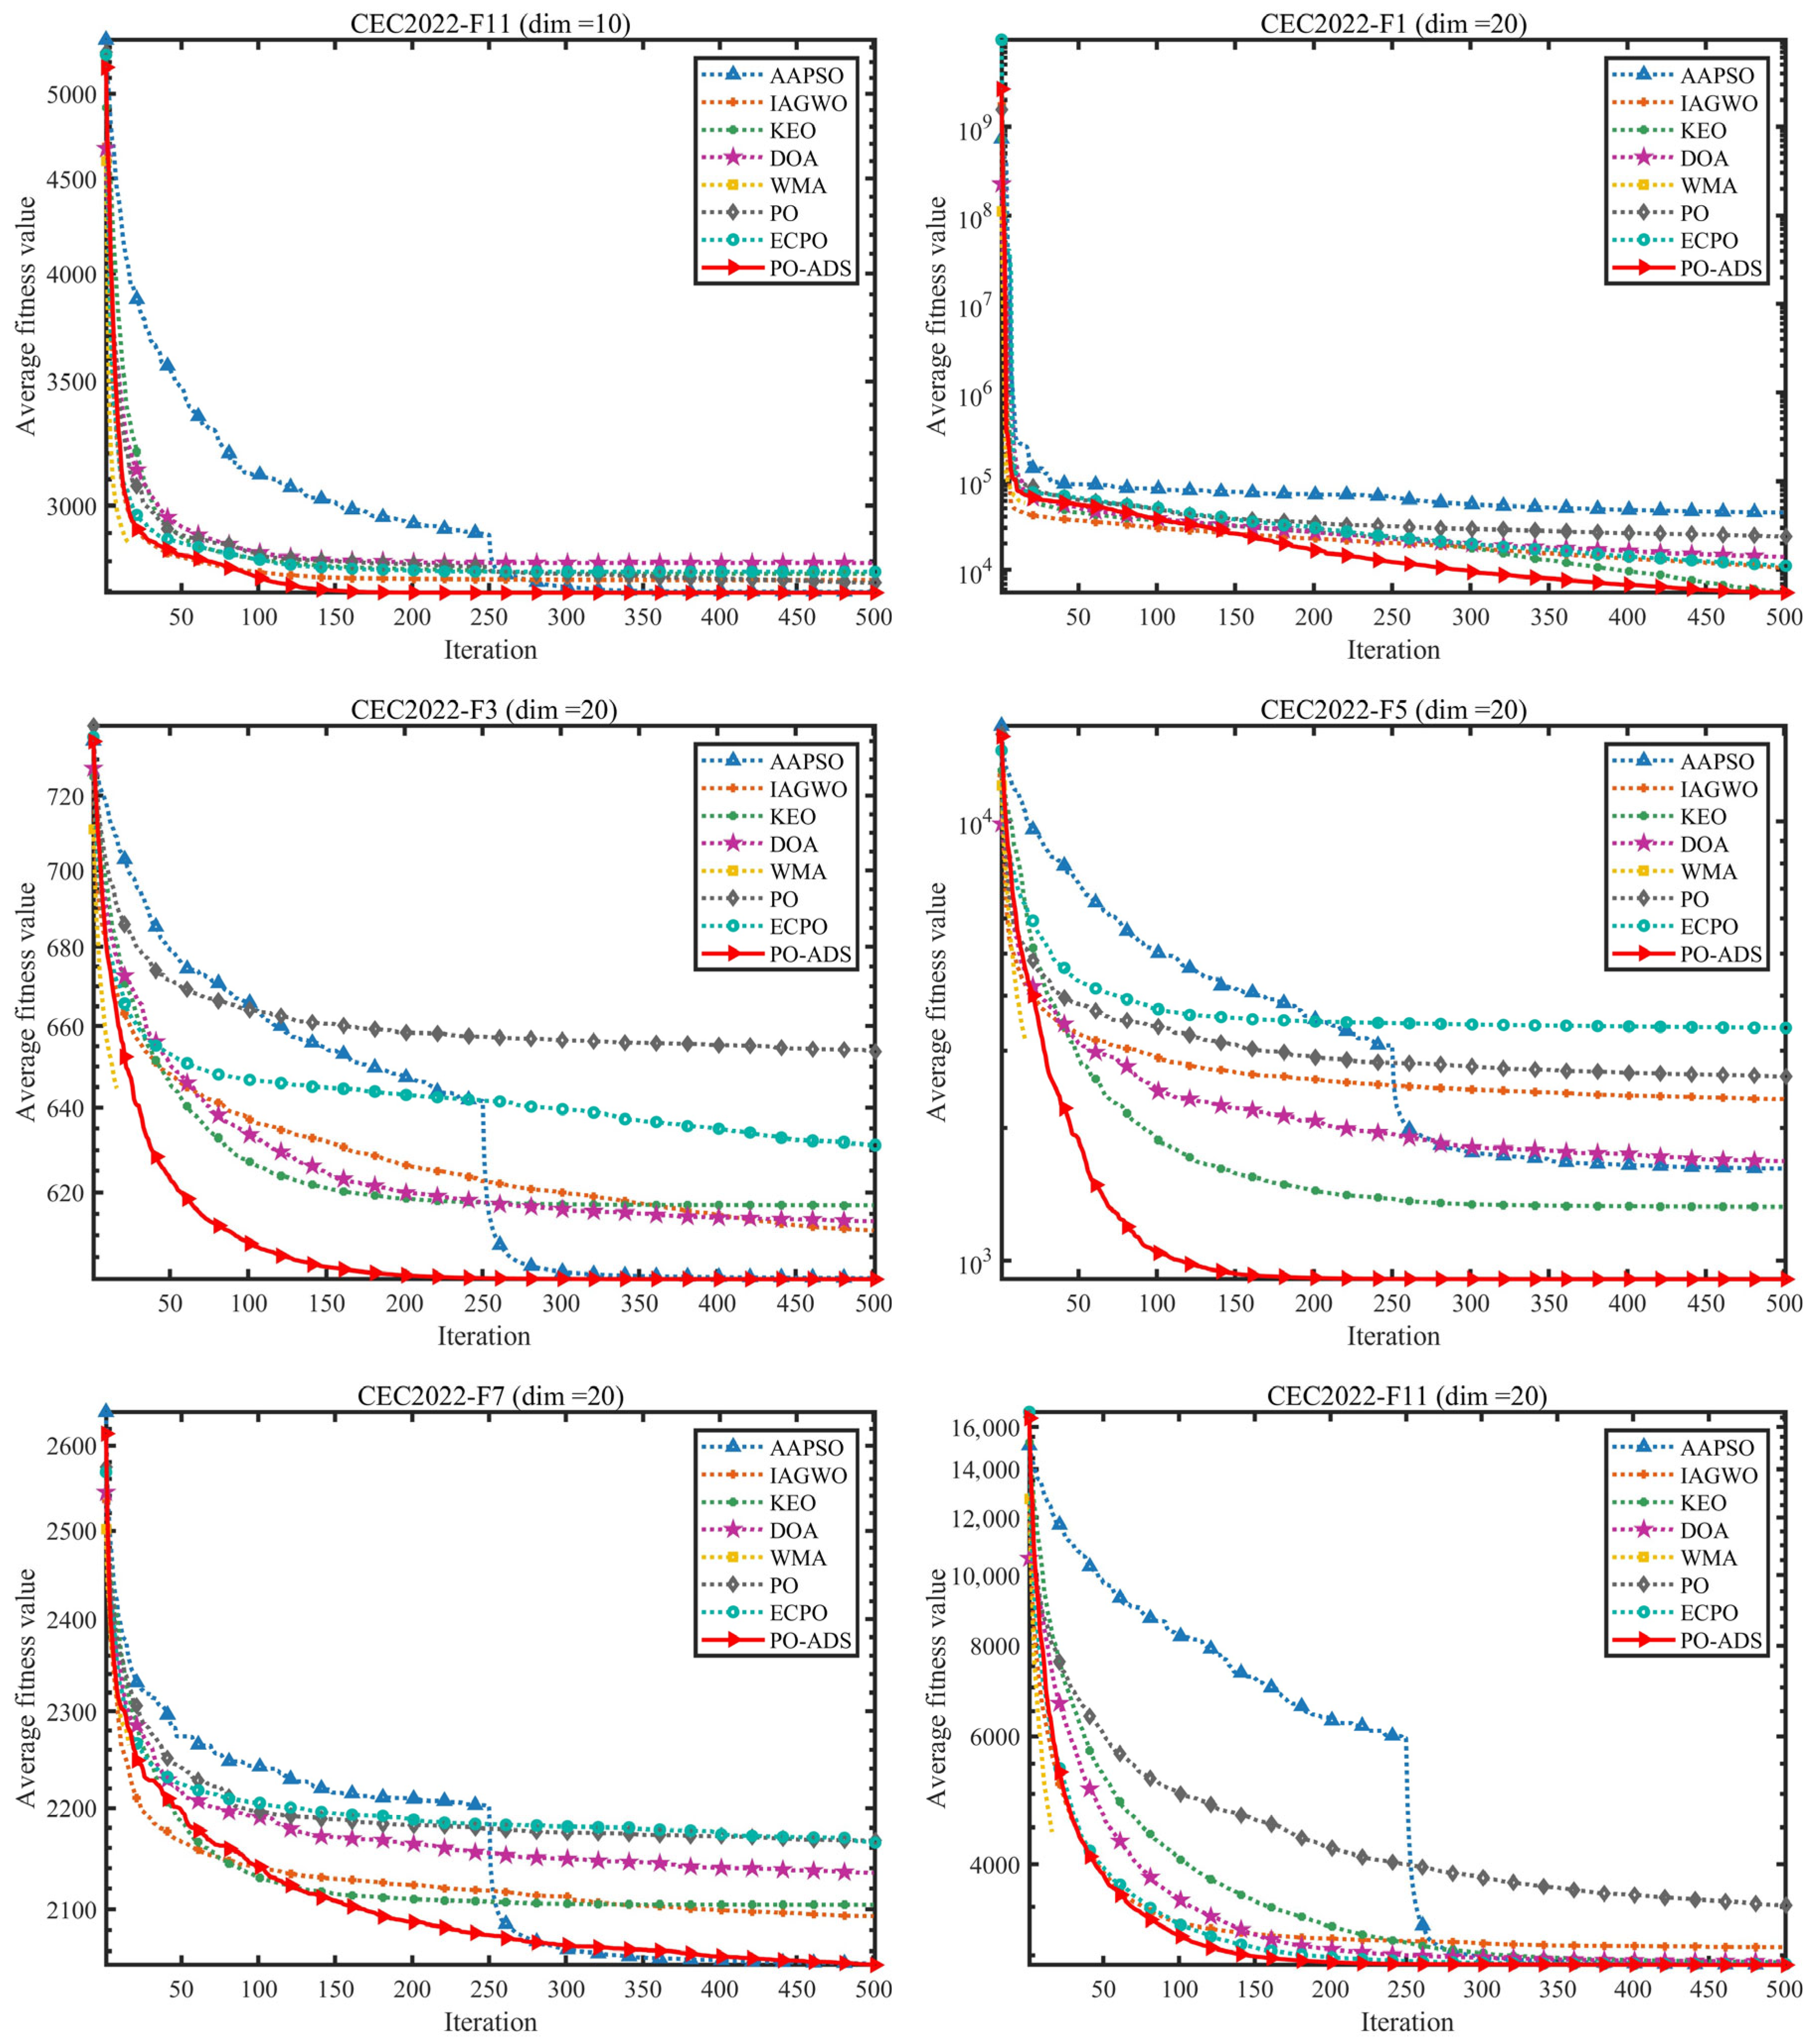
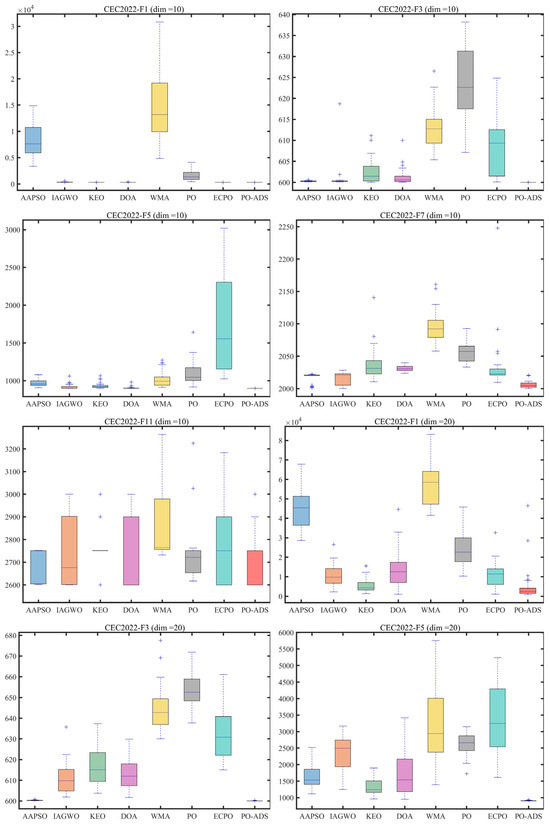
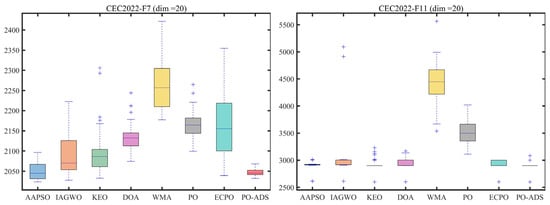
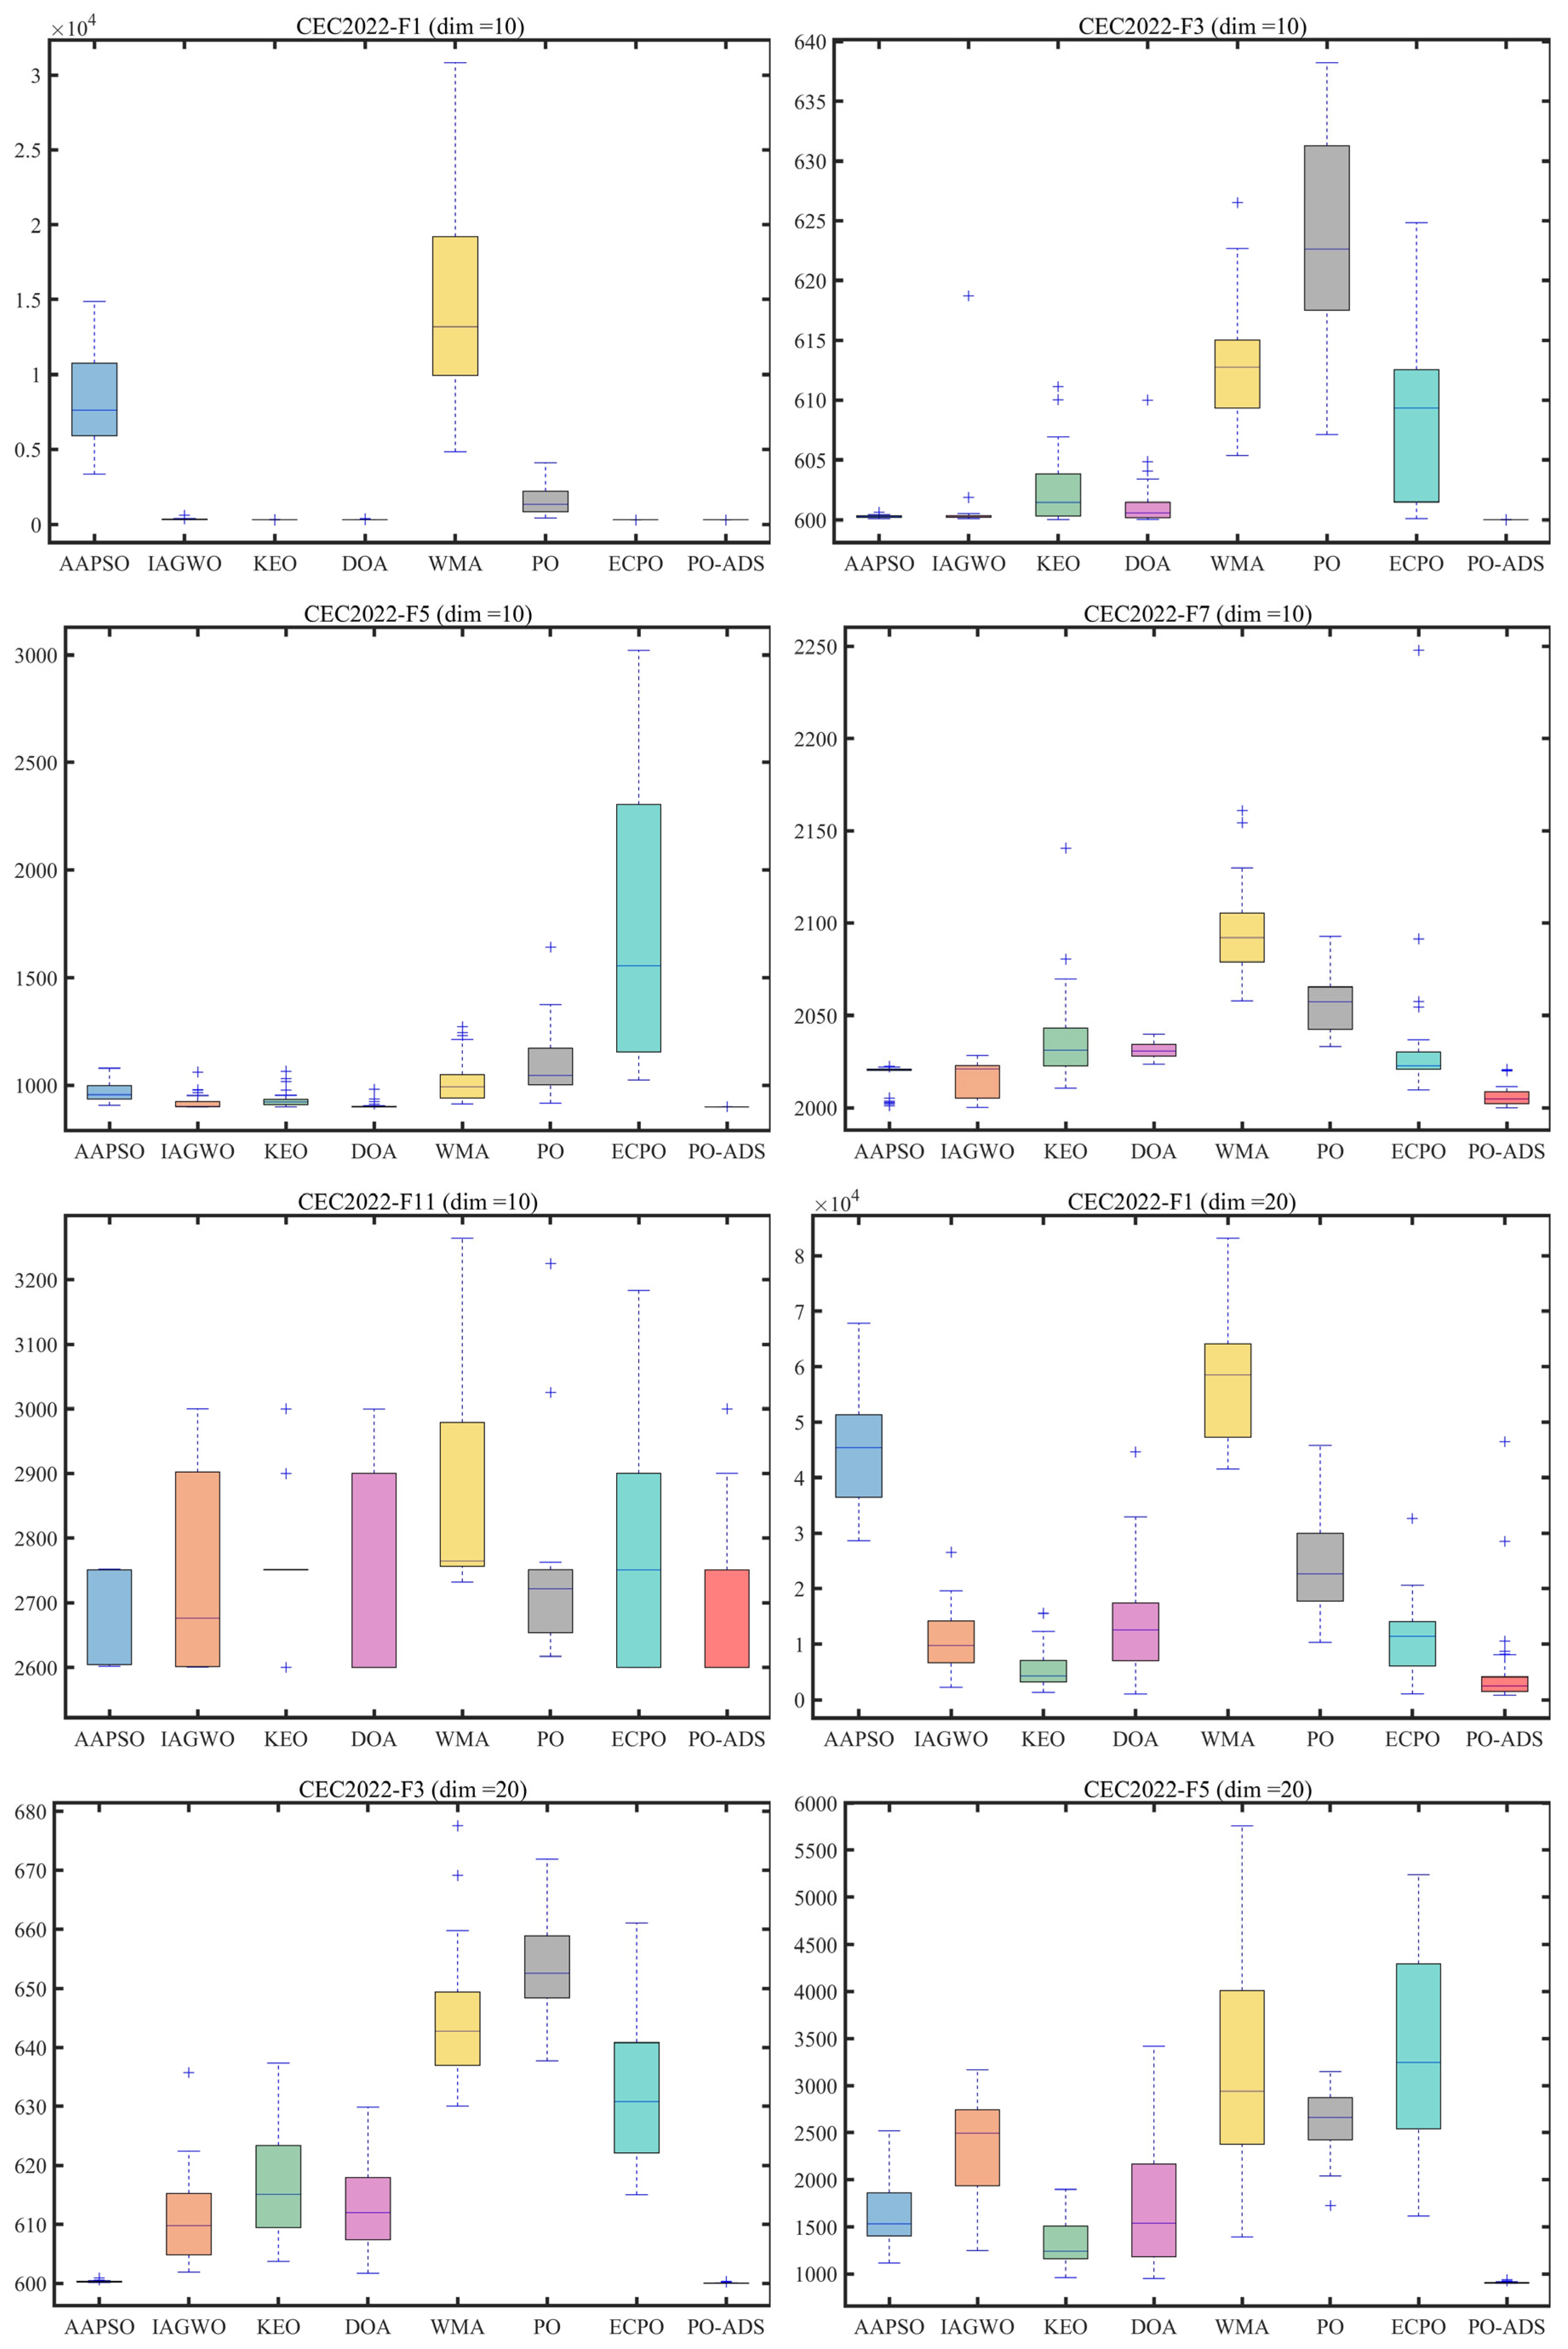
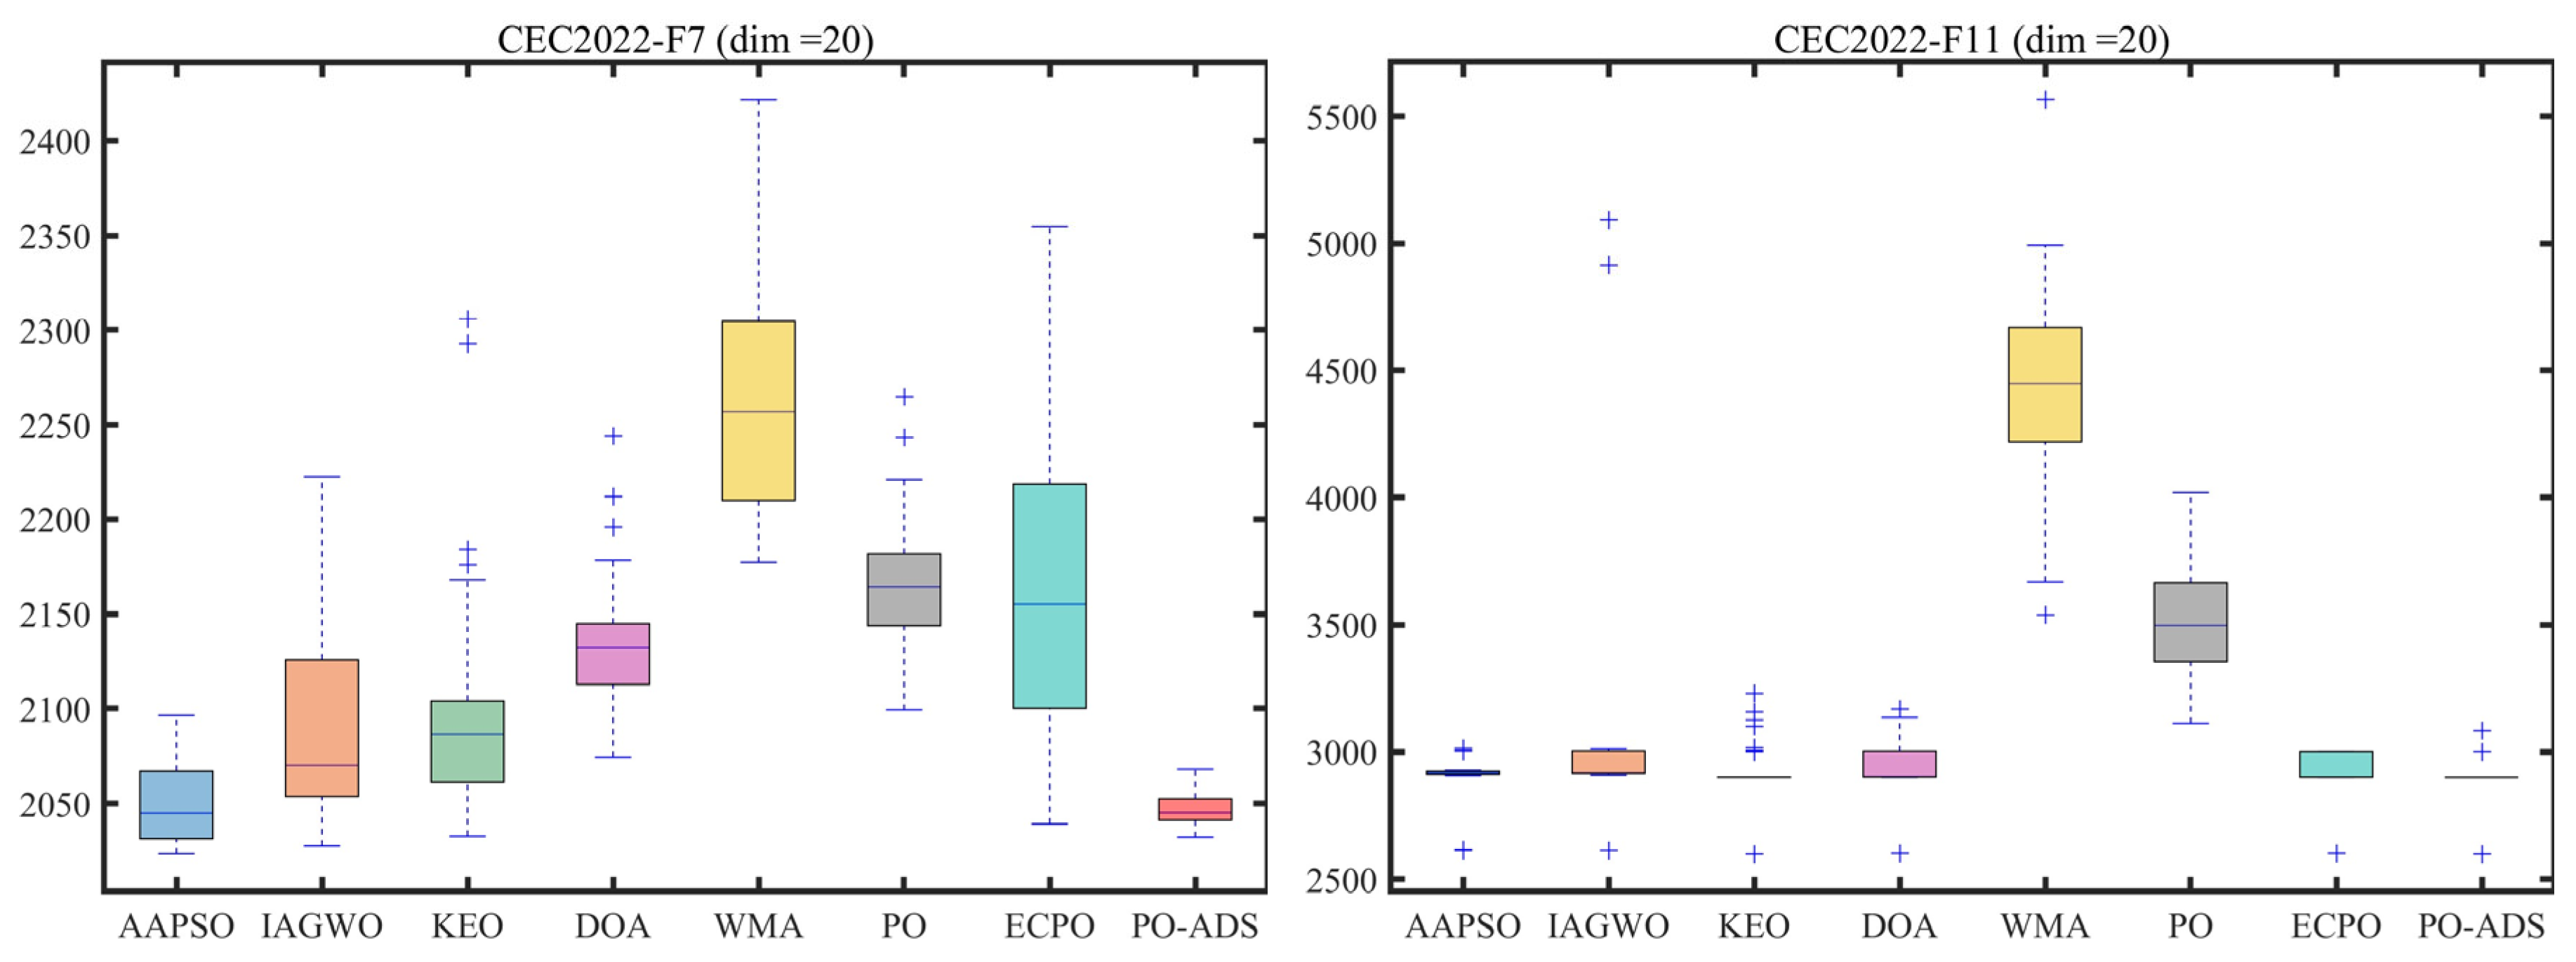
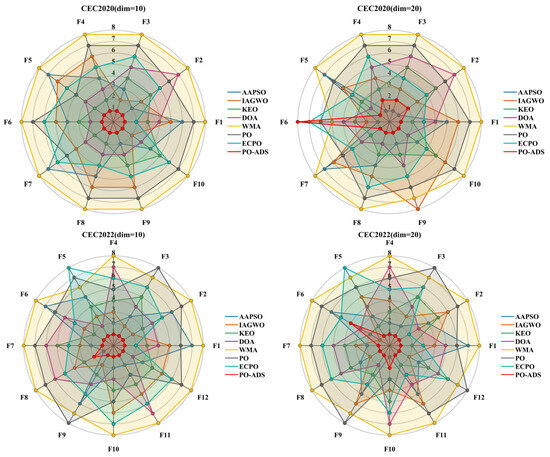
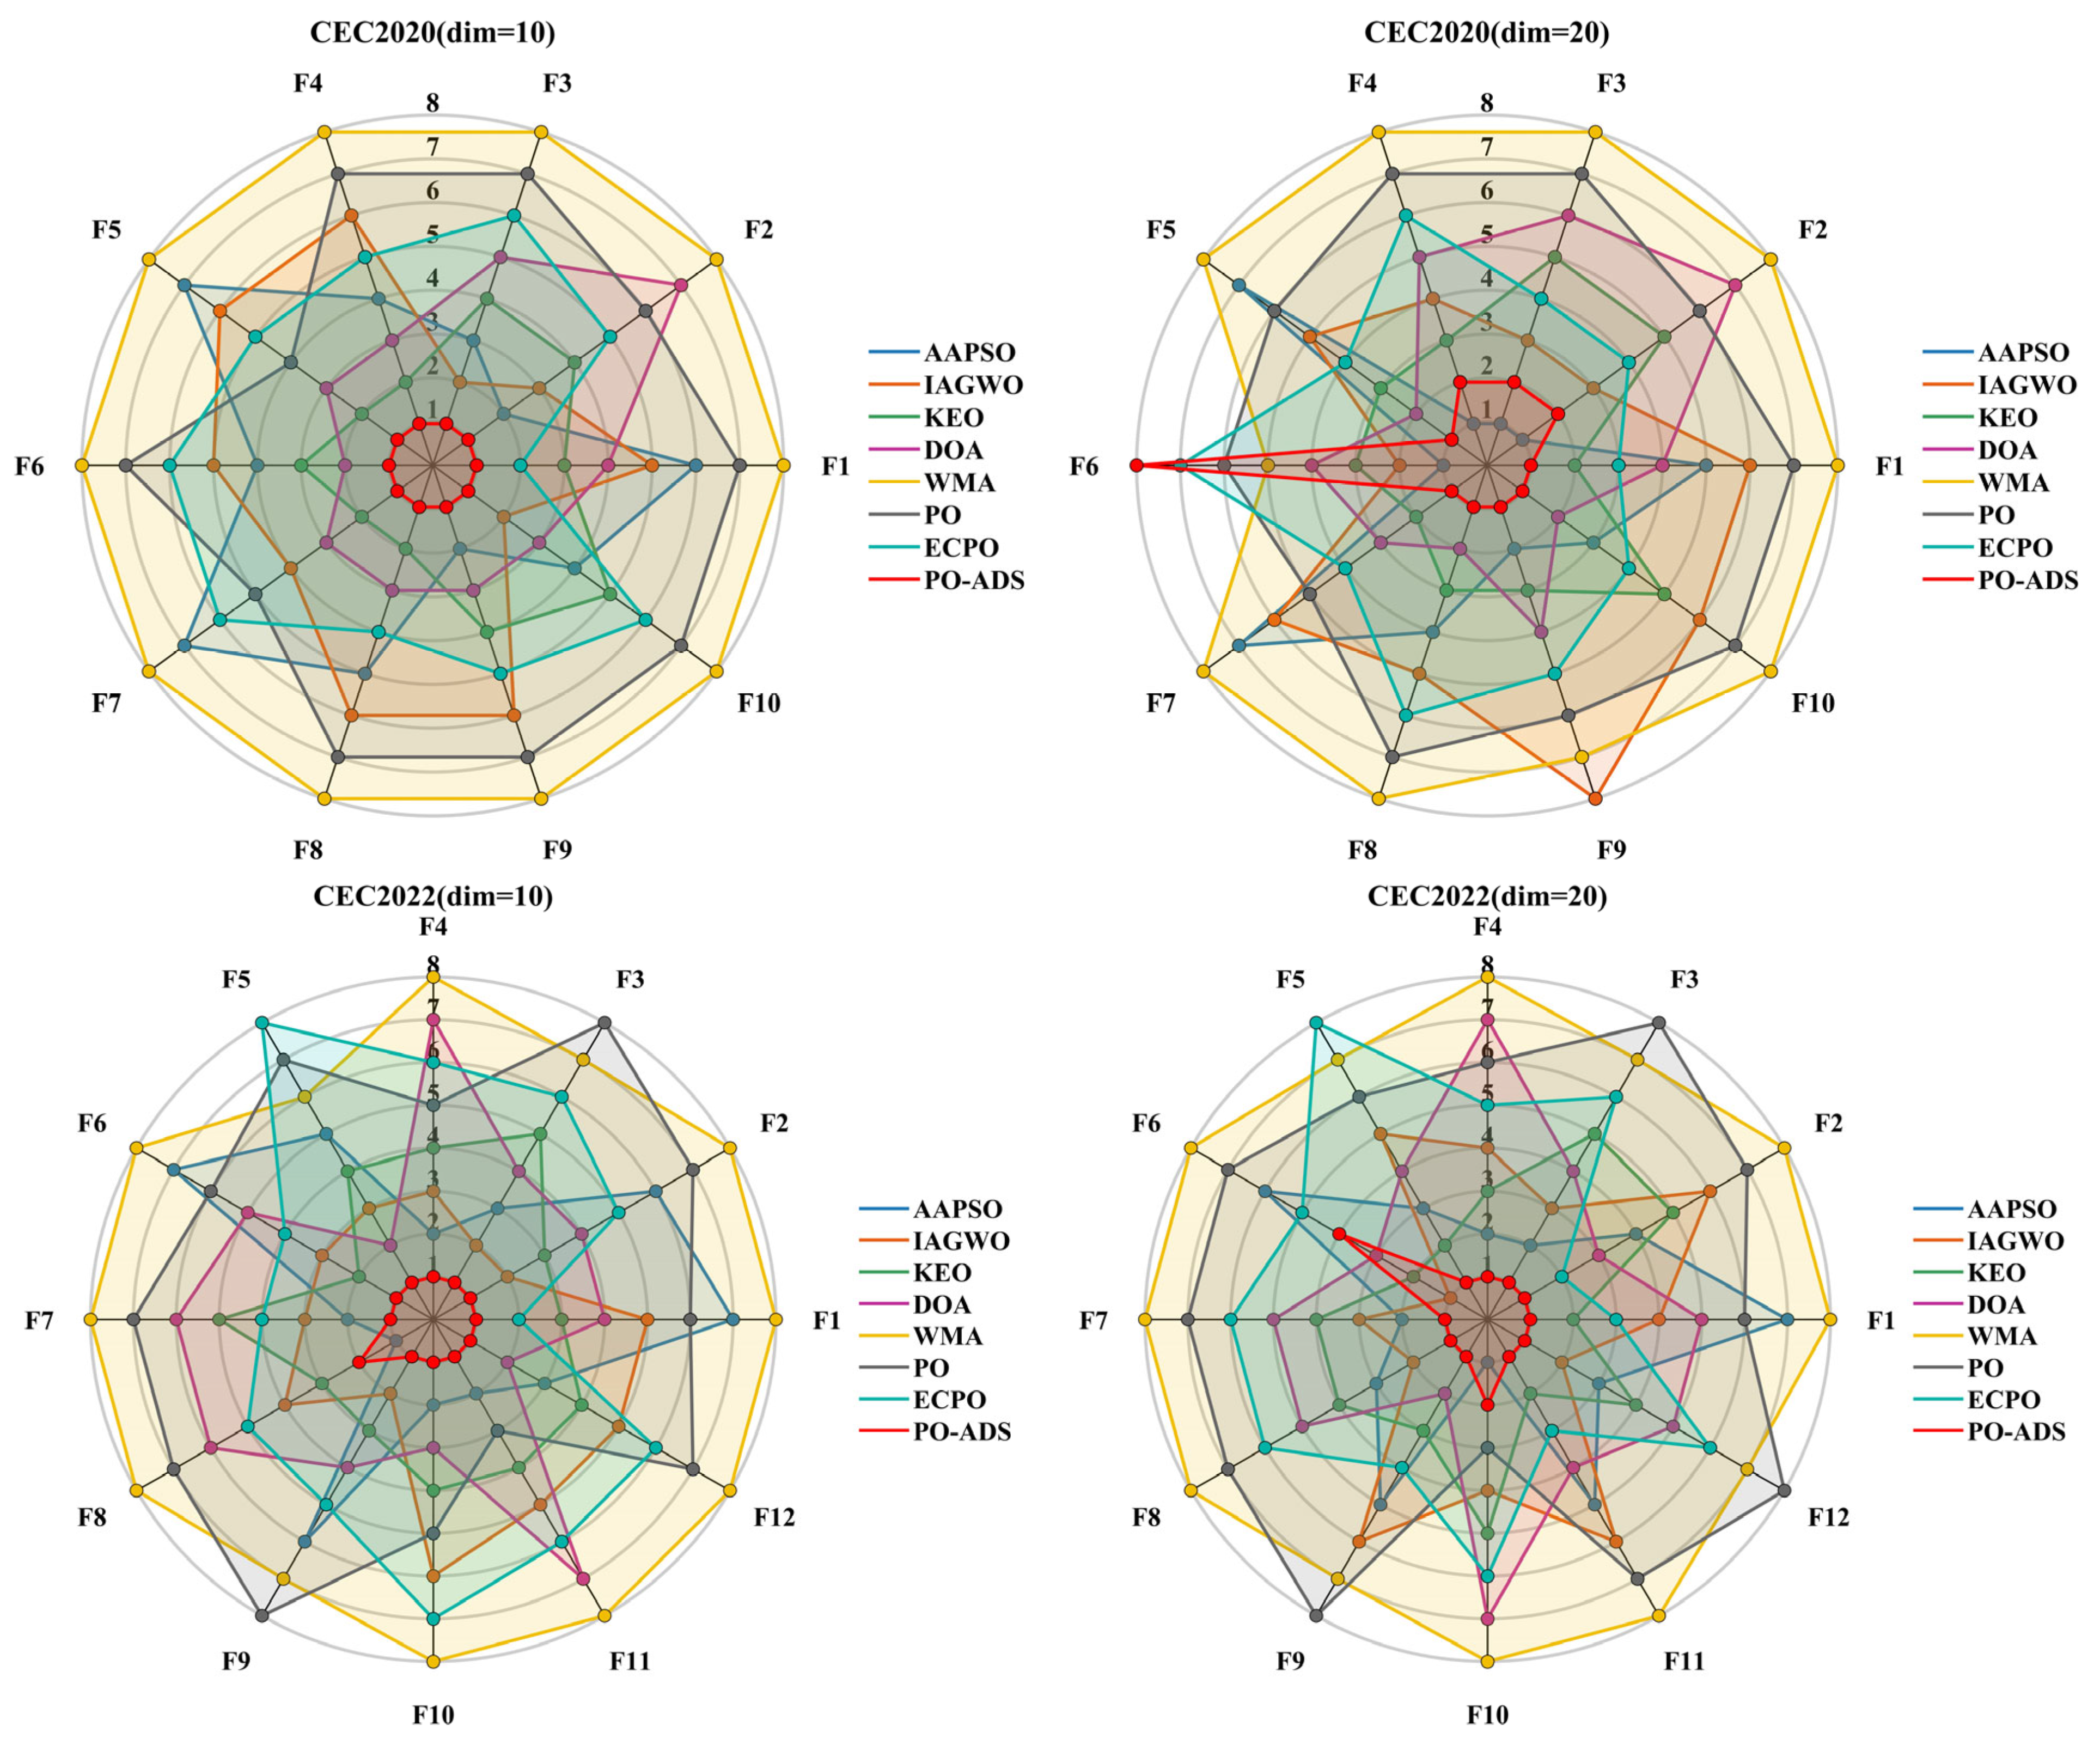
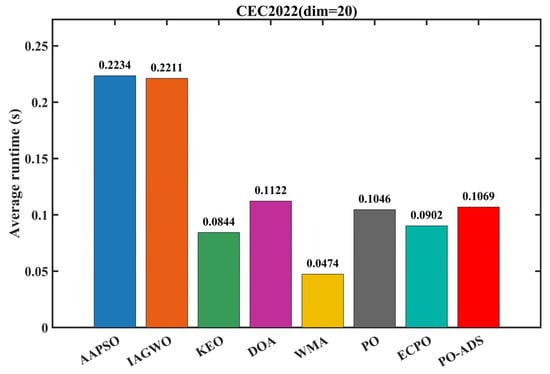
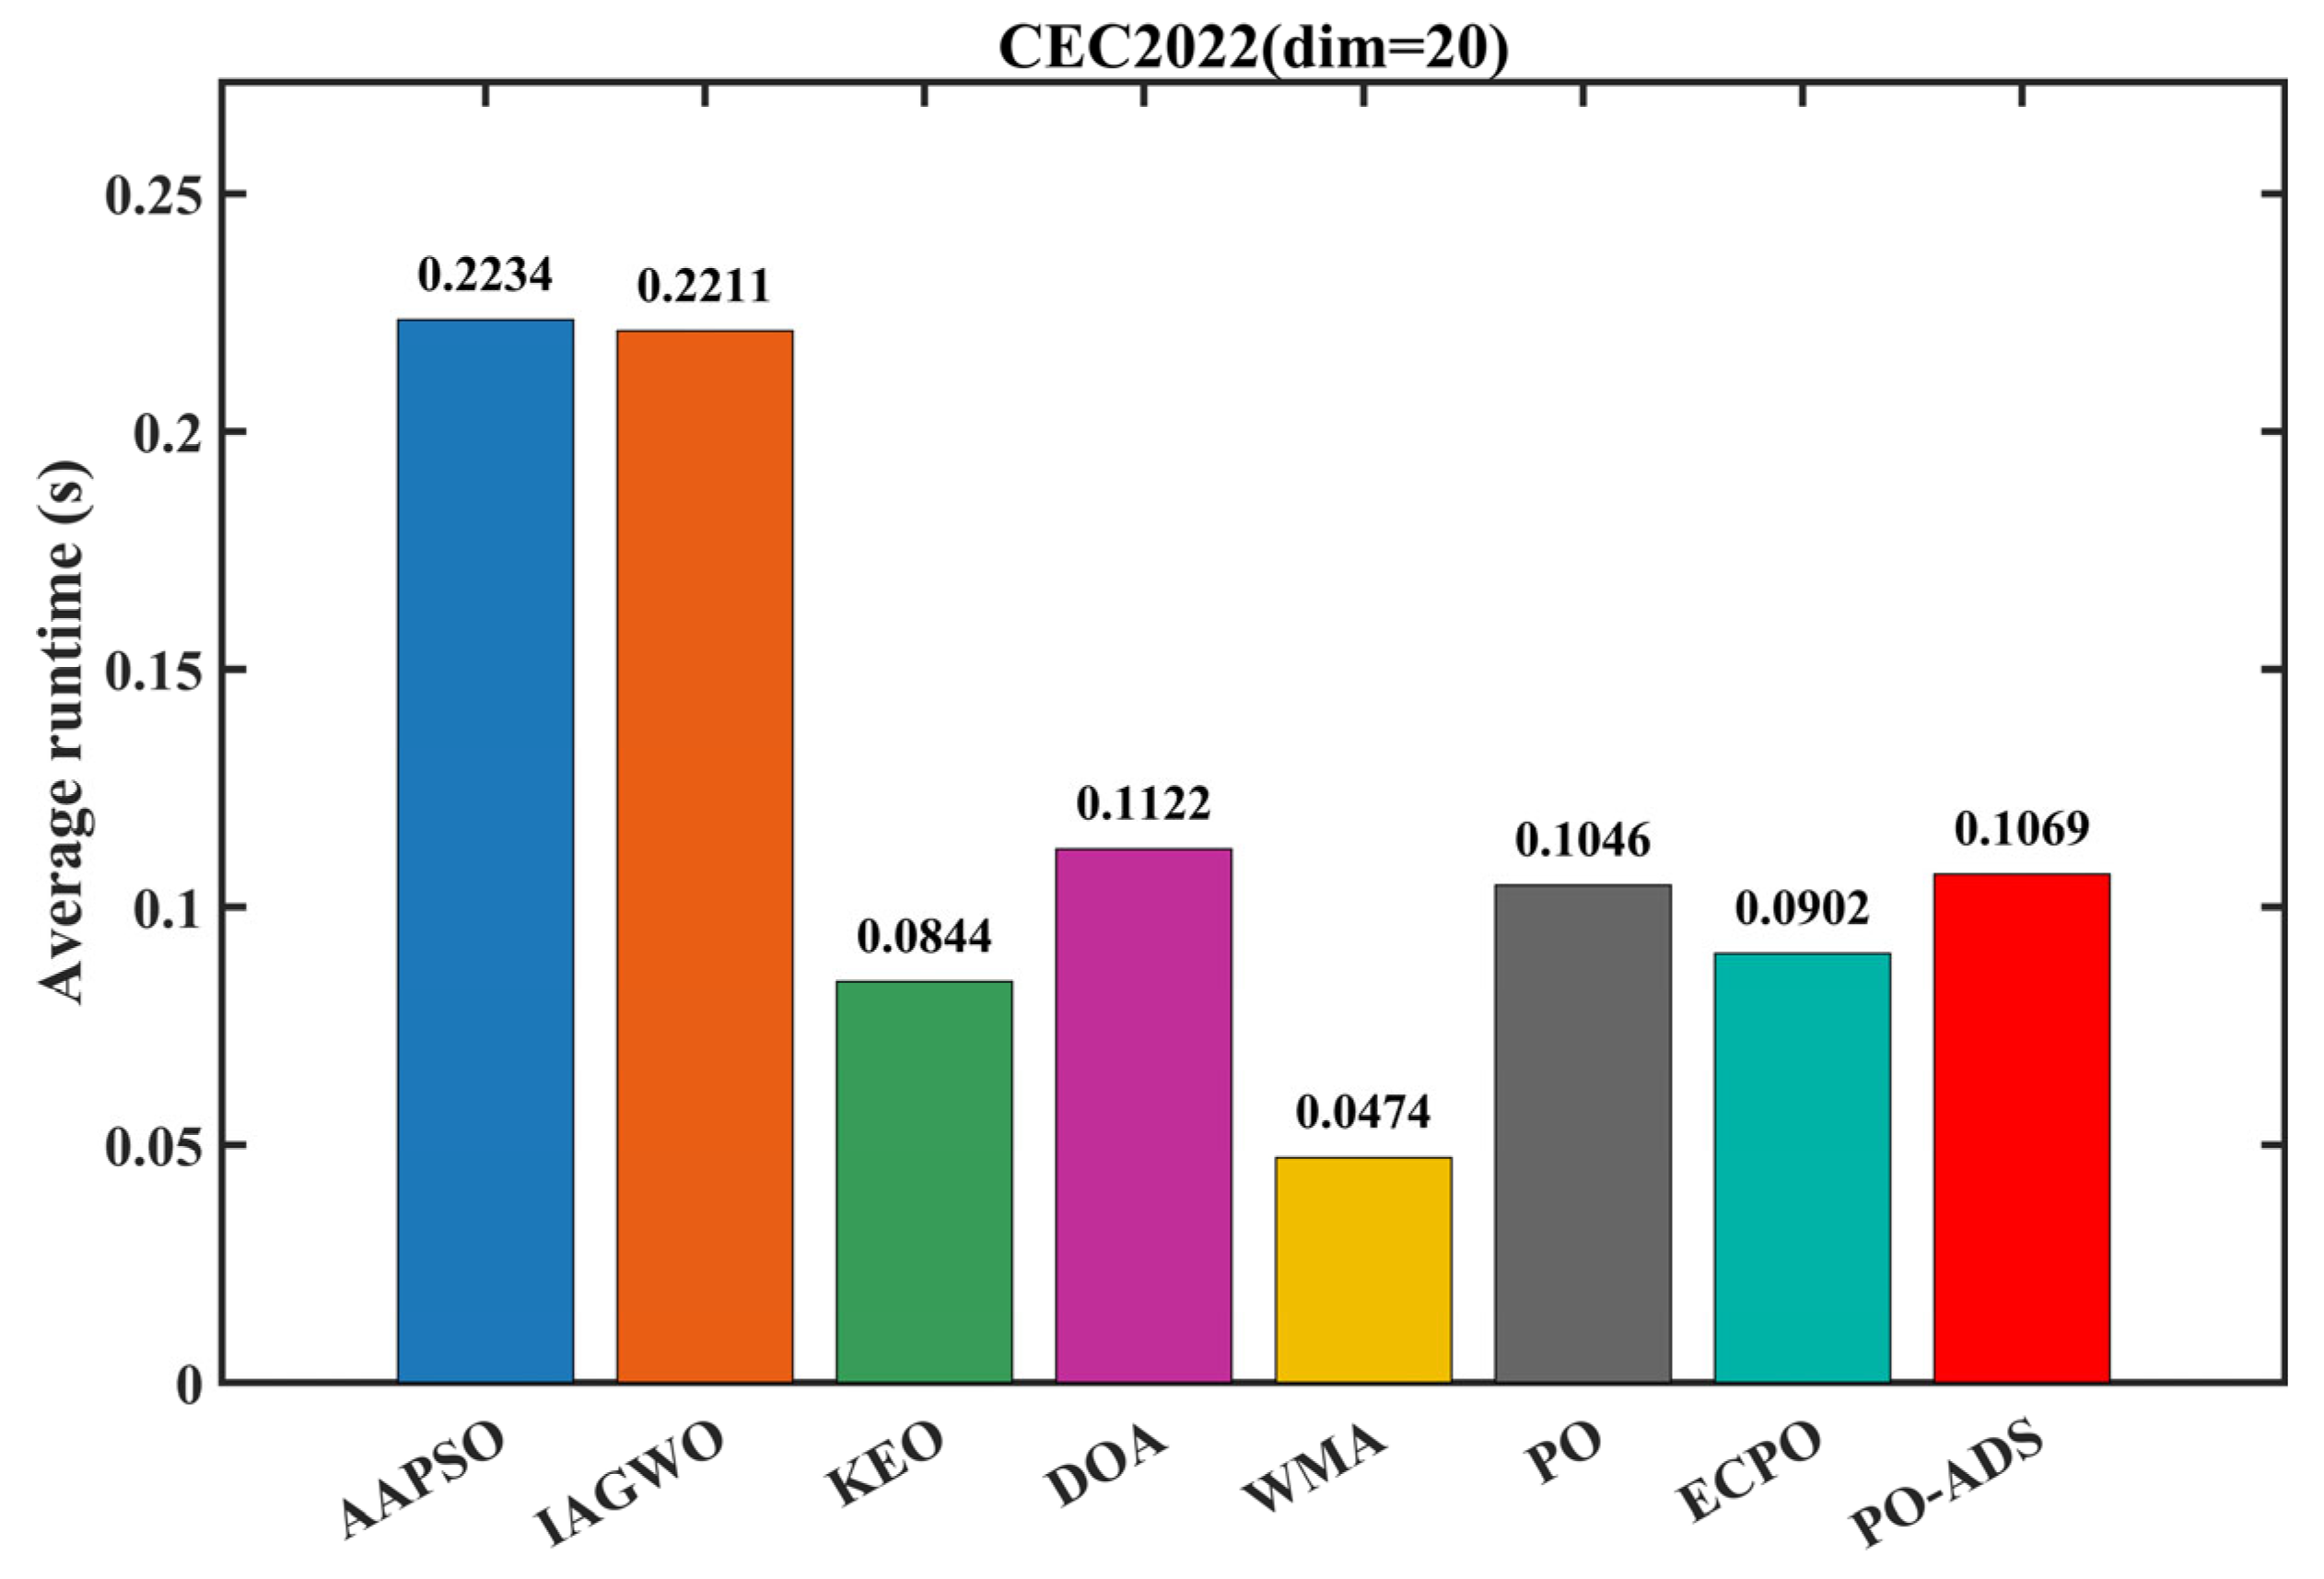
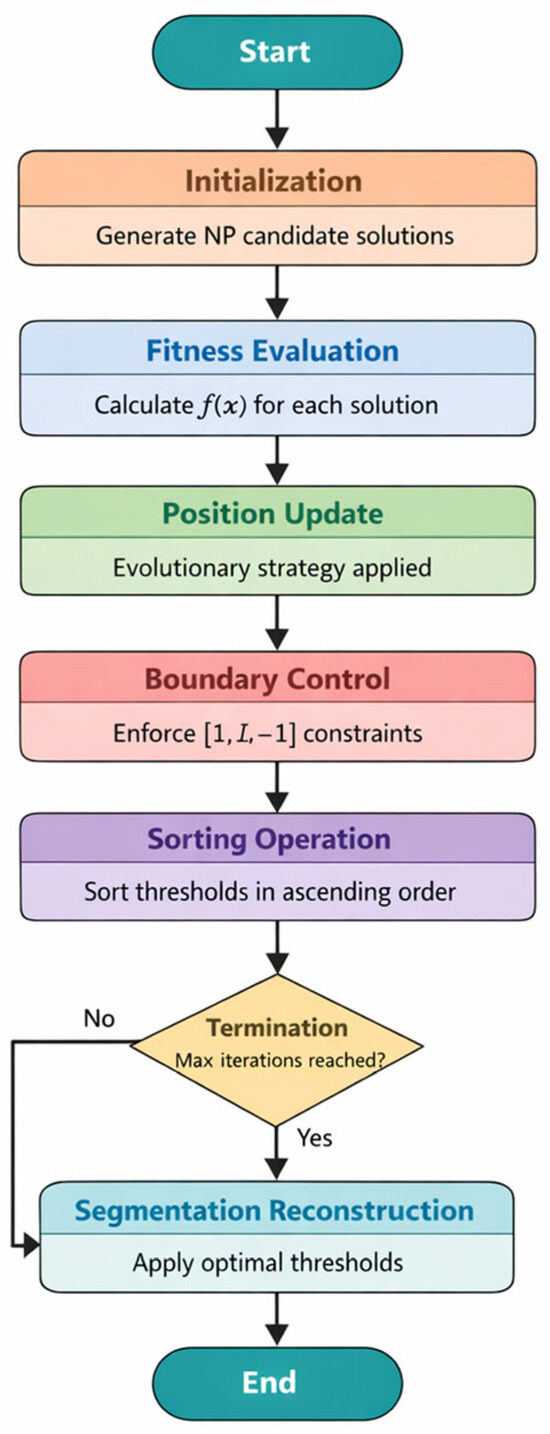
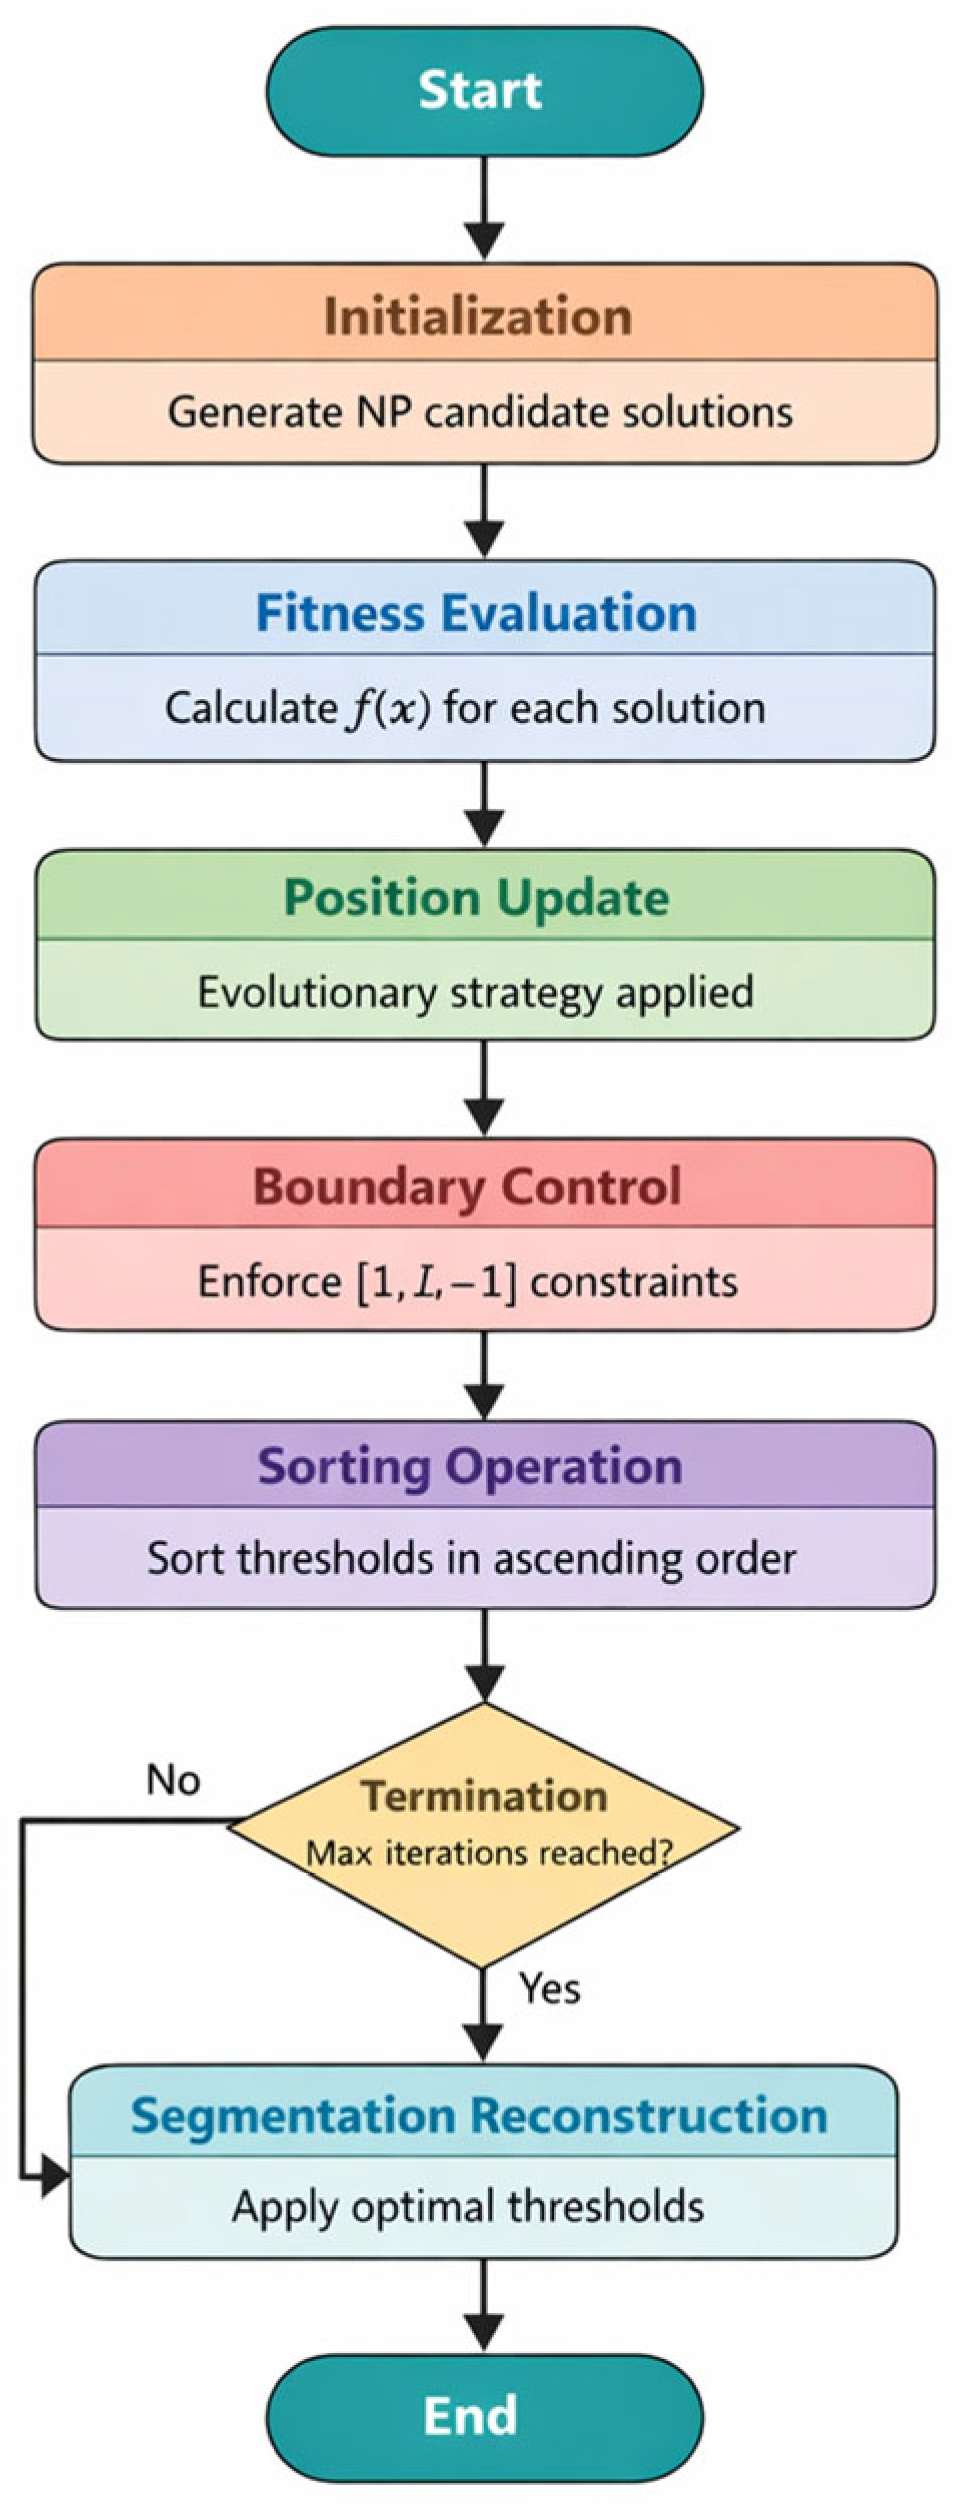
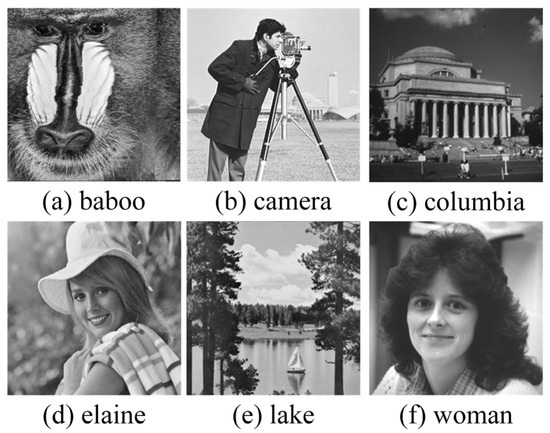
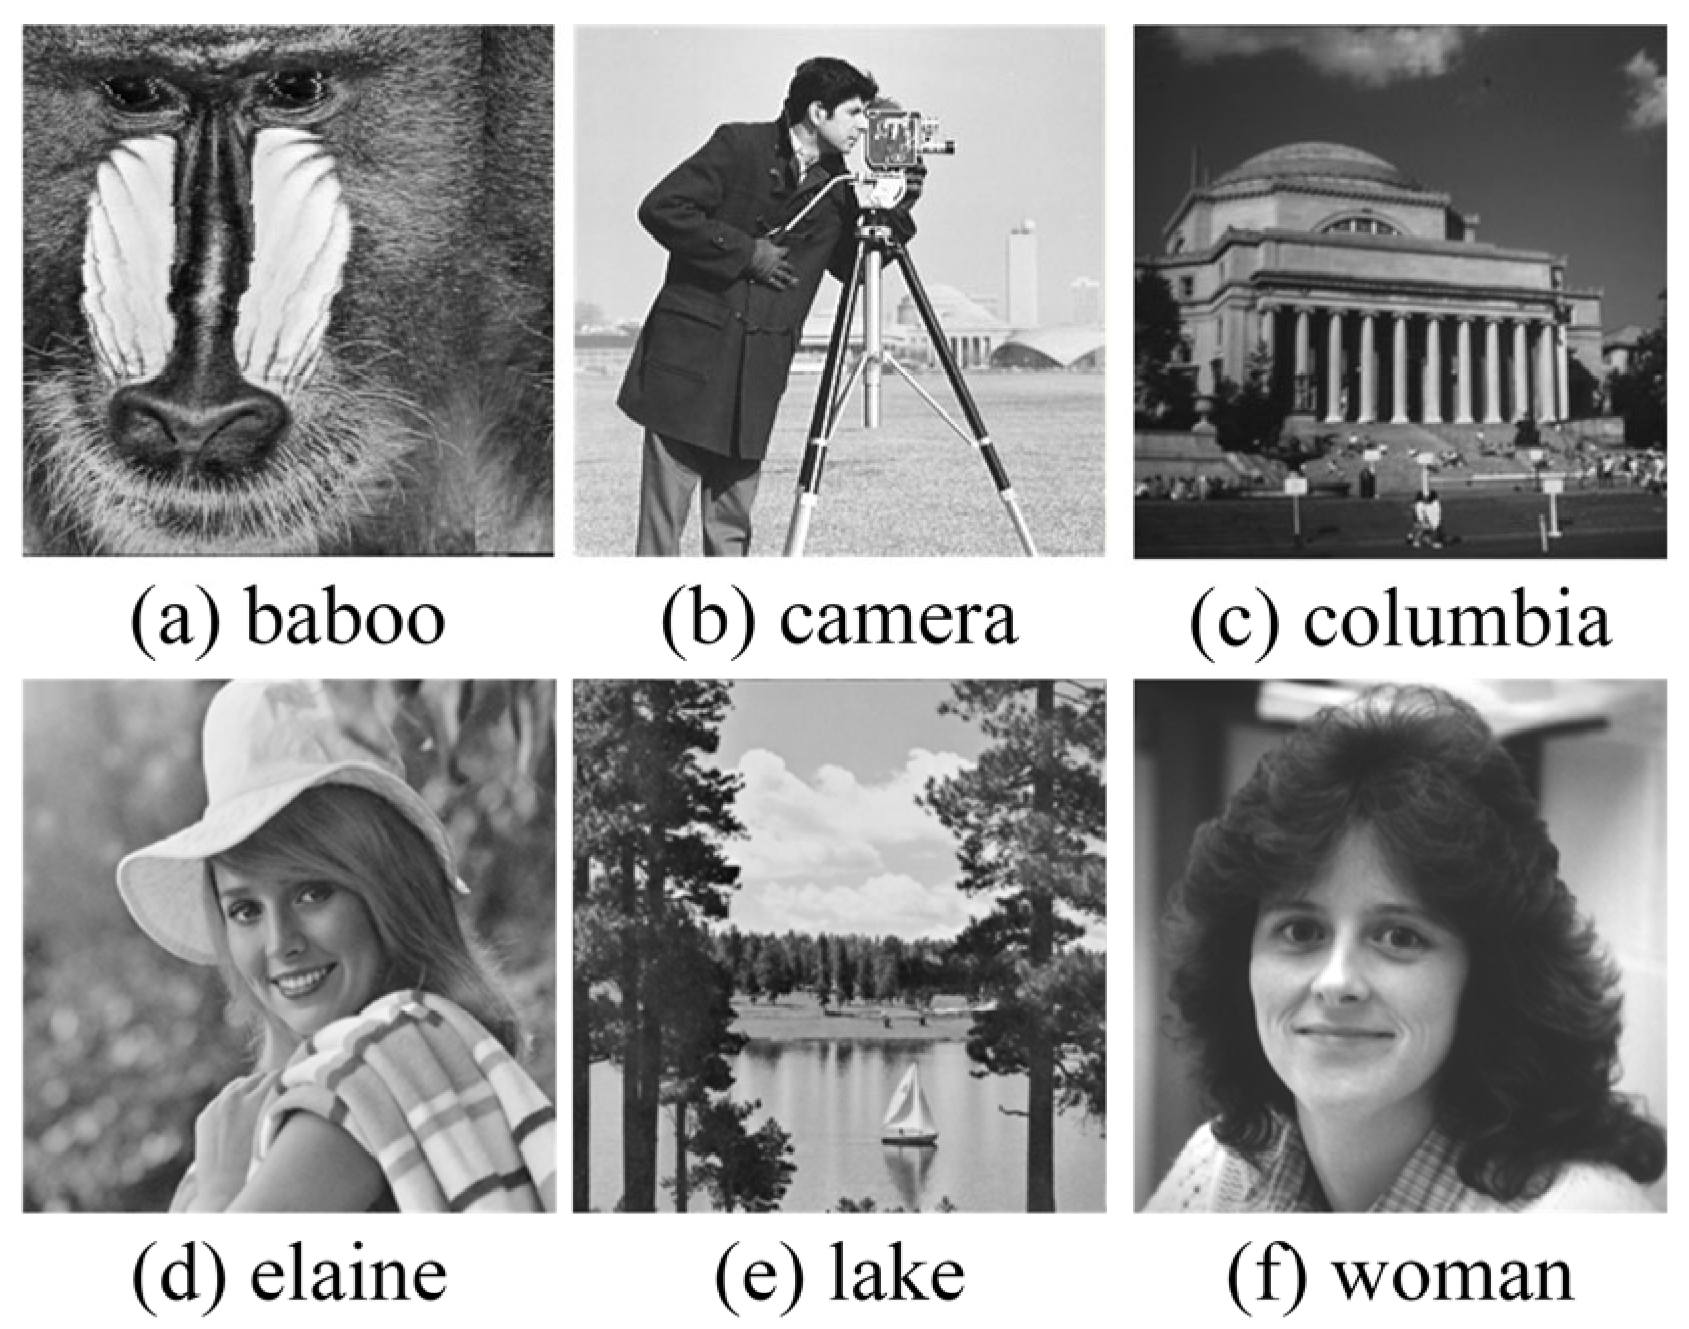
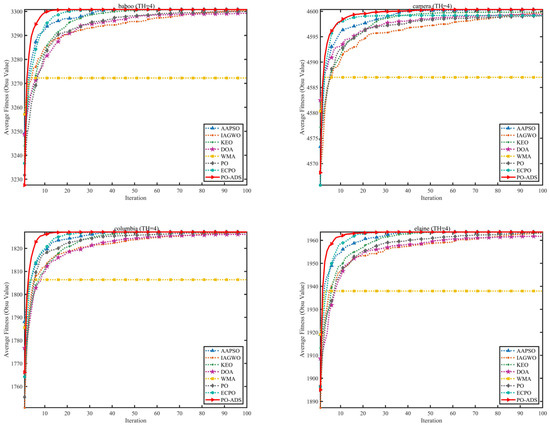
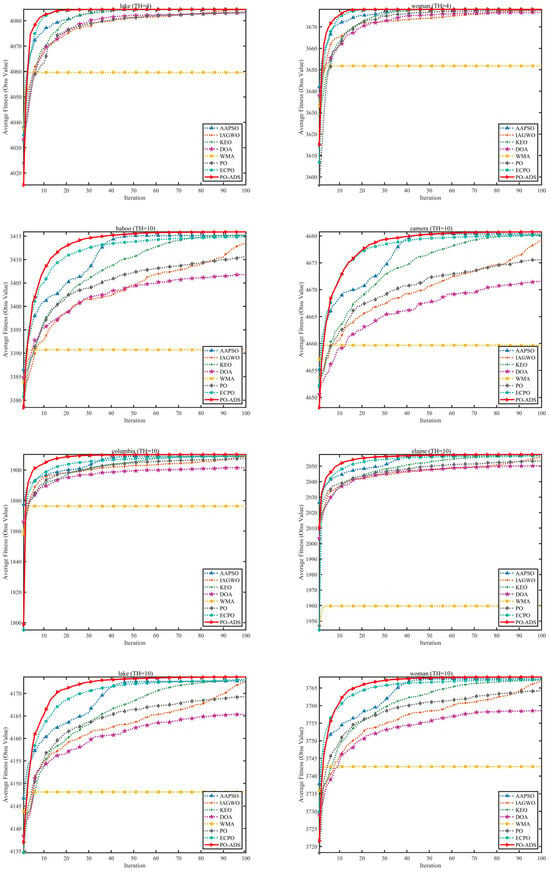
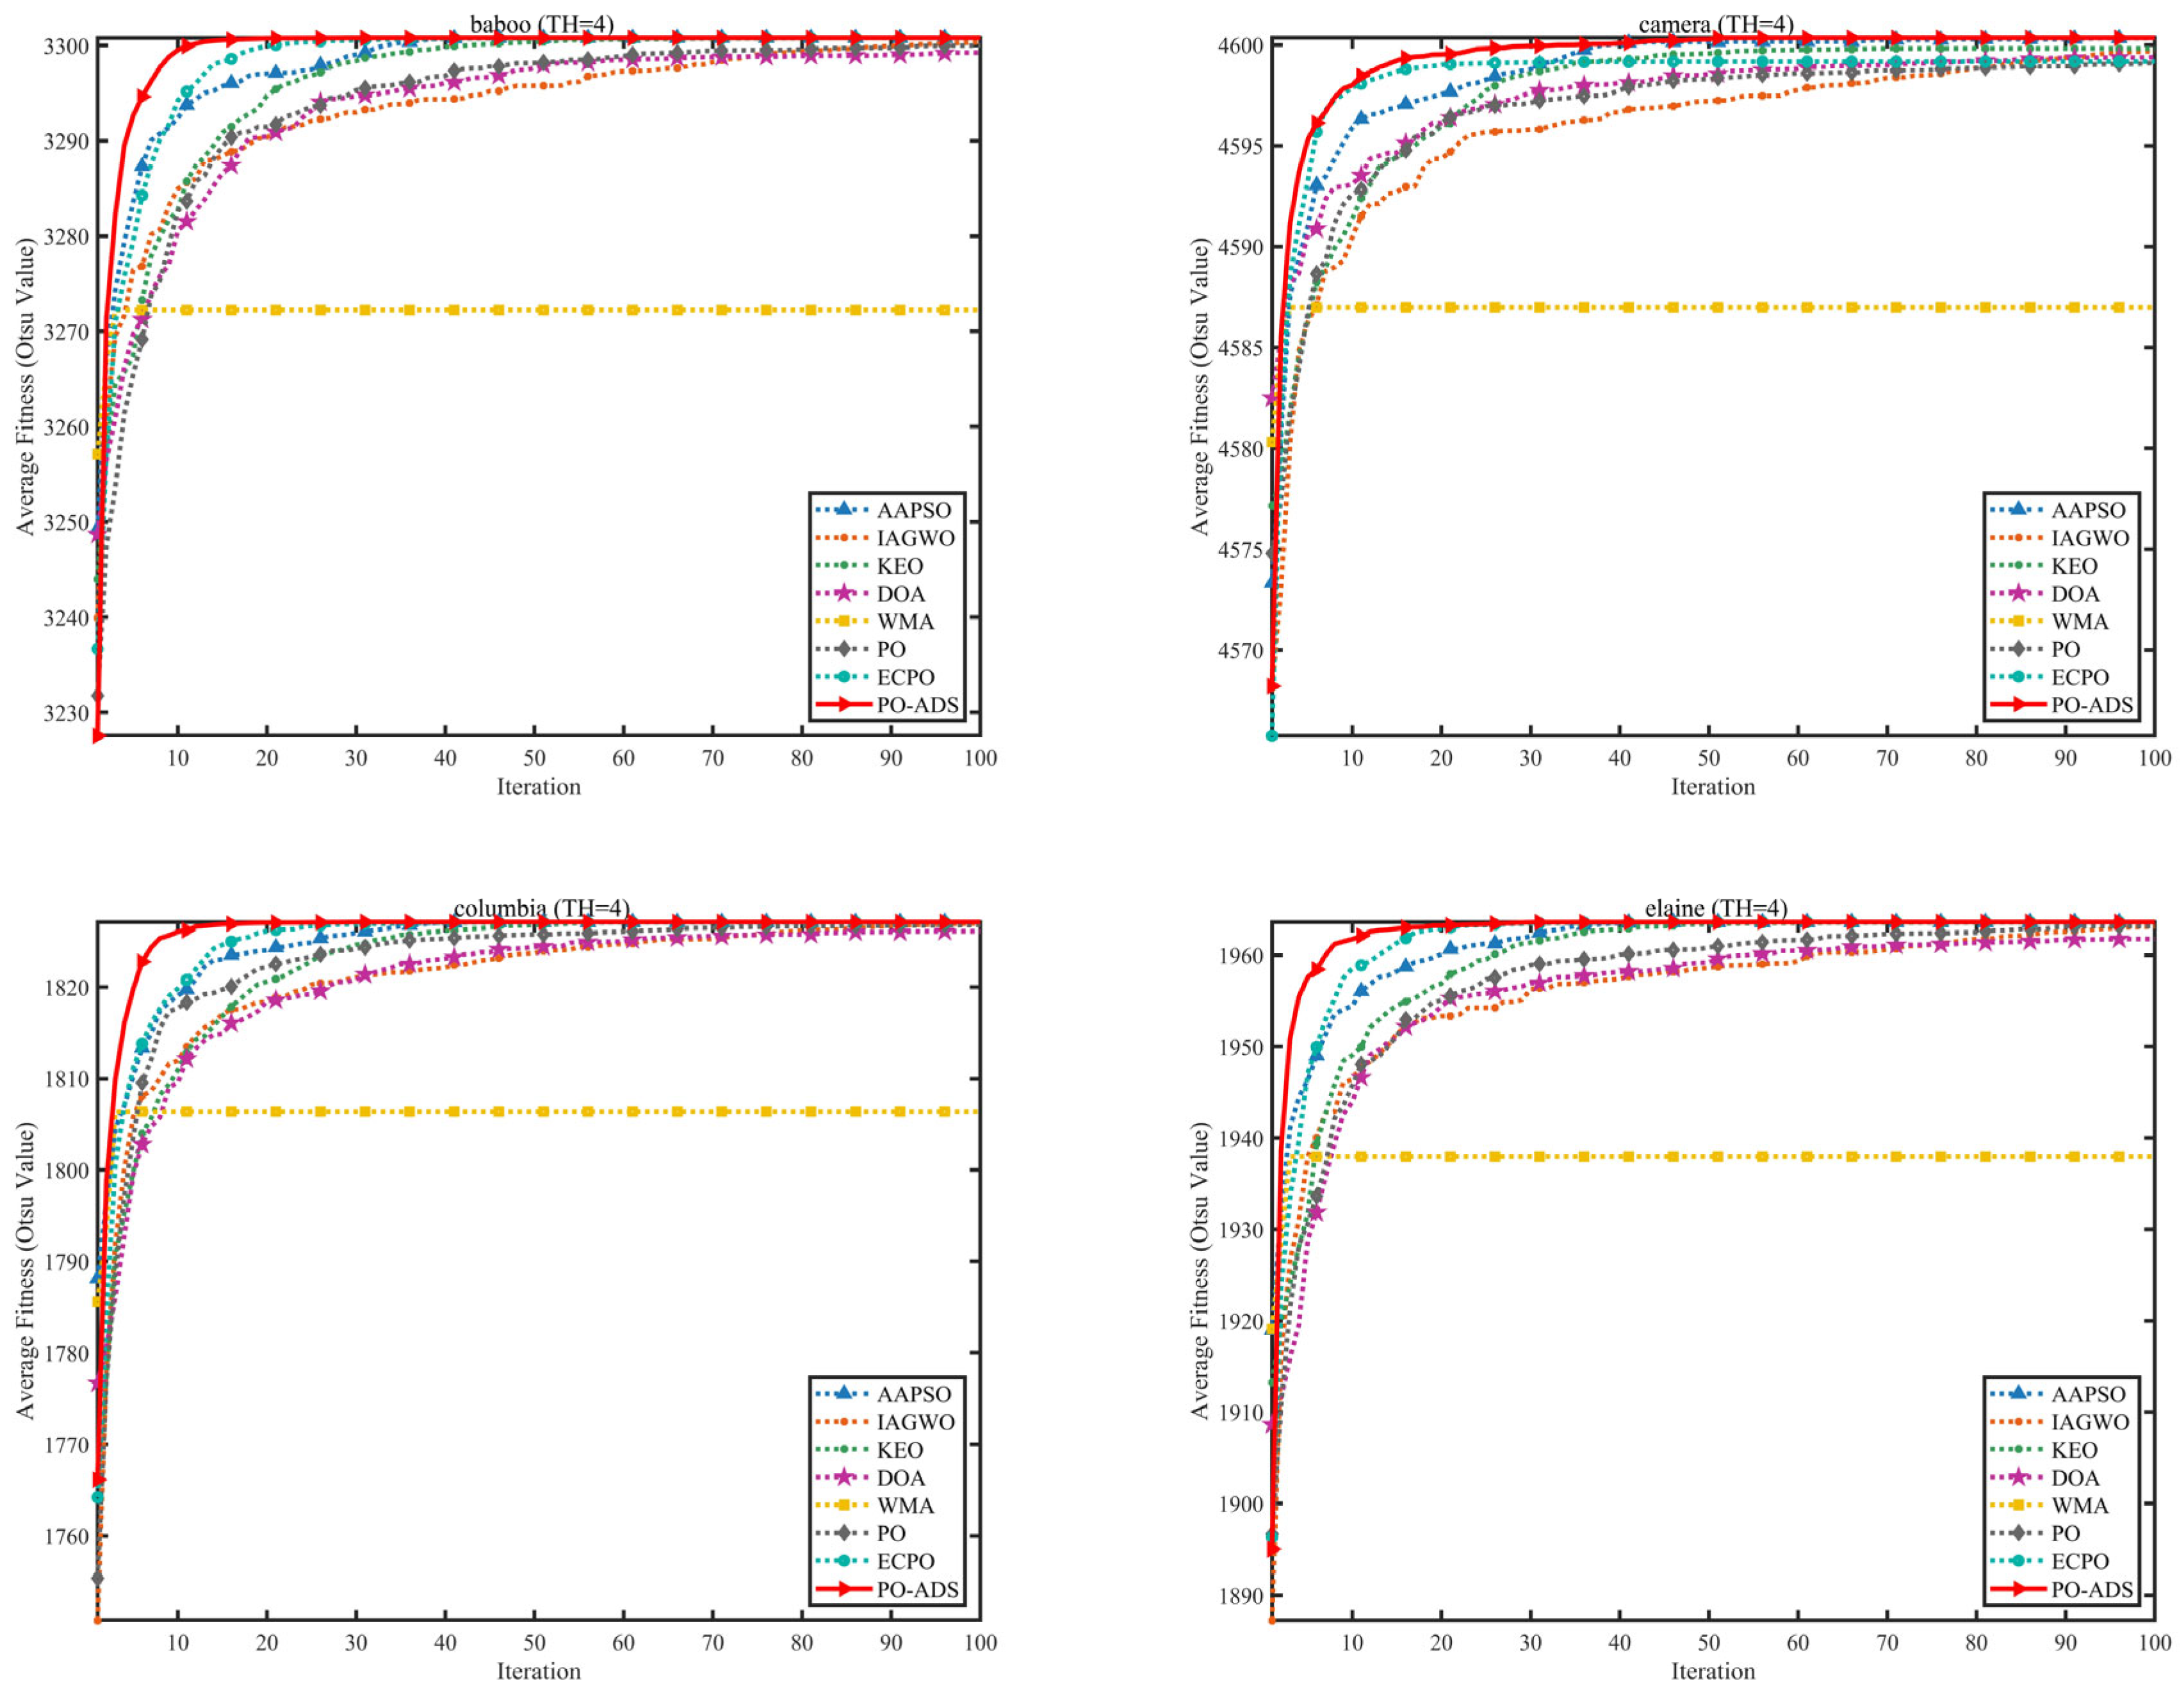
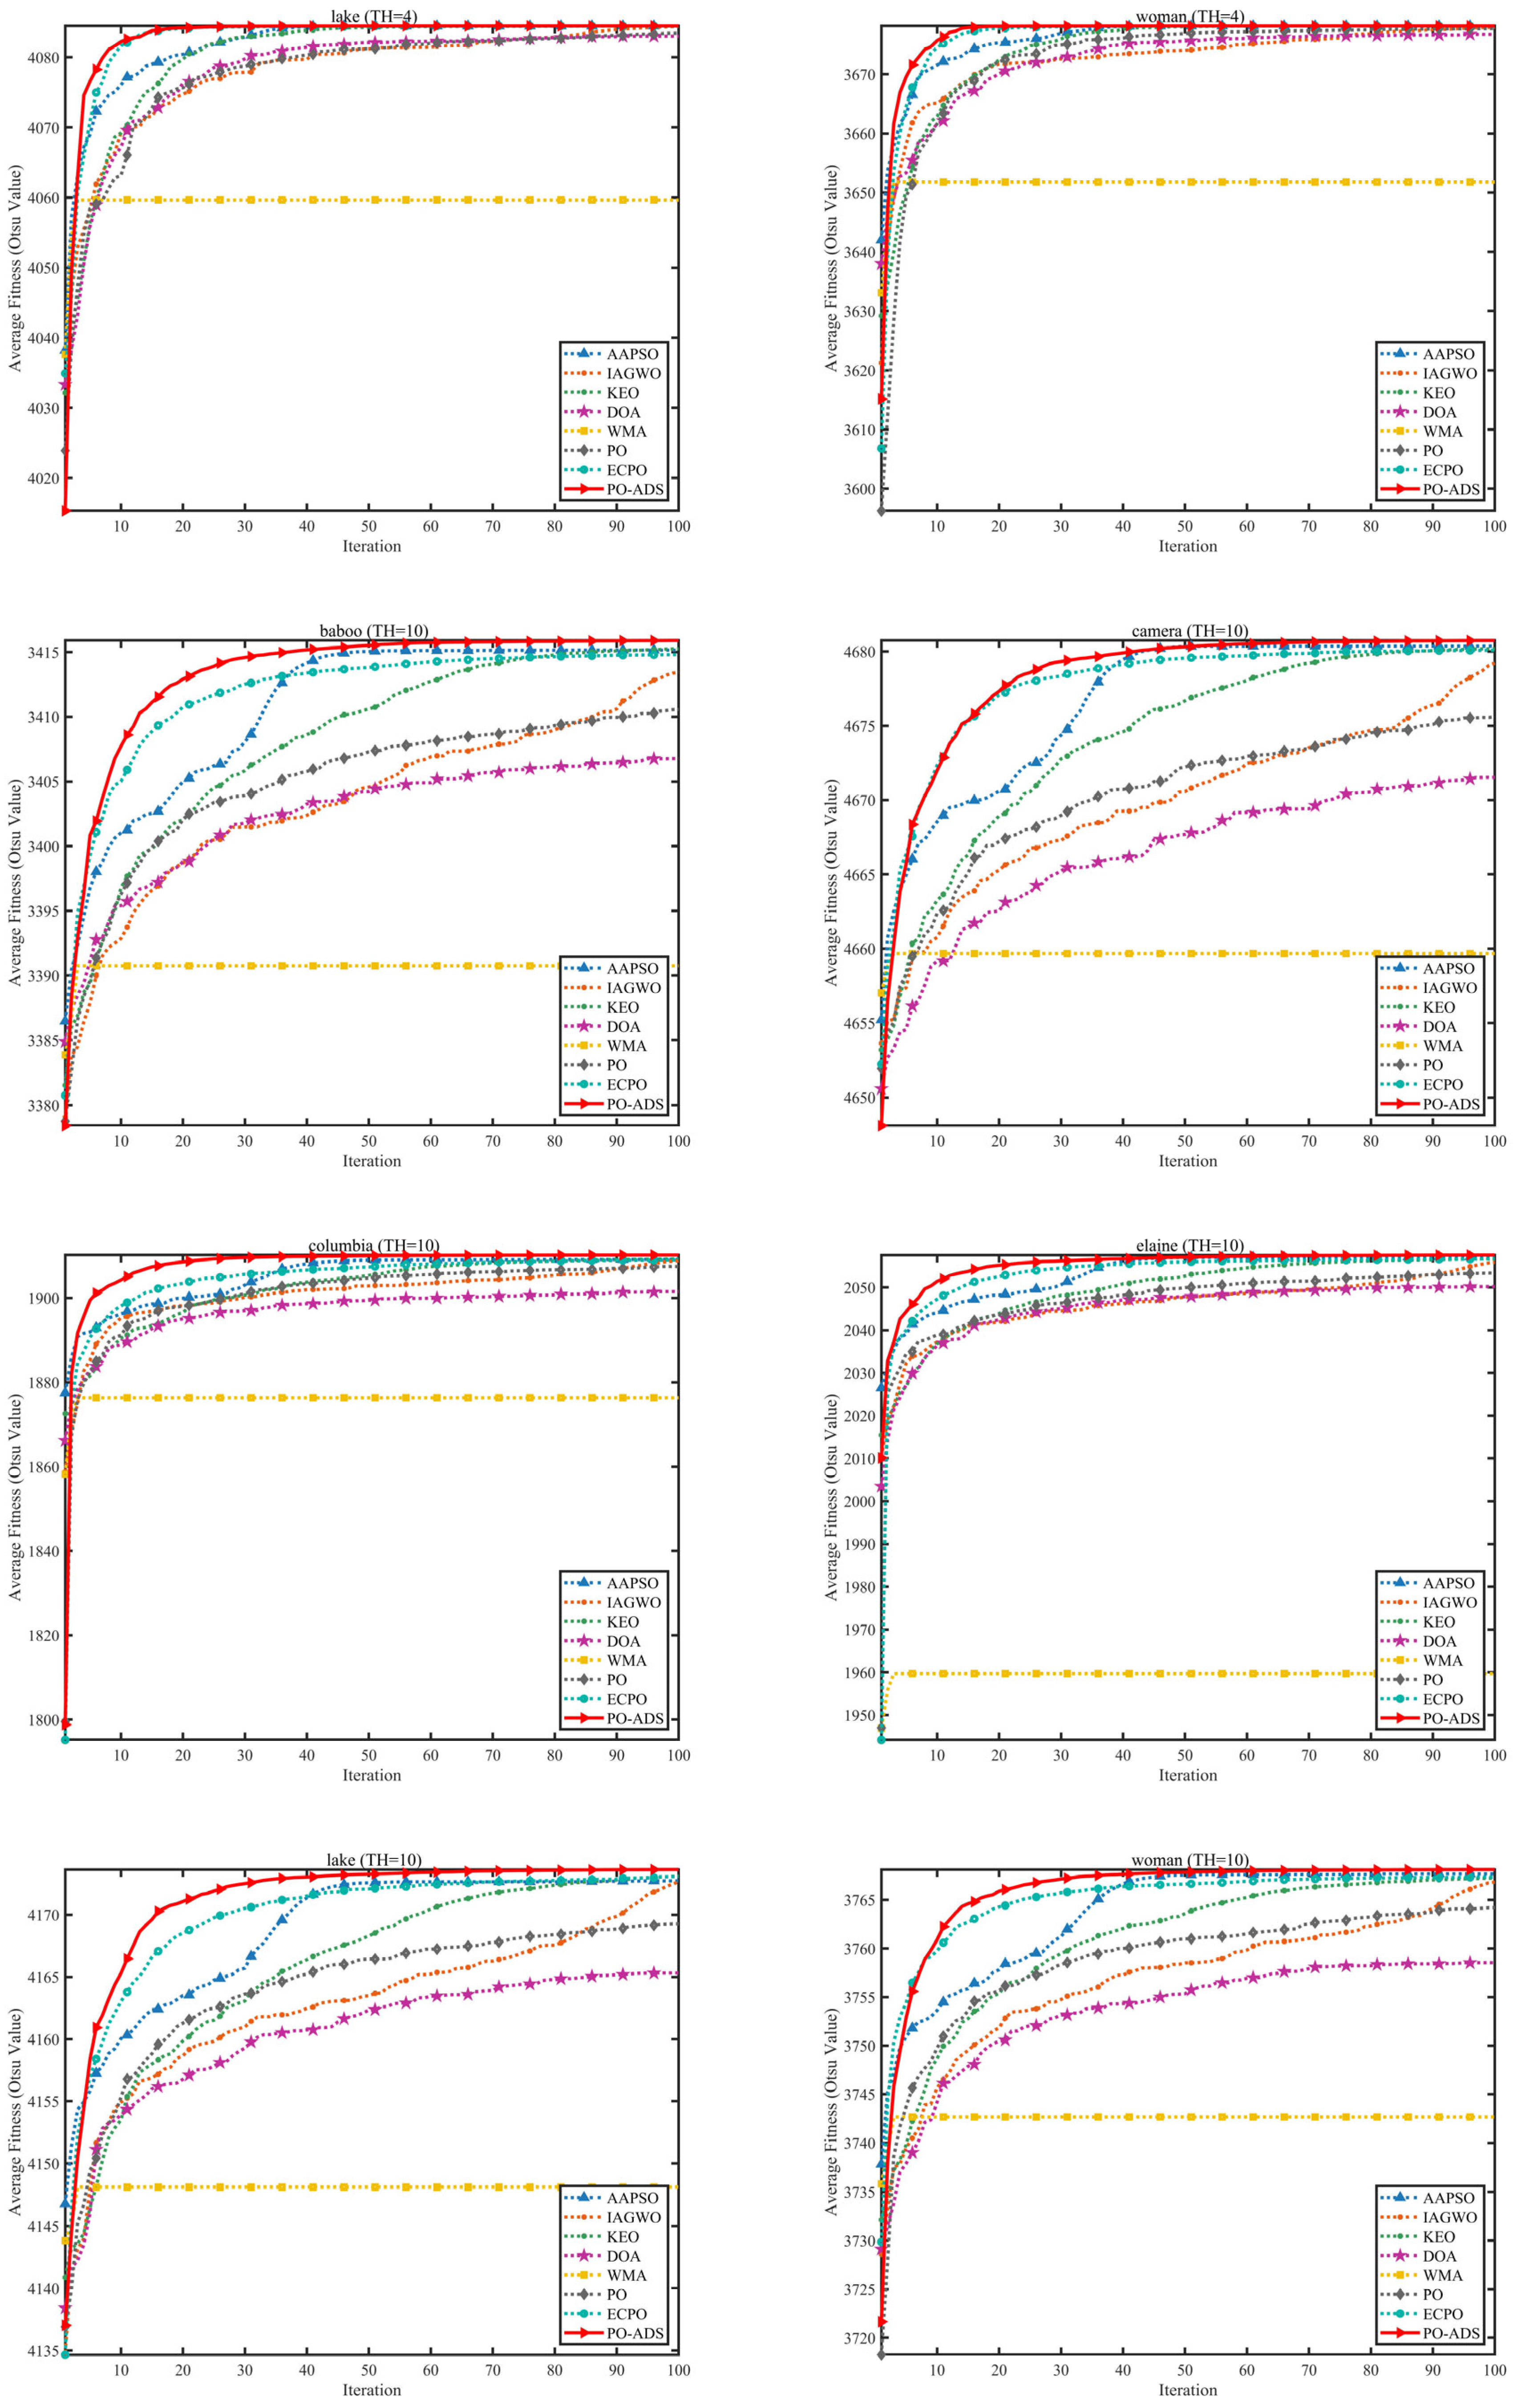
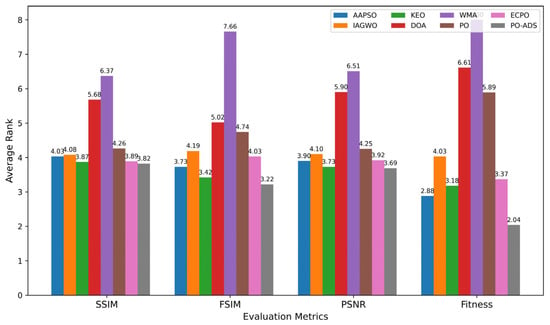
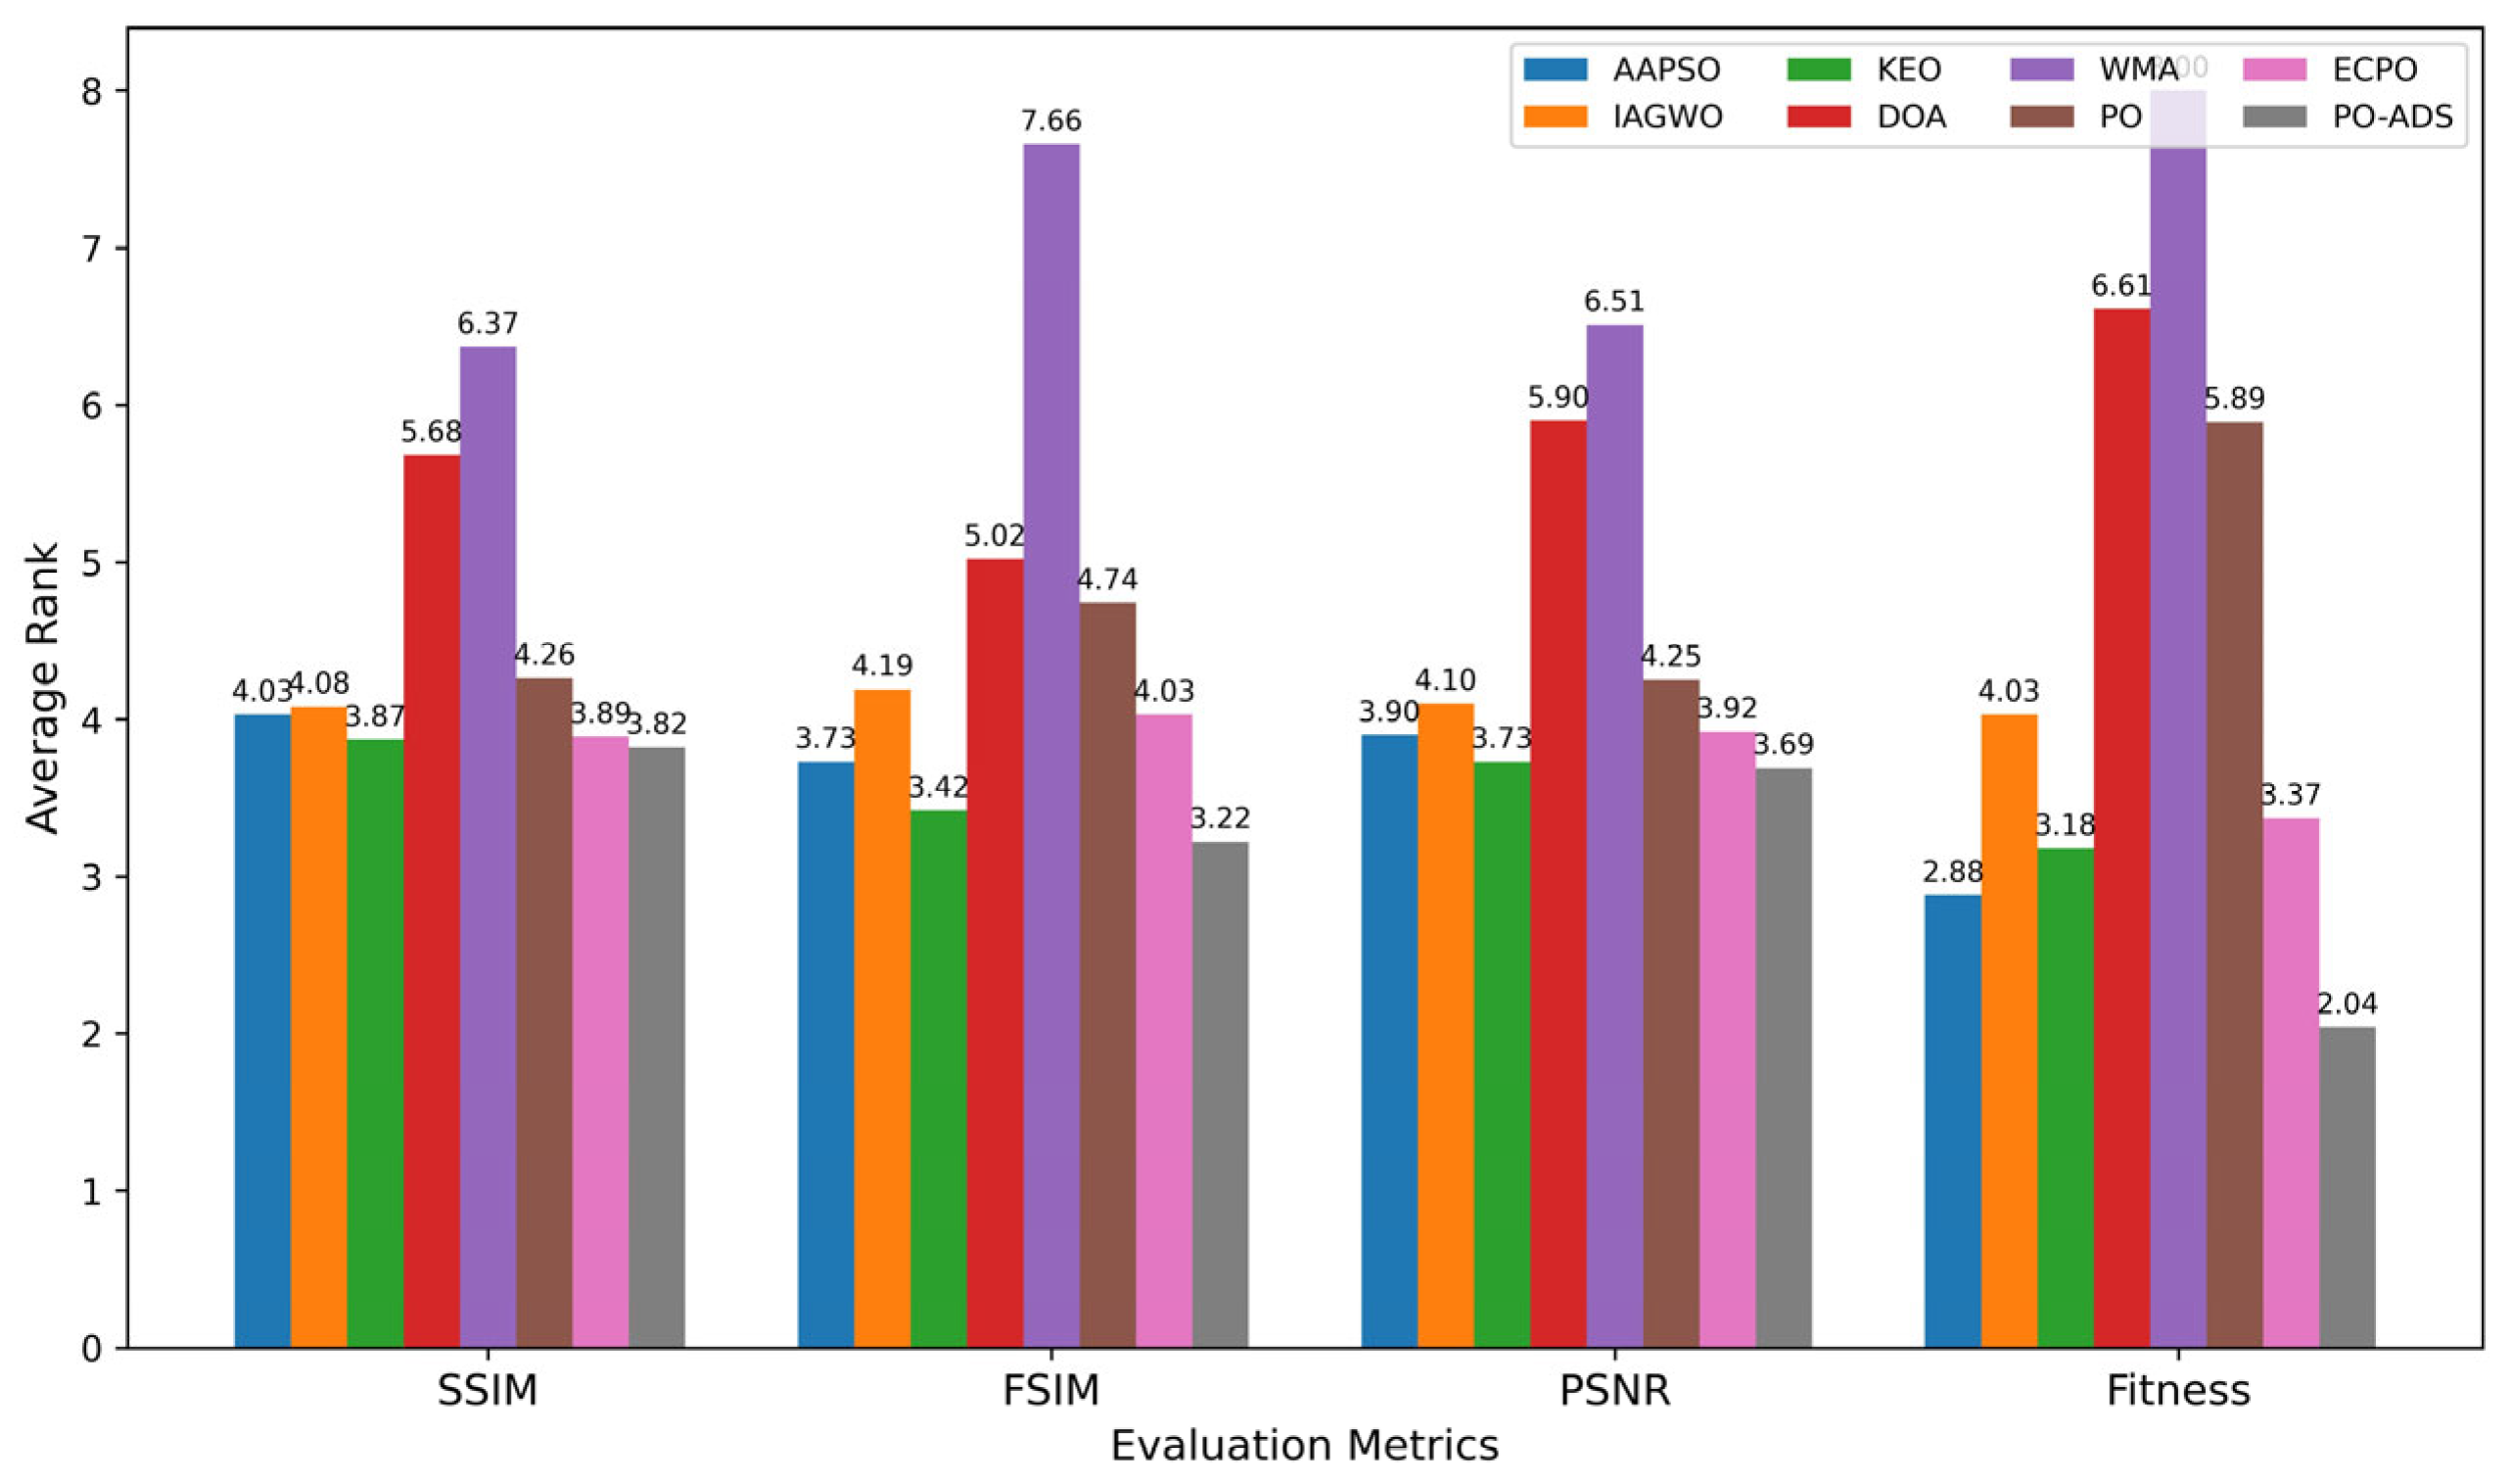

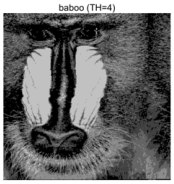
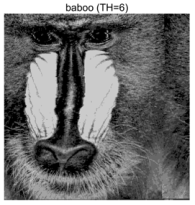
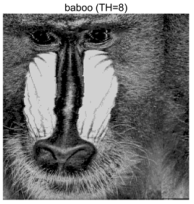
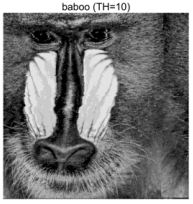
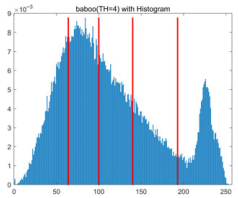
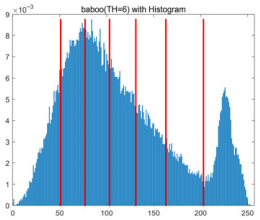
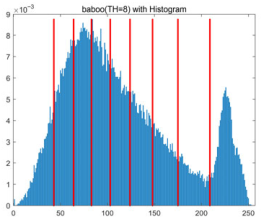
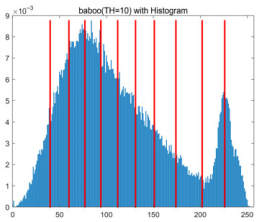
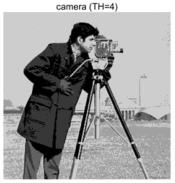
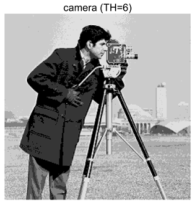
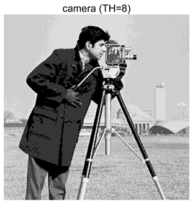
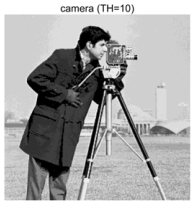
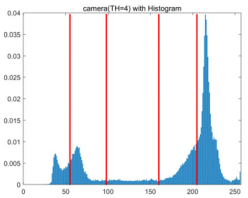
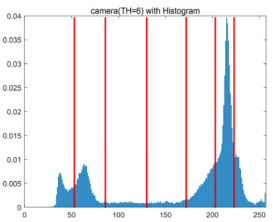
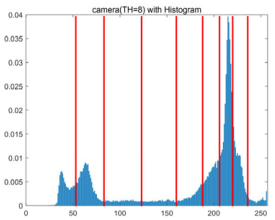
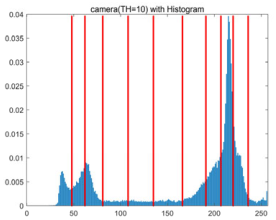
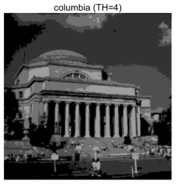
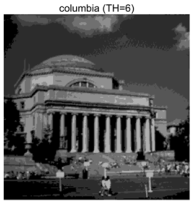
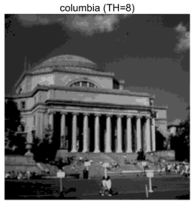
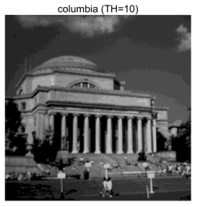
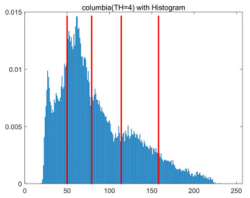
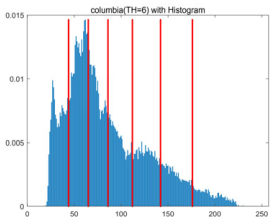
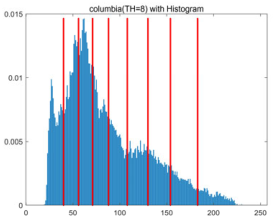
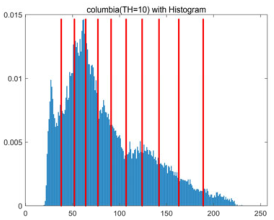
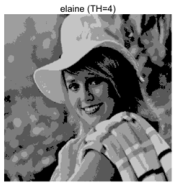
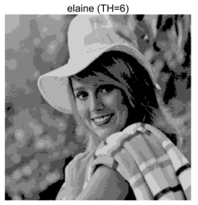
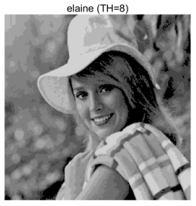
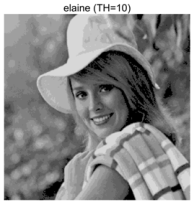
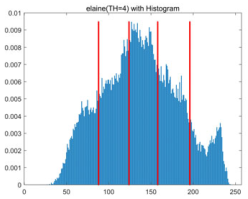
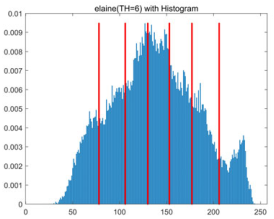
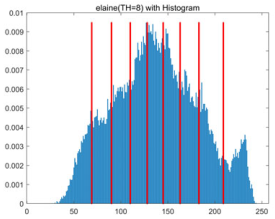
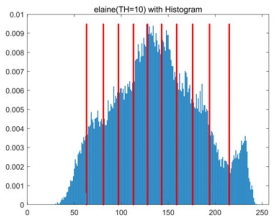
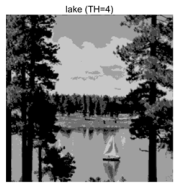
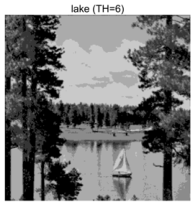
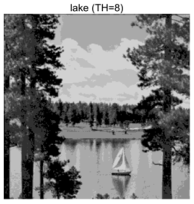
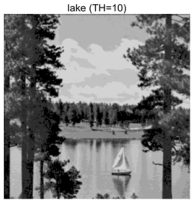
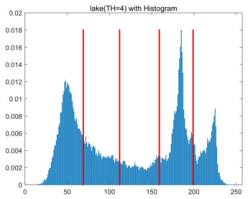
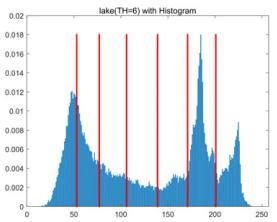
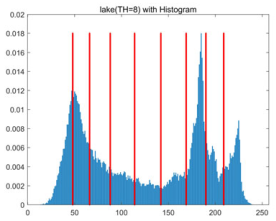
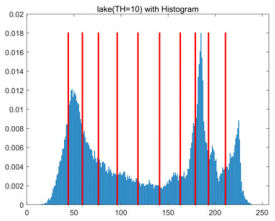
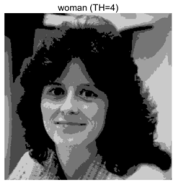
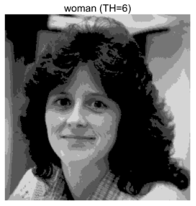
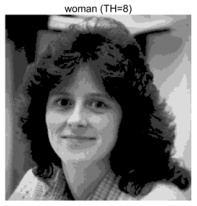
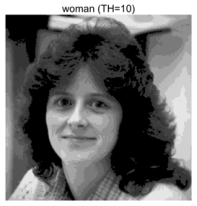
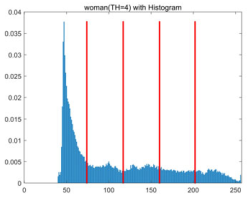
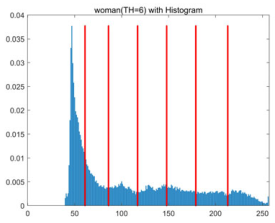
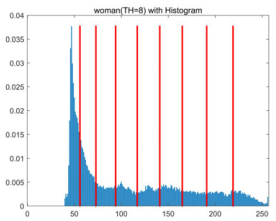
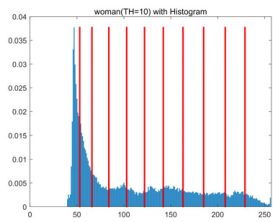
Disclaimer/Publisher’s Note: The statements, opinions and data contained in all publications are solely those of the individual author(s) and contributor(s) and not of MDPI and/or the editor(s). MDPI and/or the editor(s) disclaim responsibility for any injury to people or property resulting from any ideas, methods, instructions or products referred to in the content. |
© 2026 by the authors. Licensee MDPI, Basel, Switzerland. This article is an open access article distributed under the terms and conditions of the Creative Commons Attribution (CC BY) license.