


Abstract
Inspired by the concept of symmetry in functional representation, complex nonlinear relationships can be decomposed into combinations of lower-dimensional functions, providing an interpretable framework for modeling high-dimensional systems. With the continuous growth of road traffic volume in China and the rapid acceleration of urbanization, traffic safety issues have become increasingly prominent. To address the limitations of traditional traffic accident prediction models—including insufficient spatial information representation, weak nonlinear fitting capability, and poor interpretability—this study proposes an improved Kolmogorov–Arnold Networks (KANs) model. Specifically, a spatial embedding module, a multi-scale spline mechanism, and a residual connection structure are incorporated into the original KAN framework to enhance its ability to capture spatial heterogeneity and complex nonlinear relationships in traffic accident data. Experimental results demonstrate that the improved KAN model achieves a 2.38% increase in the coefficient of determination, while reducing the mean absolute deviation and mean squared prediction error by 24.89% and 34.69%, respectively, indicating a significant improvement in both prediction accuracy and model stability. Furthermore, the proposed model enhances interpretability by visualizing variable relationships through spline functions, enabling intuitive analysis of nonlinear effects. Overall, the improved KAN model exhibits strong capability in modeling spatially non-stationary and nonlinear structures, making it a promising tool for macroscopic traffic safety modeling with substantial application potential and practical value.
1. Introduction
The rapid growth of road traffic and motorization in China has brought serious traffic safety challenges, and the country’s road traffic safety level still remains significantly lower than that of developed countries in Europe and North America. The revised Road Traffic Safety Law of the People’s Republic of China (2011) stipulates that “scientific research should be strengthened, and advanced management methods, technologies, and equipment should be promoted and applied in road traffic safety management work.” The 12th Five-Year Plan for Road Traffic Safety (2016) proposes that “by 2020, the death rate per 10,000 vehicles in road traffic accidents nationwide shall not exceed 2.2.” Faced with the new situation and requirements of road traffic safety development, exploring advanced traffic safety management theories and establishing a scientific traffic safety management system have become particularly crucial.
Traditional road traffic safety analysis methods mainly focus on ex-post evaluation of the safety level of existing traffic systems and facilities, while lacking forward-looking considerations at the traffic system planning stage. Currently, traffic planning methods prioritize optimizing the supply–demand structure and alleviating traffic congestion, with insufficient attention to safety and a lack of core technologies for effective prediction and quantitative evaluation of traffic safety levels. At present, “traffic safety planning” has become one of the most cutting-edge research directions in the international road traffic industry and academic community [1], requiring integrating traffic safety into all levels of traffic planning and emphasizing the prediction and planning of safety levels from macro to micro perspectives. Among them, the method of linking influencing factors at the traffic planning level with traffic safety levels, namely the regional accident prediction model, has become one of the core technologies in this field. Recent studies have shown that short-term traffic flow prediction plays an important role in traffic safety management. Traffic flow characteristics, such as volume, speed, and density, reflect the operational state of road transportation systems and are closely related to accident risk. Accurate short-term traffic flow prediction can help identify potential congestion and abnormal traffic states in advance, thereby providing important support for proactive traffic management and accident prevention. With the development of deep learning and graph neural networks, various advanced traffic flow prediction models have been proposed [2]. For example, deep learning models combined with multi-source data fusion can incorporate weather and other environmental factors to improve prediction accuracy. In addition, spatial–temporal graph convolution models can effectively capture the spatial dependence and temporal dynamics of traffic networks, leading to more reliable traffic flow forecasting [3]. Therefore, integrating traffic flow prediction with traffic safety analysis provides a new perspective for traffic accident risk assessment and safety management.
Many studies in other countries have quantitatively analyzed the relationship between influencing factors at different planning levels and traffic safety performance. The spatial analysis units include states [4], counties [5,6,7], administrative divisions [8], traffic analysis zones [9,10,11], census tracts [12], and geographic grid areas [13]. Existing studies mainly focus on several aspects such as road network characteristics (highway mileage, road network density, intersection density) [5,6,7,8,9,10], traffic flow characteristics (speed limits, average travel speed, traffic volume) [5,6,7,8,9,10,12], weather characteristics (rainfall, snowfall, annual rainfall days) [5], land use characteristics (commercial areas, residential areas, suburban areas) [11], and various social–economic–demographic characteristics (population, age, gender, employment, income, etc.) [5,6,7,12,13]. Domestically, research has mainly concentrated on the safety analysis of single road facilities such as expressways [14,15] and urban intersections [16], while quantitative studies reflecting the relationship between road network characteristics, social–economic–demographic characteristics, and traffic safety at the regional macro level in China have not yet been carried out.
To thoroughly analyze the complex relationships between macro-level traffic safety, road characteristics, and socio-economic and demographic factors, researchers have introduced various statistical and machine learning methods in recent years. Commonly used negative binomial models (or Poisson–Gamma models) and Poisson–lognormal models assume that the distribution of accidents is spatially uncorrelated, but in reality, accident data exhibit complex spatial distributions. To overcome these limitations, Bayesian Conditional Autoregressive (CAR) models have been widely used in macro traffic safety analysis by introducing CAR residual terms to reflect potential spatial correlations between adjacent regions [5,6,10,12,17,18]. Considering the differences in road characteristics, economic and social conditions among different regions, the relationship between macro traffic safety levels and their influencing factors may vary with spatial locations. By assuming that the regression parameters in the generalized linear model are functions of the spatial location of the data, the Geographically Weighted Poisson Regression (GWPR) model can effectively reveal the spatial non-stationarity of regression relationships [7]. Although the above statistical methods have made certain progress in modeling spatial relationships, they still have limitations in expressive ability and interpretability when facing the complex, nonlinear, and high-dimensional characteristics of provincial-level traffic safety.
In recent years, the widespread application of neural networks in regression and prediction tasks has created new opportunities for traffic safety modeling. Among these methods, KAN, as an emerging neural network architecture, has attracted considerable attention because of its strong nonlinear fitting capability and good interpretability, making it a potential solution to the “black box model” problem. However, the direct application of the KAN model in the traffic field still faces adaptability issues: the model lacks the ability to characterize spatial structure information; the original structure cannot effectively capture multi-scale changes in variables; and deep networks face the risks of gradient vanishing and information loss.
To address the above issues, this study proposes an improved KAN model. By combining the spatial expression ability of statistical modeling with the nonlinear modeling advantages of neural networks, three key innovations are achieved: first, a spatial embedding module is introduced to integrate provincial latitude and longitude, spatial adjacency structure, and geographic zoning information, endowing the model with spatial perception ability; second, a multi-scale spline mechanism is designed to integrate spline kernels of multiple scales (Grid Size) on each edge, thereby capturing both local details and overall trends and significantly improving the model’s expressive ability; finally, drawing on the idea of ResNet, cross-layer residual connections are introduced to effectively enhance the stability of deep models and prevent overfitting and performance degradation. The improved model not only greatly improves the fitting accuracy and generalization ability of accident prediction but also realizes the interpretability of nonlinear variable relationships through the visualization of spline functions, providing a scientific theoretical basis for local governments to formulate differentiated traffic safety intervention measures.
The main contributions of this study can be summarized as follows: (1) An interpretable spatial–nonlinear learning framework is proposed by integrating Kolmogorov–Arnold Networks (KANs) with a spatial embedding mechanism, enabling unified modeling of spatial heterogeneity and complex nonlinear relationships in provincial-level traffic accident data. (2) A multi-scale spline function mechanism is designed by introducing spline kernels of different scales on network edges, allowing for simultaneous characterization of local variations and global trends of explanatory variables, thereby enhancing nonlinear representation capability under small-sample conditions. (3) A residual connection structure is incorporated to improve the training stability of deep spline networks, effectively alleviating gradient vanishing and overfitting issues commonly encountered in small-sample scenarios. (4) Through systematic comparisons with multiple classical statistical models (Poisson model, negative binomial model, Bayesian conditional autoregressive model, and geographically weighted Poisson regression model), as well as benchmark neural network models, the proposed approach is validated to achieve superior performance in terms of prediction accuracy, robustness, and interpretability. (5) Based on spline-function visualization, the nonlinear effects of key influencing factors on traffic accidents are explicitly revealed, providing intuitive decision support for regional traffic safety intervention policies.
The remainder of this paper is organized as follows. Section 2 reviews statistical and machine learning methods related to regional traffic accident analysis. Section 3 introduces the proposed spatially enhanced improved KAN model along with benchmark models. Section 4 describes the data sources, variable processing procedures, and model training strategies. Section 5 presents and discusses the experimental results. Finally, Section 6 concludes the paper and outlines future research directions.
2. Related Work
Traffic accidents exhibit pronounced multi-factor driving characteristics. Their formation mechanisms are not only closely related to traffic exposure levels, but are also jointly influenced by roadway network structure, traffic operating conditions, population socio-demographic attributes, and regional economic development. In regional-scale traffic accident analyses, study units span multiple spatial levels, including states, provinces, cities, and counties, resulting in diverse systems of explanatory variables. A large body of empirical studies has systematically investigated accident mechanisms from perspectives such as roadway network characteristics (e.g., network density and road hierarchy proportions) [5,6,7,8,9,10], traffic flow characteristics (e.g., speed limits, average travel speed, and traffic volume) [5,6,7,8,9,10,12], population structure (e.g., population size and aging level), and socio-economic factors (e.g., income level and GDP per capita) [5,6,7,12,13]. These studies provide important theoretical and empirical foundations for regional traffic safety modeling.
2.1. Statistical and Spatial Statistical Modeling of Regional Traffic Accidents
From a methodological perspective, regional traffic accident frequency analysis has long been dominated by count-based statistical models. The Poisson model, owing to its simple structure and interpretable parameters, has been widely applied to accident frequency modeling [14]. However, the fundamental assumption that the mean equals the variance is often violated in real-world accident data due to overdispersion. To address this issue, the negative binomial regression model introduces an additional dispersion parameter, thereby improving the ability to capture variability in accident counts, and has been extensively used in regional traffic safety studies [5,12].
In macro-level spatial analyses, traffic accident data commonly exhibit significant spatial clustering. To characterize spatial dependence among neighboring regions, Bayesian spatial statistical models have been introduced, among which the conditional autoregressive (CAR) structure is the most widely adopted. Zeng et al. [19] proposed a Bayesian spatial generalized ordered probit (SGOP) model with a Leroux CAR prior to analyze crash injury severity. This model accommodates the ordinal nature of injury severity outcomes and relaxes the monotonicity assumptions of explanatory variables, while explicitly accounting for the strength of spatial dependence. Nevertheless, such models typically rely on linear or quasi-linear predictors, which limits their ability to capture complex nonlinear relationships between explanatory variables and accident risk.
In addition, several domestic studies have conducted macro-level spatiotemporal modeling of traffic accident frequencies, further confirming the importance of spatial correlation in regional traffic safety research [14,15,16,17].
2.2. Spatially Non-Stationary Modeling Methods
Considering the substantial differences in roadway conditions, travel demand, and socio-economic structures across regions, some studies have introduced spatially non-stationary modeling approaches. Geographically Weighted Poisson Regression (GWPR) allows model parameters to vary across space, thereby revealing spatial heterogeneity in the effects of explanatory variables on accident risk. Zhou et al. [7] applied GWPR to traffic behavior research to analyze spatial relationships between illegal parking behavior and multi-source data. Their results demonstrated that GWPR can effectively capture spatial heterogeneity in explanatory effects. Although GWPR has advantages in identifying local effects, its parameter estimates are sensitive to sample size and bandwidth selection, and its stability remains a challenge under macro-scale small-sample conditions.
2.3. Machine Learning and Interpretable Nonlinear Modeling Methods
With the advancement of data-driven approaches, machine learning models have increasingly been applied to traffic accident risk prediction. Neural network models such as multilayer perceptrons (MLPs) demonstrate strong nonlinear fitting capabilities and can overcome the functional form limitations of traditional statistical models. However, these models typically require large sample sizes for effective training, and their internal decision-making processes lack intuitive interpretability. As a result, they are prone to overfitting when applied to macro-level regional datasets with limited sample sizes.
Kolmogorov–Arnold Networks (KANs), as a recently proposed spline-driven neural network architecture, explicitly model complex nonlinear relationships by learning univariate spline functions on network edges, thereby exhibiting potential advantages in both function approximation and model interpretability [20]. Nevertheless, systematic efforts to integrate KAN with spatial information modeling remain limited, and its application to regional traffic accident analysis—where spatial heterogeneity is prominent—has not yet been sufficiently explored.
2.4. Summary
Based on the above review, existing regional traffic accident modeling approaches exhibit different strengths in terms of modeling assumptions, nonlinear representation capability, spatial information characterization, and interpretability. As summarized in Table 1, traditional count-based statistical models and spatial statistical models offer clear structures and effective spatial correlation modeling, but have limited ability to capture complex nonlinear relationships; spatially non-stationary models can reveal local variations but suffer from stability issues under macro-scale small-sample conditions; machine learning models possess strong nonlinear fitting capabilities, yet face challenges related to interpretability and generalization; interpretable nonlinear models partially alleviate the “black-box” problem, but remain limited in their integration of spatial information. Overall, existing methods still struggle to simultaneously account for spatial heterogeneity, complex nonlinear relationships, and model interpretability at the provincial level, which motivates the subsequent research in this study.
Table 1.
Comparison and limitations of existing regional traffic accident modeling methods.
3. Methods
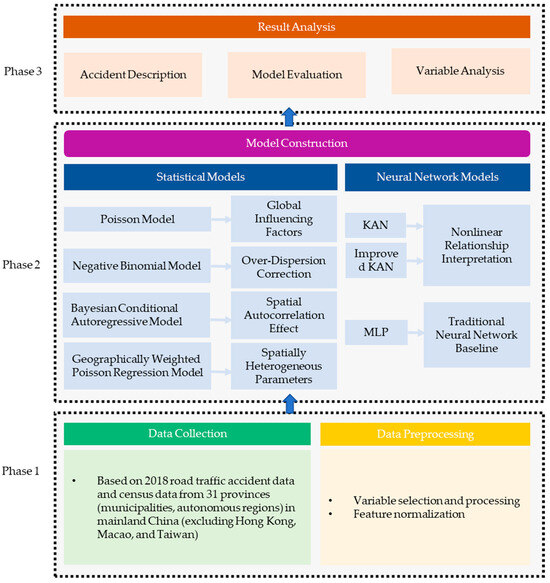
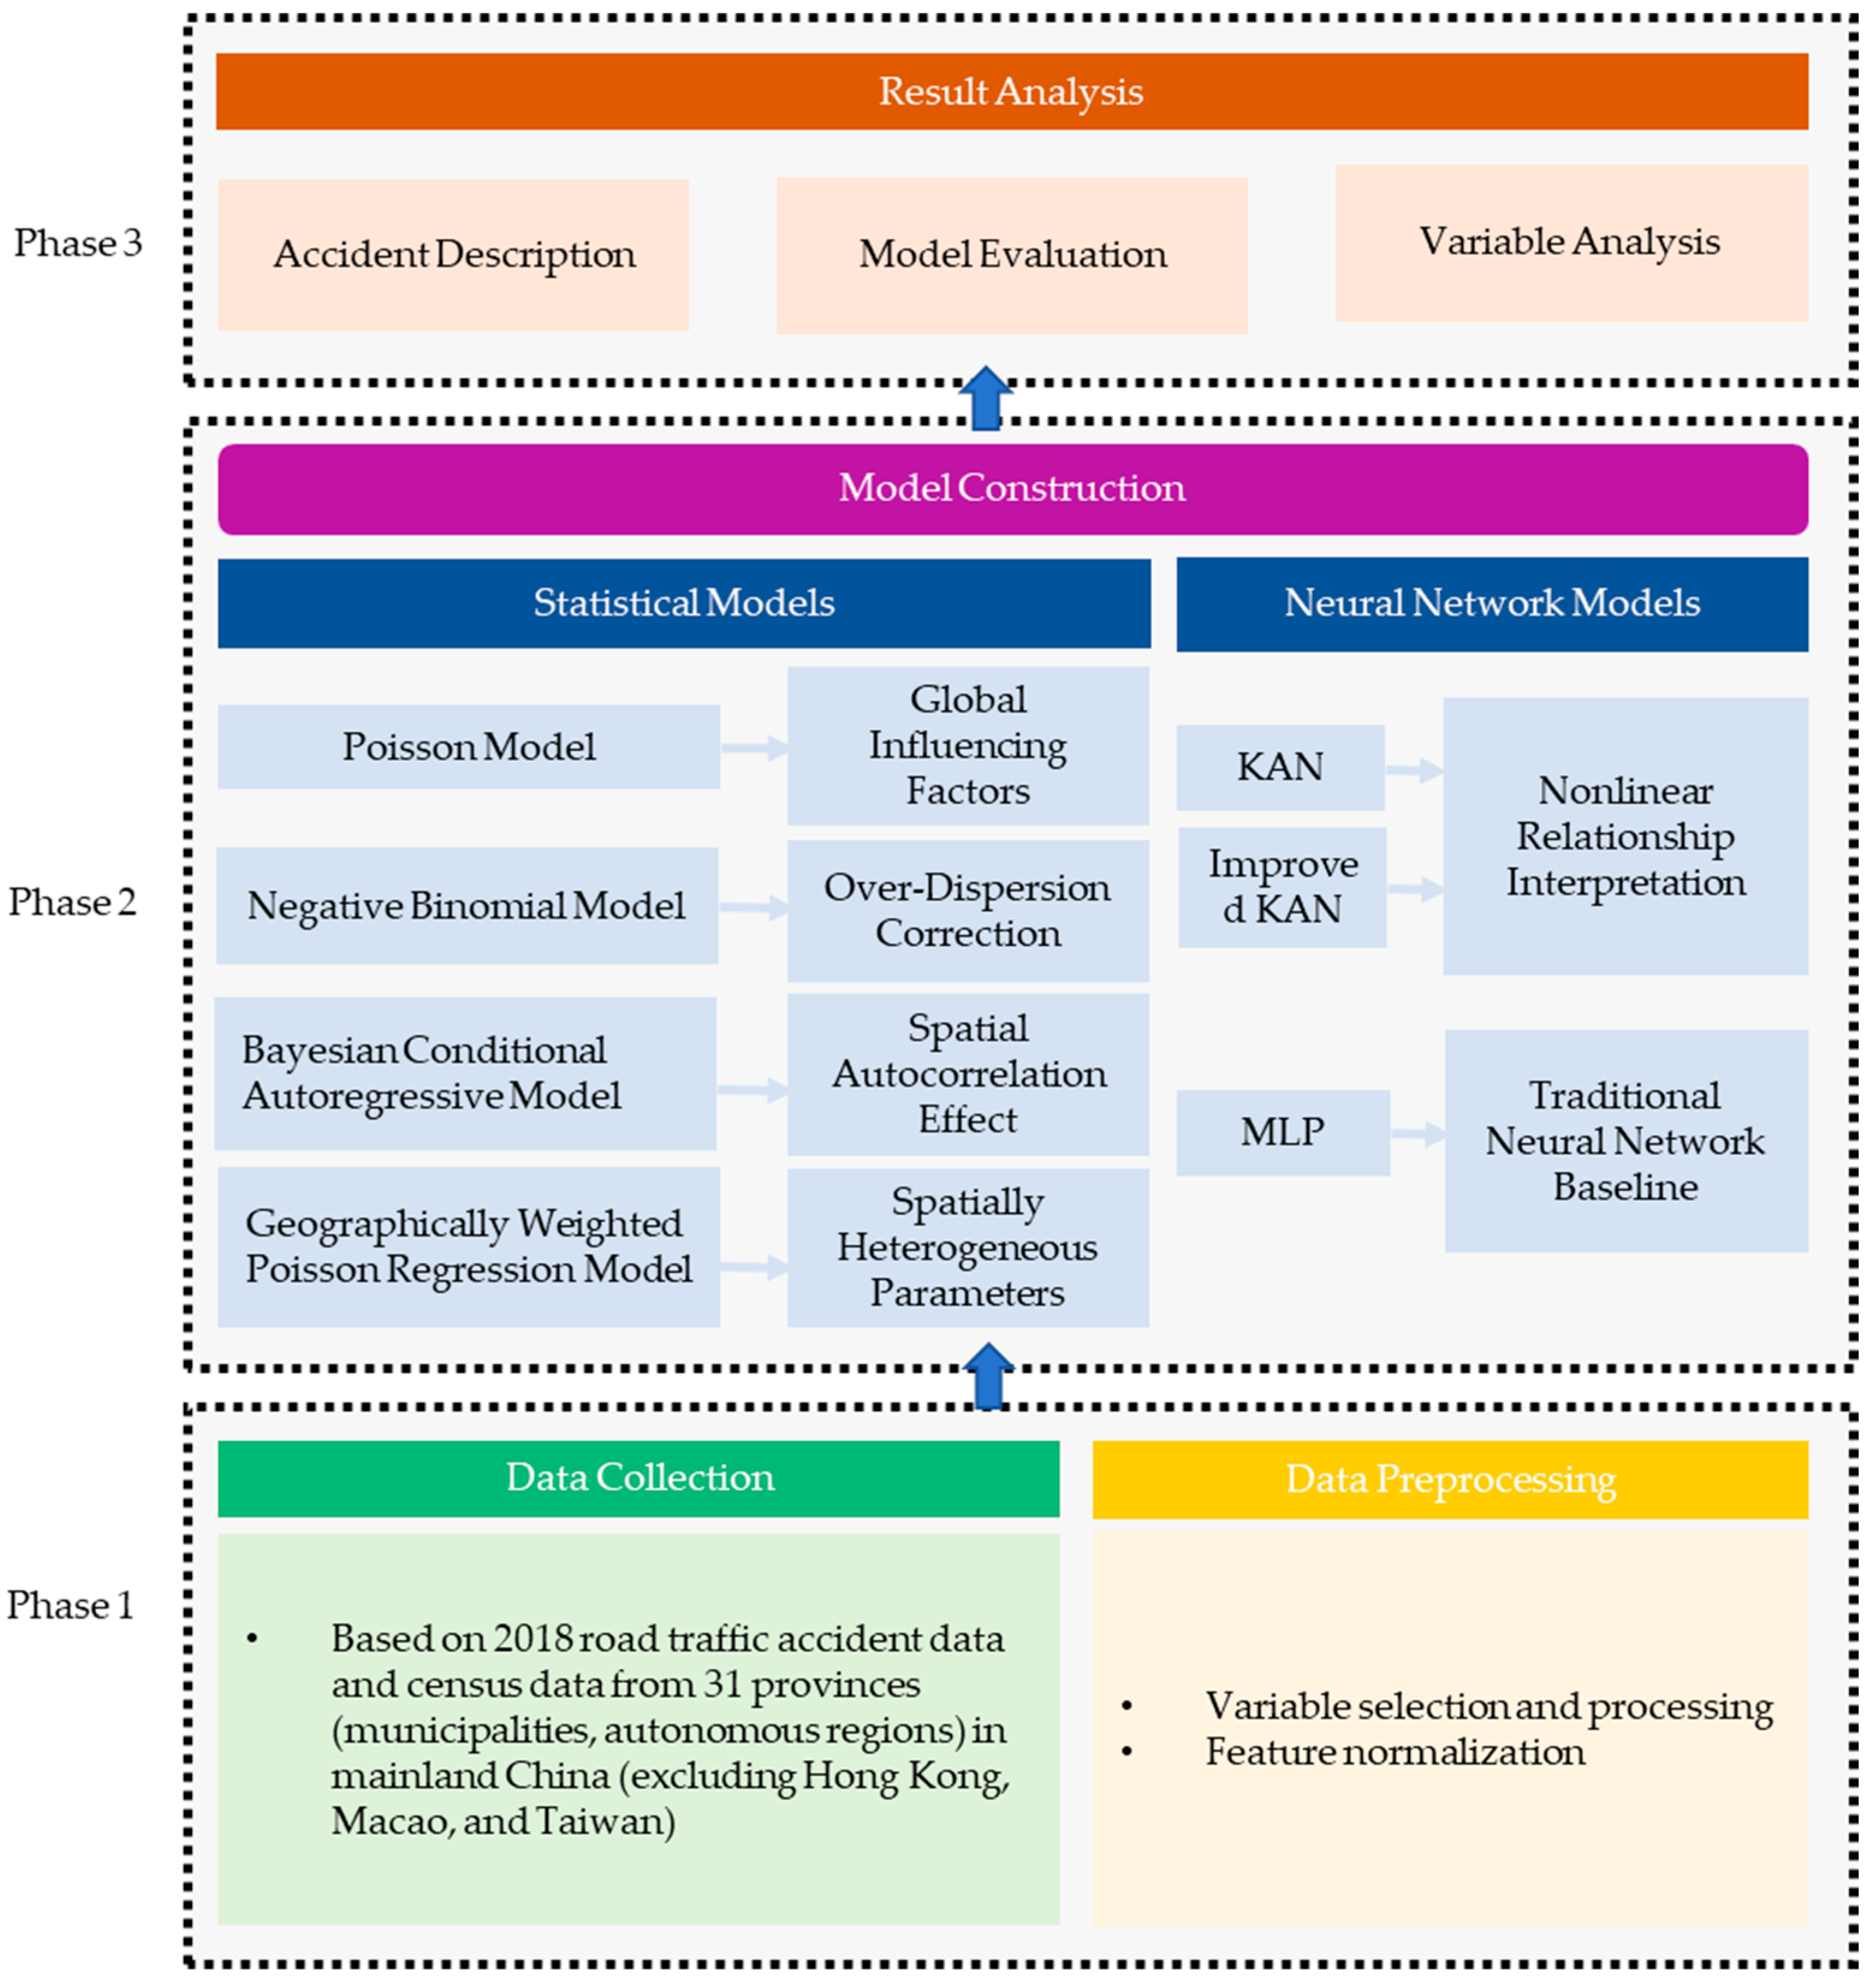
This section details an improved KAN model and four statistical models, comprehensively analyzing the influencing factors of road traffic accidents at the provincial level in China and the predictive modeling of the total number of traffic accidents. Figure 1 shows the flowchart of the method in this paper.
Figure 1.
Flowchart.
3.1. Construction of the Spatial-Enhanced Improved KAN Model
3.1.1. Basic KAN Model Structure
With the development of deep learning and its wide application in regression and prediction fields, traditional neural network structures such as Multi-layer Perceptrons (MLPs) have problems such as large performance fluctuations and difficulty in interpretation when facing complex nonlinear relationship modeling. To further improve the model’s ability to predict the total number of traffic accidents, this chapter introduces an emerging neural network structure—KAN [20]. The KAN model is inspired by the Kolmogorov–Arnold Representation Theorem, which states that any multivariate continuous function can be expressed as a finite combination of univariate functions and their sums. Its mathematical expression is
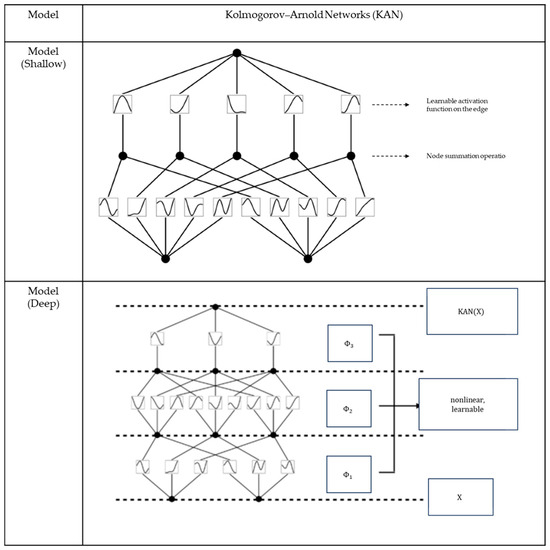
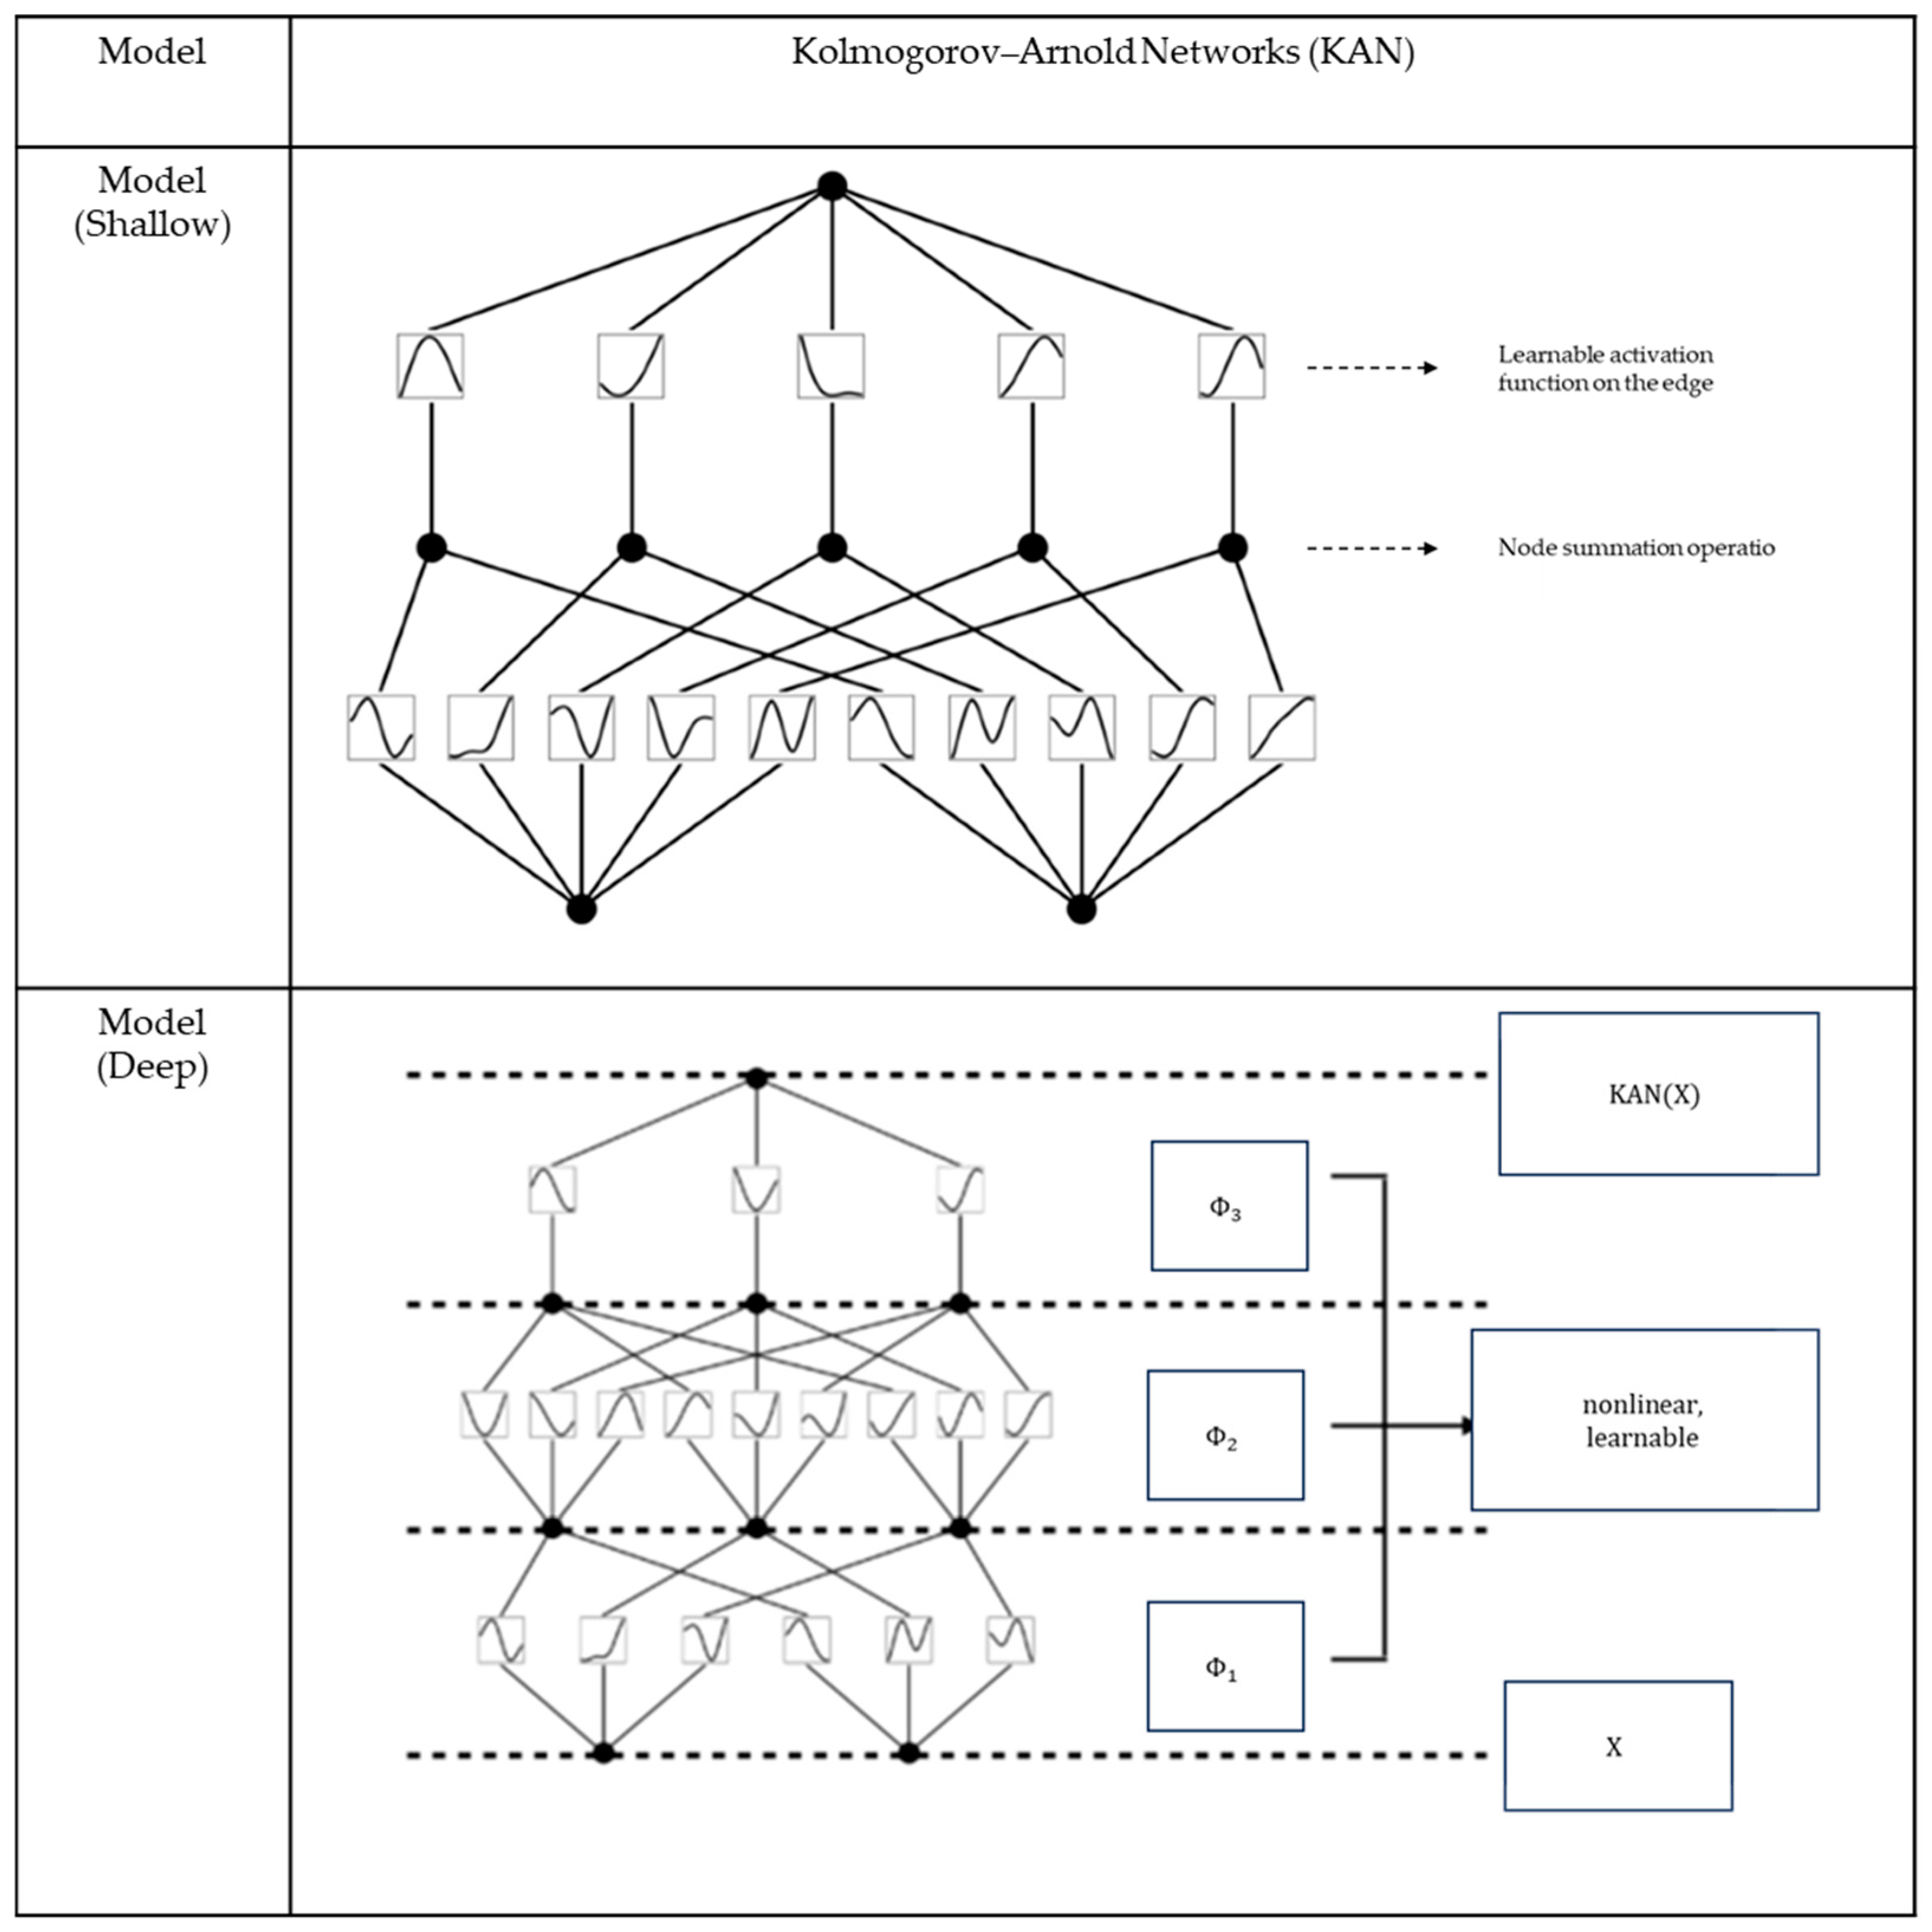
where represents the superposition combination of 2n + 1 terms. are internal functions, and are external functions used to sum the outputs of the internal functions . From the above formula, any multivariate function can be transformed into a form of compound summation of univariate functions. This provides a direct theoretical basis for the network structure of KAN. Figure 2 shows the schematic diagram of the KAN network architecture. The core idea of KAN is to place learnable activation functions (usually parameterized as spline functions) directly on the “edges” (i.e., weight connections) of the network. KAN approximates complex functions by learning these univariate spline functions on the edges, which enables the network to achieve even better accuracy than MLP with fewer parameters in some tasks, and its structure and learned functions are more interpretable. Because the function on each edge can be individually visualized and analyzed, it provides a promising new approach for building more efficient and understandable deep learning models.
Figure 2.
KAN network architecture (adapted from [20]).
3.1.2. Improved Mechanisms for Spatial Non-Stationarity
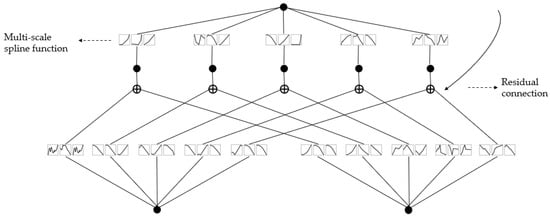
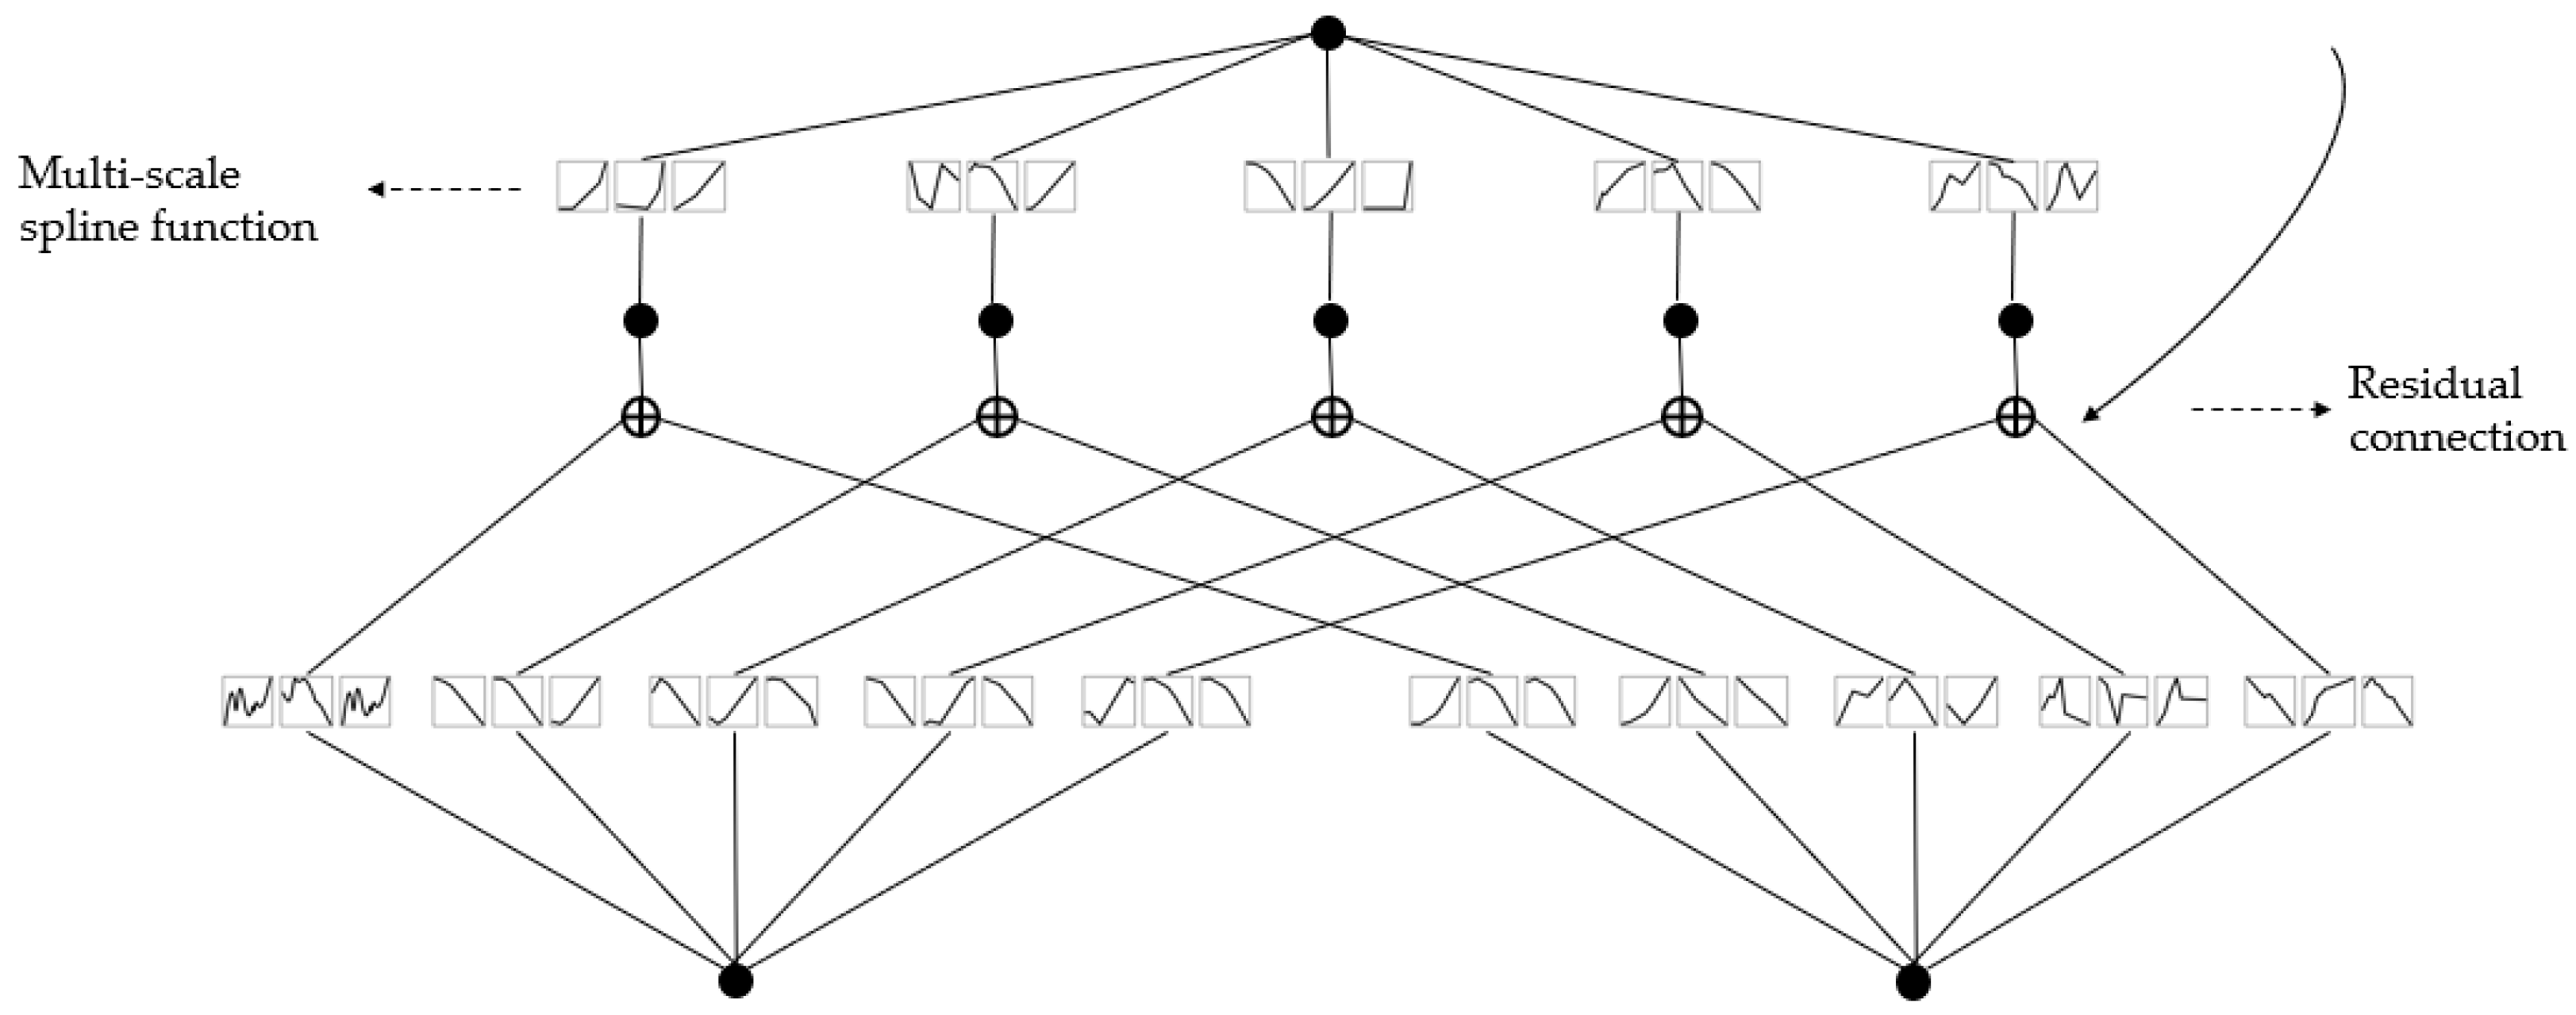
To further enhance the applicability and expressive capability of the KAN model for provincial-level traffic accident prediction in China, three improvement strategies are introduced based on the original KAN structure. The improved network structure is shown in Figure 3.
Figure 3.
Improved KAN network architecture.
- (1)
- Spatial Embedding Module: Considering the significant differences in geographical location, road network structure, and social and economic development among provinces in China, to enhance the model’s ability to characterize regional spatial heterogeneity, a “spatial embedding module” is added to the input features. This module includes:
- Normalized latitude and longitude coordinates of the geometric center of each provincial administrative division;
- Feature convolution output of the adjacency matrix to reflect the mutual influence between adjacent regions;
- One-hot encoding of provincial categories (e.g., Eastern/Central/Western) to represent geographic zonal characteristics. This spatial information is concatenated with the original explanatory variables at the model input layer as the complete input features of the KAN network, enabling the model to have the ability to perceive spatial structures when processing provincial-level data.
- (2)
- Multi-Scale Spline Function Mechanism: The core of KAN is the learnable one-dimensional spline functions on the edges, which are used to characterize the nonlinear mapping relationship between input variables and target variables. To enhance the model’s ability to analyze variable change patterns, this paper proposes a multi-scale spline mechanism:
- Introduce spline kernels of multiple different scales on each edge;
- Each group of scale kernels extracts information of different granularities, such as local drastic changes or overall trends;
- Multi-scale outputs are combined through concatenation and weighting and transmitted to subsequent layers.
This mechanism enables the model to not only finely fit the local changes of the input features but also to capture their overall trend characteristics, thereby improving the model’s expressive ability and generalization performance under small sample conditions.
- (3)
- Residual Connection Design: To alleviate the problems of gradient vanishing and information loss that may occur in deep neural network structures, this paper draws on the idea of ResNet and introduces a “residual connection” structure between the input and output of each layer of KAN.
This connection mechanism not only helps stabilize the training process of the model, but also provides a bridge for information fusion among multi-scale spline features, thereby improving overall modeling efficiency.
3.2. Setting and Comparison of Benchmark Statistical Models
3.2.1. Poisson Model
The Poisson model is suitable for describing the discreteness and randomness of road traffic accidents, as well as the characteristic that accident frequency is a non-negative integer. Assume that the number of accidents in the i-th province follows a Poisson distribution:
where is the intensity parameter of the Poisson distribution, reflecting the expected number of accidents in the province within a year. Taking the logarithm of , a linear relationship with explanatory variables is established:
where represents the exposure variable (number of registered vehicles) in the i-th province, represents the k-th explanatory variable in the i-th province, and , , and are the coefficients to be estimated.
3.2.2. Negative Binomial Model
An important limitation of the Poisson model is the assumption that the mean and variance of accidents are equal. However, the variance of accident data is often significantly greater than the mean. The negative binomial model considers the over-dispersion characteristics of accidents and has become one of the mainstream accident prediction models. Assume that the number of accidents in the i-th province follows a negative binomial distribution:
where is the over-dispersion coefficient. In the negative binomial model, the variance of the number of accidents in the i-th province is
Taking the logarithm of , a linear relationship with explanatory variables is established:
3.2.3. Bayesian Conditional Autoregressive Model
Spatial correlation widely exists in adjacent regions and has a significant impact on the results of model parameter estimation. On the basis of the negative binomial model, by introducing conditional autoregressive residual terms, the Bayesian Conditional Autoregressive model can better fit the potential spatial correlations between adjacent regions [5,6,10,12,17,18]. The model is established as follows:
where follows a prior distribution satisfying conditional autoregressive [19]:
where , and is the element of the spatial adjacency matrix . If the i-th province is adjacent to the j-th province, ; otherwise, it is 0. In this study, Hainan Province is considered adjacent to Guangdong Province. , and is the precision parameter of the prior conditional autoregressive model.
In Bayesian estimation, non-informative prior distributions are set for model parameters [6]:
The WinBUGS software (version 1.4.3) [21] is used for parameter estimation of the above model.
3.2.4. Geographically Weighted Poisson Regression Model
The above models can be collectively referred to as global models (or static coefficient models), whose basic assumption is spatial homogeneity. However, there are certain differences in road characteristics, economic and social conditions among different provinces, and the relationship between macro traffic safety levels and their influencing factors may vary with spatial locations. Based on the idea of local smoothing, the Geographically Weighted Poisson Regression model assumes that the regression parameters in the generalized linear model are functions of the spatial location of the data to explore the spatial non-stationarity of regression relationships. The model is as follows:
where are the spatial coordinates of the geometric center of the i-th province, and is the coefficient to be estimated for the k-th variable in the i-th province. Based on the assumption that “observational data close to the i-th province make a greater contribution to the estimation of ”, parameters can be estimated using the following formula:
where is the independent variable matrix, is its transpose matrix, is the dependent variable matrix, and is the spatial weight matrix:
where is the weight of the j-th province relative to the i-th province, which can usually be calculated by the following two kernel functions:
- Fixed Gaussian kernel:
- Adaptive bi-square kernel:
The GWR4.0 software [24] is used for parameter estimation of the geographically weighted Poisson regression model.
4. Model Training and Performance Verification
4.1. Data Description
Data from 31 provinces (municipalities directly under the Central Government and autonomous regions) in mainland China in 2018 are adopted, including road traffic accident data, road characteristic data, and various social–economic–demographic characteristic data.
Accident data and road characteristic data are obtained from the Statistical Yearbook of Road Traffic Accidents of the People’s Republic of China (2015 Edition) issued by the Traffic Management Bureau of the Ministry of Public Security, and social–economic–demographic data are obtained from China’s Sixth National Population Census (2010). Data aggregation processing is performed based on GIS maps to obtain provincial-level variables as follows: (1) Accident data: Number of traffic accidents, number of deaths and injuries in accidents, and direct property economic losses; (2) Road characteristic data: Total road mileage, road mileage classified by technical grade (expressway/Class I/Class II/Class III/Class IV/substandard), and road mileage classified by administrative grade (national highway/provincial highway/county highway/township highway/special highway/village highway); (3) Social–economic–demographic data: Regional area, number of registered vehicles, number of registered drivers, Gross Domestic Product (GDP), resident population, population classified by age (0–14 years old/15–64 years old/65 years old and above), population classified by gender (male/female), and employment status (number of unemployed population aged 16 and above). Although the socio-economic data are obtained from the 2010 national population census and the accident data are derived from the 2015 Statistical Yearbook of Road Traffic Accidents, structural socio-economic indicators at the provincial level tend to change relatively slowly over short periods. Therefore, such data integration is considered reasonable in macro-level traffic safety studies. Potential biases arising from this temporal inconsistency are acknowledged and discussed as a limitation of this study.
4.2. Data Preprocessing
4.2.1. Variable Selection and Processing
To reflect the impact of various factors on traffic safety levels, preprocessing is performed on the original data. The total number of accidents is defined as the response variable of the model. In the case of numerous factors and multiple collinearity among factors, the selection of model explanatory variables is challenging. Model fit and parsimony are two important indicators. Previous studies have suggested using vehicle miles traveled as the exposure variable (EV). Due to the lack of corresponding data, this study first conducts modeling analysis on the total population and the number of registered vehicles respectively, and selects the number of registered vehicles as the exposure variable based on the model fit. Through exploratory data analysis, other variables are gradually added to the model, and a set with higher fit is selected as the final explanatory variables while ensuring model parsimony and variable significance. The descriptive statistical results are shown in Table 2.
Table 2.
Statistical description of variables.
4.2.2. Feature Normalization
In the original real-world data, input features include the number of registered vehicles, road network density, proportion of expressways, per capita GDP, proportion of population aged 65 and above, proportion of female population, regional area, etc., and the output is the total number of traffic accidents in each province. To improve the stability of model training, all input features are normalized using the Min-Max normalization formula:
4.3. Accident Description
According to the 2018 data, a total of 219,548 traffic accidents occurred in 31 provinces in China, resulting in 65,207 deaths. The minimum was 781 accidents in the Tibet Autonomous Region with 409 deaths, and the maximum was 30,370 accidents in Guangdong Province with 6203 deaths. The standard deviations of the number of accidents and deaths were 6343.48 and 1436.82, respectively, with a large variation range. It can be seen that accidents are relatively concentrated and the number of deaths is relatively high in the central and eastern coastal regions, while accidents are relatively few in the northeastern and western regions. Previous studies have shown that the spatial distribution of accidents is closely related to factors such as regional economic development level, population distribution, and travel activities. The central and eastern coastal regions have a high level of economic development and relatively dense population, resulting in relatively high accident frequency and number of deaths.
4.4. Training Strategy
To verify the effectiveness of the MLP, KAN, and improved KAN models, training and testing experiments are conducted based on real-world traffic accident datasets in this chapter. Considering the small number of data samples, a 5-fold cross-validation strategy is adopted to divide the dataset to enhance the generalization ability and robustness of the model. In each fold, 80% of the samples in the training set are used for model training, and the remaining 20% are used for validation to evaluate model performance. Although the sample size in this study consists of only 31 provincial administrative units, the adopted KAN model differs fundamentally from traditional deep neural networks that rely on high-dimensional weight matrices. By modeling nonlinear relationships through univariate spline functions, KAN significantly reduces parameter complexity and is more suitable for small-sample regression scenarios. In addition, the multi-scale spline mechanism and residual connection structure impose effective constraints on model flexibility. Combined with the five-fold cross-validation strategy, these designs help mitigate overfitting risks and improve model generalization performance.
4.5. Model Evaluation Criteria
, Mean Absolute Deviance (MAD), and Mean Squared Predictive Error (MSPE) are used for scientific evaluation of candidate models. Their calculation methods are written as follows:
where is the predicted mean number of accidents in the i-th province, and is the observed mean number of accidents in 31 provinces. For the Poisson model, negative binomial model, and Bayesian conditional autoregressive model, the Deviance Information Criterion (DIC) [25] can be used for evaluation. Its calculation method is as follows:
where is used to measure model fit and is the number of effective parameters, used to measure model complexity.
A smaller DIC indicates a better model. A DIC difference greater than 5 indicates a significant difference between models [25].
5. Results Analysis
5.1. Comparison of Nonlinear Modeling Capabilities of Neural Network Models
To verify the performance of the improved KAN model, it is compared with the basic KAN model and the traditional MLP model, using R2, MAD, and MSPE for evaluation. Table 3 lists the experimental results of the three models on the real-world dataset. The experimental results show that the improved KAN model outperforms the original KAN and MLP models in all evaluation indicators, demonstrating excellent fitting ability and generalization performance. Specifically, compared with the MLP model, the improved KAN model increases R2 by 3.83%, and reduces MAD and MSPE by 99.63% and 99.99%, respectively; compared with the original KAN model, its R2 is increased by 2.38%, and MAD and MSPE are reduced by 24.89% and 34.69%, respectively. These results fully reflect the significant improvement in model performance after introducing the multi-scale spline mechanism and residual connections.
Table 3.
Evaluation of KAN and MLP models.
The overall performance of the improved KAN model, characterized by an increase in R2 and significant reductions in MAD and MSPE, can be primarily attributed to its structured nonlinear modeling mechanism based on spline functions. Unlike multilayer perceptron models that require the simultaneous estimation of a large number of weight parameters, KAN decomposes complex multivariate mappings into multiple interpretable univariate nonlinear sub-functions by learning spline functions on network edges. This property effectively reduces parameter estimation variance and enhances prediction stability under small-sample conditions. Such a structural advantage enables the model to more precisely capture the nonlinear relationships between explanatory variables and traffic accident counts without relying on an increase in model complexity.
To avoid drawing partial conclusions based solely on R2 values or scatter plots, this study further introduces two error-based metrics, MAD and MSPE, to jointly evaluate prediction accuracy and stability. Specifically, MAD reflects the average magnitude of prediction errors, whereas MSPE is more sensitive to large deviations and is therefore useful for assessing model robustness under extreme prediction scenarios. The multi-metric analysis indicates that the significant differences observed among models in terms of error metrics not only reflect disparities in overall predictive accuracy, but also indirectly reveal variations in prediction stability and nonlinear fitting capability, thereby providing a more comprehensive and reliable basis for model performance comparison.
In practical applications, the improved KAN model exhibits three significant advantages: (1) Stronger nonlinear modeling ability: Even in the small-scale provincial dataset with only 31 samples, the improved KAN model can still maintain excellent nonlinear relationship modeling ability, which benefits from its structural design introducing the multi-scale spline mechanism; (2) Better generalization ability: By introducing the residual connection structure, the problems of gradient vanishing and overfitting that may occur in the model under the combination of multi-layer splines are effectively alleviated, thereby improving the robustness under spatially heterogeneous data; (3) Higher interpretability: The visualization mechanism of the spline edge functions inside the model makes the nonlinear mapping relationship between variables and the total number of accidents clearly visible, which is helpful for understanding the mechanism of variable action and intervention in traffic safety management.
These characteristics make the improved KAN model particularly suitable for the provincial-level traffic safety analysis scenario in China: on the one hand, there are significant differences among provinces in economic development, road network structure, etc., requiring the model to adaptively capture spatial non-stationarity; on the other hand, traffic safety management decisions need to clarify the impact mechanism of various factors, and the “black box” characteristic of traditional neural networks often struggles to meet this demand. The breakthroughs achieved by the improved KAN model in these two aspects have important practical value for achieving the goal of reducing the death rate per 10,000 operating vehicles proposed in the 14th Five-Year Plan.
5.2. Performance Verification of Statistical Models
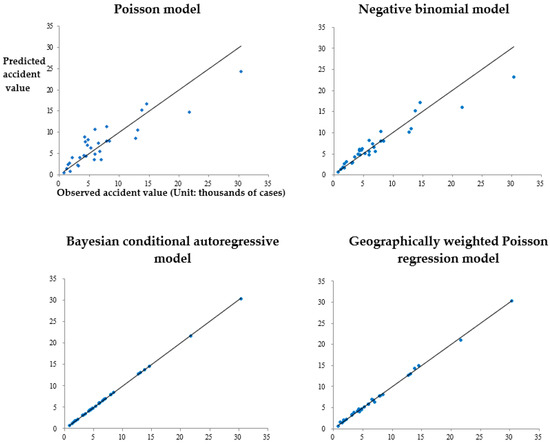
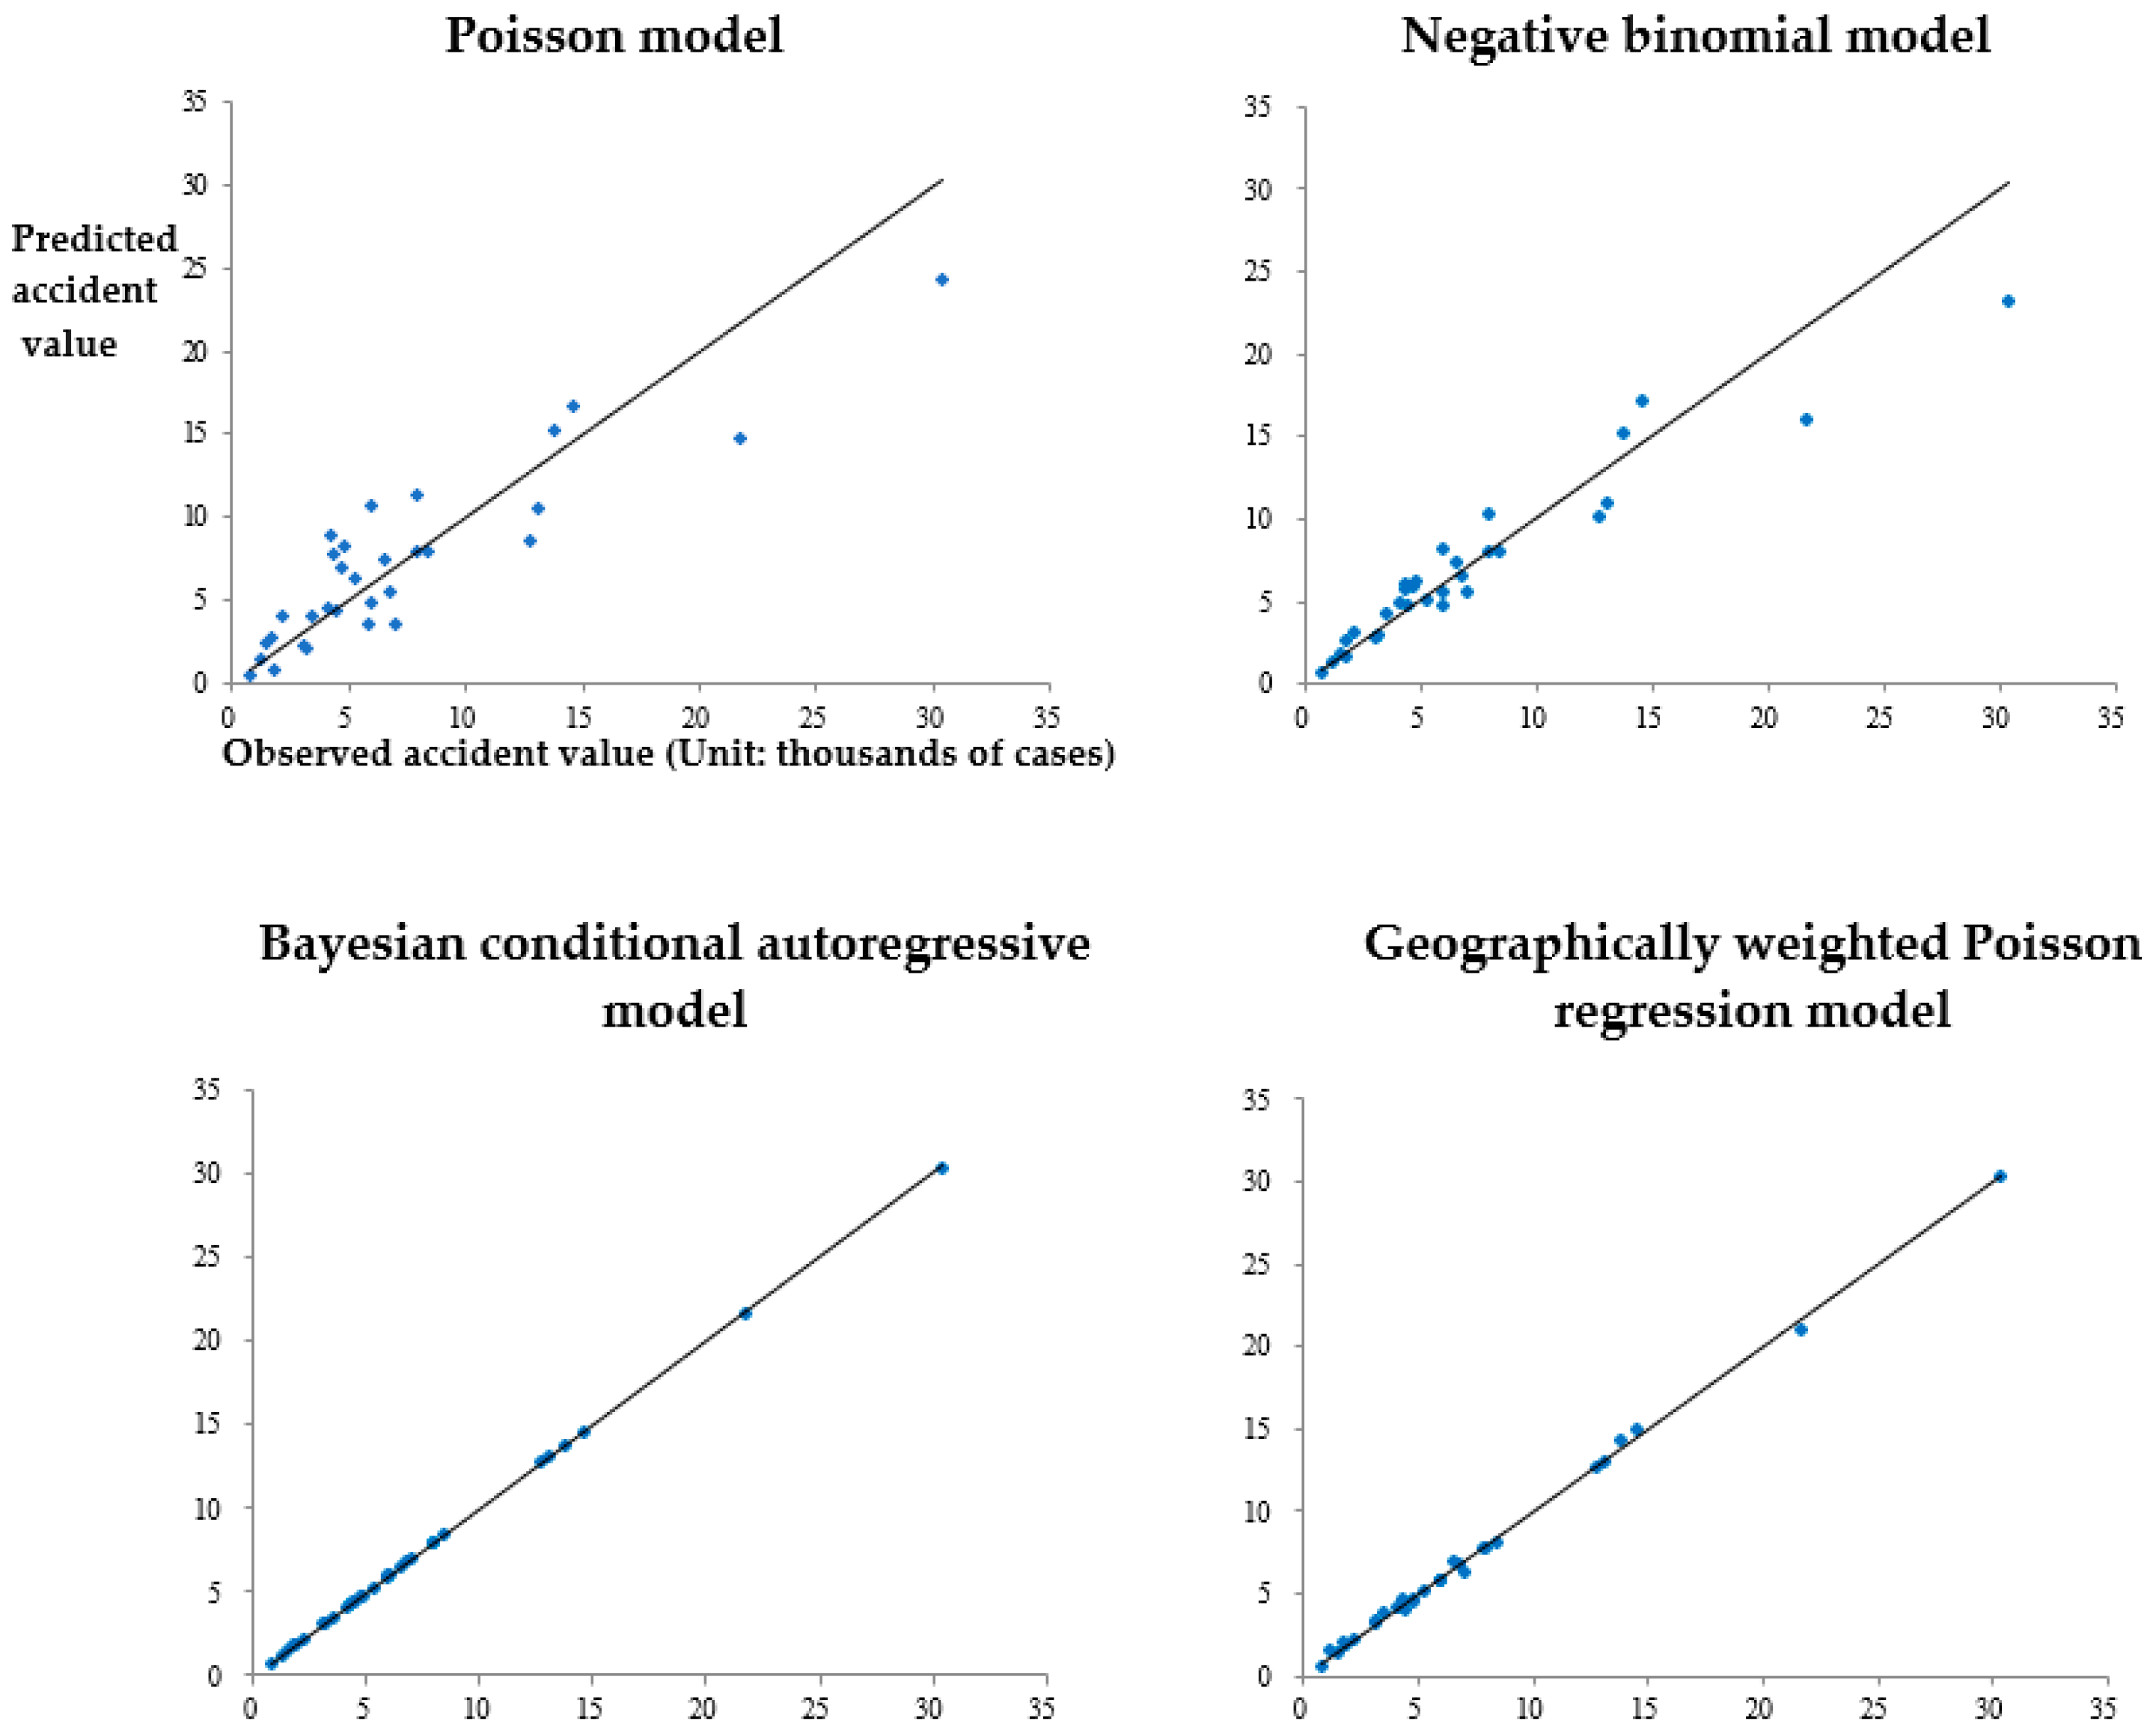
For the geographically weighted Poisson regression model, according to the principle of minimizing AICc, the adaptive bi-square kernel is selected as the kernel function, and the k value in Formula (14) is 13, with an AICc value of 805.65 at this time. The model evaluation results are shown in Figure 4 and Table 4.
Figure 4.
Comparison between the mean value of model accident prediction and the observed value of accidents.
Table 4.
Statistical models evaluation.
The straight line in Figure 4 indicates that the predicted mean number of accidents is equal to the observed number of accidents. Compared with traditional accident prediction models, the deviations between the predicted mean number of accidents and the observed number of accidents of the Bayesian conditional autoregressive model and the geographically weighted Poisson regression model are both small, and the overall model fit is high. Using DIC as the evaluation criterion, as shown in Table 4, for the Poisson model, negative binomial model, and Bayesian conditional autoregressive model, as the model complexity gradually increases (the value gradually increases), the model fit significantly improves (the value significantly decreases). Among them, the Bayesian conditional autoregressive model has the smallest DIC value, indicating that this model performs the best; from the perspective of , both the Bayesian conditional autoregressive model and the geographically weighted Poisson regression model have good overall fit; for the MAD and MSPE indicators, the Bayesian conditional autoregressive model has only 4.13 and 34.24, indicating that it has the most accurate prediction of accidents in this study, followed by the geographically weighted Poisson regression model, and the Poisson model performs the worst.
5.3. Comparative Analysis Between the Improved KAN Model and Statistical Models
A systematic comparison is conducted between the improved KAN model and traditional statistical models (Poisson model, negative binomial model, Bayesian conditional autoregressive model, geographically weighted Poisson regression model). The comparison indicators include , MAD, and MSPE. Experimental results show that the improved KAN model outperforms the Poisson and negative binomial models in all evaluation indicators, with better fitting performance and obvious advantages in handling complex nonlinear relationships. Compared with the Bayesian conditional autoregressive model, the improved KAN retains the spatial structure expression ability while enhancing the model’s generalization performance through the deep neural structure. In terms of error control for certain samples, the improved KAN even surpasses the CAR model and has higher interpretability and visualization capabilities. In addition, compared with the large error fluctuations of the GWPR model in some provinces, the improved KAN shows stronger stability and robustness. From the comparison results, autoregressive models and geographically weighted Poisson regression models exhibit certain advantages in capturing spatial correlation. However, their underlying assumptions are mainly based on linear or quasi-linear relationships, which limits their ability to fully reflect complex nonlinear interactions among multiple factors. In particular, the GWPR model shows large fluctuations in prediction errors for some provinces, indicating sensitivity to local parameter estimation under limited sample sizes. In contrast, by incorporating a spatial embedding mechanism and nonlinear spline functions, the improved KAN model enables joint modeling of spatial heterogeneity and nonlinear relationships, resulting in more stable overall prediction performance and improved error control.
5.4. Variable Analysis
It should be noted that the explanatory variables selected in this study are not arbitrarily defined based on empirical assumptions, but are determined through a comprehensive review of existing multivariate traffic accident modeling studies, in conjunction with the availability and statistical characteristics of provincial-level traffic safety data in China. While maintaining a relatively parsimonious model structure, this variable system is able to characterize traffic accident risk from multiple dimensions, including traffic exposure, roadway conditions, population structure, and regional economic development, thereby providing a reasonable and robust foundation for subsequent nonlinear relationship modeling and analysis. Table 5 shows the model parameter estimation results, with bold values indicating 95% statistical significance in the Bayesian model. The results show that all explanatory variables of the Poisson model are significant, while the negative binomial model and the Bayesian conditional autoregressive model have fewer significant explanatory variables, both 3 (natural logarithm of the number of registered vehicles, proportion of expressways, and per capita GDP); the over-dispersion coefficients in the negative binomial model and the Bayesian conditional autoregressive model are both significant, indicating that the variance of the accident data used in this study is significantly greater than the mean. From the model evaluation in the previous section, the geographically weighted Poisson regression model performs worse than the Bayesian conditional autoregressive model, which may be because the model ignores the over-dispersion characteristics of accidents; the CAR effect in the Bayesian conditional autoregressive model is statistically significant, indicating that it is necessary to consider the spatial correlation of adjacent regions; the parameter estimation results of the Poisson model, negative binomial model, and Bayesian conditional autoregressive model are all within the corresponding ranges of the geographically weighted Poisson regression model, which indicates that the global model can only obtain an average regression equation and cannot reflect the spatial variation characteristics of the regression relationship.
Table 5.
Model parameter estimation results.
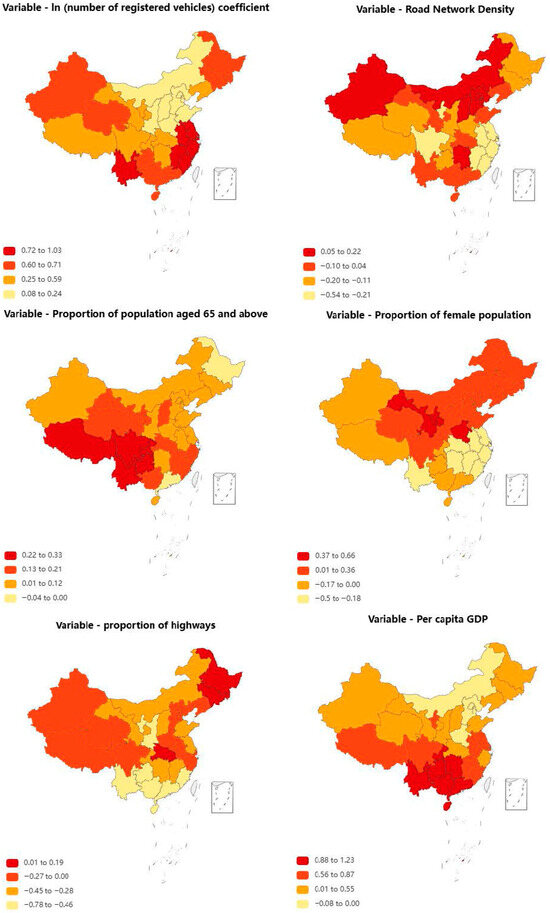
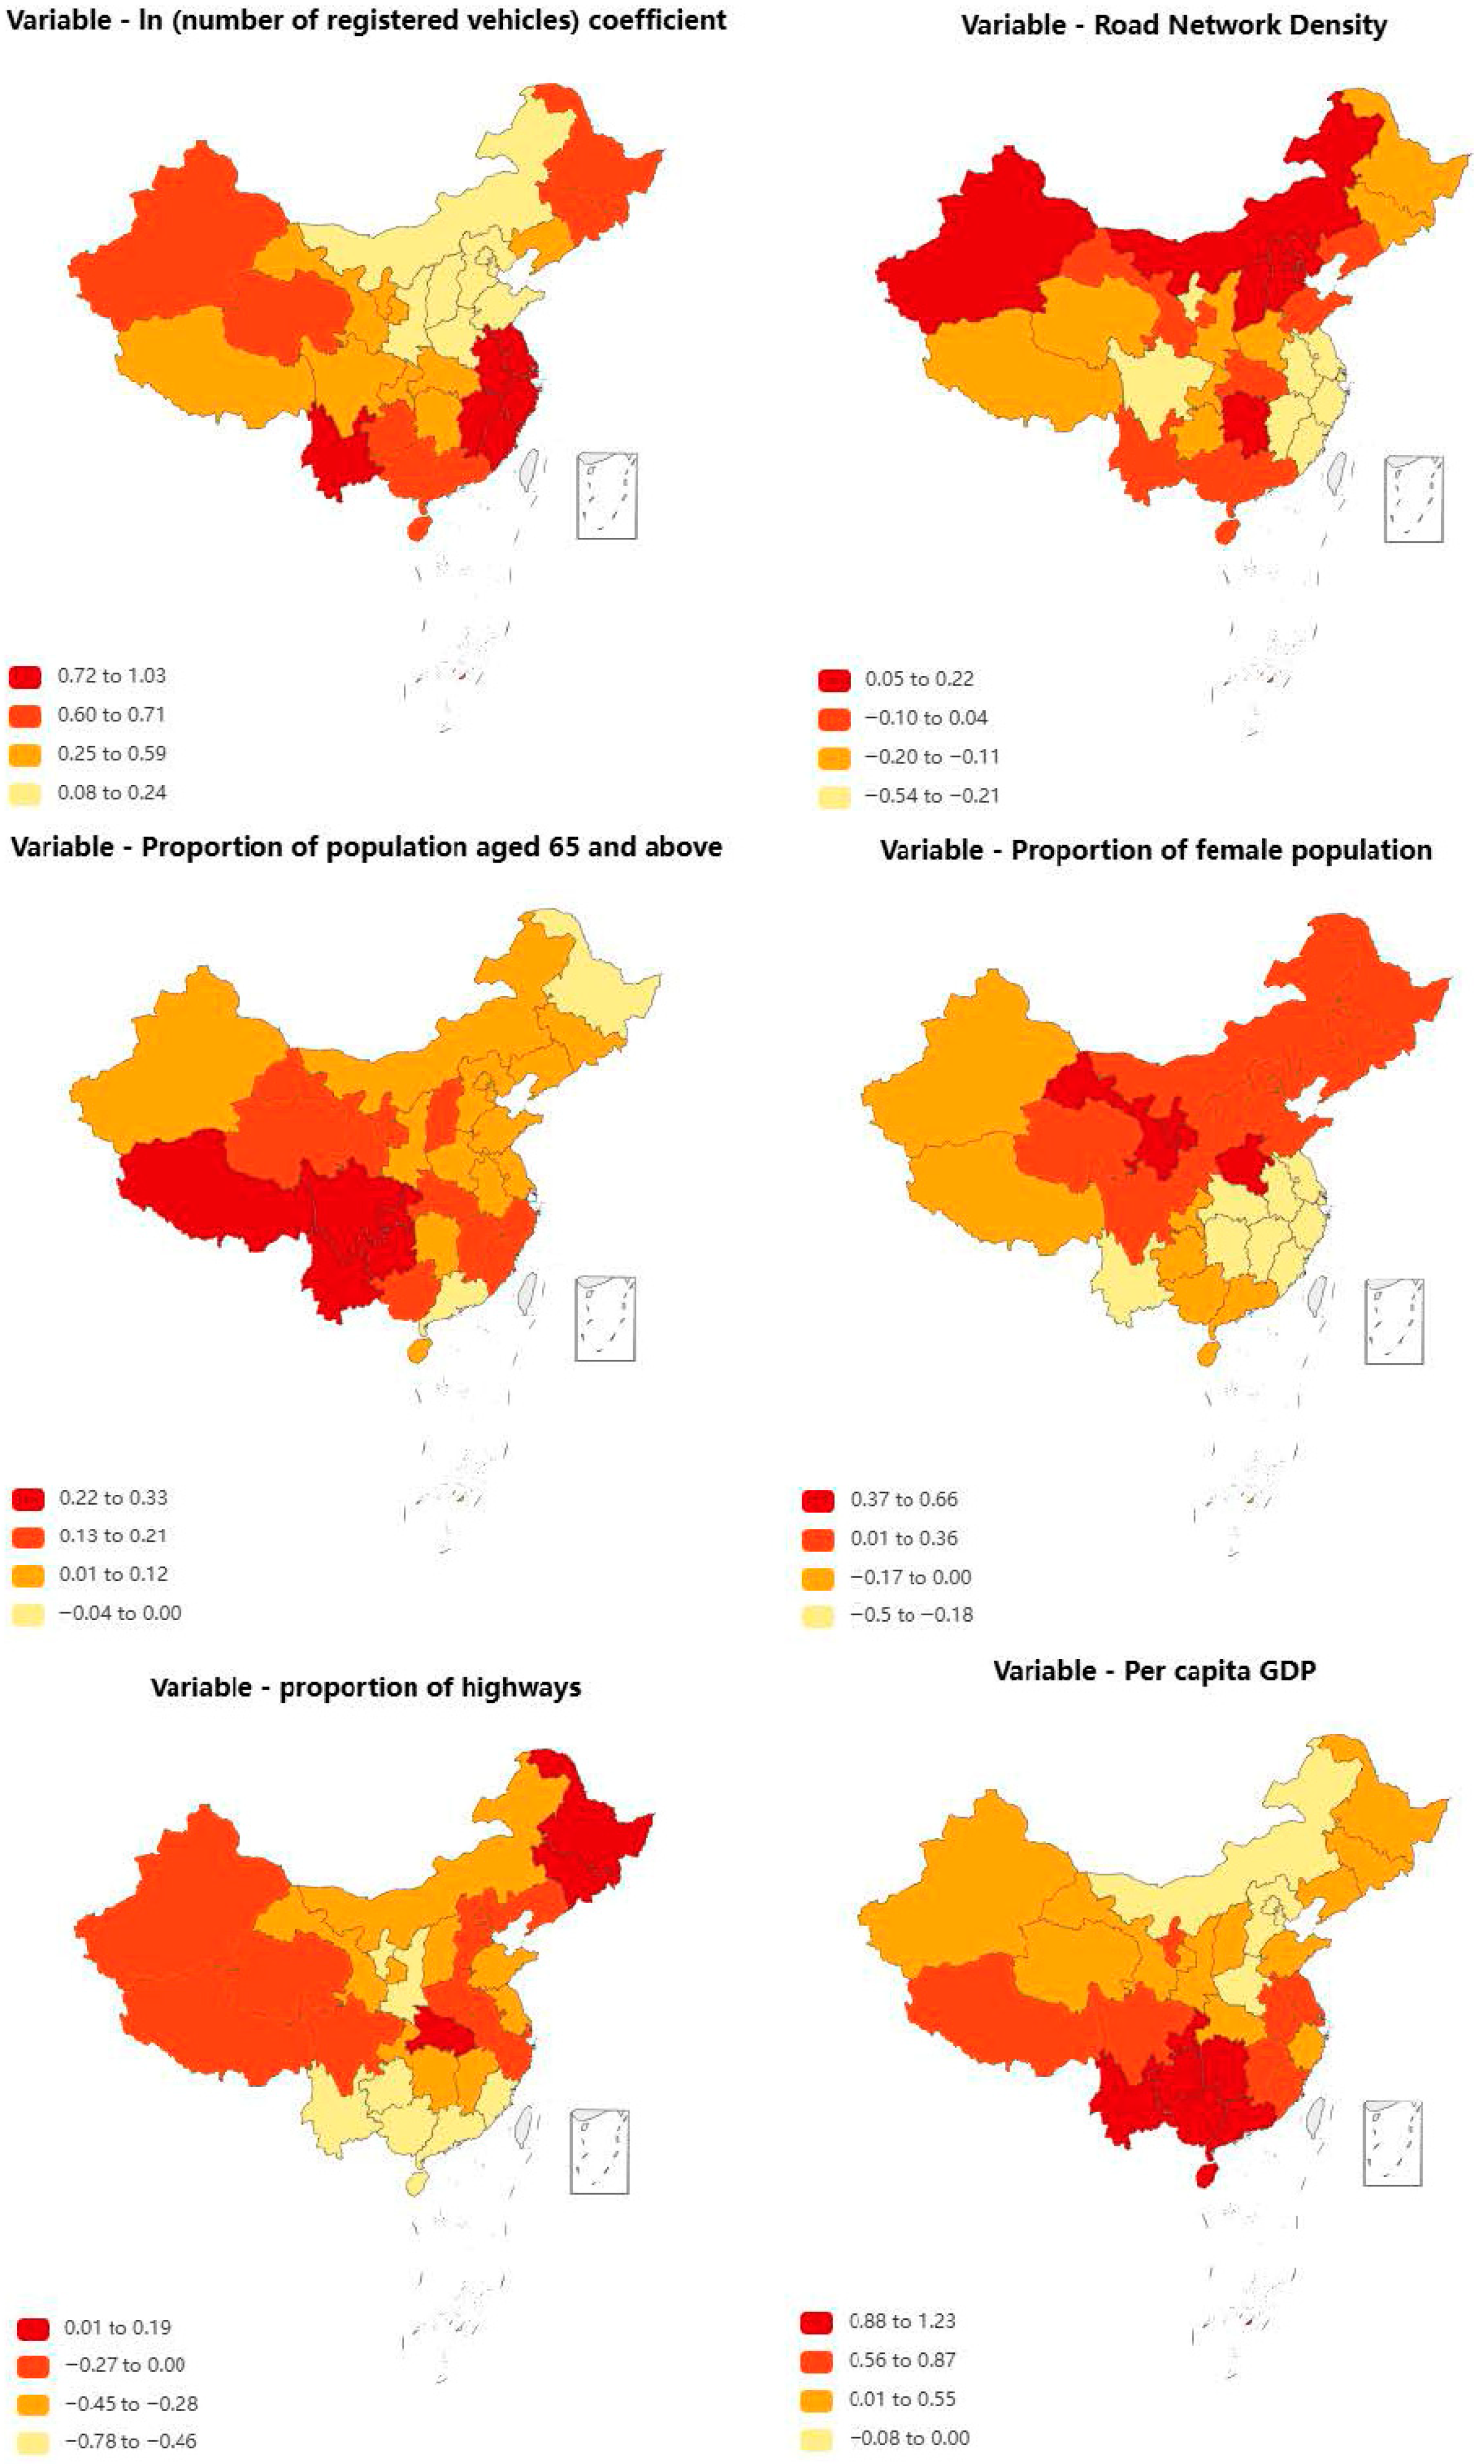
Figure 5 shows the parameter estimation results of the geographically weighted Poisson regression model. It can be seen that the relationship between macro traffic safety levels and their influencing factors varies with provinces. Compared with the above global models, the geographically weighted Poisson regression model can effectively reveal the spatial non-stationarity of regression relationships.
Figure 5.
Parameter estimation results of geographically weighted Poisson regression model.
Among the four types of models, the number of registered vehicles is significantly positively correlated with accidents, indicating that the growth of motorization level is one of the key factors leading to frequent accidents, and its impact is the greatest in the southeastern coastal regions (with the largest model coefficient).
Road network density is not significant in the negative binomial model and the Bayesian conditional autoregressive model, but shows obvious spatial non-stationarity in the geographically weighted regression model. It is significantly positively correlated with accidents in North China (Beijing, Tianjin, Hebei Province, Shanxi Province, Inner Mongolia Autonomous Region) and Hunan Province, while significantly negatively correlated with accidents in other provinces. This may reflect that the meaning of road network density varies in different regions: in urban dense areas, a dense road network means an increase in intersections and conflict points; while in rural or underdeveloped areas, a higher road network density may represent higher accessibility and facility level, which helps reduce traffic accidents. Therefore, the role of this variable should be modeled in more detail, in combination with road grades and traffic flow patterns.
Except for Heilongjiang Province and Guangdong Province, the proportion of population aged 65 and above is significantly positively correlated with accidents, and its impact coefficient is the largest in the southwest region. Elderly people are often accompanied by problems such as decreased reaction ability and visual impairment, and their driving behavior is more risky. For China, which is about to enter an aging society, on the one hand, attention should be paid to strengthening the safety training of elderly drivers to improve their safety awareness and driving skills; on the other hand, auxiliary driving systems and vehicle safety protection equipment for the elderly can be developed.
The proportion of female population is not significant in the negative binomial model and the Bayesian conditional autoregressive model, but in the geographically weighted regression model, it changes positively and negatively with different provinces, showing obvious spatial differences. It is positively correlated in some provinces such as Gansu Province and Henan Province, and negatively correlated in some provinces such as Jiangsu Province and Guangdong Province. This variable may not be a direct influencing factor but a proxy indicator reflecting regional gender structure, employment patterns, or driving habits.
Except for Heilongjiang Province, Jilin Province, and Hubei Province, the proportion of expressways is significantly negatively correlated with accidents. Based on higher design standards, strict access restrictions, lane separation, and speed limit management, expressways can significantly reduce the density of conflict points compared with ordinary highways. This indicates that maintaining a certain road scale and improving the design grade of roads can effectively reduce the occurrence of accidents.
For most provinces, per capita GDP is significantly positively correlated with accidents, that is, the more economically developed the region, the higher the frequency of accidents. On the one hand, economic development is accompanied by the expansion of traffic demand and the increase in vehicle density; on the other hand, it may reflect more complex travel behaviors and higher exposure levels.
5.5. Statistical Significance Verification
To further verify the reliability of model performance improvement, statistical significance tests are conducted based on the results of five-fold cross-validation. Specifically, R2, MAD, and MSPE values obtained from each fold are recorded to construct paired performance samples under identical data partitions. Paired t-tests are then applied to compare the improved KAN model with baseline models (MLP and original KAN) for each evaluation metric. In addition, to avoid potential distributional assumptions under small-sample conditions, a Bootstrap resampling procedure with 1000 repetitions is employed to estimate confidence intervals of performance differences. It should be noted that these statistical tests are applied only to learning-based models using the same cross-validation strategy, while traditional statistical models are excluded due to differences in estimation frameworks.
The results indicate that improvements achieved by the improved KAN model in terms of R2, MAD, and MSPE are statistically significant at the 95% confidence level (p < 0.05), and the corresponding Bootstrap confidence intervals do not include zero. These findings demonstrate that the performance advantages of the improved KAN model in provincial-level traffic accident prediction are consistent and reliable rather than resulting from random variation.
6. Conclusions
To address the problems of spatial heterogeneity and complex nonlinear relationships in provincial-level road traffic accident prediction, this study proposes an improved KAN model. By introducing three key innovations, a spatial embedding module, multi-scale spline mechanism, and residual connection, the model’s performance in prediction accuracy, generalization ability, and interpretability is significantly improved. Empirical research shows that the improved KAN model is overall superior to traditional statistical models and benchmark neural networks in key indicators such as R2, MAD, and MSPE, and exhibits unique advantages, especially in capturing nonlinear relationships between variables and spatial heterogeneity.
The main contributions of the improved KAN model are reflected in the following three aspects: first, the spatial embedding module effectively integrates geographic information, endowing the model with spatial perception ability; second, the multi-scale spline mechanism significantly enhances the nonlinear expressive ability through the collaborative learning of local and global features; finally, the residual connection design not only stabilizes the training process of deep networks but also alleviates the overfitting problem under small sample data. These innovations enable the improved KAN to maintain the powerful fitting ability of neural networks while having interpretability close to that of statistical models, providing a new analysis tool for traffic safety management.
Despite the above achievements, this study still has some directions worthy of further exploration. Future work can focus on three aspects: first, introducing richer dynamic traffic flow data to improve the model’s ability to perceive real-time safety risks; second, exploring the integration with other spatiotemporal prediction models to better capture the spatiotemporal evolution law of accidents; third, applying the model to more refined regional divisions to provide support for precise safety management. The analysis framework established by the improved KAN model is not only applicable to macro traffic safety prediction but also provides a reference solution for other spatial data analysis problems. Although the socio-economic data and accident data used in this study are not fully aligned in time, such a practice is relatively common in macro-level provincial analyses. Nevertheless, this temporal inconsistency may introduce a certain degree of uncertainty, which is acknowledged as a limitation of the present study. Future research will seek to incorporate data with higher temporal resolution to further improve analytical accuracy.
Author Contributions
Conceptualization, Y.W. and Z.L.; methodology, Y.W., H.Y., Z.P. and Y.L.; software, Y.W.; validation, Y.W., Z.L. and H.Y.; formal analysis, Y.W.; writing—original draft preparation, Y.W.; writing—review and editing, Y.W., Z.P. and Y.L. All authors have read and agreed to the published version of the manuscript.
Funding
This research received no external funding.
Data Availability Statement
Restrictions apply to the datasets.
Conflicts of Interest
Authors Yuwei Wang, Zhihai Li and Hang Yuan were employed by the company China Communications Information &Technology Group Co., Ltd. The remaining authors declare that the research was conducted in the absence of any commercial or financial relationships that could be construed as a potential conflict of interest.
References
- Washington, S.P.; van Schalkwyk, I.; Mitra, S.; Meyer, M.; Dumbaugh, E.; Zoll, M. Incorporating Safety into Long-Range Transportation Planning; NCHRP Report 546; Transportation Research Board: Washington, DC, USA, 2006. [Google Scholar]
- Zhang, W.; Yu, Y.; Qi, Y.; Shu, F.; Wang, Y. Short-term traffic flow prediction based on spatio-temporal analysis and CNN deep learning. Transp. A Transp. Sci. 2019, 15, 1688–1711. [Google Scholar] [CrossRef] [Scilit]
- Chen, Z.; Lu, Z.; Chen, Q.; Zhong, H.; Zhang, Y.; Xue, J.; Wu, C. A spatial–temporal short-term traffic flow prediction model based on dynamical-learning graph convolution mechanism. Inf. Sci. 2022, 611, 522–539. [Google Scholar] [CrossRef] [Scilit]
- Washington, S.; Metarko, J.; Fomunung, I.; Ross, R.; Julian, F.; Moran, E. An inter-regional comparison: Fatal crashes in the southeastern and non-southeastern United States: Preliminary findings. Accid. Anal. Prev. 1999, 31, 135–146. [Google Scholar] [CrossRef] [Scilit]
- Aguero-Valverde, P.; Jovanis, P.P. Spatial analysis of fatal and injury crashes in Pennsylvania. Accid. Anal. Prev. 2006, 38, 618–625. [Google Scholar] [CrossRef] [Scilit] [PubMed]
- Zhu, M.; Sze, N.N.; Newnam, S. Effect of urban street trees on pedestrian safety: A micro-level pedestrian casualty model using multivariate Bayesian spatial approach. Accid. Anal. Prev. 2022, 176, 106818. [Google Scholar] [CrossRef] [Scilit] [PubMed]
- Zhou, X.; Ding, X.; Yan, J.; Ji, Y. Spatial heterogeneity of urban illegal parking behavior: A geographically weighted Poisson regression approach. J. Transp. Geogr. 2023, 110, 103636. [Google Scholar] [CrossRef] [Scilit]
- Haynes, R.; Jones, A.; Kennedy, V.; Harvey, I.; Jewell, T. District variations in road curvature in England and wales and their association with road-traffic crashes. Environ. Plan. A 2007, 39, 1222–1237. [Google Scholar] [CrossRef] [Scilit]
- Abdel-Aty, M.; Siddiqui, C.; Huang, H.L. Integrating trip and roadway characteristics in managing safety at traffic analysis zones. Transp. Res. Rec. 2011, 2213, 20–28. [Google Scholar] [CrossRef] [Scilit]
- Wang, X.S.; Wu, X.W.; Abdel-Aty, M.; Tremont, P.J. Investigating of road network features and safety performance. Accid. Anal. Prev. 2013, 56, 22–31. [Google Scholar] [CrossRef] [Scilit]
- Pulugurha, S.S.; Duddu, V.R.; Kotagirl, Y. Traffic analysis zone level crash estimation models based on land use characteristics. Accid. Anal. Prev. 2013, 50, 678–687. [Google Scholar] [CrossRef] [Scilit]
- Quddus, M.A. Modeling area-wide count outcomes with spatial correlation and heterogeneity: An analysis of London crash data. Accid. Anal. Prev. 2008, 40, 1486–1497. [Google Scholar] [CrossRef] [Scilit]
- Zeng, Q.; Wang, F.; Wang, Q.; Pei, X.; Yuan, Q. Bayesian multivariate spatial modeling for crash frequencies by injury severity at daytime and nighttime in traffic analysis zones. Transp. Lett. 2023, 15, 553–560. [Google Scholar] [CrossRef] [Scilit]
- Ma, Z.-L.; Shao, C.-F.; Hu, D.-W.; Ma, S.-Q. Temporal-spatial analysis model of traffic accident frequency on expressway. J. Traffic Transp. Eng. 2012, 12, 93–99. [Google Scholar]
- Meng, X.-H.; Guan, Z.-Q.; Zheng, L. Safety evaluation of mountainous expressway based on geometric alignment indexes. China J. Highw. Transp. 2011, 24, 103–108. [Google Scholar]
- Wang, X.-S.; Xie, K.; Chen, X.-H.; Wang, K. Risk factor analysis for signalized intersections along corridors with a consideration of spatial correlation. J. Tongji Univ. (Nat. Sci.) 2012, 40, 1814–1820. [Google Scholar]
- Wang, X.-S.; Wu, X.-W.; Jin, Y. Macro-level safety modeling and impact factor analysis. J. Tongji Univ. (Nat. Sci.) 2012, 40, 1627–1633. [Google Scholar]
- Huang, H.-L.; Deng, X.; Xu, P.-P. Bayesian Crash Prediction Model Based on a consideration of spatial autocorrelation. J. Tongji Univ. (Nat. Sci.) 2013, 41, 1378–1383. [Google Scholar]
- Zeng, Q.; Wang, Q.; Wang, F.; Sze, N.N. Revisiting spatial correlation in crash injury severity: A Bayesian generalized ordered probit model with Leroux conditional autoregressive prior. Transp. A Transp. Sci. 2022, 18, 1084–1102. [Google Scholar] [CrossRef] [Scilit]
- Liu, Z.; Wang, Y.; Vaidya, S.; Ruehle, F.; Halverson, J.; Soljačić, M.; Hou, T.Y.; Tegmark, M. Kan: Kolmogorov-arnold networks. arXiv 2024, arXiv:2404.19756. [Google Scholar]
- Raubenheimer, L.; Southey, R.; Radlof, S.E. Bayesian disease mapping: A literature review with an application, using WinBugs software. Stat. Optim. Inf. Comput. 2022, 10, 829–857. [Google Scholar] [CrossRef] [Scilit]
- Akpa Onoja, M.; Unuabonah, E.I. Small-sample corrected Akaike information criterion: An appropriate statistical tool for ranking of adsorption isotherm models. Desalination 2011, 272, 20–26. [Google Scholar] [CrossRef] [Scilit]
- Wu, S.; Wang, Z.; Du, Z.; Huang, B.; Zhang, F.; Liu, R. Geographically and temporally neural network weighted regression for modeling spatiotemporal non-stationary relationships. Int. J. Geogr. Inf. Sci. 2021, 35, 582–608. [Google Scholar] [CrossRef] [Scilit]
- Comber, A.; Brunsdon, C.; Charlton, M.; Dong, G.; Harris, R.; Lu, B.; Lü, Y.; Murakami, D.; Nakaya, T.; Wang, Y.; et al. A route map for successful applications of geographically weighted regression. Geogr. Anal. 2023, 55, 155–178. [Google Scholar] [CrossRef] [Scilit]
- Ebrahim, E.A.; Cengiz, M.A.; Terzi, E. The Best Fit Bayesian Hierarchical Generalized Linear Model Selection Using Information Complexity Criteria in the MCMC Approach. J. Math. 2024, 2024, 1459524. [Google Scholar] [CrossRef] [Scilit]

Disclaimer/Publisher’s Note: The statements, opinions and data contained in all publications are solely those of the individual author(s) and contributor(s) and not of MDPI and/or the editor(s). MDPI and/or the editor(s) disclaim responsibility for any injury to people or property resulting from any ideas, methods, instructions or products referred to in the content. |
© 2026 by the authors. Licensee MDPI, Basel, Switzerland. This article is an open access article distributed under the terms and conditions of the Creative Commons Attribution (CC BY) license.