


Abstract
Structural software testing is an essential stage in the software development lifecycle, where achieving high coverage and fault detection remains a significant challenge. Manual testing is costly and inefficient for a program with a large number of modules and functions. Automated test data generation addresses this issue, but its effectiveness depends on the optimization strategies used. This study introduces a novel hybrid optimization algorithm that combines the Gray Wolf Optimizer (GWO) and Particle Swarm Optimization (PSO) to cover deep paths of the program and generate efficient test data. By balancing exploration and exploitation through the proposed hybrid PSO-GWO approach, this method adapts well to programs of varying size and complexity. The proposed method was evaluated on 26 standard benchmark programs. Experimental results demonstrate its superior performance, achieving 88.37% coverage, which is higher than the state-of-the-art methods, and a mutation score of 67.45%, reflecting improved fault detection capability. Moreover, it produces fewer test cases and executes an average of 1257.7 s, approximately half the time required by GA, GWO, and PSO individually. In this study, the symmetric and asymmetric structural aspects of program control flow and execution paths are analyzed to generate automated tests. The suggested deep path coverage technique uses optimization principles based on symmetry to achieve effective and reliable structural testing of software. Overall, the proposed hybrid algorithm delivers test data that is smaller, faster, and more effective. The proposed method is a reliable and efficient test generator compared to the state-of-the-art methods.
1. Introduction
Software testing is a key component of software quality assurance, particularly as rapid technological growth has increased the challenges of maintaining software quality and performance [1]. Its main objective is to detect defects by comparing actual outputs with expected results, either through manual or automated execution of test cases. Automated testing is increasingly important because it reduces time and cost. Studies show that nearly 80% of defects are concentrated in 20% of software modules, so focusing testing efforts on these critical parts optimizes resources and improves quality more effectively. Real-world programs consist of numerous functions or services, and failure in one component can affect the entire system. Although unit testing evaluates each function individually, the growing number of services, especially in microservice architectures, adds significant complexity. Therefore, beyond automatic test generation, there is a need to produce a minimal set of test cases that achieves maximum coverage and high defect detection, requiring intelligent approaches that balance efficiency and effectiveness [2].
Current test-data generation techniques still have a lot of problems. For example, optimization-based methods often converge too quickly, which means they create more test cases than necessary, which raises the cost of testing [3]. ML and LLM-assisted methods depend on the quality of the model and the amount of computing power available, and boundary-focused or prioritization methods do not work well for complex programs. Additionally, a lot of methods focus on improving coverage without directly improving the ability to find faults [4]. Another big problem is that hard-to-cover code areas, like deeply nested conditions, rare execution paths, and complicated branch combinations, are not being tested enough. This could mean that sensitive or error-prone parts of the software are not being tested, even though the overall coverage metrics are high. So, we still need methods that can improve coverage and defect detection at the same time, efficiently explore difficult program paths, and cut down on unnecessary testing across different software structures.
The main objective of this study is to minimize redundant test data by removing test cases that produce overlapping coverage. This method generates a small but effective set of test inputs that cover critical parts of software functions and services. It also reduces testing time and cost by limiting the number of required test cases while preserving coverage quality. In addition, this approach improves error detection by producing test data that better exposes faults in the software under test.
In this study, a hybrid heuristic algorithm combining PSO and GWO is applied to generate software test cases. Combining PSO and GWO utilizes the strengths of both algorithms and provides a balance between fast convergence and effective exploration of the search space. This hybrid approach enhances the ability to find optimal test data while avoiding local optima. The performance of the proposed method has been evaluated and compared with results from existing methods. This study presents a tailored hybrid PSO–GWO approach for automated test-data generation, where optimization is guided by a combined fitness function incorporating code coverage, branch coverage, and mutation score to enhance both coverage and defect detection capability. The proposed method offers the following contributions:
- The proposed method employs a discretized and extended variant of the hybrid heuristic algorithm (PSO and GWO) to generate optimal test data with high coverage and defect discovery rate.
- It identifies sensitive parts of the source code and tests the program with a smaller number of test data.
- It reduces testing costs by eliminating duplicate coverage test data and minimizing the required test data while maintaining code and branch coverage.
- The generated test data demonstrates higher defect detection capability compared to other methods.
- Developing a unit-level defect injection platform for the functions and services written in C#.
- A fully automated platform is developed to generate test data, evaluate code and branch coverage, and eliminate redundant test cases.
The remaining sections are arranged as follows: Section 2 reviews related work on test generation and prioritization methods. Section 3 elaborates on the proposed hybrid test generator. Section 4 discusses the experimental framework, results, and comparisons with other test generation methods. Finally, Section 5 concludes the paper and highlights future research directions.
2. Related Works
In recent years, search-based techniques have gained popularity in software test optimization. This section reviews and categorizes methods for automatic test-data generation and prioritization. Reference [5] presents an improved version of the Lyrebird optimization algorithm (ILOA) to automatically generate test data. A new fitness function is used to improve exploration and evaluation. Test results show that ILOA outperforms genetic algorithms, PSO, and other methods in terms of speed, coverage, and fault detection. The algorithm is simple, easy to implement, and requires minimal parameter tuning. It also balances exploration and evaluation well. However, like other stochastic algorithms, it does not guarantee a global optimum and may not always be optimal for every problem.
In [6], a novel approach (BRMiner) is presented that combines Large Language Models (LLMs) with traditional techniques to extract relevant input data from bug reports for automated test generation. Evaluated on the Defects4J benchmark with EvoSuite and Randoop, BRMiner achieved an input accuracy rate of 60.03% and outperformed pure LLM-based methods by detecting 58 unique bugs. By providing more relevant input data, BRMiner improves code coverage (branch, line, method, and statement) and improves bug detection. The authors also discuss accuracy threats, including dependence on bug report quality, LLM classification errors, and Oracle build issues. While BRMiner performs well, its performance can vary across projects and software domains.
Reference [7] presents a test case prioritization framework using Jay’s Archimedes optimization algorithm (Jaya AOA). This method combines Jay’s algorithm and the Archimedes optimization algorithm. It operates in two phases: test case generation and test case prioritization. Prioritization focuses on two objectives: average percentage of faults detected (APFD) and average rate of branch coverage (APBC). Experiments show strong results with high values for APFD (0.934) and APBC (0.968). This method reduces costs, improves coverage, and detects more faults, making it useful for large projects. Its main drawbacks are high resource requirements and unclear test criteria.
In [8], a metric called Boundary Coverage Distance (BCD) was proposed to measure how well test cases cover boundary values in Boundary Value Analysis (BVA). Using BCD, three algorithms were developed to generate optimized test inputs. Experiments on five programs showed that the BCD-based method creates inputs closer to boundaries and improves fault detection compared to random testing. The main limitation is manual boundary identification, which is hard for large or complex programs. Future work will focus on automating boundary detection and extending the method to non-numerical data.
Python 3.11 and other dynamic languages are widely used because they are flexible. But they lack parameter type declarations, which makes test generation hard. Random type guesses increase the search space and lower efficiency. Existing evolutionary algorithms often get stuck and produce faulty test cases. A new framework that uses large language models (LLMs) to improve test generation (pytLMtester) was suggested in [9]. It works in three steps. First, it analyzes parameter types to reduce the search space. Second, it adds meaningful data during mutations. Third, it repairs faulty test cases using LLMs. Experiments show good results. Coverage improved by 16%, and more test cases were executable compared to previous methods. Although tested only on Python, pytLMtester can be used for other dynamic languages. Challenges remain, such as the need for an LLM for better datasets.
In reference [10], a variant of Black Widow Optimization Algorithm (BWOA) was developed for test-data generation. Branch coverage is used as the fitness function. Tests on six benchmarks show better results than SA, GA, ACO, PSO, and ABC. This method reached 99.98% coverage, 99.96% success, and only 9.36 iterations. BWOA has high convergence, coverage, and stability. Extension of the fitness function to focus on error-prone code and error-propagation instructions is considered as a future study of the paper.
Reference [11] proposes an automated method for generating software test data using machine learning (ML) and the Horse Herd Optimization Algorithm (HHOA). This technique works in two steps. First, ML identifies non-error-propagating instructions with 90% accuracy and 82% precision. Second, HHOA generates tests that target only error-propagating instructions. Experiments on nine benchmark programs show strong results: 99.93% coverage of error-prone instructions, 98.93% success rate, and 89.40% fault detection. In [12], a method (Traxtor) is presented for automatically generating test data using the Imperialist Competitive Algorithm. Traxtor improves coverage, success rate, and stability, achieving 99.94% success rate in experiments.
Reference [13] developed the Shuffled Frog Leaping Algorithm (SFLA) for automatic software test-data generation. The SFLA employs branch coverage as its fitness function and is known for its rapid convergence and straightforward implementation. Experiments on seven benchmark programs show 99.99% branch coverage and 99.97% success rate. Results demonstrate that SFLA outperforms GA, PSO, ACO, and ABC in software test generation. The study in [14] introduced HT-EP, a hierarchical, tree-based expression-parsing algorithm designed to improve the efficiency of software expression models for test sequence generation. Traditional methods rely on abstract syntax trees (ASTs), which often lead to redundant algebraic operations and reduced parsing efficiency. The proposed HT-EP algorithm converts expressions into hierarchical trees with fewer nodes, enabling faster traversal and more efficient algebraic manipulation. An experimental evaluation using 124 expressions from academic sources and 15 open-source projects demonstrated that HT-EP significantly improves both parsing speed and fault-detection capability compared to four existing algorithms. Moreover, HT-EP reduces redundant operations by approximately 40% and decreases runtime by about 63% relative to AST-based approaches, confirming its superior performance and practicality in automated software testing.
Reference [15] introduces TestLoter, a logic-driven framework for automated unit test generation that combines white-box and black-box testing through a Logic-Driven Chain-of-Thought (LCoT) and a hierarchical repair mechanism. TestLoter improves code reasoning, enhances test correctness, and reduces errors in generated cases. Experiments on nine open-source projects show that it achieves the highest performance, with 83.6% line coverage and 78% branch coverage, which surpasses both traditional (EvoSuite) and LLM-based methods, while lowering the test failure rate to only 2.3%.
Reference [16] presents a machine learning-based method to automate Boundary Value Analysis (BVA). The goal is to make BVA faster and more accurate. This technique uses a discriminator model to check if two test inputs are on different sides of a boundary. Based on this, it calculates boundary density using two methods called pointDensity and pairDensity. Then, it applies Markov Chain Monte Carlo (MCMC) to generate new test inputs near the boundaries. Experiments were done on eight programs. The results show that this ML-based approach performs better than manual BVA in five programs and concolic testing in four programs. It also detects more faults than Adaptive Random Testing (ART) and Random Testing (RT). Enhancing boundary coverage, generating test inputs closer to the boundaries, and handling complex conditions more accurately are the future studies of the suggested method. Table 1 illustrates the literature’s merits and demerits.
Table 1.
The merits and demerits of the previous test generation methods.
Current methods for generating test data improve coverage and finding faults, but they still have a lot of problems. A lot of optimization-based methods either converge too quickly or make extra test cases, which raises the cost of testing without giving any extra benefits. Methods that use LLM and ML to help with automation are better, but they rely heavily on the quality of the model and may cause instability or a lot of extra work for the computer. Methods that focus on boundaries and prioritization often require work by hand or do not work well with complicated programs. Also, a lot of methods only improve coverage without directly improving the ability to find defects. Another big problem is that existing methods do not always examine hard-to-cover parts of the code thoroughly, such as deeply nested conditions, rare execution paths, and complex branch combinations that are hard to follow. So, even if the overall coverage metrics look good, sensitive or error-prone code areas may not be tested. So, there is still a need for a method that improves coverage and fault detection at the same time, effectively explores program paths that are hard to cover, cuts down on unnecessary test cases, balances exploration and exploitation in search, and works without relying on LLM quality. The suggested hybrid PSO–GWO framework fills these gaps by combining optimization methods that work well together and adding coverage to mutation-based fault detection.
3. Method
In the proposed method, the Gray Wolf and Particle Swarm algorithms are combined to serve as a test-data generator. The GWO algorithm is based on the leadership and hunting behavior of gray wolves [17]. It balances exploration and exploitation well in complex search spaces. Its fast convergence and simplicity make it effective for nonlinear and multimodal optimization problems. The PSO copies the social behavior of birds and fish [16]. Particles share information and quickly move toward the best solutions. A hybrid of GWO and PSO uses the structured search of GWO and the fast convergence of PSO. This improves performance and makes test-data generation more reliable.
The proposed method is most similar to metaheuristic-based test-data generation techniques that use single optimization strategies like GA or PSO to improve code or branch coverage. The standalone PSO and GWO-based approaches are the most direct conceptual predecessors of the methods that were tested. This is because both methods use population-based search to create candidate test inputs and improve coverage metrics over time. PSO, on one hand, usually has strong exploitation capabilities, which means it can quickly find promising solutions. However, this can sometimes lead to premature convergence and not enough exploration of hard execution paths. On the other hand, GWO’s leader-based search mechanism makes it better at exploring, but it might take longer to converge in later stages of optimization. The experimental findings in this study indicate that both PSO and GWO enhance coverage; however, their efficacy is constrained when addressing programs with higher cyclomatic complexity or challenging branches to cover. The suggested method combines the best parts of both techniques, so that exploration and exploitation are balanced in one search process.
Figure 1 shows the detailed implementation of the Gray Wolf and hybrid Particle Swarm algorithms. At the end of each iteration or generation, the first part of the hybrid method is applied. This applies the genetic algorithm’s mutation and crossover operators to the population generated by Gray Wolf and Particle Swarm. Next, the second part of the hybrid method (shown in Figure 1) is applied. This produces a superior population that can replace wolves or particles with similar performance. The replacement targets individuals with low fitness but high value according to the hybrid method. The first part of the hybrid method speeds up population diversity and helps discover new points in the search space. This allows the algorithm to reach or approach the test data faster. The second part prevents the destruction of superior wolves or particles. For example, a test data series may have low fitness or low line and branch coverage. Basic algorithms would discard it, but they may cover sensitive points. The hybrid method keeps such individuals in the superior population because they are valuable.
Figure 1.
Flowchart of the suggested method.
In this study, “superior individuals” refer to those test candidates who demonstrate higher branch coverage, higher line coverage, and a superior mutation score (fault discovery rate). The combination of GWO’s leader-based exploration with the exploitation-oriented mutation and crossover operators further enhances search capability by diversifying candidate solutions while intensifying refinement in promising areas. This synergy enables the algorithm to discover test data that achieves higher line and branch coverage and significantly improves mutation score (fault discovery rate), thereby outperforming classical single-heuristic approaches. This mechanism prevents premature loss of high-impact individuals, maintains population diversity, and helps the algorithm avoid local optima while improving coverage of sensitive code areas. As a result, the hybrid method ensures that both globally optimal and strategically important test cases are maintained and explored further.
In this study, superior individuals are candidate test inputs that get higher fitness values when the optimization process uses the objective function. The fitness value includes branch coverage, line coverage, and mutation score (fault detection rate). At each iteration, individuals are ranked based on this fitness score. The individuals in the top-performing group are thought to be better than the rest of the population. In GWO, the best candidates are chosen to be the leaders (alpha, beta, and delta wolves), and in PSO, the best solutions are kept as personal bests. The selection of individuals (test data) is based on ranking (fitness), meaning that the best-performing individuals in each iteration are retained further. This adaptive ranking system ensures that the selection criteria change automatically based on the cyclomatic complexity of the input program.
3.1. Program’s Input Identification
The first phase of the proposed test generation method analyzes the source code of an input program to determine its testability and extracts the input information needed for automated test generation. This is implemented using the Roslyn compiler platform (Microsoft.CodeAnalysis), which programmatically parses the code into a syntax tree. The CodeParser class uses CSharpSyntaxTree.ParseText to process the input string, retrieve the root node, and then scan the namespace, classes, and method declarations. During this process, the system checks the accessibility of classes and methods. The parser collects the input parameters, their names, and types within each technique. Supported types include the traditional data and system types. If any parameter has an unsupported or unknown type, the method is not processed further. The parser also determines whether methods are static or instance-based by adjusting the call type accordingly.
Filtering is applied at both class and method levels. If no valid method is detected within a parsed class, the system generates an error such as “Cannot detect testable method.” Otherwise, the output is a structured CodeParsed object containing the detected class, one of its valid methods, a parameter list, and associated usage directives. This step ensures that only valid code elements are passed to the next stages of the pipeline, forming the basis for generating executable test cases.
Figure 2 shows the original source code that was used as input for the proposed automated test generation framework. The program in this example creates a class called f04 with a public method called convolve. This method can take several parameters, such as integer values and integer arrays. The method uses nested loops and array manipulations to do a convolution operation. This figure shows the kind of real program code that was looked at in the first stage of the framework, where testable program parts and input parameters are taken out. Figure 3 shows the structured output that the parser made after examining the source code in Figure 2. The parser uses the Roslyn compiler API to get important information like how accessible a class is, what properties a method has, and what input parameters it needs. The extracted information is in JSON format, and it shows the class, method attributes, and parameter types that will be used to generate test data. Indeed, before test generation, the input program should be parsed, and the required syntactical information should be extracted; this information is essential for the next steps in the automated test generation process.
Figure 2.
The source code of a program as the input of the suggested method.
Figure 3.
The output of the developed parser in JSON format for the program shown in Figure 2.
Figure 3 illustrates the parsing output produced by stage 1 when the code from Figure 2 was analyzed. Using the Roslyn compiler API, the parser identified that class f04 is testable. It also detected the method convolve as a valid candidate, and all of its input parameters have supported types (int and int []). The output is in JSON format, listing the class and method properties along with the extracted input parameters and their mapped data types. This confirms that the code is testable and can proceed to the next stage of automated test case generation.
3.2. Test Data Generation
In the second phase, the method generates test data for the methods parsed in phase1. It uses two optimization algorithms: GWO and PSO. These algorithms examine the input space and generate candidate solutions. After each iteration, mutation and crossover operators from a genetic algorithm are applied to the population. Mutation introduces small, random changes. The second part of the hybrid method is applied to refine the population further. This phase ensures that the generated test input data is valid and optimized. Combining swarm algorithms and genetic operators increases diversity and the likelihood of detecting errors in the code. Algorithm 1 presents the pseudo-code for the proposed hybrid test generator, the second phase of the method.
The pseudo-code (Algorithm 1) shows how each particle is first updated using the PSO equations to move toward its personal and global best solutions, thereby supporting fast exploitation. Furthermore, the GWO equations generate three alternative candidate positions based on the α, β, and δ leaders, which supports more exhaustive exploration. In a hybrid test generation algorithm, population initialization is a crucial first step that forms the foundation of the entire optimization process. This step begins after analyzing the source code and identifying a testable method. The algorithm uses the method’s input parameters and their corresponding data types to generate a diverse set of input combinations. The input data for each population member is generated randomly. This ensures the syntactic and semantic correctness of the input data for the method being tested. By aggregating a wide range of input configurations, the algorithm increases the probability of achieving significant code coverage. This diversity is essential to the evolutionary process, as it enables the hybrid algorithm to explore different execution paths during testing.
| Algorithm 1. Pseudo-code of the suggested hybrid test generator |
| Initialize a population ρ_min = 0.2; ρ_max = 0.8; FOR iteration = 1 to n_iter: a = 2 − 2*(t/n_iter); //Adaptive probability schedule (more PSO later) ρ(t) = ρ_min + (ρ_max − ρ_min) * (t/n_iter); //If stagnation detected, force more exploration (reduce PSO) IF no improvement in best_hist for last k_stag iterations THEN ρ(t) ← max(ρ_min, ρ(t) − 0.2); END IF FOR each particle i: # GWO update (exploration) A1 = 2*a*r1 – a; C1 = 2*r2; A2 = 2*a*r3 – a; C2 = 2*r4; A3 = 2*a*r5 – a; C3 = 2*r6; Dα = |C1 * Xα - Xi|; Dβ = |C2 * Xβ - Xi|; Dδ = |C3 * Xδ - Xi|; X1 = Xα - A1 * Dα; X2 = Xβ - A2 * Dβ; X3 = Xδ - A3 * Dδ; Xgwo = (X1 + X2 + X3)/3 # PSO Update (adaptive Exploitation) IF rand() < ρ(t) THEN Vi = w*Vi + c1*rand()*(Pbest_i − Xgwo) + c2*rand()*(Gbest − Xgwo) Xnew = Xgwo + Vi Xnew ← BoundRepair(Xnew) ELSE Xnew = Xgwo END IF IF no progress has been made in the individual fitness Perform Crossover and Mutation END IF IF objective_function(Xnew) is better than objective_function(besti): besti = Xnew END IF particle i = Xnew END FOR Update the global best from all personal bests END FOR RETURN global best solution, best fitness |
As shown in Figure 4, the first random population consists of candidate inputs for the method of class f04. Each candidate contains values for all the method’s parameters. The p_coeffs parameter is an array of integers. It holds the coefficients used in the process. The length of this array is stored in p_coeffs_n. The p_in parameter is another integer array. It represents the input signal on which the method will be performed. The p_out array stores the results. It is initialized with zeros, and its length is determined by the n parameter. Parameter n is an integer and specifies how many positions in the output array the method will calculate. Each candidate in the population has randomly selected values. Some data have longer arrays, while others have shorter ones. This variety helps cover different test scenarios. The first random population provides the starting point for the hybrid optimization stage.
Figure 4.
The structure of the JSON-based population, which includes three random test data for the program shown in Figure 2.
In PSO, each particle adjusts its position based on its personal best solution (Pbest) and the best global solution (Gbest), which is shared by the swarm. Equation (1), the velocity update equation, combines inertia, cognitive attraction (toward Pbest), and social attraction. This causes the particle to move closer to the best-known solutions while maintaining some flexibility. The position update is made by Equation (2). This step emphasizes exploitation, which refines solutions in areas that already look promising.
GWO models the hunting strategy of gray wolves. The hierarchy is based on three leaders—the alpha, beta, and delta wolves—and these three guide the rest of the pack by surrounding the prey from different sides. Mathematically, the distance between a wolf and each leader is calculated, and then the wolf updates its position by averaging its relative distance to α, β, and δ. Random coefficients (A and C) adjust how strongly each leader influences the move. This mechanism allows wolves to spread out in the search space, ensuring the algorithm can explore widely instead of converging too quickly. By balancing the pulls of three leaders, GWO avoids premature convergence and maintains diversity in the population.
Equations (3)–(11) describe the position update mechanism in the GWO, which mimics the leadership and hunting behavior of gray wolves. Two key coefficient vectors are defined, Ai in Equation (3) and Ci in Equation (4). These control exploration and exploitation of the search space. This allows wolves to either move closer to the leaders or explore away from them. The vector Ci introduces randomness in how wolves perceive the positions of the leading wolves. Equations (5)–(7) compute the distances of a wolf from the three top-ranking wolves (α, β, and δ). These distances (Dα, Dβ, and Dδ) measure how far a wolf is from each leader. Using these distances, Equations (8)–(10) generate three candidate positions (X1, X2, and X3) that pull the wolf toward each of the leaders. Finally, Equation (11) updates the wolf’s new position as the average of these three candidates. This collective guidance ensures that wolves balance following the leaders and exploring new areas, which helps the algorithm converge toward optimal solutions effectively.
The proposed hybrid optimization strategy integrates the exploratory capacity of the GWO with the exploitative efficacy of PSO through a two-stage adaptive update mechanism. The GWO leader-based search is used to explore different parts of the input space and find execution paths that are hard to cover. This is done by updating candidate test inputs in each iteration. After that, PSO refinement is used with a changing probability to help promising candidate solutions improve by guiding them toward their own and the best positions in the world. This mixing allows the algorithm to keep the population diverse while still quickly converging on high-quality test inputs, which is especially important for programs with complicated control-flow structures. The adaptive mechanism dynamically balances exploration and exploitation throughout the optimization process, improving coverage and defect detection performance while preventing premature convergence. Equation (12) indicates the hybrid individual solution.
As indicated by Equation (12), ρ(t) is introduced as a time-varying control parameter that regulates how often the optimizer applies the PSO update (exploitation) after computing the GWO candidate position Xgwo (exploration). This design is theoretically motivated by the standard exploration–exploitation principle in swarm intelligence: early iterations should favor global exploration to avoid premature convergence, while later iterations should increasingly emphasize local refinement once promising regions have been identified. In this study, the adaptive probability parameter is bounded within ρmin = 0.2 and ρmax = 0.8 to ensure a balanced and stable hybridization between GWO-based exploration and PSO-based exploitation. Setting ρmin = 0.2 allows the algorithm to prioritize exploration during early iterations while still maintaining a small probability of refinement through PSO updates. Conversely, ρmax = 0.8 increases PSO’s influence in later iterations to enhance local search and convergence without completely eliminating GWO’s exploratory capability. This range prevents either component from being fully suppressed (which could reduce the method to a single metaheuristic) and supports a smooth transition from global search to local refinement. Hence, ρ(t) is not arbitrary; it is a theoretically grounded annealing-like schedule with stagnation-aware correction that ensures a principled transition from global search to local refinement.
4. Experiment and Results
4.1. Platform
The suggested method for generating test data is not tied to any one programming language or platform. The hybrid PSO–GWO optimization strategy for the automated test-data generation works with program structures and input parameters. These can be taken from software written in any programming language, as long as the right parsing and instrumentation tools are available. In this study, the C# programming language and the .NET framework were selected solely as an implementation case study. But the proposed framework can be used with other programming languages, like Java, Python, or C/C++, by changing the parts that parse and instrument the code for that language while keeping the parts that optimize and generate tests.
The PSO-GWO test generator was created in C# .NET. The program was designed modularly, with separate parts for population setup, fitness assessment, parameter control, and position update. The hybrid method combines PSO’s velocity update with the GWO leadership model. This combination helps balance exploration and exploitation during the search. The platform also includes tuning functions for algorithm testing and visualization tools to display convergence curves during optimization. The experimental platform utilizes numerous libraries for various tasks, such as .NET libraries, which are explained in Table 2. The experiments were carried out on an Intel-based computing platform running Windows 11 (64-bit). The hardware configuration included an Intel Core i7 processor (2.80 GHz, 8 cores, 16 threads) and 16 GB of DDR4 RAM. This setup provided a balanced combination of computational power and memory capacity, suitable for executing optimization-based algorithms and handling large datasets.
Table 2.
The libraries utilized for implementing the test generation method.
The developed fault-injection platform is based on mutation testing, which checks whether test cases can detect the injected fault in software. Mutations are minor changes in the code, such as deleting a statement, changing a condition, or modifying variables. Several mutated versions of the original program are created and tested against the same test suite. The platform compares results from the mutated and original programs. If the tests cannot detect the changes, it means the test suite is weak. The tool’s effectiveness is measured using Equation (13). A score of 100% indicates that the tests are strong enough. Mutants (injected faults) that survive are called live mutants, while those that are detected are killed mutants. The Stryker mutator tool has been used to generate mutated versions of benchmark programs.
The Stryker mutator is installed globally and runs through commands in the command line. The tool takes the benchmark program and its unit tests, generates mutations with different operators, runs the tests, and produces a detailed report. The report includes:
- Mutation score: percentage of detected mutants.
- Killed: the number of mutants detected by the tests.
- Survived: the mutants not detected by the tests.
- No coverage: code lines not reached by any unit test.
- Ignored: code lines skipped.
- Compile errors: the mutants that failed to compile.
- Detected: total number of detected mutants (Killed + Timeout).
- Undetected: total number of undetected mutants (Survived + No coverage).
- Total: all generated mutants, excluding compile and runtime errors.
Table 3 shows the calibration settings for the PSO-GWO hybrid method. The population size is set between 50 and 70; it adapts based on the program’s complexity and LOC. The maximum number of iterations is between 100 and 200 to provide enough search cycles. The inertia weight (w) is 0.8 and can adapt to the problem. This helps balance exploration and exploitation. The cognitive (c1) and social (c2) coefficients are both 1.7, giving equal weight to personal and group knowledge.
Table 3.
Calibration parameters of different methods.
The a parameter from GWO decreases from 2 to 0, helping the search move from broad exploration to fine exploitation. Role assignment assigns GWO to guide exploration, while PSO refines solutions. A crossover rate of 0.7 helps combine solutions. A mutation rate of 0.2 adds randomness to avoid early convergence. These settings, together, improve the diversity, balance, and efficiency of the hybrid method.
The test generation algorithms, including GA, PSO, GWO, and hybrid PSO–GWO methods, are executed under the same conditions to enable a fair comparison. For baseline algorithms, the population size was in all methods (50 to 70 agents). The population size varied depending on how complex the input program was. The stopping criterion was either reaching the maximum number of iterations (100–200, depending on the complexity of the input program). The coverage and execution time values given are the average of all the runs. The total optimization time needed to create test data was used to measure execution time. Overall, the implemented test generation methods have been executed on the same software and hardware platform.
In this study, two fitness functions, as defined in Equations (13) and (14), are employed to guide the search process. The first fitness function evaluates structural quality based on line and branch coverage. The second fitness function assesses fault detection effectiveness by computing the mutation score. Local and global searches are initially driven by coverage optimization, whereas mutation-based refinement improves fault-detection capability. Individuals excelling in either function are prioritized, and those performing well in both are promoted to the superior population to preserve their representation in subsequent iterations. Line and branch coverage analysis requires execution tracing of the program under test, whereas mutation testing incurs additional cost due to repeated execution of modified program versions. For a population of N individuals over T iterations, the total complexity of fitness evaluation across the optimization process is indicated by Equation (15); in this equation, L represents the number of executed lines evaluated for line coverage, B the number of branches executed for branch coverage, and M the number of mutants analyzed for mutation score.
Equation (16) shows the total cost of the fitness evaluation process. T is the number of iterations, and N is the size of the population. The term tcov is the average time it takes to calculate structural coverage (line and branch coverage) for one test data, including the time it takes to run the program and add instrumentation. The word tmut shows the average amount of time it takes to calculate the mutation score for the same test data by running several different versions of the program and checking for bugs. So, in each iteration, each test data set undergoes both coverage evaluation and mutation analysis, and the total cost of both is summed across all people and iterations. This formulation makes it clear that the extra work required for structural evaluation is distinct from that required for mutation testing. It also shows that mutation analysis usually requires more computation because it runs M mutants over and over.
The two fitness functions have different optimization goals when looked at from a theoretical point of view. The coverage-based fitness function (Equation (14)) is a structural adequacy criterion that is modeled as a weighted linear combination of line and branch coverage. This formulation guarantees consistent enhancement towards structural completeness and facilitates seamless navigation for both global and local searches owing to its continuous and decomposable characteristics. The mutation-based fitness function, on the other hand, checks how well a system can find semantic faults by looking at the number of killed mutants. Coverage only shows how well a test works when it comes to structural reachability. Mutation score, on one hand, shows how sensitive a program is to changes in behavior, which means it shows how well a test works in other ways. Coverage optimization usually leads to faster convergence and less computational overhead. Mutation evaluation, on the other hand, gives better fault-revealing discrimination, but it costs more to compute. Using these two formulations together creates a multi-objective balance: coverage encourages exploration of structural elements, while mutation score strengthens exploitation of defect-sensitive areas. This makes the search process more robust and based on theory.
4.2. Benchmark Programs
In this study, 26 programs with different levels of complexity were used. Table 4 presents the specifications of the benchmark programs used to evaluate the proposed method. Some are common functions, such as IsLeapYear and FindMaxElement, while others were randomly chosen from public C# projects on GitHub 2.5. This wide selection ensures the proposed algorithm is tested in many different conditions, not just based on its strengths. Each benchmark program is described by its inputs, lines of code (LOC), cyclomatic complexity, and control structures. The suite covers:
- Simple programs (such as IsLeapYear, FindMaxElement, and Divide) with few lines and low complexity.
- Medium programs (such as ApplyDiscount, Convolve, and ValidateCardNumber) that mix multiple conditions and loops.
- Complex programs (AES and MS_MergeSort_Obf) with many lines and high complexity.
Table 4.
The specification of the benchmark programs.
This benchmark set enables evaluation of the fault injection and test generation platform across both simple and complex scenarios. The test programs used in this study were carefully selected to reflect the main programming structures found in real-world software. They include conditional statements (if, else-if, and switch), various loop types (for and while), and a wide range of operators. They also use multiple data types, including integers, arrays, strings, Booleans, and more complex objects. Most real-world programs rely on a combination of these structures to implement logic, manage data, and perform computations. The selected test programs range from very simple functions to complex programs with high cyclomatic complexity. This ensures that the test generation tool is evaluated against tasks similar to those it would encounter in practice, making the evaluation results more reliable and applicable to real-world scenarios. Figure 5 shows the cyclomatic complexity of the benchmark programs.
Figure 5.
The cyclomatic complexity of the utilized benchmark programs.
The benchmark used in this study was carefully chosen to cover a wide range of programming structures and algorithmic behaviors that are often seen in real-world programs. These programs use a variety of control-flow structures, such as conditional branches, nested loops, and iterative operations. As shown in Table 4, they also have different levels of cyclomatic complexity. This variety makes it possible to systematically and consistently test the proposed method in controlled settings while still being able to compare it to previous studies. The benchmark programs also cover a wide range of input domains and data types that are often used in real-world programs, such as integers, floating-point numbers, strings, arrays, Boolean values, and structured inputs. This variety makes sure that the test data is evaluated in real-world situations that are common in real-world programs.
Figure 5 shows that many benchmark programs have high cyclomatic complexity values, with some functions having values over 10. While well-designed industrial software often tries to keep the complexity of each function below this level. Some of the chosen benchmark programs are more structurally complex than most industrial functions. This makes it harder to test algorithms for generating test data. The suggested method also works at the unit-testing level, focusing on function-level granularity instead of the whole program. According to common software engineering practices, large industrial programs with millions of lines of code are broken down into smaller functions, which usually have between 5 and 40 lines of code. Some chosen benchmark programs purposely have longer and less organized functions that stand for code segments that are not well-modularized. These kinds of cases add more stress tests, which let us see how well the algorithm can handle complex and unstructured code fragments.
4.3. Results
4.3.1. Coverage of the Generated Test Data
In software testing, coverage metrics measure the effectiveness of test execution. Two of the most important are code coverage and branch coverage. Code coverage measures the number of lines of code executed during testing. A high value indicates that most of the program has been tested. However, it does not always mean that all program logic or hidden paths have been tested. Branch coverage focuses on decision points, such as if, else, or switch statements. It measures whether both possible outcomes of each decision have been tested. This makes it more robust than code coverage because it shows that multiple paths through the program logic have been explored. Using these metrics together provides a more complete picture of testing. Code coverage shows whether code is executing, while branch coverage shows whether its decisions are tested in all execution paths. High values for both metrics indicate that the test generation tool is more effective at detecting bugs and ensuring software reliability.
Figure 6 shows the line coverage of the generated test data by different methods. The proposed PSO-GWO algorithm was tested and compared with RND, GA, GWO, PSO, and GA-GWO. The evaluation was conducted on 26 test programs of varying complexity. The algorithms were measured using line coverage and branch coverage, commonly used metrics in software testing. The results show that PSO-GWO offers better coverage of most functions. It performs well even in complex programs where other algorithms fail. This is because PSO-GWO combines the fast convergence of PSO with GWO’s exploratory capabilities. This hybrid method balances breadth-first and depth-first search, increasing the diversity of test data and helping cover a larger number of program paths. In summary, PSO-GWO is more efficient than other algorithms. It is particularly useful for programs with complex control structures and diverse input data, making it suitable for real-world testing.
Figure 6.
The line coverage of the generated test data by different methods for 26 benchmark programs, which are split and shown in four subcharts.
The average coverage results show apparent differences between the algorithms. RND had the lowest score at 75.88%, indicating weak exploration and low test effectiveness. GA performed slightly better with 78.18%, but it still suffered from slow convergence and early stagnation. Among single algorithms, PSO achieved the best result with 84.43%, while GWO reached 83.05%. This shows that swarm-based methods are stronger than random or genetic approaches. The hybrid GA-GWO gave 83.65%, better than GA and close to GWO. The proposed PSO-GWO achieved the highest average coverage of 88.37%. This is a 16.6% improvement over RND, 10.2% over GA, and about 4.7% over PSO. These results show that PSO-GWO offers the best balance of exploration and exploitation, making it the most effective method for test generation.
Figure 7 shows the branch coverage results of all algorithms for selected test functions. Branch coverage is an important metric because it measures the number of decision paths (true/false branches) executed during testing. Higher coverage indicates that the test generation method is more effective at exploring different program flow paths. The figure shows that the proposed PSO-GWO method achieved the highest branch coverage for most functions. In particular, it outperformed other algorithms on the most complex tests, such as f5, f8, f18, f21, and f26. Other algorithms, such as PSO and GWO, also performed well on several functions, but their coverage values were often lower than PSO-GWO. Figure 7 shows that PSO-GWO provides more complete branch coverage, making it more effective at detecting potential bugs and ensuring higher-quality software testing.
Figure 7.
The branch coverage of the generated test data by different methods for 26 benchmark programs, which are split and shown in four subcharts.
As shown in Figure 7, the RND method achieves the lowest coverage at 75.36%, while the GA improves slightly to 77.08%. The swarm-based methods, GWO and PSO, achieve significantly better results, at 82.52% and 82.44%, respectively. The GA-GWO hybrid achieves 80.33%, which is higher than RND and GA but lower than single swarm methods. The PSO-GWO hybrid achieves the highest coverage, at 82.88%, demonstrating that combining PSO exploration with GWO exploitation produces the most effective test cases.
Figure 8 shows the variance among the results obtained by the methods in the benchmark programs. Variance measures the method’s consistency across different test functions. High variance indicates highly variable coverage, while low variance indicates stable performance. RND has the highest variance, which makes it unstable. GA testing is slightly more consistent but still exhibits low coverage for some functions. Swarm-based methods such as PSO and GWO exhibit lower variance, indicating more stable performance. Hybrid methods, especially PSO-GWO, further reduce variance and provide consistently high coverage. Overall, PSO-GWO is the most stable and reliable method tested.
Figure 8.
The variation in the results obtained by different testing methods during different benchmark programs.
The achieved coverage depends on the benchmark programs used in the experiments. In this study, the selected benchmarks are more complex than those used in most previous works. Many of these programs include deeply nested conditionals and low-reachability branches, which make test generation more difficult. Such complex structures reduce the likelihood of reaching certain code sections, as they can only be executed with specific input value combinations. To ensure a fair comparison, all test generation methods, including RND, GA, PSO, GWO, GA-GWO, and the proposed PSO-GWO, were implemented by the authors. All experiments were performed on the same hardware platform and with the same benchmark programs. This setup ensures that performance differences arise solely from the algorithms, not from external factors. The results show that the proposed method achieves higher branch coverage, especially in hard-to-reach and deep program locations, proving its effectiveness in complex testing scenarios.
4.3.2. Fault Discovery Rate of the Generated Test Data
In the second stage of the evaluation, the Mutation Score (MS) was measured for six test-data generation algorithms for 26 functions. A bar graph was created for each function to show the algorithms’ mutation scores. Mutation testing is important because the mutation score indicates how well the test suite detects injected errors (mutants) in the source code. A higher score means that the test suite can find more hidden errors, leading to better error detection and stronger program validation.
The results show that the PSO-GWO method outperforms other algorithms. For many functions, PSO-GWO achieved higher mutation scores, demonstrating its ability to detect errors that genetic algorithms, PSO, or GWO missed. Although some methods failed for specific functions, PSO-GWO produced consistent, reliable results. For example, the genetic algorithm failed to produce a valid score for function f05, whereas PSO, GWO, and the genetic algorithm all returned zero scores for function f19. In contrast, PSO-GWO detected errors in these challenging cases. In summary, PSO-GWO improves not only coverage but also error detection. By combining the strengths of PSO and GWO, it generates stronger test cases that expose more defects, making it a reliable and efficient software testing method.
Figure 9 shows the fault-detection rates for different test generators. The average fault detection rate (FDR) across all test functions shows that the hybrid PSO-GWO method achieves the highest FDR of 67.45%, indicating the highest fault detection efficiency. Among the other methods, GA-GWO ranks second in efficiency, with an average FDR of 61.47%, followed by GA (59.92%) and PSO (55.03%). GWO alone achieves 51.37%, while the random testing method (RND) has the lowest average FDR of 47.70%. This trend clearly shows that combining algorithms, and PSO-GWO in particular, significantly improves fault detection efficiency compared to individual or random methods.
Figure 9.
The fault discovery rate of the test data generated by different testing methods for 26 benchmark programs, which are split and shown in four subcharts.
The differences observed in the results highlight the significant impact of utilizing different operators from PSO and GWO within the hybrid algorithm. The PSO-GWO hybrid combines the velocity update and position adjustment mechanisms of PSO with the hierarchical leadership and encircling behavior of GWO, resulting in a more effective balance between exploration and exploitation. This synergy enables the algorithm to escape local optima while efficiently refining promising regions of the search space.
4.3.3. Evaluation of the Test Set Size
In the third evaluation, the number of test data generated by each algorithm for testing the functions is examined. For each function, a bar chart shows the amount of data generated. Figure 10 shows the number of test data generated by testing methods. The Random algorithm is excluded because it produces a very large number of data points (500 per function), making comparisons with other algorithms difficult. By excluding it, a more precise visual comparison is provided. In software testing, less test data is considered more efficient in terms of time and cost. Therefore, algorithms that generate smaller, more effective test sets are considered better.
Figure 10.
The number of test data generated by different testing methods for 26 benchmark programs, which are split and shown in four subcharts.
The average number of test data points generated by each algorithm indicates a significant performance difference. GA, GWO, and PSO generate approximately the same number of test data points, with average values of 12.3, 12, and 12, respectively. This suggests that these algorithms require a relatively large amount of test data to achieve sufficient test coverage. In contrast, the hybrid algorithms GA-GWO and PSO-GWO generate significantly fewer test data points, averaging only 3.5 per algorithm. This demonstrates that hybrid methods are more efficient because they create smaller test sets while maintaining the same effectiveness, reducing computational effort and testing time. In the graph for function f05, the results of the genetic algorithm are not shown. This is because an error or an infinite loop occurred when using the data generated by this algorithm, preventing the generation of valid data.
4.3.4. The Time Required for Test Data Generation
In the fourth stage of evaluation, the time (in seconds) required to generate test data for each function was measured. For comparison, a bar graph was drawn for each function, showing the execution time of each algorithm. Figure 11 shows the time required to generate test data using different methods. The Random algorithm is not included in these graphs. This is because it does not perform iterative optimization and completes the process in a single step. Its execution time is much shorter than the other algorithms, which makes its bar invisible and disrupts the comparison. Removing it allows a clearer view of the execution times of the other methods. In software testing, shorter execution time is important for efficiency. Therefore, methods that generate test data faster are considered more optimal from a time perspective.
Figure 11.
The time required for generating test data by different methods.
The results show that GA requires an average of 2626 s, GWO 2919.1 s, and PSO 3025.65 s, making PSO the slowest of the individual methods. Hybrid methods are faster: GA-GWO requires 1639.6 s, which is significantly less than the time required by the individual methods. PSO-GWO achieves the best performance, with an average time of 1257.7 s, about half that of GA, GWO, and PSO. This shows that PSO-GWO is the most efficient method, as it combines the advantages of PSO and GWO while reducing computation time. Overall, PSO-GWO consistently shows the lowest execution times across most functions, making it the most time-efficient method.
Additionally, the number of test data generated by each algorithm serves as another key performance indicator. Generally, a lower number of test data implies reduced execution time and less redundancy in testing, which directly contributes to higher testing efficiency. Unlike time measurements, this metric is entirely independent of hardware and software environments, which makes it a more stable and hardware-neutral indicator of test generation performance. Consequently, both metrics together (execution time and number of generated tests) provide a balanced and platform-independent evaluation of the proposed test generator’s performance.
Figure 12 shows the variance in the mutation scores across different methods. The boxplot of mutation values shows that some methods are more stable than others. PSO-GWO has the best mutation score and produces effective and efficient test data with less performance degradation for most functions. GA-GWO and GA also perform well but exhibit more variability. In contrast, RND, GWO, and PSO exhibit more variability. As shown in Figure 13, the boxplot of the number of test data shows significant differences. GA, GWO, and PSO are available in 12 test cases and can be used in different ways. On the other hand, GA-GWO and PSO-GWO produce between 1 and 8 cases depending on the function. Hence, the hybrid methods often generate fewer but more focused test cases.
Figure 12.
The variance of the mutation score of the generated test data by different methods.
Figure 13.
The variance of the number of generated test data by different methods.
In the suggested method, each test input in the population is encoded as a fixed-length array containing the program under test’s inputs. For example, in the triangle program, which includes three inputs, the individual is represented by Table 5. This encoding allows the optimization algorithm to manipulate candidate solutions without any additional transformation or mapping. Because the triangle program evaluates conditional logic based on comparing these three integers, the direct integer encoding ensures that every candidate represents a valid program input, enabling efficient crossover, mutation, and heuristic search operations.
Table 5.
A small subset of the population for a program under test with three integer inputs.
Figure 14 compares the code coverage achieved by RND and a GA for a classifier program with a cyclomatic complexity of 18. The codes highlighted in green indicate the full coverage by the test generation method. The code highlighted in red indicates the not covered, and the yellow color indicates codes whose coverage is between 1 and 99%. On the left side (RND) of Figure 14, several branches and conditions remain uncovered, especially in the program’s deeper decision paths. This indicates that random inputs did not explore all possible execution flows. On the right side (GA), almost all lines and conditions are covered. This indicates that GA-based test generation more effectively explores various execution paths. This shows that GA systematically guides the selection of test inputs to achieve higher coverage compared to random testing.
Figure 14.
Comparing the RND and GA in terms of coverage for the classify benchmark program. (a) Coverage of test data generated by RND; (b) coverage of test data generated by GA.
Figure 15 compares PSO and GWO in terms of test data coverage for a classifier program with a cyclomatic complexity of 18. The green lines show the tested code, and the red lines show the untested part. Both PSO and GWO cover almost the entire program and achieve very high coverage. However, both methods miss the branch in the condition in deep locations. This means that while PSO and GWO are powerful methods for generating test data, they still cannot achieve complete coverage across all conditions. Figure 14 compares the test coverage of the classify program using two methods (GA-GWO and PSO-GWO). The program has a cyclomatic complexity of 18, indicating that there are many possible ways to test it. As shown in Figure 16, most of the code tested by GA-GWO is in green, indicating it is covered. One branch is in red, indicating it is not tested. All lines are green in the PSO-GWO; the test coverage of each branch is complete. Overall, the PSO-GWO-based test method is more effective than the other methods.
Figure 15.
Comparing the PSO and GWO in terms of coverage for the classify benchmark program. (a) Coverage of test data generated by PSO; (b) coverage of test data generated by GWO.
Figure 16.
Comparing the GA-GWO and PSO-GWO in terms of coverage for the classify benchmark program. (a) Coverage of test data generated by GA-GWO; (b) coverage of test data generated by PSO-GWO.
5. Discussion and Threats to Validity
5.1. Discussion
The results indicate that PSO-GWO provides the best coverage among the methods. It performs well even on complex programs where other methods fail. This is because it combines the fast convergence of PSO with GWO’s exploration capabilities. The hybrid method explores more paths and generates diverse test data. On average, PSO-GWO achieves the highest average coverage of 88.37%. This is better than RND (75.88%), GA (78.18%), GWO (83.05%), PSO (84.43%), and GA-GWO (83.65%). These results demonstrate that PSO-GWO is the most effective method in terms of coverage. Mutation scores measure how well tests detect faults. The results show that the PSO-GWO method has the highest average score of 67.45%. This indicates that it detects more latent faults than the other methods. GA-GWO comes in second with a score of 61.47%. This demonstrates that hybrid methods, and especially PSO-GWO, are more effective at detecting faults.
The number of test data generated by different methods is another evaluation criterion. GA, GWO, and PSO generate an average of about 12 test cases. This number is relatively high. GA-GWO and PSO-GWO, on the other hand, generate significantly fewer cases, on average about 3.5. This demonstrates that hybrid methods are more efficient. They reduce the size of the test data but still achieve good results. Test-data generation time is also important. The results show that analytical algorithms (GA) require 2626 s, GWO algorithms 2919.1 s, and PSO algorithms 3025.65 s. These individual methods are slower. GA-GWO is faster, taking 1639.6 s. The PSO-GWO algorithm performs best, generating data in just 1257.7 s. This is about half the time of GA, GWO, and PSO algorithms. Therefore, the PSO-GWO algorithm is the most time-efficient. It balances coverage, error detection, and data generation speed better than all other algorithms.
The results show that the proposed PSO-GWO-based test data generator works well on complex programs where other methods fail. This success comes from combining the strengths of PSO and GWO. PSO is good at finding solutions quickly because it allows particles to share information and move toward promising areas. However, PSO alone can get stuck in local optima. GWO, on the other hand, has strong exploration ability. It imitates how gray wolves search and hunt together, which helps the algorithm explore more possible solutions. When these two methods are combined, PSO-GWO balances exploration and exploitation. GWO helps explore the search space widely at the beginning, while PSO helps refine the solutions more quickly in later stages. This balance allows the algorithm to generate more diverse and effective test data, which leads to better path coverage. Overall, the results prove that PSO-GWO combines the performance of PSO and the exploration ability of GWO effectively. It achieves high coverage, strong fault detection, and fast execution with fewer test cases. Therefore, PSO-GWO is a powerful and efficient method for automated test data generation and software testing.
Table 6 presents the Friedman statistical analysis results. To statistically compare mutation score performance across all benchmark programs, the Friedman test was applied since all algorithms were evaluated on the same datasets. The results show a statistically significant difference among algorithms (p < 0.001). PSO-GWO achieved the best average rank (1.90), indicating that it consistently outperformed competing methods across programs. The hybrid GA-GWO and GA methods followed, while GWO and RND obtained the lowest ranks. These findings confirm that the proposed PSO-GWO approach provides superior mutation testing effectiveness compared to the baseline and other hybrid approaches.
Table 6.
Friedman Test Results for Mutation Score Comparison.
Our study focuses explicitly on unit testing at the source code level, where individual methods or functions are tested by the testing callers. Integration testing, on the other hand, is a higher-level test that examines how these units interact once they have been individually verified. After the reliability of each unit is verified through unit testing, the next stage (integration testing) is conducted to validate the consistency and correctness of interactions among units. The proposed method in this study is designed for fine-grained analysis at the source code level, where control and data flow within a single method are examined. In contrast, integration testing involves testing connections between units (such as function calls, shared data, APIs, and HTTP requests), which require different tools and techniques. Integration testing generally treats units as black boxes, focusing on their interfaces and communication patterns rather than their internal logic. Therefore, the scope of this research is intentionally limited to unit testing. Extending the proposed approach to integration testing would involve additional challenges, including modeling inter-unit dependencies and API interactions. This remains an essential direction for study, where the method could be adapted to address integration-level behavior.
Table 7 shows different values of the configuration parameters. Figure 17 summarizes the branch coverage results of the proposed test generator under four different parameter configurations. The results indicate that coverage varies slightly across configurations. Configuration 1 achieved the highest average branch coverage (82.88%), demonstrating a strong balance between exploration and exploitation, with many functions (e.g., f2, f3, f9, f16, f18, f21, and f23) achieving full coverage. Configuration 2 produced slightly lower average coverage (81.94%), indicating modest sensitivity to changes in control coefficients and the mutation rate. In Configuration 3, the average coverage decreased further (80.65%), likely due to a less effective exploration phase when PSO guided the search instead of GWO. Configuration 4 showed the lowest performance (78.95%), with greater variation across functions, implying instability in convergence caused by excessive alternation between the two algorithms. Overall, the results confirm that Configuration 1 provides the best balance between global exploration and local exploitation, resulting in the highest and most consistent branch coverage across all configurations.
Table 7.
Configuration values of the suggested method.
Figure 17.
Branch coverage of the suggested test generator in different configurations.
The combination of PSO and GWO was made intentionally to balance the exploration ability of GWO and the exploitation ability of PSO based on the test optimization. Although the combination is simple, it provides a stable and effective way to control the search process for test generation. At the beginning of the optimization, the method focuses more on exploration, while in later iterations, it gradually shifts toward exploitation. This balance helps the algorithm avoid local optima and improve convergence. The blending process is used in the population optimization phase, as shown in the flowchart. The weighting coefficient (α) in Equation (12) decreases with iterations, which allows a smooth transition from global to local search. Experimental results support this design. The proposed method achieved better line and branch coverage, fault discovery rate, and test-generation time than PSO, GWO, and GA alone. Therefore, the linear blending mechanism is both practical and effective for the test-data generation problem.
Hard-to-cover or deep locations in a program typically correspond to nested conditional structures whose execution depends on complex logical expressions. The reachability (execution probability) of the code inside such nested conditionals is directly determined by the values of these expressions, which in turn depend on the input data. However, accurately calculating the execution probability of these conditional branches is an intractable problem, especially for real-world programs with numerous interdependent inputs and control paths. Without exhaustive testing (executing the program with all possible combinations of input values), it is not feasible to precisely determine whether each conditional branch can be reached. Since the input space is typically vast, complete enumeration of all input combinations is practically impossible. Therefore, test generation methods must rely on heuristic or search-based mechanisms to approximate this reachability and maximize coverage of such deep or hard-to-reach program regions.
The proposed hybrid PSO–GWO method, enhanced with mutation and crossover operators, is capable of effectively detecting and reaching deep program locations. It does so by preserving test candidates that exhibit potential coverage improvements, even if their immediate fitness values are low. These preserved candidates guide the search process toward structurally complex and rarely executed regions of the program. As a result, this method enables earlier and more consistent exploration of hard-to-reach areas. This represents a significant advantage over conventional test generation approaches, which often fail to access such regions or only reach them in the final iterations. The results presented in Table 8 show the effectiveness of the proposed method in achieving this goal. Compared to other test generation approaches, the suggested method significantly reduces the percentage of uncovered branches, particularly those located in deeper or more complex parts of the control-flow graph. As shown in the table, the PSO-GWO hybrid method achieves the lowest uncovered percentage (17.12%), outperforming both individual and hybrid algorithms.
Table 8.
The capability of different test generators to cover the hard-to-cover parts of the benchmark codes.
Microsoft IntelliTest is a concolic unit test generation tool available exclusively in Visual Studio. IntelliTest uses concolic testing, where symbolic execution is combined with concrete execution to systematically explore and generate unit test inputs that cover alternative program paths. Constraints extracted from branch conditions are solved using constraint solvers, enabling deep path exploration and detection of edge-case behaviors that are typically missed by random or heuristic-based search methods. Compared to IntelliTest, which relies on concolic testing to systematically explore execution paths through constraint solving, the proposed hybrid PSO–GWO method demonstrates superior effectiveness in test-data generation. While IntelliTest is highly effective in targeting branch-dependent paths, its performance is constrained by limited exploration ability in complex input domains.
As shown in Table 4, the utilized benchmarks have a complex input domain. In contrast, our hybrid approach benefits from the global exploration capability of Particle Swarm Optimization combined with the hunting and leadership hierarchy mechanism of the Gray Wolf Optimizer. Regarding the experimental results shown in Figure 18, the proposed method achieves higher line and branch coverage and superior mutation score across iterations. Experimental results confirm that the hybrid metaheuristic structure enables a more diverse and deeper search of the test data space, allowing earlier and more consistent discovery of hard-to-reach program locations than concolic-based IntelliTest.
Figure 18.
The coverage provided by the suggested method and the IntelliTest tool.
Modern automated test-generation tools, such as concolic testing and learning-based approaches, have been experimentally compared with the suggested test generator. Table 9 shows the branch coverage of the suggested method along with IntelliTest (a concolic testing tool), EvoSuite (a popular search-based automated unit test generator), and two new LLM-based test generation tools, ChatUniTest [18] and ChatTester [19]. The results indicate that PSO-GWO has the best branch coverage of all the methods that were compared. It has 82.88% coverage, which is better than IntelliTest (77.45%), EvoSuite (81.00%), ChatTester (80.20%), and ChatUniTest (82.41%), but only slightly better than ChatUniTest. These results show that the suggested hybrid metaheuristic approach is still competitive with, and in most cases better than, modern tools for learning-based and concolic testing.
Table 9.
Branch Coverage Comparison with Modern Test Generation Tools.
In our experiments, the proposed test-generation algorithm uses a population size of 50–70 candidate inputs and evolves them for at least 100 iterations. For each candidate, the target program is executed, and coverage information is collected. Over many generations, this process approximates the probability that each statement is executed, which we interpret as its empirical reachability. Statements that are executed infrequently throughout the search process correspond to low-reachable (hard-to-cover) code.
Figure 19 shows the line coverage report for the IsLeapYear(int y) benchmark. The numbers on the left indicate how many times each line was executed for a given test. In this run, the method was entered eight times because there are eight test data in the generated test set. In the full experiments for this benchmark program, a population of 50 tests and 100 iterations was used to approximate the reachability of such hard-to-cover code. Lines 10–15 in the code shown in Figure 19 were never executed (all marked with 0). This is a clear example of low reachability (hard-to-cover) in the program, which is very rarely covered by the naïve inputs.
Figure 19.
The test report generated for one of the benchmark programs.
The suggested method has significant real-world effects on software testing because it automatically generates high-quality test data that covers a large codebase and branches, making it easier to find bugs. The method helps developers and testing teams focus their testing on the most important parts of the program by covering hard-to-cover areas of the source code. This means that fewer test inputs are needed, which saves time and money. The automatic removal of duplicate test cases makes maintenance even easier and makes the test suite work better. Also, the unit-level defect injection platform for C# functions that was built lets you systematically test how well it finds faults, helping ensure quality in real development environments. Overall, the fully automated framework facilitates scalable and cost-effective testing workflows, making it suitable for integration into continuous integration and industrial software development pipelines.
5.2. Threats to Validity
This study faces several potential threats to validity. The experiments were done using standard benchmark programs and fixed parameter settings. Nonstandard program types or parameter values may yield different results. Its performance on larger programs should be evaluated, and additional experiments are needed. This study used coverage and mutation score to measure performance. These metrics do not consider the issue of infeasible paths, which may affect coverage results. Although PSO-GWO yielded better results, test prioritization was not considered. This study mainly focused on code coverage and mutation scores as evaluation metrics. However, the lack of an effective test oracle limits the accuracy of fault-detection results. Without a strong oracle, it is not easy to fully verify the correctness of the generated test cases.
6. Conclusions
The experimental results clearly demonstrate that the proposed PSO-GWO-based test generator outperforms all compared methods in software test-data generation. The suggested metaheuristic-driven test generator achieves the highest average coverage (88.37%) and mutation score (67.45%), confirming its superior ability to explore the input space and detect hidden faults. These findings highlight the advantage of combining the fast convergence of PSO with the strong exploration ability of GWO, enabling the algorithm to generate diverse and effective test data. Moreover, PSO-GWO demonstrates remarkable efficiency by producing a smaller number of test cases and requiring the least generation time. This means the hybrid approach not only improves testing effectiveness but also reduces computational cost. Overall, the experimental results indicate that the PSO–GWO method demonstrates improved effectiveness and efficiency for automated test-data generation compared with the tested algorithms under the same benchmark programs and experimental settings. It provides better fault detection, higher coverage, and faster execution, making it a highly promising technique for practical software testing and future studies of oracle-based test automation.
Infeasible path identification is a challenge in source-code-driven testing; this is one of the suggested method’s drawbacks and should be addressed as a future study. Improving coverage of fault-prone paths, rather than covering all paths of the program under test, is another future study. The oracle problem in software testing is a distinct and difficult field of study that aims to automatically verify the accuracy of program outputs. Recent research has investigated statistical, machine learning (ML), and deep learning (DL)-based methodologies for developing intelligent oracles that can detect anomalous or erroneous behaviors without clearly specified expected outcomes. Developing an efficient test oracle is not extensively focused on in the current study; hence, extension of an effective oracle is the subject of another future study. Minimizing overlapping and redundant test cases can be considered another future study. Another focus is the reduction of the implementation complexity in the hybrid methods to facilitate their practical application. Finally, adaptive strategies could be explored to dynamically adjust the number of generated test cases, thus balancing performance and completeness in different testing scenarios.
Author Contributions
B.A. designed the suggested procedure. B.A. and M.I.S. implemented and coded the suggested algorithm. B.A. and M.I.S. benchmarked the implemented method. B.A., M.I.S. and H.K. carried out analysis of the data and results. The manuscript was written by B.A. and H.K. All authors have read and agreed to the published version of the manuscript.
Funding
This research received no external funding.
Data Availability Statement
The data sets (benchmark programs) used in this study are freely available.
Conflicts of Interest
All authors state that there are no conflicts of interest.
References
- Keshtgar, S.A.; Arasteh, B.B. Enhancing Software Reliability against Soft-Error using Minimum Redundancy on Critical Data. Int. J. Comput. Netw. Inf. Secur. (IJCNIS) 2017, 9, 21–30. [Google Scholar] [CrossRef] [Scilit]
- Arasteh, B.; Arasteh, K.; Ghaffari, A.; Ghanbarzadeh, R. A new binary chaos-based metaheuristic algorithm for software defect prediction. Clust. Comput. 2024, 27, 10093–10123. [Google Scholar] [CrossRef] [Scilit]
- Hosseini, S.M.; Arasteh, B.; Isazadeh, A.; Mohsenzadeh, M.; Mirzarezaee, M. An error-propagation aware method to reduce the software mutation cost using genetic algorithm. Data Technol. Appl. 2021, 55, 118–148. [Google Scholar] [CrossRef] [Scilit]
- Mårtensson, T. So much more than test cases—An industrial study on testing of software units and components. J. Syst. Softw. 2025, 228, 112479. [Google Scholar] [CrossRef] [Scilit]
- Abdi, M.; Mardukhi, F. Automatic near-optimal generation of software test data for critical paths. J. Supercomput. 2025, 81, 672. [Google Scholar] [CrossRef] [Scilit]
- Ouédraogo, W.C.; Plein, L.; Kabore, K.; Habib, A.; Klein, J.; Lo, D.; Bissyandé, T.F. Enriching automatic test case generation by extracting relevant test inputs from bug reports. Empir. Softw. Eng. 2025, 30, 85. [Google Scholar] [CrossRef] [Scilit]
- Sugave, S.R.; Kulkarni, Y.R.; Jagdale, B.; Gutte, V. Fault-Aware Test Case Prioritization in Software Testing Using Jaya Archimedes Optimization Algorithm. J. Electron. Test. 2025, 41, 41–61. [Google Scholar] [CrossRef] [Scilit]
- Guo, X.; Okamura, H.; Dohi, T. Optimal test case generation for boundary value analysis. Softw. Qual. J. 2024, 32, 543–566. [Google Scholar] [CrossRef] [Scilit]
- Yang, R.; Xu, X.; Wang, R. LLM-enhanced evolutionary test generation for untyped languages. Autom. Softw. Eng. 2025, 32, 20. [Google Scholar] [CrossRef] [Scilit]
- Arasteh, B.; Ghaffari, A.; Khadir, M.; Torkamanian-Afshar, M.; Pirahesh, S. Effective test-data generation using the modified black widow optimization algorithm. Signal Image Video Process. 2024, 18, 5333–5346. [Google Scholar] [CrossRef] [Scilit]
- Arasteh, B.; Arasteh, K.; Ghaffari, A. An automatic software test-generation method to discover the faults using fusion of machine learning and horse herd algorithm. J. Supercomput. 2025, 81, 741. [Google Scholar] [CrossRef] [Scilit]
- Arasteh, B.; Hosseini, S.M.J. Traxtor: An Automatic Software Test Suit Generation Method Inspired by Imperialist Competitive Optimization Algorithms. J. Electron. Test. 2022, 38, 205–215. [Google Scholar] [CrossRef] [Scilit]
- Ghaemi, A.; Arasteh, B. SFLA-based heuristic method to generate software structural test data. J. Softw. Evol. Proc. 2020, 32, e2228. [Google Scholar] [CrossRef] [Scilit]
- Li, Y.; Liu, P. Hierarchical tree-based algorithms for efficient expression parsing and test sequence generation in software models. J. Syst. Softw. 2025, 223, 112354. [Google Scholar] [CrossRef] [Scilit]
- Yang, R.; Xu, X.; Wang, R. TestLoter: A logic-driven framework for automated unit test generation and error repair using large language models. J. Comput. Lang. 2025, 84, 101348. [Google Scholar] [CrossRef] [Scilit]
- Guo, X.; Okamura, H.; Dohi, T. Improving test suite generation quality through machine learning-driven boundary value analysis. Array 2025, 27, 100496. [Google Scholar] [CrossRef] [Scilit]
- Mirjalili, S.; Mirjalili, S.M.; Lewis, A. Grey Wolf Optimizer. Adv. Eng. Softw. 2014, 69, 46–61. [Google Scholar] [CrossRef] [Scilit]
- Xie, Z.; Chen, Y.; Zhi, C.; Deng, S.; Yin, J. ChatUniTest: A ChatGPT-based automated unit test generation tool. arXiv 2023. [Google Scholar] [CrossRef] [Scilit]
- Yuan, Z.; Lou, Y.; Liu, M.; Ding, S.; Wang, K.; Chen, Y.; Peng, X. No More Manual Tests, Evaluating and Improving ChatGPTfor Unit Test Generation. arXiv 2023. [Google Scholar] [CrossRef] [Scilit]
- Available online: https://github.com/bahmanarasteh/STGEN-Hybrid.git (accessed on 3 March 2026).
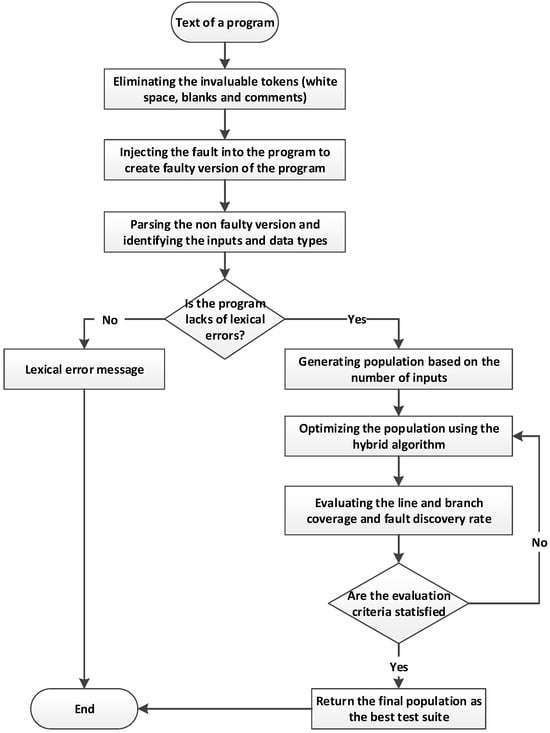
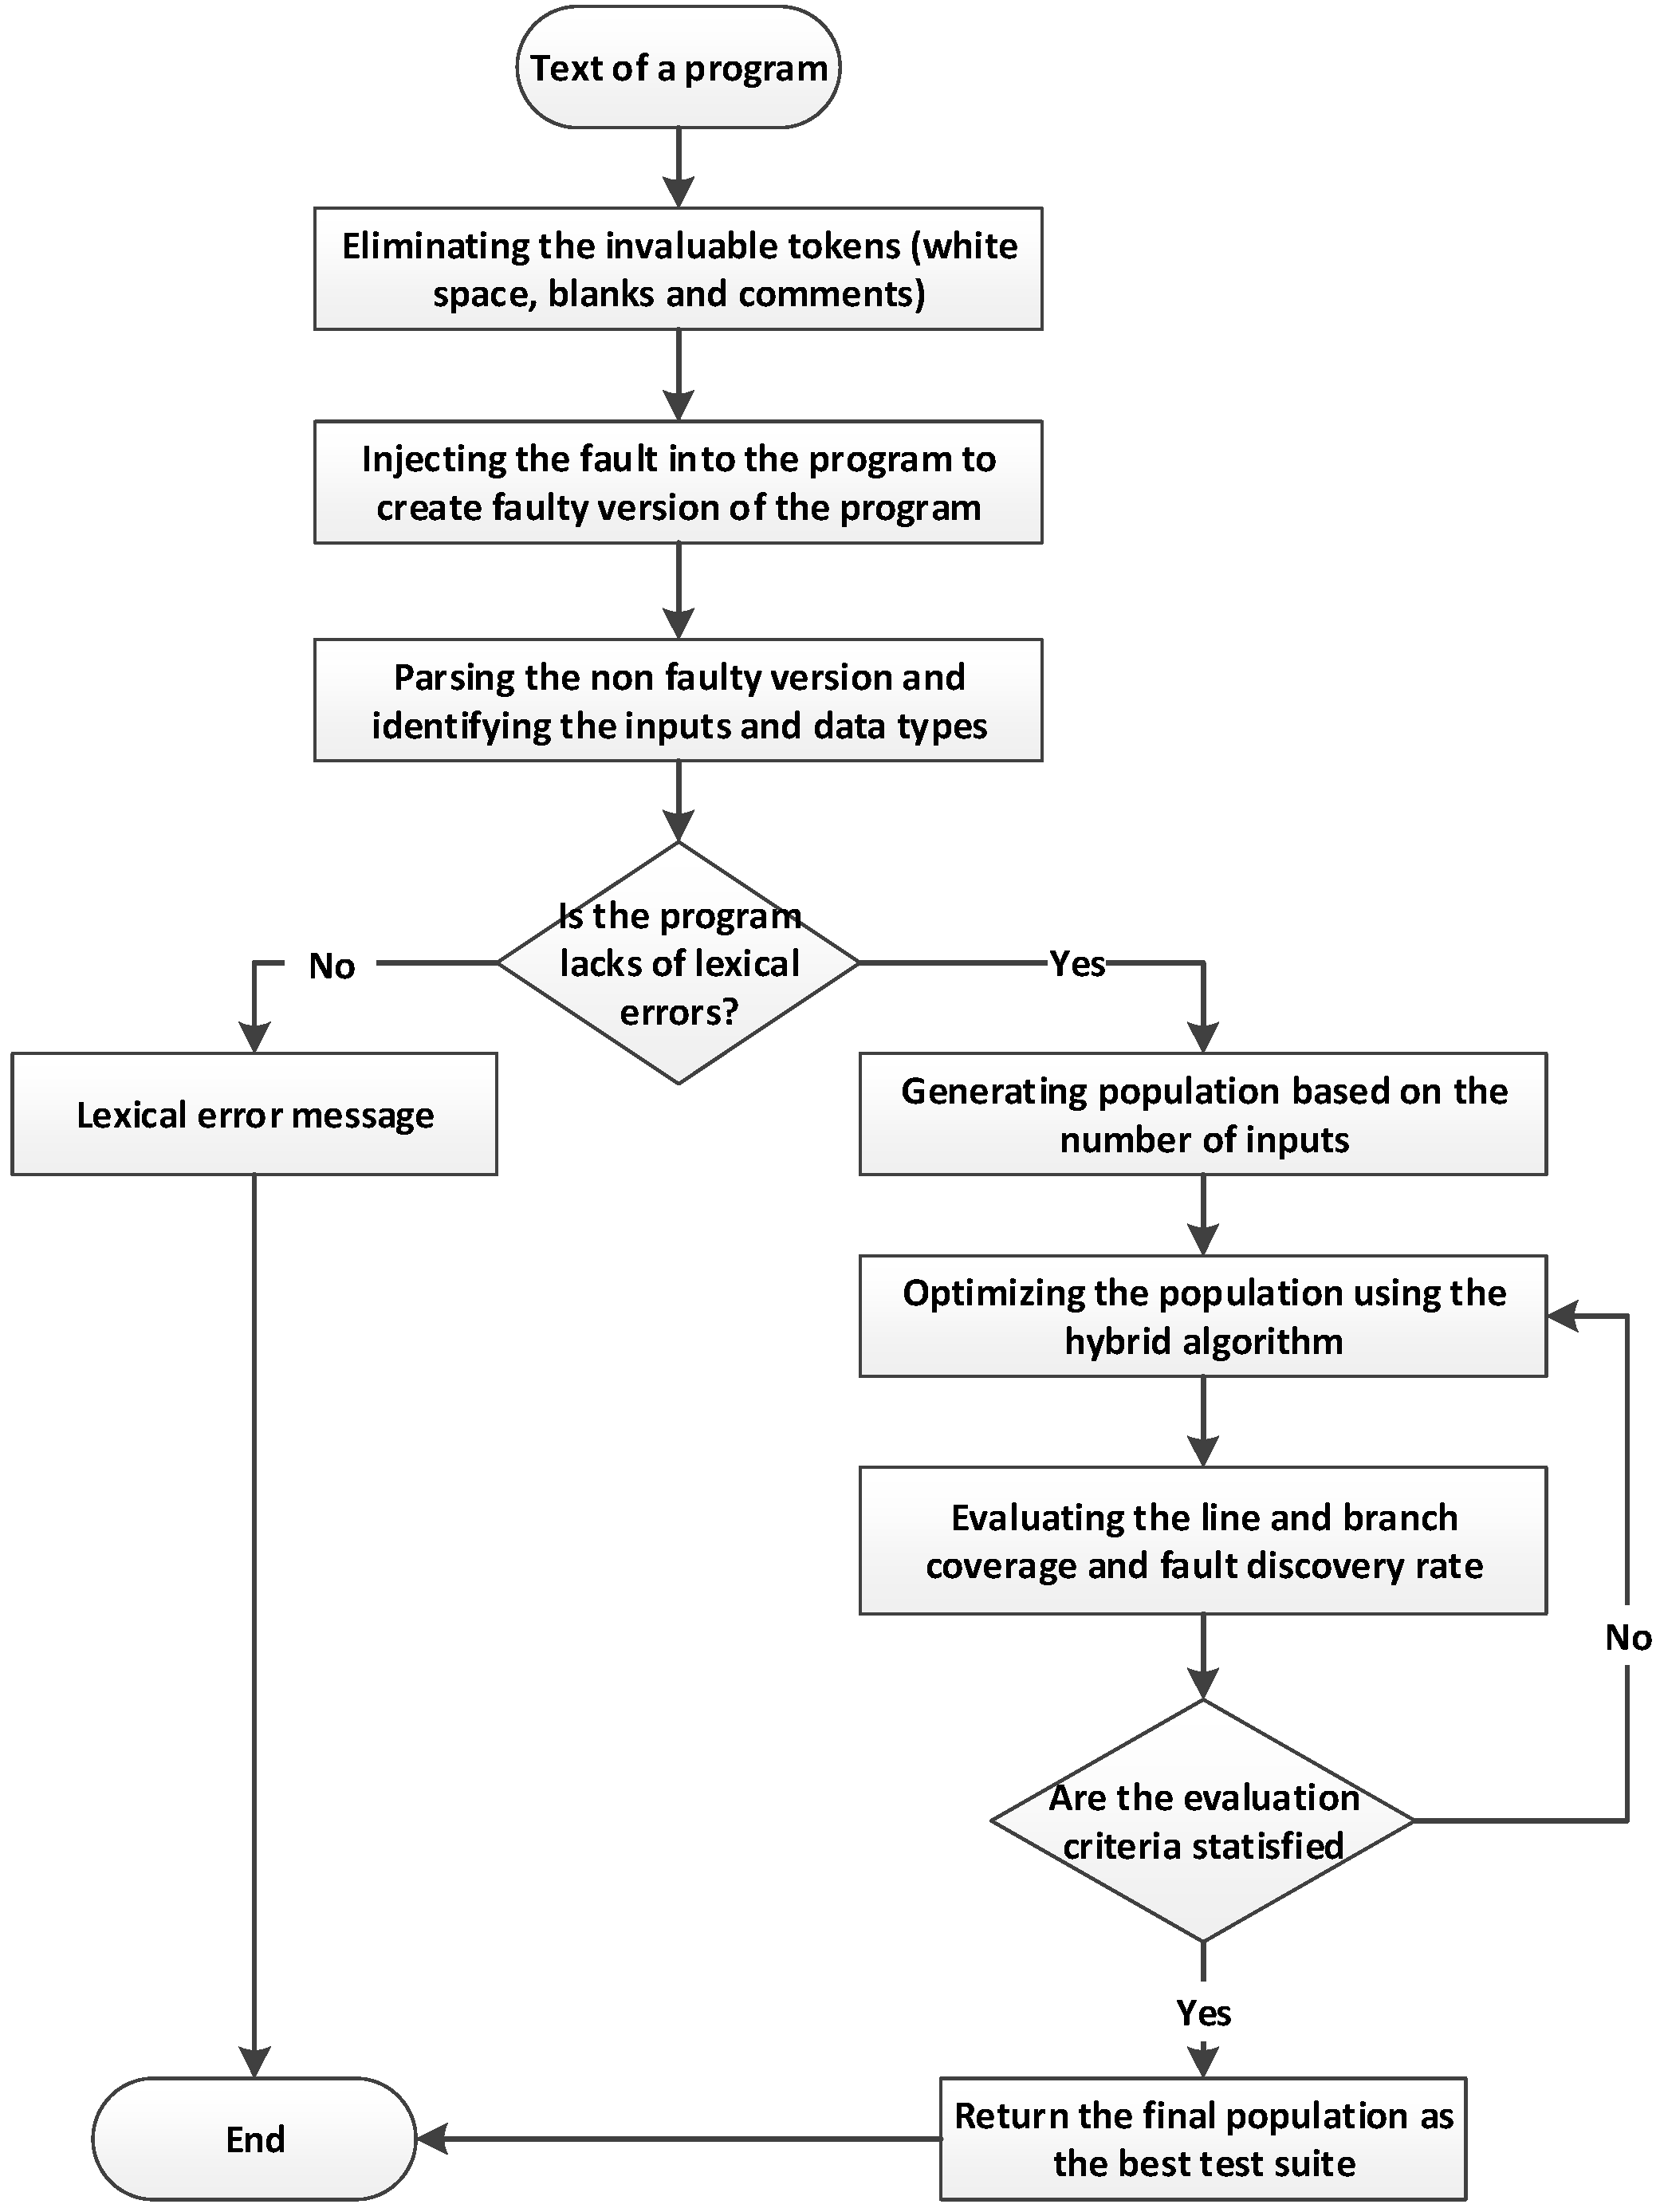
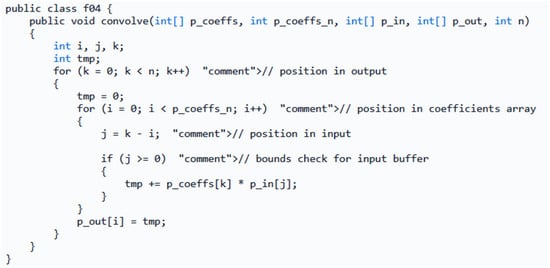
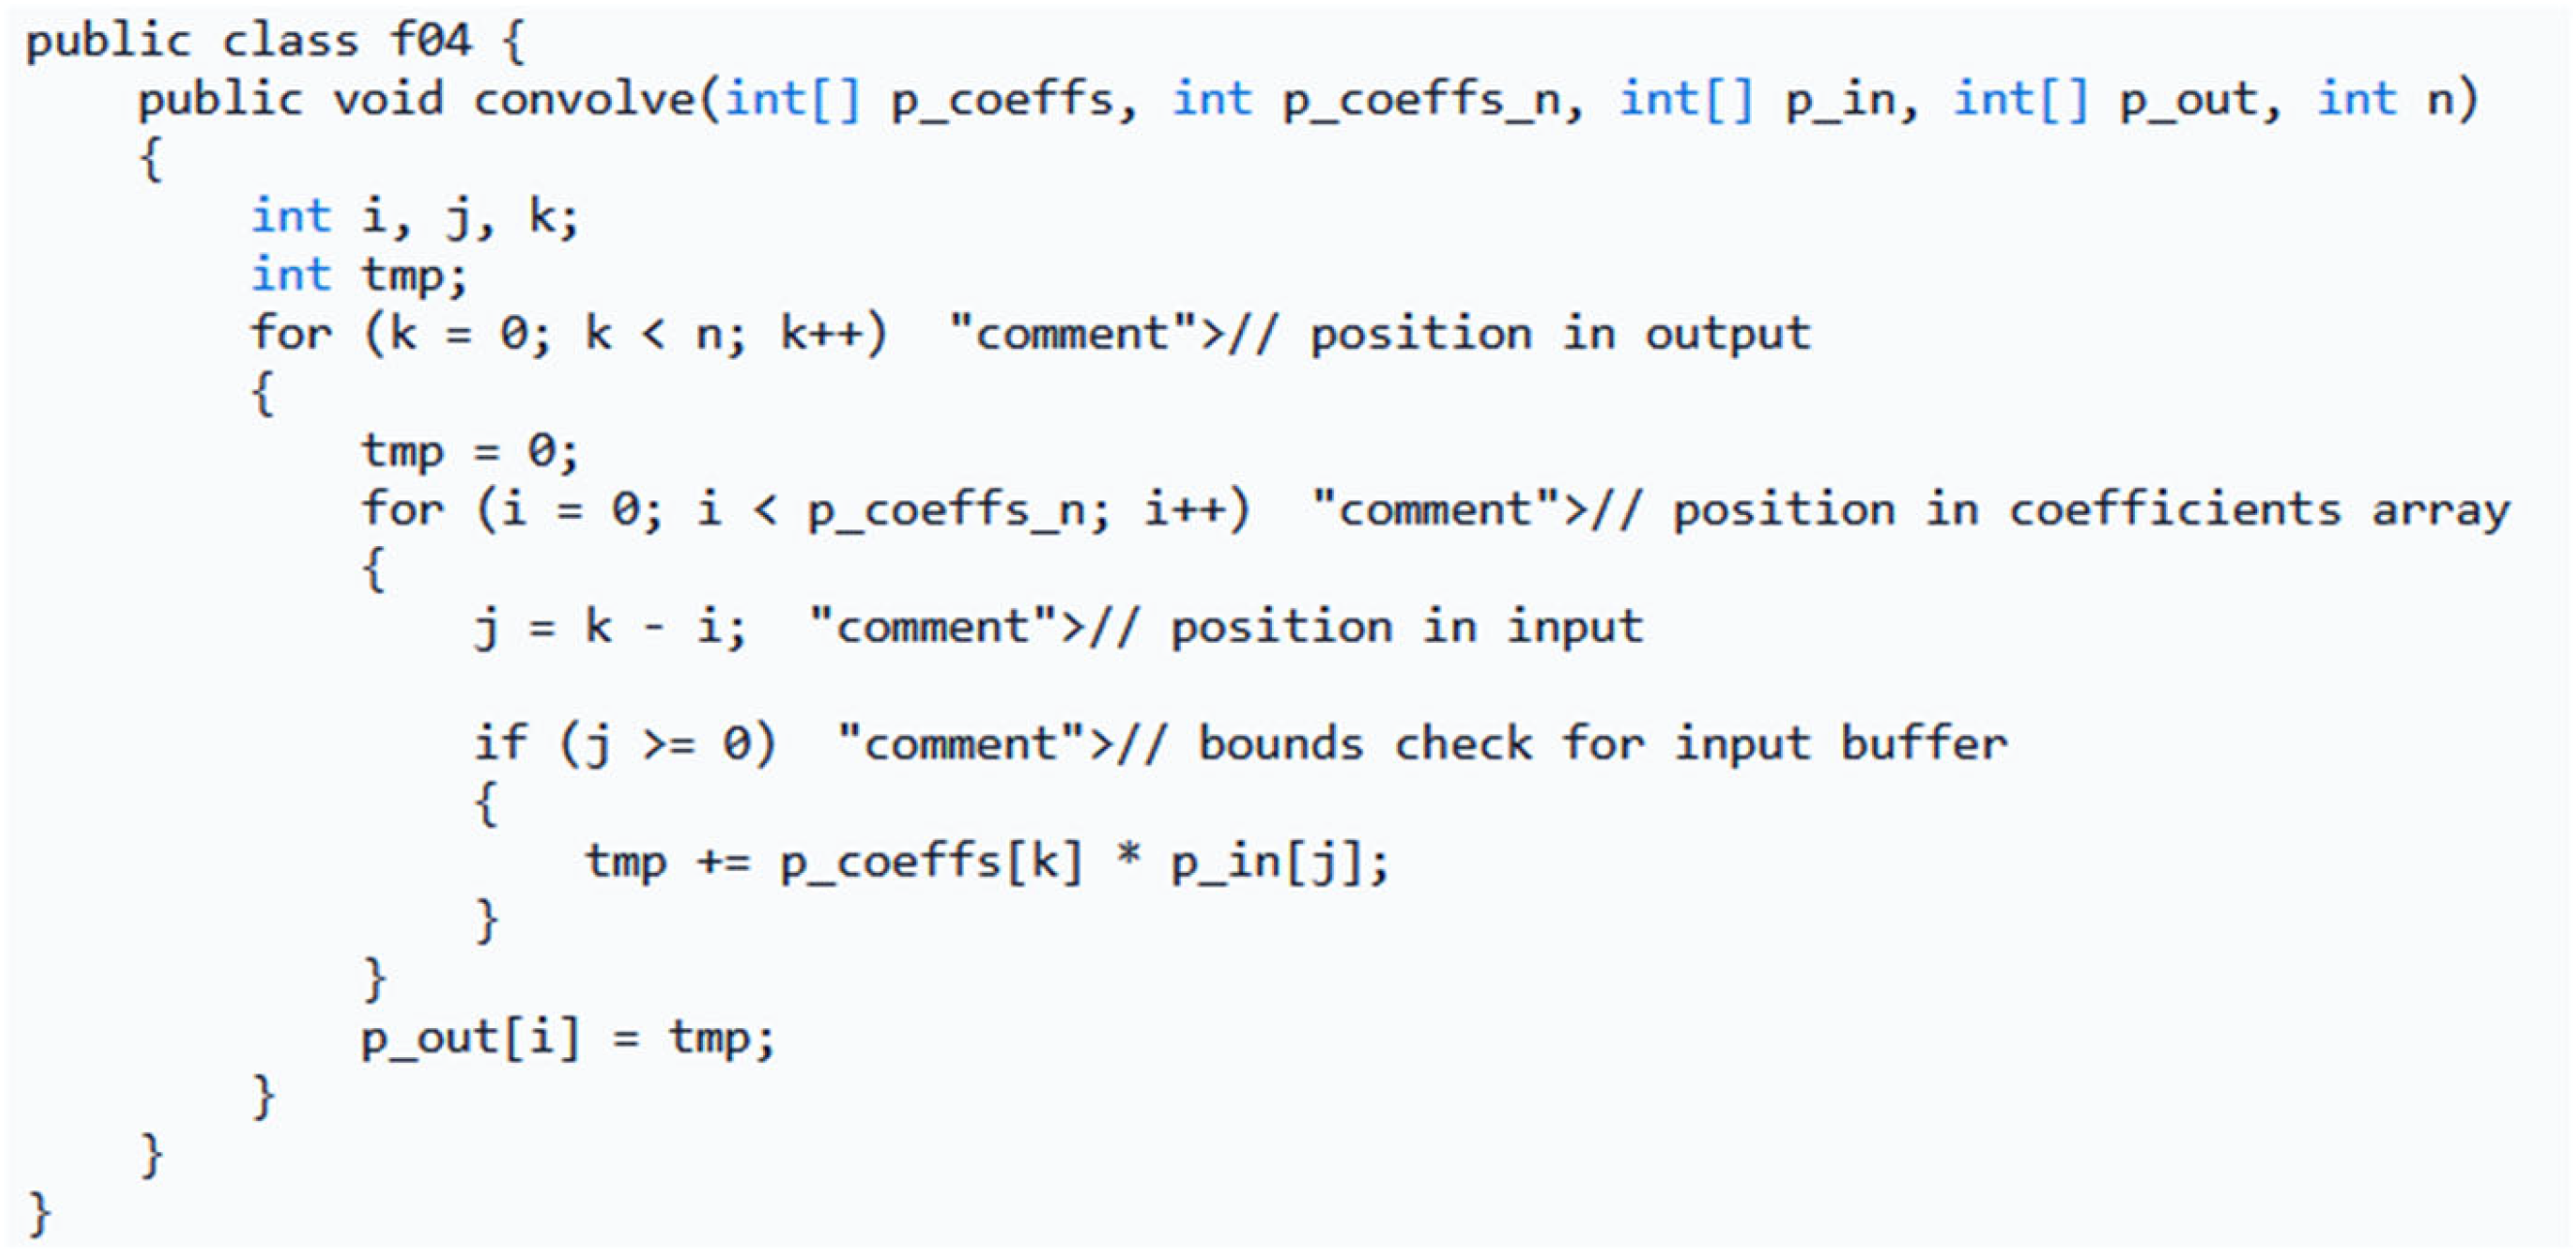
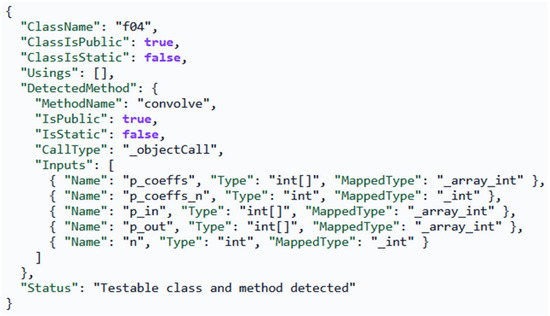
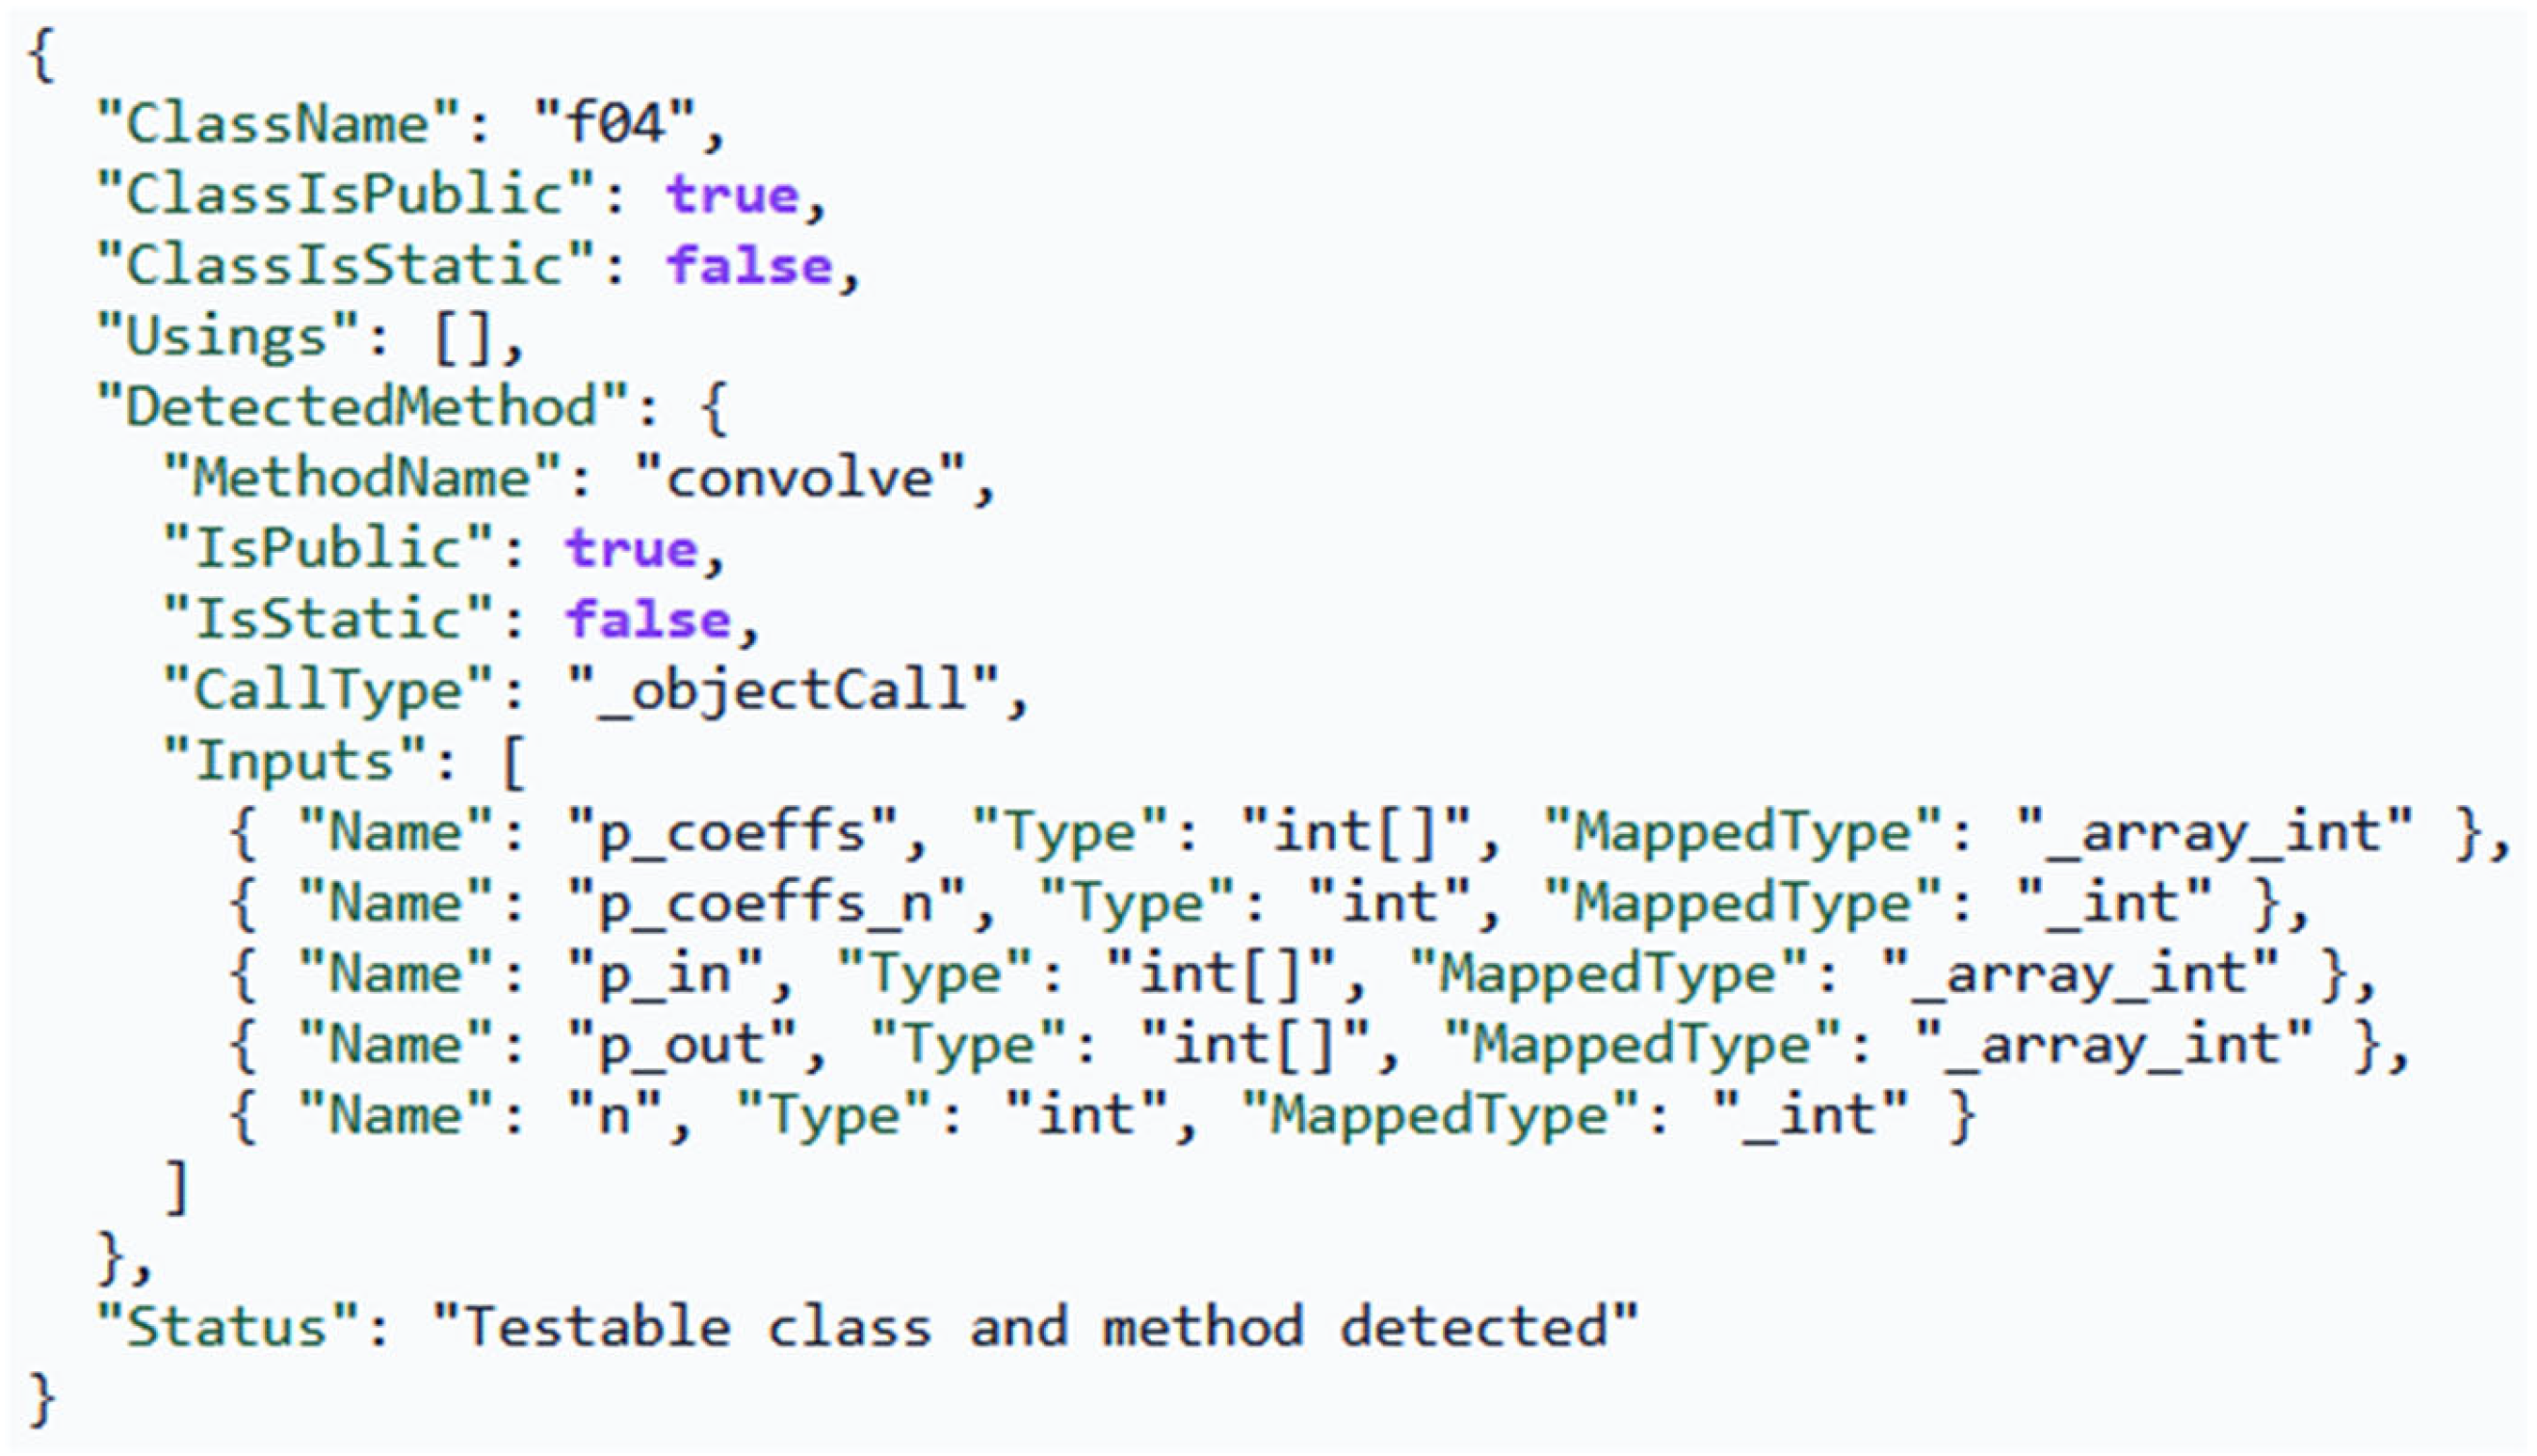
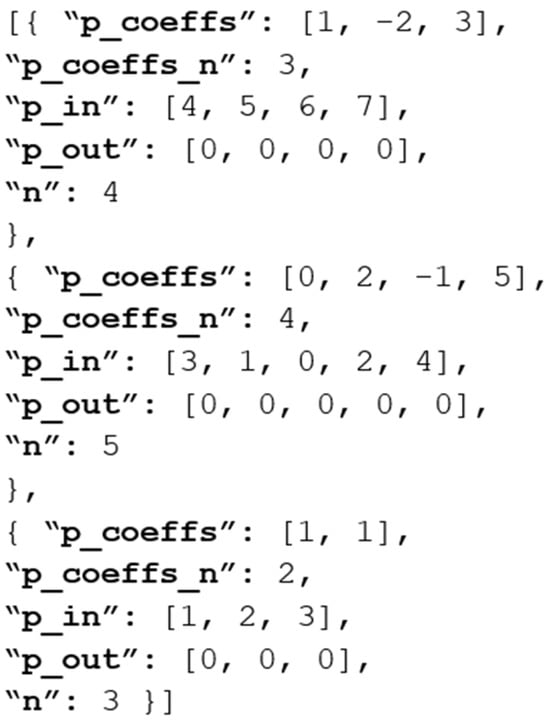
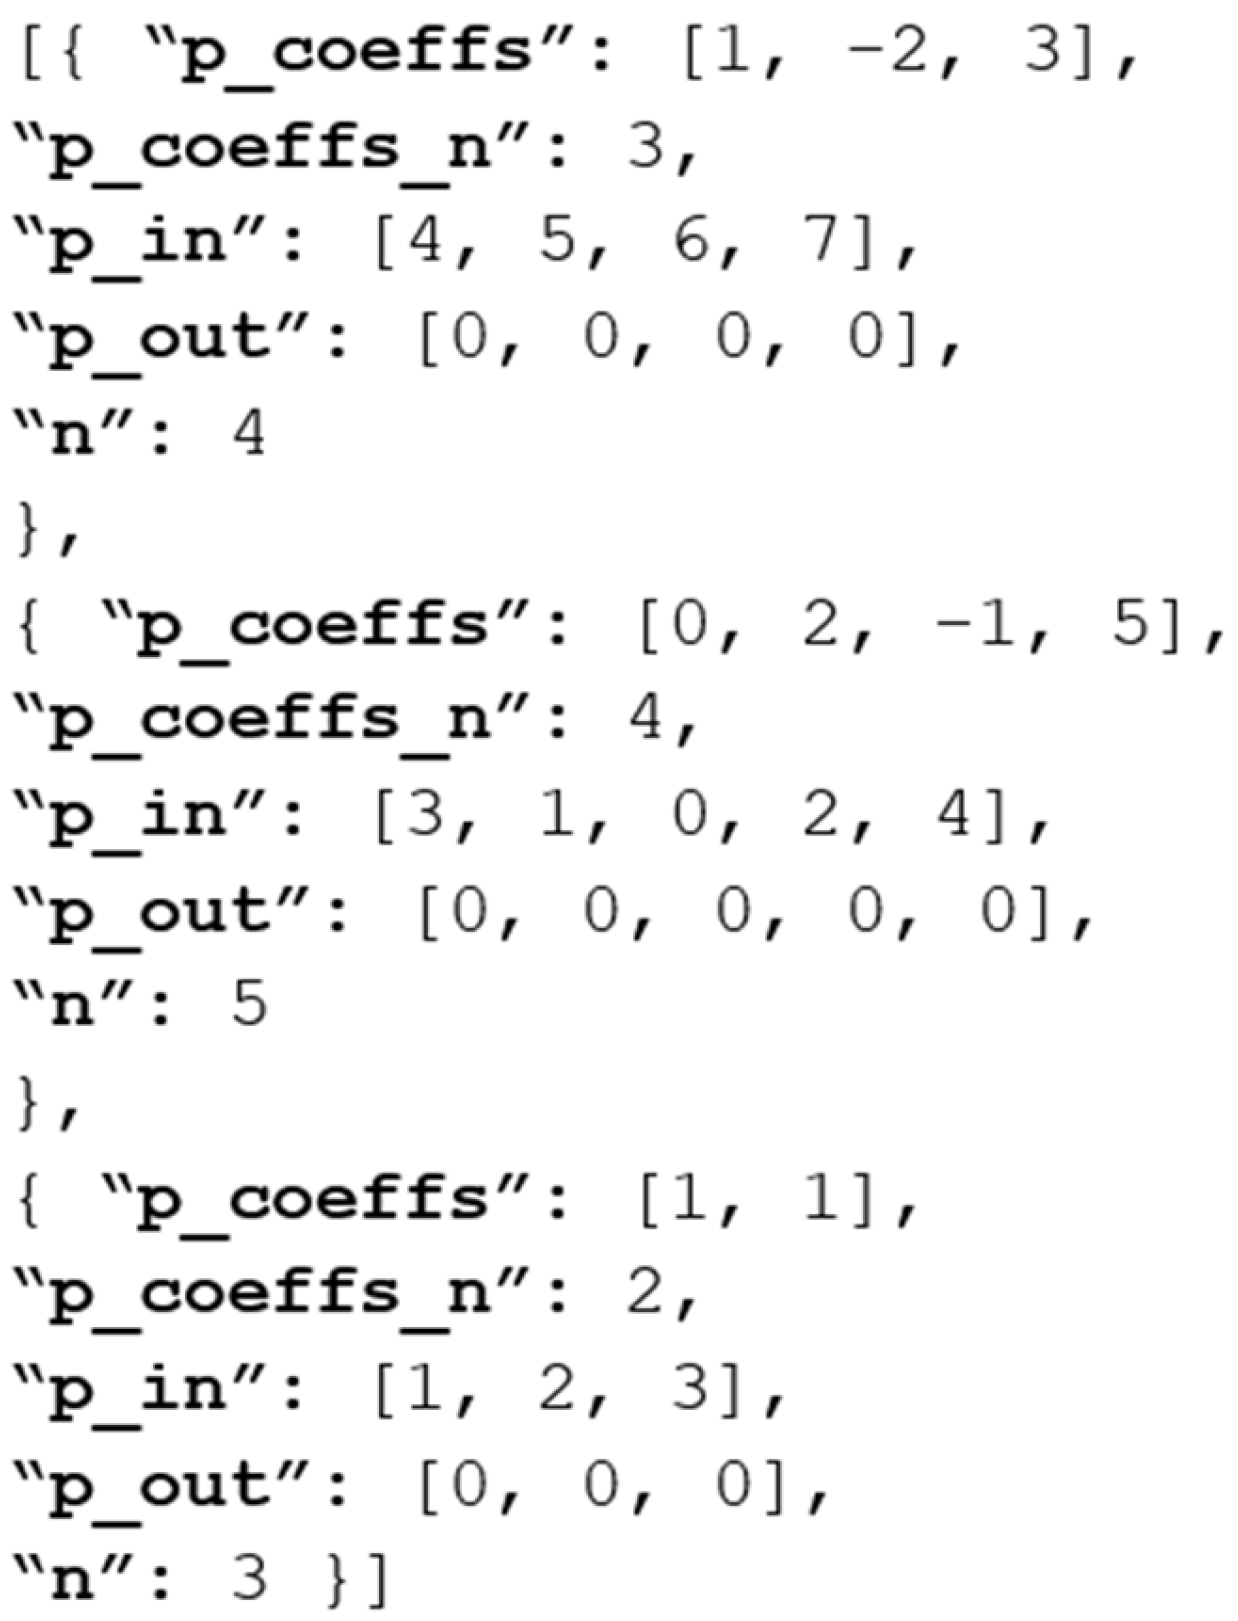
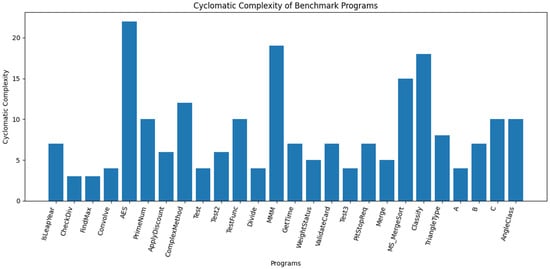
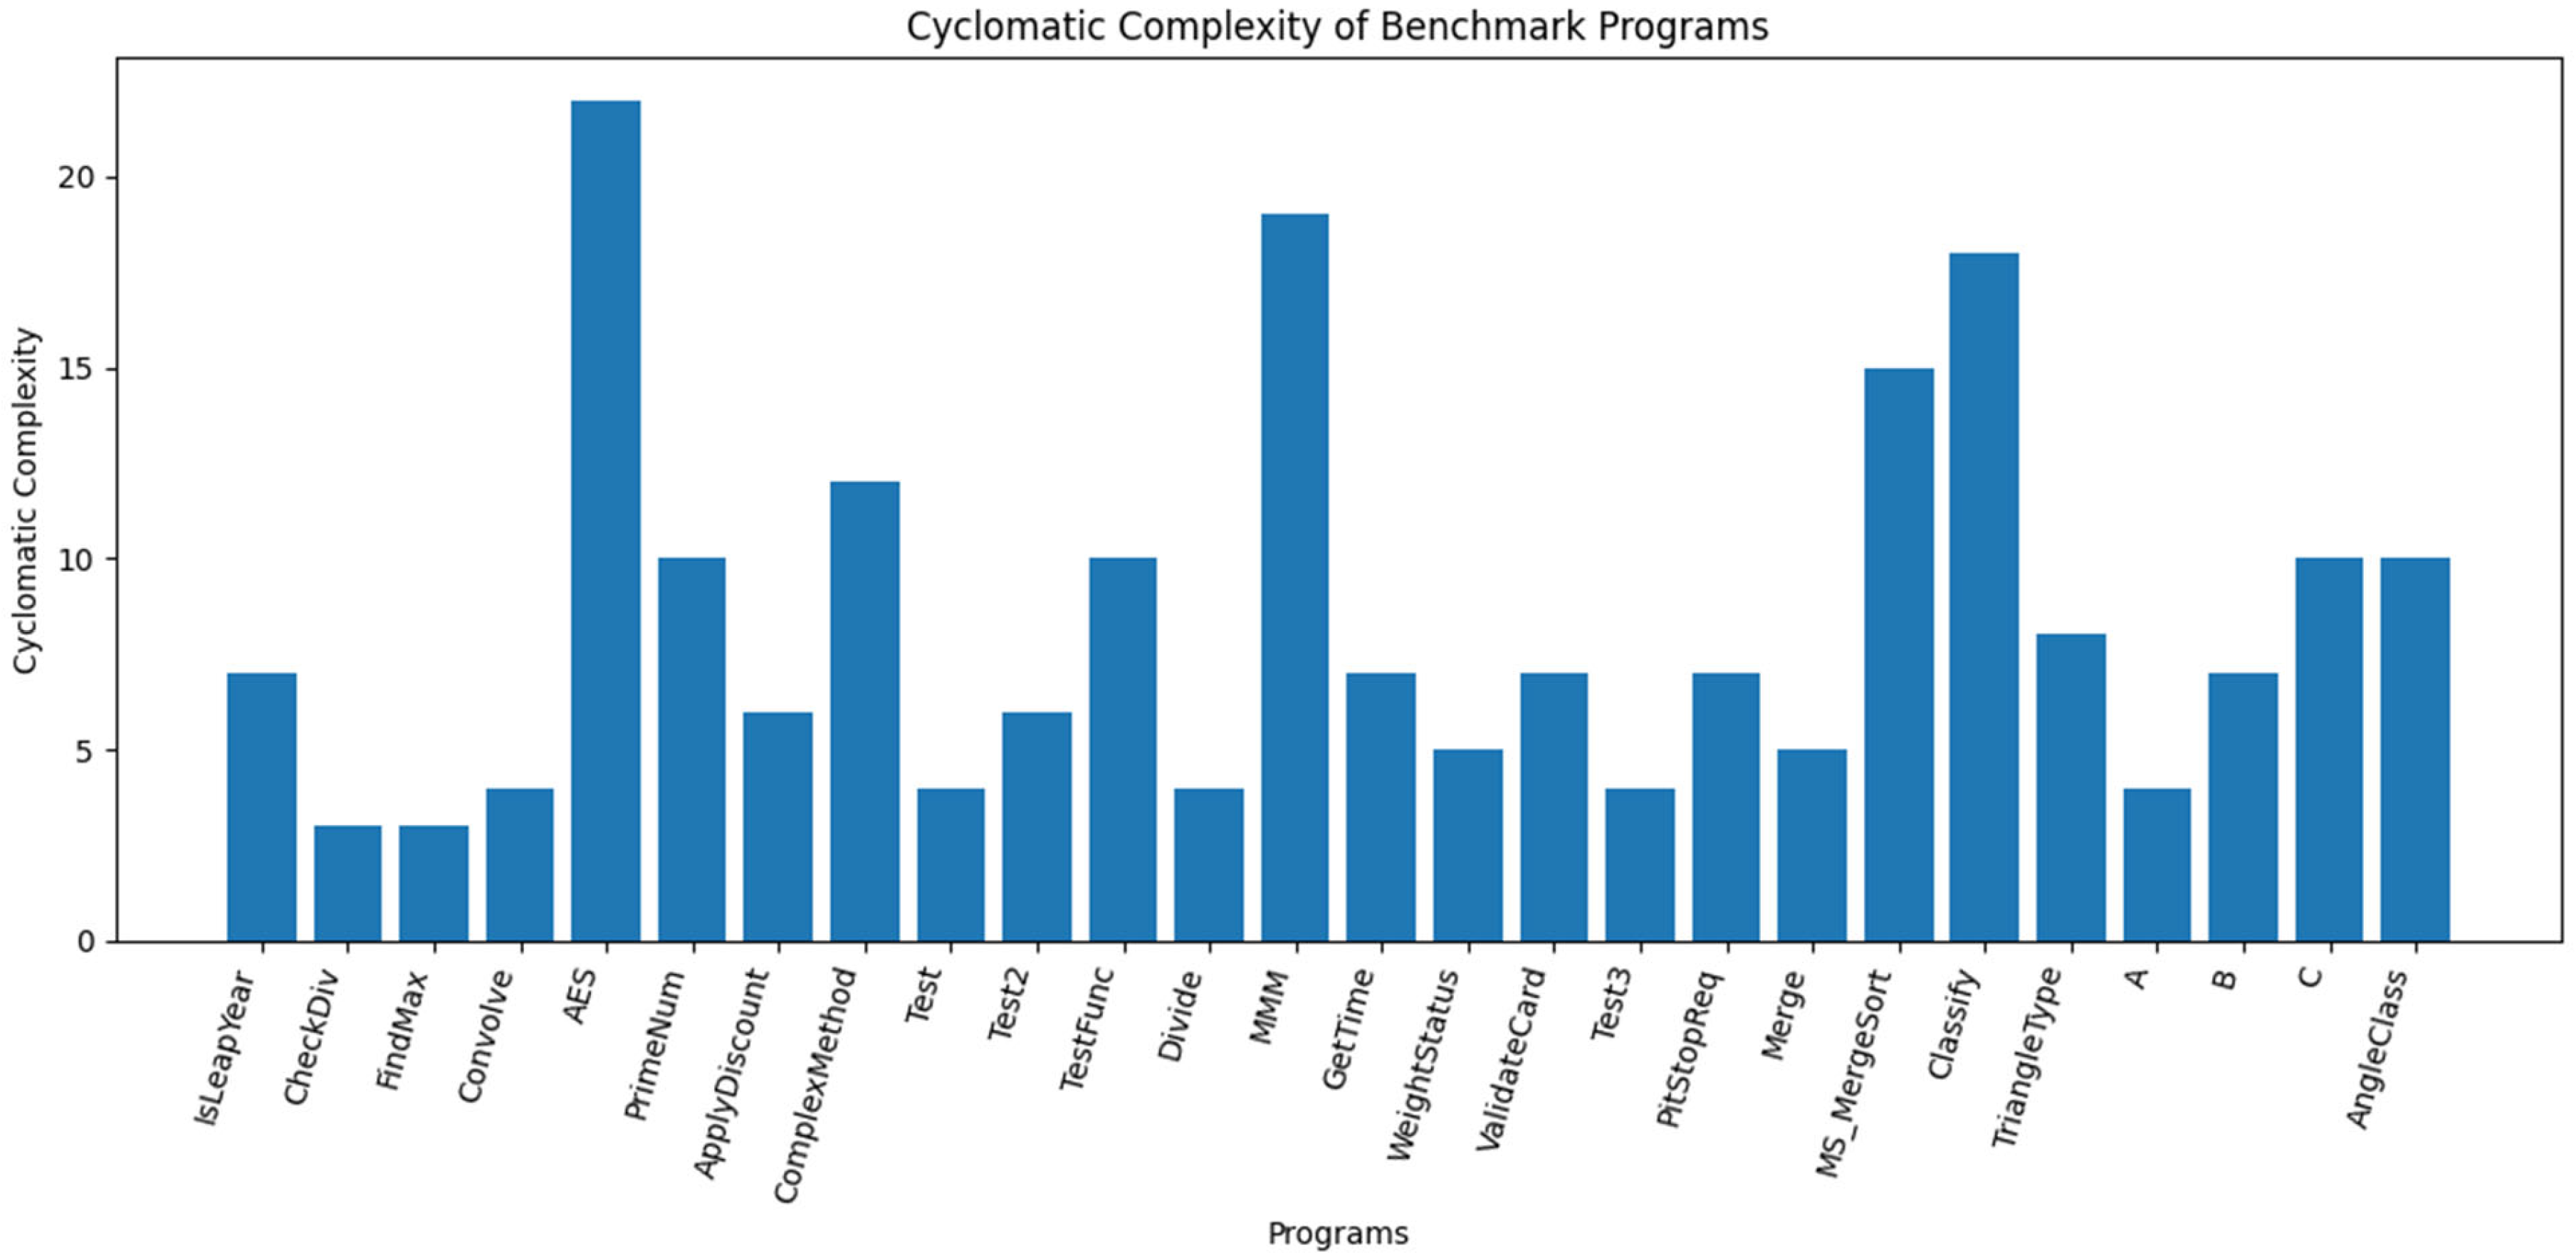
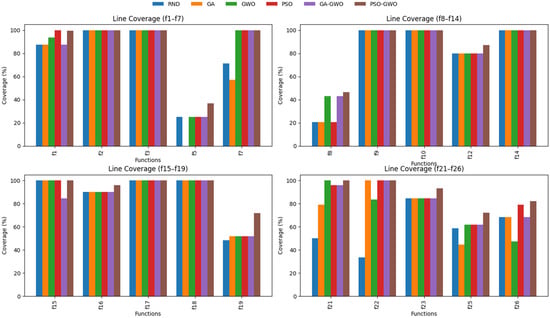
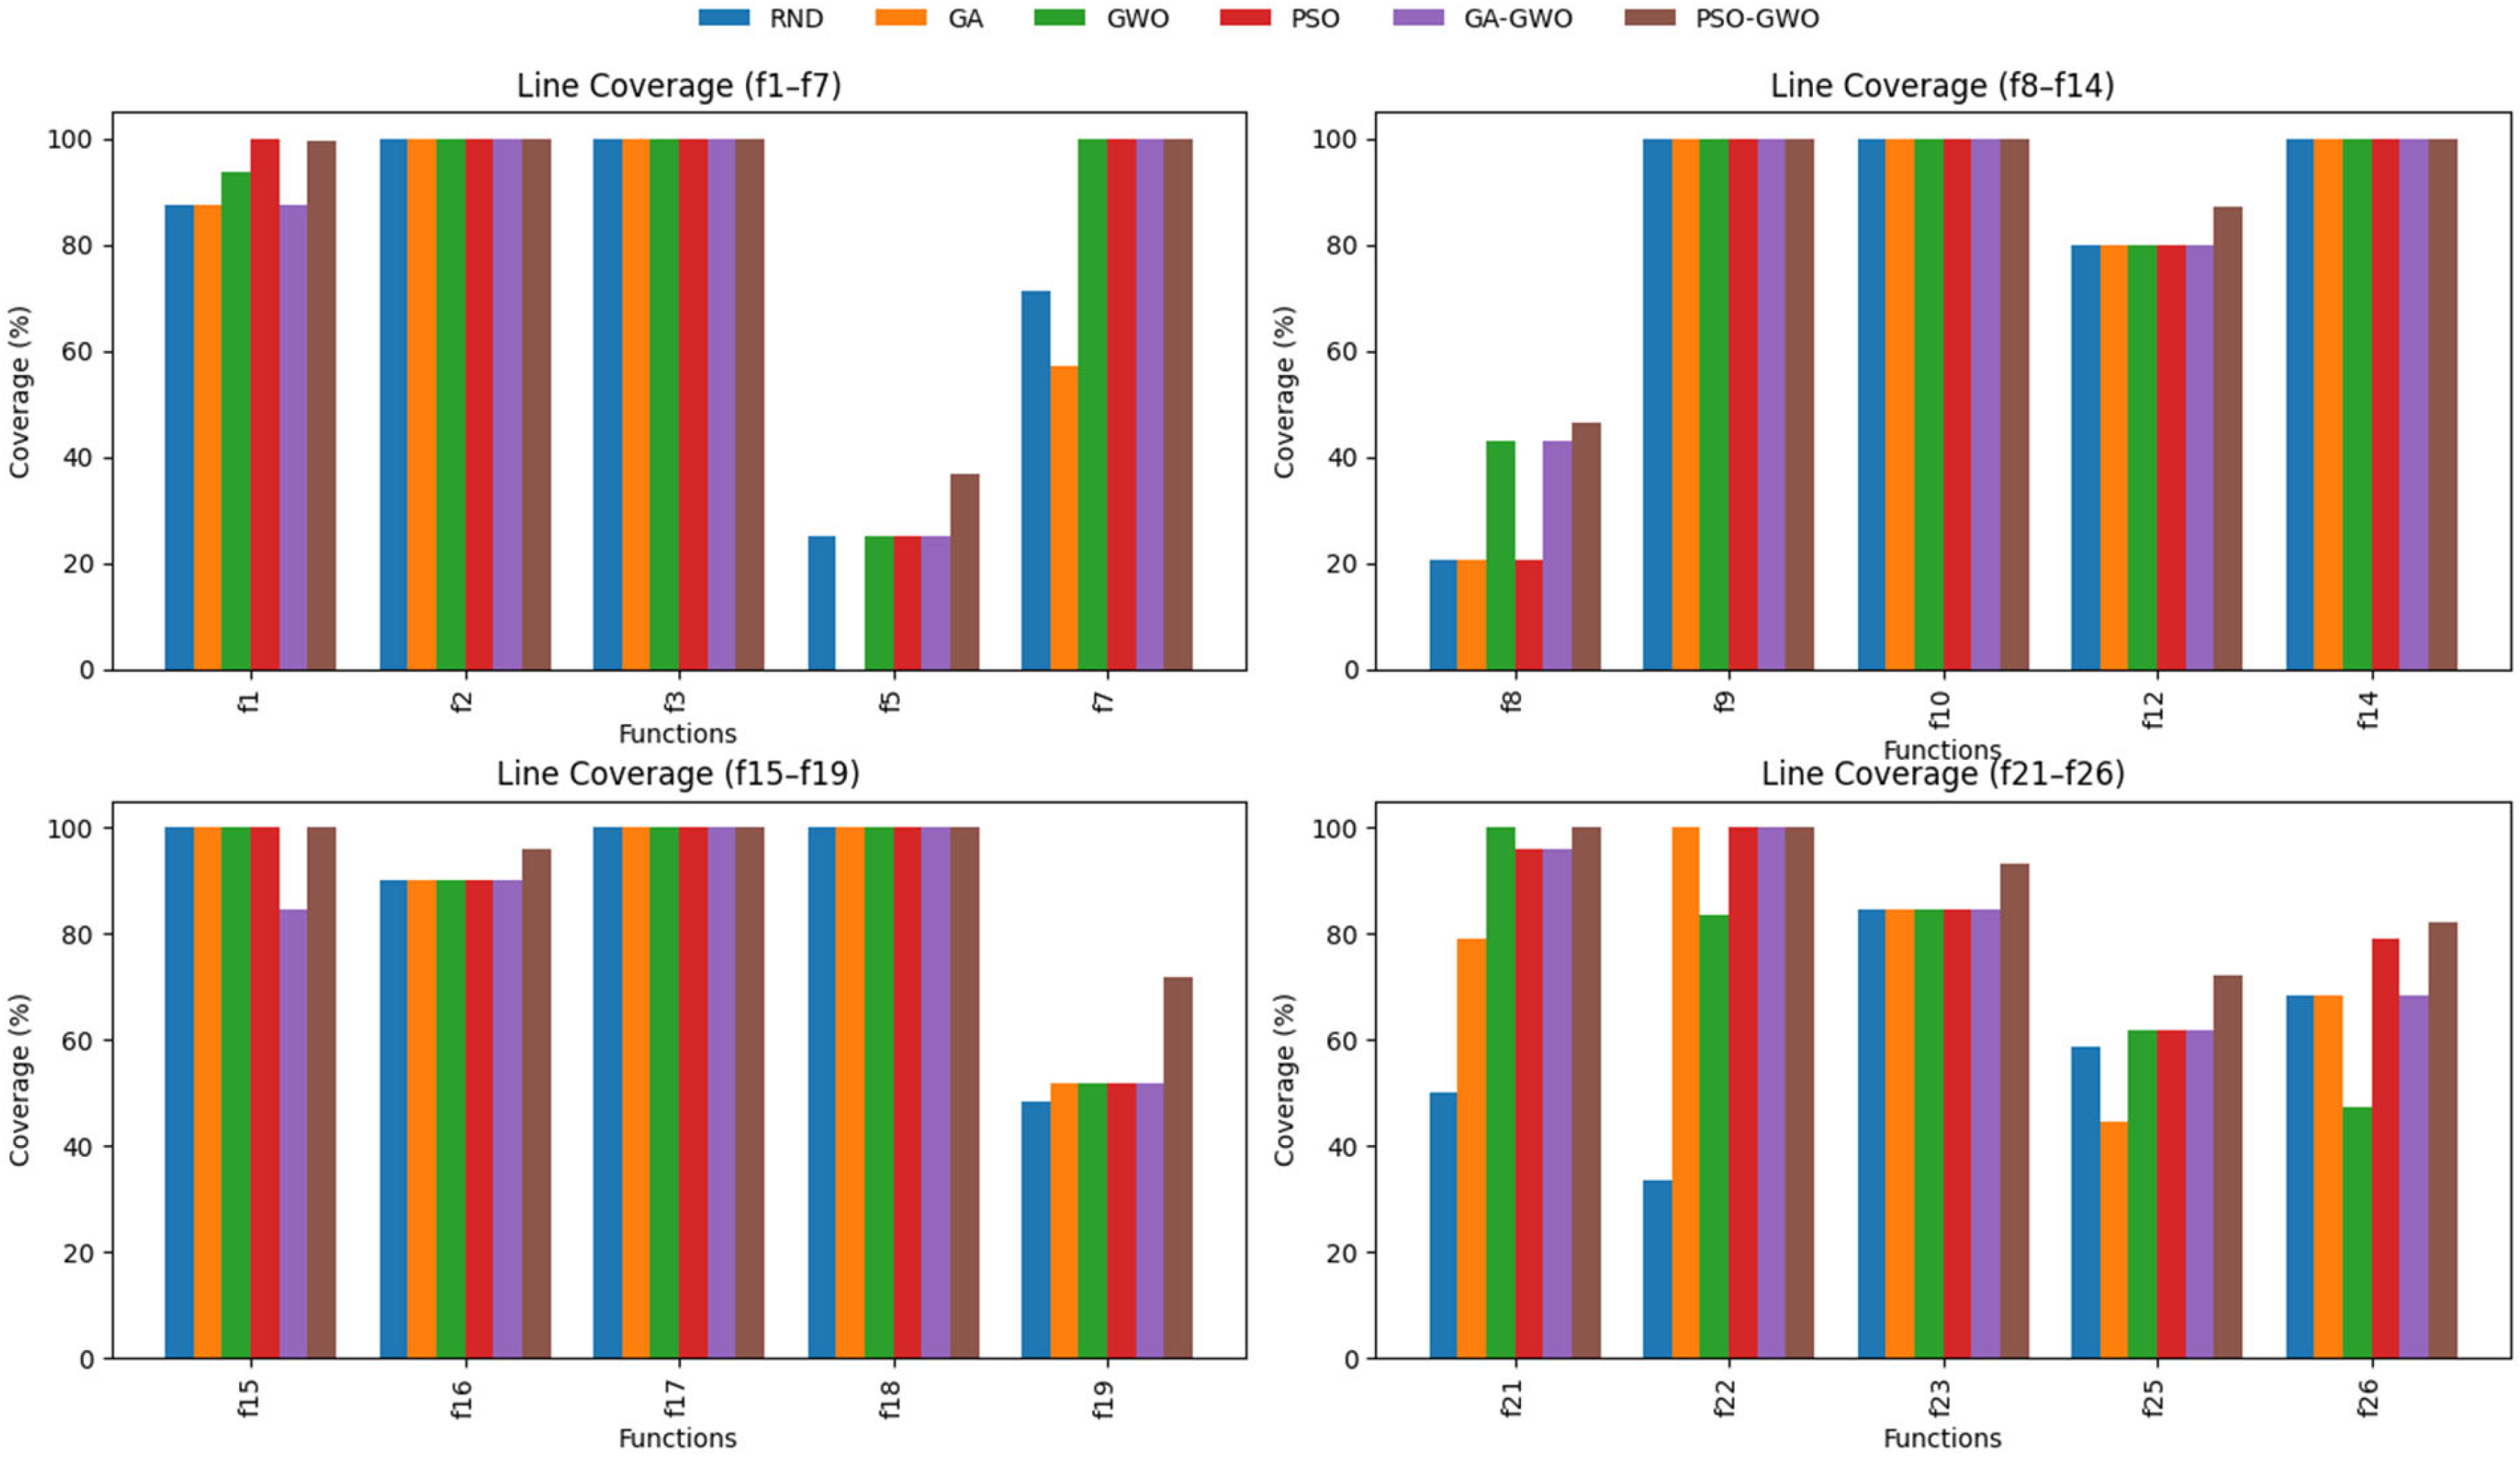
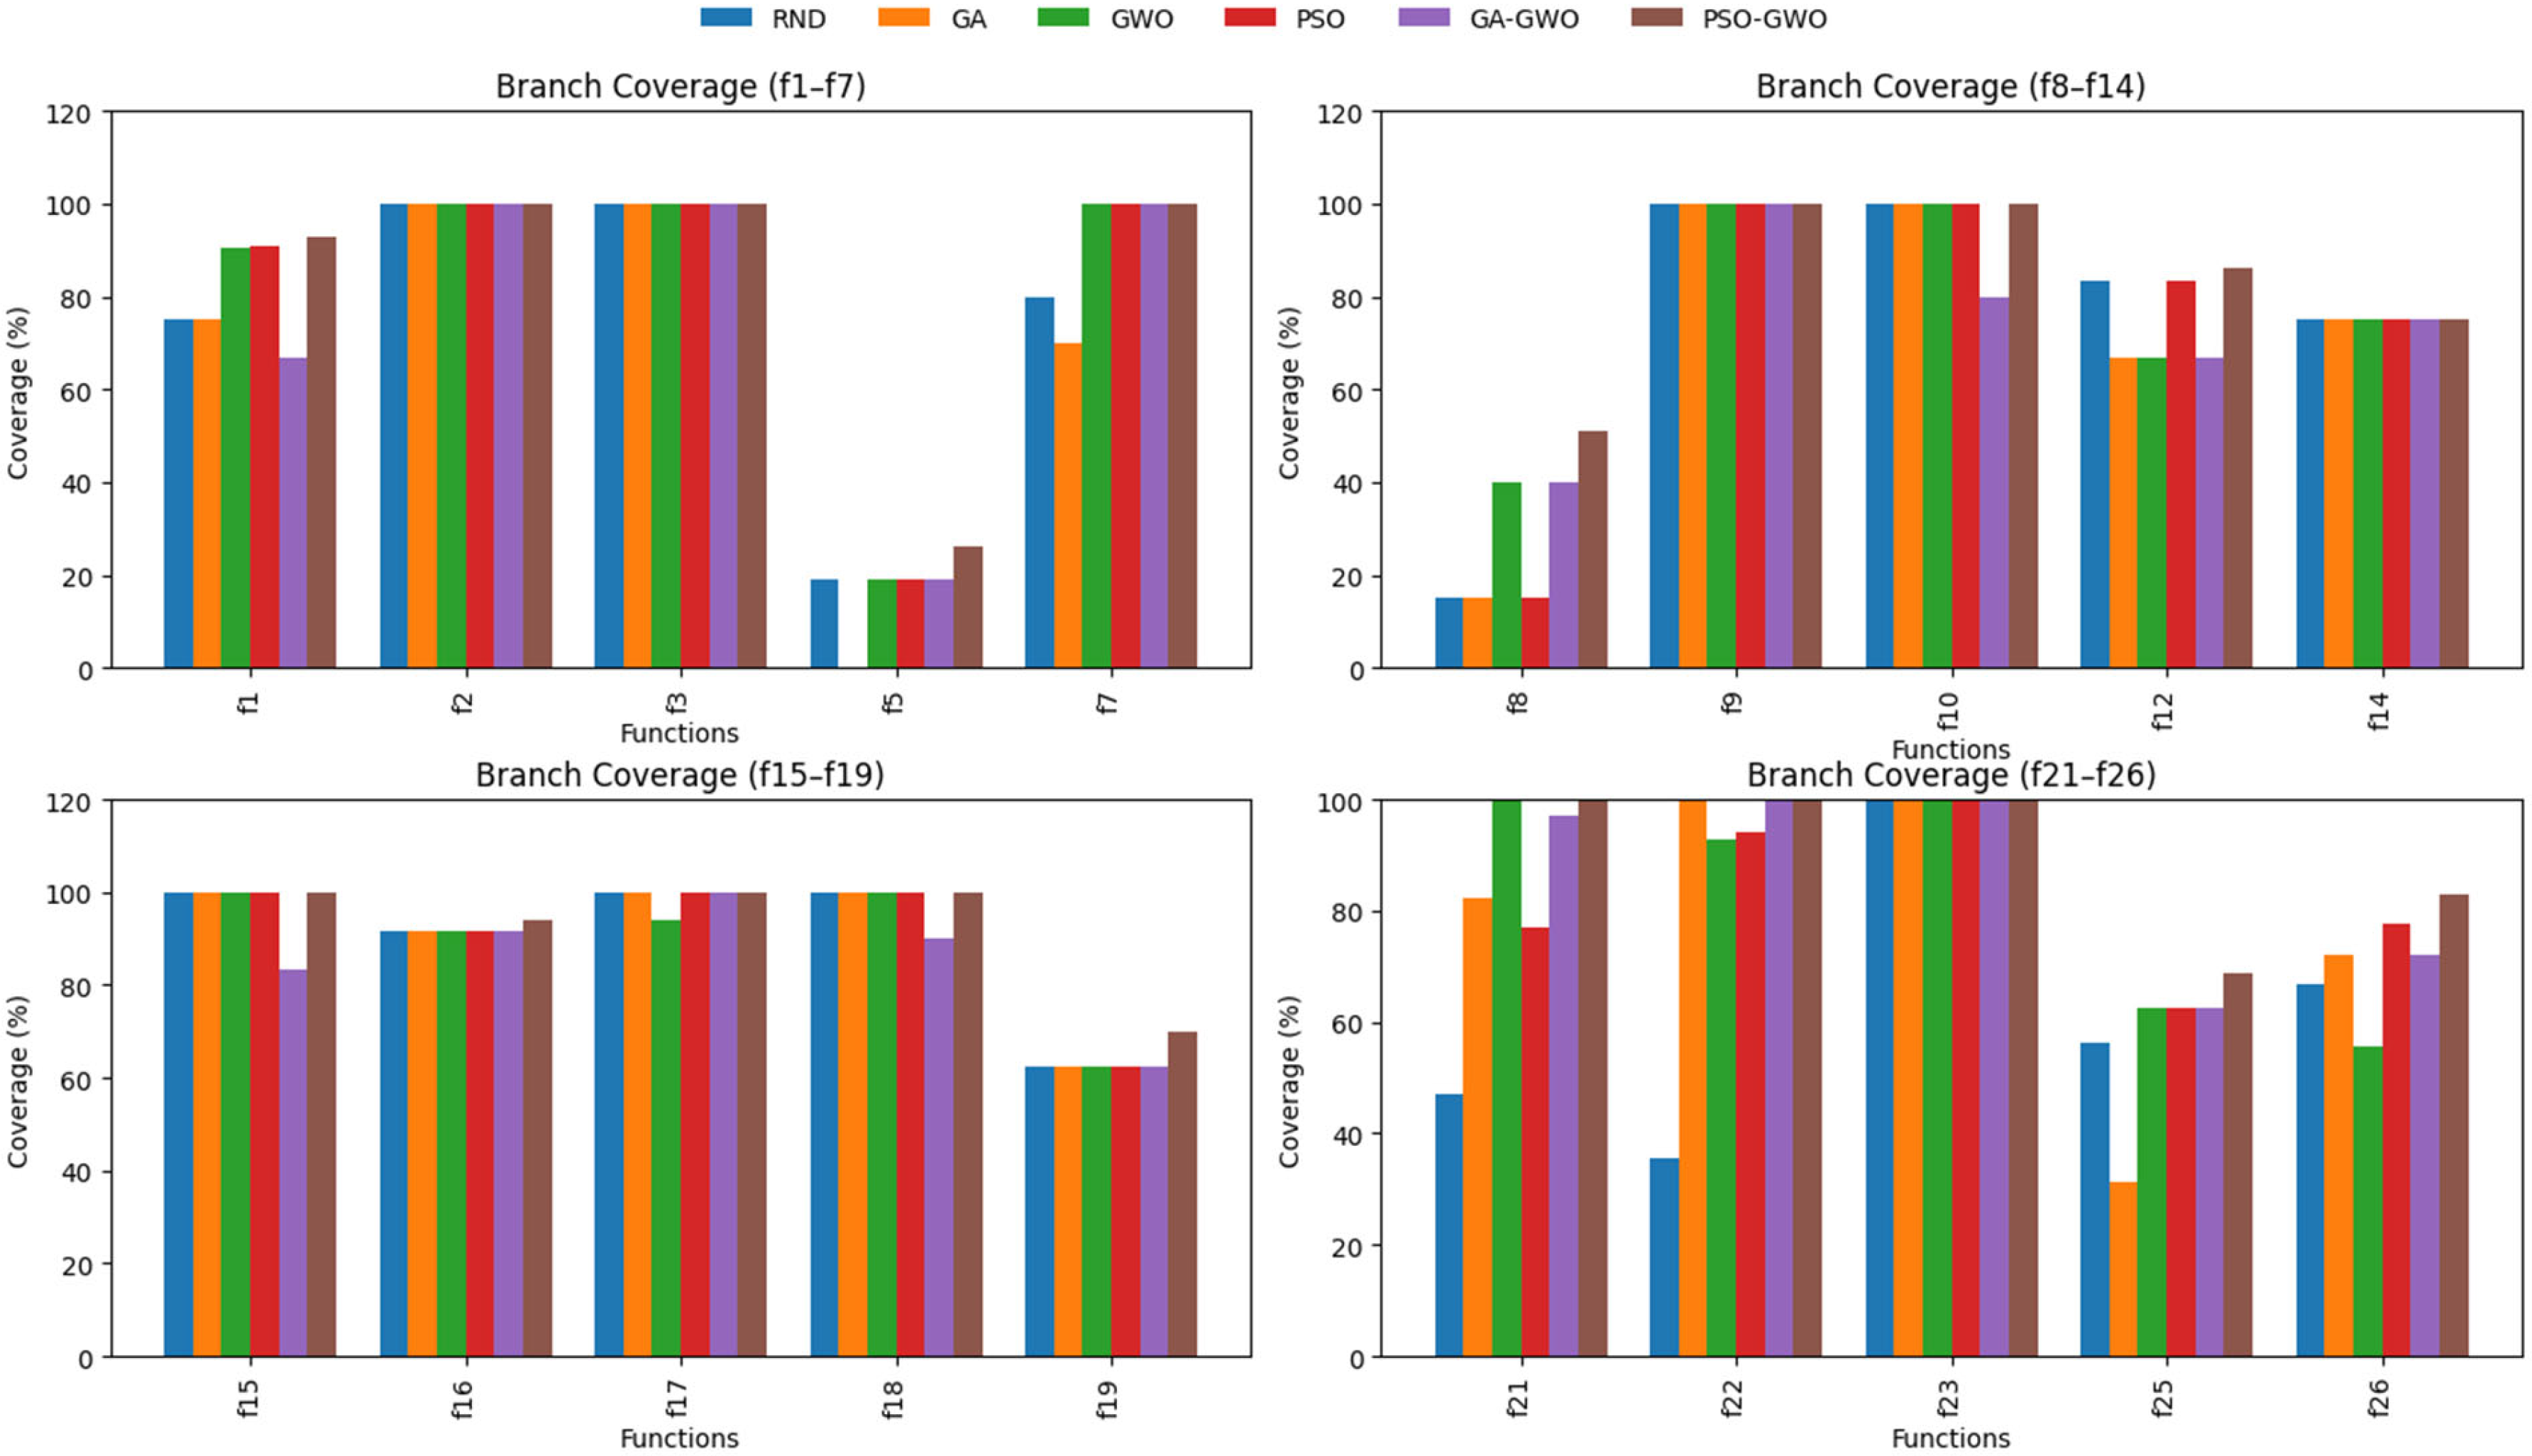
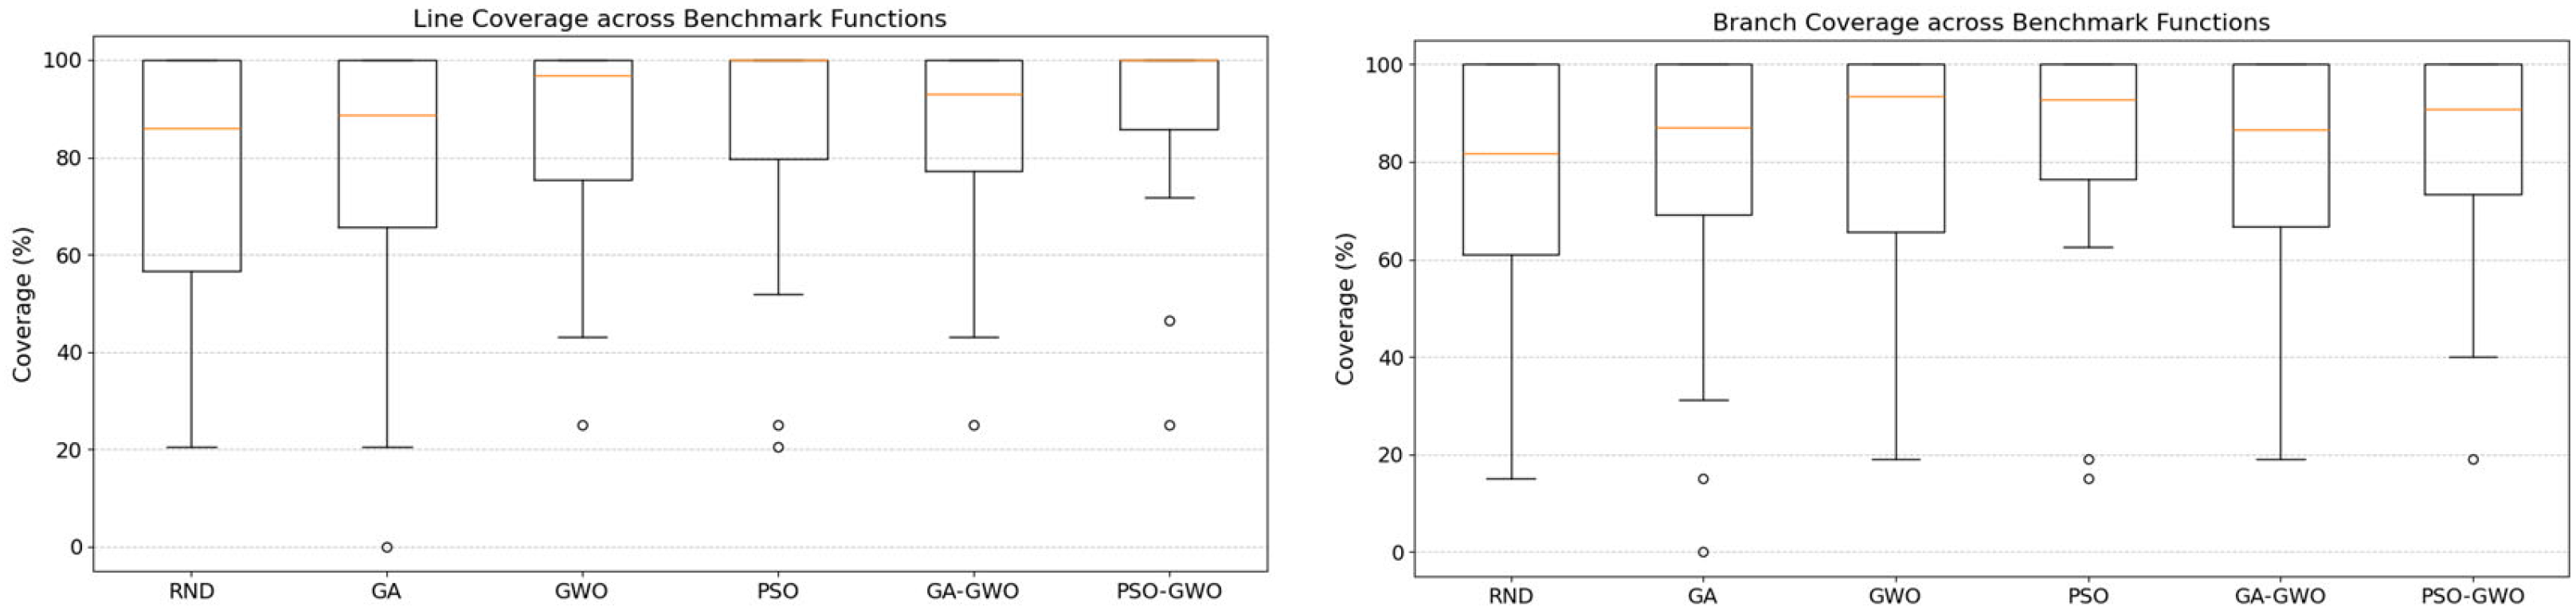
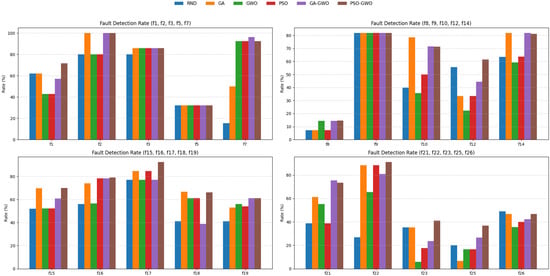
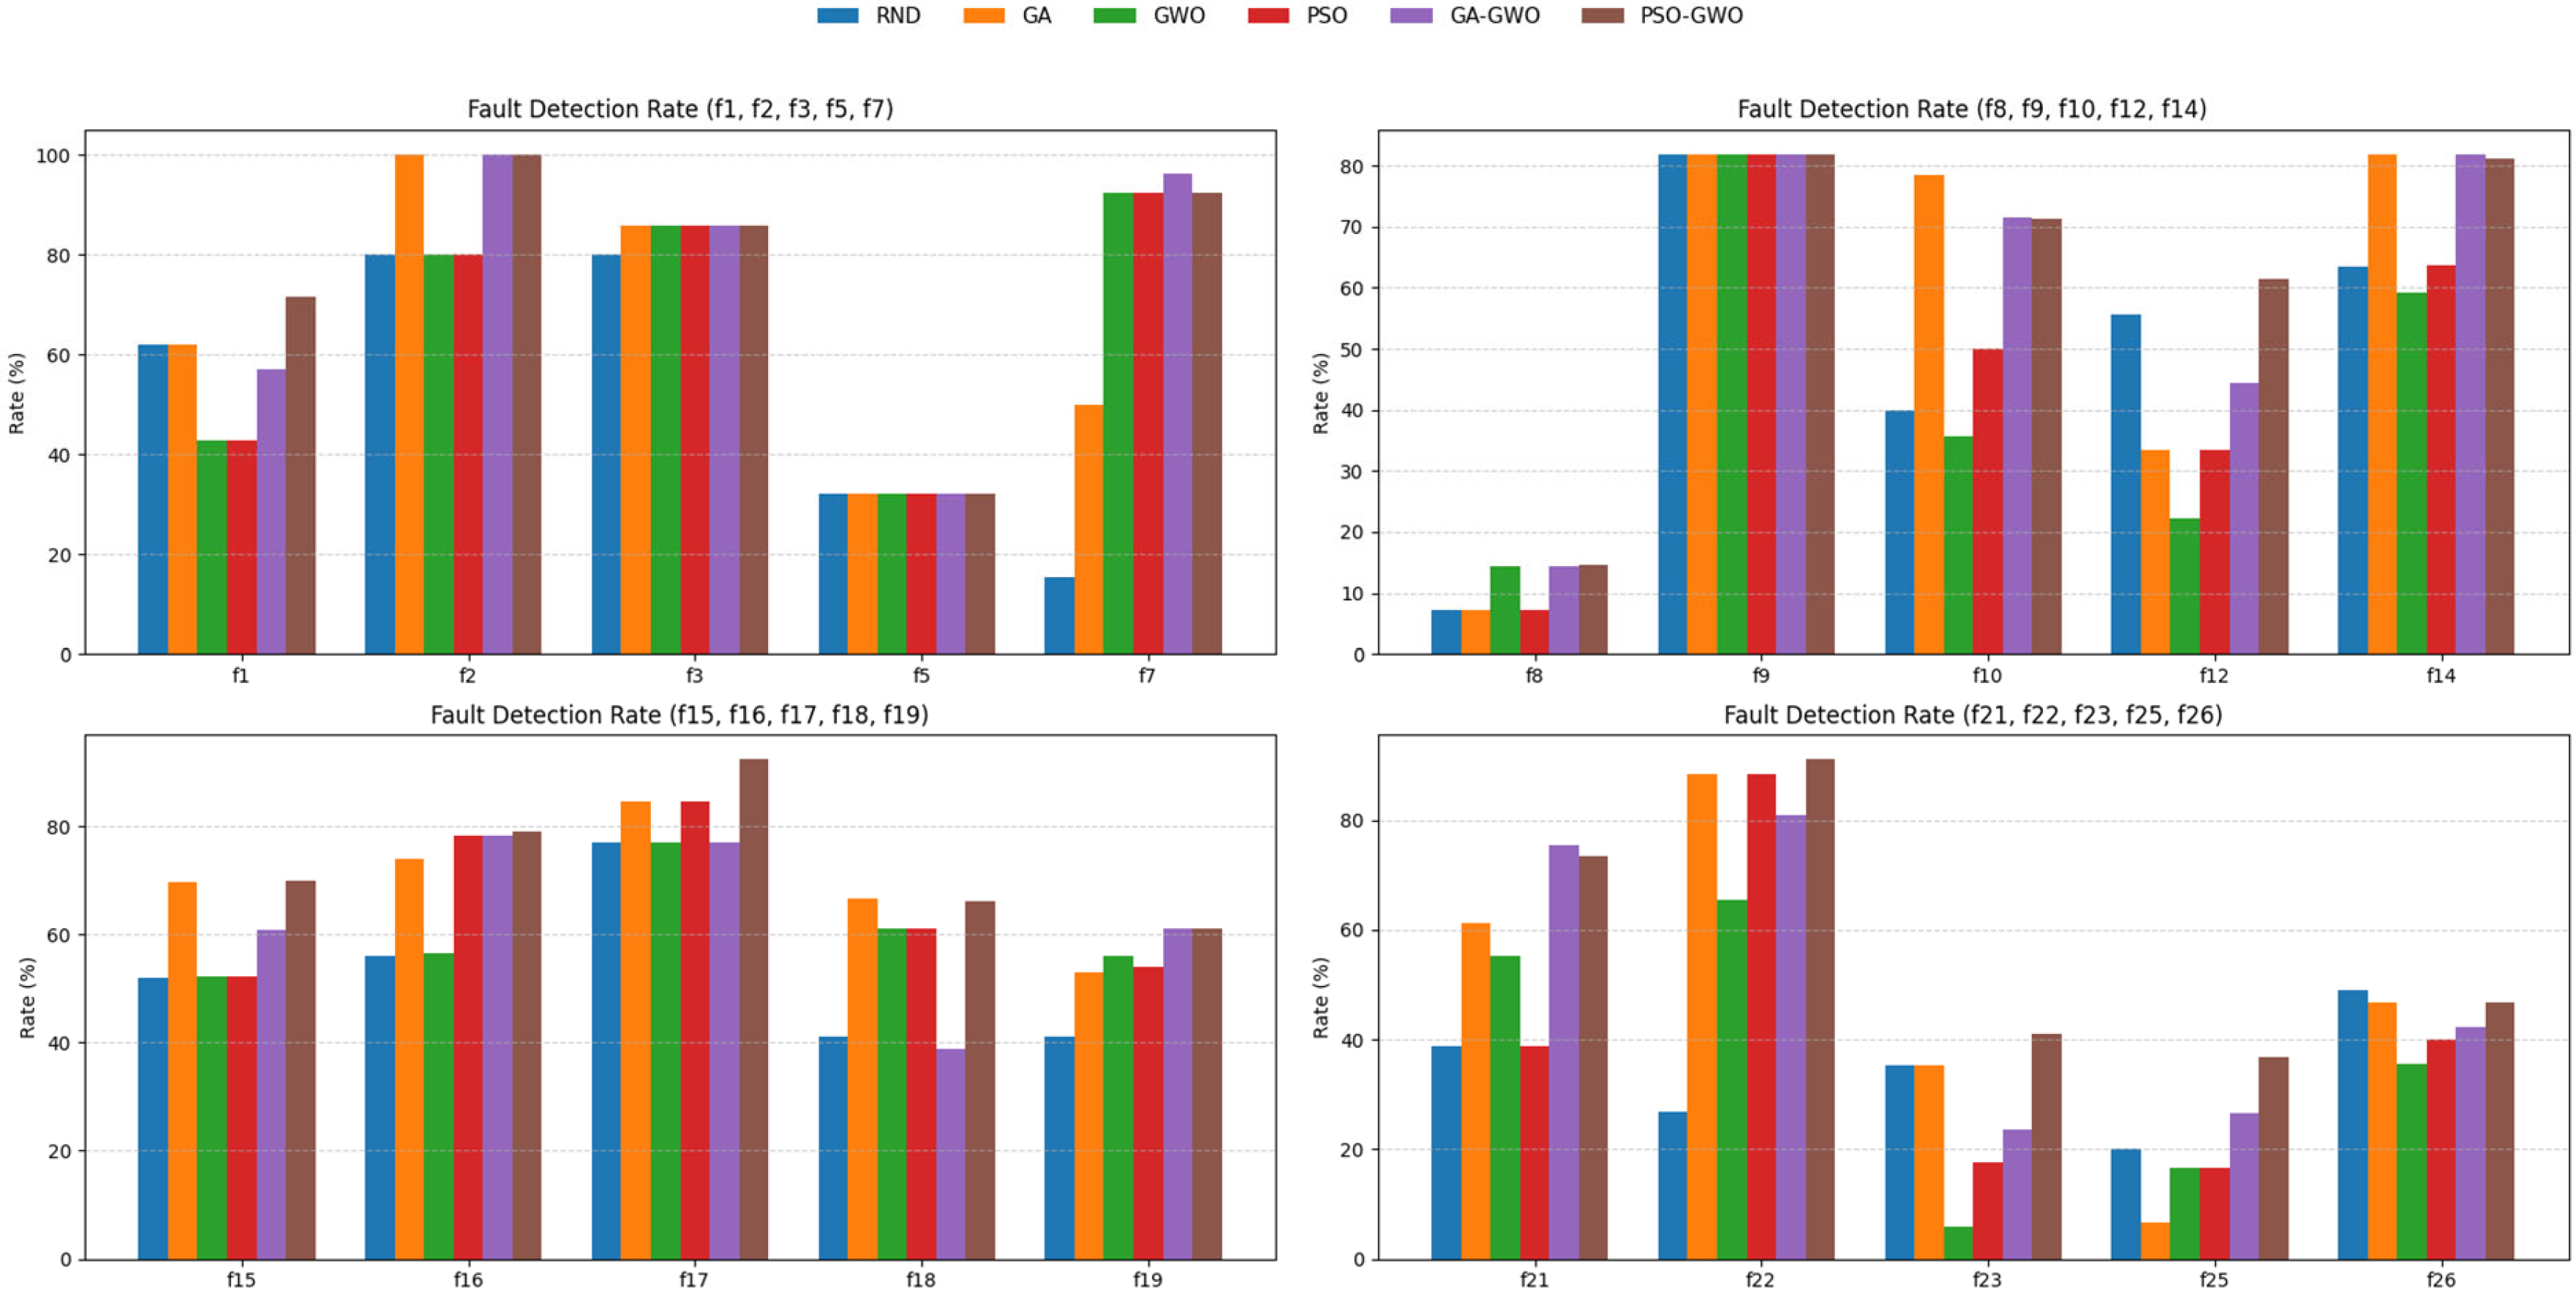
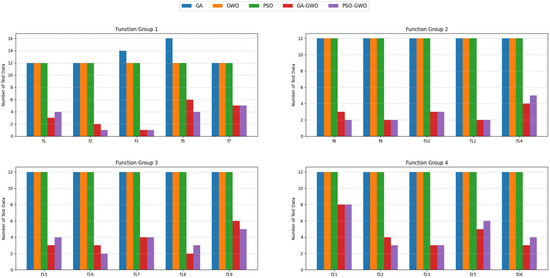
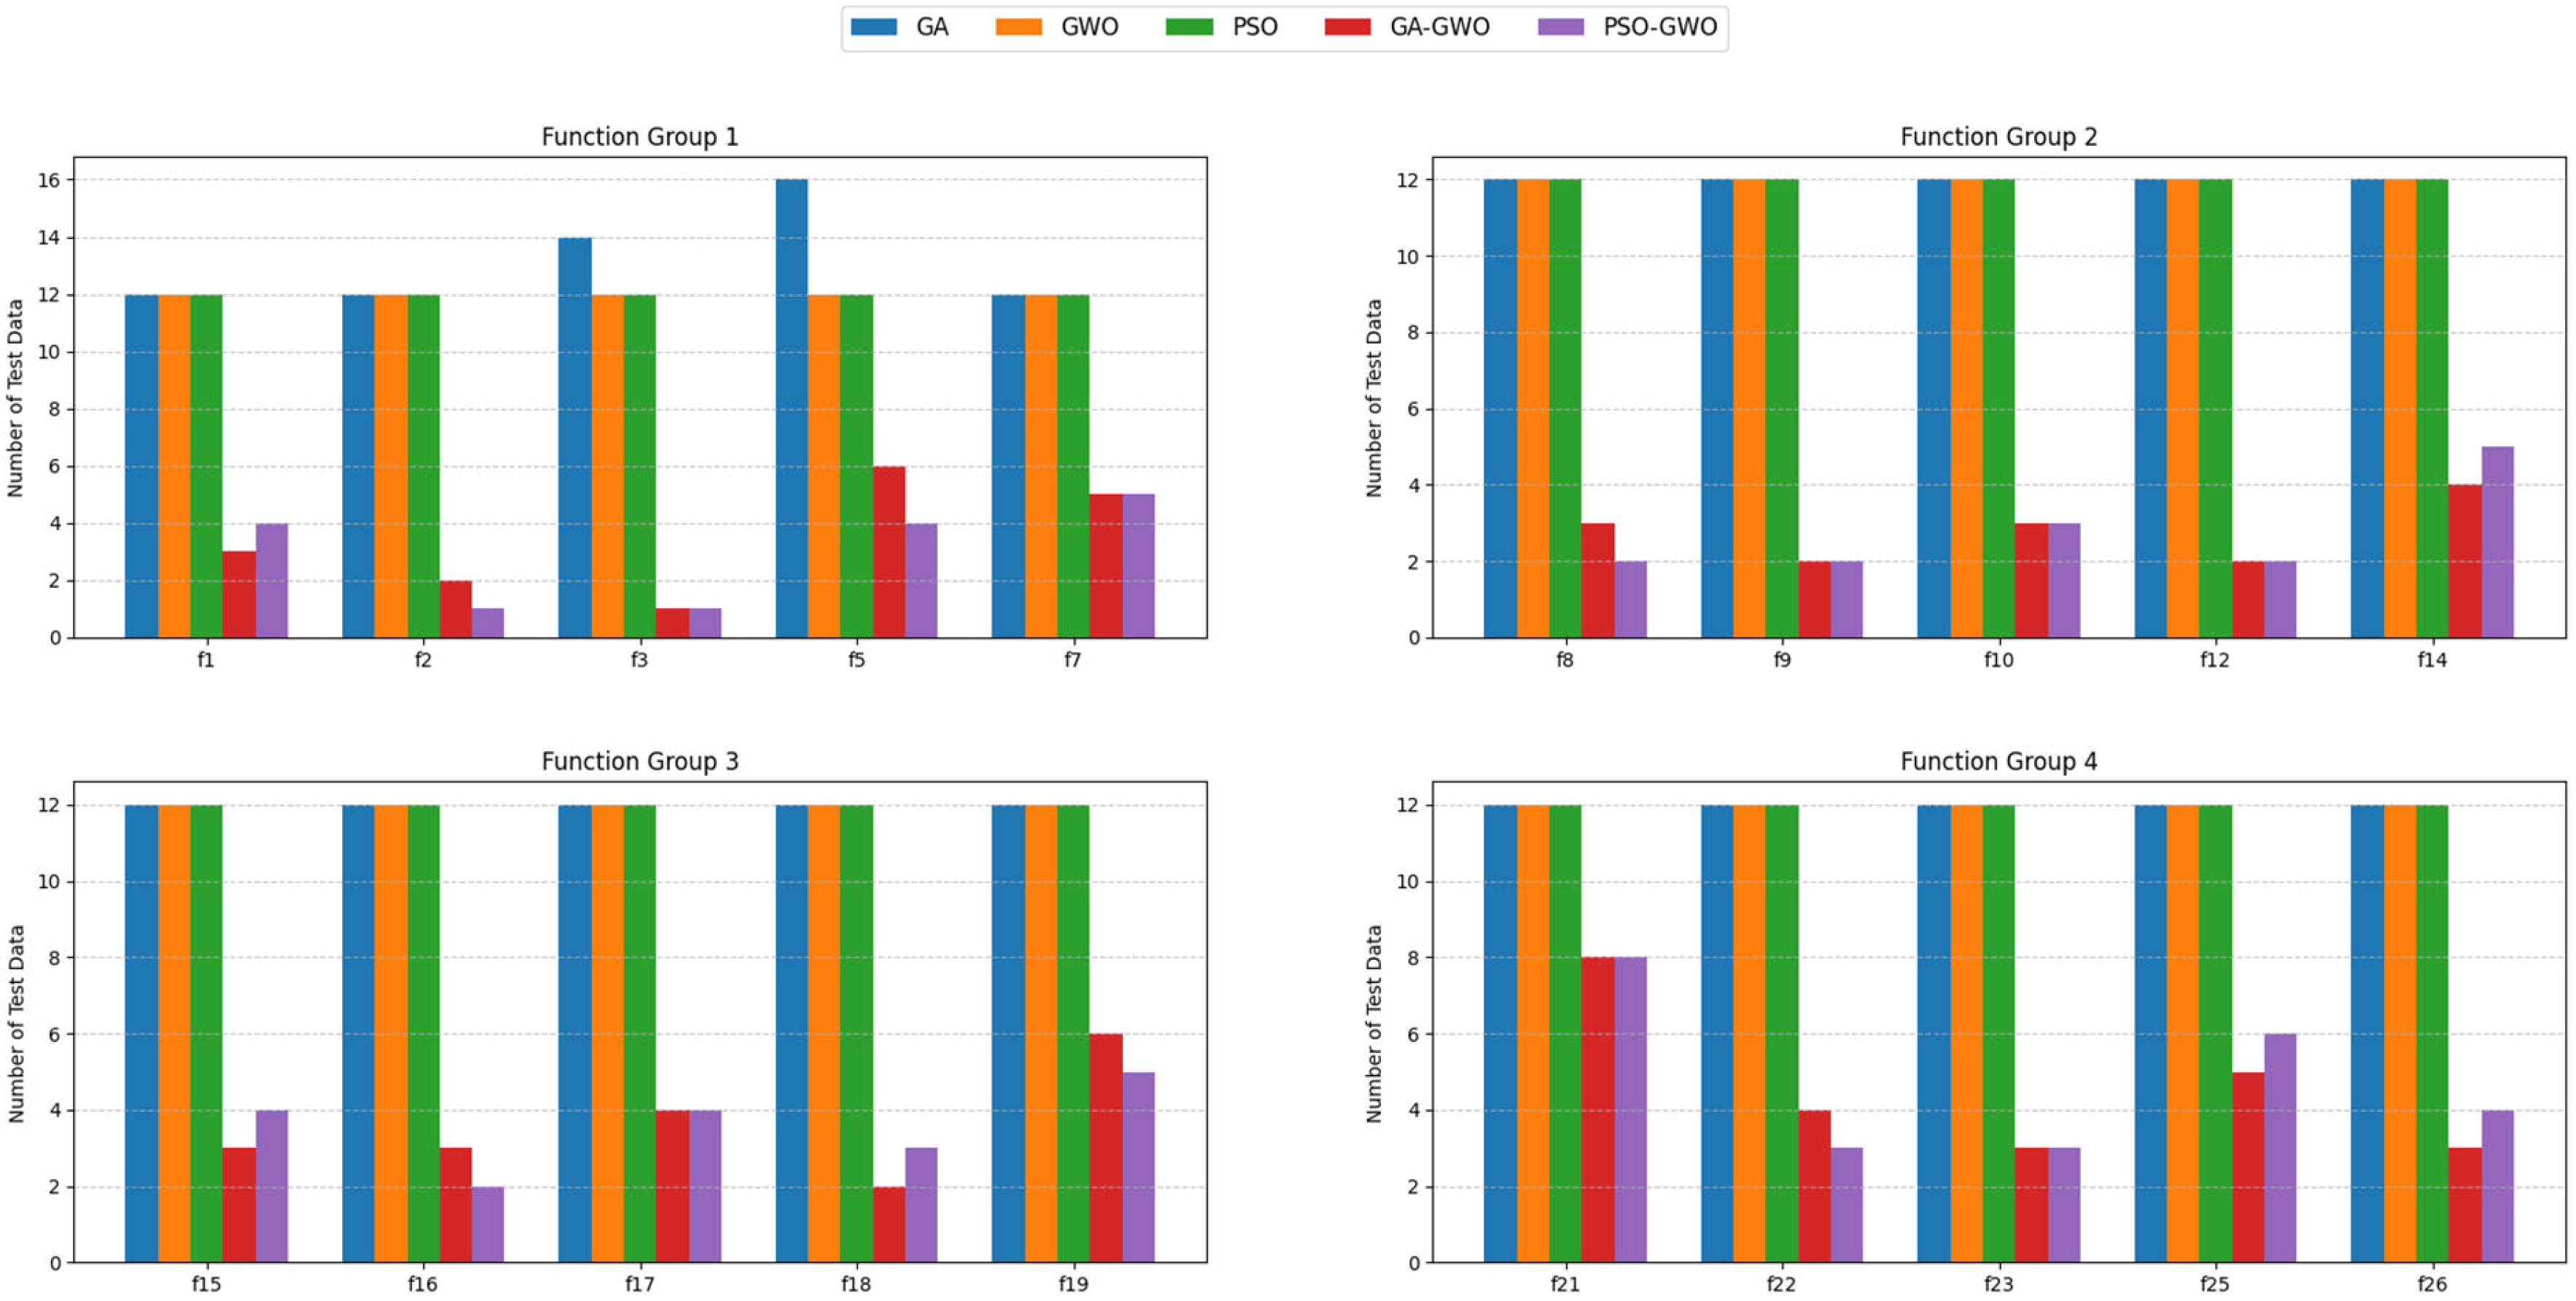
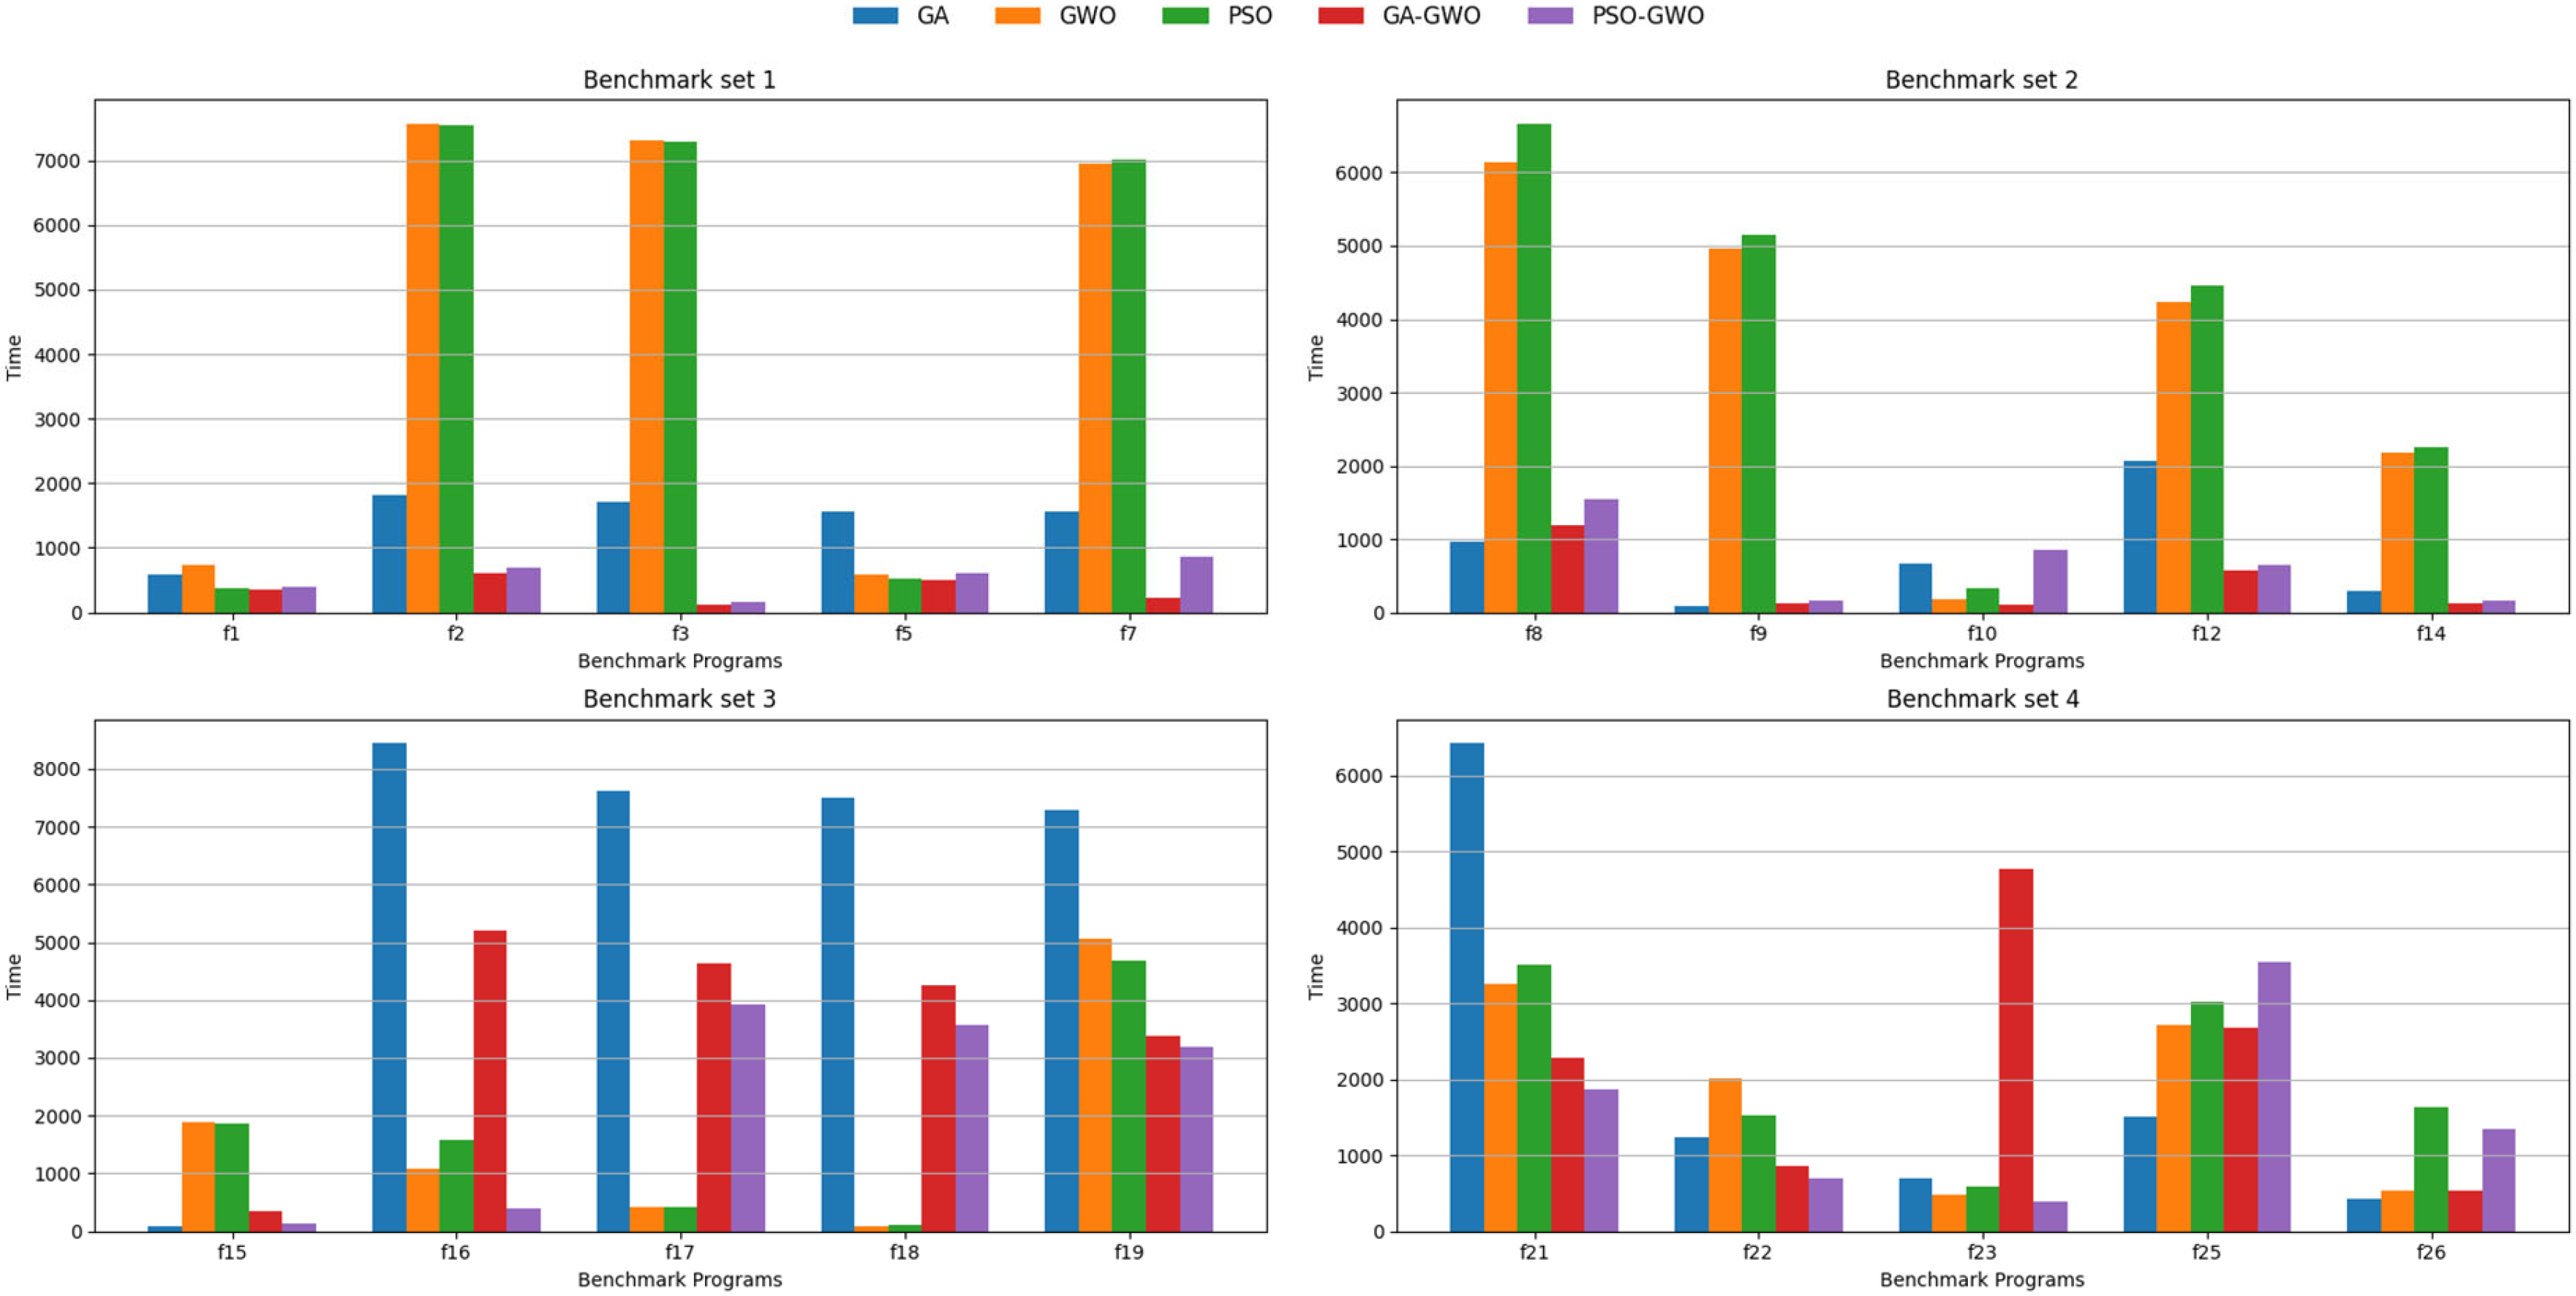
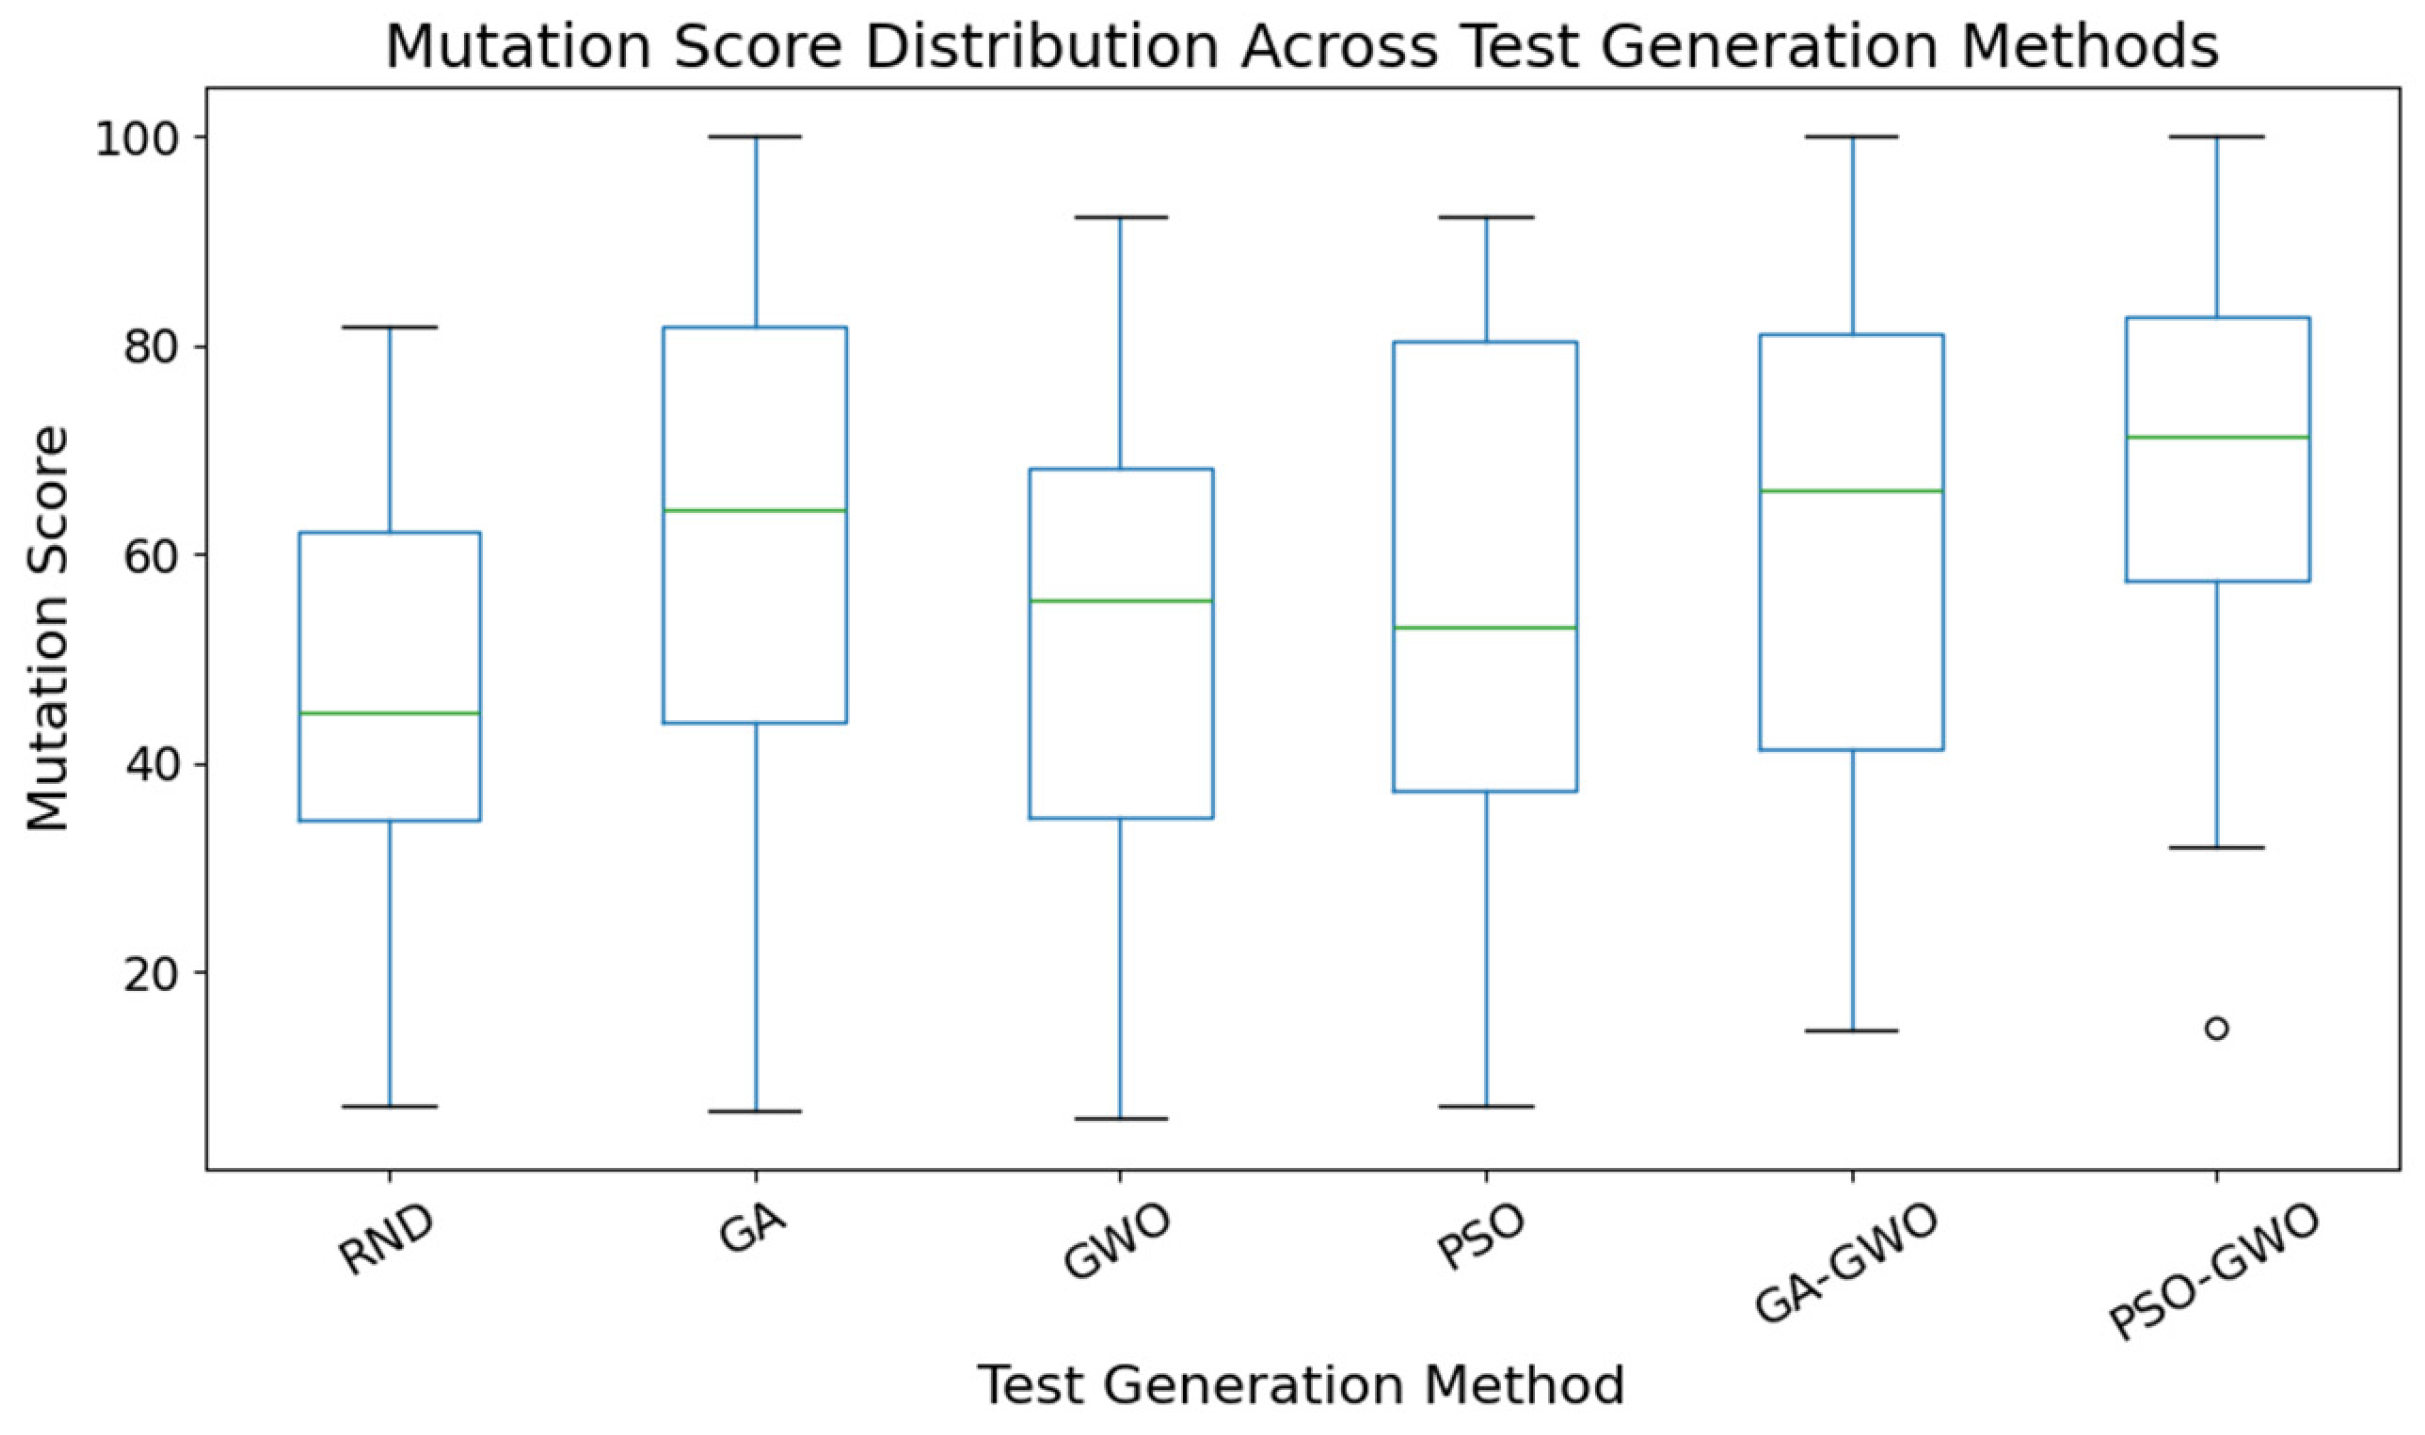
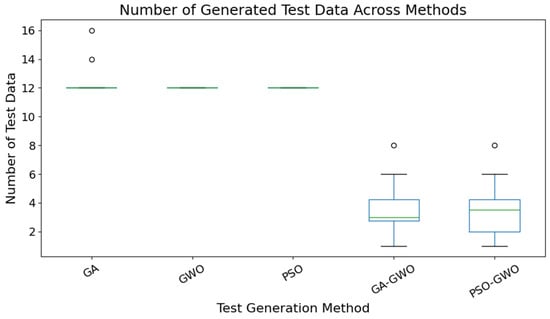
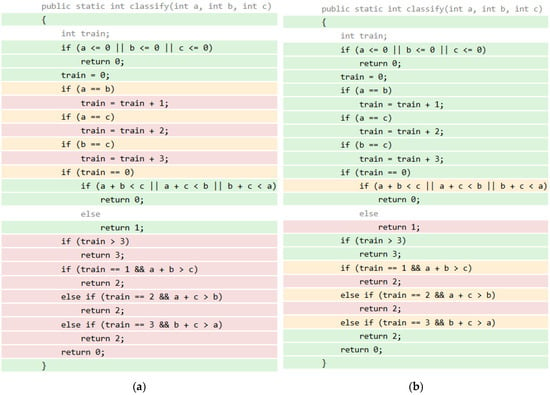
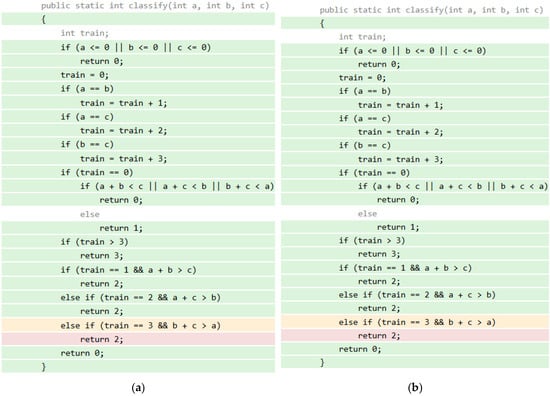
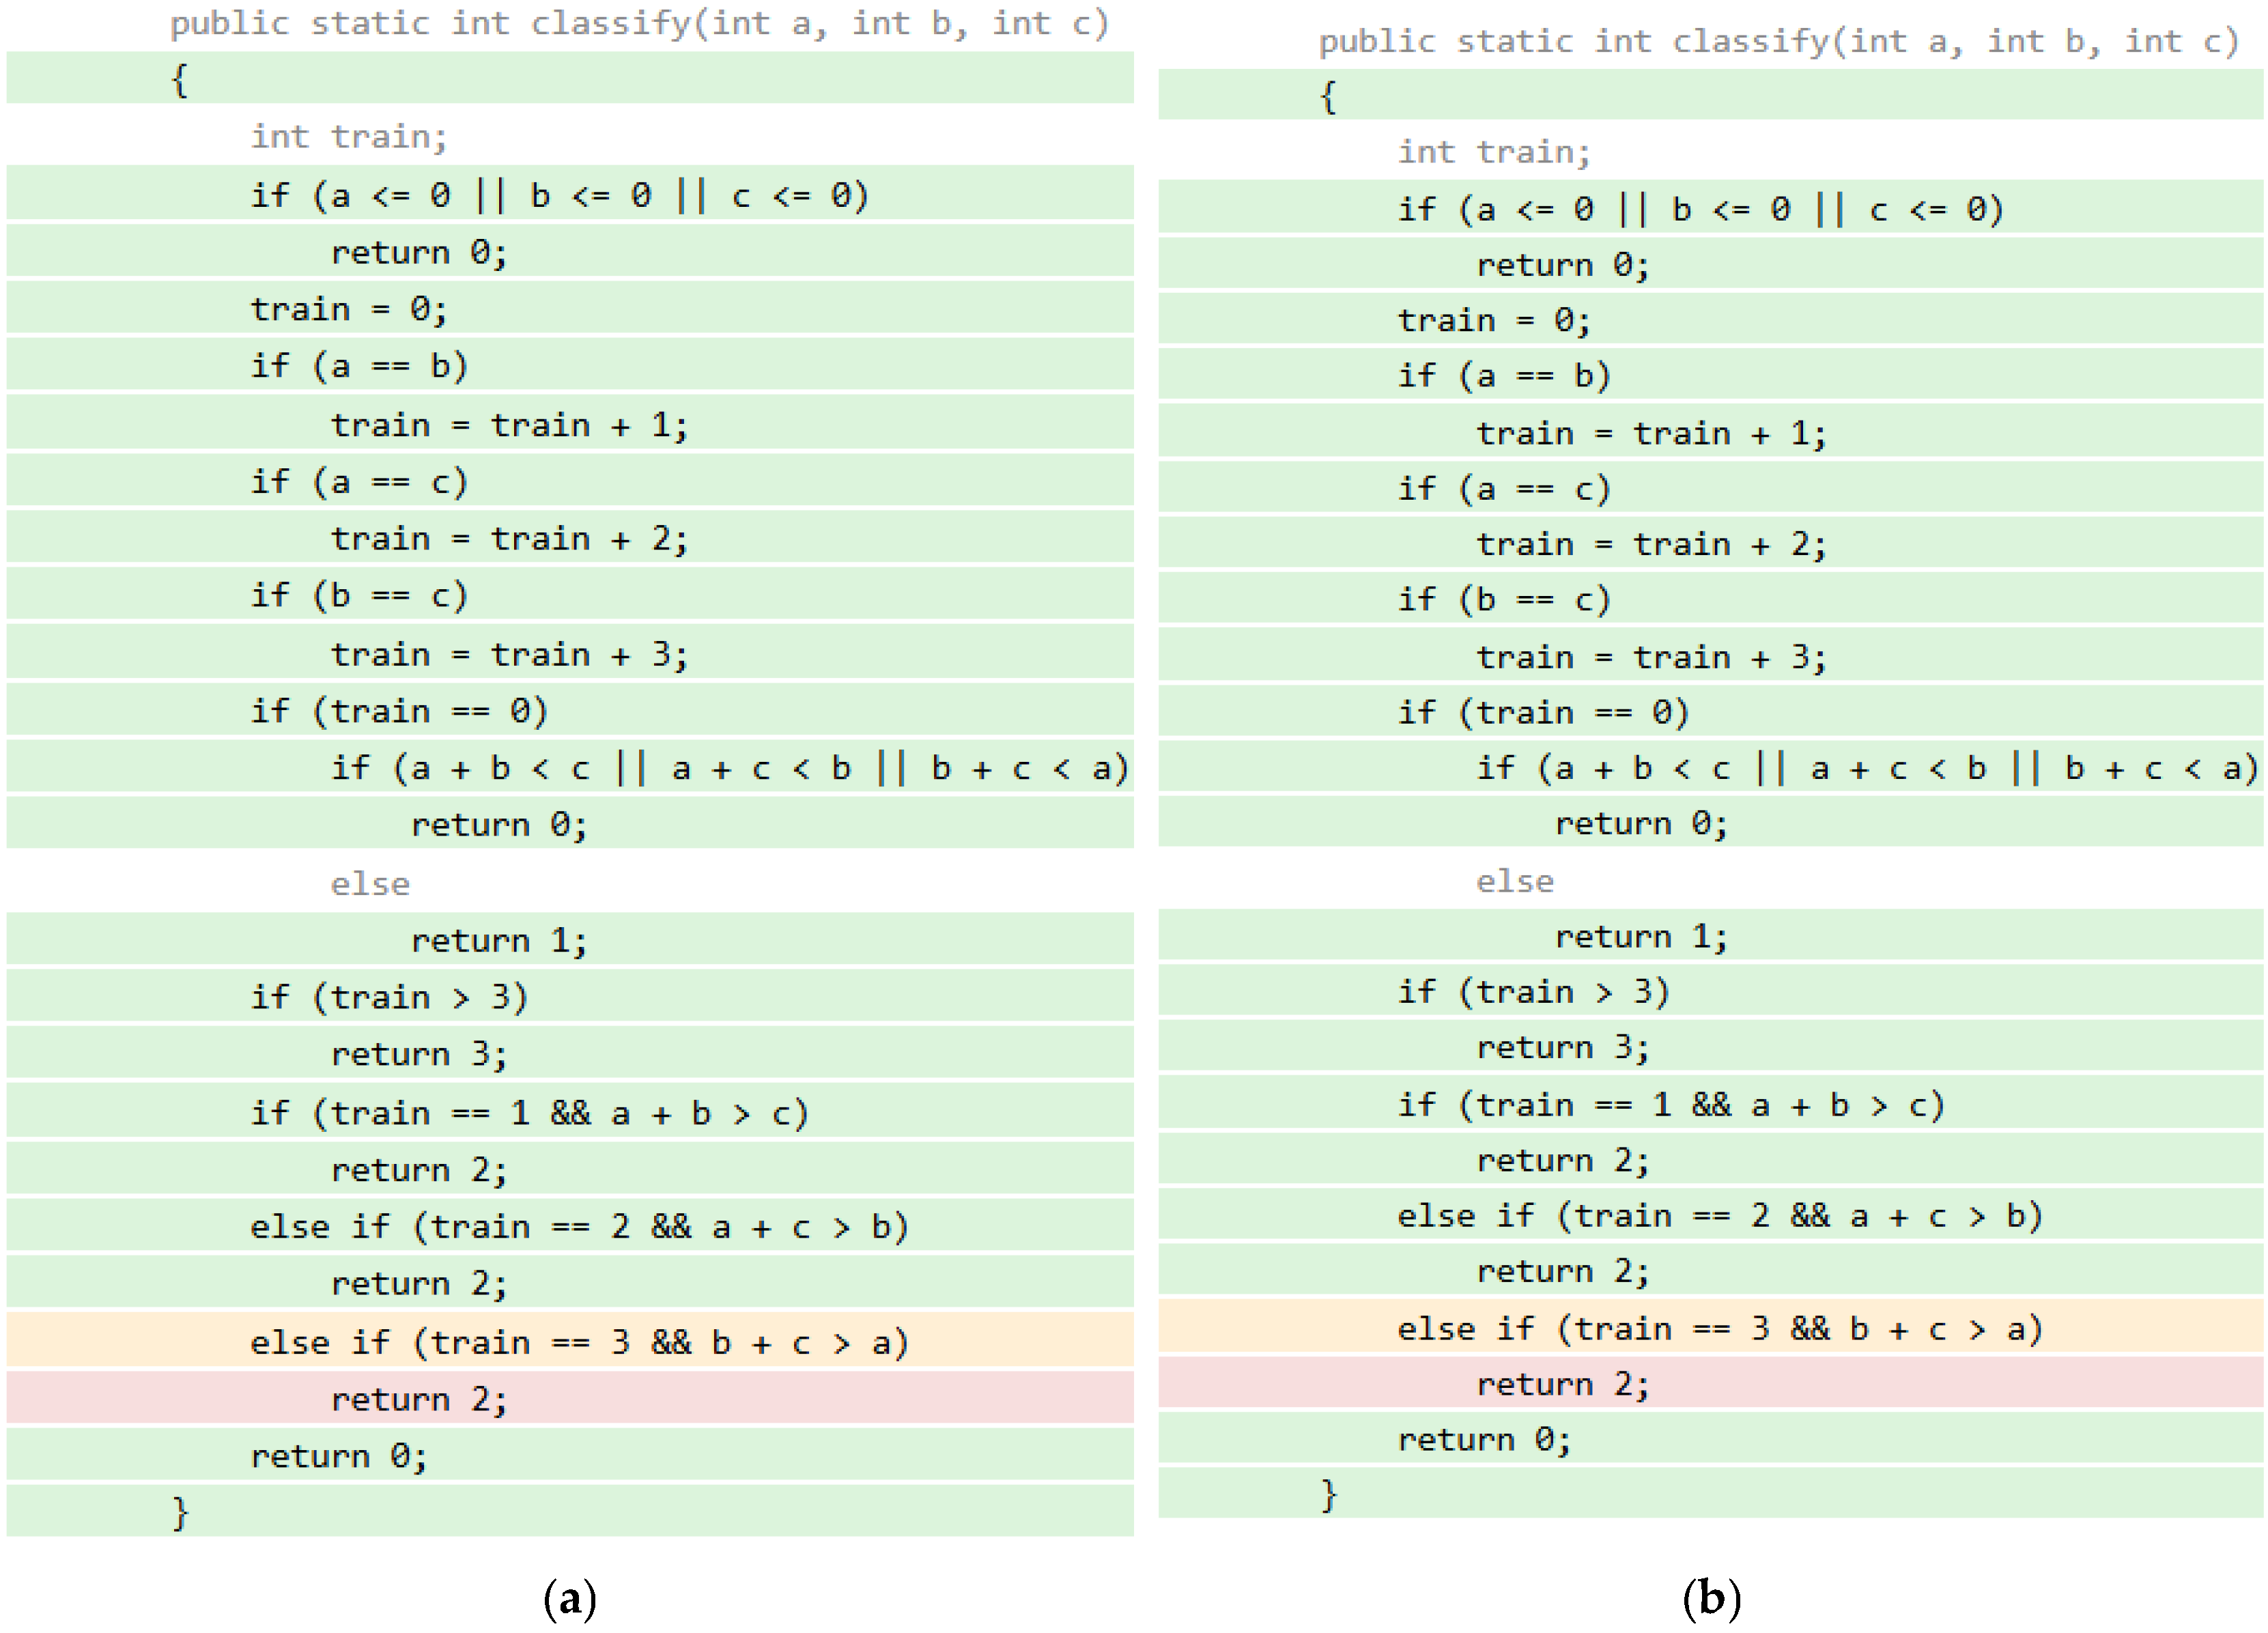
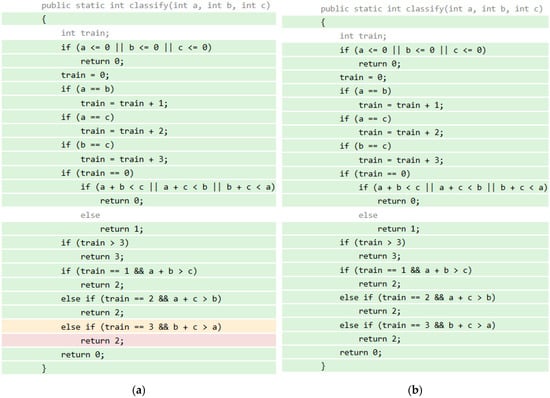
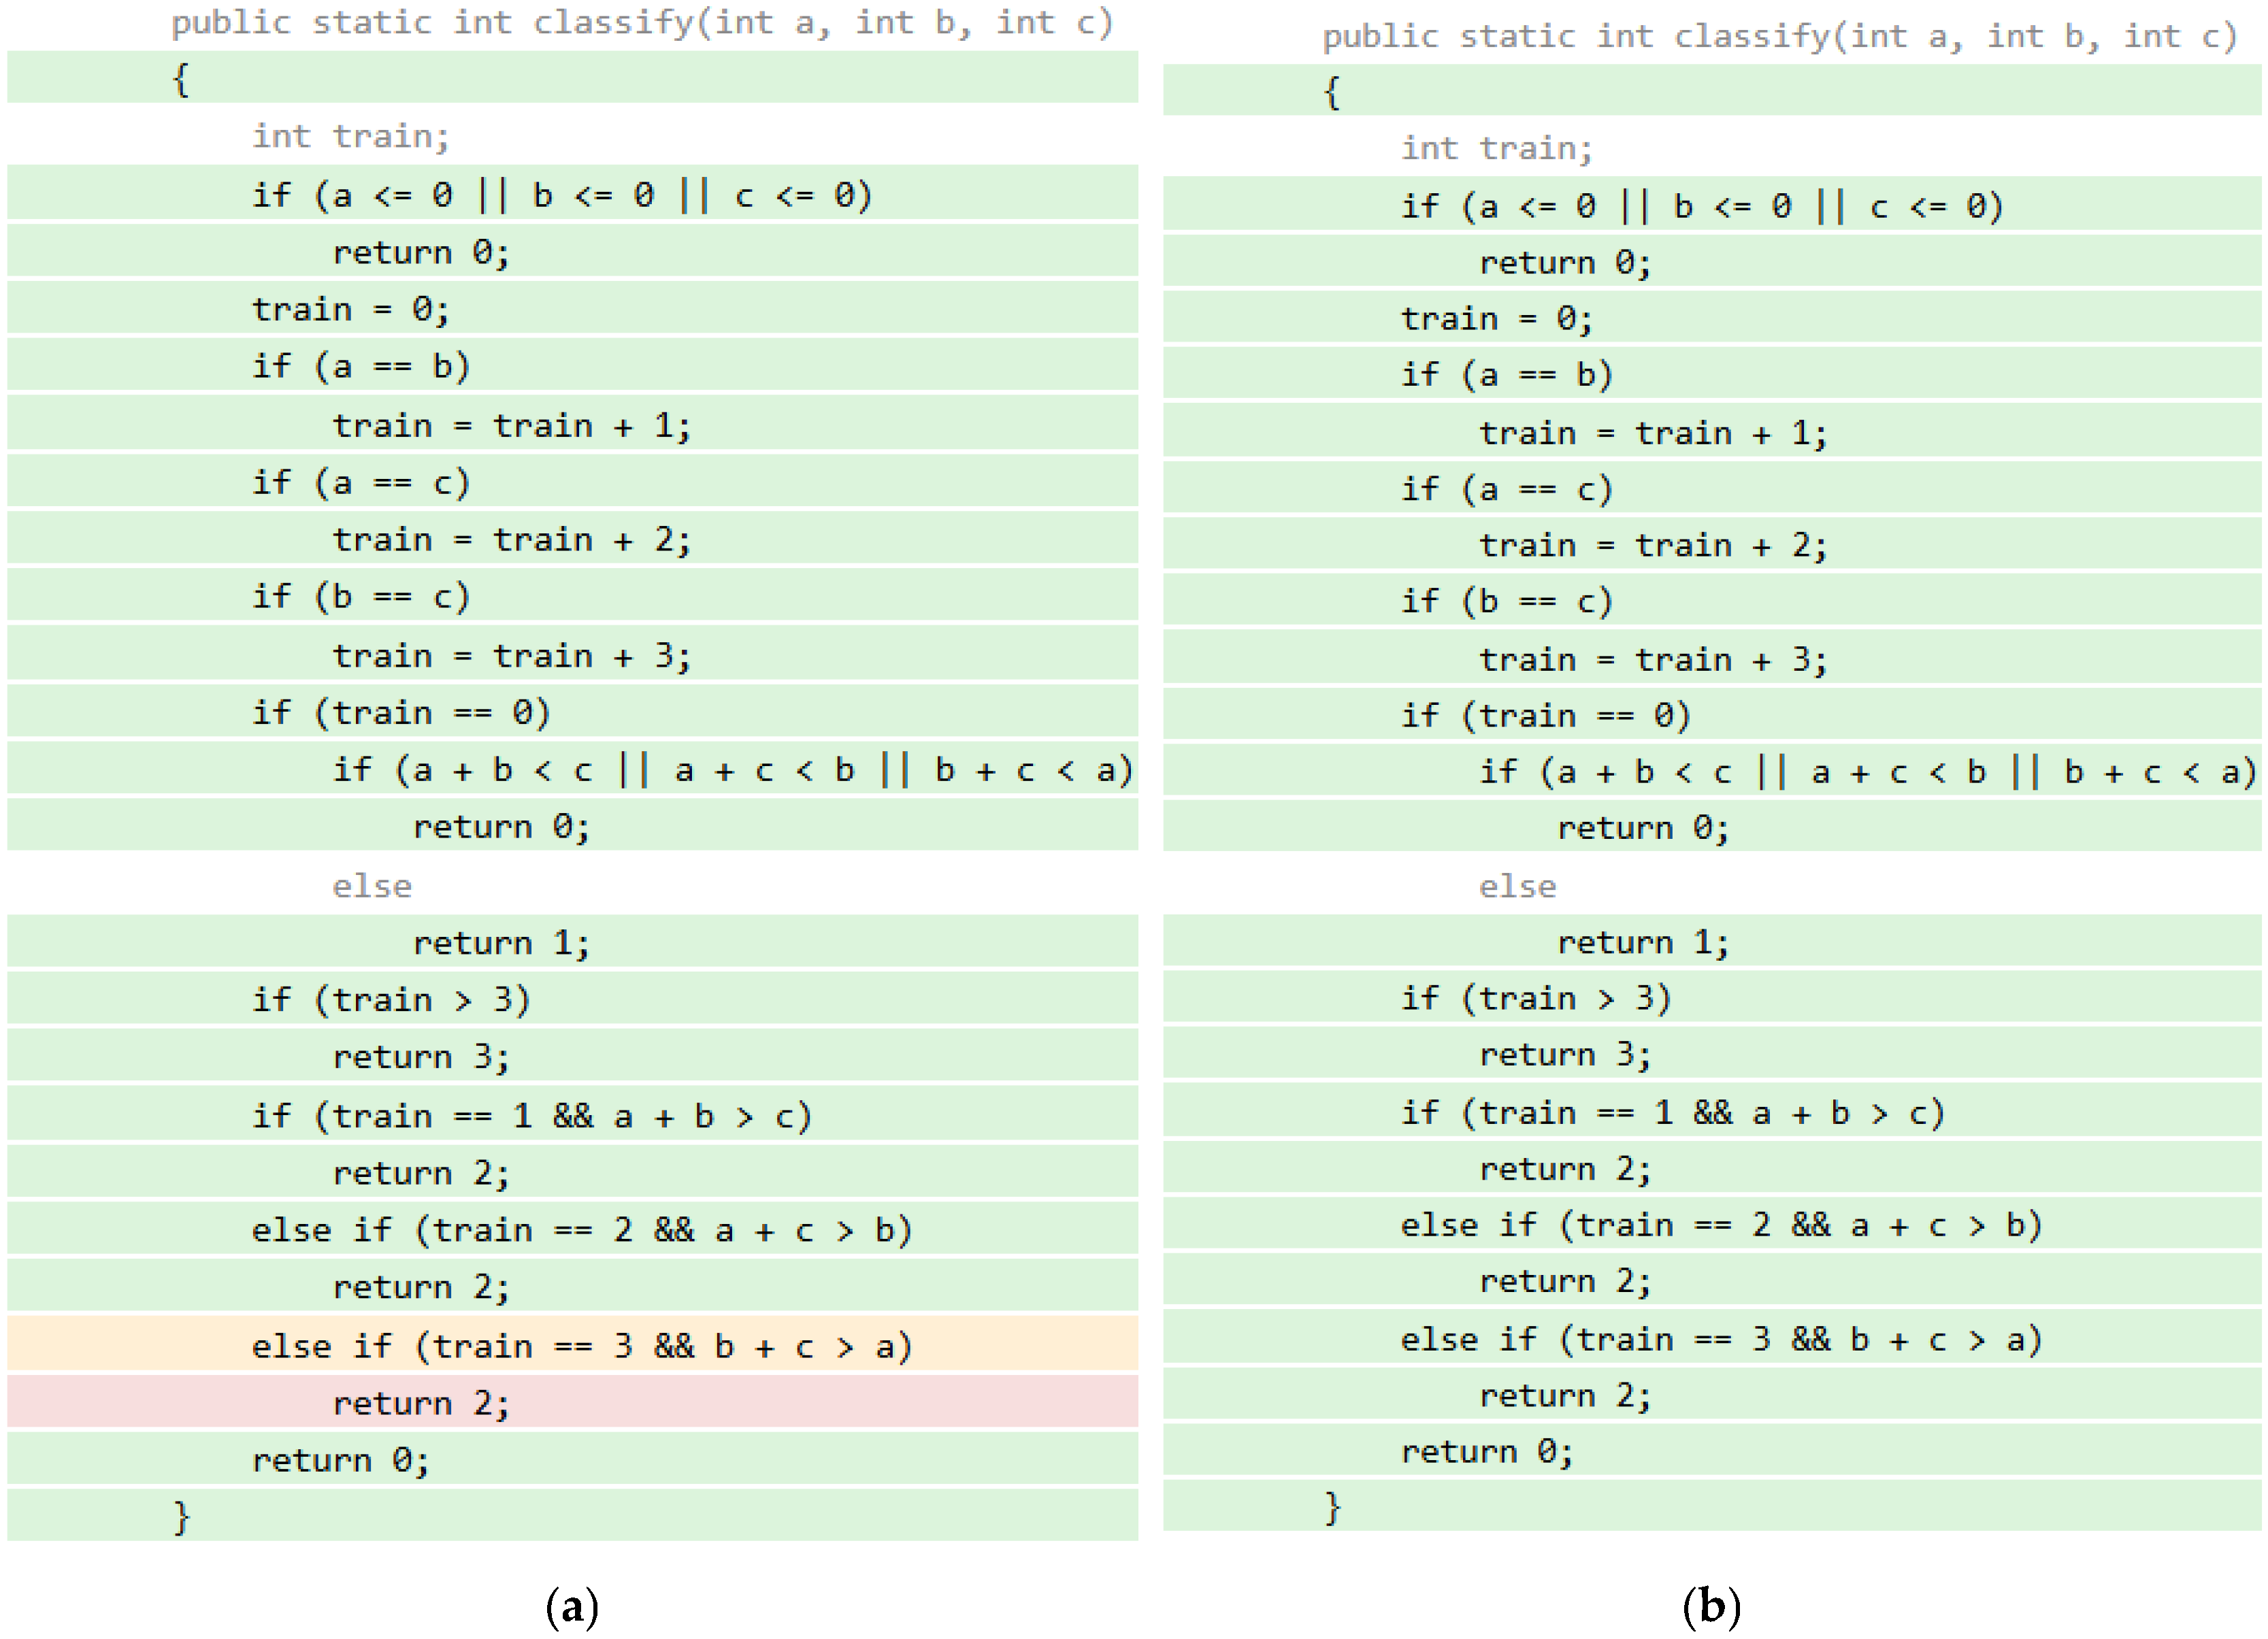
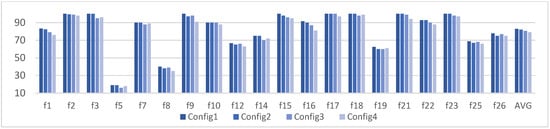
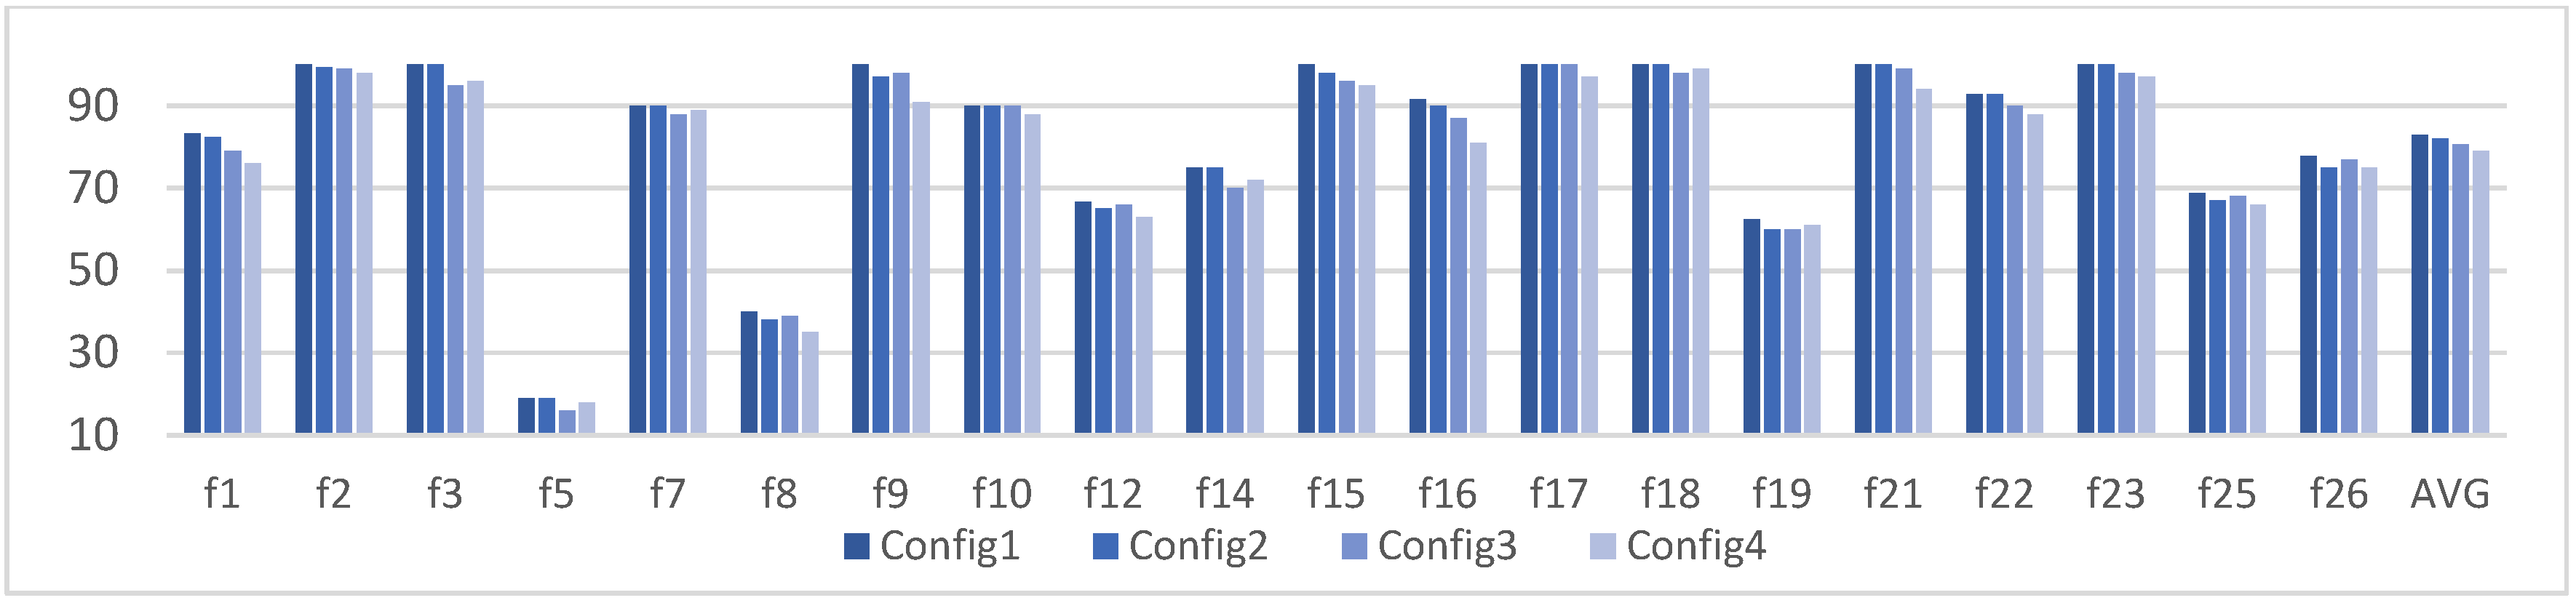
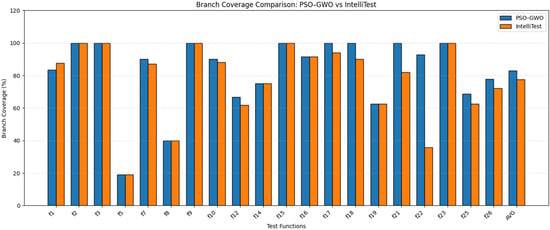
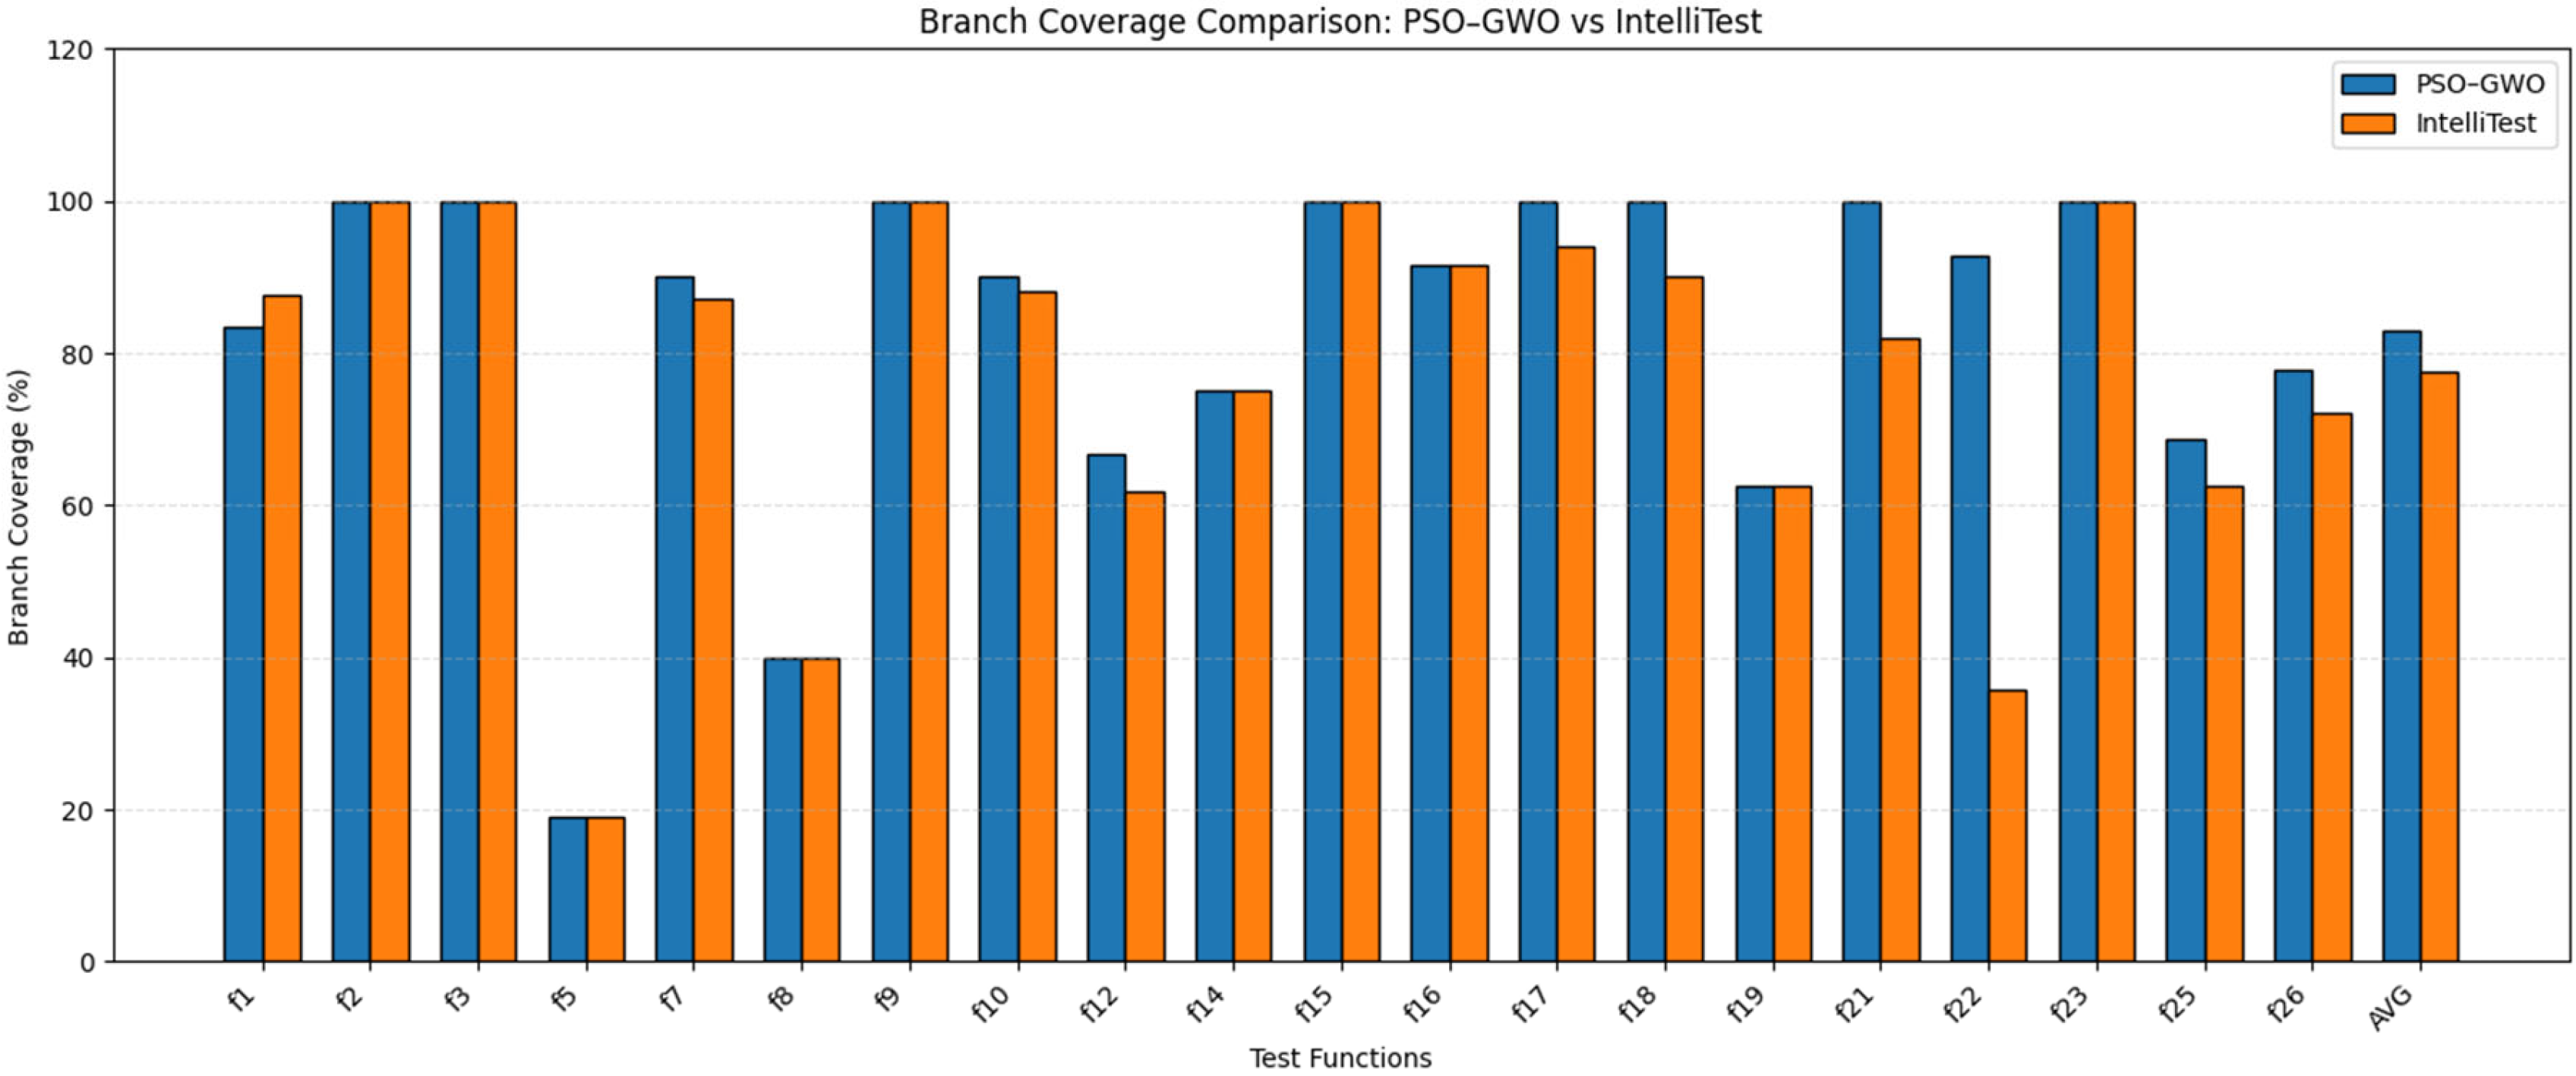
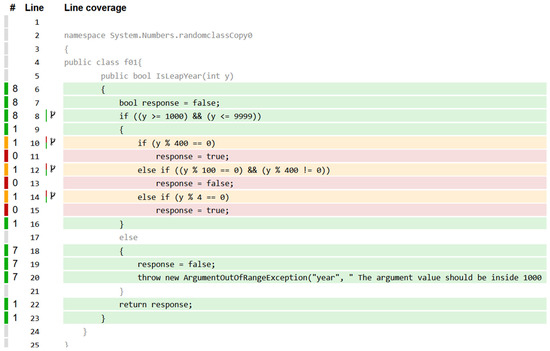
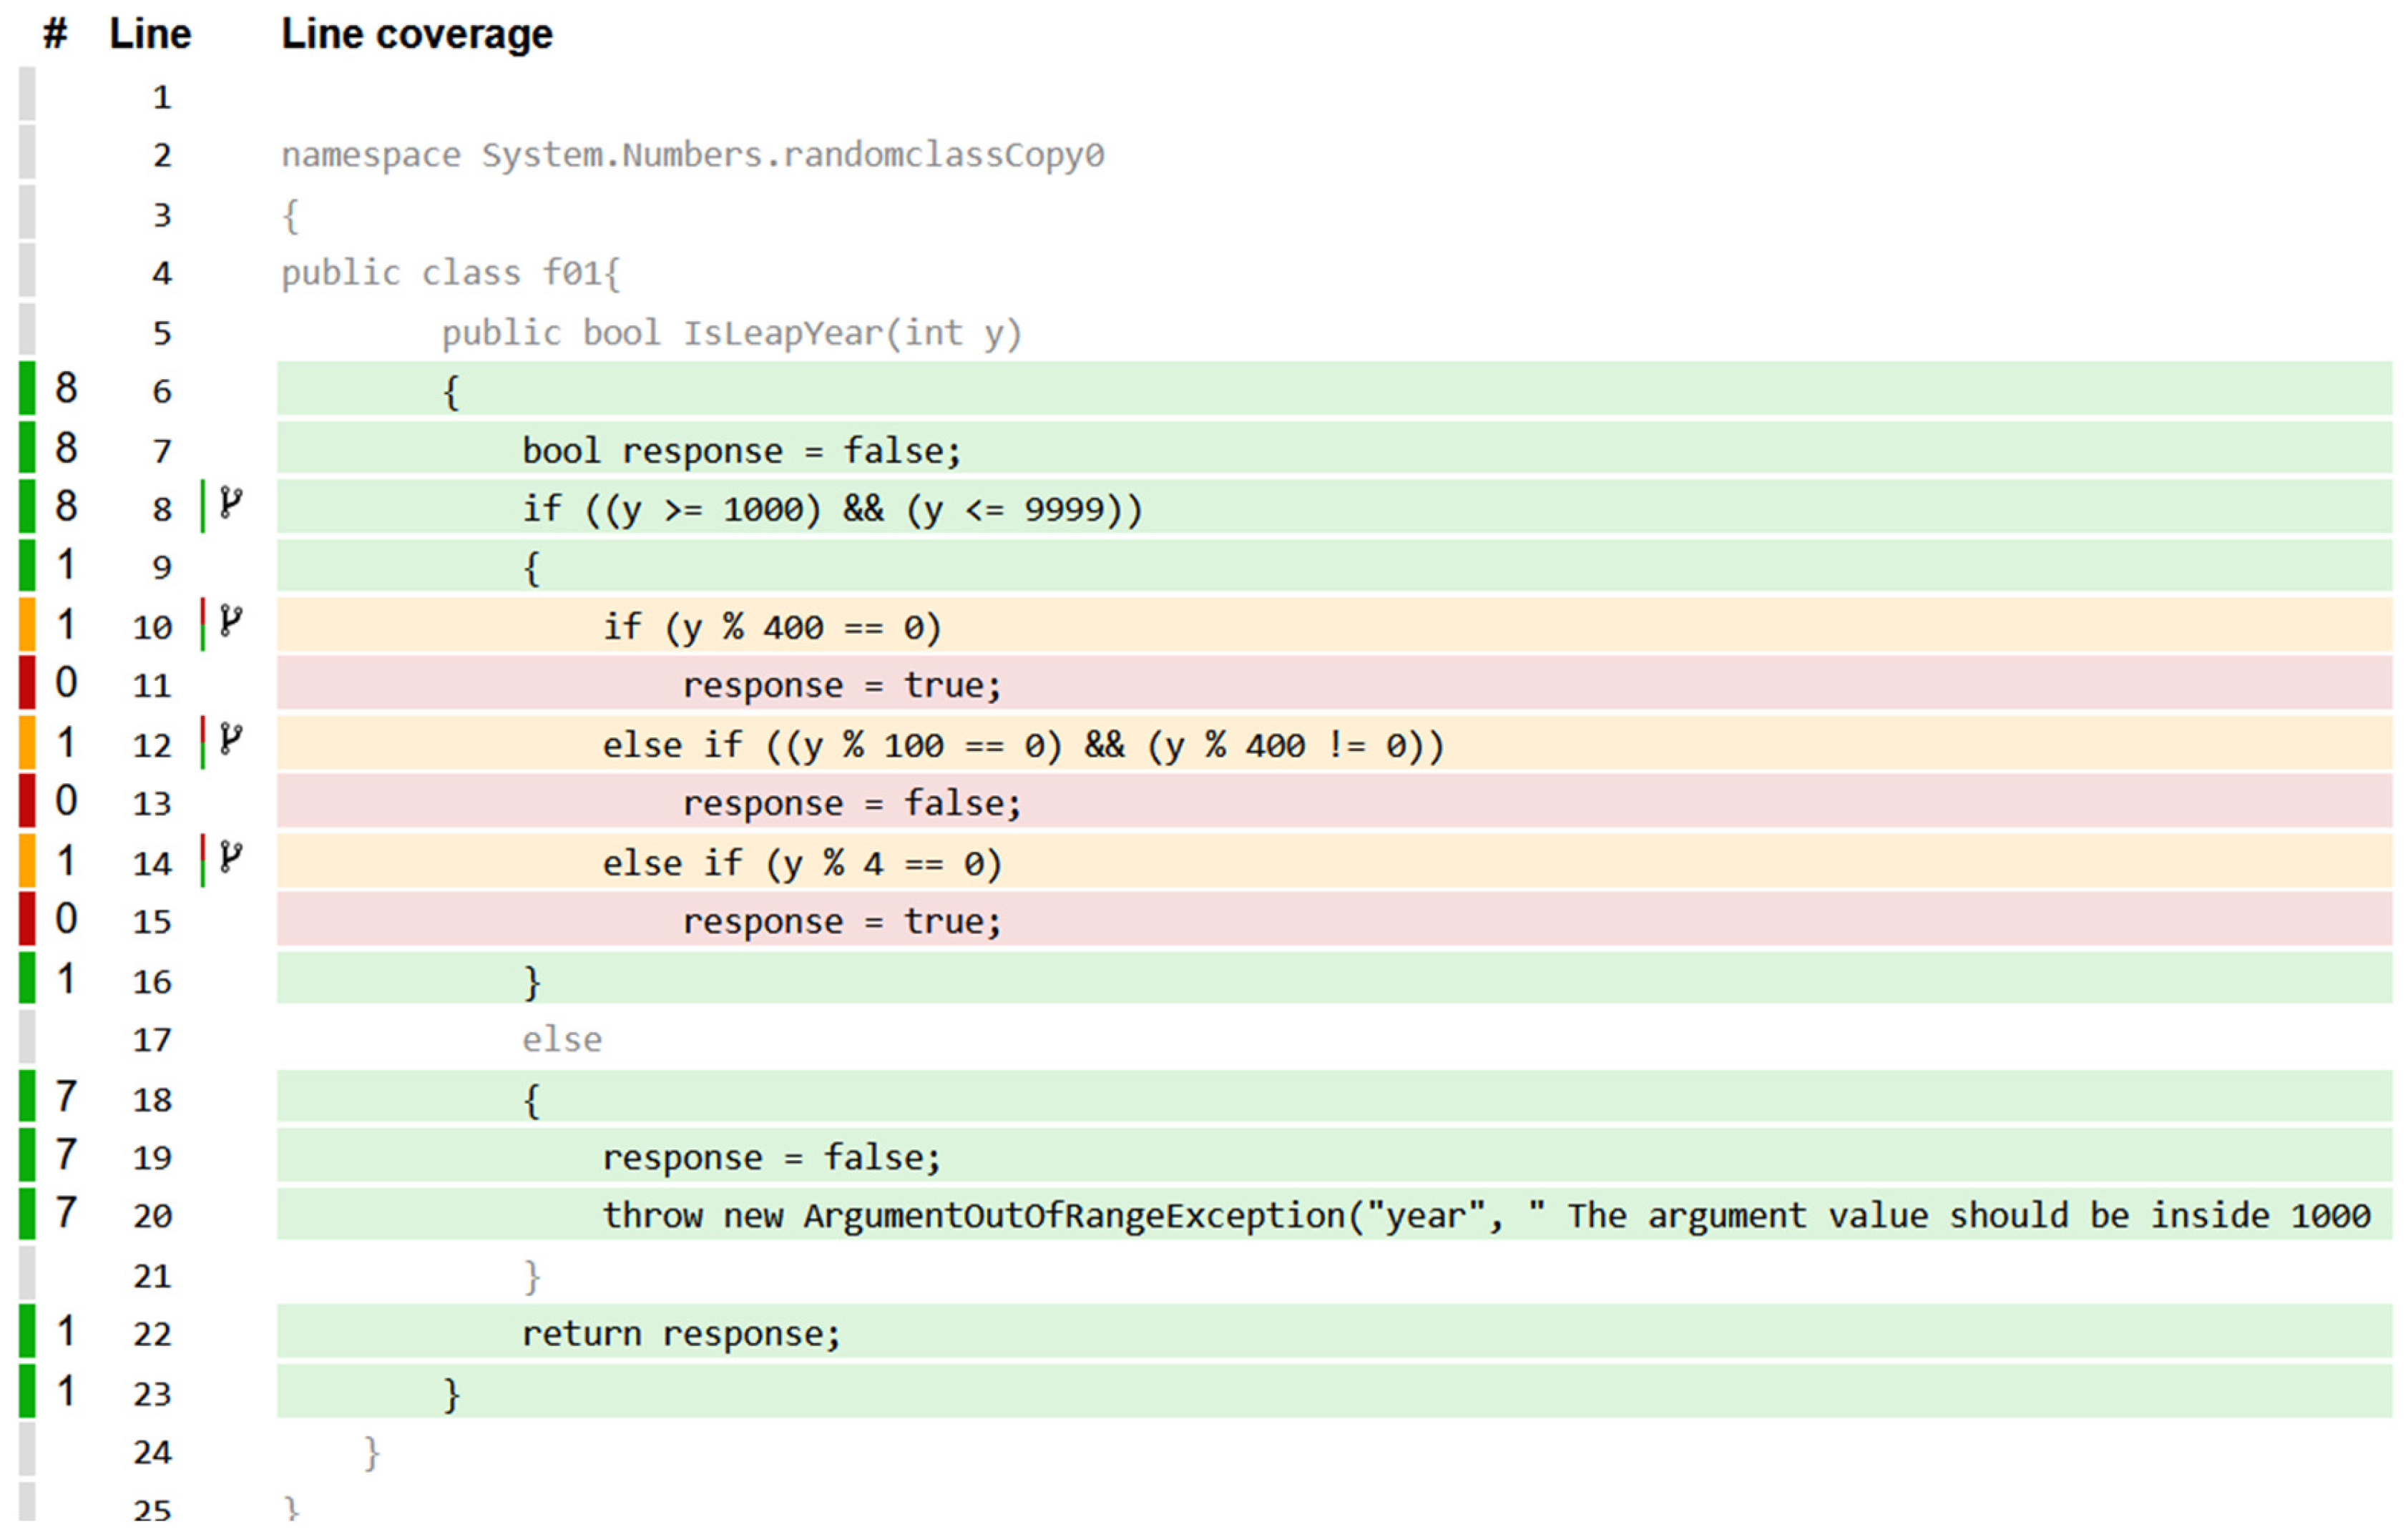

Disclaimer/Publisher’s Note: The statements, opinions and data contained in all publications are solely those of the individual author(s) and contributor(s) and not of MDPI and/or the editor(s). MDPI and/or the editor(s) disclaim responsibility for any injury to people or property resulting from any ideas, methods, instructions or products referred to in the content. |
© 2026 by the authors. Licensee MDPI, Basel, Switzerland. This article is an open access article distributed under the terms and conditions of the Creative Commons Attribution (CC BY) license.