


Abstract
This study aims to investigate the computation of the partition dimension of various anti-myocardial infarction drugs, a graph-theoretical invariant of molecular graphs representing these drugs, for understanding and computationally characterizing structural properties of molecular networks. To improve the computational modeling of this topological invariant, advanced neural network techniques, specifically graph neural networks (GNNs) and deep neural networks (DNNs), are adopted. The GNN captures topological and molecular connection features from the molecular graph structures, which are then input into the DNN model. The DNN further processes these features to estimate the partition dimension, evaluating training performance, performing regression analysis, and producing error histograms. The model’s predictions are validated against reference values. Moreover, by analyzing the role that symmetry plays in determining the calculation of partition dimension, studying how the GNN takes advantage of permutation invariance concept related to symmetry principles to provide the DNN with symmetry-invariant features, and relating the degree of molecular symmetry to the predictive model’s accuracy and performance, its structural interpretation rather than direct chemical behavior. This dual-model approach permits a comprehensive evaluation of the model’s effectiveness in apprehending the structural characteristics of molecular graphs derived from drug molecules. The results are explicated in detail, focused on prediction accuracy, error distributions, and regression results. Moreover, this graph-theoretical metric analysis of partition dimension supports structure-based drug analysis and computational modeling, rather than direct prediction of pharmacokinetic properties, by integrating artificial neural network applications into pharmaceutical research.
1. Introduction
Myocardial infarction, commonly called a heart attack, arises when part of the heart muscle receives insufficient blood due to a coronary artery blockage. This oxygen shortage can cause tissue damage, impair the pumping ability of the heart, and lead to complications such as heart failure [1,2]. Typical symptoms include chest pain, dizziness, throat, jaw, back, or shoulder pain, arm pain, shortness of breath, nausea, sweating, exhaustion, and breathing difficulties, though they may differ by gender. Heart attacks are categorized into two types: Type I, caused by plaque rupture spilling cholesterol and other substances into the bloodstream, and Type II, when blood flow is reduced but arteries are not fully blocked. Major risk factors include smoking, high cholesterol, obesity, inactivity, stress, diabetes or prediabetes, poor diet, alcohol use, and insomnia [3]. Globally, heart disease causes about 17 million deaths annually. Treatments include stent placement, angioplasty, bypass surgery, valve surgery, and transplantation [4], but developing drugs for this condition remains costly and complex, motivating chemists to design analytical tools for studying molecular structures.
In mathematical chemistry, and particularly in chemical graph theory, chemical systems are represented as graphs, where vertices denote atoms and edges represent chemical bonds. For the purpose of this study, double bonds in molecular structures are represented by a single edge in the corresponding graph. For a molecular graph , distances between nodes are used to define resolving sets and metric dimensions. The metric dimension corresponds to the smallest subset of vertices that uniquely identifies all others by distance. This concept has applications in optimization, robotics, games, image processing, pharmaceutical chemistry, polymer synthesis, and electrical systems [5,6,7,8,9,10,11,12,13].
Researchers have extended these ideas to many graph classes. For example, windmill graphs were analyzed through metric generalization [14,15], while bounds were studied for broader graph families [16]. Studies also examined rooted product-based symmetric graphs [17] and hollow coronoid structures [18]. Metric parameters of quartz structures were also explored. Partition dimension, closely related to metric dimension, provides another approach to graph resolvability but is computationally challenging (NP-hard). Important contributions include convex polytopes [19,20], chemical fullerene graphs [21], nanotubes and sheets [22], and two-dimensional lattice structures [23]. Applications of these ideas are broad, spanning optimization, robotics, games, image analysis, pharmaceuticals, polymer synthesis, and electrical engineering [11,12,13,24,25,26]. Further studies include ones by Buawangpong et al. on the comb structures of Apis dorsata [27], Milli et al. on meat classification using gas sensor data [28], Hsu et al. on graph-theoretic algorithms [29], Li et al. on GNNs in power electronics [30], Guzman-Pando et al. on deep learning in computational chemistry [31], and Bhat et al. on GNN technologies for graph data analysis [32]. Graph invariants, such as the maximal elliptic Sombor index, have been studied for various graph classes, including bicyclic graphs [33]. Understanding these indices provides insights into structural properties that are increasingly applied in graph neural network models. These works collectively highlight the significance and diverse applicability of partition dimension across multiple fields. This work employs concepts from chemical graph theory to examine anti-myocardial infarction drugs by representing their molecular structures as graphs and focusing on topological indices for structural characterization. In this representation, atoms are modeled as vertices and chemical bonds as edges, yielding molecular graphs suitable for mathematical analysis. The primary objective of the study is to determine the partition dimension of these molecular graphs, which serves as a numerical descriptor of their underlying topological structure. To address this task, advanced machine learning methodologies, specifically graph neural networks (GNNs) and deep neural networks (DNNs), are utilized. Within the proposed framework, the GNN is responsible for learning connectivity driven structural features directly from molecular graphs, while the DNN uses these features to approximate partition dimension values through regression modeling, performance evaluation, and error analysis. This combined approach supports structure-oriented computational modeling and provides a mathematically grounded perspective that may inform, but does not directly predict, drug-related properties. By integrating graph-based molecular representations with neural learning models, the study presents a data driven method for computing a fundamental graph-theoretic invariant associated with drug molecules.
The remaining parts of the article are structured as follows: Section 2 offers a comprehensive overview of the fundamental concepts and background information pertinent to partition resolvability. The core of our investigation is presented in Section 3, where we detail the primary findings and analysis. In Section 4, we provide a comparative evaluation of GNNs and DNNs in the context of partition-based representations. Lastly, Section 5 encapsulates the key findings and presents the overall conclusions drawn from the research.
2. Preliminaries
The investigation into the partition resolvability of chemical structures related to anti-heart attack drugs relies significantly on graph theory as a robust framework. Key graph theoretic principles like distance, metric dimension, and partition dimension offer invaluable insights into the structural complexities of these compounds. Through the analysis of these parameters, this research endeavors to unveil the essential spatial arrangements and interconnections within molecular frameworks, shedding light on crucial factors that shape the efficacy and behavior of anti-heart attack drugs.
Definition 1
([18]). Suppose an undirected graph represents a chemical system, where denotes the set of main nodes (vertices), and denotes a collection of links (edges). The number of edges along the shortest path between nodes and is defined as the distance between these two main nodes, , denoted as .
Definition 2
([18]). Let ℘ be a principal node belonging to , and suppose is a subset consisting of principal nodes specified by . The position of a principal node ℘ concerning , denoted as , can be described as an ordered sequence of distances to each node in : . If every significant node in possesses a unique identity based on the ordered subset , this subset is termed as the resolving set of the network . The term denotes the minimum number of elements in the subset , which essentially represents the metric dimension of .
Definition 3
([11]). Let denote the s-tuple distance description of a principal node ℘ with respect to , where represents a set of s distinct elements. can be termed as the partition resolving set of the principal node within a network if each member of the set of principal nodes possesses a unique identifier. The partition dimension of is defined as the minimum number of subsets in the set of .
In the Section 1, the symbol is used to represent either a graph or a chemical structure. The notation indicates the positional relationship of a vertex ℘ relative to the resolving set or locating set . Moreover, is employed to denote the partition resolving set, while represents the metric dimension of the graph . Additionally, the partition dimension is symbolized by , establishing a symbolic framework crucial for understanding the subsequent discussions on anti-heart attack chemical structures and their partition resolvability.
3. Main Results
This section presents our primary discoveries from the analysis of partition determining sets associated with specific structures encompassing Rivaroxaban, Ticagrelor, Apixaban, Aspirin, Atenolol, Candesartan, Captopril, Carvedilol, Dipyridamole, Edoxaban, Quinapril, Ramipril, and Warfarin.
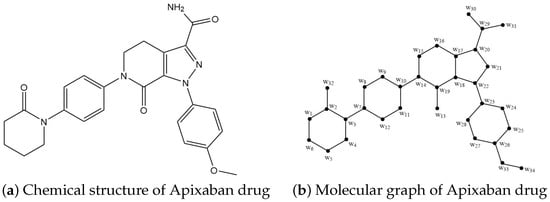
The bond and vertex sets in the chemical structure of Apixaban, an anti-heart attack drug, are shown here. The Apixaban structure has 34 nodes (vertices) and 38 bonds (edges). Figure 1b depicts the molecular graph of Apixaban and the labeling strategy utilized in our core observations. Reference [34] discusses topological aspects unique to this structure.
Figure 1.
Chemical structure and molecular graph of Apixaban drug.
Theorem 1.
Let depict the structure of Apixaban, an anti-myocardial infarction drug molecule. Thus, there are less than or equal to five partition dimensions for .
Proof.
We compute that the Apixaban heart attack drug structure graph has a partition dimension of five. To establish our claim, we employed a partition-locating set of size five, which is , where and . The authenticity of such assumption is guaranteed by the existence of accompanying figures that describe the position of each node within the Apixaban drug molecule, presented in Table 1.
Table 1.
Illustrations of nodes of with respect to .
The special position of the nodes in the Apixaban graph structure adheres to the requirements of the partition-locating set needed, thereby confirming the validity of the proposed partition-locating number. This effective construction gives us the upper bound, which is . Eventually, in order to validate the proof, we need to demonstrate that as well. As it is well established that if and only if is a path, we conclude that . Establishing the lower bound ensures that the partition dimension is exactly . □
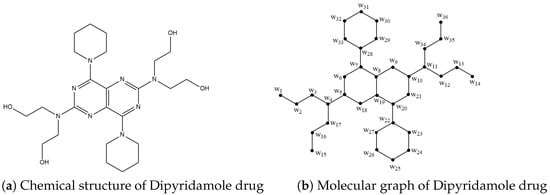
The bond and vertex sets in the chemical structure of Dipyridamole, an anti-heart attack drug, are shown here. The Dipyridamole structure has 36 nodes (vertices) and 38 bonds (edges). Figure 2b depicts the molecular graph of Dipyridamole and the labeling strategy utilized in our core observations. Reference [34] discusses topological aspects unique to this structure.
Figure 2.
Chemical structure and molecular graph of Dipyridamole drug.
Theorem 2.
Let depict the structure of Dipyridamole, an anti-myocardial infarction drug molecule. Thus, there are less than or equal to five partition dimensions for .
Proof.
We compute that the partition dimension of the Dipyridamole heart attack medication structural graph is five. In order to support our assertion, we used a size of five partition-locating set, which is , where and . The authenticity of such assumption is guaranteed by the existence of accompanying figures that describe the position of each node within the Dipyridamole drug molecule, presented in Table 2.
Table 2.
Illustrations of nodes of with respect to .
The proposed partition-locating number is adequate since the unique node positions in the Dipyridamole graph structure adhere to the requirements of the desired partition-locating set. This effective construction gives us the upper bound, which is . Eventually, in order to validate the proof, we need to demonstrate that as well. As it is well established that if and only if is a path, we conclude that . Establishing the lower bound ensures that the partition dimension is exactly . □
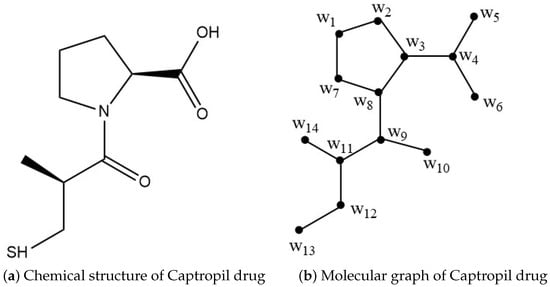
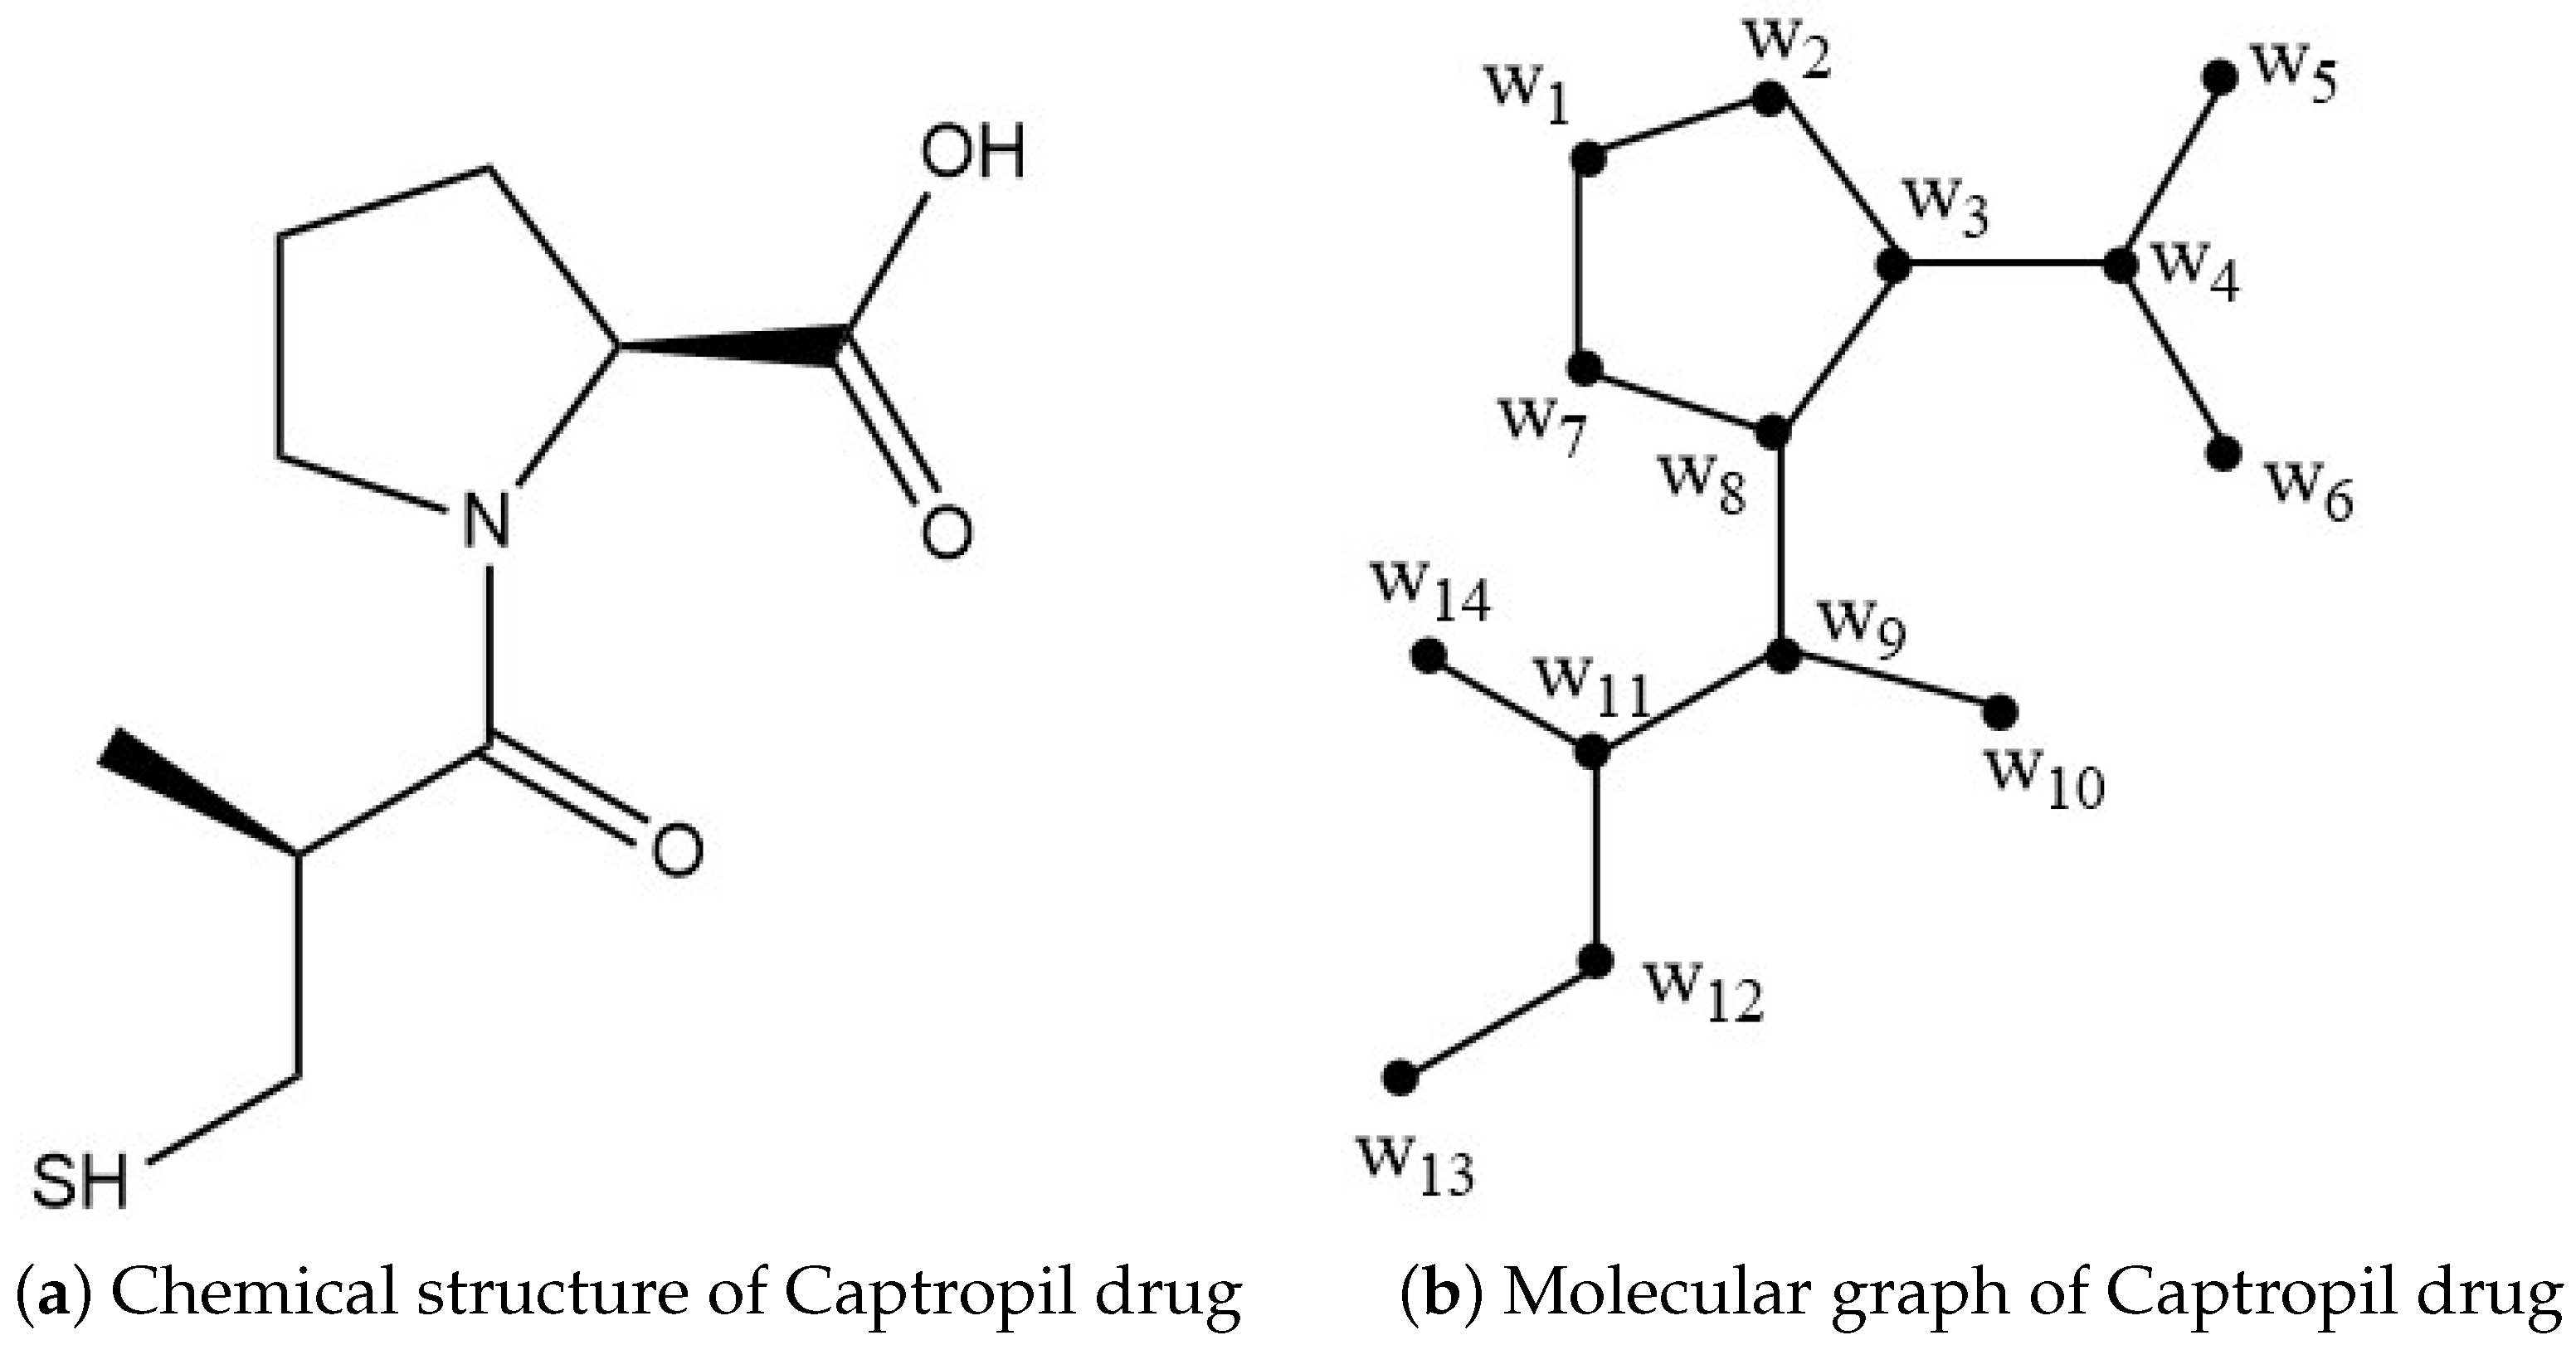
The bond and vertex sets in the chemical structure of Captopril, an anti-heart attack drug, are shown here. The Captopril structure has 14 nodes (vertices) and 14 bonds (edges). Figure 3b depicts the molecular graph of Captopril and the labeling strategy utilized in our core observations. Reference [34] discusses topological aspects unique to this structure.
Figure 3.
Chemical structure and molecular graph of Captropil drug.
Theorem 3.
Let depict the structure of Captopril, an anti-myocardial infarction drug molecule. Thus, there are less than or equal to four partition dimensions for .
Proof.
We compute that the Captopril heart attack drug structure graph has a partition dimension of four. To support our claim, we employed a size of four partition-locating set which is , where and . The validity of such assumption is ensured by the inclusion of accompanying figures that illustrate the position of each node within the Captopril drug molecule, presented in Table 3.
Table 3.
Illustrations of nodes of with respect to .
The proposed partition-locating number is adequate since the unique node positions in the Captopril graph structure adhere to the requirements of the desired partition-locating set. This effective construction gives us the upper bound, which is . Eventually, in order to validate the proof, we need to demonstrate that as well. As it is well established that if and only if is a path, we conclude that . Establishing the lower bound ensures that the partition dimension is exactly . □
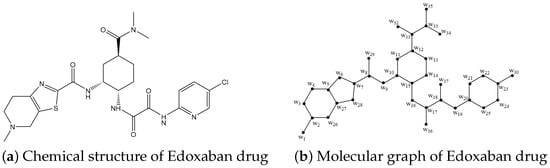
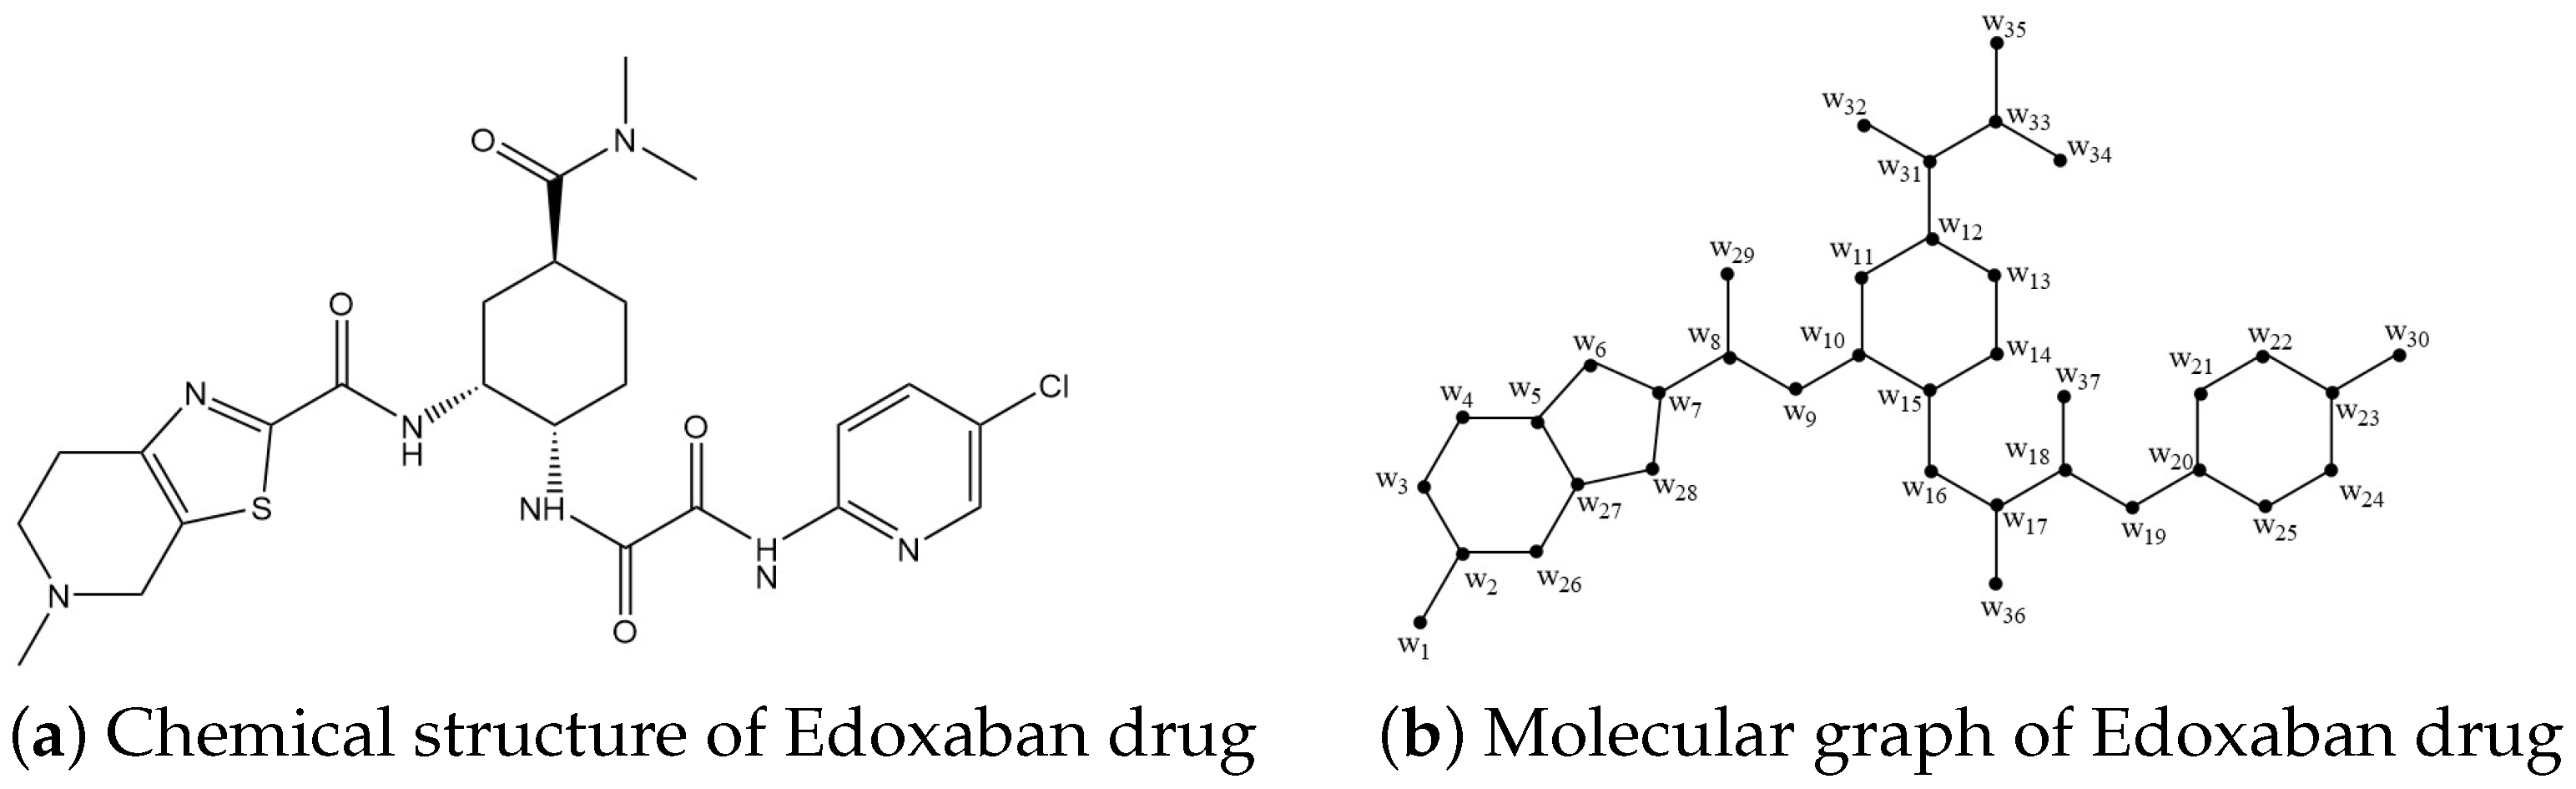
The bond and vertex sets in the chemical structure of Edoxaban, an anti-heart attack drug, are shown here. The Edoxaban structure has 37 nodes (vertices) and 40 bonds (edges). Figure 4b depicts the molecular graph of Edoxaban and the labeling strategy utilized in our core observations. Reference [34] discusses topological aspects unique to this structure.
Figure 4.
Chemical structure and molecular graph of Edoxaban drug.
Theorem 4.
Let depict the structure of Edoxaban, an anti-myocardial infarction drug molecule. Thus, there are less than or equal to four partition dimensions for .
Proof.
We compute that the partition dimension of the Edoxaban heart attack medication structural graph is four. In order to support our assertion, we used a size of four partition-locating set, which is , where and . The authenticity of such assumption is guaranteed by the existence of accompanying figures that describe the position of each node within the Edoxaban drug molecule, presented in Table 4.
Table 4.
Illustrations of nodes of with respect to .
The proposed partition-locating number is adequate since the unique node positions in the Edoxaban graph structure adhere to the requirements of the desired partition-locating set. This effective construction gives us the upper bound, which is . Eventually, in order to validate the proof, we need to demonstrate that as well. As it is well established that if and only if is a path, we conclude that . Establishing the lower bound ensures that the partition dimension is exactly . □
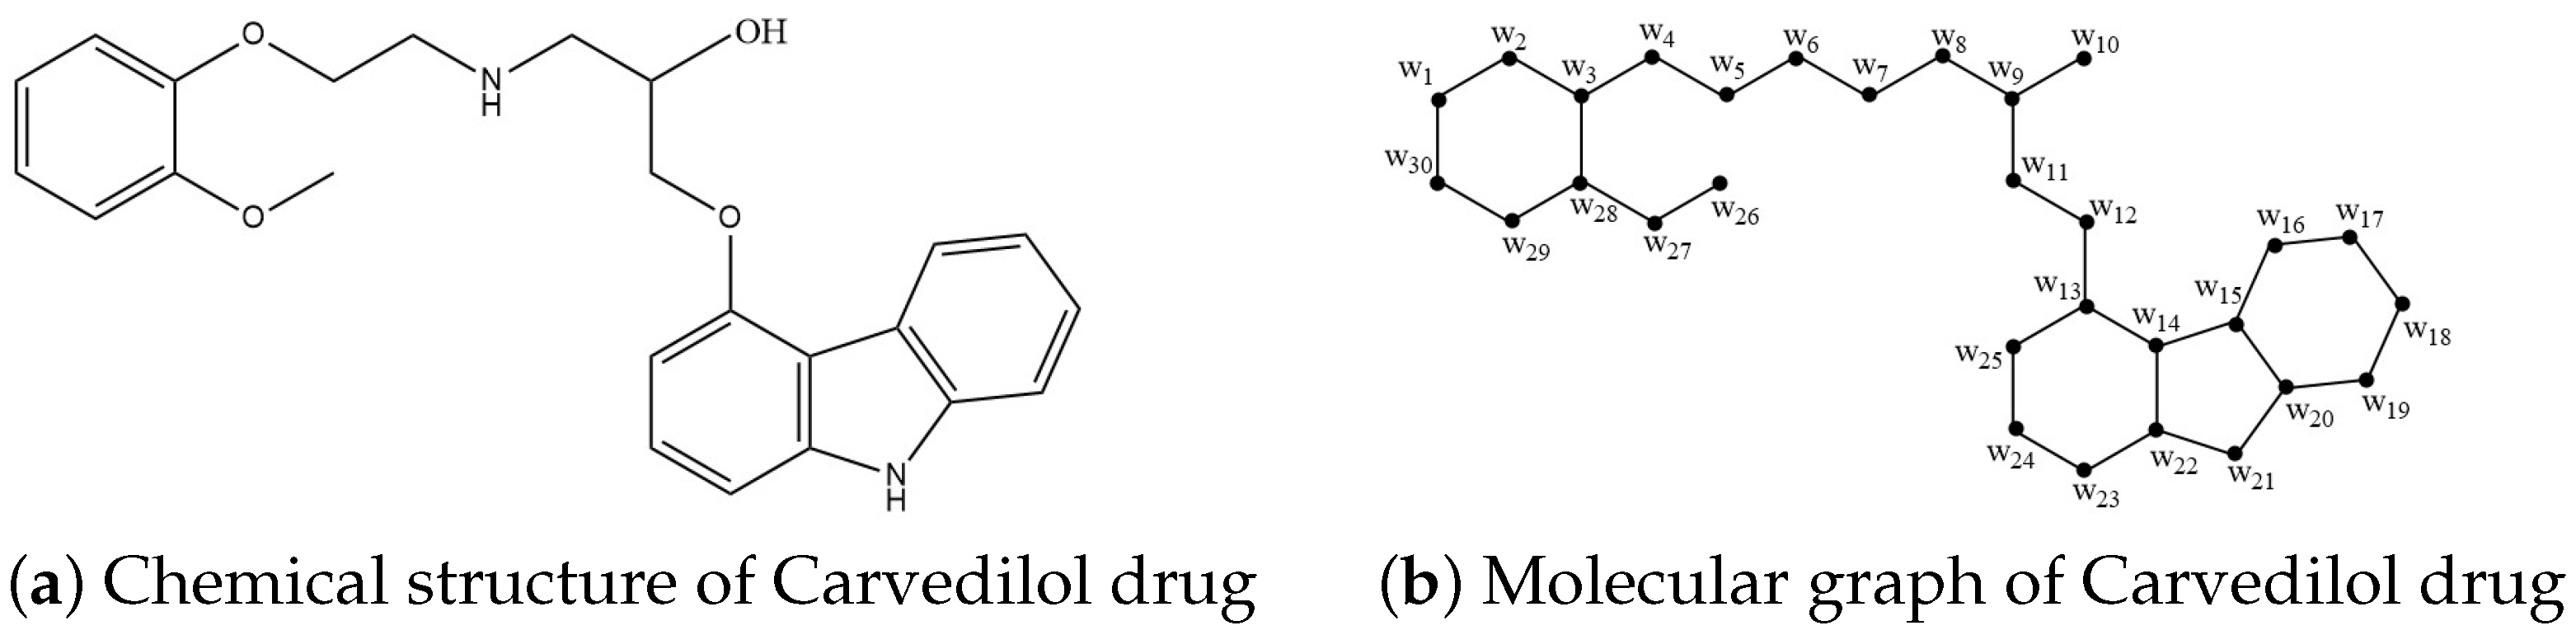
The bond and vertex sets in the chemical structure of Carvedilol, an anti-heart attack drug, are shown here. The Carvedilol structure has 30 nodes (vertices) and 33 bonds (edges). Figure 5b depicts the molecular graph of Carvedilol and the labeling strategy utilized in our core observations. Reference [34] discusses topological aspects unique to this structure.
Figure 5.
Chemical structure and molecular graph of Carvedilol drug.
Theorem 5.
Let depict the structure of Carvedilol, an anti-myocardial infarction drug molecule. Thus, there are three partition dimensions for .
Proof.
We compute that the partition dimension of the Carvedilol heart attack medication structural graph is three. In order to support our assertion, we used a size of three partition-locating set, which is , where and . The authenticity of such assumption is guaranteed by the existence of accompanying figures that describe the position of each node within the Carvedilol drug molecule, presented in Table 5. The proposed partition-locating number is sufficient since the distinct node positions in the Carvedilol graph structure satisfy the conditions of the required partition-locating set. This effective construction provides the upper bound, which is . Ultimately, to validate the proof, we must also show that . As it is well known that if and only if is a path, we infer that . Establishing the lower bound confirms that the partition dimension is precisely . □
Table 5.
Illustrations of nodes of with respect to .
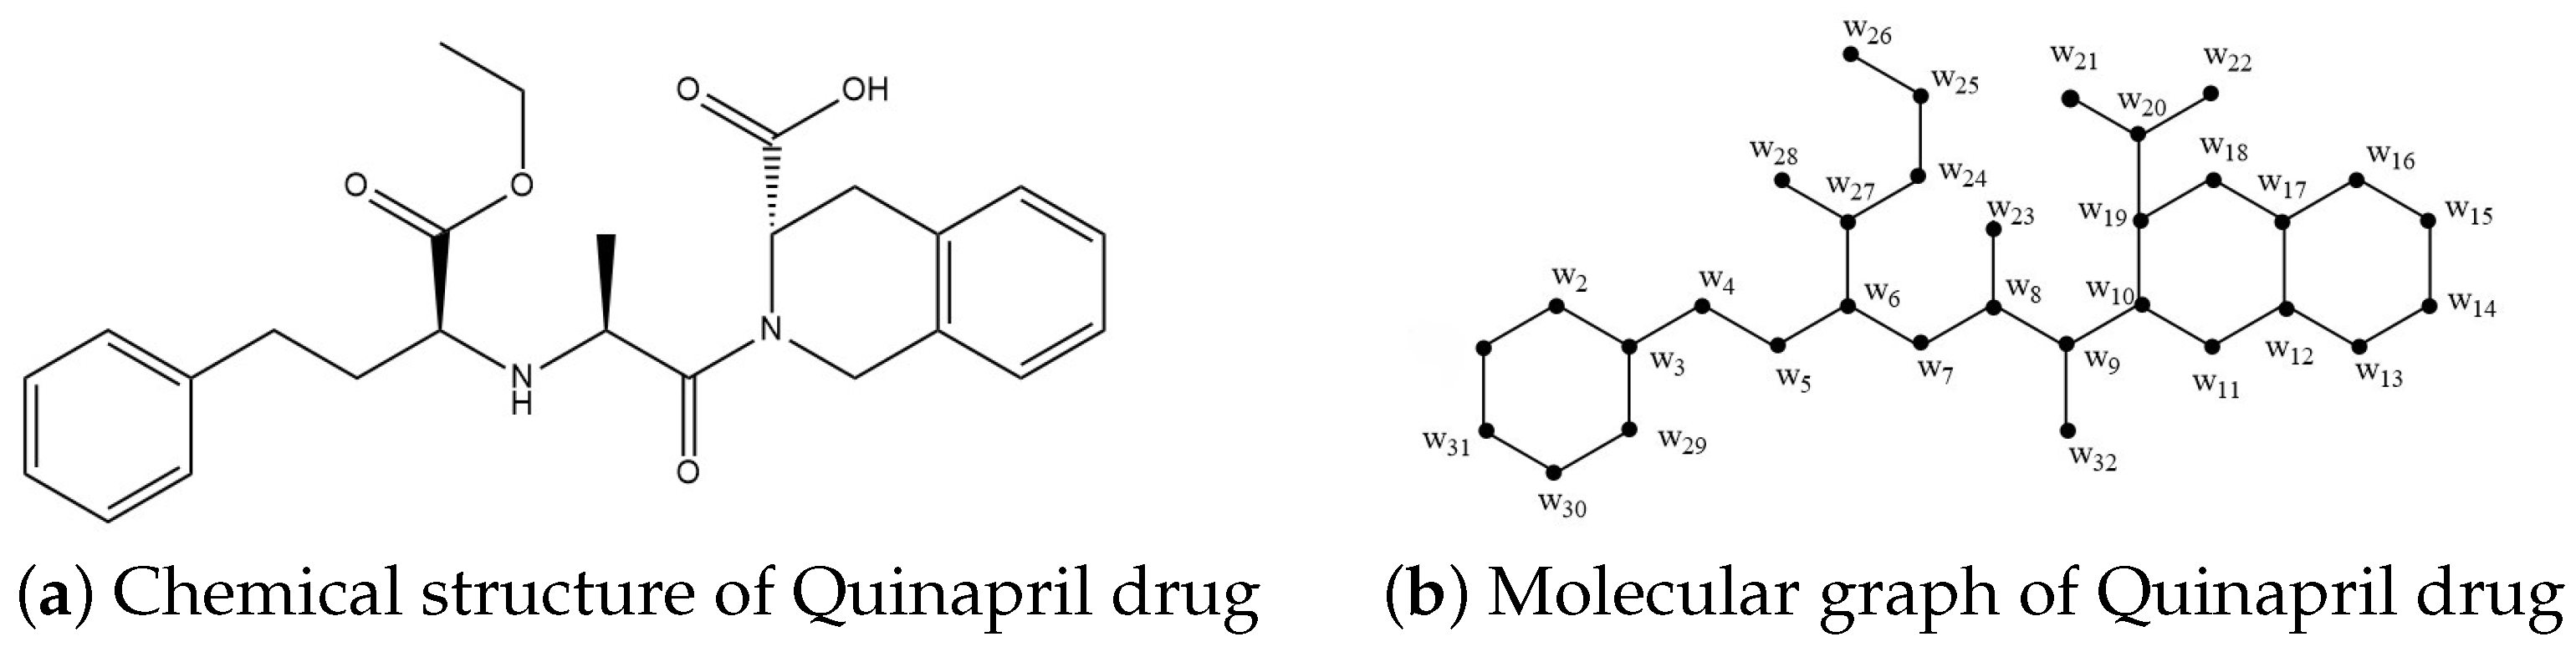
The bond and vertex sets in the chemical structure of Quinapril, an anti-heart attack drug, are shown here. The Quinapril structure has 32 nodes (vertices) and 35 bonds (edges). Figure 6b depicts the molecular graph of Quinapril and the labeling strategy utilized in our core observations. Reference [34] discusses topological aspects unique to this structure.
Figure 6.
Chemical structure and molecular graph of Quinapril drug.
Theorem 6.
Let depict the structure of Quinapril, an anti-myocardial infarction drug molecule. Thus, there are equal to three partition dimensions for .
Proof.
We compute that the partition dimension of the Quinapril heart attack medication structural graph is five. In order to support our assertion, we used a size of three partition-locating set, which is , where and . The authenticity of such assumption is guaranteed by the existence of accompanying figures that describe the position of each node within the Quinapril drug molecule, presented in Table 6.
Table 6.
Illustrations of nodes of with respect to .
The proposed partition-locating number is adequate since the unique node positions in the Quinapril graph structure adhere to the requirements of the desired partition-locating set. This effective construction gives us the upper bound, which is . Eventually, in order to validate the proof, we need to demonstrate that as well. As it is well established that if and only if is a path, we conclude that . Establishing the lower bound ensures that the partition dimension is exactly . □
4. Structural Analysis of Anti-Heart Attack Drugs Using GNN and DNN Models
In this study, we integrated outputs from a graph neural network (GNN) and applied a deep neural network (DNN) to analyze training performance metrics, regression analysis, and error histograms. The following discussion delves into these results, examining the model’s training effectiveness, regression accuracy, and error distribution to assess overall performance.
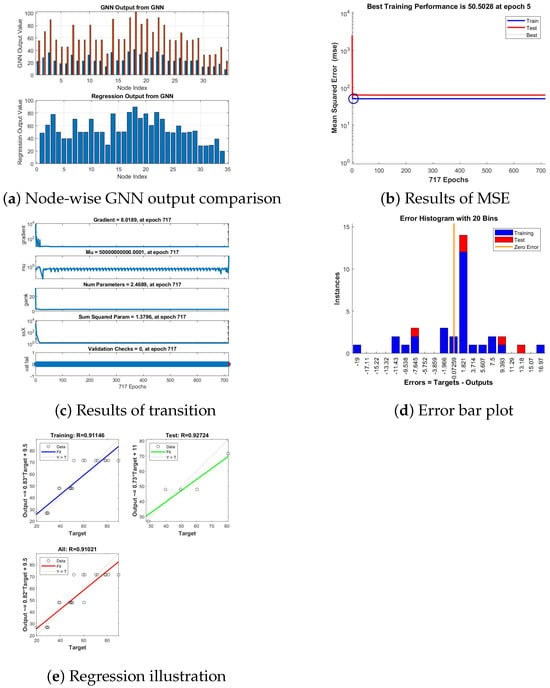
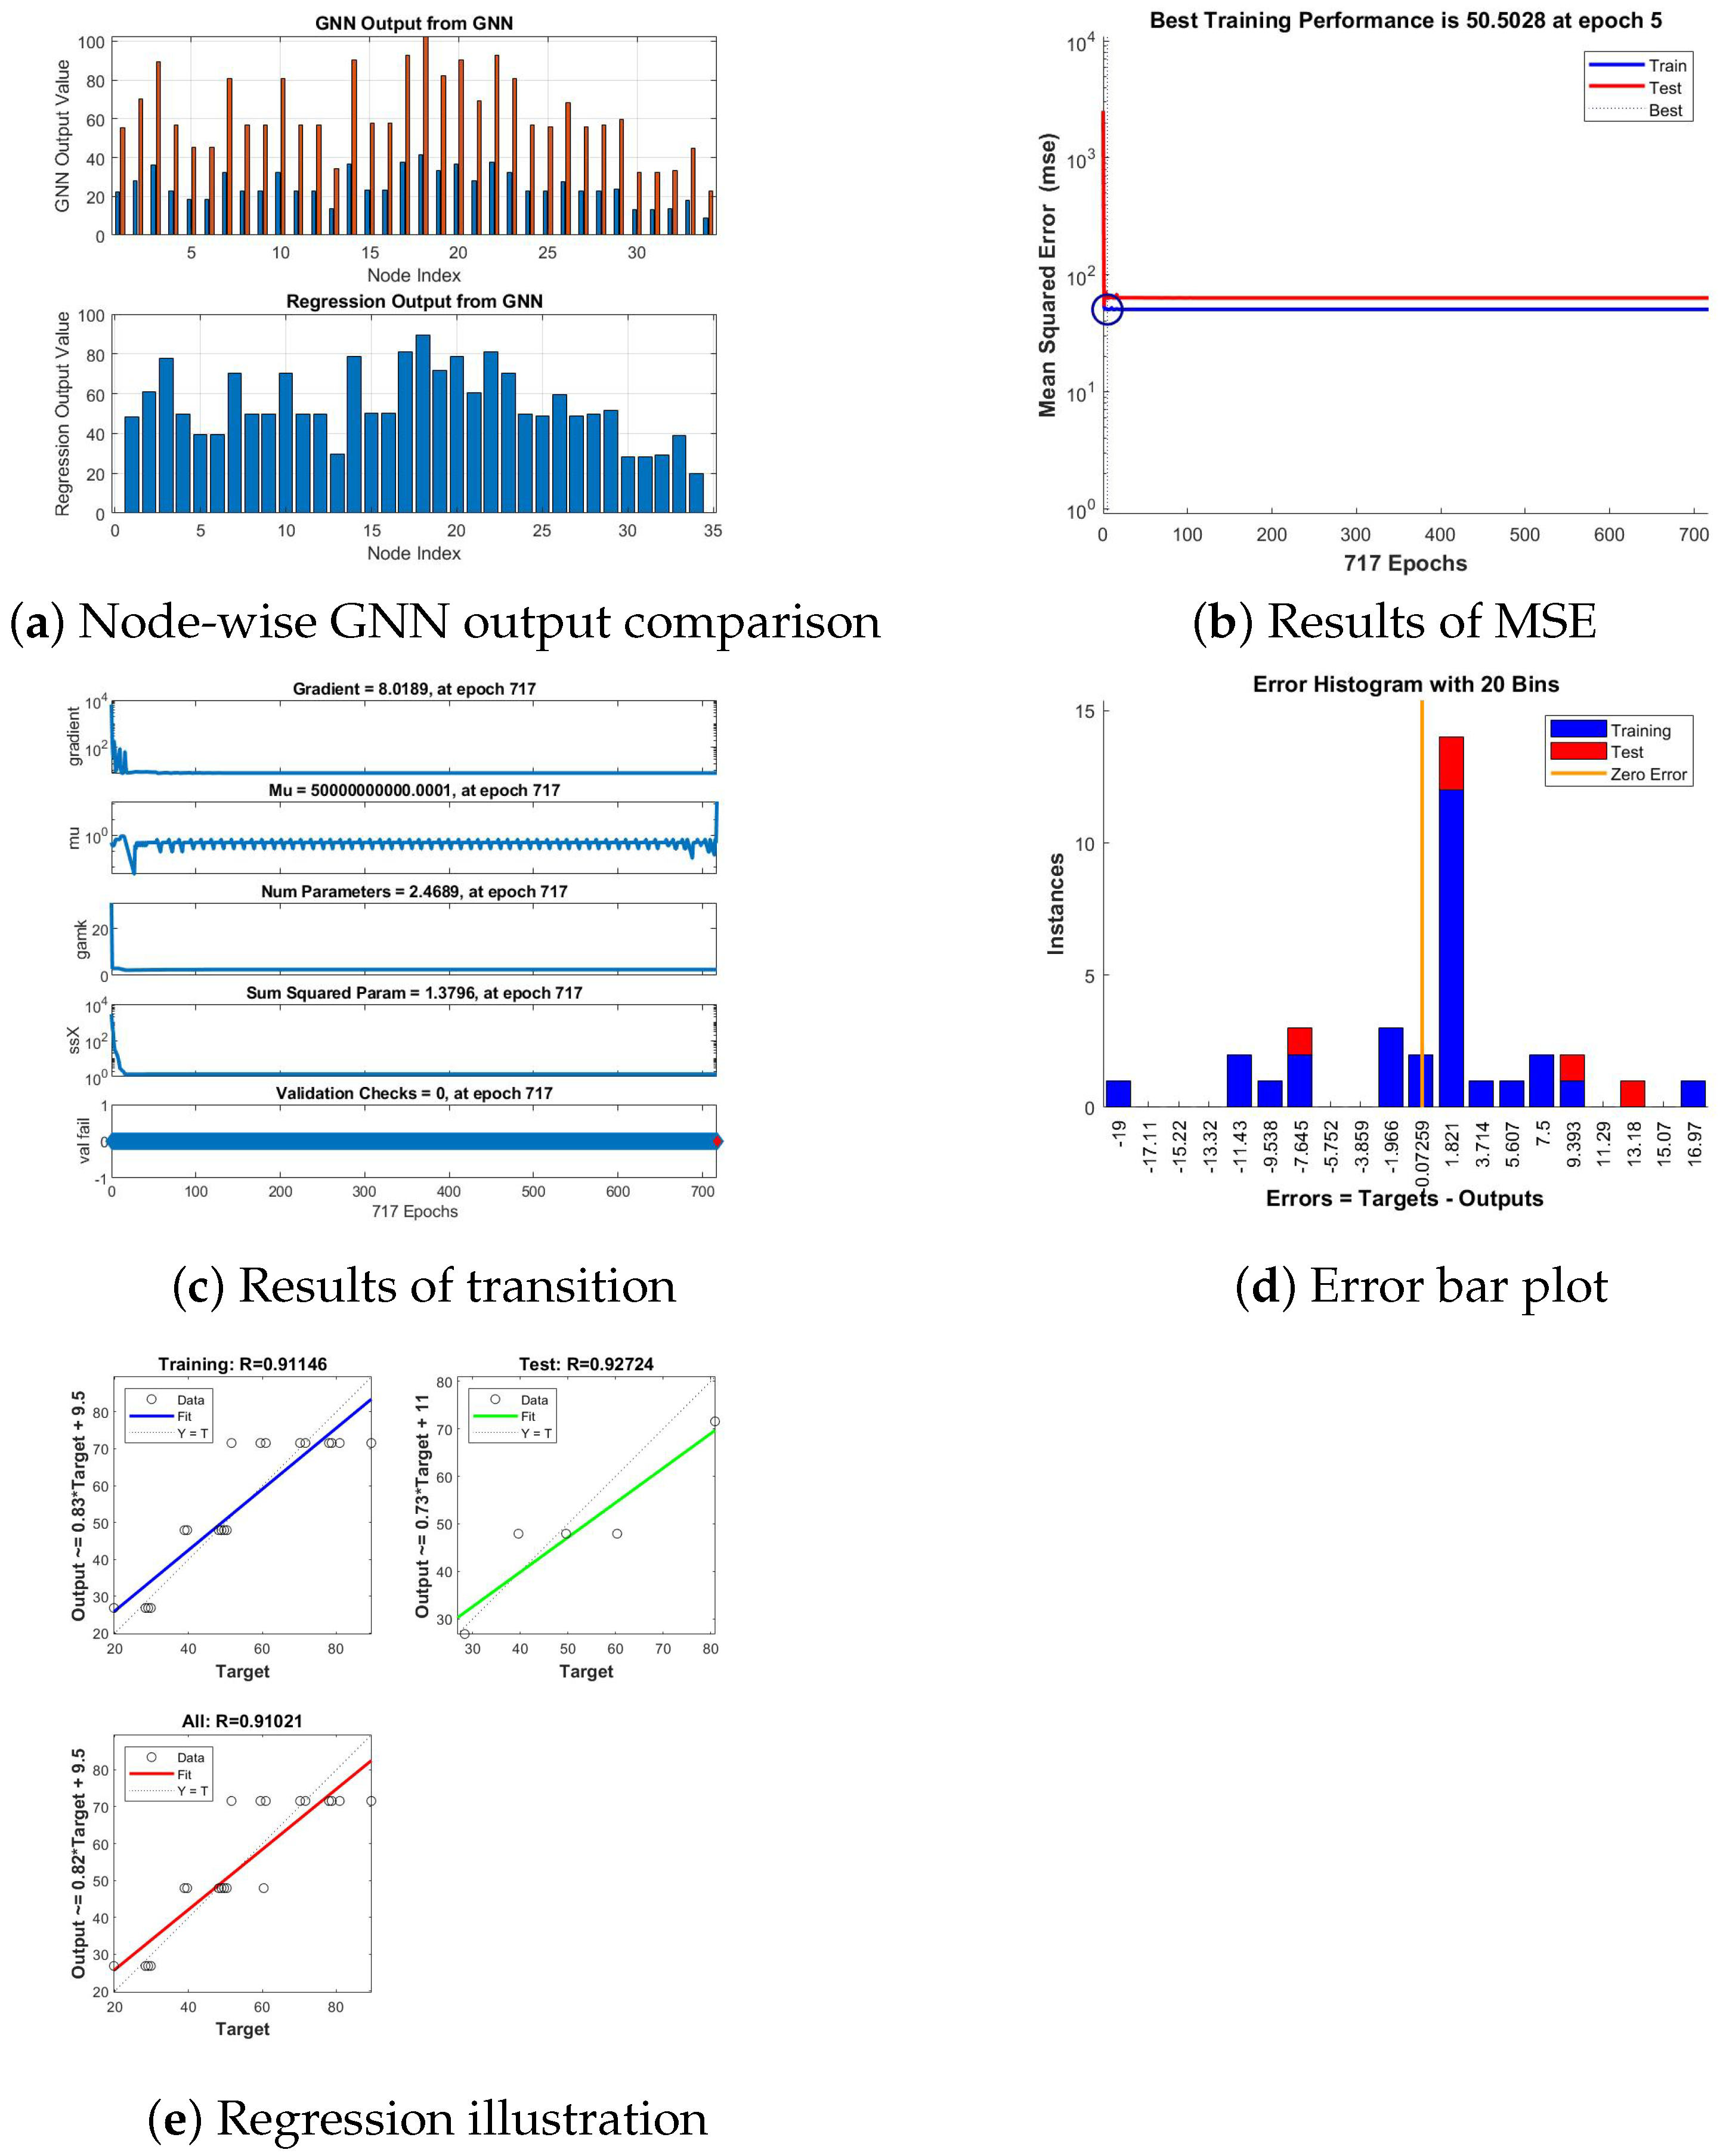
Figure 7 depicts the visual description of training progress and performance results for the Apixaban anti-heart attack drug. Figure 7a illustrates the results from a GNN model trained using the partition dimension of a graph representing a drug structure as input. In the top plot, the GNN output (in red) is compared with the expected or target values (in blue) across different nodes, and the bottom plot shows the regression output from the GNN, indicating how well the model’s predictions generalize. In Figure 7b, the performance graph shows the lowest training MSE of 50.5028 at epoch 5, highlighting a rapid convergence. The close alignment of training and test curves suggests that the model generalizes well. Consistency in error reduction indicates stability in learning across epochs. In Figure 7c, the training parameters indicate stable learning dynamics, with a final gradient of 8.0189 and consistent parameter values. Zero validation checks suggest no increase in validation loss. In Figure 7d, the error histogram indicates that training errors (blue) are densely concentrated near zero, reflecting a strong fit to the training data. Test errors (red), however, exhibit a wider dispersion, suggesting limited generalization. This spread may imply mild overfitting, which could benefit from further model refinement. In Figure 7e, regression plots show high correlation coefficients (R = 0.91146 for training, 0.92724 for testing), demonstrating a strong relationship between predicted and actual values. The combined R = 0.91021 further validates the model’s effectiveness. Slight deviations from the ideal line suggest areas for fine-tuning to improve accuracy.
Figure 7.
Visual description of training progress and performance results for Apixaban anti-heart attack drug.
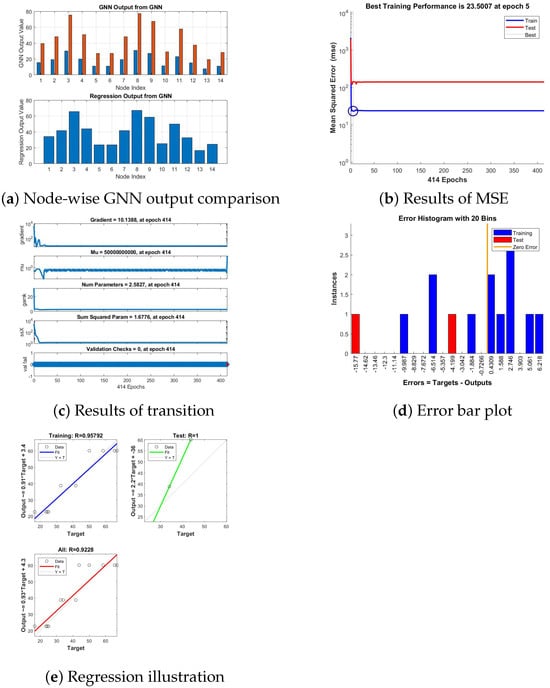
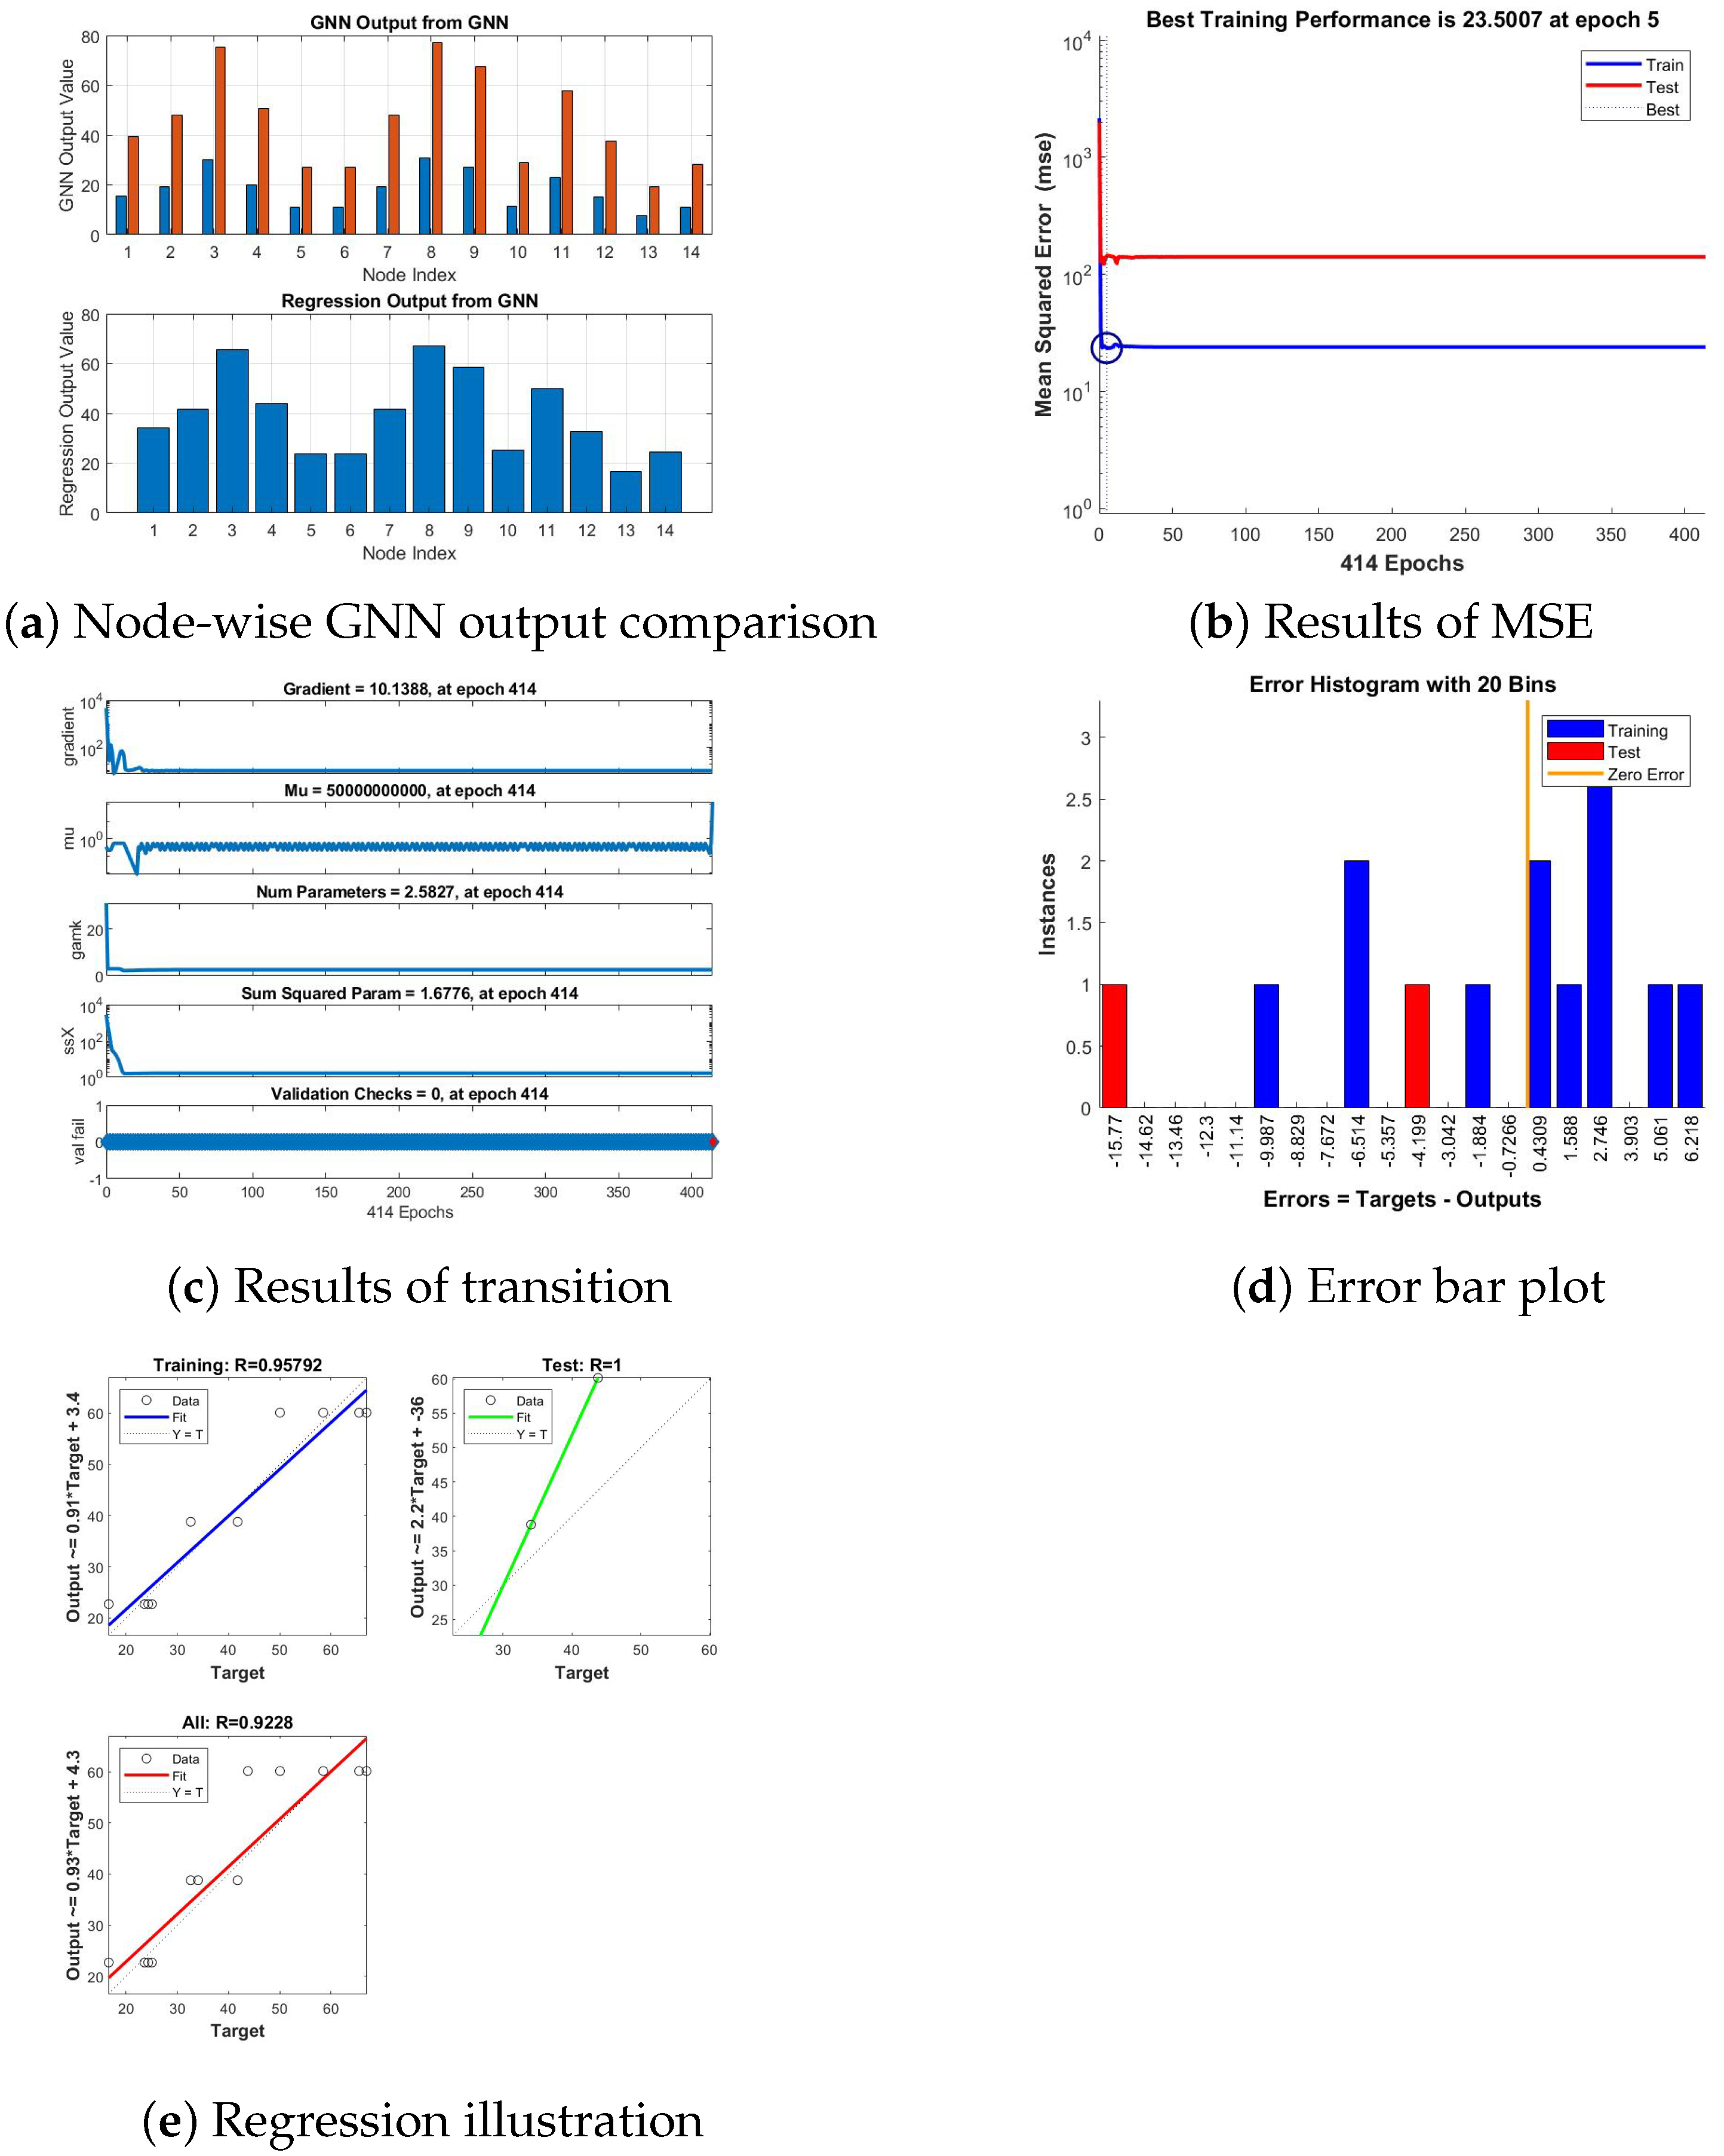
Figure 8 depicts the visual description of training progress and performance results for the Captopril anti-heart attack drug. Figure 8a illustrates the results from a GNN model trained using the partition dimension of a graph representing a drug structure as input. In the top plot, the GNN output (in red) is compared with the expected or target values (in blue) across different nodes, and the bottom plot shows the regression output from the GNN, indicating how well the model’s predictions generalize. In Figure 8b, the best training performance, achieved at epoch 5 with a mean squared error of 23.5007, indicates rapid convergence of the model during training. This suggests the optimization process effectively minimized the error within a few epochs. The early achievement of optimal performance highlights the efficiency of the training algorithm and the suitability of the model’s configuration. In Figure 8c, the training parameters indicate stable learning across 414 epochs, with a gradient of 10.1388. No validation failures were recorded, suggesting consistent performance. Further adjustments may lower the gradient for improved convergence. In Figure 8d, the error histogram shows training errors (blue) tightly clustered near zero, indicating a good fit to the training data. However, test errors (red) are more dispersed, highlighting potential generalization issues. This suggests the need for further optimization to reduce overfitting. In Figure 8e, regression results reveal exceptional model performance. The training dataset achieved an R-value of 0.95792, indicating a very strong correlation between predictions and targets. The test dataset achieved a perfect R-value of 1, reflecting flawless predictions on unseen data, while the overall R-value of 0.9228 confirms the model’s robustness and generalization capability across all data.
Figure 8.
Visual description of training progress and performance results for Captopril anti-heart attack drug.
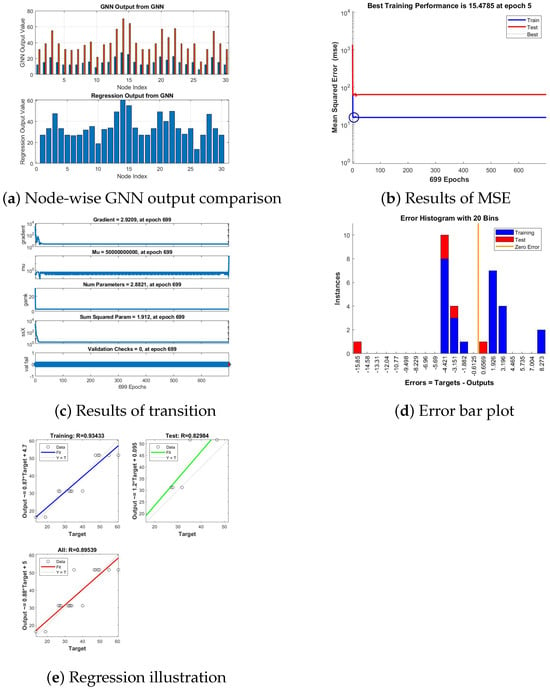
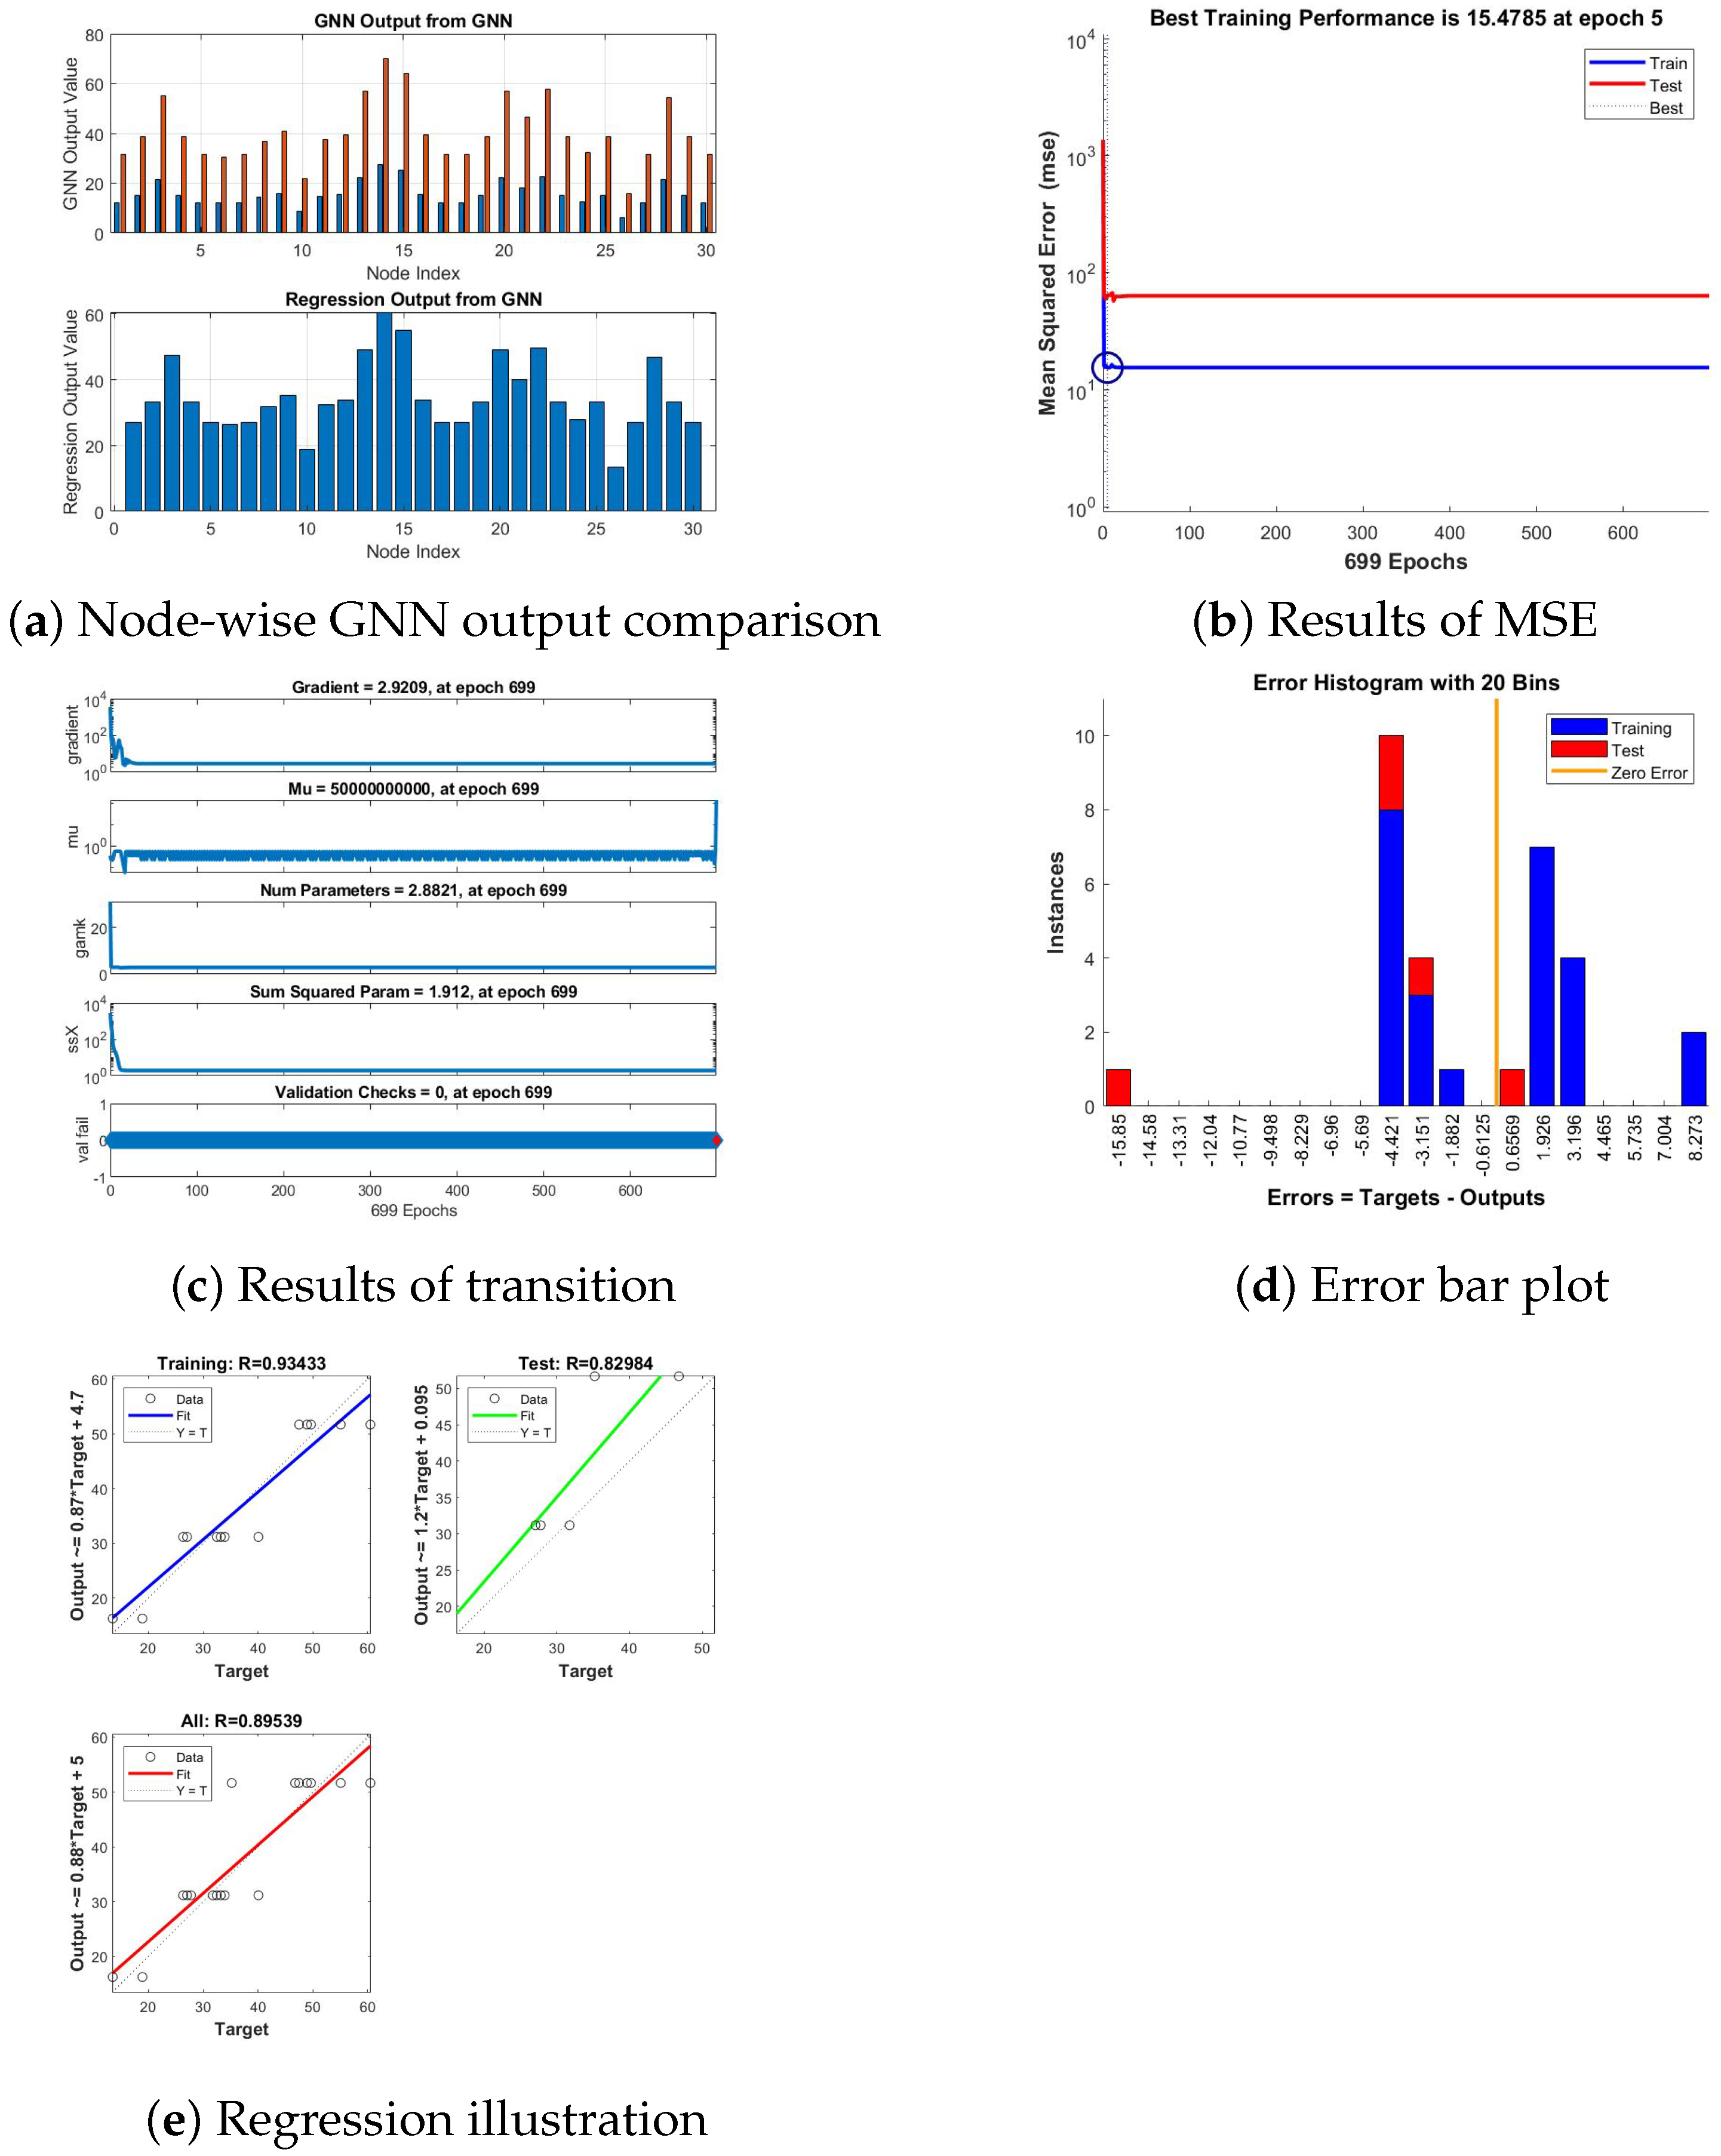
Figure 9 depicts the visual description of training progress and performance results for the Carvedilol anti-heart attack drug. Figure 9a illustrate the results from a GNN model trained using the partition dimension of a graph representing a drug structure as input. In the top plot, the GNN output (in red) is compared with the expected or target values (in blue) across different nodes, and the bottom plot shows the regression output from the GNN, indicating how well the model’s predictions generalize. In Figure 9b, the MSE graph indicates the best training performance at 15.4785, achieved at epoch 5. Training and test errors stabilize after the initial epochs, with the test error being consistently higher. This gap points to potential underfitting or a need for enhanced feature learning. In Figure 9c, training parameters reflect stable learning, with a low gradient of 2.9209 at epoch 699. The lack of validation checks confirms minimal overfitting, as validation loss did not increase. Constant values for Mu and other metrics highlight robust parameter tuning. In Figure 9d, the error histogram shows training errors (blue) tightly clustered around zero, signifying a good model fit. Test errors (red), however, display greater dispersion, suggesting some limitations in generalization. Further optimization or regularization might help to reduce test error variability. In Figure 9e, the regression results demonstrate a training correlation coefficient of 0.93433, indicating strong agreement between predictions and targets during training. The test correlation of 0.82984, though slightly lower, reflects adequate model generalization to unseen data. The overall correlation of 0.89539 underscores the model’s capability to capture the underlying patterns in the dataset effectively.
Figure 9.
Visual description of training progress and performance results for Carvedilol anti-heart attack drug.
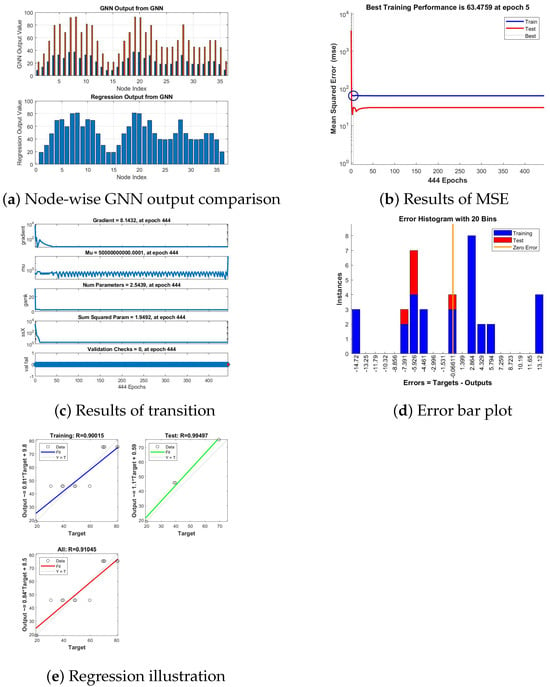
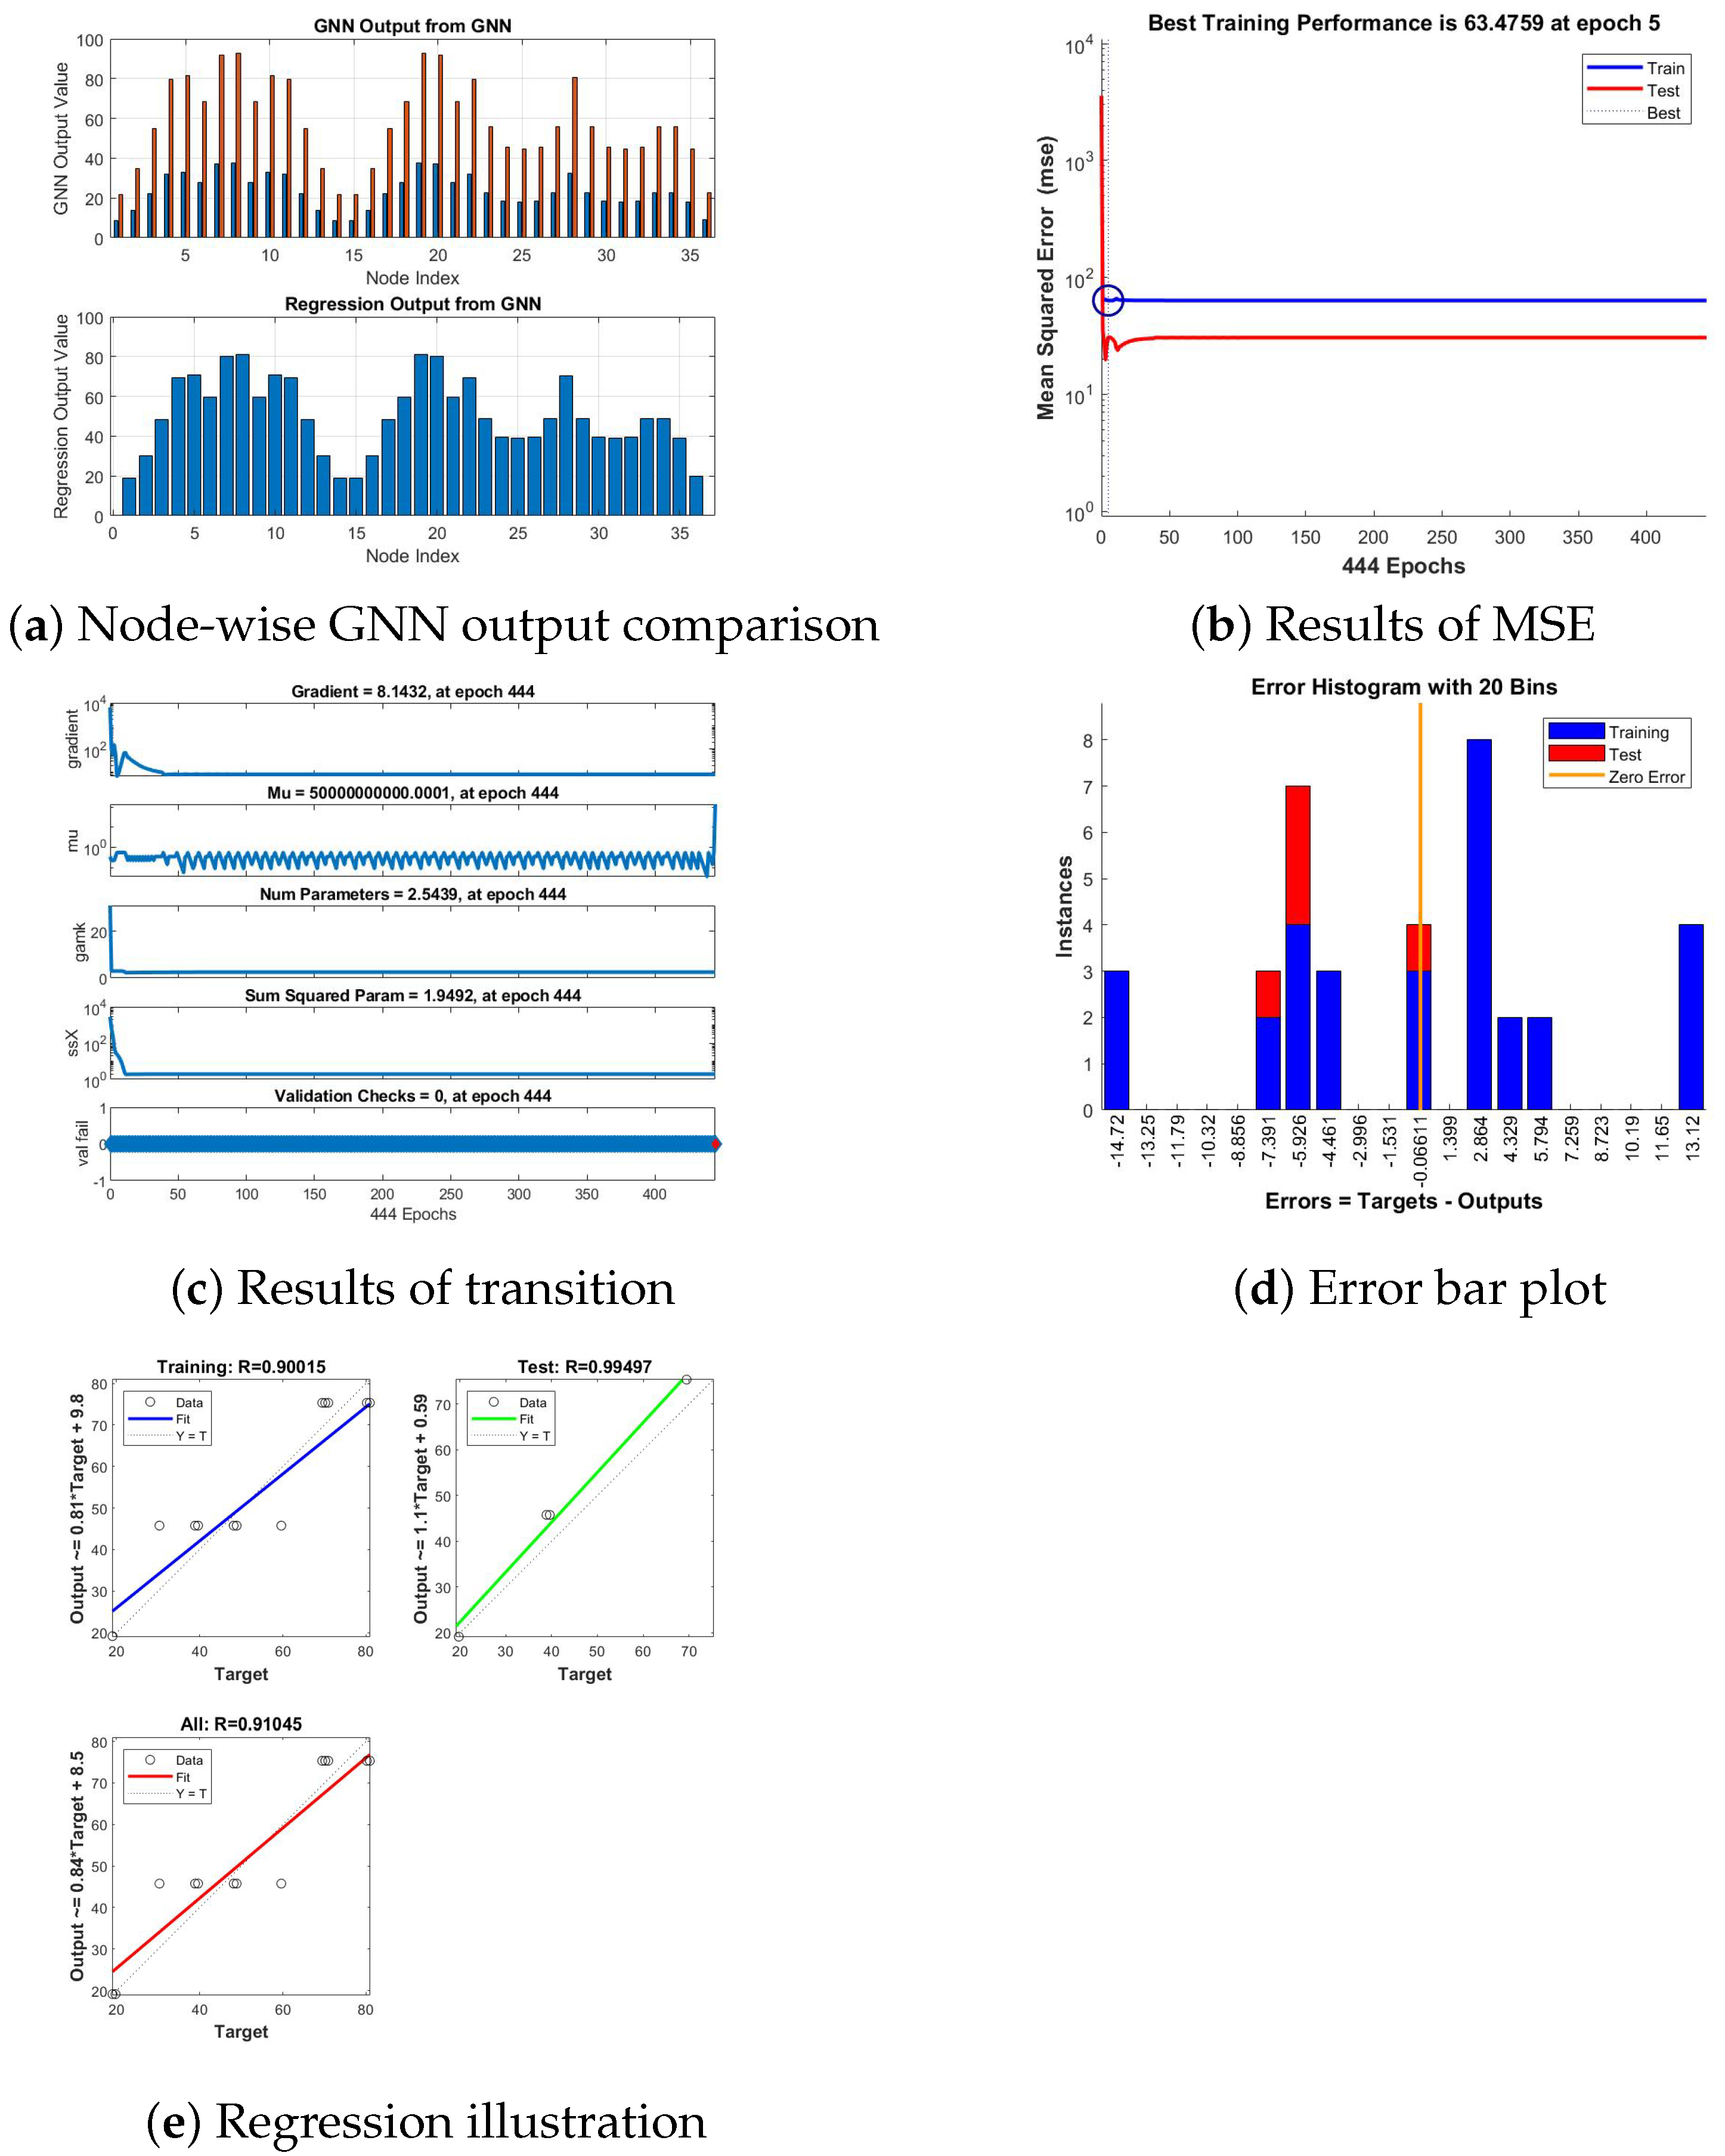
Figure 10 depicts the visual description of training progress and performance results for the Dipyridamole anti-heart attack drug. Figure 10a illustrates the results from a GNN model trained using the partition dimension of a graph representing a drug structure as input. In the top plot, the GNN output (in red) is compared with the expected or target values (in blue) across different nodes, and the bottom plot shows the regression output from the GNN, indicating how well the model’s predictions generalize. In Figure 10b, the MSE graph shows the best training performance at 63.4759, achieved at epoch 5. Training and test errors stabilize over 444 epochs, with a consistent gap favoring test performance. This indicates the model generalizes well but might benefit from tuning to reduce the gap. In Figure 10c, training parameters remain stable, with a gradient of 8.1432 at epoch 444, indicating smooth convergence. Constant Mu values and stable metrics suggest effective training without significant oscillations. The absence of validation failures further confirms minimal overfitting throughout the process. In Figure 10d, the error histogram shows that training errors (blue) are closely centered near zero, indicating a good model fit. Test errors (red), however, are more spread, suggesting some generalization challenges. The distribution indicates a need for further parameter tuning to reduce overfitting. In Figure 10e, regression results indicate a training correlation coefficient of 0.90015, showing a strong alignment between the model’s predictions and actual values during training. The test correlation of 0.99497 demonstrates excellent generalization performance on unseen data. An overall correlation of 0.91045 suggests that the model effectively captures the relationships in the dataset across both training and testing phases. The overall trend reflects a reasonable fit between targets and outputs.
Figure 10.
Visual description of training progress and performance results for Dipyridamole anti-heart attack drug.
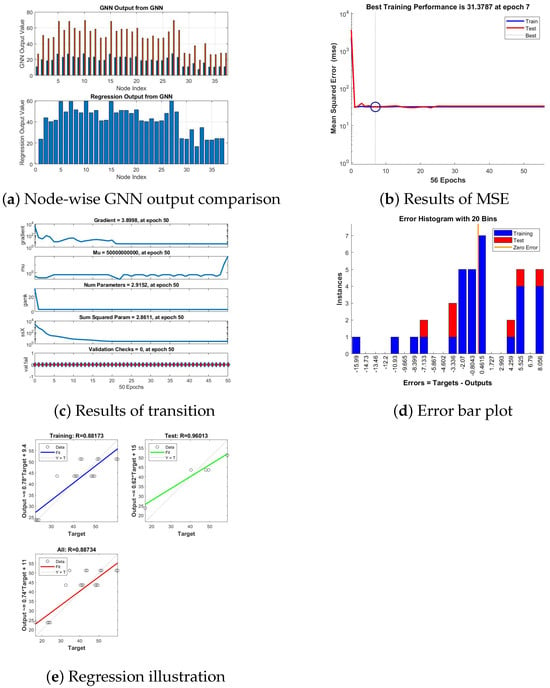
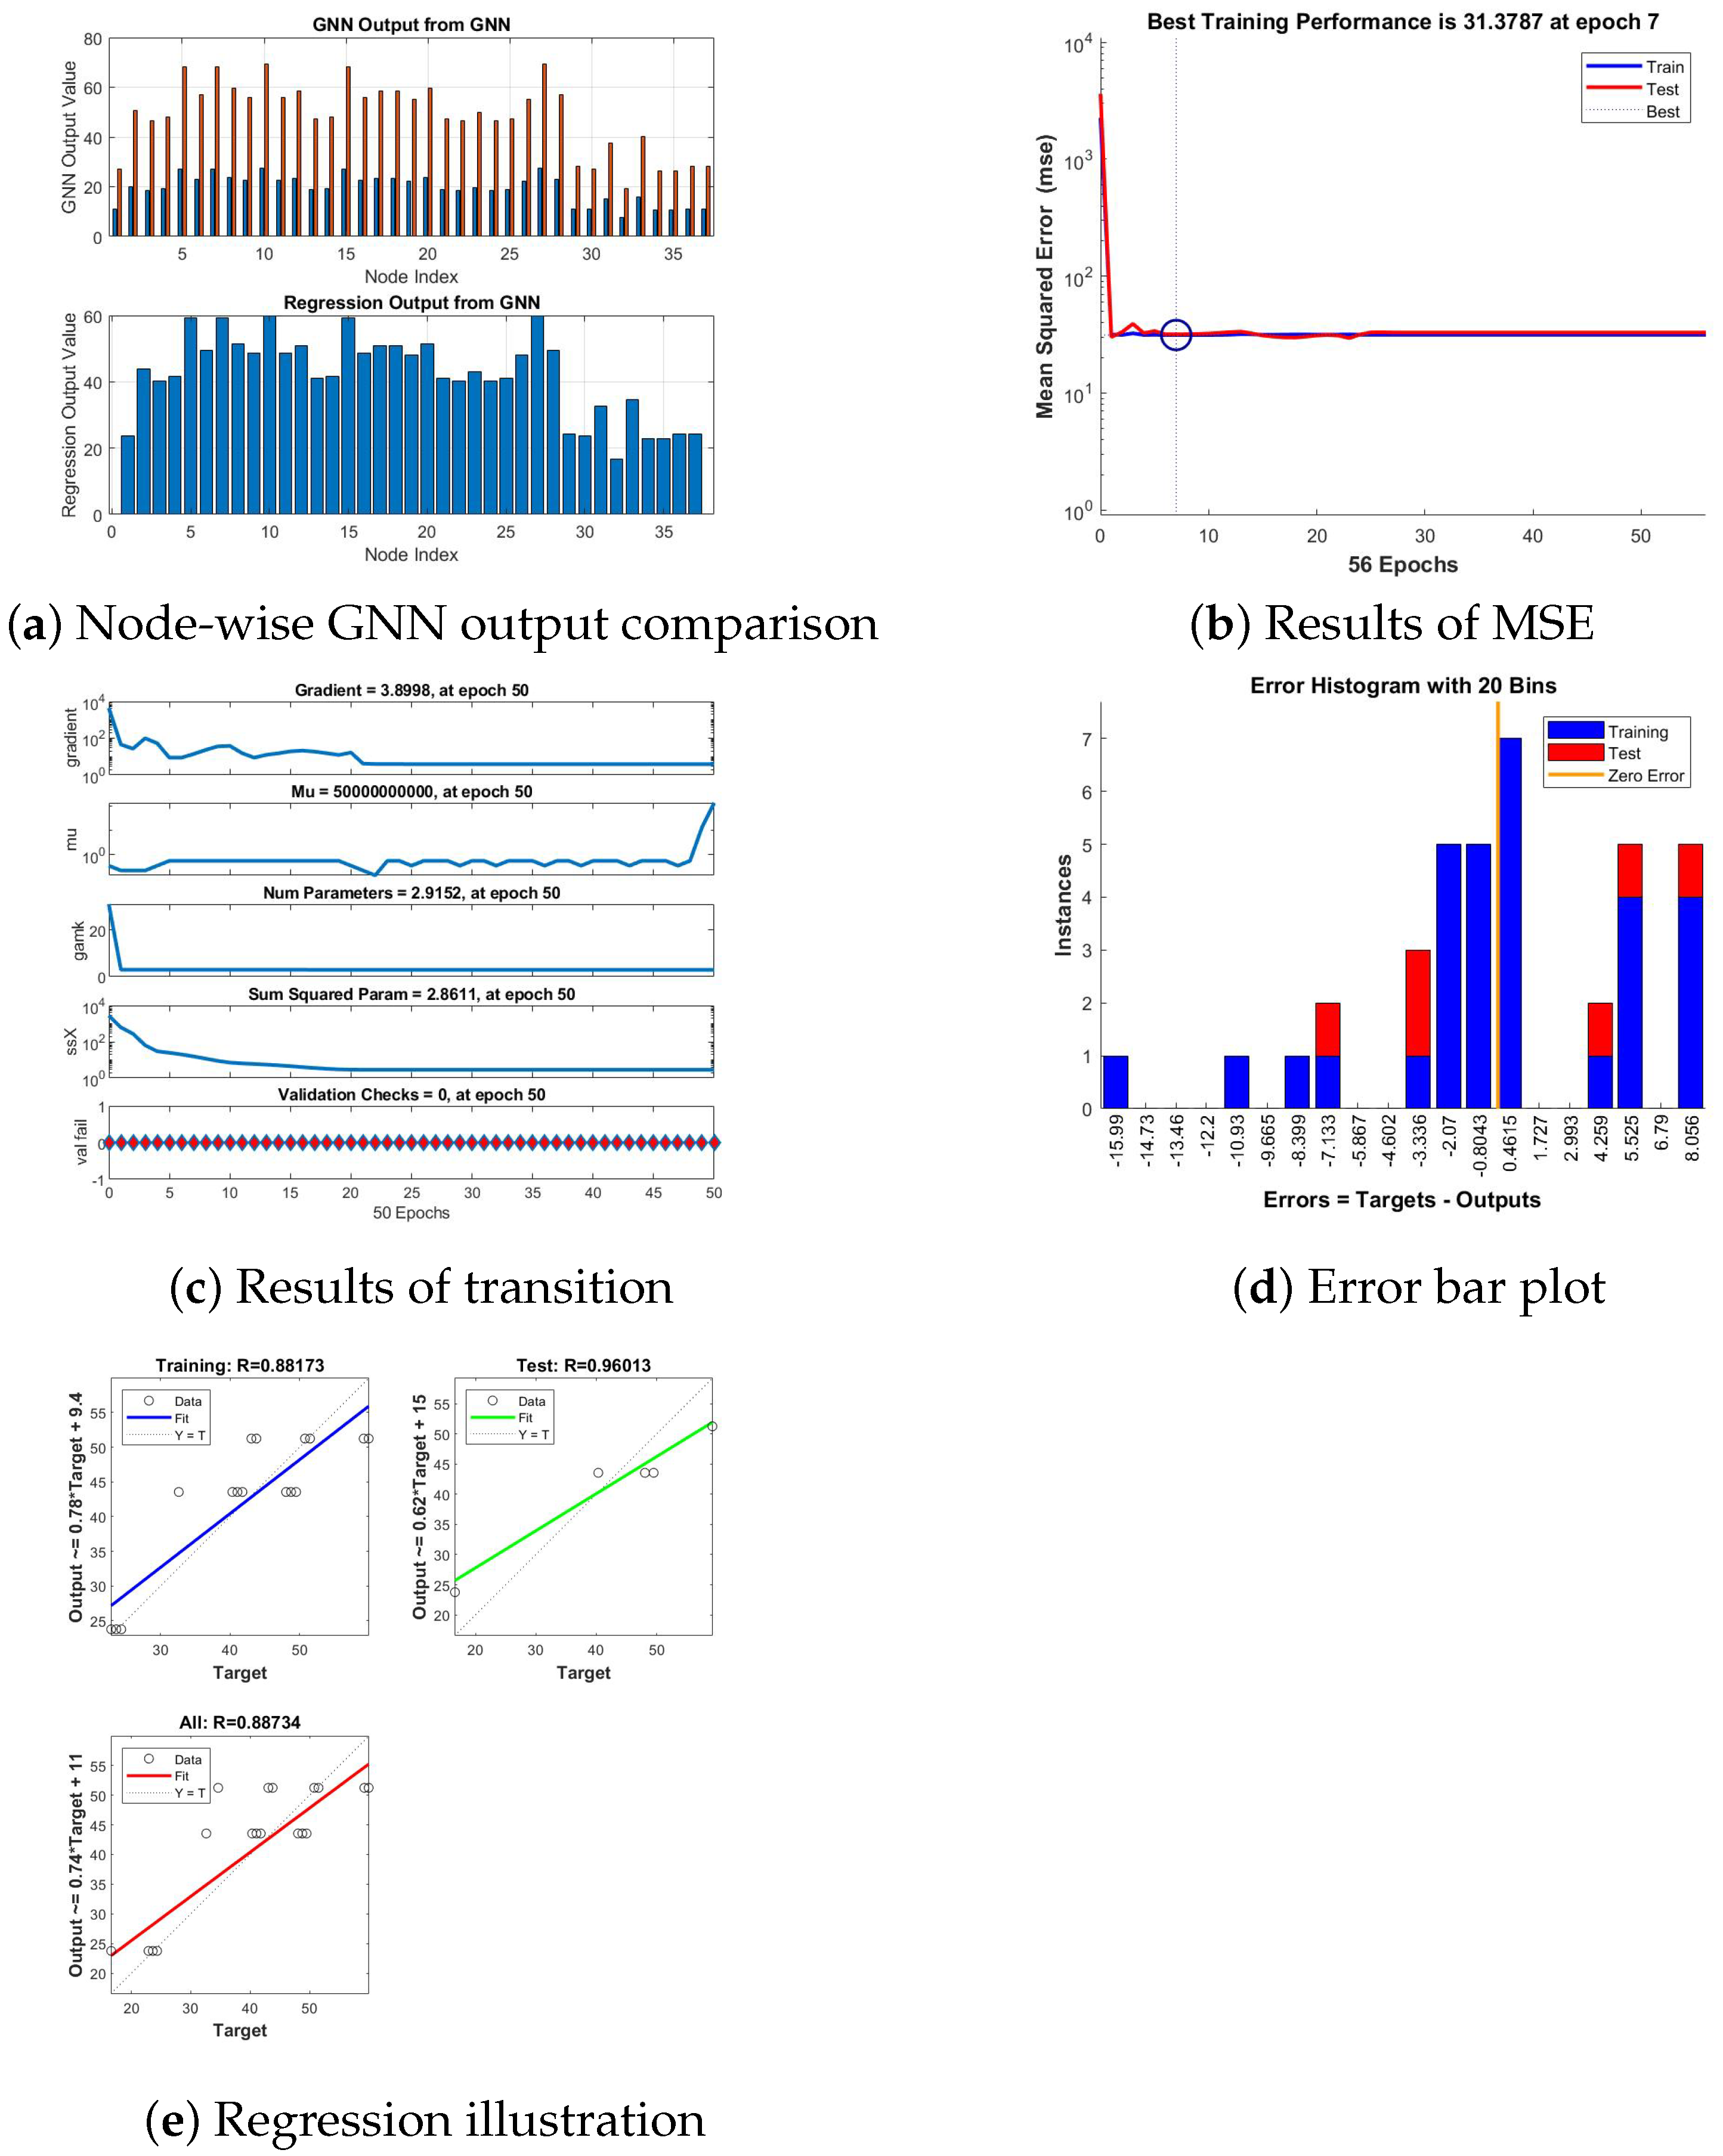
Figure 11 depicts the visual description of training progress and performance results for the Edoxaban anti-heart attack drug. Figure 11a illustrates the results from a GNN model trained using the partition dimension of a graph representing a drug structure as input. In the top plot, the GNN output (in red) is compared with the expected or target values (in blue) across different nodes, and the bottom plot shows the regression output from the GNN, indicating how well the model’s predictions generalize. In Figure 11b, the best training performance was recorded at a specific epoch, reflecting optimal tuning and minimal overfitting across training iterations. In Figure 11c, gradual declines in gradients and stable parameter values underscore a well-optimized model free from significant divergence. In Figure 11d, errors are centered closer to zero for training and test sets, indicating well-calibrated model predictions with minimal deviations. In Figure 11e, regression plots reveal high RRR-values for training and testing, supporting robust predictive performance.
Figure 11.
Visual description of training progress and performance results for Edoxaban anti-heart attack drug.
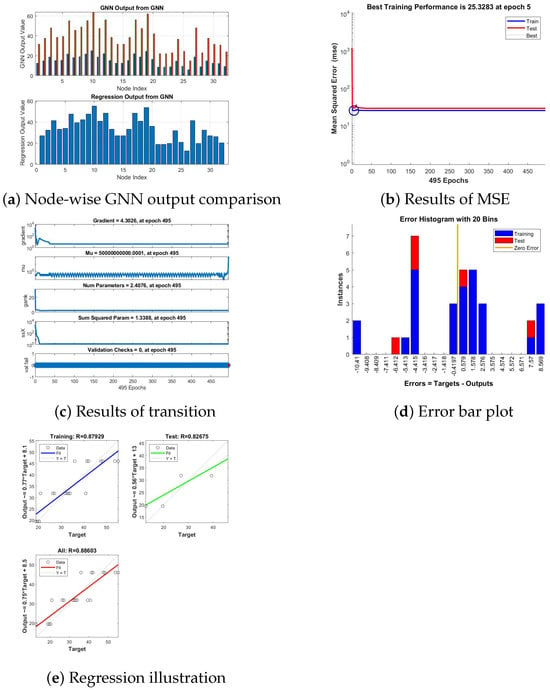
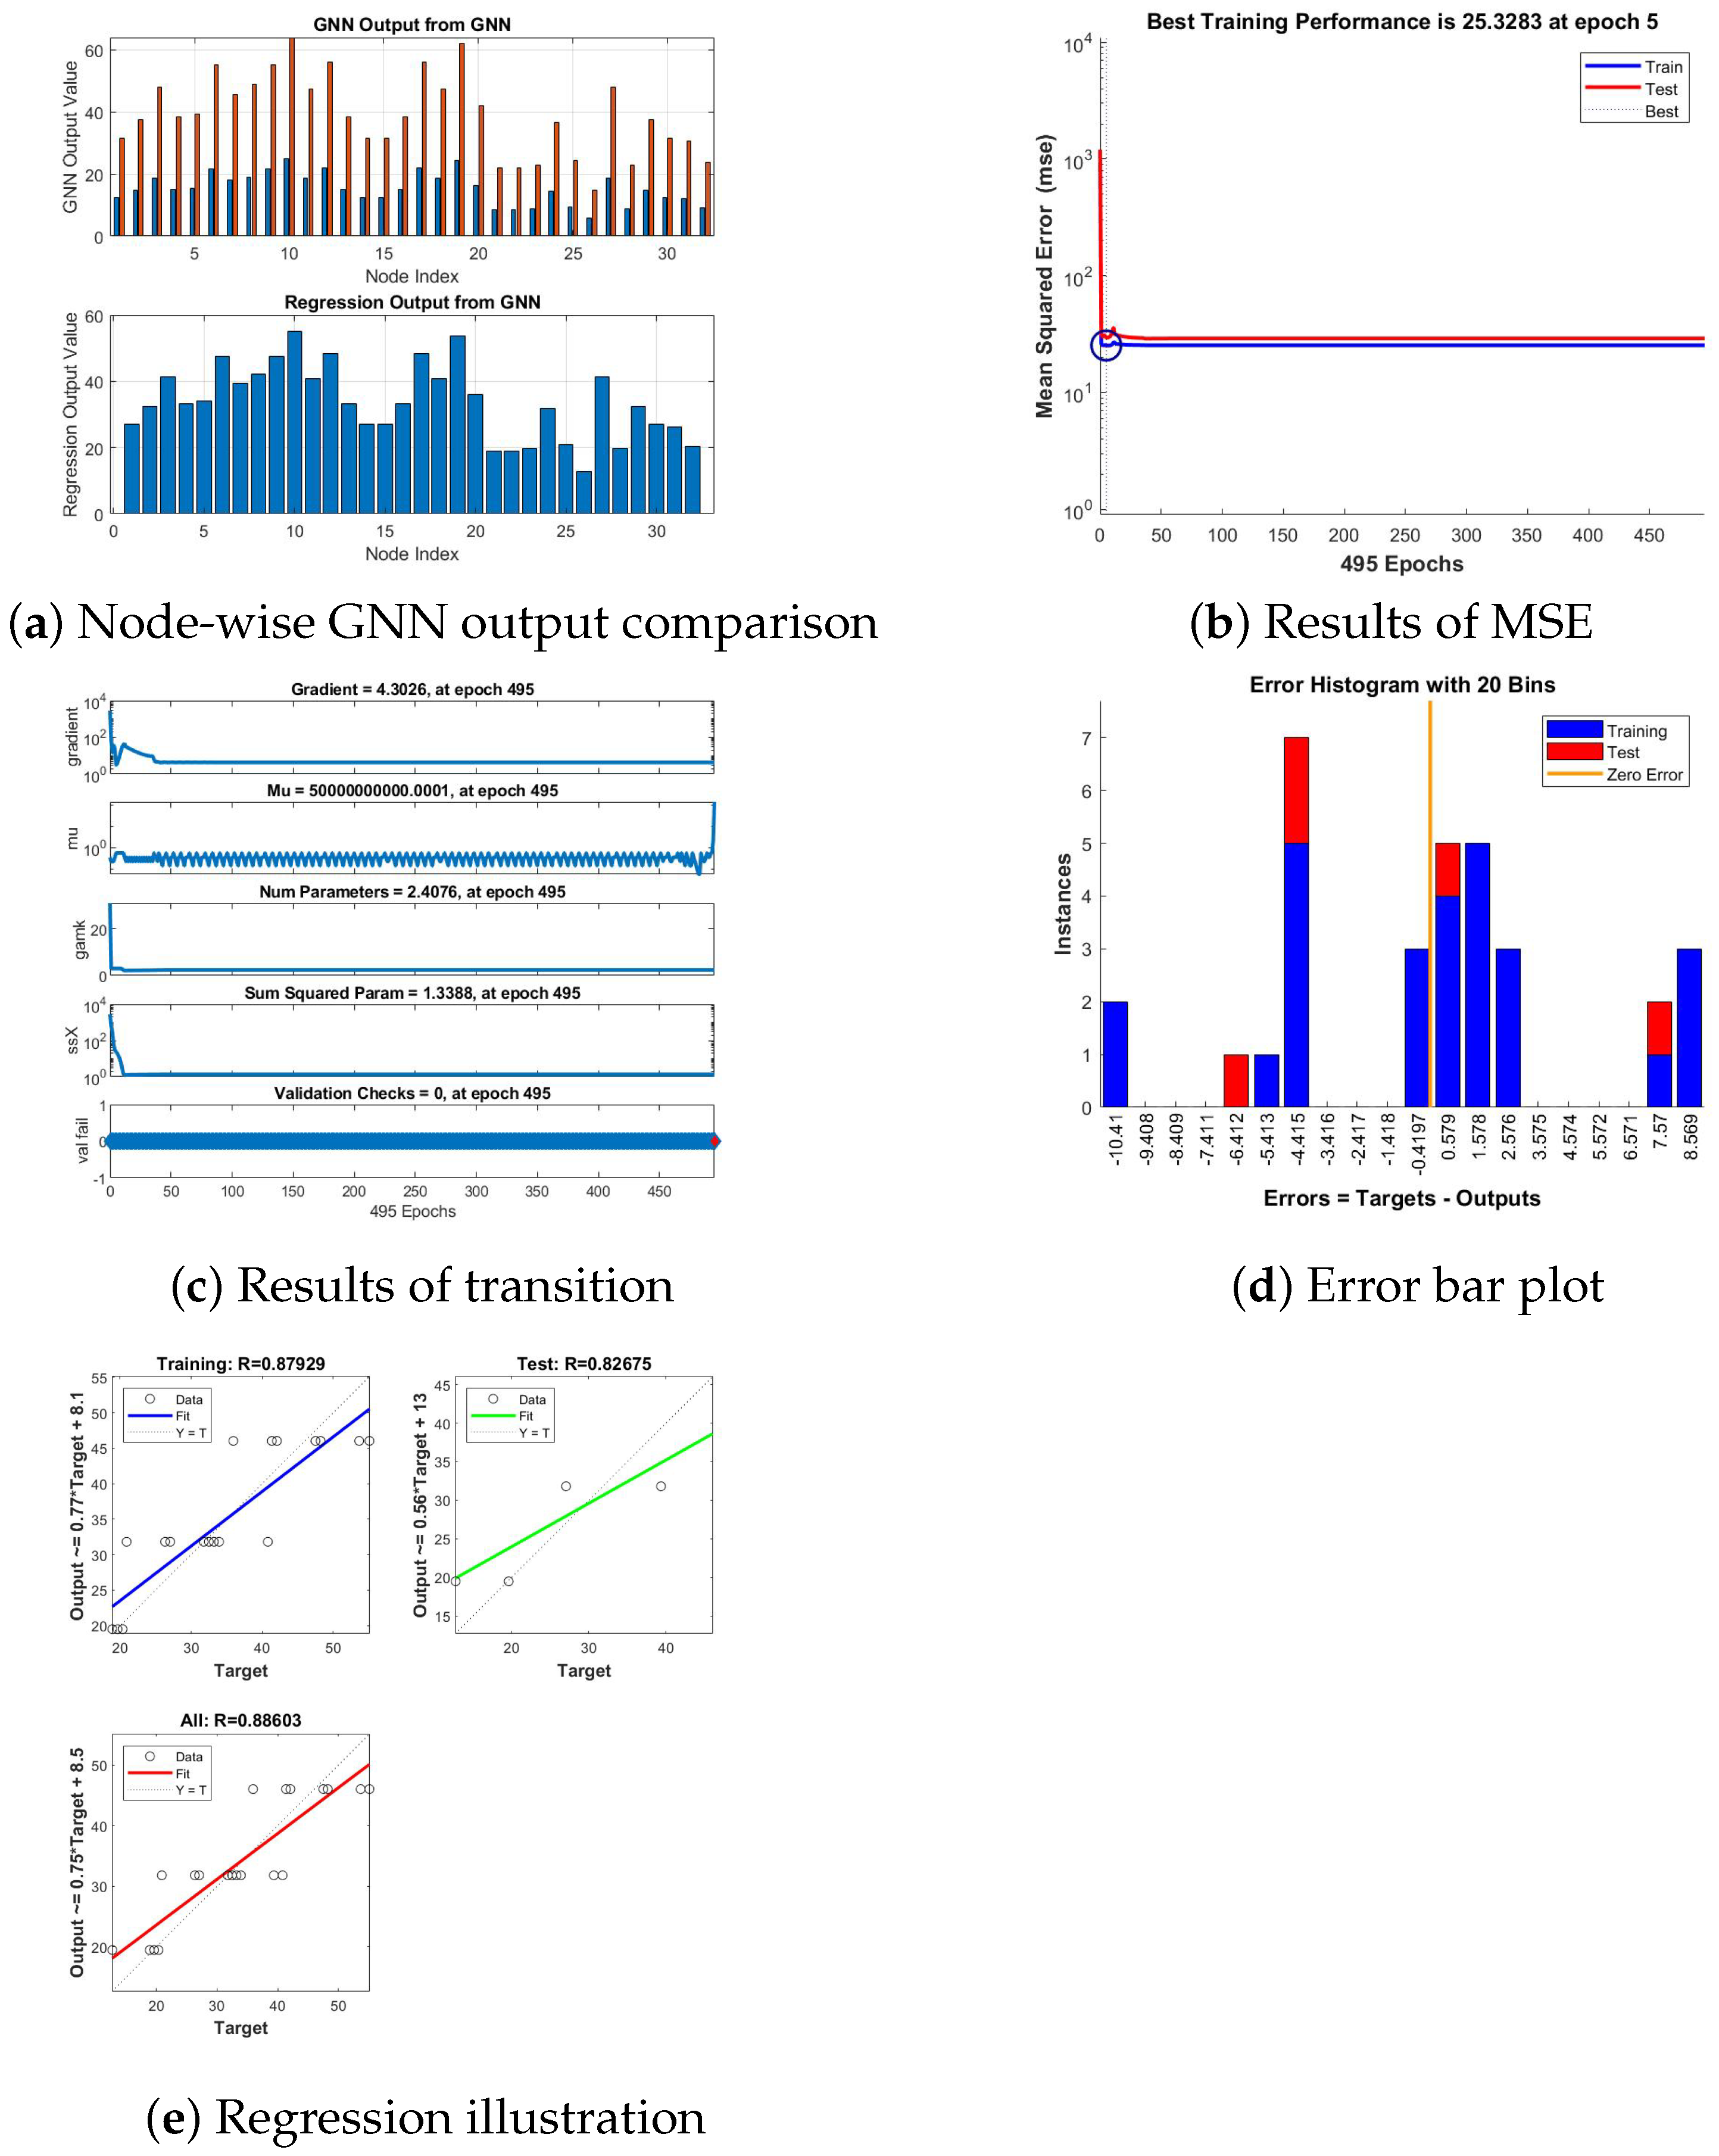
Figure 12 depicts the visual description of training progress and performance results for the Quinapril anti-heart attack drug. Figure 12a illustrates the results from a GNN model trained using the partition dimension of a graph representing a drug structure as input. In the top plot, the GNN output (in red)is compared with the expected or target values (in blue) across different nodes, and the bottom plot shows the regression output from the GNN, indicating how well the model’s predictions generalize. In Figure 12b, the MSE rapidly decreases, achieving the best training performance of 25.3283 at epoch 5. The close alignment between training and test curves indicates good generalization and effective learning. In Figure 12c, the final gradient is 4.3026, with a stable Mu and no validation checks, suggesting consistent learning and minimal overfitting. In Figure 12d, training errors (blue) are concentrated near zero, indicating a good fit. Test errors (red) are more dispersed, suggesting limited generalization and potential overfitting. In Figure 12e, regression results show strong training performance (R = 0.87929) and moderate test performance (R = 0.82675). The overall R = 0.88603 indicates balanced model accuracy. Test predictions could be further improved.
Figure 12.
Visual description of training progress and performance results for Quinapril anti-heart attack drug.
5. Conclusions
This study contributes to pharmaceutical science by changing the chemical structures of anti-myocardial infarction drugs into molecular graphs, where atoms and chemical bonds are characterized as nodes and edges, respectively. To compute the graph-theoretic partition dimension of these molecular graphs, advanced neural network techniques, specifically graph neural networks (GNNs) and deep neural networks (DNNs), are adopted. A key emphasis of this research was to compute the partition dimension of various anti-myocardial infarction medications, such as Rivaroxaban, Ticagrelor, Apixaban, Aspirin, Atenolol, Candesartan, Captopril, Carvedilol, Dipyridamole, Edoxaban, Quinapril, Ramipril, and Warfarin. This graph-theoretical metric provides a topological descriptor for molecular complexity, which may correlate with physical properties relevant to drug behavior. Our computed results reveal that the partition dimensions of Carvedilol and Quinapril are both equal to 3. Upper bounds for the partition dimensions of Rivaroxaban, Ticagrelor, Aspirin, Atenolol, Candesartan, Captopril, and Edoxaban are ≤4; for Apixaban, Dipyridamole, Ramipril, and Warfarin, they are ≤5. In addition, this investigation supports the topological analysis of drug molecules and computational modeling by integrating artificial neural network applications into pharmaceutical research.
Moreover, an integrated analysis of GNNs and DNNs was conducted to compute the partition dimension of the selected anti-myocardial infarction drugs. GNNs were adopted to create topological and molecular connection features from the drug structures, which were then input into the DNN model. Further, DNNs processed these features to estimate the partition dimension, evaluating training performance, conducting regression analysis, and yielding error histograms. This combined approach permits a comprehensive valuation of the model’s effectiveness in apprehending the structural characteristics of drug molecules. The outcomes are explicated in detail, focused on prediction accuracy, error distributions, and regression results. By integrating molecular graph structures and machine learning, this research establishes a method for computing a structural index, contributing to the graph-theoretic characterization of drugs.
Finally, this study demonstrates the potential of combining DNN and GNN architectures for computing topological indices in pharmacological modeling. Future work in drug design and optimization may leverage such computational methods for the structural analysis of drug candidates. However, the current work is limited by the selection of drugs analyzed, the reliance on a purely topological model without atom-type differentiation, and the computational rather than experimental nature of the validation. Future studies should expand the dataset, incorporate atom- and bond-type features, and explore correlations with experimental physicochemical properties.
Author Contributions
All authors have contributed to the writing of this paper. All authors have accepted responsibility for the entire content of this manuscript and approved its submission. Methodology, Y.N.A.; software, S.A. and H.K.; data validation, S.A. and M.A.T.; formal analysis, H.K. and M.A.T.; investigation, Y.N.A.; resources, K.P. and M.A.T.; data curation, K.P.; writing—review and editing, K.P. All authors have read and agreed to the published version of the manuscript.
Funding
This work was not supported by any funding.
Data Availability Statement
Data are contained within the article.
Conflicts of Interest
The authors declare no conflicts of interest.
References
- Merritt, C.J.; De Zoysa, N.; Hutton, J.M. A qualitative study of younger men’s experience of heart attack (myocardial infarction). Br. J. Health Psychol. 2017, 22, 589–608. [Google Scholar] [CrossRef] [Scilit]
- National Heart, Lung, and Blood Institute, What Are the Signs and Symptoms of Heart Disease. NHLBI, 2014. Available online: https://www.nhlbi.nih.gov/health/coronary-heart-disease (accessed on 17 August 2025).
- Krueger, D.E.; Ellenberg, S.S.; Bloom, S.; Calkins, B.M.; Jacyna, R.; Nolan, D.C.; Phillips, R.; Rios, J.C.; Sobieski, R.; Shekelle, R.B.; et al. Risk factors for fatal heart attack in young women. Am. J. Epidemiol. 1981, 113, 357–370. [Google Scholar] [CrossRef] [Scilit] [PubMed]
- Davis, B.R.; Cutler, J.A.; Gordon, D.J.; Furberg, C.D.; Wright, J.T., Jr.; Cushman, W.C.; Grimm, R.H.; LaRosa, J.; Whelton, P.K.; Perry, H.M.; et al. Rationale and design for the hypertensive and lipid lowering treatment to prevent heart attack trial (ALLHAT). Am. J. Hypertens. 1996, 9, 342–360. [Google Scholar] [CrossRef] [Scilit] [PubMed]
- Ali, A.; Nazeer, W.; Munir, M.; Min Kang, S. M-polynomials and topological indices of zigzag and rhombic benzenoid systems. Open Chem. 2018, 16, 73–78. [Google Scholar] [CrossRef] [Scilit]
- Hayat, S.; Wang, S.; Liu, J.B. Valency-based topological descriptors of chemical networks and their applications. Appl. Math. Model. 2018, 60, 164–178. [Google Scholar] [CrossRef] [Scilit]
- Kavitha, S.R.J.; Abraham, J.; Arockiaraj, M.; Jency, J.; Balasubramanian, K. Topological characterization and graph entropies of tessellations of kekulene structures: Existence of isentropic structures and applications to thermochemistry, nuclear magnetic resonance, and electron spin resonance. J. Phys. Chem. A 2021, 125, 8140–8158. [Google Scholar] [CrossRef] [Scilit]
- Jamil, M.K.; Imran, M.; Abdul Sattar, K. Novel face index for benzenoid hydrocarbons. Mathematics 2020, 8, 312. [Google Scholar] [CrossRef] [Scilit]
- Nadeem, M.F.; Azeem, M.; Siddiqui, H.M.A. Comparative study of Zagreb indices for capped, semi-capped, and uncapped carbon nanotubes. Polycycl. Aromat. Compd. 2022, 42, 3545–3562. [Google Scholar] [CrossRef] [Scilit]
- Nadeem, M.F.; Imran, M.; Siddiqui, H.M.A.; Azeem, M.; Khalil, A.; Ali, Y. Topological aspects of metal-organic structure with the help of underlying networks. Arab. J. Chem. 2021, 14, 103157. [Google Scholar] [CrossRef] [Scilit]
- Ahmad, A.; Koam, A.N.; Siddiqui, M.H.F.; Azeem, M. Resolvability of the starphene structure and applications in electronics. Ain Shams Eng. J. 2022, 13, 101587. [Google Scholar] [CrossRef] [Scilit]
- Sebő, A.; Tannier, E. On metric generators of graphs. Math. Oper. Res. 2004, 29, 383–393. [Google Scholar] [CrossRef] [Scilit]
- Slater, P.J. Leaves of trees. Congr. Numer. 1975, 14, 37–49. [Google Scholar]
- Singh, P.; Sharma, S.; Sharma, S.K.; Bhat, V.K. Metric dimension and edge metric dimension of windmill graphs. AIMS Math. 2021, 6, 9138–9153. [Google Scholar] [CrossRef] [Scilit]
- Estrada-Moreno, A.; Yero, I.G.; Rodríguez-Velázquez, J.A. On the (k, t)-metric dimension of graphs. Comput. J. 2021, 64, 707–720. [Google Scholar] [CrossRef] [Scilit]
- Pirzada, S.; Aijaz, M. On graphs with same metric and upper dimension. Discret. Math. Algorithms Appl. 2021, 13, 2150015. [Google Scholar] [CrossRef] [Scilit]
- Imran, S.; Siddiqui, M.K.; Imran, M.; Hussain, M. On metric dimensions of symmetric graphs obtained by rooted product. Mathematics 2018, 6, 191. [Google Scholar] [CrossRef] [Scilit]
- Koam, A.N.; Ahmad, A.; Abdelhag, M.E.; Azeem, M. Metric and fault-tolerant metric dimension of hollow coronoid. IEEE Access 2021, 9, 81527–81534. [Google Scholar] [CrossRef] [Scilit]
- Liu, J.B.; Nadeem, M.F.; Azeem, M. Bounds on the partition dimension of convex polytopes. Comb. Chem. High Throughput Screen. 2022, 25, 547–553. [Google Scholar] [CrossRef] [Scilit]
- Azeem, M.; Imran, M.; Nadeem, M.F. Sharp bounds on partition dimension of hexagonal Möbius ladder. J. King Saud Univ.-Sci. 2022, 34, 101779. [Google Scholar] [CrossRef] [Scilit]
- Shabbir, A.; Azeem, M. On the partition dimension of tri-hexagonal α-boron nanotube. IEEE Access 2021, 9, 55644–55653. [Google Scholar] [CrossRef] [Scilit]
- Siddiqui, M.K.; Imran, M. Computing the metric and partition dimension of H-Naphtalenic and VC5C7 nanotubes. J. Optoelectron. Adv. Mater. 2015, 17, 790–794. [Google Scholar]
- Siddiqui, H.M.A.; Imran, M. Computing metric and partition dimension of 2-dimensional lattices of certain nanotubes. J. Comput. Theor. Nanosci. 2015, 11, 2419–2423. [Google Scholar] [CrossRef] [Scilit]
- Khuller, S.; Raghavachari, B.; Rosenfeld, A. Landmarks in graphs. Discret. Appl. Math. 1996, 70, 217–229. [Google Scholar] [CrossRef] [Scilit]
- Nadeem, M.F.; Hassan, M.; Azeem, M.; Ud-Din Khan, S.; Shaik, M.R.; Sharaf, M.A.; Awwad, E.M. Application of resolvability technique to investigate the different polyphenyl structures for polymer industry. J. Chem. 2021, 2021, 6633227. [Google Scholar] [CrossRef] [Scilit]
- Azhar, K.; Zafar, S.; Kashif, A.; Zahid, Z. Fault-tolerant partition resolvability in chemical graphs. Polycycl. Aromat. Compd. 2023, 43, 8830–8840. [Google Scholar] [CrossRef] [Scilit]
- Buawangpong, N.; Saraithong, P.; Khongphinitbunjong, K.; Chantawannakul, P.; Burgett, M. The comb structure of Apis dorsata F. (Hymenoptera: Apidae): 3-dimensional architecture and resource partitioning. Chiang Mai J. Sci. 2014, 41, 1077–1083. [Google Scholar]
- Milli, N.S.; Parlak, İH.; Milli, M. A new approach for machine learning-based recognition of meat species using a BME688 gas sensors matrix. Chiang Mai J. Sci. 2025, 52, e2025031. [Google Scholar] [CrossRef] [Scilit]
- Hsu, C.H.; Peng, S.L.; Tsay, Y.W. An improved algorithm for protein structural comparison based on graph theoretical approach. Chiang Mai J. Sci. 2011, 38, 71–81. [Google Scholar]
- Li, Y.; Xue, C.; Zargari, F.; Li, Y.R. From graph theory to graph neural networks (GNNs): The opportunities of GNNs in power electronics. IEEE Access 2023, 11, 145067–145084. [Google Scholar] [CrossRef] [Scilit]
- Guzman-Pando, A.; Ramirez-Alonso, G.; Arzate-Quintana, C.; Camarillo-Cisneros, J. Deep learning algorithms applied to computational chemistry. Mol. Divers. 2024, 28, 2375–2410. [Google Scholar] [CrossRef] [Scilit]
- Bhat, V.P.; Harsha, T.R.; Vinay, S.K. Revolutionizing AI: Applications of Graph Neural Networks Across Industries. In Graph Neural Networks: Essentials and Use Cases; Springer: Cham, Switzerland, 2025; pp. 161–188. [Google Scholar] [CrossRef] [Scilit]
- Qi, F.; Lin, Z. Maximal elliptic Sombor index of bicyclic graphs. Contrib. Math. 2024, 10, 25–29. [Google Scholar] [CrossRef] [Scilit]
- Rasheed, M.W.; Mahboob, A.; Hanif, I. An estimation of physicochemical properties of heart attack treatment medicines by using molecular descriptors. S. Afr. J. Chem. Eng. 2023, 45, 20–29. [Google Scholar] [CrossRef] [Scilit]

Disclaimer/Publisher’s Note: The statements, opinions and data contained in all publications are solely those of the individual author(s) and contributor(s) and not of MDPI and/or the editor(s). MDPI and/or the editor(s) disclaim responsibility for any injury to people or property resulting from any ideas, methods, instructions or products referred to in the content. |
© 2026 by the authors. Licensee MDPI, Basel, Switzerland. This article is an open access article distributed under the terms and conditions of the Creative Commons Attribution (CC BY) license.