


Abstract
Reared-apart twin designs offer a powerful means for investigating the relative contributions of genetic and environmental factors to individual differences in physical and behavioral traits. The current study analyses data from the Minnesota Study of Twins Reared Apart (MISTRA) for digit lengths, digit ratios (2D:4D), and fluctuating asymmetry (FA). The ratio of length between the second (index) and fourth (ring) fingers—2D:4D—is thought by some to be a proxy for variations in prenatal sex hormone levels, with low ratios indicating high androgen exposure. FA represents deviations from bilateral symmetry for paired traits. It is typically examined as a proxy for developmental instability (DI), with larger deviations from symmetry indicating greater DI. The current study investigated the contributions of genetic and environmental factors to individual differences in 2D:4D and FA using a sample of reared-apart twins. In addition, we examined 2D:4D in relation to the twin testosterone transfer (TTT) hypothesis. It has been reasoned that androgens can transfer between twins during gestation, and twins with male co-twins are exposed to higher levels of androgens than twins with female co-twins. Digit lengths and ratios all showed evidence of heritability, but no such effects were observed for FA. A group difference in directional asymmetry in 2D:4D (D[R−L]), consistent in direction with the TTT hypothesis, emerged in analyses without multiple-comparison correction, though the result warrants cautious interpretation.
1. Introduction
The classic twin study design has been instrumental in estimating the degree to which a trait is heritable, that is, the proportion of variance between individuals within a population at a given time that can be explained by genetic differences. More specifically, the greater the similarity within monozygotic (MZ) twin pairs relative to the similarity within dizygotic (DZ) twin pairs, the higher the heritability. A particularly powerful method is the examination of MZ reared-apart twins, as this can hold genetic differences constant, while environmental factors vary. However, it is important to acknowledge that even with such study designs, decoupling genes and environment can be complex because reared-apart twins have a shared prenatal environment. Researchers have utilized reared-apart twin studies to calculate heritability estimates for various individual difference traits, with the most well-known example being the Minnesota Study of Twins Reared Apart (MISTRA) [1,2].
1.1. Fluctuating Asymmetry
Fluctuating asymmetry (FA) represents random deviations from perfect bilateral symmetry of paired traits. FA is assessed as a proxy for developmental instability (DI), under the assumption that bilaterally paired traits are subject to the same genetic control, see [3,4]. FA can be measured in many ways and can encompass various traits. There has been considerable interest in FA in humans from an evolutionary biology/psychology perspective, e.g., [5,6], and it has been reported that FA relates to a range of relevant phenomena. For instance, recent papers have reported that elevated temperature during the first trimester of pregnancy is associated with increased asymmetry of deciduous (primary) dentition in female offspring [7], and that an indirect association between greater facial symmetry and higher number of children, via earlier age at first reproduction, is present in postmenopausal women from rural Southern Poland [8]. Researchers have also sometimes measured finger lengths to estimate FA, e.g., [9,10,11,12], with much of the variability in finger length itself appearing to be explainable by genetic factors [13].
To date, two papers have examined FA in the MISTRA. In both cases, there were 51 pairs of reared-apart MZ twins (MZA) and 37 pairs of reared-apart DZ twins (DZA), with the following 10 traits under study: foot, wrist, eye, and ear breadths, ankle and forearm circumference, ear and elbow-to-wrist lengths, knee height (from the floor, with participant sitting with feet flat on the floor), and acromium-olecranon (upper arm from elbow bent at 90 degrees to shoulder bone) length. Johnson, Segal et al. [14] reported heritability estimates ranging from 0.21 to 0.34, depending on which type of FA measure was used. For Johnson, Gangestad et al. [15], heritability estimates averaged across the 10 individual traits ranged from 0.004 to 0.080, depending on the method used, whereas heritability for aggregated measures comprised of these 10 traits ranged from 0.27 to 0.31, again depending on the methods used. The authors interpreted their pattern of results as suggesting that the individual traits share systematic sources of variance, and that this shared systematic component of variance itself must possess substantial heritability. They noted, “On average, across our three composites, the correlation for MZ twins [reared apart] was 0.272 and the correlation for DZ twins [reared apart] was 0.137” (p. 656). These findings are generally consistent with a meta-analysis of 34 studies [16], which reported an average weighted effect size estimate of r = 0.188. However, that study has been criticized on various methodological grounds [17]. Additionally, the meta-analysis was conducted across several species, and a comparable meta-analysis relating only to human data is lacking.
An early study of right–left differences in dermal ridge count by Holt [18] reported intraclass correlation coefficients (ICCs) of −0.07 for MZ twins and −0.08 for DZ twins, implying that the trait is not heritable. However, it was noted that differences in ridge counts between the twins’ hands tended to be smaller than those in the general population, directional asymmetry may have been present, and the sample examined lacked generalizability. More specifically, 34 MZ pairs and 66 same-sex DZ pairs were drawn from a series of ‘psychotic and neurotic twins’, see [19]; 12 MZ pairs were from the New Maudsley Series of psychotic and neurotic twins, and six MZ pairs were from London schools. Slater and Shields’ [19] data were also reanalyzed by Markow and Gottesman [20], although these authors did not report heritability estimates.
1.2. Digit Ratio (2D:4D)
Another purpose for which researchers measure finger lengths is to calculate the second-to-fourth digit ratio (2D:4D). The 2D:4D ratio has been posited as a putative marker of prenatal sex steroid exposure, with a relatively long fourth finger thought to indicate high levels of prenatal androgens and/or a high ratio of testosterone to estradiol [21,22,23]. Sex differences consistent with this idea are frequently reported, with lower 2D:4D typically observed in males [24]. This difference also appears to be larger for the right hand (R2D:4D) than the left hand (L2D:4D). It has been further hypothesized that directional asymmetry, calculated as R2D:4D minus L2D:4D (D[R−L]), acts as a further indicator of prenatal sex hormone exposure, with low R2D:4D compared to L2D:4D indicating relatively high androgen exposure [21]. However, studies attempting to correlate digit ratio, be it R2D:4D, L2D:4D, the average of these two measures (M2D:4D), or D[R−L], with measures of prenatal/perinatal testosterone have produced mixed findings [25,26]. Whereas some advocate 2D:4D as a proxy for prenatal hormone exposure, e.g., [27,28,29,30], others, e.g., [31,32,33] have taken a more skeptical stance regarding its validity and utility, see also [34].
Whatever the validity status of 2D:4D may be, several twin studies have reported heritability estimates for this measure. Medland and Loehlin [35] summarize previous twin studies of 2D:4D, as well as present their own data. Table 1 of Medland and Loehlin [35] includes additive genetic (A), shared environment (C), and non-shared environment (E) effects relating to the three preceding twin studies by Paul et al. [36], Voracek and Dressler [37], and Gobrogge et al. [38]. For R2D:4D, point estimates ranged as follow: A = 0.43–0.61, C = 0.03–0.15, and E = 0.36–0.42; for L2D:4D, A = 0.50–0.70, C = 0.01–0.08, and E = 0.29–0.42. The study by Voracek and Dressler [37] considered M2D:4D: A = 0.62, C = 0.17, E = 0.21. Medland and Loehlin’s [35] own data indicated that additive genetic effects accounted for 71% of the variance in R2D:4D and 80% of the variance in L2D:4D, with no common environmental effects observed. Since then, Hiraishi et al. [39] reported that additive genetic factors explained 68% of the variance in R2D:4D and 62% of the variance in L2D:4D in their sample. Likewise, for a sample of twins with and without neurodevelopmental disorders, Myers et al. [40] reported M2D:4D correlations of rs = 0.670 for MZ twins and rs = 0.363 for DZ twins, which indicates a heritability estimate of 0.614 as per Falconer’s formula. Collectively, these studies indicate that heritability for 2D:4D is substantial, and that most, if not all, of the remaining variance is explained by the non-shared environment.
Table 1.
Intraclass correlation coefficients for the researcher-measured digit length variables.
1.3. Twin Testosterone Transfer Hypothesis
A further means for which digit ratios have been used in twin studies is to investigate the twin testosterone transfer (TTT) hypothesis. The reasoning is that a fetus that gestates next to a male co-twin may be exposed, on average, to higher levels of prenatal testosterone than a fetus that gestates next to a female co-twin [41,42]. As such, twins with male co-twins could be expected to exhibit more ‘male-typical’ characteristics, including lower 2D:4D ratios. Despite the already noted validity concerns regarding 2D:4D as an indicator of prenatal sex hormone exposure, and the mixed pattern of findings reported in the literature on TTT, see [41], two early digit ratio studies [37,43] reported some observations that are consistent with the TTT hypothesis. However, other studies have not yielded similar findings [39,44,45,46], including the largest one to date [46]. To the best of our knowledge, no reared-apart twin study on digit ratios has been reported in the academic literature, and no twin study of digit ratios has examined D[R−L].
1.4. Hypotheses
Hypothesis 1.
Finger lengths are heritable. We predict that larger (positive) ICCs will be observed for MZA pairs, compared to DZA pairs, for the second finger (2D), third finger (3D), fourth finger (4D), and fifth finger (5D) of the right and left hands.
Hypothesis 2.
Digit ratios are heritable. We predict that larger (positive) ICCs will be observed for MZA pairs, compared to DZA pairs, for R2D:4D, L2D:4D, M2D:4D, and D[R−L].
Hypothesis 3.
FA is heritable. We predict that larger (positive) ICCs will be observed for MZA pairs, compared to DZA pairs, for FA.
Question: Based on the TTT hypothesis, one might predict lower R2D:4D, L2D:4D, M2D:4D, and D[R−L]) in females with male co-twins, compared to females with female co-twins, and higher R2D:4D, L2D:4D, M2D:4D, and D[R−L] in males with female co-twins compared to males with male co-twins. However, as the two studies [37,43] that did report statistically significant effects consistent with the TTT hypothesis had very small sample sizes, and others (including that with the largest sample size) have not found such effects, this remains an open question of interest.
2. Methods
2.1. Participants
The sample was comprised of 41 MZA twin pairs (27 female, 14 male), 19 same-sex DZA twin pairs (13 female, 6 male), and 10 opposite-sex DZA twin pairs. Ages (in years) of the twin pairs were as follow: female MZA (16–67 years, M = 42.04, SD = 12.05); male MZA (21–68, M = 42.14, SD = 14.41); female DZA (25–61, M = 43.54, SD = 10.73); male DZA (30–61, M = 37.83, SD = 12.22); opposite-sex DZA (29–67, M = 44.10, SD = 15.26). Within this sample, there was one triplet set consisting of female MZA twins and a male co-triplet. All three twin pairs from this triplet set were included in the inter-rater reliability analyses; only the MZA pair was included in the heritability analyses, and only the two opposite-sex DZA pairs were included in the TTT hypothesis analyses.
2.2. Digit Ratio
Researchers had previously used hand scans to measure digit lengths (2D, 3D, 4D, and 5D) for both right and left hands. As details regarding the exact processes used were unavailable, for comparison, one of the authors of the current paper (DN) used AutoMetric 2.2 [47] to create a third set of measurements from these hand scans. One participant appeared to have a marked injury to R5D, resulting in reduced length of that digit. Subsequent FA analyses do not include 5D for that participant.
We calculated R2D:4D as R2D divided by R4D, and L2D:4D as L2D divided by L4D, separately, for the first and second sets of measurements. From these, we also calculated M2D:4D and D[R−L], separately for the two sets of measurements. M2D:4D was calculated as the mean of R2D:4D and L2D:4D, and D[R−L] was calculated as R2D:4D minus L2D:4D. Based on notes that accompanied the scans, the scans may have been measured by more than two people, and it was not entirely clear whether the first and second measurements were consistently made by the same people. Although an ICC in these circumstances may not provide a strict index of inter-rater reliability, it can at least provide an indication of the level of consistency across the two sets of measurements. However, close agreement between the two sets of measurements was observed for each variable (Table 1).
We calculated mean values for R2D:4D, L2D:4D, M2D:4D, and D[R−L] from the two sets of measurements (note that for one participant, only one set of measurements was available for the digits of the left hand, so in subsequent analyses we considered the L2D:4D, M2D:4D, and D[R−L] values calculated from the available measurements to represent the means). ICCs between these measurements and those made with AutoMetric 2.2 indicated a high degree of consistency: R2D:4D, ICC = 0.888 [95% CI: 0.845, 0.920], F(136, 136) = 17.556, p < 0.001; L2D:4D, ICC = 0.841 [95% CI: 0.784, 0.884], F(136, 136) = 11.515, p < 0.001; M2D:4D, ICC = 0.907 [95% CI: 0.872, 0.932], F(136, 136) = 20.519, p < 0.001; and D[R−L], ICC = 0.712 [95% CI: 0.618, 0.786], F(136, 136) = 6.033, p < 0.001.
2.3. Fluctuating Asymmetry
It is noted that the MISTRA paper by Johnson, Segal et al. [14] reported “We had some finger length data from photocopies of hands, but the sample of these was smaller and the participants for whom we had these data were not well matched with those for whom we had the other anthropometric data so we did not make use of any finger length data” (p. 281). Correlations observed between FA of individual traits within participants were also low. More specifically, Johnson, Gangestad et al. [15] reported that the mean correlation between unsigned FAs for the 10 traits previously examined was 0.023. Although not truly an independent replication, with these very low correlations in mind, we examined the finger length data here to test the replicability of effects already reported from the MISTRA.
ICCs were high for the two sets of researcher-measured digit lengths (Table 1). Mean values for R2D, R3D, R4D, R5D, L2D, L3D, L4D, and L5D were calculated from the two sets of (researcher-made) measurements. As already noted, there was one participant for whom only one set of researcher-made measurements was created for the left hand (all digits); in this case, we treated the available measurements as means.
We next conducted paired samples t-tests to examine directional asymmetry. That is, we aimed to determine whether the difference in size between the right and left sides deviated significantly from zero. If directional asymmetry were present, we would expect to find either the right or left side of a paired trait to be significantly larger, on average, than the other. R4D was significantly longer than L4D, and, reflecting this, R2D:4D was significantly lower than L2D:4D; all other measures examined in this analysis did not exhibit significant directional asymmetry (Table 2).
Table 2.
Examination of directional asymmetry in digit lengths and digit ratios.
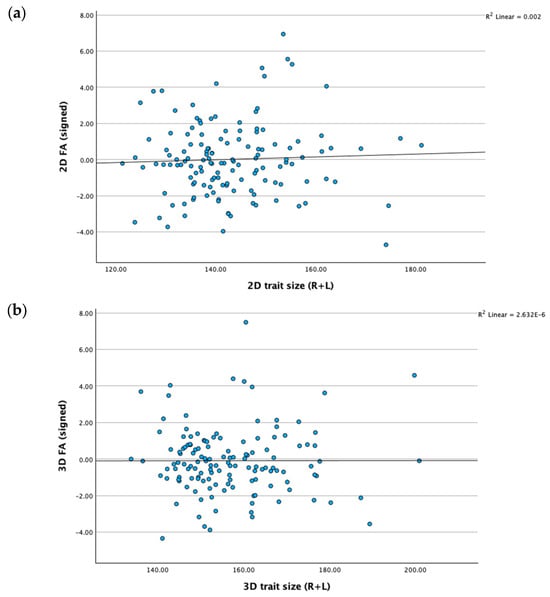
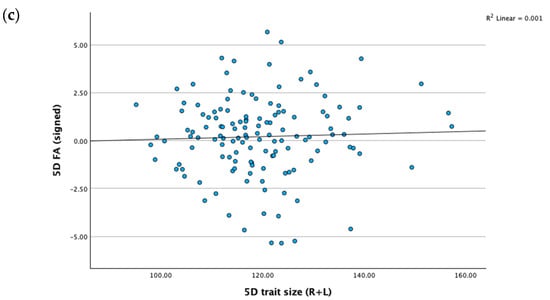
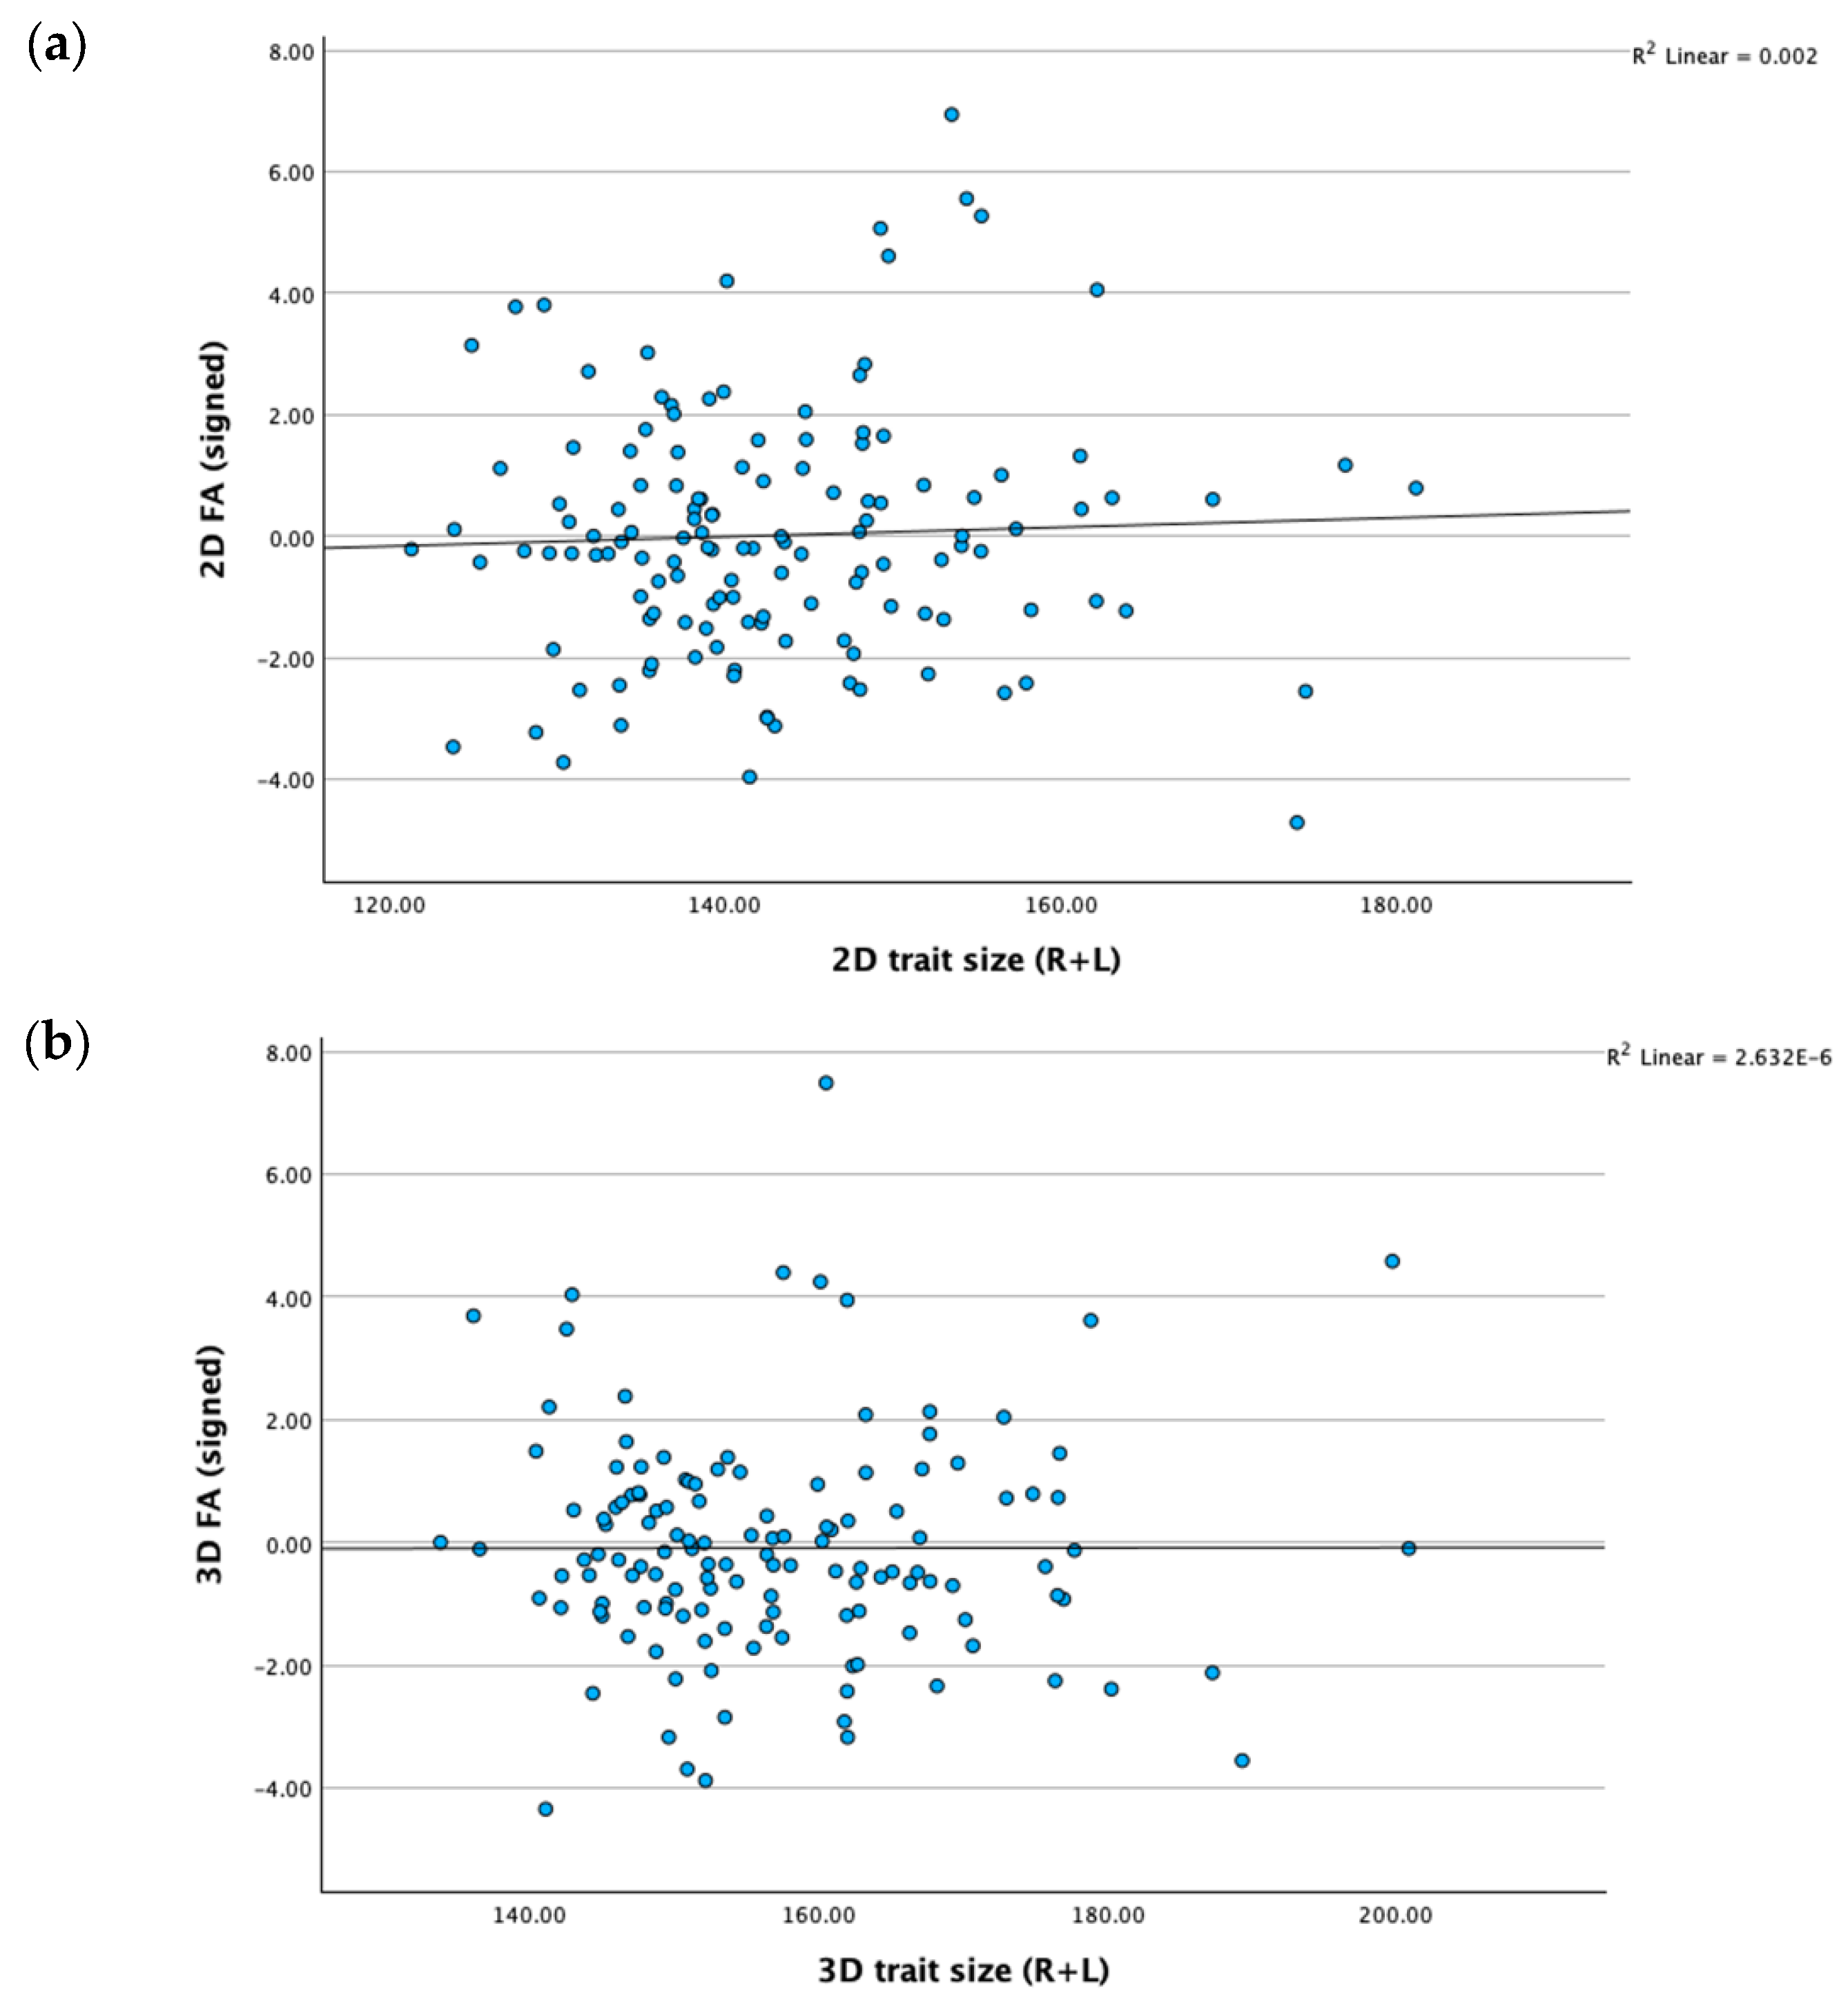
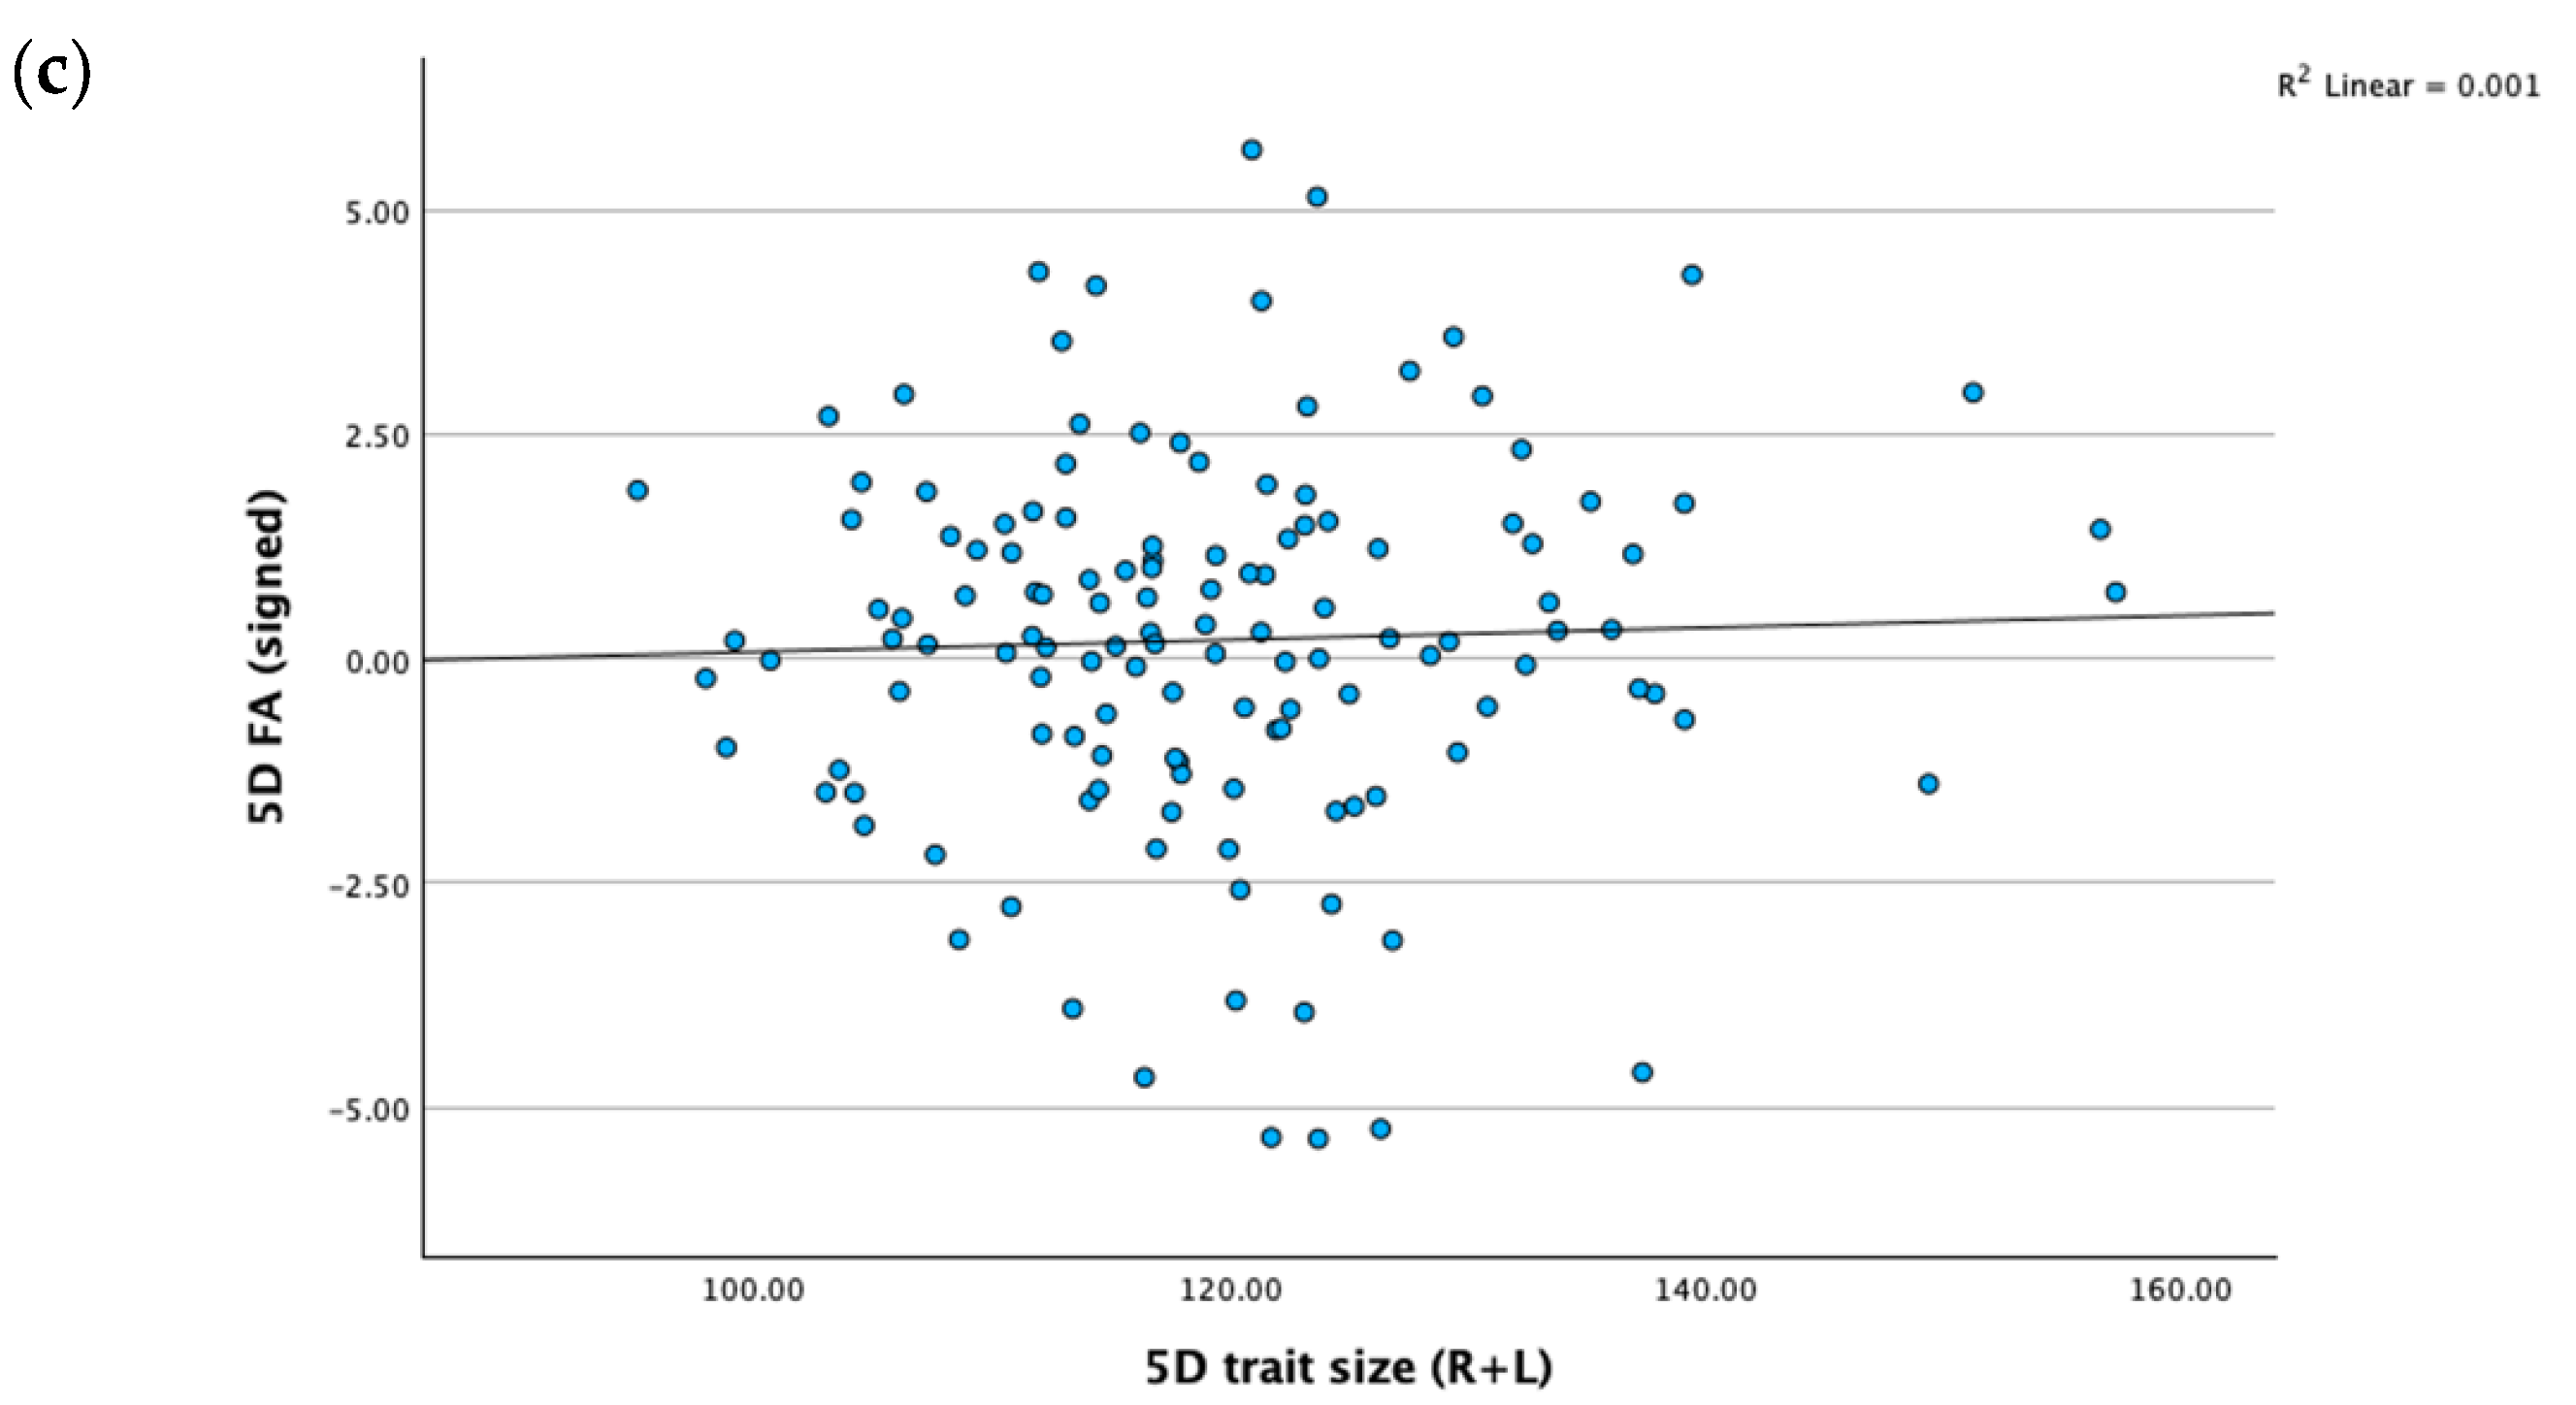
We calculated FA for each of the three digits (2D, 3D, and 5D) for which significant directional asymmetry was not observed. FA was calculated as the absolute (i.e., unsigned) difference between RD and LD and was computed separately for each of the two sets of measurements. ICCs showed significant agreement between the two sets of measurements (see Table 1). We then computed mean FA values for 2D, 3D, and 5D from these two sets of measurements. As before, we considered the single set of measurements for one participant to constitute the mean values. We compared these with the measurements taken via AutoMetric 2.2. Because the researcher-made measurements were recorded in millimeters, whereas the measurements made with AutoMetric 2.2 were recorded in pixels, ICCs would be unlikely to show high agreement, even if the measurements were, for all intents and purposes, similar. For this reason, we computed Pearson correlations between these two sets of measurements. The correlations were strong and statistically significant in each case: 2D, r (135) = 0.621, p < 0.001; 3D, r (134) = 0.698, p < 0.001; and 5D FA, r (132) = 0.503, p < 0.001. Scatterplots (Figure 1) of trait size (i.e., mean RD + mean LD) against signed FA (i.e., mean RD − mean LD) did not reveal any notable relationships, indicating that scaling was not required, see [48] (pp. 401–402).
Figure 1.
Trait size (R + L) plotted against signed FA (R − L) for 2D (a), 3D (b), and 5D (c).
Based on the above observations, we calculated composite FA (cFA) using 2D, 3D, and 5D. There are many suggested formulae for calculating cFA, e.g., [3,48,49]; see also [50], with Palmer and Strobeck (p. 393, [48]) having noted there being “an almost bewildering variety” within the literature. We chose to calculate this simply as the average of FA for 2D, 3D, and 5D (separately, for each of the two sets of researcher-made measurements). The inter-rater reliability was reasonably high (see Table 1). We then took the average of these two sets of cFA measurements. The resulting cFA measurement correlated strongly with that calculated from the AutoMetric 2.2 measurements, r (131) = 0.667, p < 0.001.
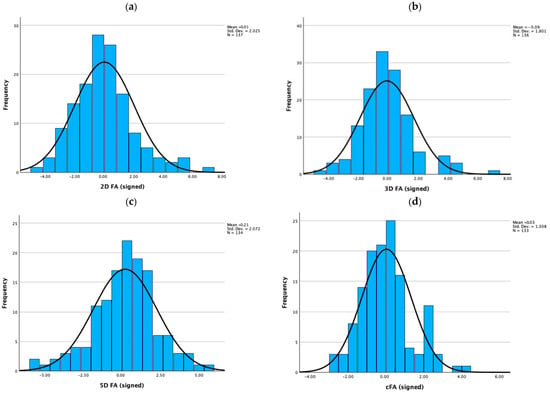
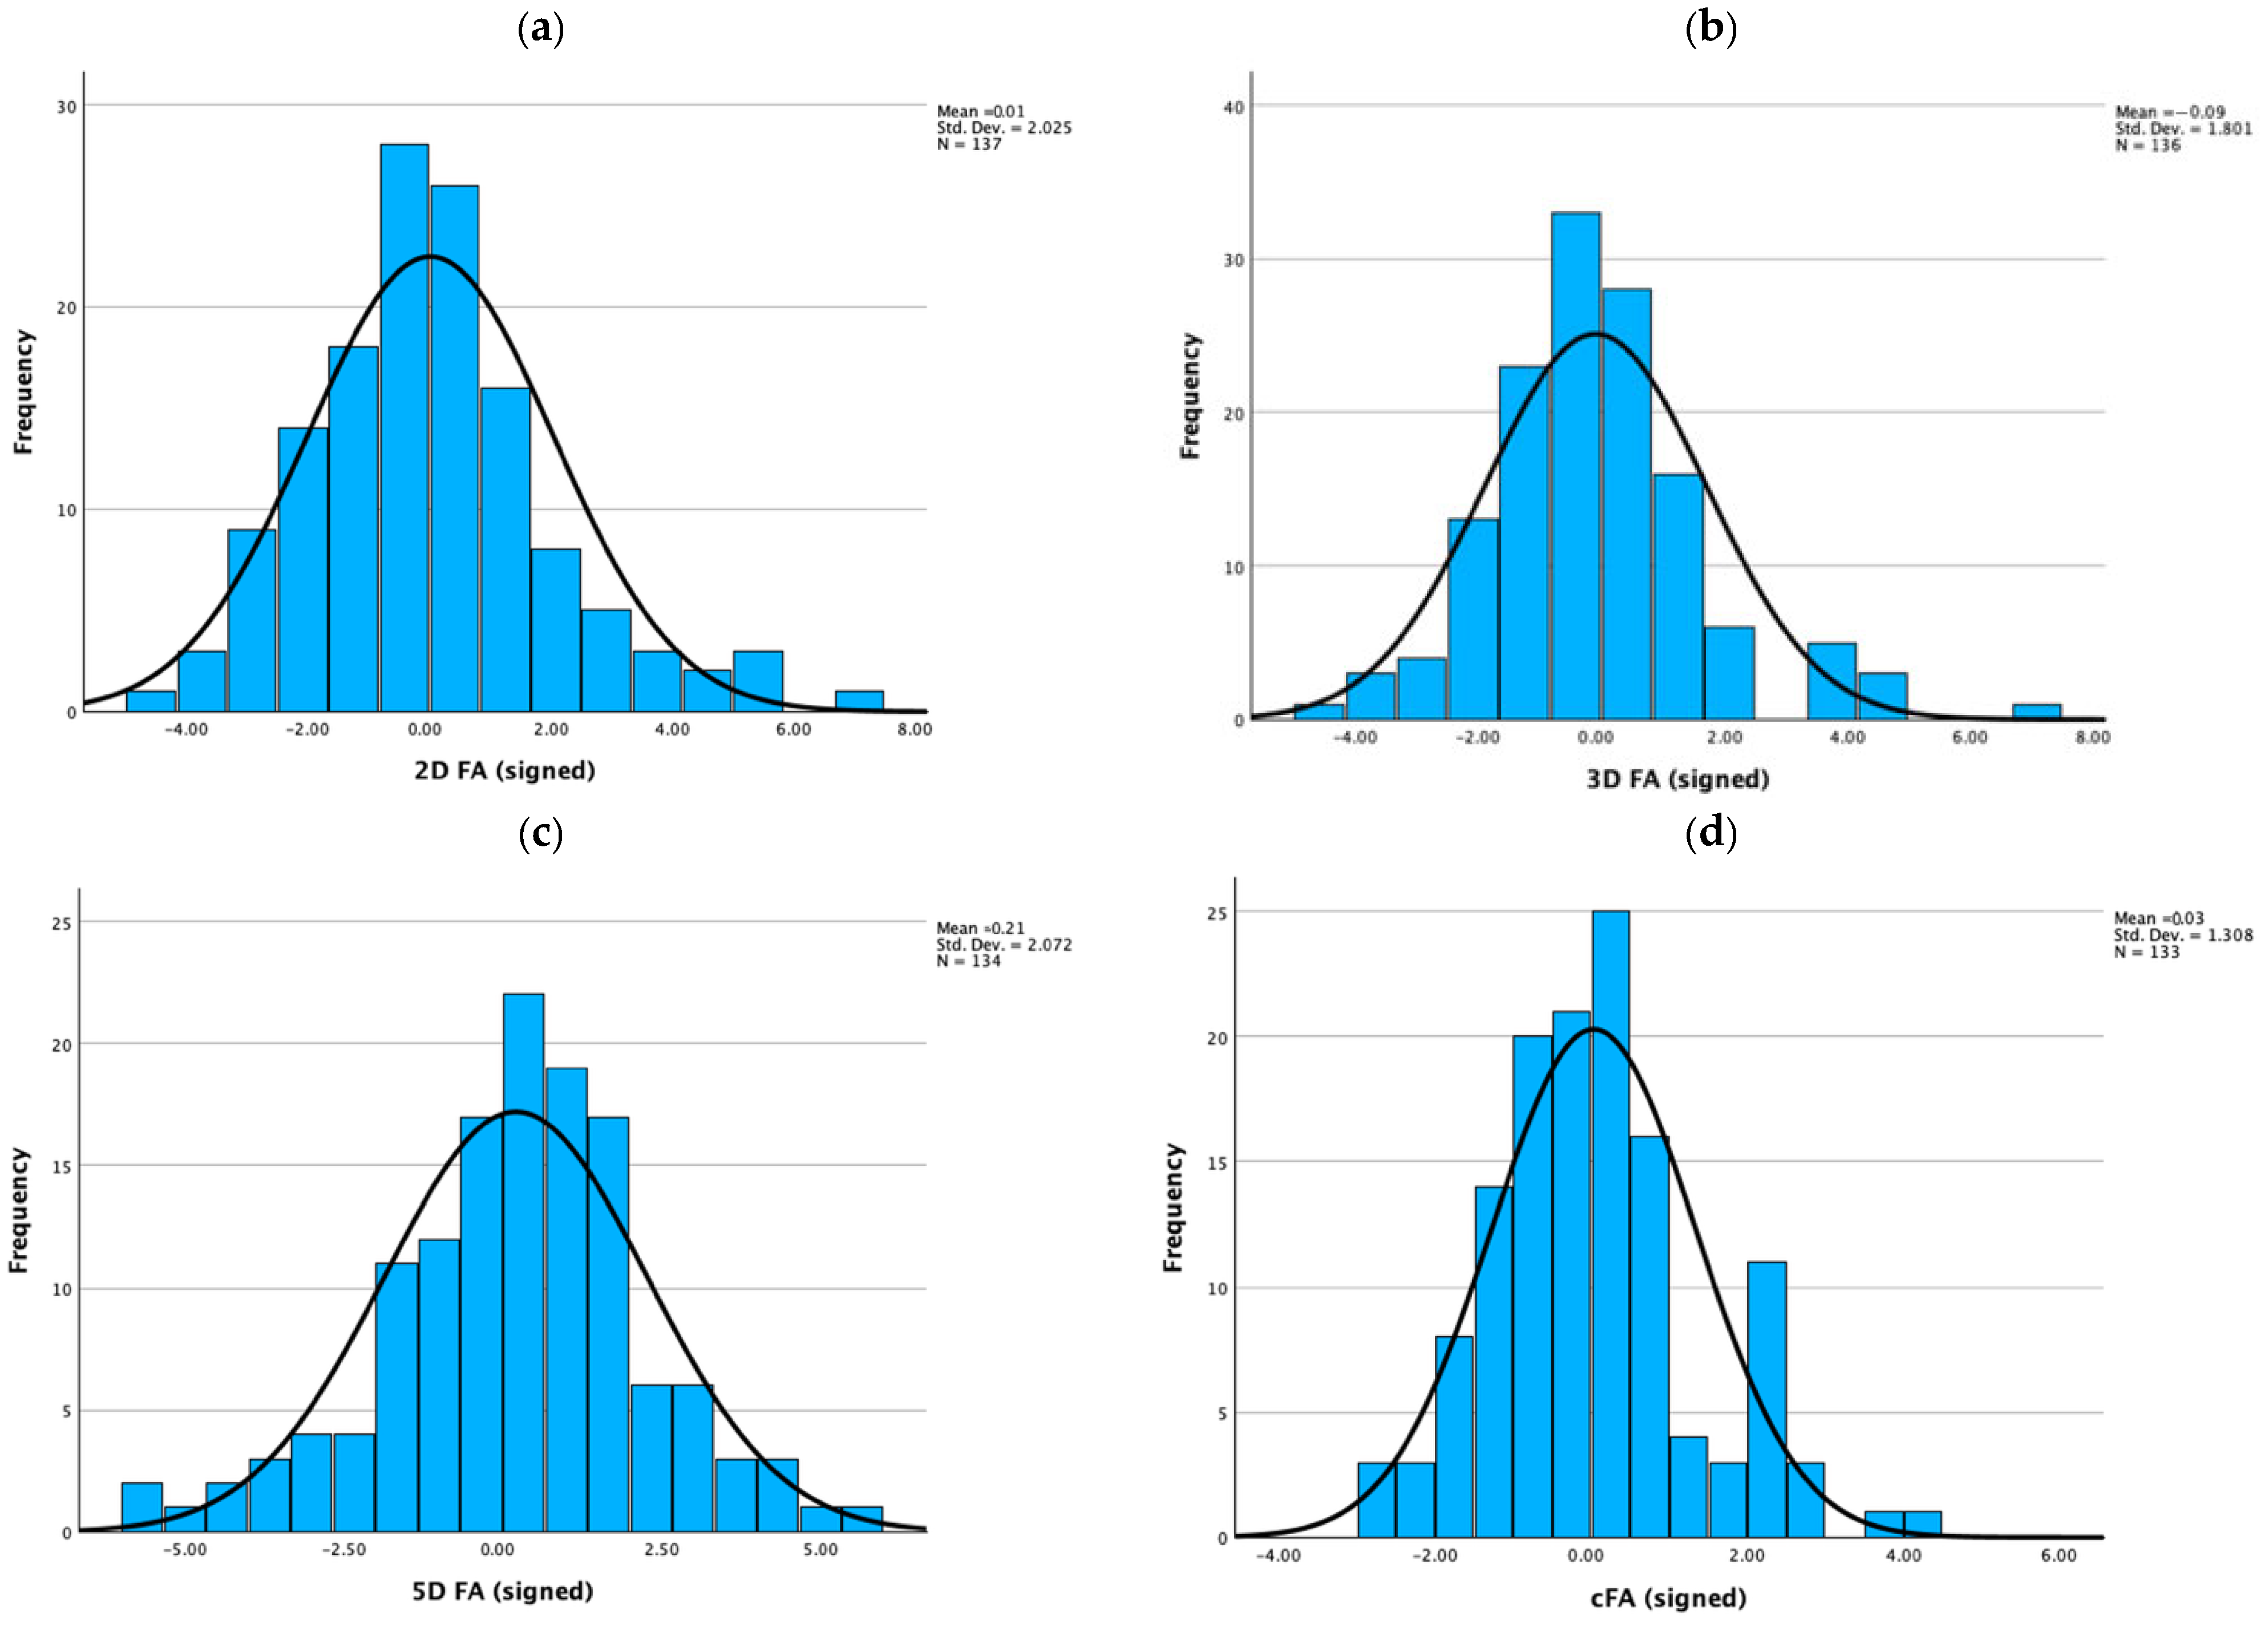
Signed mean RD minus LD values were approximately normally distributed; means were close to zero, indicating absence of directional asymmetry, and platykurtosis was not observed, indicating absence of antisymmetry (Figure 2).
Figure 2.
Distribution of (signed) fluctuating asymmetry scores for 2D (a), 3D (b), 5D (c), and cFA (d).
3. Results
3.1. Heritability Analysis
ICCs indicated greater resemblance in MZA than DZA twin pairs for each of the digit length and digit ratio variables examined here. Surprisingly, each of the ICCs for FA variables was in the negative direction, and none was statistically significant (Table 3).
Table 3.
Intraclass correlation coefficients for MZA and same-sex DZA twin pairs for digit length, digit ratio, and fluctuating asymmetry variables.
3.2. Comparison of Twins from Same-Sex and Opposite-Sex Pairs
To investigate the TTT hypothesis, we randomly selected one twin from each of the 60 same-sex pairs to compare with twins from the opposite-sex pairs. As there was a triplet set in this sample (consisting of female MZA twins and a male co-triplet), we then removed the female MZA pair, retaining the two opposite-sex DZA twin pairs. We next performed independent samples t-tests to compare the digit ratio variables between same-sex female twins and opposite-sex female twins, and between same-sex male twins and opposite-sex male twins. D[R−L] was significantly lower in opposite-sex female twins, though no other significant differences were observed (Table 4).
Table 4.
Comparisons of digit ratio variables between twins from same-sex and opposite-sex twin pairs.
4. Discussion
Support was provided for the hypotheses that digit lengths (Hypothesis 1) and digit ratios (Hypothesis 2) are heritable, although no support was provided for the hypothesis that FA is heritable (Hypothesis 3). Comparisons of digit ratios in twins from same-sex and opposite-sex pairs showed D[R−L] to be significantly lower in females with male co-twins compared to females with female co-twins. Although this effect is consistent with the TTT hypothesis, none of the other seven comparisons were statistically significant.
The current findings are consistent with previous research indicating that digit lengths are heritable [13]. They are also consistent with twin studies of digit ratio, which have typically observed moderate-to-high heritability, with additive genetic factors explaining most of the variance [35,36,37,38,39,40].
Interest in digit ratio variables is primarily due to the suggestion that they reflect individual differences in exposure to sex hormones during prenatal development [21,23]. The current study indicates that R2D:4D, L2D:4D, and M2D:4D are highly heritable. D[R−L] showed lower heritability, although this may be expected considering that random measurement errors do not cancel out when taking differences and multiply when calculating ratios—D[R−L] is calculated as the difference between two ratios [51]. It should be considered that digit ratio variables being highly heritable need not be inconsistent with their being subject to hormonal influences, as hormones would, presumably, mediate genetic effects. However, ICCs calculated for the MZA twin pairs indicate heritability for 2D and 4D to be approximately 90%, and it is difficult to interpret exactly what it means to observe heritability for digit ratio variables in this context. Considering the digit ratio variables are comprised of other variables (i.e., 2D and 4D), which themselves appear to be highly heritable, the question may be asked whether heritability of 2D:4D observed here is simply a product of finger lengths being heritable.
The current study also aimed to test the TTT hypothesis by comparing digit ratio variables between twins from same-sex and opposite-sex pairs. We found D[R−L] to be significantly lower (i.e., more ‘male-typical’) in females with male co-twins compared to females with female co-twins. Although this effect is consistent with the TTT hypothesis and appears to be a novel finding, as previous twin studies have not reported D[R−L], there are several caveats that should be considered when interpreting this finding. The analysis relied on a small twin sample (39 same-sex female twins and 10 opposite-sex female twins), and none of the other seven same-sex vs opposite-sex comparisons yielded statistically significant results. The effect would also not have remained significant had Bonferroni correction for multiple testing been applied. Further, D[R−L] is less researched than R2D:4D or L2D:4D, and, as noted, is subject to high levels of measurement error, see [51,52]. For these reasons, it is likely that very large sample sizes would be required to obtain reliable results. It is also worth noting that, although two small-scale studies did observe statistically significant results for digit ratio [37,43], others have not replicated such effects [39,44,45,46]. Furthermore, Galiano et al. [53] compared umbilical cord androgen levels between female same-sex and female opposite-sex twins and did not observe a statistically significant difference for testosterone.
Unlike previous analyses from the MISTRA [14,15], the current study did not find evidence of FA being heritable. There may be several explanations for this. First, although some other research indicates that FA is heritable, e.g., [16], the effects that can be detected empirically appear to be very small. Our analysis is likely underpowered, and it is worth noting that we utilized a slightly smaller sample size and fewer bilaterally paired traits compared with the previous MISTRA FA studies. Second, digit lengths might not be the best traits for examining FA, because they may be subject to subtle directional asymmetry effects related to handedness, and because development of the second, third, fourth, and fifth digits is likely related to much of the same genetics. It may be advantageous, instead, to consider paired traits that can be assumed to be relatively independent (e.g., ear length, knee width), given that aberration in the development of one such trait is unlikely to be shared by another, whereas this may not be the case for digit lengths. It is also noted that Wilson and Manning [54] observed directional asymmetry for 2D (but not for 3D, 4D, or 5D), whereas the current study observed directional asymmetry for 4D (but not 2D, 3D, or 5D). This could reflect differences in study methodology, e.g., the current study measured finger lengths from photocopies whereas Wilson and Manning [54] measured finger lengths directly.
It has been suggested that FA may be produced as a consequence of the twinning process itself [55]; see also [56]). However, Markow and Gottesman [57] examined dermatoglyphic FA in MZ twins, DZ twins, and adult singletons and found that the FA measures were comparable. They, therefore, concluded that their “findings support the assumption that observations on fluctuating asymmetry in twins may be extended to singletons despite their differences in developmental history” (p. 215). In accordance with this, Johnson, Gangestad et al. [15] noted that composite indexes of FA in the MISTRA did not differ between twins and non-twins. Sokol et al. [58] reported that dermatoglyphic asymmetry did not differ between monochorionic and dichorionic MZ twins. It is noted, however, that Bogle, Reed, and Norton Jr. [59] reported that variability in a-b ridge count asymmetry was related to zygosity, chorion type, and whether placentas were fused. We are unaware of such investigations having been reported regarding asymmetry of finger lengths.
In addition to potential issues regarding FA in the specific case of twinning, it should be noted that FA provides only an imprecise indication of DI; therefore, unless adequately corrected, heritability for DI derived from FA will be underestimated, due to repeatability of FA typically being very low [60]. Furthermore, although DI might be thought of as relating only to environmental influences, developmental noise (i.e., randomness) may play a considerable role [61]—this also appears to exhibit a degree of heritability, see also [62].
A further limitation of the current study is its measurement of 2D:4D indirectly from photocopies rather than directly from participants’ hands. Manning et al. [63] reported that 2D:4D measured from photocopies was lower than that produced from direct measurements, a finding replicated across various datasets [64,65]. This observation likely reflects distortion of fat pads at the fingertips during photocopying, a process that may not affect each finger in a uniform manner. This issue may affect much of the 2D:4D literature. Notably, Table 2 of Hönekopp and Watson’s [24] review paper lists the following measurement types for primary 2D:4D studies: direct, k = 33; indirect, k = 75; direct/indirect, k = 3; radiographic, k = 5. Measuring FA from photocopies of fingers may also be an issue. Manning et al. [66] reported very low reliability between finger asymmetries measured directly and from photocopies (ICCs ranged from 0.16 to 0.39) and stated that they “strongly advise against the use of photocopies for the measurement of finger asymmetry. The resulting asymmetries may contain large amounts of ‘noise’, and small amounts of information concerning developmental instability” (p. 490). Additionally, effects of photocopying could differ across hands, see [63] (Table 1). Although this may be a concern, data for the MISTRA were collected many years ago, and it would not be possible to obtain direct finger length measurements now. Obtaining a comparably large dataset relating to reared-apart twins may also be unrealistic. It is noted, however, that other researchers have considered finger lengths measured from photocopies when examining FA, e.g., [9,67].
Graham and Özener [68] (p. 4) suggested “age should probably be included as a covariate in all studies of fluctuating asymmetry,” and correlations between age and 2D:4D have also sometimes been reported, e.g., [69]. However, we have not controlled for age as a covariate here. For analyses relating to heritability in the current study, twins’ FA and 2D:4D will have been assessed in relation to that of their co-twins, who would be of the same age. Body mass index (BMI) might also be considered a potentially relevant covariate, with associations having been reported between this variable and both 2D:4D, e.g., [70]) and FA, e.g., [71]. As with age, however, we did not control for BMI statistically. BMI is a highly heritable trait [72], and so greater variability is expected for DZ pairs compared to MZ pairs. However, obtaining heritability estimates from reared-apart twin designs does not require direct comparison of MZA and DZA correlations (e.g., via Falconer’s formula). Therefore, greater within-pair variability in DZA pairs for BMI should not unduly affect the heritability estimates observed here. A stronger case might be made for controlling for age and/or BMI in analyses used for examining the TTT hypothesis. However, the number of opposite-sex twin pairs was particularly small, and we elected not to increase the complexity/reduce the intuitiveness of these analyses.
5. Conclusions
The current paper presents, to our knowledge, the first examination of digit lengths and digit ratios in reared-apart twins, the first consideration of digit ratio in relation to the TTT hypothesis in a reared-apart twin study, and a new analysis of FA heritability. The findings suggest digit lengths to be highly heritable, R2D:4D, L2D:4D and M2D:4D to exhibit moderate heritability, and D[R−L] to be less heritable, but still statistically significant. We also observed D[R−L] to be lower in females from opposite-sex twin pairs compared to females from same-sex twin pairs, an effect consistent with the TTT hypothesis. However, this finding was derived from a small subsample, implying a lack of adequate statistical power, and similar analyses did not produce significant results. Contrary to some previous reports, we did not detect evidence of heritability for FA. Interpretations drawn from these data should take into account the modest sample size, measurement constraints, and limited statistical power.
Author Contributions
G.R. conceived the idea for the paper, analyzed the data, and prepared key parts of the manuscript. N.L.S. processed and analyzed data, and prepared and reviewed portions of the manuscript. D.N. measured the twins’ hand scans and reviewed the final text. All authors have read and agreed to the published version of the manuscript.
Funding
This research received no external funding.
Institutional Review Board Statement
The data were gathered with approval of the Institutional Review Board of the University of Minnesota. All ethical standards were followed.
Informed Consent Statement
Informed consent was obtained from all twin participants on the first assessment day. Each twin read a letter, signed the letter and was given a copy for their records. A copy of the form is not available given that data collection ended nearly 30 years ago.
Data Availability Statement
The data used in this study are not currently available, due to privacy and confidentiality considerations.
Acknowledgments
We would like to thank Thomas J. Bouchard, Jr., University of Minnesota, and Erik Moore, University of Minnesota, for making the data available. The data analyzed in this manuscript were collected under numerous research grants from a variety of sources as documented in Appendix A of Segal [2]. Some expenses were provided by the School of Psychology, Newcastle University. The reared-apart twins are gratefully acknowledged for their participation. AI was not used.
Conflicts of Interest
There are no conflicts of interest on the part of any of the three authors.
References
- Bouchard, T.J., Jr.; Lykken, D.T.; McGue, M.; Segal, N.L.; Tellegen, A. Sources of human psychological differences: The Minnesota Study of Twins Reared Apart. Science 1990, 250, 223–228. [Google Scholar] [CrossRef] [Scilit] [PubMed]
- Segal, N.L. Born Together—Reared Apart: The Landmark Minnesota Twin Study; Harvard University Press: Cambridge, MA, USA, 2012. [Google Scholar] [CrossRef] [Scilit]
- Møller, A.P.; Swaddle, J.P. Asymmetry, Developmental Stability, and Evolution; Oxford University Press: Oxford, UK, 1997. [Google Scholar]
- Van Valen, L. A study of fluctuating asymmetry. Evolution 1962, 16, 125–142. [Google Scholar] [CrossRef] [Scilit]
- Farrera, A. Formal models for the study of the relationship between fluctuating asymmetry and fitness in humans. Am. J. Biol. Anthropol. 2022, 179, 73–84. [Google Scholar] [CrossRef] [Scilit] [PubMed]
- Van Dongen, S.; Gangestad, S.W. Human fluctuating asymmetry in relation to health and quality: A meta-analysis. Evol. Hum. Behav. 2011, 32, 380–398. [Google Scholar] [CrossRef] [Scilit]
- Moes, E.; Kuzawa, C.W.; Edgar, H.J.H. Sex-specific effects of environmental temperature during gestation on fluctuating asymmetry in deciduous teeth. Am. J. Biol. Anthropol. 2024, 184, e24944. [Google Scholar] [CrossRef] [Scilit] [PubMed]
- Klimek, M.; Marcinkowska, U.M.; Galbarczyk, A.; Nenko, I.; Jasienska, G. The age at first reproduction as a potential mediator between facial fluctuating asymmetry and reproductive success in women. Am. J. Biol. Anthropol. 2023, 181, 166–172. [Google Scholar] [CrossRef] [Scilit] [PubMed]
- Burton, C.; Stevenson, J.C.; Williams, D.C.; Everson, P.M.; Mahoney, E.R.; Trimble, J.E. Attention-deficit hyperactivity disorder (AD/HD) and fluctuating asymmetry (FA) in a college sample: An exploratory study. Am. J. Hum. Biol. 2003, 15, 601–619. [Google Scholar] [CrossRef] [Scilit] [PubMed]
- Datta Banik, S. Handedness and bilateral asymmetry of second to fourth finger digit ratio (2D:4D) in adults from Merida, Mexico. Hum. Biol. Rev. 2017, 6, 79–95. [Google Scholar]
- Jasienska, G.; Lipson, S.F.; Ellison, P.T.; Thune, I.; Ziomkiewicz, A. Symmetrical women have higher potential fertility. Evol. Hum. Behav. 2006, 27, 390–400. [Google Scholar] [CrossRef] [Scilit]
- Voracek, M. Who wants to believe? Associations between digit ratio (2D:4D) and paranormal and superstitious beliefs. Personal. Individ. Differ. 2009, 47, 105–109. [Google Scholar] [CrossRef] [Scilit]
- Clark, P.J. The heritability of certain anthropometric characters as ascertained from measurements of twins. Am. J. Hum. Genet. 1956, 8, 49–54. [Google Scholar] [PubMed]
- Johnson, W.; Segal, N.L.; Bouchard, T.J., Jr. Fluctuating asymmetry and general intelligence: No genetic or phenotypic association. Intelligence 2008, 36, 279–288. [Google Scholar] [CrossRef] [Scilit]
- Johnson, W.; Gangestad, S.W.; Segal, N.L.; Bouchard, T.J., Jr. Heritability of fluctuating asymmetry in a human twin sample: The effect of trait aggregation. Am. J. Hum. Biol. 2008, 20, 651–658. [Google Scholar] [CrossRef] [Scilit] [PubMed]
- Møller, A.P.; Thornhill, R. A meta-analysis of the heritability of developmental stability. J. Evol. Biol. 1997, 10, 1–16. [Google Scholar] [CrossRef] [Scilit]
- Leamy, L.J.; Klingenberg, C.P. The genetics and evolution of fluctuating asymmetry. Annu. Rev. Ecol. Evol. Syst. 2005, 36, 1–21. [Google Scholar] [CrossRef] [Scilit]
- Holt, S.B. Genetics of dermal ridges: Bilateral asymmetry in finger ridge-counts. Ann. Eugen. 1952, 17, 211–231. [Google Scholar] [CrossRef] [Scilit] [PubMed]
- Slater, E.; Shields, J. Psychotic and Neurotic Illnesses in Twins (Medical Research Council Special Report Series, No. 278); Her Majesty’s Stationery Office: London, UK, 1953. [Google Scholar]
- Markow, T.A.; Gottesman, I.I. Fluctuating dermatoglyphic asymmetry in psychotic twins. Psychiatry Res. 1989, 29, 37–43. [Google Scholar] [CrossRef] [Scilit] [PubMed]
- Manning, J.T. Digit Ratio: A Pointer to Fertility, Behavior, and Health; Rutgers University Press: New Brunswick, NJ, USA, 2002. [Google Scholar]
- Manning, J.T. Resolving the role of prenatal sex steroids in the development of digit ratio. Proc. Natl. Acad. Sci. USA 2011, 108, 16143–16144. [Google Scholar] [CrossRef] [Scilit] [PubMed]
- Manning, J.T.; Scutt, D.; Wilson, J.; Lewis-Jones, D.I. The ratio of 2nd to 4th digit length: A predictor of sperm numbers and concentrations of testosterone, luteinizing hormone and oestrogen. Hum. Reprod. 1998, 13, 3000–3004. [Google Scholar] [CrossRef] [Scilit] [PubMed]
- Hönekopp, J.; Watson, S. Meta-analysis of digit ratio 2D:4D shows greater sex difference in the right hand. Am. J. Hum. Biol. 2010, 22, 619–630. [Google Scholar] [CrossRef] [Scilit] [PubMed]
- Richards, G.; Aydin, E.; Tsompanidis, A.; Padaigaitė, E.; Austin, T.; Allison, C.; Holt, R.; Baron-Cohen, S. Digit ratio (2D:4D) and maternal testosterone-to-estradiol ratio measured in early pregnancy. Sci. Rep. 2022, 12, 13586. [Google Scholar] [CrossRef] [Scilit] [PubMed]
- Sorokowski, P.; Kowal, M. Relationship between the 2D:4D and prenatal testosterone, adult level testosterone, and testosterone change: Meta-analysis of 54 studies. Am. J. Biol. Anthropol. 2024, 183, 20–38. [Google Scholar] [CrossRef] [Scilit] [PubMed]
- Manning, J.T.; Fink, B. Are there any “direct” human studies of digit ratio (2D:4D) and measures of prenatal sex hormones? Early Hum. Dev. 2017, 113, 73–74. [Google Scholar] [CrossRef] [Scilit] [PubMed]
- Manning, J.T.; Fink, B. Digit ratio (2D:4D) and its relationship to foetal and maternal sex steroids: A mini-review. Early Hum. Dev. 2023, 183, 105799. [Google Scholar] [CrossRef] [Scilit] [PubMed]
- Swift-Gallant, A.; Breedlove, S.M. Finger pointing: Why bias against 2D:4D ratios doesn’t add up. Horm. Behav. 2025, 172, 105759. [Google Scholar] [CrossRef] [Scilit] [PubMed]
- Swift-Gallant, A.; Johnson, B.A.; Di Rita, V.; Breedlove, S.M. Through a glass, darkly: Human digit ratios reflect prenatal androgens, imperfectly. Horm. Behav. 2020, 120, 104686. [Google Scholar] [CrossRef] [Scilit] [PubMed]
- Richards, G. What is the evidence for a link between digit ratio (2D:4D) and direct measures of prenatal sex hormones? Early Hum. Dev. 2017, 113, 71–72. [Google Scholar] [CrossRef] [Scilit] [PubMed]
- McCormick, C.M.; Carré, J.M. Facing off with the phalangeal phenomenon and editorial policies: A commentary on Swift-Gallant, Johnson, Di Rita and Breedlove (2020). Horm. Behav. 2020, 120, 104710. [Google Scholar] [CrossRef] [Scilit] [PubMed]
- Voracek, M. No effects of androgen receptor gene CAG and GGC repeat polymorphisms on digit ratio (2D:4D): A comprehensive meta-analysis and critical evaluation of research. Evol. Hum. Behav. 2014, 35, 430–437. [Google Scholar] [CrossRef] [Scilit]
- Leslie, M. The mismeasure of hands? Science 2019, 364, 923–925. [Google Scholar] [CrossRef] [Scilit] [PubMed]
- Medland, S.E.; Loehlin, J.C. Multivariate genetic analyses of the 2D:4D ratio: Examining the effects of hand and measurement technique in data from 757 twin families. Twin Res. Hum. Genet. 2008, 11, 335–341. [Google Scholar] [CrossRef] [Scilit] [PubMed]
- Paul, S.N.; Kato, B.S.; Cherkas, L.F.; Andrew, T.; Spector, T.D. Heritability of the second to fourth digit ratio (2d:4d): A twin study. Twin Res. Hum. Genet. 2006, 9, 215–219. [Google Scholar] [CrossRef][Green Version]
- Voracek, M.; Dressler, S.G. Digit ratio (2D:4D) in twins: Heritability estimates and evidence for a masculinized trait expression in women from opposite-sex pairs. Psychol. Rep. 2007, 100, 115–126. [Google Scholar] [CrossRef] [Scilit] [PubMed]
- Gobrogge, K.L.; Breedlove, S.M.; Klump, K.L. Genetic and environmental influences on 2D:4D finger length ratios: A study of monozygotic and dizygotic male and female twins. Arch. Sex. Behav. 2008, 37, 112–118. [Google Scholar] [CrossRef] [Scilit] [PubMed]
- Hiraishi, K.; Sasaki, S.; Shikishima, C.; Ando, J. The second to fourth digit ratio (2D:4D) in a Japanese twin sample: Heritability, prenatal hormone transfer, and association with sexual orientation. Arch. Sex. Behav. 2012, 41, 711–724. [Google Scholar] [CrossRef] [Scilit] [PubMed]
- Myers, L.; Van’t Westeinde, A.; Kuja-Halkola, R.; Tammimies, K.; Bölte, S. 2D:4D ratio in neurodevelopmental disorders: A twin study. J. Autism Dev. Disord. 2018, 48, 3244–3252. [Google Scholar] [CrossRef] [Scilit] [PubMed]
- Ahrenfeldt, L.J.; Christensen, K.; Segal, N.L.; Hur, Y.-M. Opposite-sex and same-sex twin studies of physiological, cognitive and behavioral traits. Neurosci. Biobehav. Rev. 2020, 108, 322–340. [Google Scholar] [CrossRef] [Scilit] [PubMed]
- Geschwind, N.; Galaburda, A.M. Cerebral lateralization: Biological mechanisms, associations, and pathology: II. A hypothesis and a program for research. Arch. Neurol. 1985, 42, 521–552. [Google Scholar] [CrossRef] [Scilit] [PubMed]
- van Anders, S.M.; Vernon, P.A.; Wilbur, C.J. Finger-length ratios show evidence of prenatal hormone-transfer between opposite-sex twins. Horm. Behav. 2006, 49, 315–319. [Google Scholar] [CrossRef] [Scilit] [PubMed]
- Banyeh, M.; Nyewie, M.; Abdulai, A.; Nkansah, C.; Abbam, G.; Kangkpi, T.; Zogli, K.E.; Shittu, S.O.; Bure, D.; Wemegah, R.K.; et al. Twin testosterone transfer hypothesis and the second-to-fourth digit ratio in females of same-sex and opposite-sex twin pairs: An exploratory study. Physiol. Rep. 2025, 13, e70207. [Google Scholar] [CrossRef] [Scilit] [PubMed]
- Cohen-Bendahan, C. Biological Roots of Sex Differences: A Longitudinal Twin Study. Doctoral Dissertation, University Medical Center Utrecht, Utrecht, the Netherlands, 2005. [Google Scholar]
- Medland, S.E.; Loehlin, J.C.; Martin, N.G. No effects of prenatal hormone transfer on digit ratio in a large sample of same- and opposite-sex dizygotic twins. Personal. Individ. Differ. 2008, 44, 1225–1234. [Google Scholar] [CrossRef] [Scilit]
- DeBruine, L. AutoMetric 2.2 Software for Measurement of 2D:4D Ratios; University of Glasgow: Glasgow, UK, 2006; Unpublished. [Google Scholar]
- Palmer, A.R.; Strobeck, C. Fluctuating asymmetry: Measurement, analysis, patterns. Ann. Rev. Ecol. Syst. 1986, 17, 391–421. [Google Scholar] [CrossRef]
- Palmer, A.R.; Strobeck, C. Fluctuating asymmetry analyses revisited. In Developmental Instability (DI): Causes and Consequences; Polak, M., Ed.; Oxford University Press: Oxford, UK, 2003; pp. 279–319. [Google Scholar]
- Benítez, H.A.; Lemic, D.; Villalobos-Leiva, A.; Bažok, R.; Órdenes-Claveria, R.; Pajač Živković, I.; Mikac, K.M. Breaking symmetry: Fluctuating asymmetry and geometric morphometrics as tools for evaluating developmental instability under diverse agroecosystems. Symmetry 2020, 12, 1789. [Google Scholar] [CrossRef] [Scilit]
- Voracek, M.; Manning, J.T.; Dressler, S.G. Repeatability and interobserver error of digit ratio (2D:4D) measurements made by experts. Am. J. Hum. Biol. 2007, 19, 142–146. [Google Scholar] [CrossRef] [Scilit] [PubMed]
- Richards, G.; James, T.K. A comparison of self-measured and researcher-measured digit ratio (2D:4D). Ann. Hum. Biol. 2019, 46, 527–530. [Google Scholar] [CrossRef] [Scilit] [PubMed]
- Galiano, V.; Solazzo, G.; Rabinovici, J.; Nahid, F.; Baccarelli, R.H.; Machtinger, A.A. Cord blood androgen levels of females from same sex and opposite sex twins—A pilot study. Clin. Endocrinol. 2021, 94, 85–89. [Google Scholar] [CrossRef] [Scilit] [PubMed]
- Wilson, J.M.; Manning, J.T. Fluctuating asymmetry and age in children: Evolutionary implications for the control of developmental stability. J. Hum. Evol. 1996, 30, 529–537. [Google Scholar] [CrossRef] [Scilit]
- Rose, R.J.; Reed, T.; Bogle, A. Asymmetry of a-b ridge count and behavioral discordance of monozygotic twins. Behav. Genet. 1987, 17, 125–140. [Google Scholar] [CrossRef] [Scilit] [PubMed]
- Bogle, A.C.; Reed, T.; Rose, R.J. Replication of asymmetry of a-b ridge count and behavioral discordance in monozygotic twins. Behav. Genet. 1994, 24, 65–72. [Google Scholar] [CrossRef] [Scilit] [PubMed]
- Markow, T.A.; Gottesman, I.I. Dermatoglyphic fluctuating asymmetry in twins and singletons. Hereditas 1989, 110, 211–215. [Google Scholar] [CrossRef] [Scilit] [PubMed]
- Sokol, D.K.; Moore, C.A.; Rose, R.J.; Williams, C.J.; Reed, T.; Christian, J.C. Intrapair differences in personality and cognitive ability among young monozygotic twins distinguished by chorion type. Behav. Genet. 1995, 25, 457–466. [Google Scholar] [CrossRef] [Scilit] [PubMed]
- Bogle, A.C.; Reed, T.; Norton, J.A., Jr. Within-pair differences in a-b ridge count asymmetry in monozygotic twins: Evidence for a placental proximity effect. Hum. Hered. 1994, 44, 162–168. [Google Scholar] [CrossRef] [Scilit] [PubMed]
- Whitlock, M. The heritability of fluctuating asymmetry and the genetic control of developmental stability. Proc. R. Soc. London. Ser. B Biol. Sci. 1996, 263, 849–853. [Google Scholar] [CrossRef] [Scilit] [PubMed]
- Graham, J.H. Nature, nurture, and noise: Developmental instability, fluctuating asymmetry, and the causes of phenotypic variation. Symmetry 2021, 13, 1204. [Google Scholar] [CrossRef] [Scilit]
- Graham, J.H. Random developmental variation of human phenotypic traits, as estimated by fluctuating asymmetry and twin studies. İstanbul Antropoloji Derg. Istanb. Anthropol. Rev. 2021, 1, 1–10. [Google Scholar] [CrossRef] [Scilit]
- Manning, J.T.; Fink, B.; Neave, N.; Caswell, N. Photocopies yield lower digit ratios (2D:4D) than direct finger measurements. Arch. Sex. Behav. 2005, 34, 329–333. [Google Scholar] [CrossRef] [Scilit] [PubMed]
- Fink, B.; Manning, J.T. Direct versus indirect measurement of digit ratio: New data from Austria and a critical consideration of clarity of report in 2D:4D studies. Early Hum. Dev. 2018, 127, 28–32. [Google Scholar] [CrossRef] [Scilit] [PubMed]
- Ribeiro, E.; Neave, N.; Morais, R.N.; Manning, J.T. Direct versus indirect measurement of digit ratio (2D:4D): A critical review of the literature and new data. Evol. Psychol. 2016, 14, 147470491663253. [Google Scholar] [CrossRef] [Scilit]
- Manning, J.T.; Fink, B.; Neave, N.; Szwed, A. The second to fourth digit ratio and asymmetry. Ann. Hum. Biol. 2006, 33, 480–492. [Google Scholar] [CrossRef] [Scilit] [PubMed]
- Putz, D.A.; Gaulin, S.J.C.; Sporter, R.J.; McBurney, D.H. Sex hormones and finger length: What does 2D:4D indicate? Evol. Hum. Behav. 2004, 25, 182–199. [Google Scholar] [CrossRef] [Scilit]
- Graham, J.H.; Özener, B. Fluctuating asymmetry of human populations: A review. Symmetry 2016, 8, 154. [Google Scholar] [CrossRef] [Scilit]
- Richards, G.; Bellin, W.; Davies, W. Familial digit ratio (2D:4D) associations in a general population sample from Wales. Early Hum. Dev. 2017, 112, 14–19. [Google Scholar] [CrossRef] [Scilit] [PubMed]
- Bagepally, B.S.; Majumder, J.; Kotadiya, S. Association between the 2d:4d and cardiovascular risk factors: Body mass index, blood pressure and body fat. Early Hum. Dev. 2020, 151, 105193. [Google Scholar] [CrossRef] [Scilit] [PubMed]
- Milne, B.J.; Belsky, J.; Poulton, R.; Thomson, W.M.; Caspi, A.; Kieser, J. Fluctuating asymmetry and physical health among young adults. Evol. Hum. Behav. 2003, 24, 53–63. [Google Scholar] [CrossRef] [Scilit]
- Nan, C.; Guo, B.; Warner, C.; Fowler, T.; Barrett, T.; Boomsma, D.; Nelson, T.; Whitfield, K.; Beunen, G.; Thomis, M.; et al. Heritability of body mass index in pre-adolescence, young adulthood and late adulthood. Eur. J. Epidemiol. 2012, 27, 247–253. [Google Scholar] [CrossRef] [Scilit] [PubMed]

Disclaimer/Publisher’s Note: The statements, opinions and data contained in all publications are solely those of the individual author(s) and contributor(s) and not of MDPI and/or the editor(s). MDPI and/or the editor(s) disclaim responsibility for any injury to people or property resulting from any ideas, methods, instructions or products referred to in the content. |
© 2026 by the authors. Licensee MDPI, Basel, Switzerland. This article is an open access article distributed under the terms and conditions of the Creative Commons Attribution (CC BY) license.