


Abstract
Unsupervised anomaly detection has been extensively studied. However, most existing methods are designed for either numerical or nominal data, which struggle to detect anomalies effectively in real-world mixed-type datasets. Fuzzy information granulation is a key concept in granular computing, which offers a potent framework for managing uncertainty in mixed-type data and provides a viable pathway for unsupervised anomaly detection. Nevertheless, conventional fuzzy information granulation-based detection methods often model only simple, linear fuzzy relations between samples. This limitation prevents them from capturing the complex, nonlinear structures inherent in the data, leading to a degradation in detection performance. To address these shortcomings, we propose a Hybrid Kernelized Fuzzy Density-based anomaly detector (HKFD). HKFD pioneers a hybrid kernelized fuzzy relation by integrating a hybrid distance metric with kernel methods. This new relation allows us to define a hybrid kernelized fuzzy density for each sample within every feature subspace, effectively capturing the local data dispersion. Crucially, we introduce an information-theoretic weighting mechanism. By calculating the fuzzy information entropy of each feature’s distribution, HKFD automatically assigns higher weights to more informative feature subspaces that contribute more to identifying anomalies. The final anomaly factor is then calculated by the weighted fusion of these densities. Comprehensive experiments on 20 datasets demonstrate that HKFD significantly outperforms state-of-the-art methods, achieving superior anomaly detection performance.
1. Introduction
Anomaly detection, also known as outlier detection [1,2], refers to the task of identifying data instances that deviate significantly from the majority of data, often referred to as the norm. These non-conforming instances are defined as anomalies or outliers. This task is of critical importance across a diverse range of high-impact domains, including financial fraud detection, network intrusion security, and medical diagnostics.
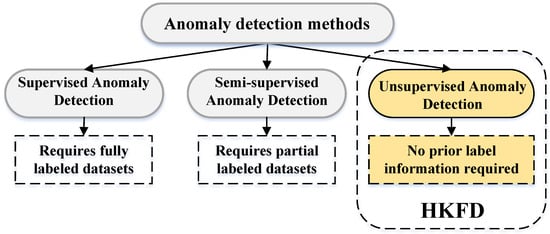
Based on the availability of labels, anomaly detection methods can be categorized into supervised, semi-supervised, and unsupervised methods, as illustrated in Figure 1. Supervised methods require a fully labeled dataset containing both normal and anomaly instances, which is often impractical. Anomalies are by nature rare, and their patterns may be unknown in advance. Unsupervised anomaly detection operates under the most challenging and realistic scenario, assuming the dataset is predominantly normal and contains no labels. The core assumption of unsupervised anomaly detection is that anomalies are both few and different from the normal data. Unlike methods requiring prior knowledge, our proposed HKFD is an unsupervised approach that identifies anomalies by exploring intrinsic data structures.
Figure 1.
A conceptual taxonomy of anomaly detection approaches categorized by label availability. Our proposed HKFD belongs to the unsupervised category, which directly explores the intrinsic data distribution without requiring labeled samples.
Over the past decades, a multitude of unsupervised anomaly detection methods have been proposed. These methods can be broadly classified into several major categories. Statistical-based methods [3,4] posit a statistical model (e.g., a Gaussian distribution) to represent the normal data. Instances that have a low probability of being generated by this model are declared anomalies. However, these methods rely on strong assumptions about the data distribution, which are often violated in complex and high-dimensional real-world data. Distance-based methods [5,6,7], such as k-Nearest Neighbors (k-NN) [7], are built on the premise that anomalies are located far from their nearest neighbors. Their primary drawback is the curse of dimensionality. In high-dimensional spaces, the contrast in distances between the nearest and farthest neighbors becomes negligible, rendering the distance metric unreliable. Density-based methods [8,9,10], such as Local Outlier Factor (LOF) [8], refine the distance-based concept by comparing the local density of an instance to that of the neighbors. This allows them to identify anomalies in regions of varying density. Nonetheless, their performance is highly sensitive to parameter choices, and their computational complexity, often , makes them unsuitable for large datasets. Clustering-based methods [11,12] operate on the assumption that normal data instances belong to large and dense clusters, while anomalies are either isolated or belong to very small, sparse clusters. The effectiveness of these methods is highly contingent on the success of the underlying clustering algorithm. Consequently, these methods are often optimized for cluster quality rather than for anomaly detection. Deep learning-based methods [13,14] have recently emerged as a powerful paradigm. Methods such as Autoencoders (AE) and Generative Adversarial Networks (GANs) learn a compact, nonlinear representation of the normal data manifold. Instances that cannot be faithfully reconstructed are considered anomalies. While effective, they often require large amounts of clean training data and are prone to overgeneralization.
In parallel to these developments, methods based on Fuzzy Information Granulation (FIG) have emerged as another important category. As a core concept within Granular Computing (GrC), FIG provides a theoretical framework for managing uncertainty. By using fuzzy set theory and the concept of a fuzzy relation, these methods assign degrees of membership rather than binary labels. This makes them inherently suitable for modeling the uncertainty in data and provides a flexible mechanism to uniformly model the similarity between samples in heterogeneous, mixed-type data spaces. Methods based on FIG effectively reflect the anomaly degree of a sample by introducing various uncertainty measures, such as fuzzy information entropy [15] and fuzzy approximation accuracy [1]. However, most existing FIG-based methods only consider simple linear fuzzy relations between samples, failing to effectively model the complex nonlinear relationships within the data. To this end, kernel methods have been introduced into FIG to construct Kernelized FIG (KFIG). In KFIG, the fuzzy relation between samples can be constructed by various kernel methods instead of simple linear distance metrics. The rationale is that traditional linear metrics, such as Euclidean distance, assume simple geometric structures in the input space, which often fail for real-world complex data with nonlinear distributions. By employing kernel functions, samples are implicitly mapped into a high-dimensional feature space. This enhances the model’s ability to capture complex relationships between samples in the data, thereby improving its anomaly detection performance [16,17]. Nevertheless, existing KFIG-based methods still rely on a simple combination of Euclidean distance and a Gaussian kernel, which cannot effectively handle mixed-type data.
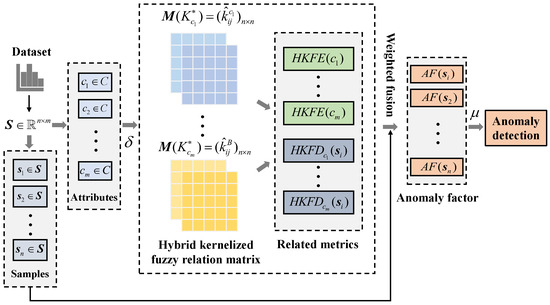
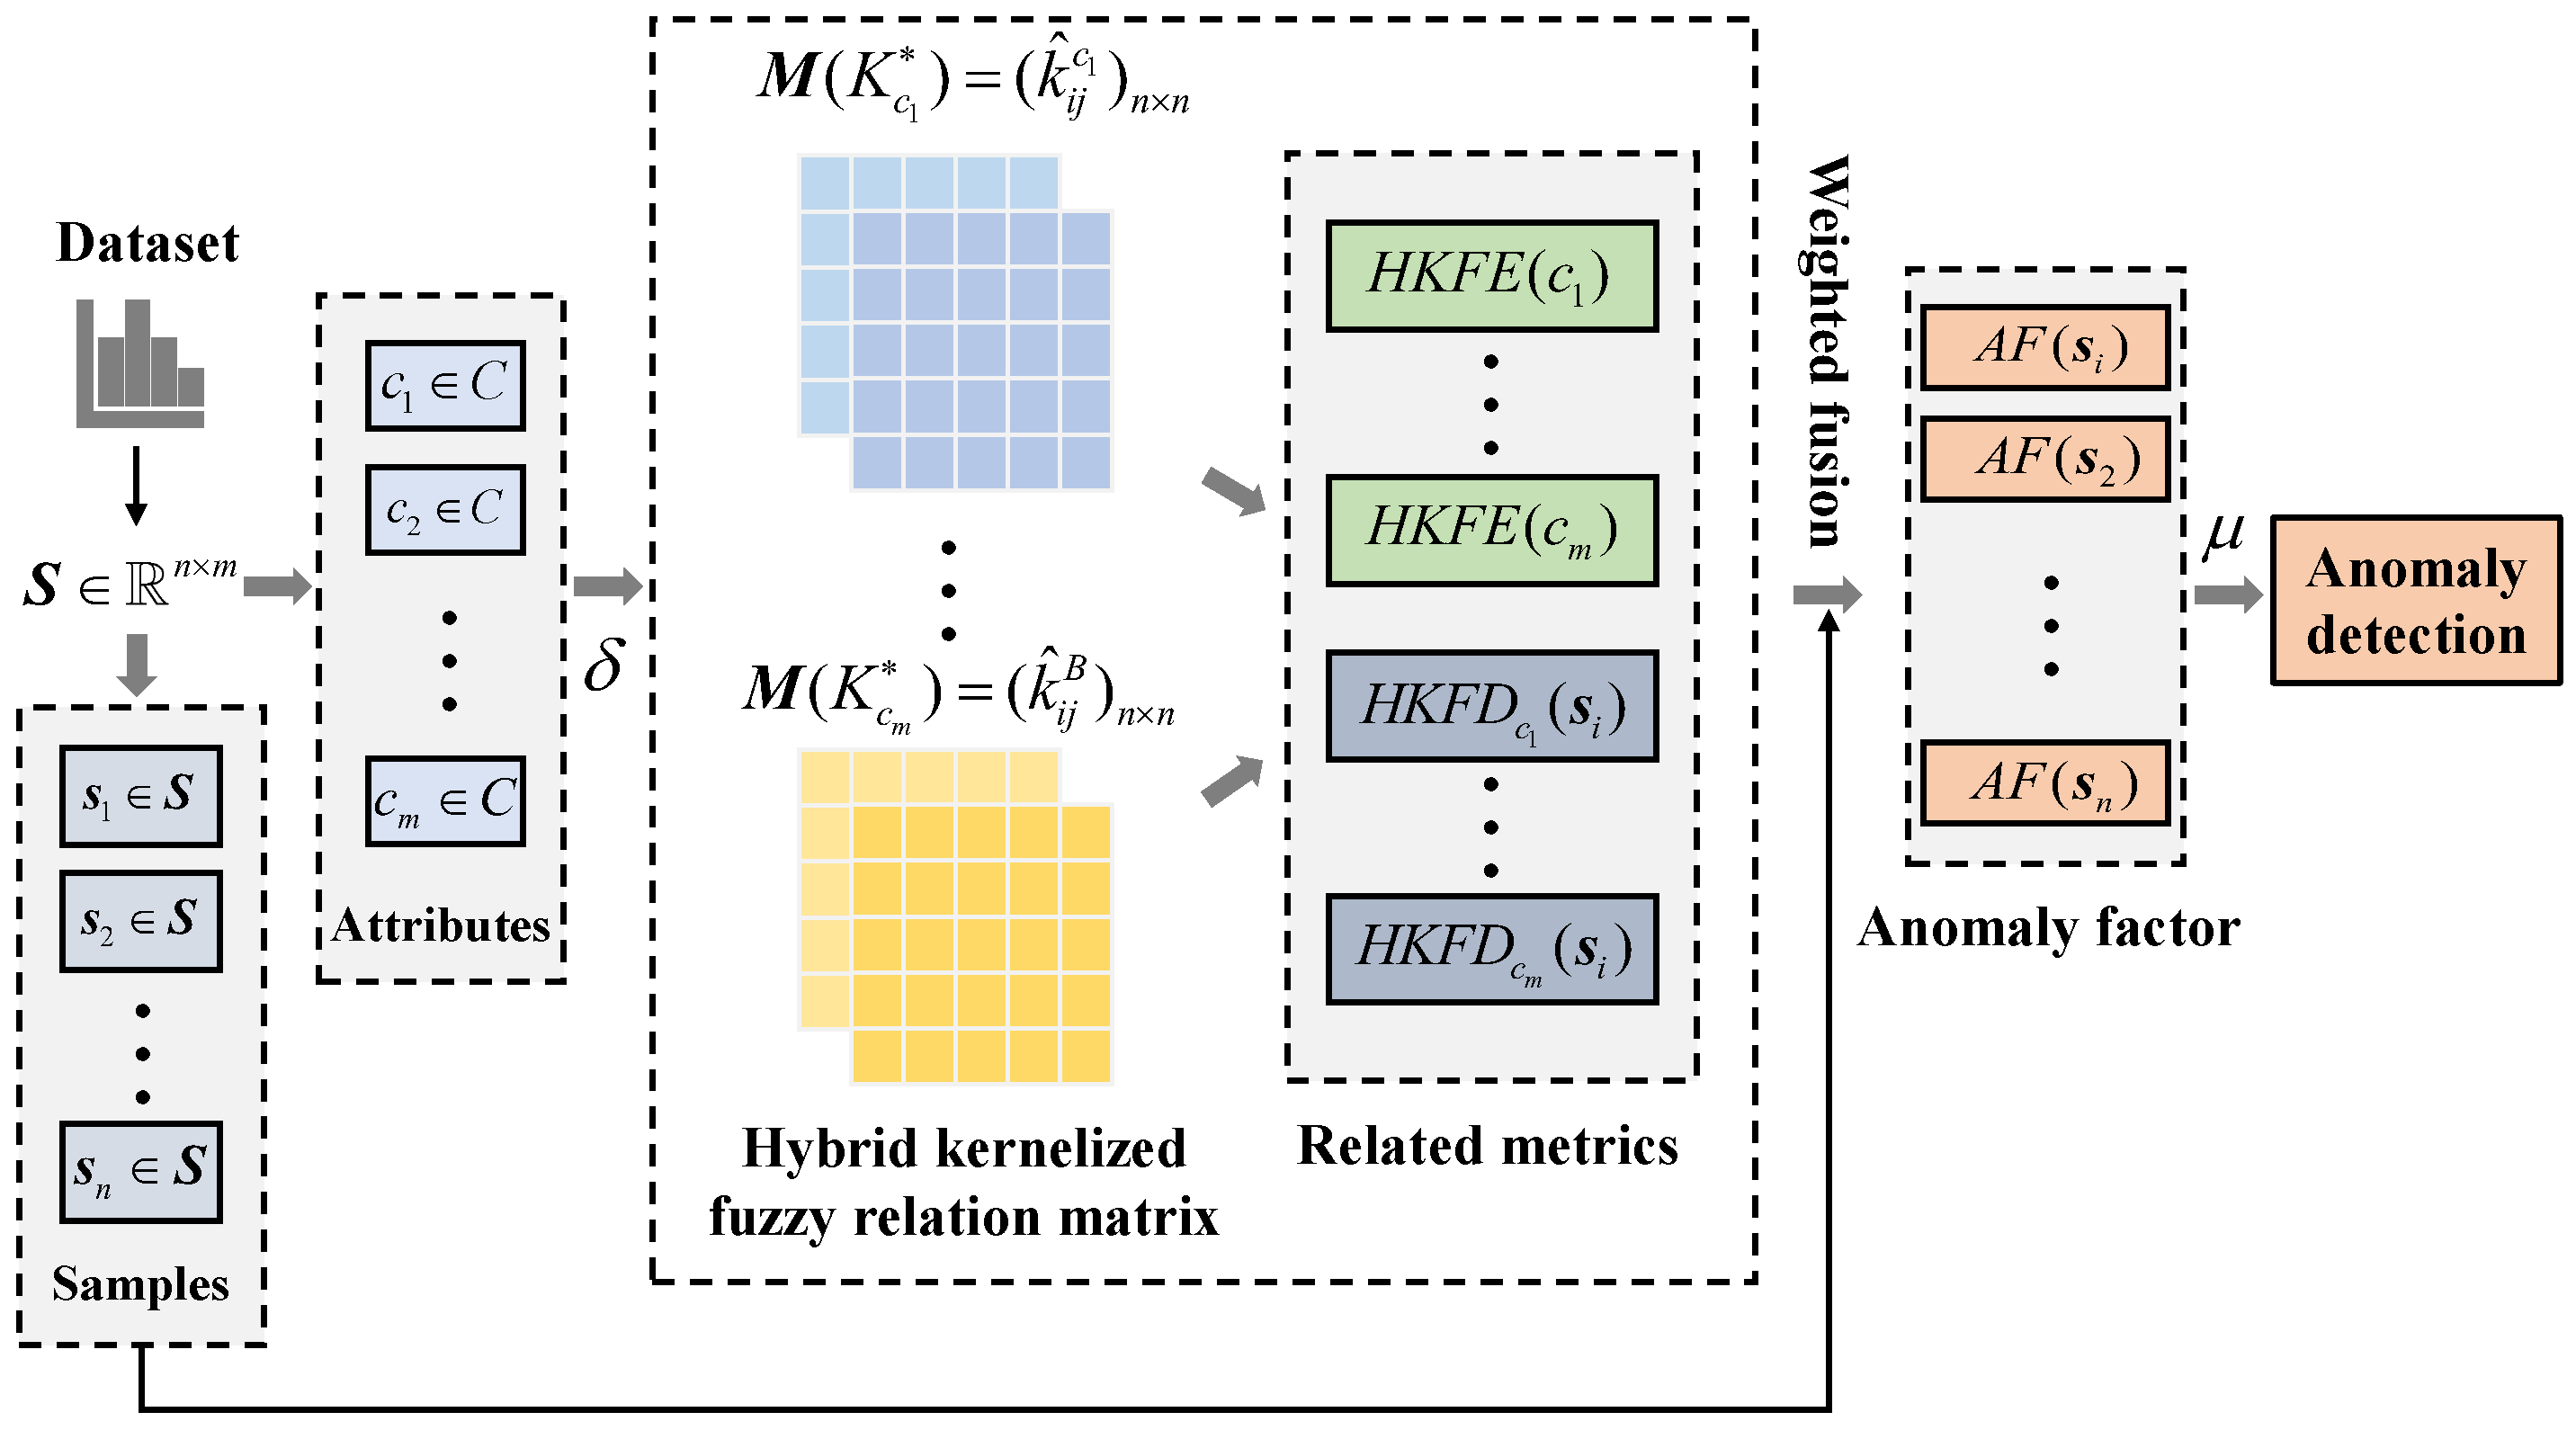
Based on the above discussion, in this study, we propose an unsupervised anomaly detection method for mixed-type data, named the Hybrid Kernelized Fuzzy Density-based anomaly detector (HKFD). The framework of HKFD is presented in Figure 2. To simultaneously address the challenges of nonlinearity and data heterogeneity, HKFD first pioneers a hybrid kernelized fuzzy relation. This is achieved by integrating a hybrid distance metric, capable of processing both numerical and categorical attributes, directly into a kernel function. This new relation allows us to define a hybrid kernelized fuzzy density for each sample within every single feature subspace, effectively capturing the local data dispersion in a nonlinear fashion. Furthermore, to distinguish the varying importance of different features, we introduce an information-theoretic weighting mechanism. By calculating the fuzzy information entropy of each feature’s distribution, HKFD automatically assigns higher weights to more informative feature subspaces, which are more critical for identifying anomalies. The final anomaly factor is then calculated as the weighted fusion of these individual densities. The main contributions of this study are summarized as follows:
Figure 2.
Framework figure of HKFD.
- We propose HKFD, a novel unsupervised anomaly detection framework designed to effectively handle complex nonlinear relationships in mixed-type datasets.
- We introduce a hybrid kernelized fuzzy relation. This relation integrates a hybrid distance metric with a kernel function, enabling a unified and nonlinear similarity measurement for heterogeneous data.
- We conduct comprehensive experiments on 20 real-world datasets. The results demonstrate that HKFD achieves significant and consistent performance gains over existing state-of-the-art anomaly detection methods.
The remaining sections of this study are organized as follows.
2. Related Works
In this section, we provide a focused review of the literature most relevant to the proposed HKFD, specifically concentrating on anomaly detection methods derived from FIG. The core idea of FIG-based anomaly detection is to quantify an instance’s abnormality by measuring the uncertainty associated with it. A common strategy is to construct fuzzy information granules around data points and then evaluate the properties of these granules. For instance, instances that are isolated or belong to very small, sparse granules are often considered anomalies. Over the years, researchers have proposed various uncertainty measures to quantify this.
For example, Yuan et al. [15] utilized a fuzzy approximate space with a fuzzy similarity relation to construct a fuzzy information entropy-based hybrid attribute anomaly detection method. Yuan et al. [1] introduced fuzzy rough sets to address the anomaly detection problem in mixed-type data. They generalized the anomaly detection model using FRS, constructing a generalized anomaly detection model based on fuzzy rough granules. Yuan et al. [18] first employed a hybrid metric to calculate the fuzzy relation, then built forward and reverse multi-fuzzy granules based on attribute importance and defined an anomaly score based on these ranked sequences. Addressing the limitation that existing techniques are mainly for deterministic data, Liu et al. [19] proposed an anomaly detection method combining fuzzy granules and a Markov random walk. Wang et al. [20] proposed a distance-based fuzzy rough entropy and its correlation measure, designing an anomaly detection method based on this fuzzy rough entropy. Chen et al. [21] proposed a novel information fusion model based on multi-scale fuzzy granules and combined it with fuzzy rough set theory to present an unsupervised anomaly detection algorithm. Subsequently, to enhance model efficiency and the perception of multi-granularity information, many methods combining FIG and granular-ball computing were proposed. For example, Su et al. [22] combined FIG and granular-ball computing, proposing the use of granular-ball fuzzy approximation accuracy to characterize the anomaly degree. Su et al. [23] also proposed detecting anomalies by fusing multi-granular-ball fuzzy information. Furthermore, Su et al. [9] integrated FIG, granular-ball computing, and LOF, proposing the use of local granular-ball density for anomaly detection.
Despite this progress, these methods all rely on simple linear distance metrics to construct the fuzzy relation matrix. This prevents them from effectively modeling the complex nonlinear relationships in the data, leading to a degradation in anomaly detection performance. To this end, Wu et al. [16] combined kernel functions with FIG and applied it to unsupervised anomaly detection. They proposed kernelized fuzzy approximation accuracy to quantify the anomaly degree. Li et al. [17] fused kernel functions, FIG, and granular-ball computing into a unified framework. They proposed multi-granularity kernelized fuzzy approximation accuracy to detect anomalies. However, when constructing the kernelized fuzzy relation, these methods rely solely on simple Euclidean distance, making them ineffective for handling mixed-type data. This specific gap in the literature motivates the development of our proposed HKFD, which is designed to simultaneously model nonlinear relationships and process heterogeneous attributes.
To provide a comprehensive overview of the current research landscape, we systematically summarize the key characteristics of the aforementioned anomaly detection methods in Table 1. The comparison is conducted across several dimensions, including their core mechanisms, supported data types, advantages, disadvantages, and commonly used benchmark datasets.
Table 1.
Comparison of existing anomaly detection methods.
Based on the comparison in Table 1, the feature handling strategies of these FIG-based methods can be further analyzed through three structured dimensions. First, regarding nonlinearity, while earlier methods like FIEOD and FRGOD rely on linear fuzzy relations that struggle with complex manifolds, recent kernelized approaches (e.g., KFRAD and KFGOD) successfully capture high-order dependencies by mapping data into high-dimensional spaces. Second, in terms of robustness to noise, the fuzzy granulation mechanism inherent in all these methods provides a “soft” boundary, which is naturally more tolerant to data perturbations and outliers than crisp distance-based models. Finally, scalability remains a primary differentiator; granular-ball-based methods (e.g., GBFRD and GBDO) achieve high efficiency by reducing data volume into coarse-grained representations, whereas traditional FIG and kernelized FIG models often entail substantial computational overhead due to the construction of full fuzzy relation matrices. By synthesizing these strategies, our proposed HKFD aims to bridge the gap between nonlinear mixed-type data handling and effective density estimation within the FIG framework.
3. Preliminaries
We use a dataset that contains n samples and m attributes. The i-th sample in can be denoted as , where represents the j-th attribute value of sample .
In contrast to classical sets, which are defined by crisp, binary membership (i.e., an element is either in the set or not), a fuzzy set is characterized by a membership function.
This function maps each element in the universe of discourse to a real value in the interval , representing its degree of belonging to the set. If f is a mapping from to , i.e., , then is a fuzzy set on . The fuzzy set f can also be represented as . It is important to note that this is a standard symbolic notation in fuzzy set theory, where the horizontal bar “/” serves as a delimiter and the plus signs represent a collection, rather than arithmetic division or addition. For any , is called the membership function of the fuzzy set f, or the membership degree of the sample to the fuzzy set f. All fuzzy sets on can be denoted as .
The algebra of fuzzy sets is defined by several fundamental operations, analogous to classical set theory. We formally define inclusion, equality, union, intersection, and complement below. Given any two fuzzy sets , the following operations and relations are defined for all :
- Inclusion relation: , if ;
- Equality relation: , if ;
- Union operation: ;
- Intersection operation: ;
- Complement operation: .
The concept of a fuzzy set can be extended to define relationships between pairs of elements. A fuzzy relation R from to is a fuzzy set R on , characterized by a mapping, i.e., . For any pair , the membership degree quantifies the degree of relationship between the sample and the sample . When R is a relation from to , it is simply called a fuzzy relation on . For a finite dataset, a fuzzy relation R on is conveniently represented by an fuzzy matrix, i.e., . Within this matrix, each row vector can be interpreted as a fuzzy set, describing the relationship of the i-th sample to all other samples. We use to denote the set of all fuzzy relations on . As a fuzzy relation is a specific type of fuzzy set, the standard operations of union, intersection, and complement also apply.
Let C be the set of conditional attributes in . For any attribute subset , we can define a specific fuzzy relation on . This mapping generates a fuzzy relation matrix . Each element quantifies a fuzzy relationship between the sample pair with regard to the attributes in B. Of particular importance is the fuzzy similarity relation, which is a fuzzy relation that satisfies two specific properties for any , i.e., (1) Reflexivity: ; (2) Symmetry: . This fuzzy similarity relation provides a mechanism to granulate the dataset . Each sample induces its own fuzzy information granule based on its relationship to all other samples. This collection of all such granules is defined as the family of fuzzy information granules. For any and any . can be granulated by into a set of fuzzy information granules, thereby forming the family of fuzzy information granules , which is defined as
where is the fuzzy information granule induced by and containing the sample . Similar to the representation of fuzzy sets, this notation is symbolic in nature, where the bar “/” facilitates the mapping between the relation degree and the pair of samples, rather than denoting arithmetic division.
Within the framework of FIG, fuzzy information entropy serves as a crucial metric for quantifying uncertainty. It is formally defined as follows:
Definition 1.
For any and any . The fuzzy information entropy with regard to B is defined as the following:
where denotes the cardinality of , which is calculated by .
To effectively capture the complex nonlinear relationships between samples, researchers have integrated kernel functions into fuzzy information granulation (FIG) and developed the KFIG framework. A function is defined as a kernel if it satisfies semi-positivity and symmetry for any [24]. Furthermore, any kernel K that fulfills the reflexivity condition for all is also guaranteed to satisfy -transitivity [24]. Several common kernel functions, such as the Rational Quadratic, Spherical, and Gaussian kernels, inherently satisfy all three properties, i.e., reflexivity, symmetry, and -transitivity. As a result, the fuzzy relations derived from these specific kernels are classified as fuzzy T-equivalence relations. The KFIG model is therefore constructed by substituting the standard fuzzy relations of FIG with these kernel functions.
Formally, for any , the kernelized fuzzy relation with regard to B on is defined as a fuzzy set on . This relation is represented in matrix form as , where each element quantifies the kernelized fuzzy relation between samples and with regard to B. As a special fuzzy relation, can also granulate to produce multiple kernelized fuzzy information granules, thereby forming the family of kernelized fuzzy information granules , which is defined as the following:
where is the kernelized fuzzy information granule induced by and containing the sample .
4. Hybrid Kernelized Fuzzy Density-Based Anomaly Detector
In this section, we introduce our novel unsupervised anomaly detection method, HKFD. We first introduce a hybrid kernelized fuzzy relation to effectively handle mixed-type data and model complex nonlinear relationships. Based on this, we define a hybrid kernelized fuzzy density to characterize the local dispersion degree of each sample within each feature subspace. Finally, we develop an information-theoretic weighting scheme and calculate the final anomaly factor by a weighted fusion of these densities.
4.1. Hybrid Kernelized Fuzzy Information Granulation
Considering that existing KFIG-based anomaly detection methods cannot effectively model the fuzzy relations between samples in mixed-type data, we propose a hybrid kernelized fuzzy relation. To effectively handle the nominal attributes in the data, we first introduce the overlap metric [25] to characterize the dissimilarity between samples in the nominal data.
Definition 2.
For any , the overlap metric between and on is calculated by
The overlap metric effectively captures the dissimilarity between samples in nominal data through direct attribute comparison. Next, we combine the overlap metric and the classic Euclidean distance to introduce the hybrid distance metric between samples.
Definition 3.
For any , the hybrid distance metric between and on is calculated by
where denotes the nominal attributes in B and denotes the numerical attributes in B; denotes the Euclidean distance between samples regarding the numerical attributes .
Next, we combine the previously proposed hybrid distance metric with the Gaussian kernel function to introduce the hybrid kernelized fuzzy relation, which is capable of effectively handling mixed-type data.
Definition 4.
For any , the hybrid kernelized fuzzy relation between and on is defined as follows:
where δ is the kernel bandwidth.
Based on the proposed hybrid kernelized fuzzy relation, we can achieve an effective granulation of the mixed-type data. Formally, for any , the hybrid kernelized fuzzy relation with regard to B on can be represented in matrix form as , where each element quantifies the hybrid kernelized fuzzy relation between samples and with regard to B. As a special fuzzy relation, can also granulate to produce multiple hybrid kernelized fuzzy information granules, thereby forming the family of hybrid kernelized fuzzy information granules , which is defined as follows:
where is the hybrid kernelized fuzzy information granule induced by and containing the sample . Assuming no ambiguity arises, we simplify to for notational convenience.
Leveraging the hybrid kernelized fuzzy information granules defined above, we extend the classical fuzzy information entropy to propose the hybrid kernelized fuzzy information entropy.
Definition 5.
For any and any . The hybrid kernelized fuzzy information entropy with regard to B is defined as follows:
where denotes the cardinality of .
Formally, the proposed appears identical in form to the classical . Their fundamental difference, however, lies in the fuzzy information granules used for their calculation, which are generated by different fuzzy relations. Our utilizes the novel hybrid kernelized fuzzy relation to effectively capture the complex nonlinear relationships between samples in mixed-type data. This allows to provide a more effective characterization and quantification of the data’s inherent uncertainty, overcoming the limitations of traditional fuzzy entropy measures that rely on linear or single-type distance metrics.
4.2. Detection Method
To effectively characterize the anomaly degree of each sample, we propose the following hybrid kernelized fuzzy density.
Definition 6.
For any and any . The hybrid kernelized fuzzy density of with regard to B is defined as follows:
where .
In the above definition, we define the hybrid kernelized fuzzy density of a sample by calculating the average cardinality of its kernelized fuzzy information granules across the different attributes in B. For a sample , if its is very small, it indicates that its similarity to the majority of other samples is low. Therefore, it has a higher probability of being an anomaly.
In the definition above, all attributes are assigned equal importance. This setting is clearly suboptimal, as in some real-world scenarios, only a small subset of attributes may be relevant for determining whether a sample is an anomaly. Therefore, to effectively measure the importance of different attributes and adaptively assign them appropriate weights, we leverage the previously proposed hybrid kernelized fuzzy information entropy. Finally, we calculate the anomaly factor for each sample as follows:
Definition 7.
For any . The anomaly factor of is defined as follows:
where denotes the weighting coefficient.
In the anomaly factor defined above, we adaptively assign reasonable weighting coefficients to different attributes based on the proposed hybrid kernelized fuzzy information entropy. The rationale for this weighting scheme is as follows: If the entropy of an attribute is larger, it implies that the distribution of its value domain is more disordered and uncertain. This high degree of uncertainty is often a key manifestation of anomalies, as anomalies are less likely to fit into a clear, low-entropy pattern. Therefore, the hybrid kernelized fuzzy density calculated from such an attribute provides more critical information for separating anomalies from normal samples and should be assigned a greater weight during the fusion process. It is evident that , as it is derived from the normalized kernelized fuzzy memberships. A higher value indicates that the sample possesses a lower fuzzy density relative to its neighbors, signifying a higher likelihood of being an anomaly, while a lower value suggests a normal data point.
4.3. Detection Algorithm
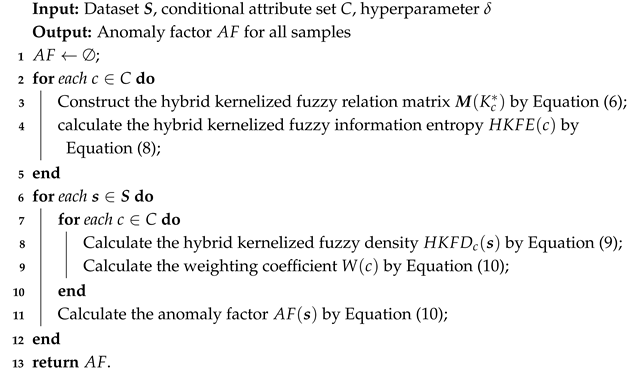
Based on the anomaly detection method proposed above, we formalize it as the HKFD algorithm. As outlined in Algorithm 1, the HKFD algorithm proceeds in several stages. First, we construct the hybrid kernelized fuzzy relation matrix for each attribute , respectively. Next, we calculate the hybrid kernelized fuzzy information entropy for each attribute, which is a prerequisite for the subsequent calculation of the attribute weighting coefficients. Then, we calculate the hybrid kernelized fuzzy density for each sample under each attribute, as well as the corresponding attribute weighting coefficient . Finally, we calculate the anomaly factor for each sample by performing a weighted fusion operation of its hybrid kernelized fuzzy densities over all attributes. It should be noted that from the detection task’s point of view, the returned values represent the final anomaly scores for all samples. In this unsupervised framework, the ’detection’ is realized through these scores, which characterize the anomaly degree of each sample. These scores enable the ranking of instances and serve as the direct input for evaluating the detection performance via threshold-independent metrics.
The primary computational bottleneck of this algorithm is the construction of the hybrid kernelized fuzzy relation matrix for each attribute. Calculating the matrix for a single attribute c requires comparing all pairs of samples, resulting in a time complexity of . Since this process must be repeated for all m attributes, the total time complexity of the HKFD algorithm is , where m and n represent the total number of attributes and samples in the dataset , respectively.
| Algorithm 1: HKFD algorithm |
 |
5. Experiments
In this section, we conduct comprehensive experiments to evaluate the performance of our proposed HKFD algorithm. We first introduce the datasets and the baseline methods used in our comparison. Next, we verify the effectiveness of HKFD through multiple experimental metrics. Then, we also conduct statistical analysis to further compare the significance of the results. Finally, we explore the sensitivity of HKFD to its hyperparameter .
5.1. Experimental Datasets
We select 20 real-world datasets commonly used for the task of unsupervised anomaly detection. The basic information of these datasets is summarized in Table 2. As shown in the table, the sample size of these datasets ranges from 111 to 4429, the attribute dimensionality ranges from 4 to 279, the number of anomalies ranges from 4 to 221, and the anomaly contamination rate varies from 1.7% to 23.5%.
Table 2.
Summary of the benchmark datasets.
5.2. Experimental Settings
To comprehensively evaluate the effectiveness of HKFD, we select 14 baseline methods covering a wide spectrum of anomaly detection paradigms, including statistical, proximity-based, granular-ball-based, and deep learning-based methods. Specifically, these methods include Rotation-based Outlier Detection (ROD) [26] and Empirical Cumulative distribution functions-based Outlier Detection (ECOD) [27] from the statistical perspective; Local Projection-based Outlier Detection (LPOD) [28], Virtual Outlier Score (VOS) [29], Mean-shift Outlier Detector (MOD+) [30], Directed density ratio Changing Rate-based Outlier Detection (DCROD) [31], and Anomaly Detection based on improved k-nearest Neighbor Rough Sets (ADkNRS) [32] representing the proximity and local density-based paradigm; local Granular-Ball Density-based Outlier detection (GBDO) [9], Granular-Ball Mean-shift Outlier Detector (GBMOD) [33], and Multi-Granular-Ball fuzzy information granules-based Outlier Detection (MGBOD) [23] as state-of-the-art granular-ball-based methods; and Deep Isolation Forest (DIF) [14], Deep Support Vector Data Description (DeepSVDD) [13], outlier detection using structural scores in a high-dimensional space (VarE) [34], and a novel joint learning framework for outlier detection in MIXed-type data with a MIXture of clustered and scattered outliers (MIX) [35] to assess performance against advanced neural networks and specialized mixed-type models. These methods are chosen to ensure a comprehensive and unbiased benchmark across diverse technical frameworks.
To ensure a fair comparison, several baseline methods require hyperparameter tuning to achieve their optimal performance. We establish appropriate search ranges for these methods. For GBDO and GBMOD, their number of neighbors is searched in the range with a step size of one, where denotes the number of generated granular-balls. For MGBOD, the fuzzy radius is searched from 0 to 1 at intervals of 0.05. For LPOD, VOS, MOD+, DCROD, and ADkNRS, we tune the number of neighbors k within the range with a step size of one. ROD and ECOD are parameter-free methods. For VarE, the hyperparameter search space is set to the discrete set . MIX is a stochastic method. We report the best result from ten independent runs as the final experimental outcome. DeepSVDD and DIF are deep learning-based methods, for which we adopt the default network architectures and settings recommended in their original publications. Finally, our proposed method, HKFD, involves a single hyperparameter to adjust the kernel bandwidth. We set the search range from 0.02 to 0.8 with a step of 0.02. We will explore the sensitivity of HKFD to in a subsequent experiment.
We select the Receiver Operating Characteristic (ROC) curve, Area Under the ROC Curve (AUC), and Average Precision (AP) as the evaluation metrics for our experiments. The ROC curve visually represents the trade-off between the true positive rate (recall) and the false positive rate as the detection threshold is varied. AUC summarizes this curve into a single scalar value, representing the probability that the model will rank a randomly chosen positive (anomaly) instance higher than a randomly chosen negative (normal) instance. AP summarizes the precision-recall curve and is particularly informative in highly imbalanced datasets, as it focuses on the performance ranking of the positive class (anomalies). For both AUC and AP, a higher value indicates superior detection performance.
To ensure a fair and rigorous comparison, we adopt an optimization strategy where hyperparameters for all methods are tuned independently for each dataset. Specifically, we conduct a grid search within the predefined ranges mentioned above. Since unsupervised anomaly detection lacks label information for traditional cross-validation, we report the best performance achieved on each dataset to represent the optimal capability of each algorithm.
5.3. Experimental Results
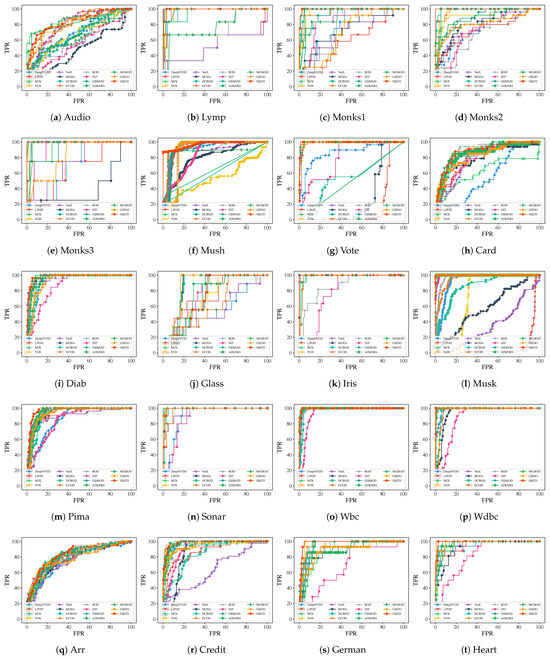
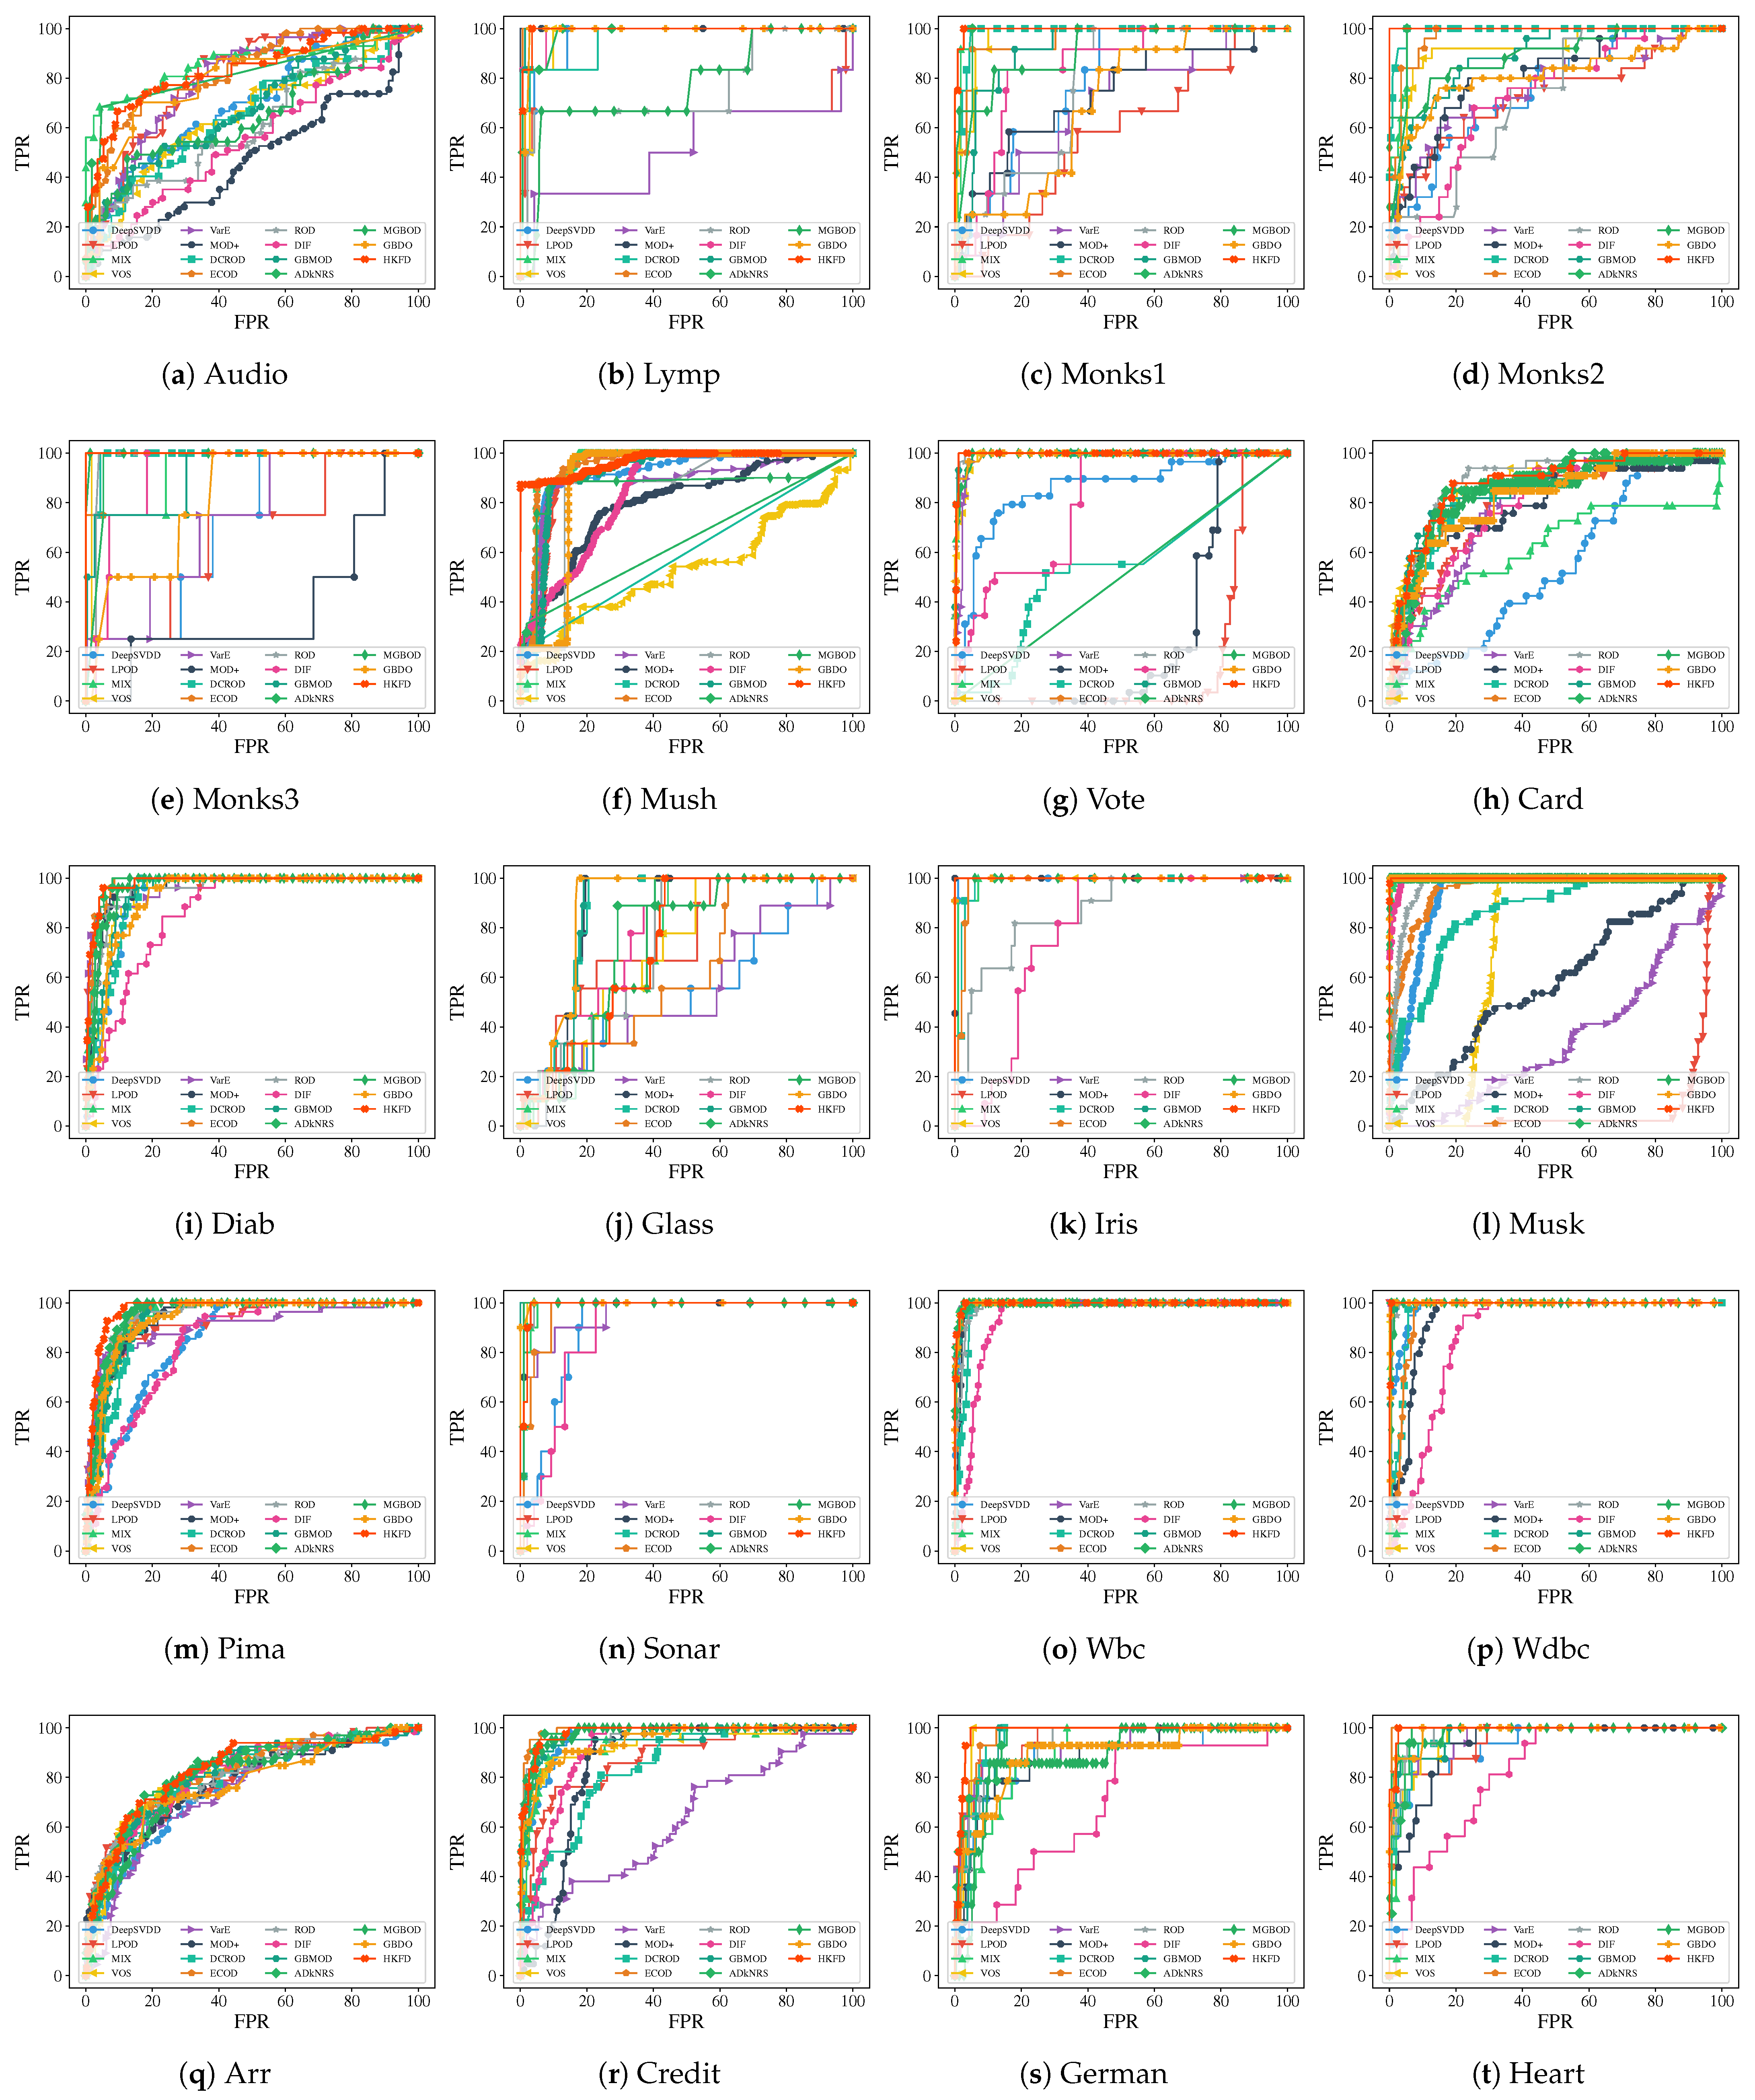
We first present the ROC curves for all methods on the 20 datasets, as shown in Figure 3. From the figure, the ROC curve of our method, HKFD, is closer to the top-left corner of the coordinate axis on datasets such as Monks1, Monks2, Monks3, Mush, Diab, Pima, and German. This indicates that HKFD outperforms other methods on these datasets, demonstrating superior anomaly detection performance. Due to the overlap of numerous ROC curves, the differences between methods can be difficult to further distinguish. Therefore, we further present the experimental results for AUC and AP in tabular form.
Figure 3.
Comparison of ROC curves for HKFD and baseline methods on all 20 datasets.
As shown in Table 3, we present the comparison of AUC scores for all 15 methods on the 20 datasets. In this table, HKFD achieves the first-place AUC score on 10 out of the 20 datasets and obtains the highest average AUC score. Our method’s average AUC score is 0.956, which is 2.0% higher than the second-best method. We further display the AP score comparison for the 15 methods on the 20 datasets. As shown in Table 4, HKFD achieves the first-place AP score on 7 out of the 20 datasets and the highest average AP score. Our method’s average AP score is 0.787, which is 10.1% higher than the second-best method. These experimental results consistently demonstrate that HKFD has better anomaly detection performance compared to other methods, thus verifying its effectiveness.
Table 3.
Comparison of AUC scores for HKFD against 14 methods across the 20 datasets. The best result on each dataset is highlighted in bold.
Table 4.
Comparisonof AP scores for HKFD against 14 methods across the 20 datasets. The best result on each dataset is highlighted in bold.
Furthermore, as observed from the results in Table 3 and Table 4, HKFD consistently achieves superior performance on purely nominal datasets, such as Monks1, Monks2, Monks3, Mush, and Vote. This advantage stems from the adoption of the hybrid kernelized fuzzy relation, which provides a more sophisticated mechanism for measuring similarities between categorical attributes compared to existing methods that rely on simple linear distance metrics or are restricted to numerical feature spaces.
Despite its robust performance, HKFD has certain limitations that warrant further investigation. First, the construction of the hybrid fuzzy relation matrix entails a computational complexity of . While acceptable for the benchmark datasets used in this study, this quadratic complexity limits the method’s direct scalability to million-scale datasets. Second, the current HKFD framework is optimized for static batch processing. In scenarios involving high-speed streaming data, the need to re-evaluate fuzzy information granules for new incoming samples could lead to efficiency bottlenecks. Developing an incremental version of HKFD for dynamic environments is a promising direction for future research.
5.4. Statistical Analysis
Referring to existing related research [9,10,22], we employ the Friedman test and the Nemenyi post-hoc test for a rigorous statistical analysis of the experimental results.
The Friedman test is a non-parametric statistical test designed to detect significant differences between multiple competing methods (our 15 methods) across multiple datasets (our 20 datasets). It operates by ranking the algorithms on each dataset based on their performance (e.g., AUC score). The null hypothesis of the Friedman test is that all algorithms perform equivalently, and thus their average ranks are statistically indistinguishable. If the test yields a p-value below a chosen significance level (e.g., ), this null hypothesis is rejected, confirming that statistically significant differences exist among the methods. When the Friedman test confirms a significant overall difference, it is necessary to use a post-hoc test to determine which specific pairs of algorithms are significantly different from each other. For this purpose, we use the Nemenyi post-hoc test. This test calculates a Critical Difference (CD) value. The performance between any two algorithms is considered statistically significantly different if the difference in their average ranks across all datasets exceeds this CD value.
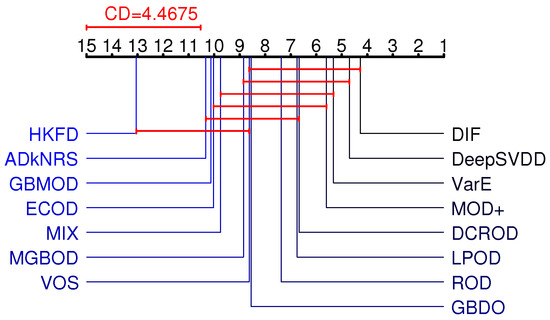
We employ the AUC results for this statistical analysis. As shown in Table 3, our experiments involve 15 methods and 20 datasets. Therefore, in the Friedman test, we can calculate the degrees of freedom for the distribution to be 14 and 266. We set the significance level , yielding a test statistic , which exceeds the critical value of 1.5303. This indicates that statistically significant differences exist among the 15 methods, necessitating the Nemenyi post-hoc test to further distinguish pairwise differences.
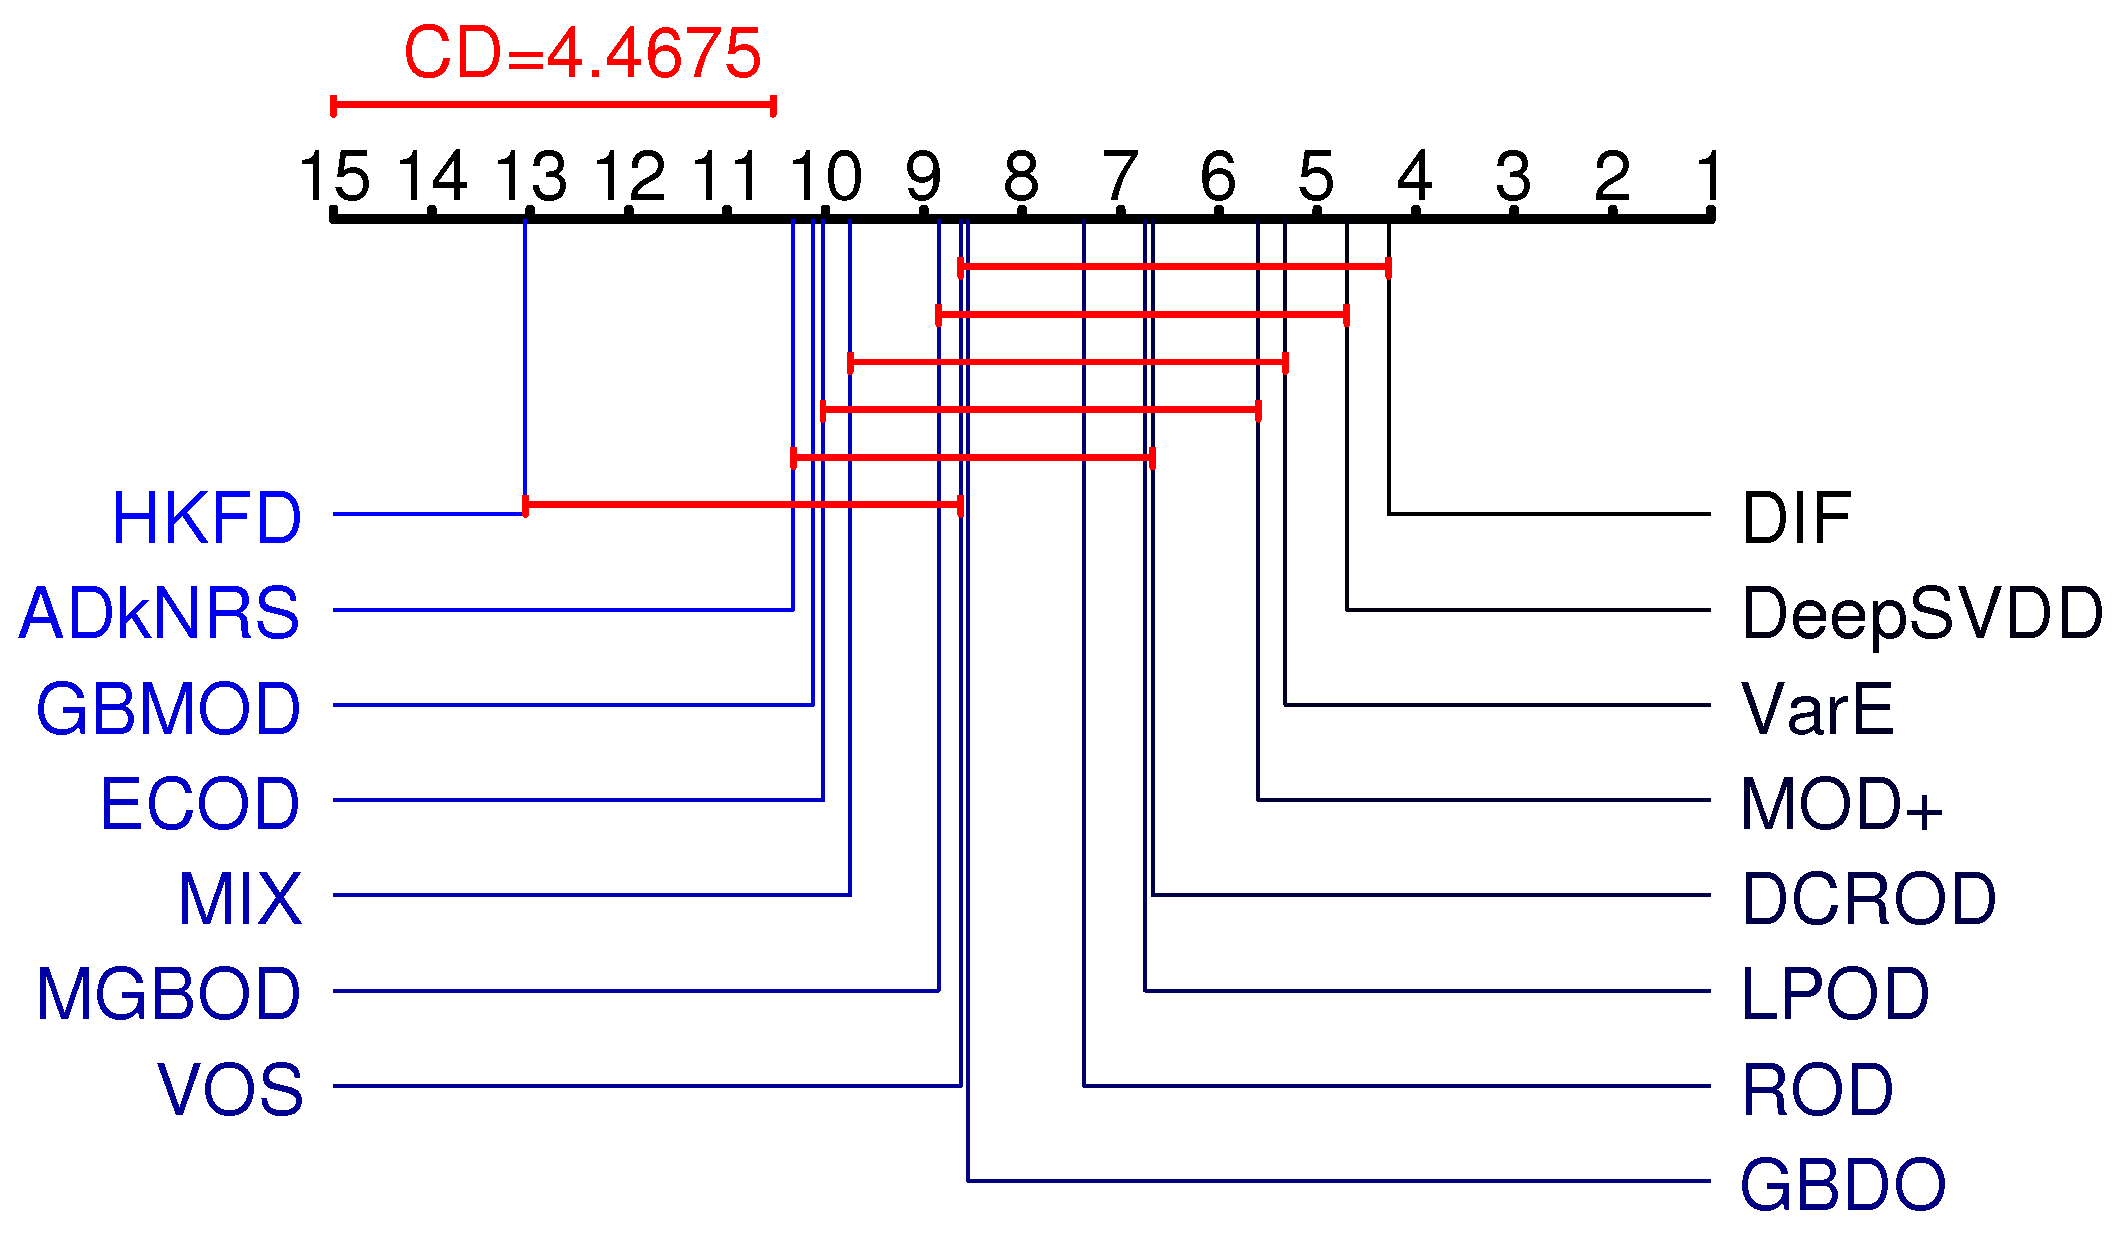
Also, at the significance level, we calculate the CD value as . To better compare the methods in the Nemenyi test, we visualize the results in Figure 4. From the figure, our method HKFD only has CD line segment overlaps with ADkNRS, GBMOD, ECOD, MIX, MGBOD, and VOS, for a total of six methods. This shows that there is no statistically significant difference between HKFD and these six methods, but there is a statistically significant difference between HKFD and the remaining eight methods.
Figure 4.
Nemenyi test figure on AUC.
5.5. Hyperparameter Sensitivity Analyses
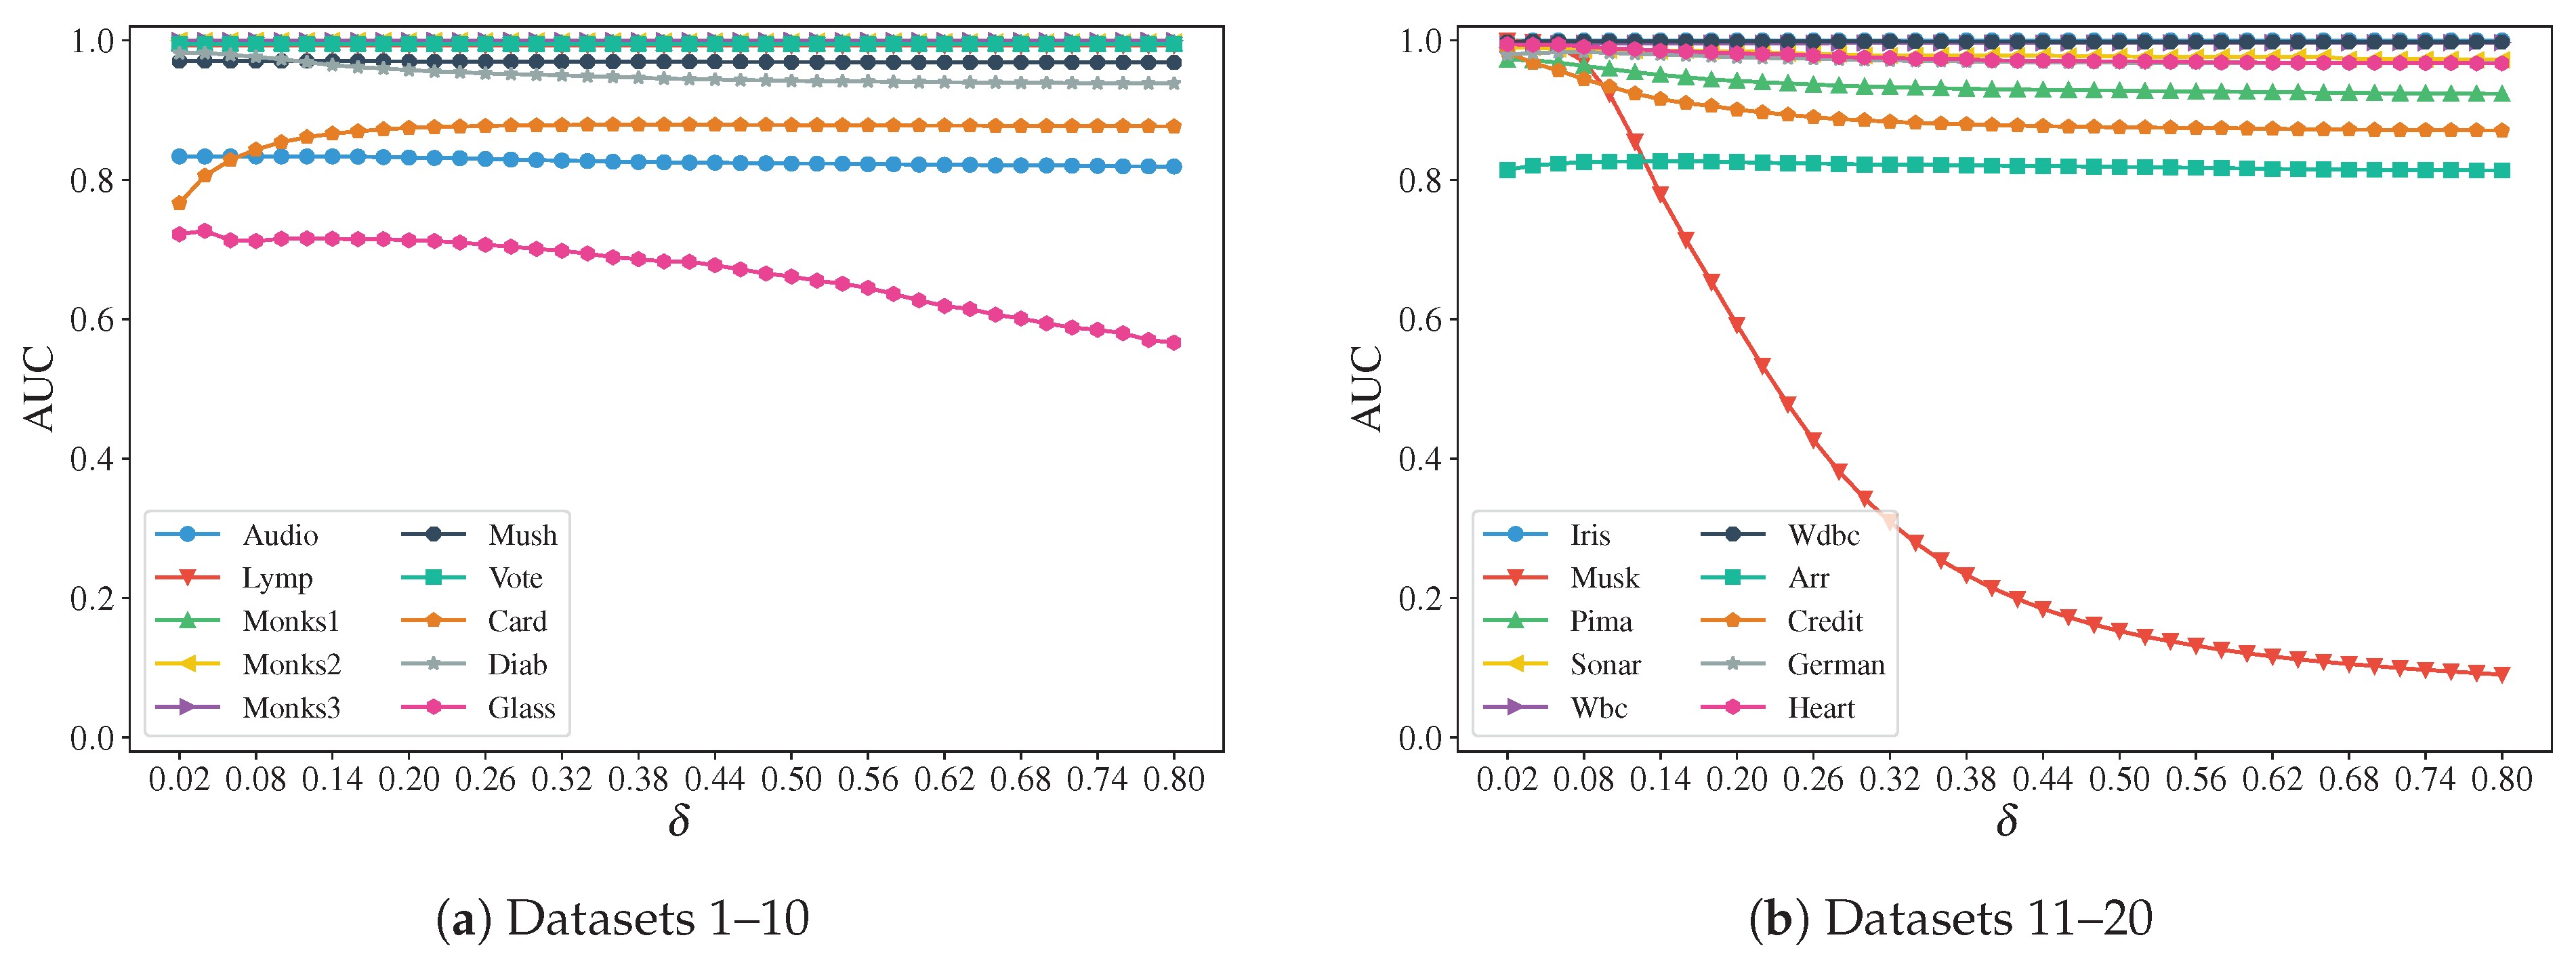
In the calculation of the hybrid kernelized fuzzy relation, HKFD involves one adjustable hyperparameter, , which controls the kernel bandwidth. We now analyze the sensitivity of HKFD to by observing the change in its AUC performance as varies.
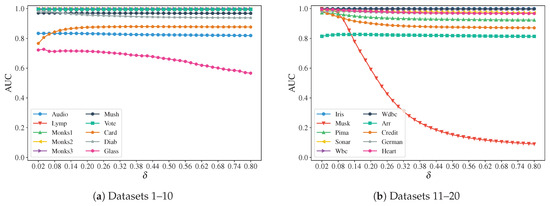
As shown in Figure 5, HKFD is relatively robust to changes in on most datasets, and its detection performance does not fluctuate excessively as increases. However, on some datasets, such as Glass, Credit, and Musk, the detection performance of HKFD gradually deteriorates as increases. This phenomenon can be explained by the role of the kernel bandwidth. The parameter controls the smoothness of the fuzzy similarity measure. When becomes too large (e.g., approaching 0.8), it leads to an over-smoothing effect. The value of will become relatively high even for samples that are moderately far apart. As a result, all samples, including anomalies, are considered more similar to each other. This causes the hybrid kernelized fuzzy density to be high for all samples, effectively flattening the density landscape and thus diminishing the model’s discriminative power.
Figure 5.
Hyperparameter sensitivity analysis of HKFD on AUC.
Overall, HKFD is not highly sensitive to the choice of in most cases. Based on the stable performance observed in the lower end of the tested range across many datasets, a recommended value could be selected from the interval .
6. Conclusions
In this study, we address the persistent challenges of unsupervised anomaly detection in mixed-type datasets. We proposed a novel framework, the HKFD. The core innovations of HKFD are twofold: First, it introduces a hybrid kernelized fuzzy relation by integrating a hybrid distance metric directly into a kernel function, enabling it to model nonlinear similarities for both numerical and categorical data. Second, it develops an information-theoretic weighting scheme based on hybrid kernelized fuzzy information entropy. This mechanism allows HKFD to evaluate the importance of each feature subspace adaptively, assigning higher weights to more uncertain and informative attributes that are critical for identifying anomalies. Comprehensive experiments were conducted on 20 real-world benchmark datasets against 14 state-of-the-art baseline methods. The results demonstrated the superior effectiveness and robustness of HKFD. Our method achieved the highest average AUC and AP scores. Furthermore, statistical analysis via the Friedman and Nemenyi tests confirmed that HKFD’s performance advantage is statistically significant over the majority of competitors. The sensitivity analysis also showed that HKFD remains effective across a stable range of its kernel bandwidth hyperparameter .
Despite its strong performance, HKFD has limitations. Its primary drawback is the computational complexity of , which is inherent in the construction of the kernelized fuzzy relation matrices for all m attributes. This makes it challenging to apply directly to very large-scale datasets. For future work, we will focus on addressing this scalability issue. Potential directions include exploring advanced techniques, such as granular-ball computing or landmark-based approaches, to accelerate the computation. Additionally, we plan to extend the HKFD framework to semi-supervised anomaly detection and investigate the impact of other kernel functions and information-theoretic measures.
Author Contributions
Conceptualization, K.L. and Y.L.; methodology, K.L.; software, S.L.; validation, C.L.; investigation, Y.L.; data curation, C.L.; writing—original draft preparation, K.L. and Y.L.; writing—review and editing, K.L. and Y.L.; visualization, C.L.; supervision, K.L.; funding acquisition, K.L. All authors have read and agreed to the published version of the manuscript.
Funding
This study was funded by the General Project of Sichuan Minzu College (XYZB2407ZB).
Data Availability Statement
The experimental dataset used in this study is publicly available at: https://github.com/BELLoney/Outlier-detection accessed on 1 November 2025. Data and code supporting this study are available from the corresponding author upon reasonable request.
Acknowledgments
The authors thank both the editors and reviewers for their valuable suggestions, which substantially improved this paper.
Conflicts of Interest
The authors declare that there is no conflicts of interest.
References
- Yuan, Z.; Chen, H.; Li, T.; Sang, B.; Wang, S. Outlier detection based on fuzzy rough granules in mixed attribute data. IEEE Trans. Cybern. 2021, 52, 8399–8412. [Google Scholar] [CrossRef] [Scilit]
- Zhang, X.; Yuan, Z.; Miao, D. Outlier detection using three-way neighborhood characteristic regions and corresponding fusion measurement. IEEE Trans. Knowl. Data Eng. 2023, 36, 2082–2095. [Google Scholar] [CrossRef] [Scilit]
- Rousseeuw, P.J.; Hubert, M. Robust statistics for outlier detection. Wiley Interdiscip. Rev. Data Min. Knowl. Discov. 2011, 1, 73–79. [Google Scholar] [CrossRef] [Scilit]
- Zhang, Y.; Hamm, N.A.; Meratnia, N.; Stein, A.; Van de Voort, M.; Havinga, P.J. Statistics-based outlier detection for wireless sensor networks. Int. J. Geogr. Inf. Sci. 2012, 26, 1373–1392. [Google Scholar] [CrossRef] [Scilit]
- Sugiyama, M.; Borgwardt, K. Rapid distance-based outlier detection via sampling. In Proceedings of the Advances in Neural Information Processing Systems 26, Lake Tahoe, NV, USA, 5–8 December 2013. [Google Scholar]
- Zhang, K.; Hutter, M.; Jin, H.D. A new local distance-based outlier detection approach for scattered real-world data. In Proceedings of the Pacific-Asia Conference on Knowledge Discovery and Data Mining; Springer: Berlin/Heidelberg, Germany, 2009; pp. 813–822. [Google Scholar]
- Chen, Y.; Miao, D.; Zhang, H. Neighborhood outlier detection. Expert Syst. Appl. 2010, 37, 8745–8749. [Google Scholar] [CrossRef] [Scilit]
- Breunig, M.M.; Kriegel, H.P.; Ng, R.T.; Sander, J. LOF: Identifying density-based local outliers. In Proceedings of the 2000 ACM SIGMOD International Conference on Management of Data, Dallas, TX, USA, 15–18 May 2000; Association for Computing Machinery: New York, NY, USA, 2000; pp. 93–104. [Google Scholar]
- Su, X.; Wang, X.; Peng, D.; Song, X.; Zheng, H.; Yuan, Z. Identifying Outliers via Local Granular-Ball Density. IEEE Trans. Neural Netw. Learn. Syst. 2025, 36, 18956–18967. [Google Scholar] [CrossRef] [Scilit]
- Yuan, Z.; Hu, P.; Chen, H.; Chen, Y.; Li, Q. DFNO: Detecting Fuzzy Neighborhood Outliers. IEEE Trans. Knowl. Data Eng. 2025, 37, 200–209. [Google Scholar] [CrossRef] [Scilit]
- Pamula, R.; Deka, J.K.; Nandi, S. An outlier detection method based on clustering. In Proceedings of the 2011 Second International Conference on Emerging Applications of Information Technology, Kolkata, India, 19–20 February 2011; IEEE: Piscataway, NI, USA, 2011; pp. 253–256. [Google Scholar]
- Ahmed, M.; Mahmood, A.N. A novel approach for outlier detection and clustering improvement. In Proceedings of the 2013 IEEE 8th Conference on Industrial Electronics and Applications (ICIEA), Melbourne, Australia, 19–21 June 2013; IEEE: Piscataway, NI, USA, 2013; pp. 577–582. [Google Scholar]
- Ruff, L.; Vandermeulen, R.; Goernitz, N.; Deecke, L.; Siddiqui, S.A.; Binder, A.; Müller, E.; Kloft, M. Deep one-class classification. In Proceedings of the International Conference on Machine Learning, Stockholm, Sweden, 10–15 July 2018; PMLR: Cambridge, MA, USA, 2018; pp. 4393–4402. [Google Scholar]
- Xu, H.; Pang, G.; Wang, Y.; Wang, Y. Deep isolation forest for anomaly detection. IEEE Trans. Knowl. Data Eng. 2023, 35, 12591–12604. [Google Scholar] [CrossRef] [Scilit]
- Yuan, Z.; Chen, H.; Li, T.; Liu, J.; Wang, S. Fuzzy information entropy-based adaptive approach for hybrid feature outlier detection. Fuzzy Sets Syst. 2021, 421, 1–28. [Google Scholar] [CrossRef] [Scilit]
- Wu, Y.; Wang, S.; Chen, H.; Peng, D.; Yuan, Z. Kernelized fuzzy-rough anomaly detection. IEEE Trans. Fuzzy Syst. 2024, 32, 4285–4296. [Google Scholar] [CrossRef] [Scilit]
- Li, Y.; Su, X.; Yuan, Z.; Ye, R.; Peng, D.; Chen, H. A Kernelized Fuzzy Approximation Fusion Model with Granular-ball Computing for Outlier Detection. Inf. Fusion 2025, 127, 103716. [Google Scholar] [CrossRef] [Scilit]
- Yuan, Z.; Chen, H.; Luo, C.; Peng, D. MFGAD: Multi-fuzzy granules anomaly detection. Inf. Fusion 2023, 95, 17–25. [Google Scholar] [CrossRef] [Scilit]
- Liu, C.; Yuan, Z.; Chen, B.; Chen, H.; Peng, D. Fuzzy granular anomaly detection using Markov random walk. Inf. Sci. 2023, 646, 119400. [Google Scholar] [CrossRef] [Scilit]
- Wang, S.; Yuan, Z.; Luo, C.; Chen, H.; Peng, D. Exploiting fuzzy rough entropy to detect anomalies. Int. J. Approx. Reason. 2024, 165, 109087. [Google Scholar] [CrossRef] [Scilit]
- Chen, B.; Li, Y.; Peng, D.; Chen, H.; Yuan, Z. Fusing multi-scale fuzzy information to detect outliers. Inf. Fusion 2024, 103, 102133. [Google Scholar] [CrossRef] [Scilit]
- Su, X.; Yuan, Z.; Chen, B.; Peng, D.; Chen, H.; Chen, Y. Detecting anomalies with granular-ball fuzzy rough sets. Inf. Sci. 2024, 678, 121016. [Google Scholar] [CrossRef] [Scilit]
- Su, X.; Cheng, S.; Peng, D.; Chen, H.; Yuan, Z. Fusing multi-granular-ball fuzzy information to detect outliers. Appl. Soft Comput. 2025, 175, 113045. [Google Scholar] [CrossRef] [Scilit]
- Hu, Q.; Yu, D.; Pedrycz, W.; Chen, D. Kernelized fuzzy rough sets and their applications. IEEE Trans. Knowl. Data Eng. 2010, 23, 1649–1667. [Google Scholar] [CrossRef] [Scilit]
- Jiang, F.; Sui, Y.; Cao, C. Some issues about outlier detection in rough set theory. Expert Syst. Appl. 2009, 36, 4680–4687. [Google Scholar] [CrossRef] [Scilit]
- Almardeny, Y.; Boujnah, N.; Cleary, F. A novel outlier detection method for multivariate data. IEEE Trans. Knowl. Data Eng. 2020, 34, 4052–4062. [Google Scholar] [CrossRef] [Scilit]
- Li, Z.; Zhao, Y.; Hu, X.Y.; Botta, N.; Ionescu, C.; Chen, G. ECOD: Unsupervised outlier detection using empirical cumulative distribution functions. IEEE Trans. Knowl. Data Eng. 2022, 35, 12181–12193. [Google Scholar] [CrossRef] [Scilit]
- Liu, H.; Li, X.; Li, J.; Zhang, S. Efficient outlier detection for high-dimensional data. IEEE Trans. Syst. Man Cybern. Syst. 2017, 48, 2451–2461. [Google Scholar] [CrossRef] [Scilit]
- Wang, C.; Liu, Z.; Gao, H.; Fu, Y. VOS: A new outlier detection model using virtual graph. Knowl.-Based Syst. 2019, 185, 104907. [Google Scholar] [CrossRef] [Scilit]
- Yang, J.; Rahardja, S.; Fränti, P. Mean-shift outlier detection and filtering. Pattern Recognit. 2021, 115, 107874. [Google Scholar] [CrossRef] [Scilit]
- Li, K.; Gao, X.; Fu, S.; Diao, X.; Ye, P.; Xue, B.; Yu, J.; Huang, Z. Robust outlier detection based on the changing rate of directed density ratio. Expert Syst. Appl. 2022, 207, 117988. [Google Scholar] [CrossRef] [Scilit]
- Chen, X.; Yuan, Z.; Feng, S. Anomaly detection based on improved k-nearest neighbor rough sets. Int. J. Approx. Reason. 2025, 176, 109323. [Google Scholar] [CrossRef] [Scilit]
- Cheng, S.; Su, X.; Chen, B.; Chen, H.; Peng, D.; Yuan, Z. GBMOD: A granular-ball mean-shift outlier detector. Pattern Recognit. 2025, 159, 111115. [Google Scholar] [CrossRef] [Scilit]
- Li, X.; Lv, J.; Yi, Z. Outlier detection using structural scores in a high-dimensional space. IEEE Trans. Cybern. 2018, 50, 2302–2310. [Google Scholar] [CrossRef] [Scilit] [PubMed]
- Xu, H.; Wang, Y.; Wang, Y.; Wu, Z. Mix: A joint learning framework for detecting both clustered and scattered outliers in mixed-type data. In Proceedings of the 2019 IEEE International Conference on Data Mining (ICDM), Beijing, China, 8–11 November 2019; IEEE: Piscataway, NI, USA, 2019; pp. 1408–1413. [Google Scholar]

Disclaimer/Publisher’s Note: The statements, opinions and data contained in all publications are solely those of the individual author(s) and contributor(s) and not of MDPI and/or the editor(s). MDPI and/or the editor(s) disclaim responsibility for any injury to people or property resulting from any ideas, methods, instructions or products referred to in the content. |
© 2026 by the authors. Licensee MDPI, Basel, Switzerland. This article is an open access article distributed under the terms and conditions of the Creative Commons Attribution (CC BY) license.