


Abstract
Urban parks can promote equitable access to recreation, nature and social interaction when their design responds to diverse physical, sensory, cognitive, social and environmental needs. However, existing park-accessibility assessments often focus on spatial proximity, regulatory compliance or individual facilities and rarely integrate these dimensions with climatic support within a transparent, multidimensional evaluation framework. Addressing this gap is important for identifying design conditions that may restrict equitable park use even where formal access is available. This study adapts and extends the Park Inclusive Design Index as the Enhanced Park Inclusive Design Index (E-PIDI) and applies it comparatively to two intentionally selected, very large multifunctional parks in Ankara, Türkiye. The framework comprises 38 indicators across Motor Accessibility, Sensory Perceptibility, Cognitive and Wayfinding Support, Social Inclusivity and Thermal Comfort Potential. Two authors independently completed the field ratings, and their unrounded arithmetic means were used in the analysis; pooled linearly weighted Cohen’s kappa was 0.675. Dimension weights were derived from pairwise comparisons completed by eight experienced academics using the Analytic Hierarchy Process. The aggregated matrix was highly consistent (CR = 0.0177). Motor Accessibility received the highest weight (38.09%), followed by Cognitive and Wayfinding Support (22.31%), Social Inclusivity (22.29%), Thermal Comfort Potential (9.35%) and Sensory Perceptibility (7.95%). The National Botanical Garden obtained a higher composite score (0.7393) than the Capital National Garden (0.6671), with higher Motor Accessibility, Sensory Perceptibility and Thermal Comfort Potential scores; Cognitive and Wayfinding Support and Social Inclusivity were equal. The ranking remained stable across equal, expert-specific, leave-one-expert-out and rater-specific sensitivity scenarios. The application demonstrates E-PIDI’s use as an intensive diagnostic comparison tool for large, spatially complex parks, complementing its potential use for broader multi-park benchmarking.
1. Introduction
Urban parks are essential components of contemporary green infrastructure, providing opportunities for contact with nature, physical activity, recreation, psychological restoration and social interaction. Their value is particularly pronounced in densely urbanised environments, where publicly accessible green spaces may represent residents’ principal opportunity to experience nature and engage in outdoor recreation. Evidence from a systematic review and meta-analysis of numerous studies indicates that exposure to green space is associated with benefits across a range of physical and mental health outcomes, including reductions in stress indicators, heart rate and blood pressure [1]. However, the existence of a park does not automatically guarantee that these benefits are available to all. The extent to which people can benefit from urban parks depends not only on their spatial distribution and proximity, but also on the quality, safety, accessibility and usability of the environments provided. Accessibility assessments should also account for differences in mobility among population groups. Luo et al. demonstrated that using a uniform walking speed can overestimate both the accessibility and equity of park green spaces, whereas age-specific walking speeds provide a more realistic representation of access for older adults and other mobility-sensitive groups [2].
Ensuring equitable access to parks is therefore both a planning concern and a matter of social justice. The importance of this issue has been recognised internationally through Sustainable Development Goal 11.7, which calls for universal access to safe, inclusive and accessible green and public spaces, particularly for women, children, older people and persons with disabilities [3]. The United Nations Convention on the Rights of Persons with Disabilities similarly establishes accessibility and equal participation in recreational, leisure and sporting activities as fundamental rights. Article 30 specifically requires that persons with disabilities have access to recreational and tourism venues and that children with disabilities have equal opportunities to participate in play and leisure activities [4]. These commitments are especially significant given that approximately 1.3 billion people—around 16% of the global population—experience a significant disability [5]. When temporary injuries, pregnancy, childhood, ageing, sensory differences and other situational limitations are considered, the proportion of people who may encounter barriers in public landscapes is substantially greater.
Within landscape planning, accessibility has frequently been examined in terms of geographical proximity, service radius, walking distance or the spatial distribution of green spaces. Although these measures are important, they provide only a partial account of whether a park can actually be used by diverse populations. A park may be geographically accessible while remaining functionally inaccessible because of steep gradients, steps, unsuitable paving, narrow routes, discontinuous circulation, inaccessible toilets, inadequate seating or the absence of resting opportunities. Likewise, sensory and cognitive barriers—including unclear signage, insufficient contrast, poor lighting, excessive noise, a lack of tactile information and confusing spatial organisation—may restrict independent navigation and participation. Research on park equity has consequently emphasised that access should be evaluated through multiple dimensions, including proximity, park area and environmental quality. Substantial inequalities have been identified particularly in park quality, maintenance, safety and the provision of facilities [6].
The concept of inclusive design broadens this discussion beyond minimum physical access requirements. Inclusive design seeks to accommodate human diversity by considering differences in physical, sensory and cognitive capabilities throughout the design process [7]. Rather than treating disability as an exceptional condition requiring isolated or supplementary solutions, it examines how environmental demands may exclude users and how those demands can be reduced. Inclusive design therefore concerns not only whether a person can enter a park, but whether that person can understand, navigate, use and enjoy its spaces with safety, dignity, autonomy and a sense of belonging. In the built environment, it may include accessible and connected circulation systems, perceptible information, multisensory wayfinding, appropriate furniture, flexible activity settings, accessible sanitary facilities, protection from climatic discomfort and opportunities for social interaction. Consequently, inclusive design incorporates accessibility but extends to usability, experience, choice and participation [8]. Moreover, formal compliance with accessibility standards does not necessarily produce an inclusive user experience. An assessment of Kaimakli Linear Park in Nicosia identified persistent barriers related to inconsistent implementation of standards, inadequate mobility infrastructure, limited tactile and sensory guidance and insufficient coordination among stakeholders [9]. This demonstrates the importance of evaluating accessibility through observed environmental performance rather than regulatory compliance alone.
This broader perspective is particularly relevant to urban parks because they are used by populations with highly diverse needs. Older adults may require shorter walking intervals, shaded resting places, stable surfaces and seating with armrests; wheelchair users require continuous step-free routes and appropriately designed facilities; people with visual impairments may depend on tactile, auditory and high-contrast information, and people with cognitive disabilities may benefit from legible layouts, recognisable landmarks and simple wayfinding systems. Children, pregnant women, caregivers with pushchairs, visitors carrying loads and people unfamiliar with the park may also experience capability–environment mismatches. Studies of urban park users have shown that needs related to mobility, safety, information, social interaction and environmental comfort differ among user groups and cannot be adequately addressed through a narrow focus on barrier-free circulation [10]. Similarly, evaluations of parks and playgrounds have demonstrated that compliance with selected accessibility requirements does not necessarily ensure overall usability or participation, because barriers may occur at different stages of the user journey—from arrival and entrance to circulation, facility use and engagement in activities [11]. Accessibility may also vary considerably according to the characteristics of the target population. In their assessment of children’s access to urban parks, Liao and Furuya developed a child-oriented accessibility model that considered the relationship between park provision and the spatial distribution of children. Their study reinforces the need to evaluate park accessibility using population-specific capabilities and demands rather than treating all users as a homogeneous group [12].
Despite increasing recognition of these principles, the inclusive performance of parks is rarely evaluated through instruments that jointly capture physical movement, sensory perception, cognition, social participation and climatic support. Existing assessments often concentrate on proximity, regulatory compliance or individual facilities and therefore may not identify the design conditions that influence use after visitors enter a park. A further methodological gap concerns transparency: contextual adaptations of an existing index should document how indicators were retained, merged, reworded, excluded or added, and should report scoring anchors, inter-rater reliability and sensitivity to weighting and aggregation choices.
The Park Inclusive Design Index (PIDI), developed by Shi et al., represents an important foundation for addressing this gap [13]. Based on a capability–demand model, the original PIDI comprises three primary dimensions, 14 secondary constructs and 60 tertiary indicators addressing motor, sensory and cognitive support. It includes socially relevant facilities within its motor dimension and one item concerning tree shade in activity areas, but it does not organise Social Inclusivity or Thermal Comfort Potential as distinct, systematically assessed dimensions. Its application to 48 parks in Hangzhou demonstrated the diagnostic value of a multidimensional index [13]. That sample comprised five comprehensive parks larger than 10 ha, 20 community parks, 15 specialised parks and eight leisure parks. Contextual adaptation is nevertheless necessary where park scale, functional complexity, planning context and climatic exposure differ from the original application.
Whereas the original application demonstrated broad multi-park assessment across several park types, the present study deliberately examines two exceptionally large multifunctional parks. Their extensive circulation systems, internal spatial heterogeneity and diverse recreational, cultural, ecological, educational and social functions provide information-rich conditions for evaluating whether E-PIDI can generate coherent indicator- and dimension-level profiles at the scale of complex individual parks. This represents a complementary application of the index as an intensive comparative and decision-support tool; application to larger systematically selected samples can extend the same framework to broader benchmarking.
Against this background, this study adapts and extends PIDI as E-PIDI and applies it to the Capital National Garden and National Botanical Garden in Ankara, Türkiye. The study addresses three questions: (1) How can PIDI be systematically adapted for large multifunctional parks under climate-sensitive conditions? (2) How do the two selected parks differ across the five E-PIDI dimensions and their underlying indicators? (3) How robust are the comparative findings to inter-rater variation and alternative weighting and rating-aggregation assumptions? The research is positioned as a comparative large-park application: it evaluates E-PIDI’s capacity for detailed site diagnosis and cross-park comparison rather than estimating the performance of all parks in Ankara or Türkiye.
2. Materials and Methods
2.1. Materials
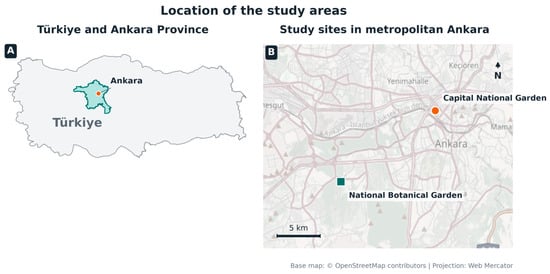
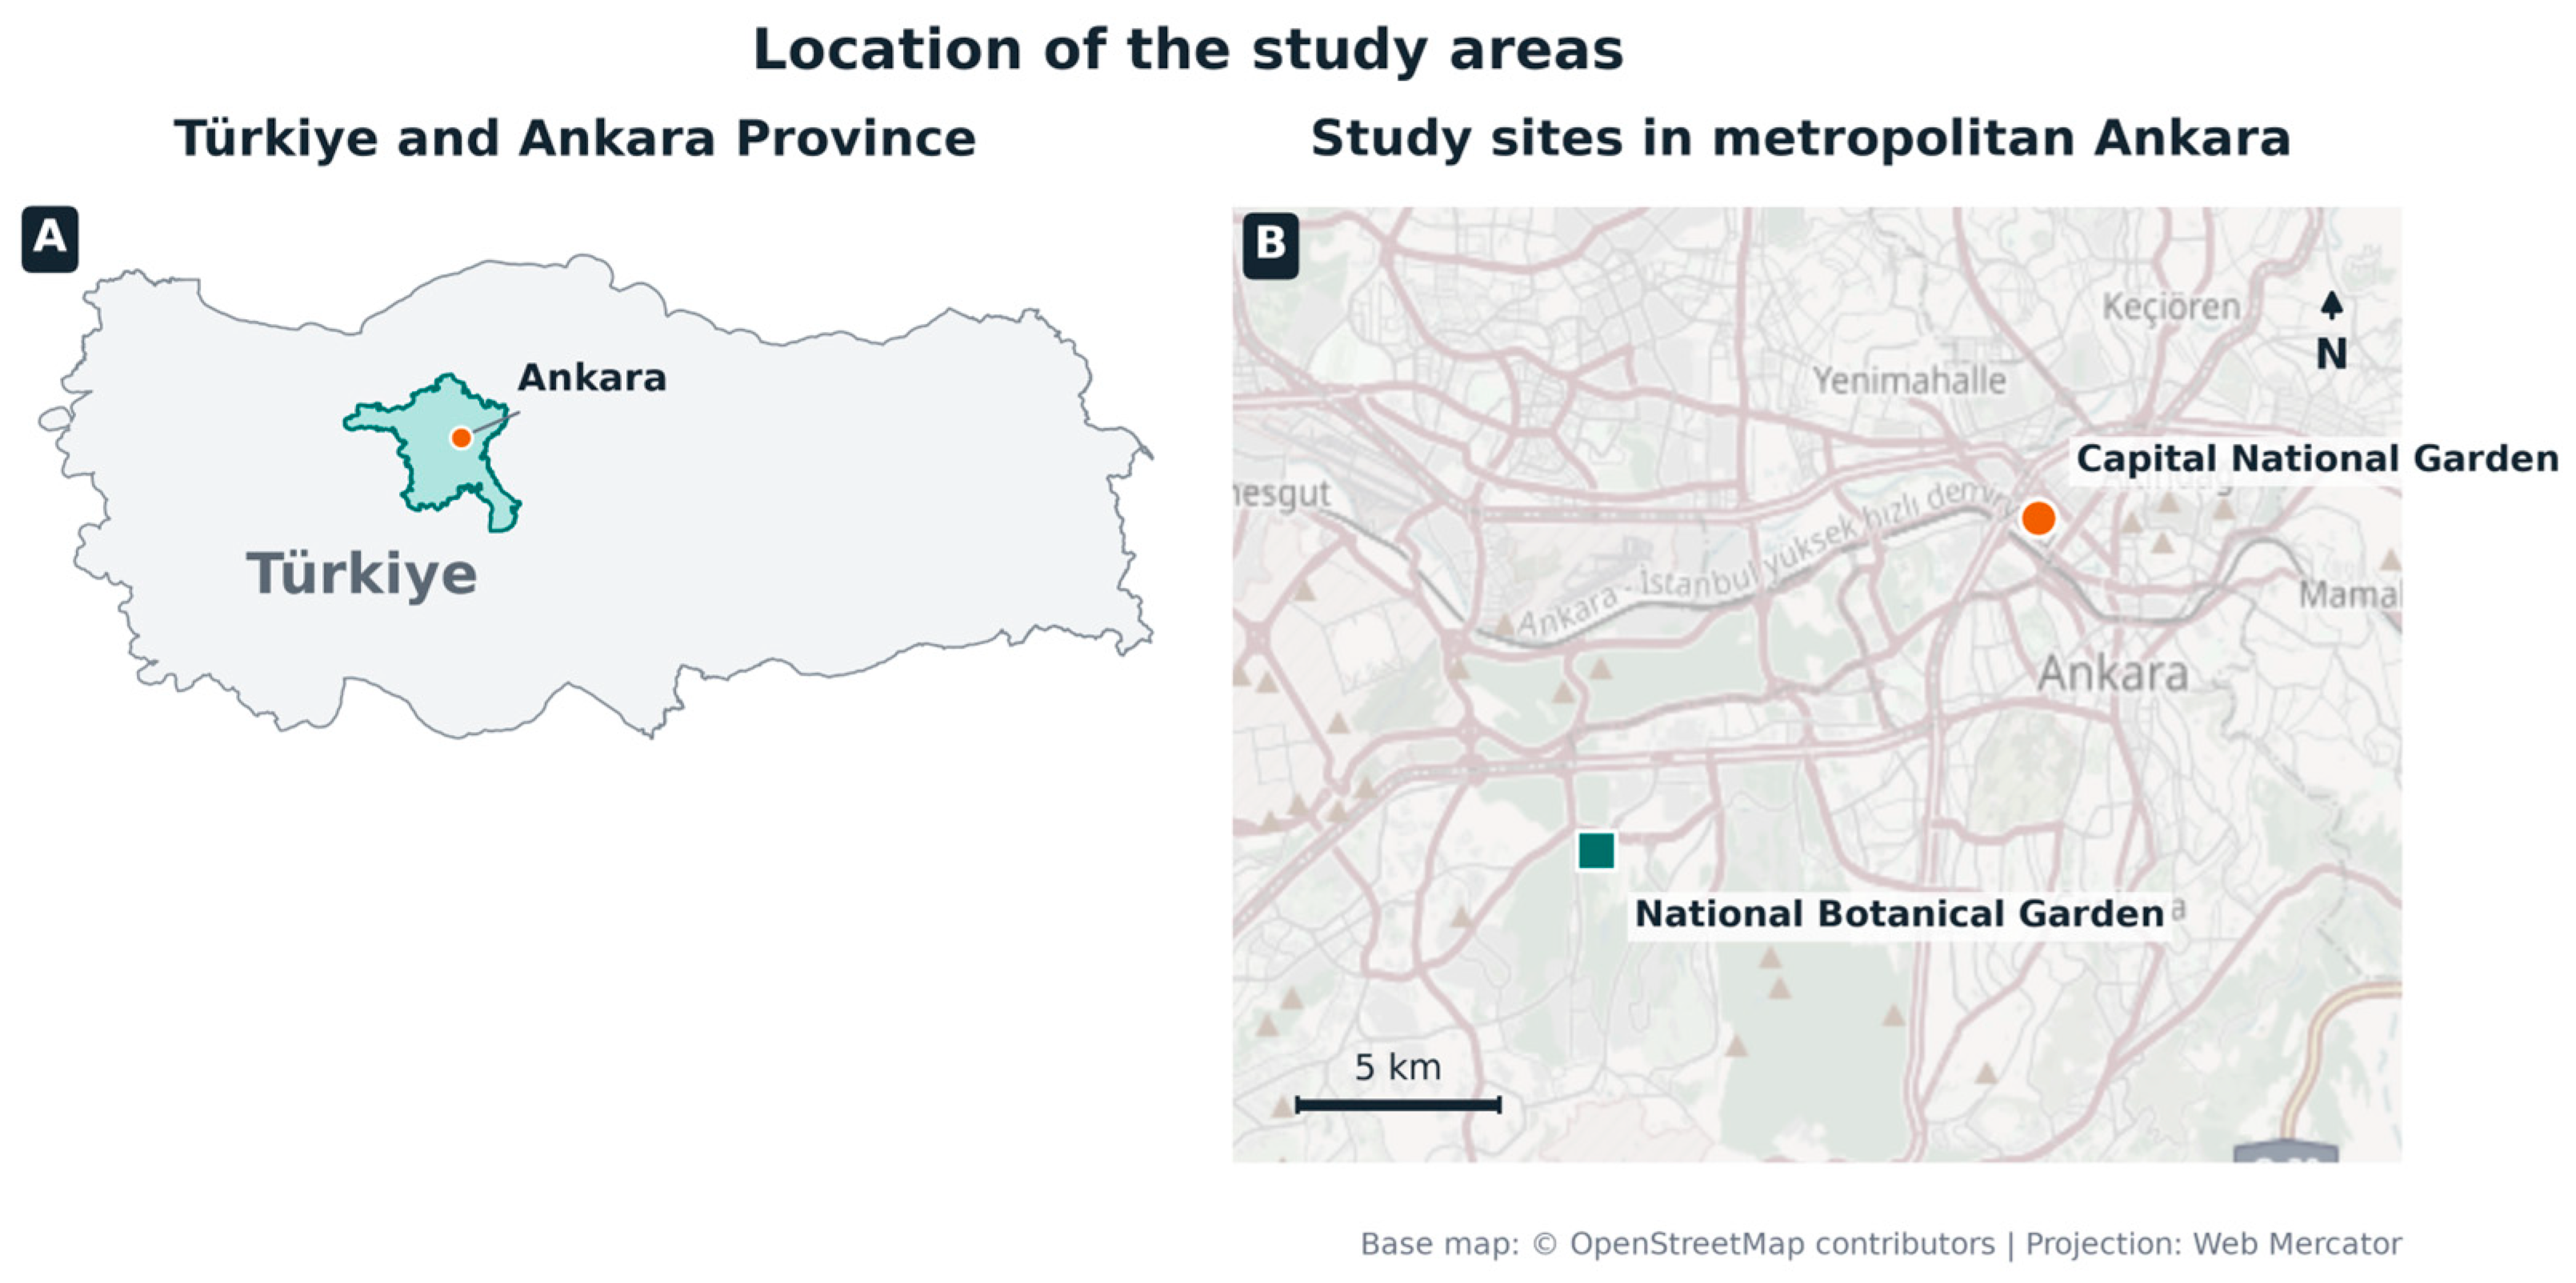
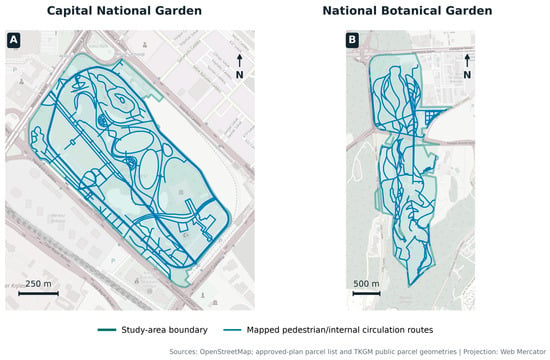
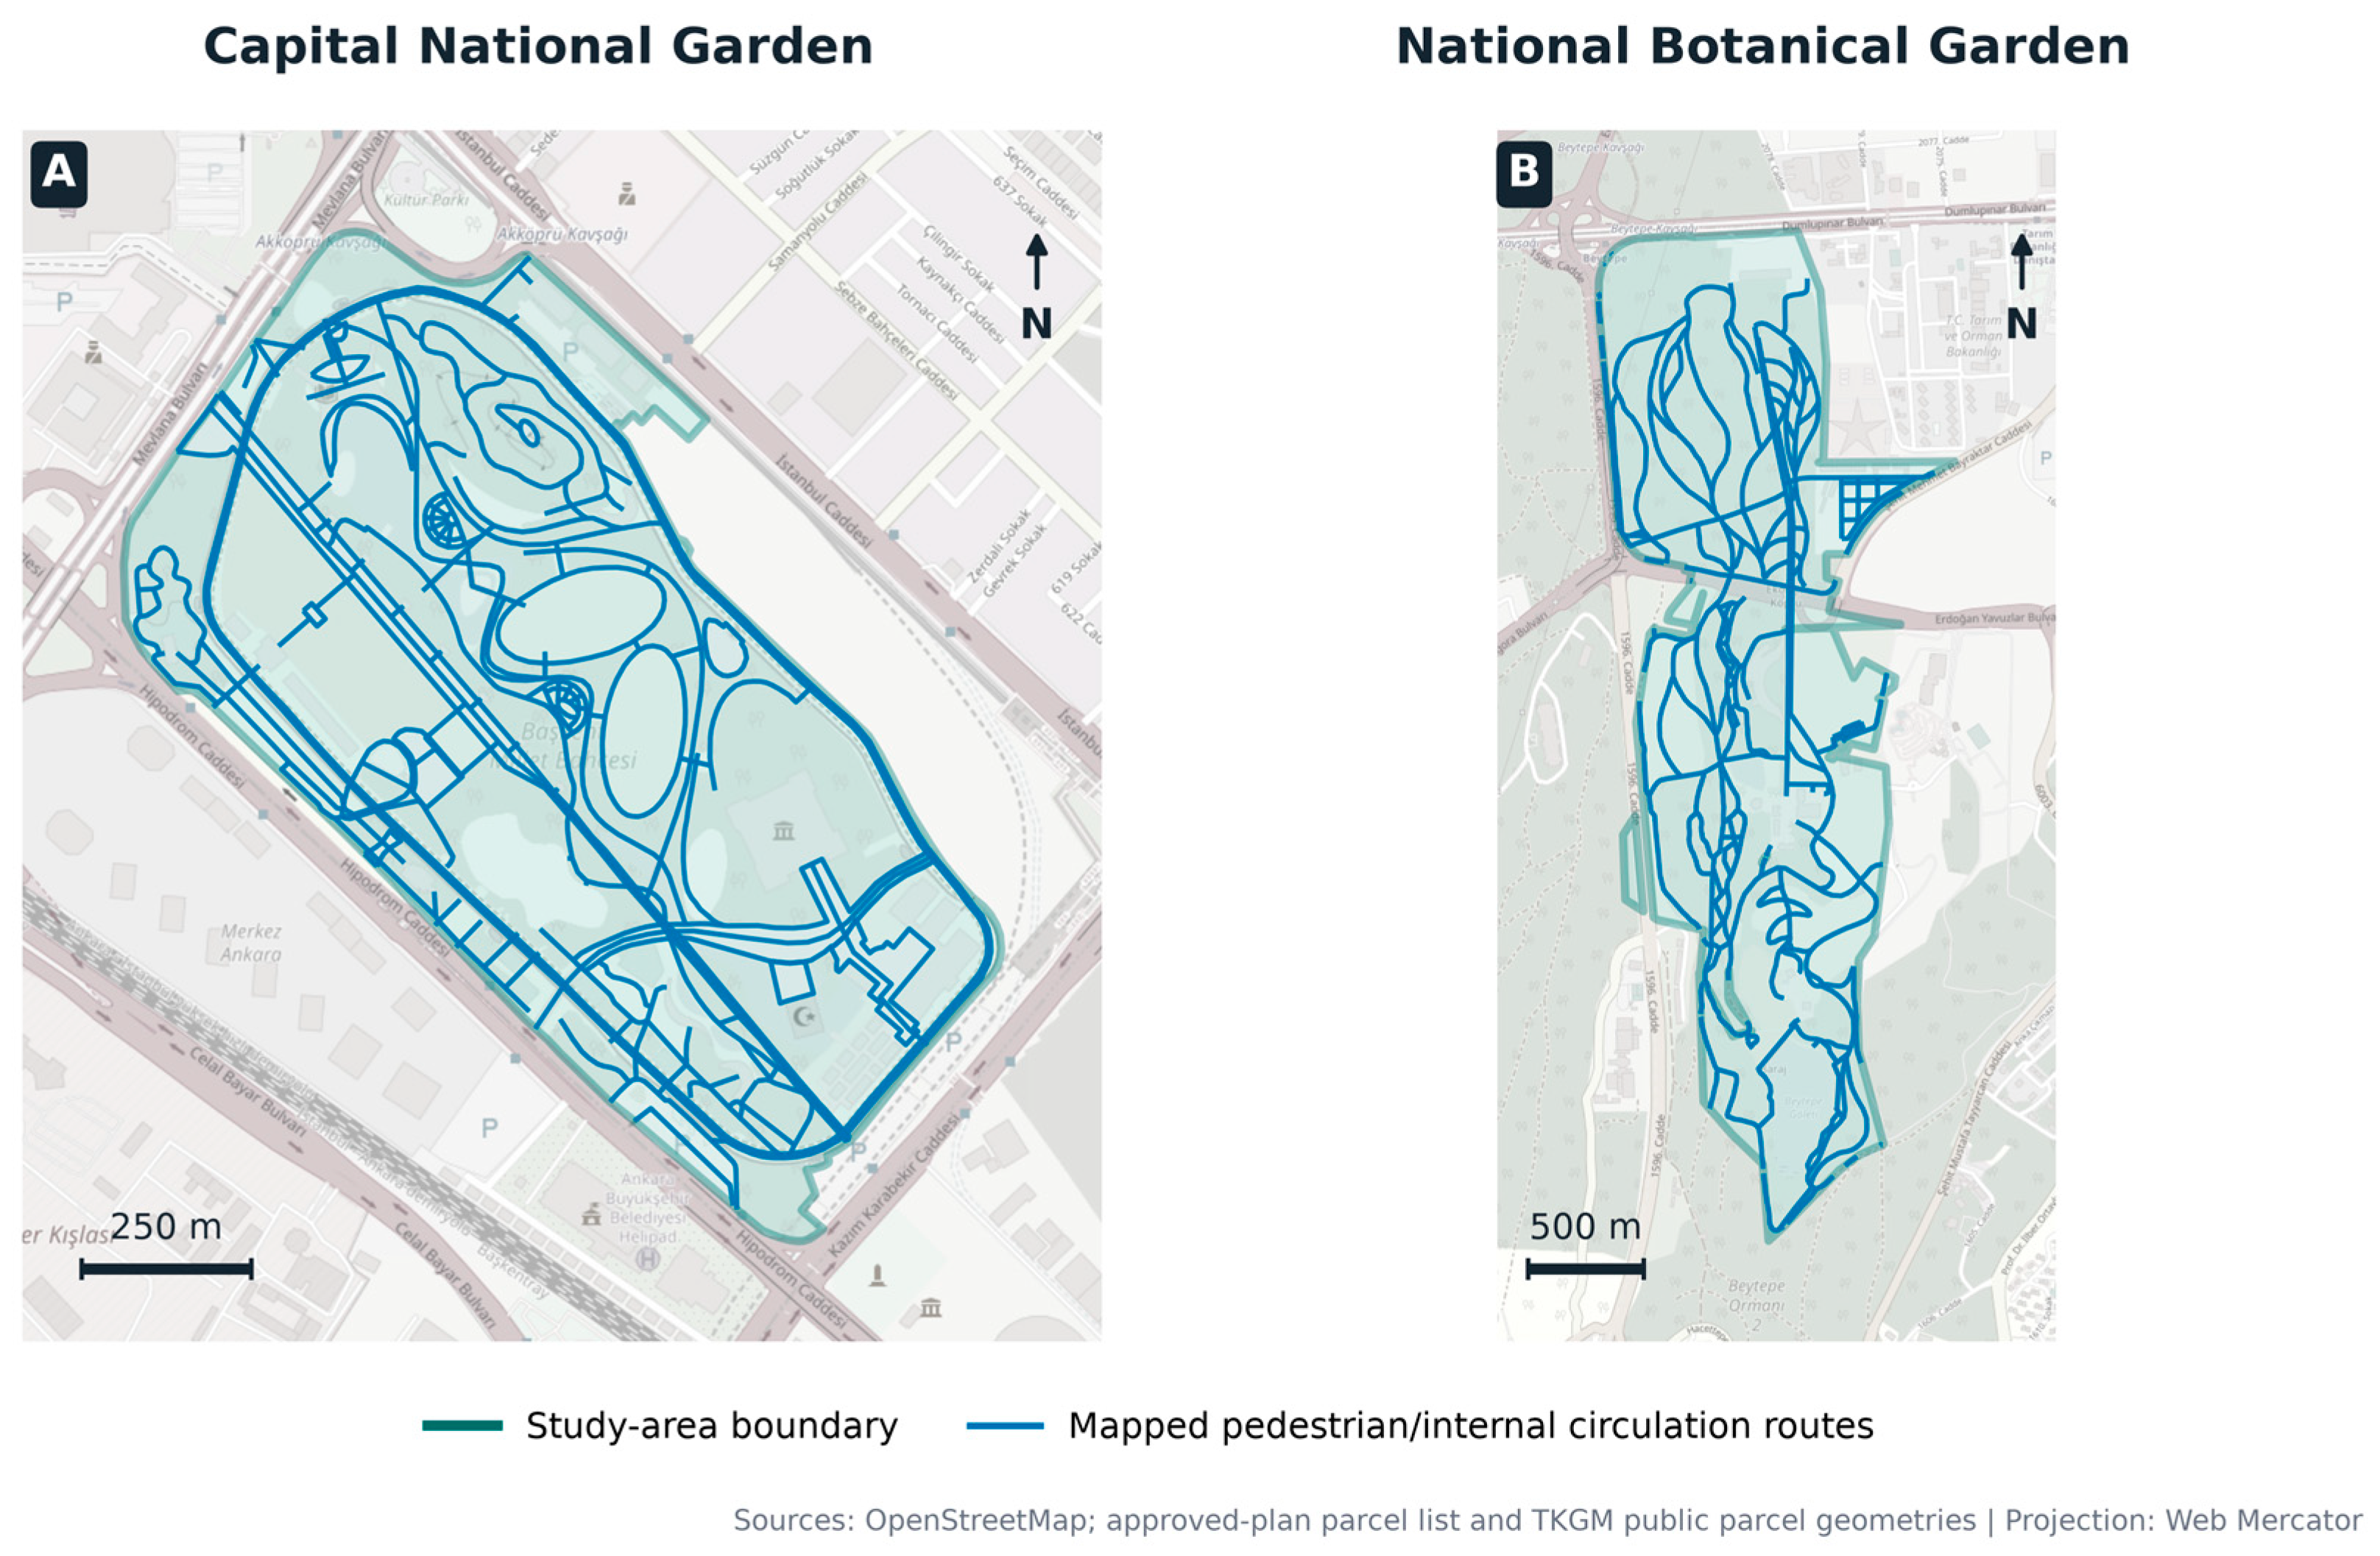
This research was conducted in two large-scale urban open green spaces in Ankara: the Capital National Garden (39°56′40.29″ N, 32°50′22.17″ E) and the National Botanical Garden (39°53′49.75″ N, 32°44′20.38″ E). The cases were purposively selected using four criteria: very large spatial extent, public accessibility, multifunctional recreational provision, and contrasting spatial organisation and landscape character. Both parks substantially exceed the original PIDI study’s 10 ha threshold for comprehensive parks and contain extensive circulation networks and varied cultural, recreational, ecological, educational and social-use settings. These characteristics make them information-rich cases for examining E-PIDI as a detailed comparative tool under complex large-park conditions. Their metropolitan locations are shown in Figure 1, and their study-area boundaries and publicly mapped circulation networks are shown in Figure 2.
Figure 1.
Location of the study areas within Türkiye and metropolitan Ankara. Base map: © OpenStreetMap contributors.
Figure 2.
Study-area boundaries and publicly mapped pedestrian and internal circulation routes used to support field coverage in (A) Capital National Garden and (B) National Botanical Garden. Sources: OpenStreetMap, approved-plan parcel information and public parcel geometries from the General Directorate of Land Registry and Cadastre (TKGM).
2.1.1. Capital National Garden
The Capital National Garden is a large-scale public open space comprising approximately 627,000 m2 of recreational area and 83,000 m2 of built area. Its multifunctional programme includes cultural facilities, pedestrian and cycle routes, children’s play areas, water features, picnic areas, sports facilities and exhibition spaces. The park is embedded in a dense central urban setting characterised by major transport corridors, public facilities and established residential and commercial districts.
2.1.2. National Botanical Garden
The National Botanical Garden is a large-scale urban landscape covering approximately 2,500,000 m2. Its principal components include food and beverage facilities, an outdoor amphitheatre, picnic areas, ponds, a plant research centre, and pedestrian and cycle routes. The park lies within a more dispersed metropolitan setting adjoining major roads, residential development, public institutions, a city hospital and extensive planted or undeveloped land.
2.2. Methods
This study developed a context-sensitive multi-criteria evaluation framework, termed the Enhanced Park Inclusive Design Index (E-PIDI), by adapting and extending PIDI [13]. Each original PIDI item was reviewed for relevance to large multifunctional parks and classified as retained, reworded, merged, excluded or supplemented. Facility-specific items were consolidated where they represented the same park-wide performance condition, while building-internal, service and technical items outside the observable public-landscape scope were excluded. The resulting framework comprises 38 indicators. Table 1 summarises the dimensional transformation from PIDI to E-PIDI. The complete indicator-level crosswalk, including the original PIDI source items and the rationale for each retention, merger, rewording, exclusion or addition, is provided in Supplementary Table S1.
Table 1.
Summary of the dimensional transformation from PIDI to E-PIDI.
The methodological framework comprised six stages: (i) literature review and traceable adaptation of the indicator set; (ii) field observation and independent scoring; (iii) inter-rater reliability assessment and aggregation of the two ratings; (iv) fixed-bound normalisation; (v) AHP weighting using expert-panel judgements; and (vi) composite-score calculation and sensitivity analysis.
2.3. Development of Assessment Indicators
Inclusive and universal design seek to enable people with diverse physical, sensory and cognitive capabilities to use environments without specialised or segregated adaptations [14]. On this basis, the retained and consolidated PIDI content was organised as Motor Accessibility, Sensory Perceptibility and Cognitive and Wayfinding Support. Social Inclusivity was made explicit to evaluate participation, inclusive play, gathering spaces and seating diversity, while Thermal Comfort Potential was added to assess shade continuity, shaded seating and an appropriate balance between exposed and sheltered spaces. Although PIDI contains socially relevant facilities and a shade-related item, the two themes are not structured as distinct dimensions in the original framework [13].
2.3.1. Motor Accessibility (M)
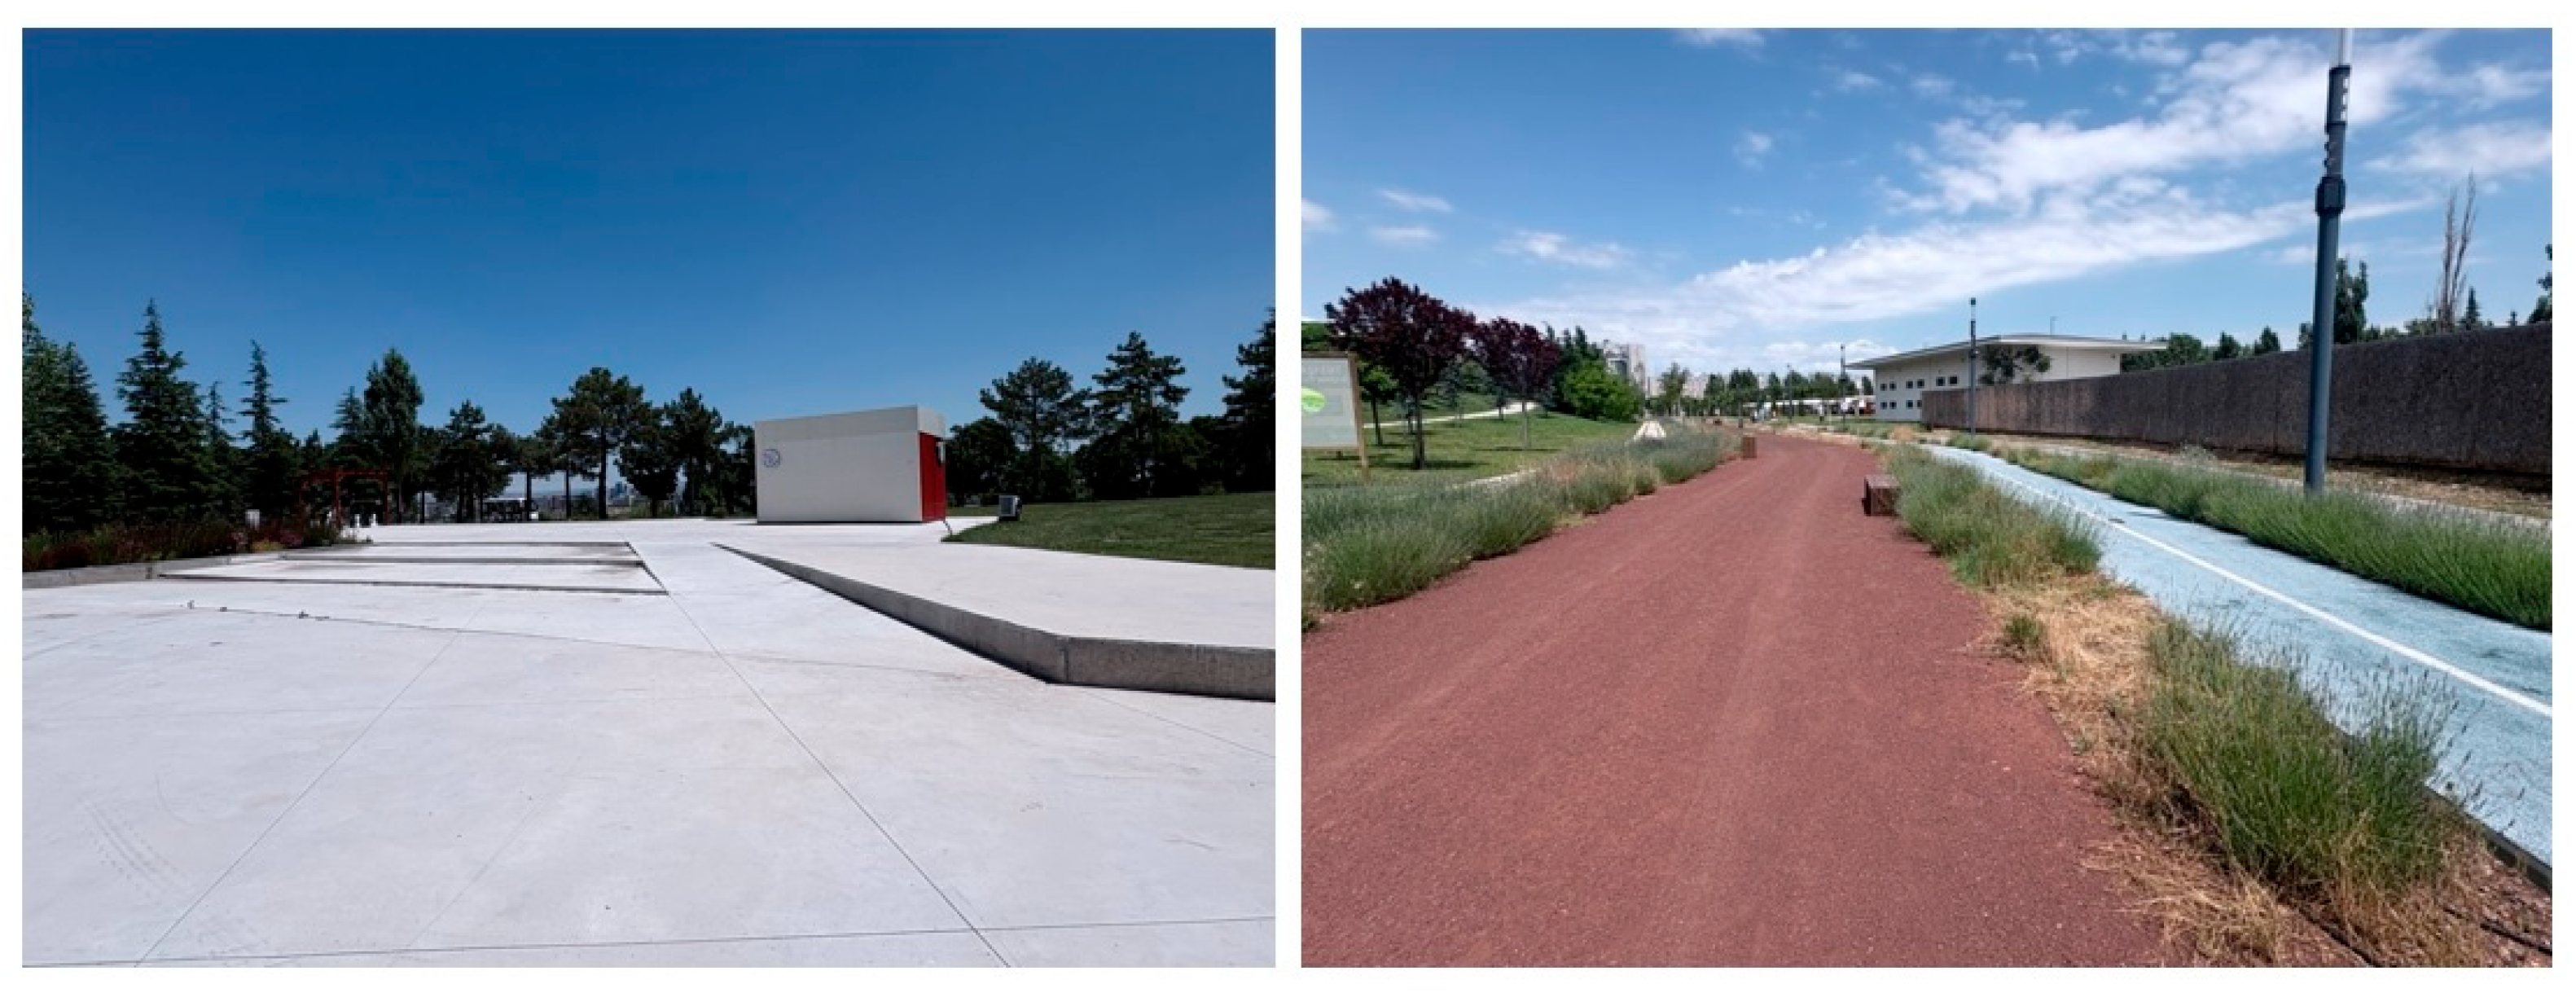
This dimension assesses the extent to which the park enables safe, continuous, and independent movement for users with diverse mobility capabilities, including wheelchair users, older adults, and individuals who use mobility aids. Physical accessibility is a fundamental component of inclusive environments [14]. The indicators addressed pathway continuity and width, management of changes in elevation, surface slip resistance, accessible seating, the frequency and distribution of resting facilities, accessible entrances and exits, physical access to shaded areas, continuity of circulation flows, and the clarity of intersections and route decision points. The ten indicators comprising this dimension are presented in Table 2. Representative examples of differences in Motor Accessibility between the study areas are shown in Figure 3.
Table 2.
Motor Accessibility (M) indicators.
Figure 3.
Representative examples of differences in Motor Accessibility between the study areas: (left) provision of ramp access as an alternative to stairs in the National Botanical Garden; and (right) absence of an accessible transition between different surface materials in the Capital National Garden. Photos taken by the authors during field observations in June 2026.
2.3.2. Sensory Perceptibility (S)
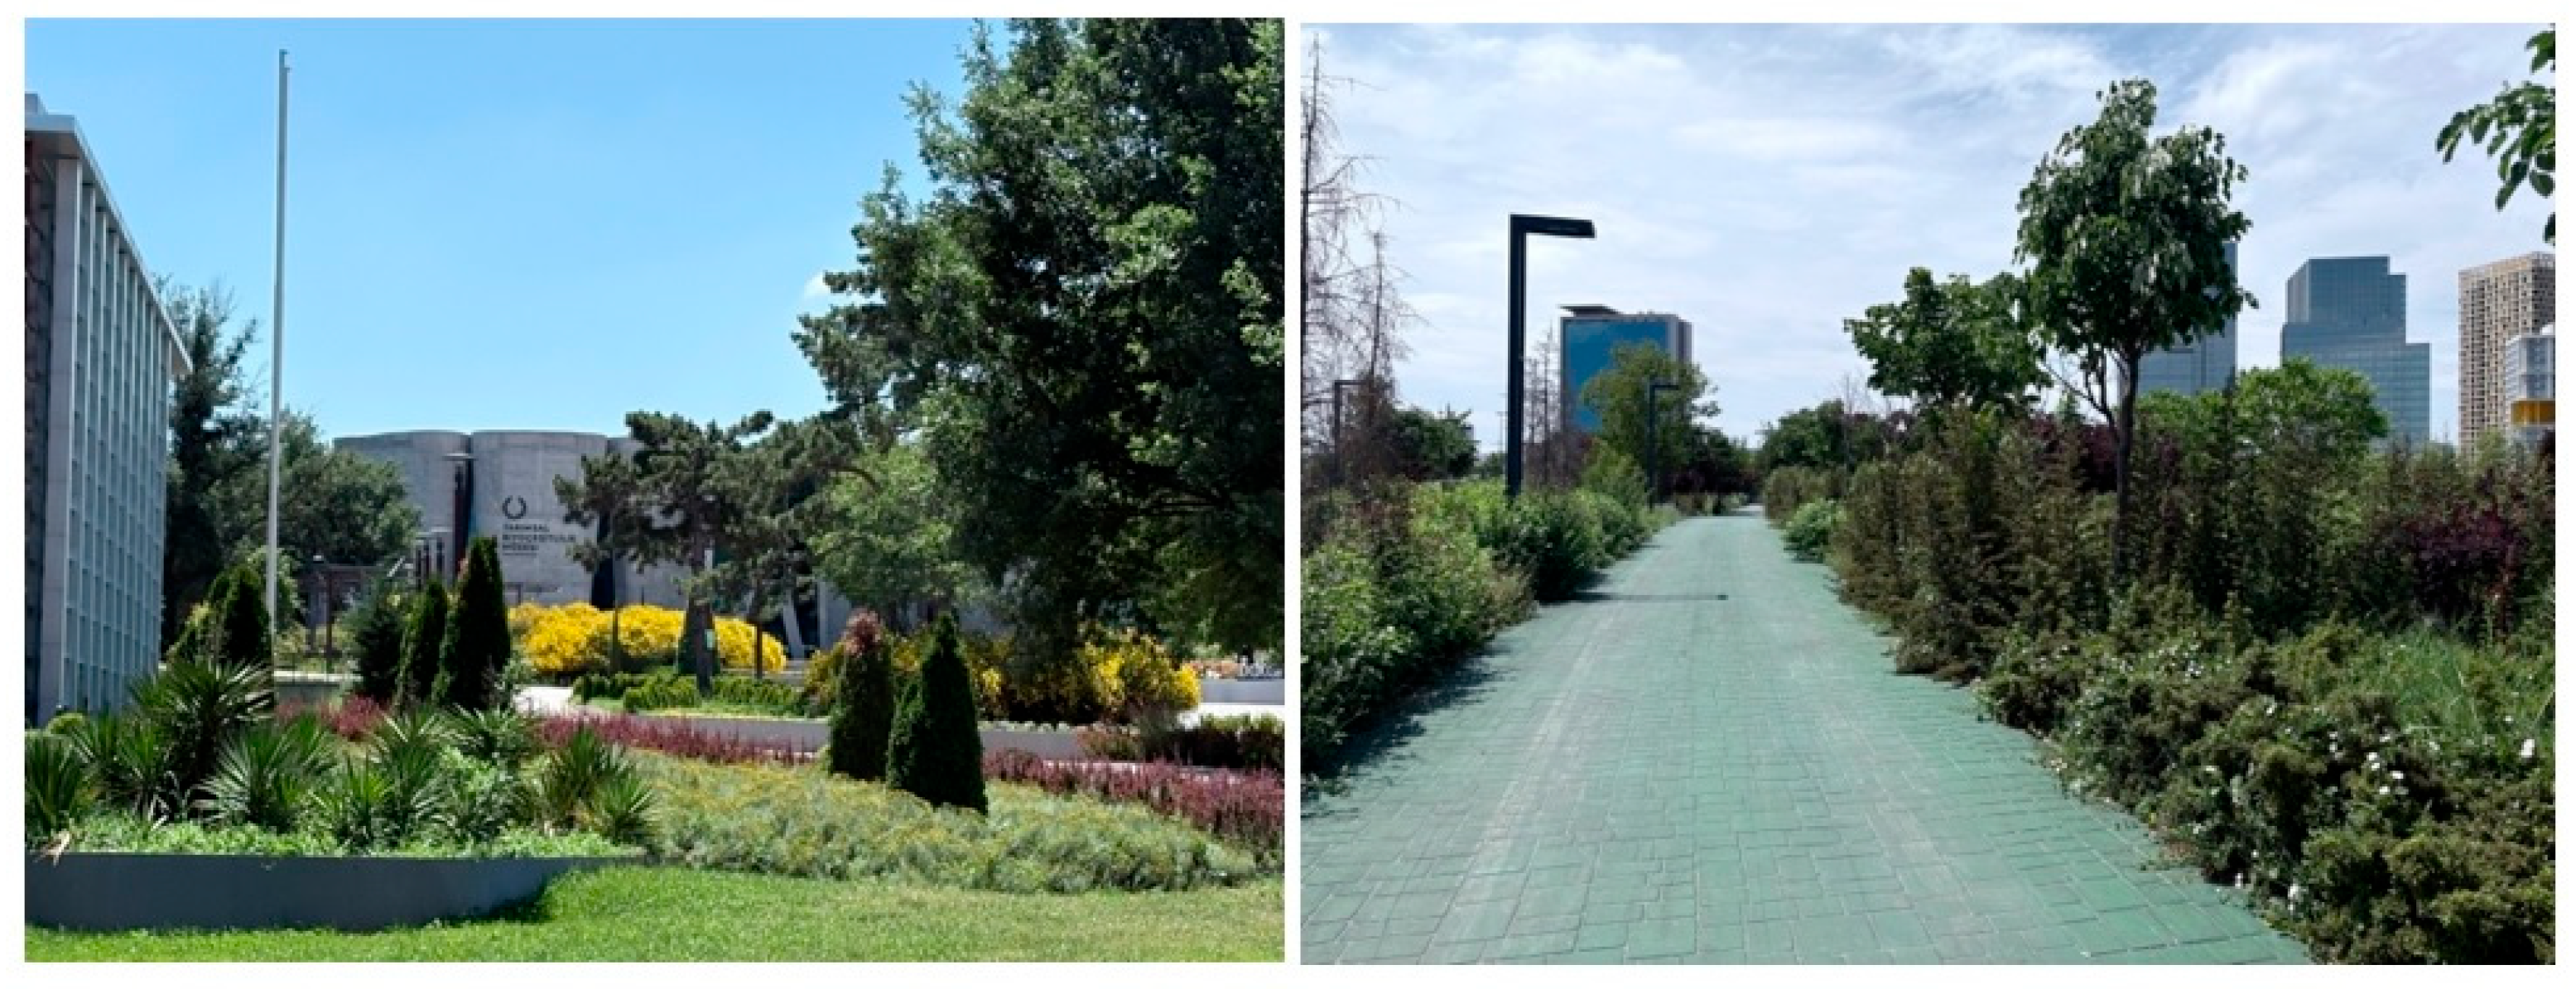
This dimension assesses the extent to which the park provides a coherent, restorative and perceptually supportive sensory environment. Attention Restoration Theory highlights the relevance of perceptual qualities such as visual variety, opportunities to retreat from noise and restorative focal points in reducing cognitive fatigue [15]. The indicators addressed visual contrast among surfaces, vegetation and site furniture; spatial legibility; diversity of vegetation textures; an appropriate balance between shade and light supporting comfort and legibility; an appropriate level of visual complexity supporting coherence and legibility; restorative visual focal points; opportunities to retreat from noise; perceived spatial coherence; perceived safety associated with visibility and clear sightlines; and the continuity of lighting. The ten indicators comprising this dimension are presented in Table 3. Representative examples of differences in Sensory Perceptibility between the study areas are shown in Figure 4.
Table 3.
Sensory Perceptibility (S) indicators.
Figure 4.
Representative examples of differences in Sensory Perceptibility between the study areas: (left) a greater variety of plant species and vegetation forms in the National Botanical Garden; and (right) a comparatively more homogeneous planting composition, characterised by the repeated use of similar plant species in the Capital National Garden. Photos taken by the authors during field observations in June 2026.
2.3.3. Cognitive and Wayfinding Support (C)
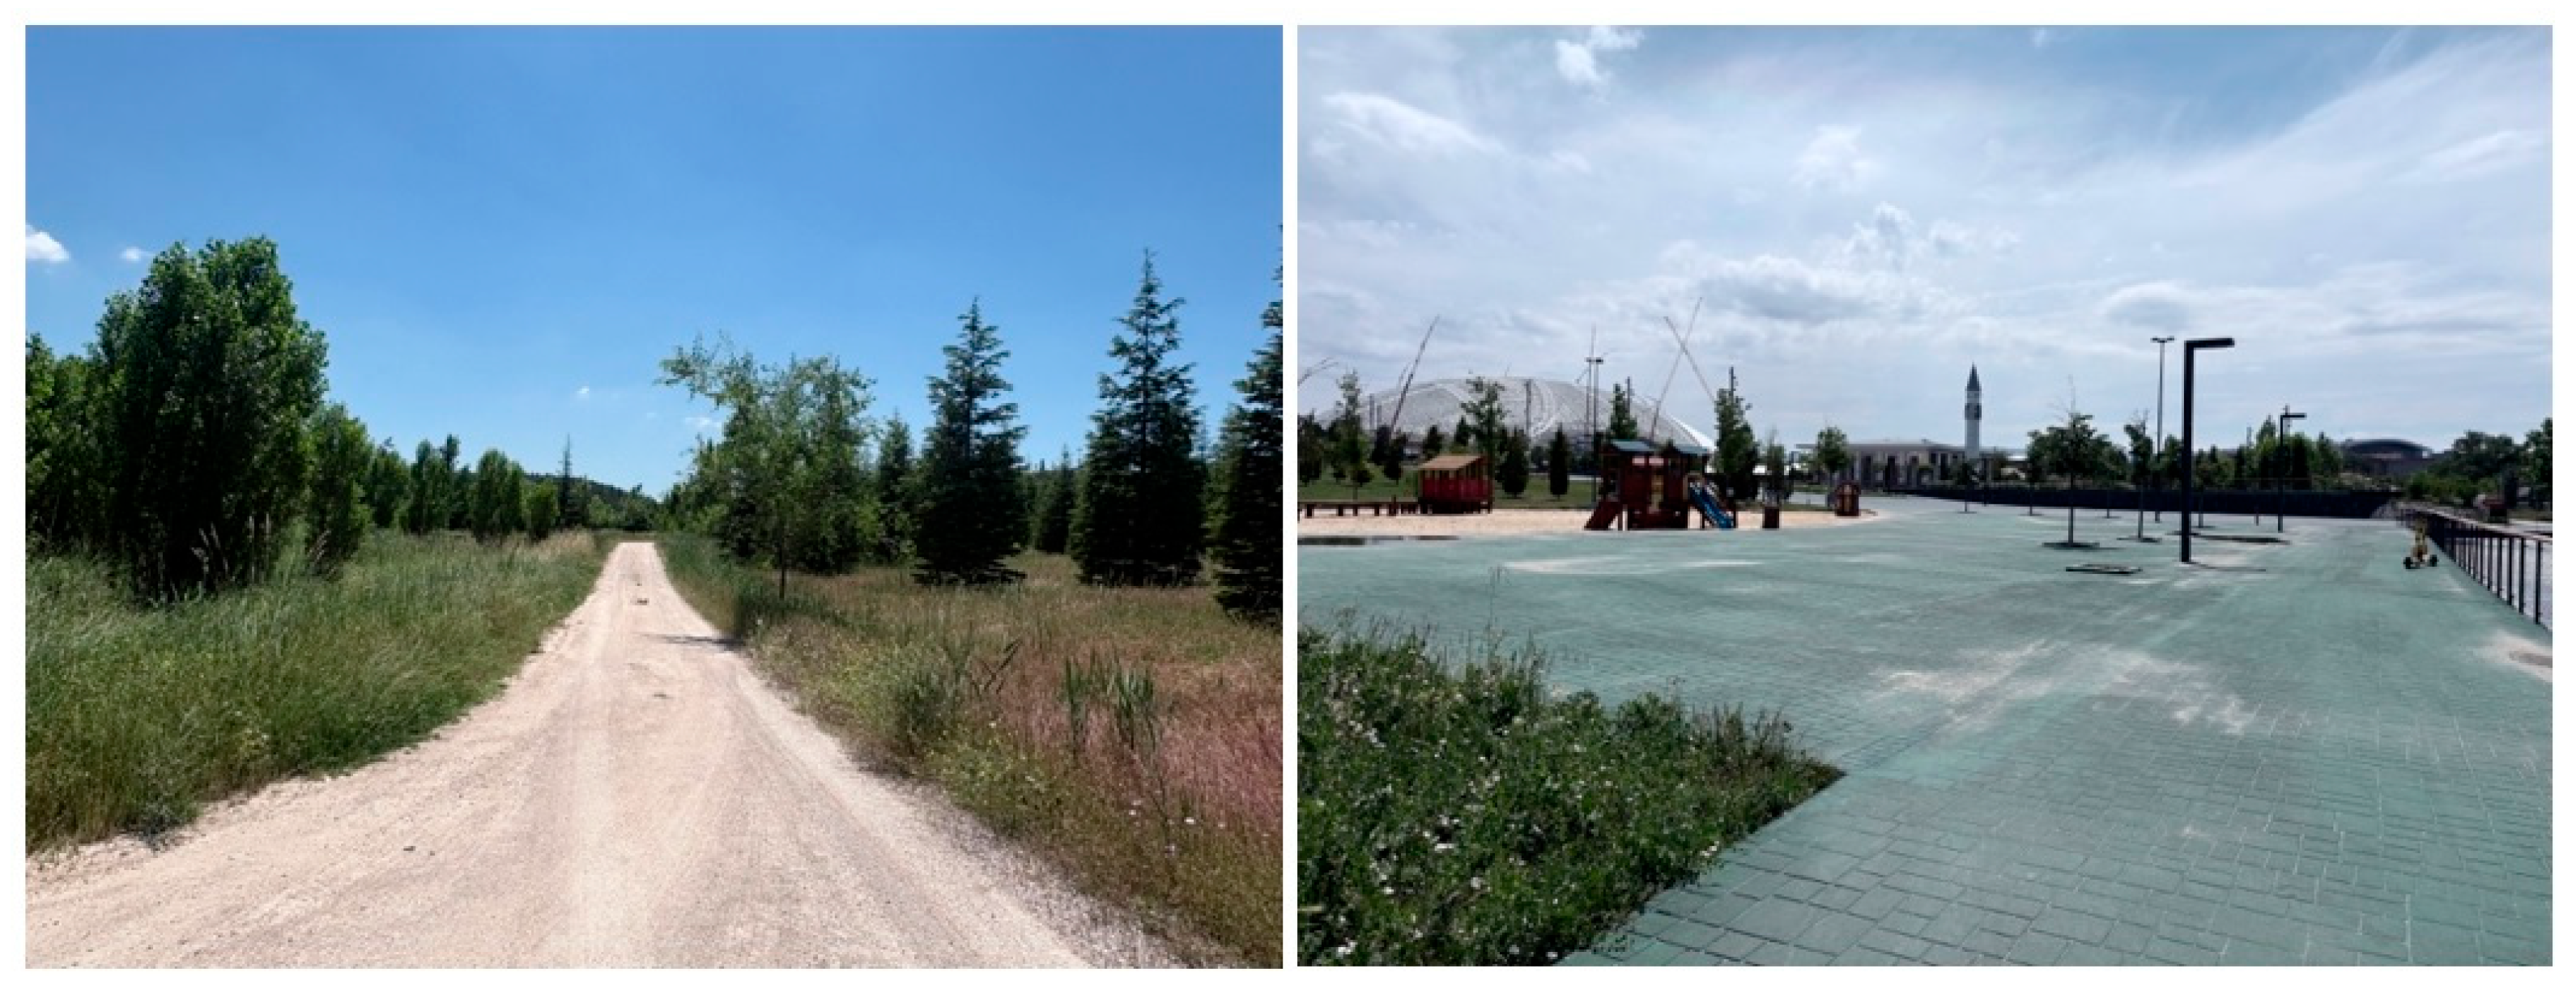
This dimension concerns users’ ability to cognitively organise, interpret and navigate the spatial environment. Lynch’s concept of legibility describes the degree to which environmental components can be recognised and organised into a coherent pattern; paths, edges, districts, nodes and landmarks contribute to the formation of cognitive maps and spatial orientation [16]. The indicators therefore addressed the perceptibility of entrances and exits, ease of wayfinding, spatial hierarchy, route continuity, the clarity of decision points, spatial simplicity, comprehensibility for first-time visitors, the availability and distribution of landmarks, and directional support through texture and colour. The nine indicators comprising this dimension are presented in Table 4. Representative examples of differences in Cognitive and Wayfinding Support between the study areas are shown in Figure 5.
Table 4.
Cognitive and Wayfinding Support (C) indicators.
Figure 5.
Representative examples of differences in Cognitive and Wayfinding Support between the study areas: (left) a visually homogeneous pedestrian route with limited spatial differentiation in the National Botanical Garden; and (right) identifiable architectural landmarks, including the concert hall and museum, that support spatial orientation in the Capital National Garden. Photos taken by the authors during field observations in June 2026.
2.3.4. Social Inclusivity (SI)
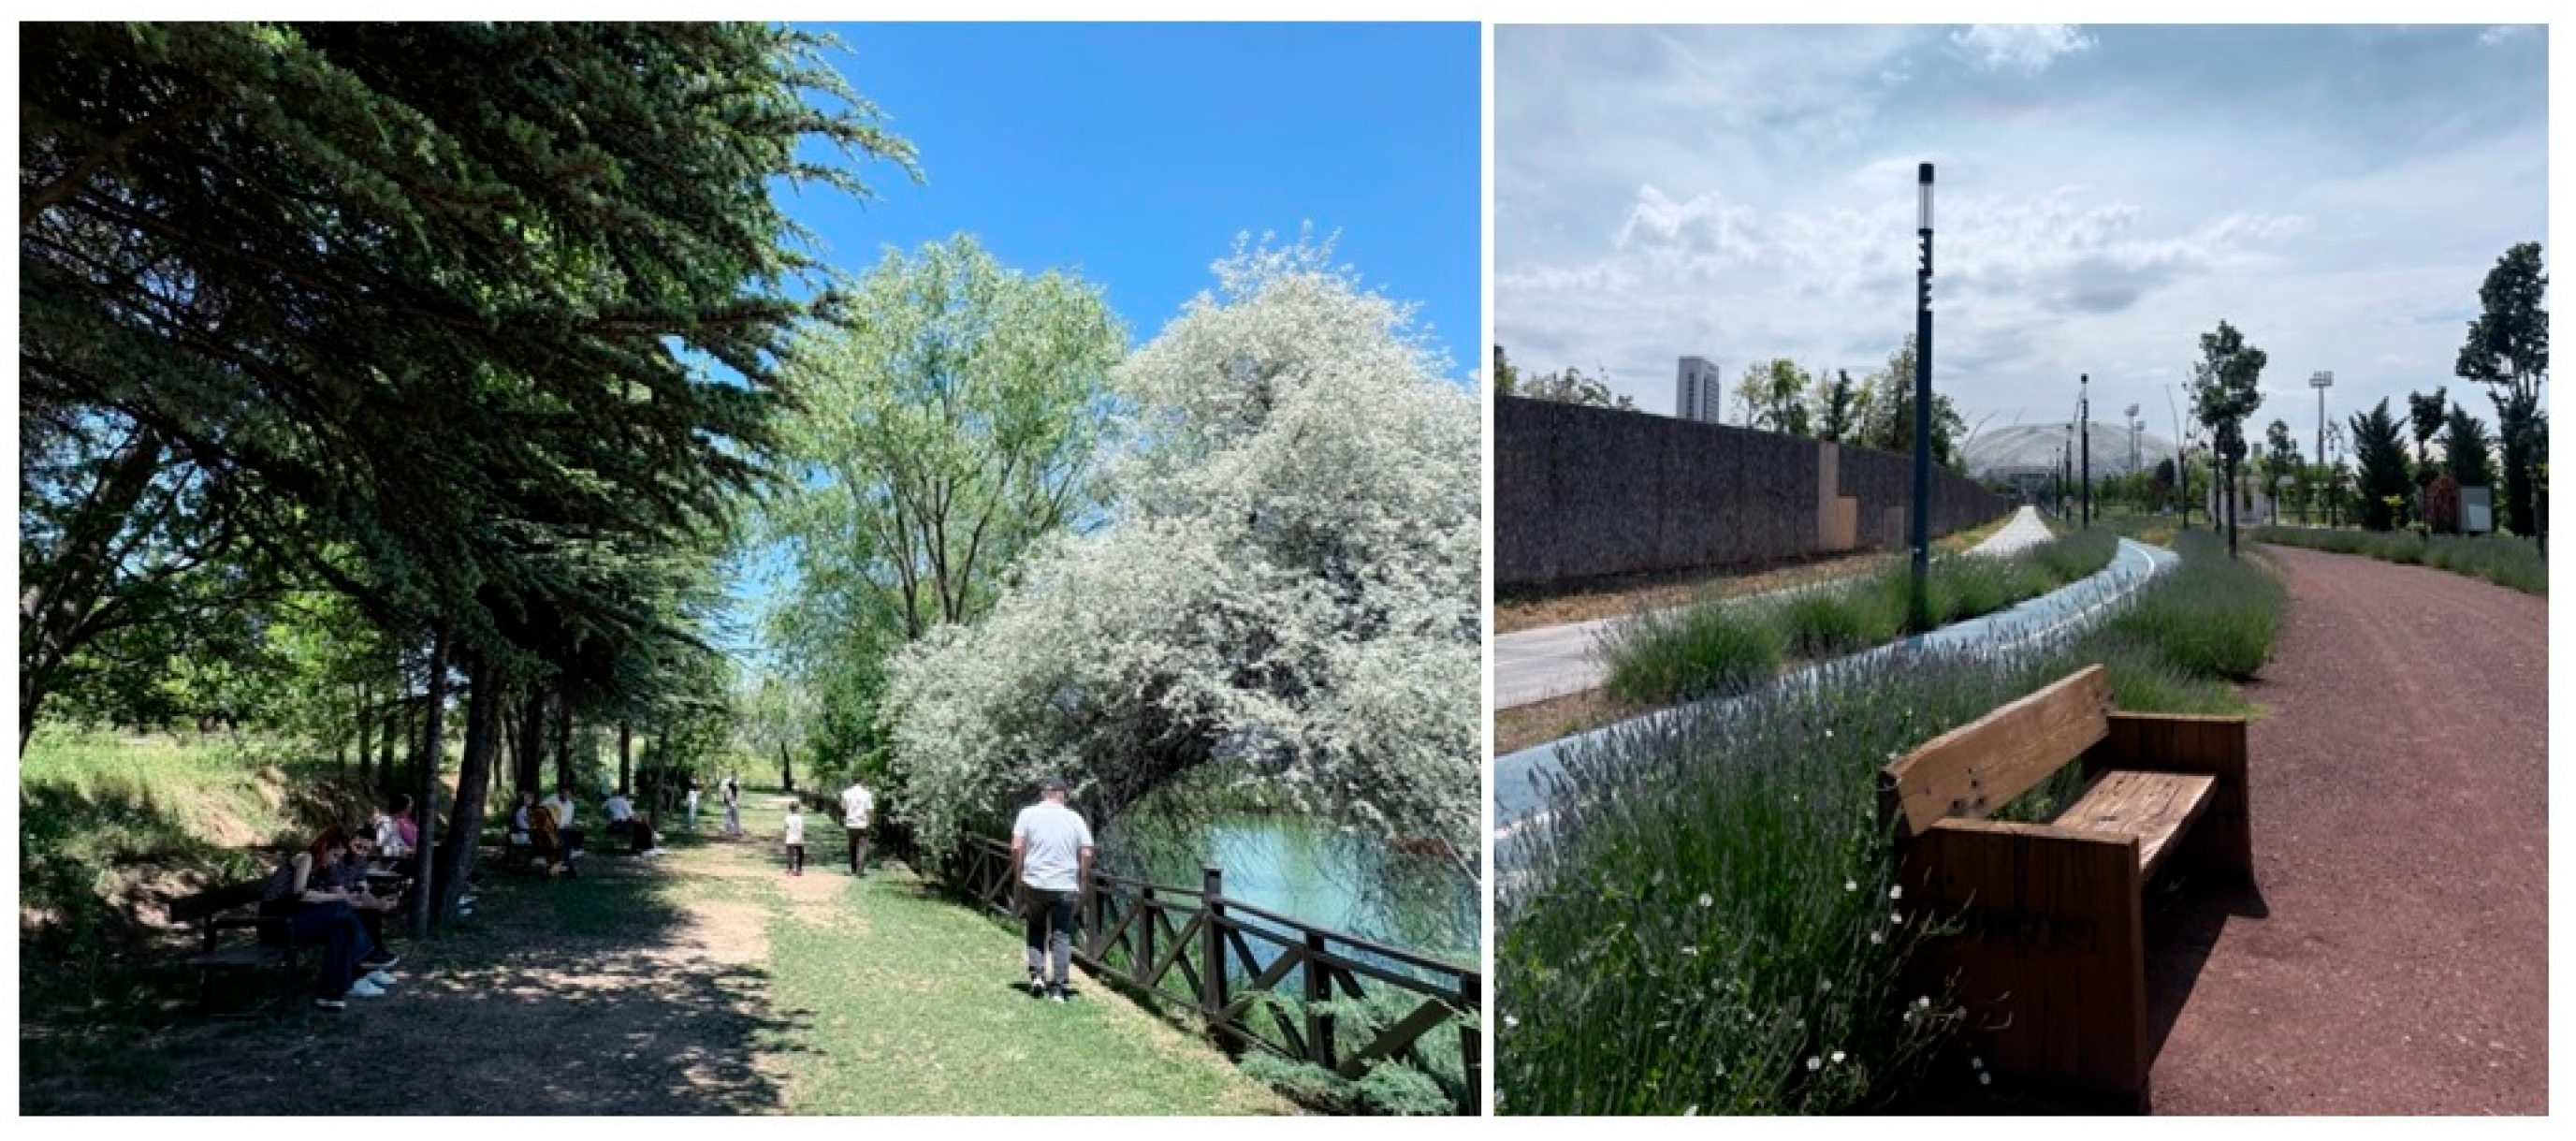
This dimension refers to the extent to which the park provides equitable opportunities for participation among users of different ages, abilities, and social backgrounds. Designing urban green spaces as shared environments that facilitate social participation and interaction between users with and without disabilities is considered critical to preventing social exclusion [17]. Accordingly, the indicators assessed under this dimension included the availability of activity areas suitable for children, young people, adults, and older adults; the provision of inclusive play spaces accessible to children with diverse abilities; the adequacy and accessibility of spaces for social activities and gatherings; the provision of a safe environment for all users through appropriate lighting, surveillance systems, and emergency facilities; and the availability of diverse seating arrangements that accommodate the needs of different user groups. The five indicators evaluated within this dimension are presented in Table 5. Representative examples of limited seating diversity in both study areas are shown in Figure 6.
Table 5.
Social Inclusivity (SI) indicators.
Figure 6.
Representative examples of Social Inclusivity in the study areas: (left) the National Botanical Garden and (right) the Capital National Garden. Both parks predominantly employ a uniform bench type, offering limited seating diversity and insufficient accommodation for users with different mobility and accessibility requirements. Photos taken by the authors during field observations in June 2026.
2.3.5. Thermal Comfort Potential (T)
Thermal Comfort Potential was introduced as a context-sensitive extension of PIDI. Outdoor thermal conditions influence spatial preference and duration of public-space use [18], while heat exposure can affect children, older adults, people with disabilities and people with chronic conditions disproportionately [19]. The dimension therefore addresses inclusive use as well as climatic context. Its four indicators assess shade continuity, the proportion of shaded seating, diversity of natural and artificial shading elements, and an appropriate balance between exposed and sheltered spaces. These observations represent design-derived potential rather than measurements of air temperature, radiant temperature, physiological exposure or perceived thermal comfort. The four indicators comprising this dimension are presented in Table 6. Representative examples of differences in Thermal Comfort Potential between the study areas are shown in Figure 7.
Table 6.
Thermal Comfort Potential (T) indicators.
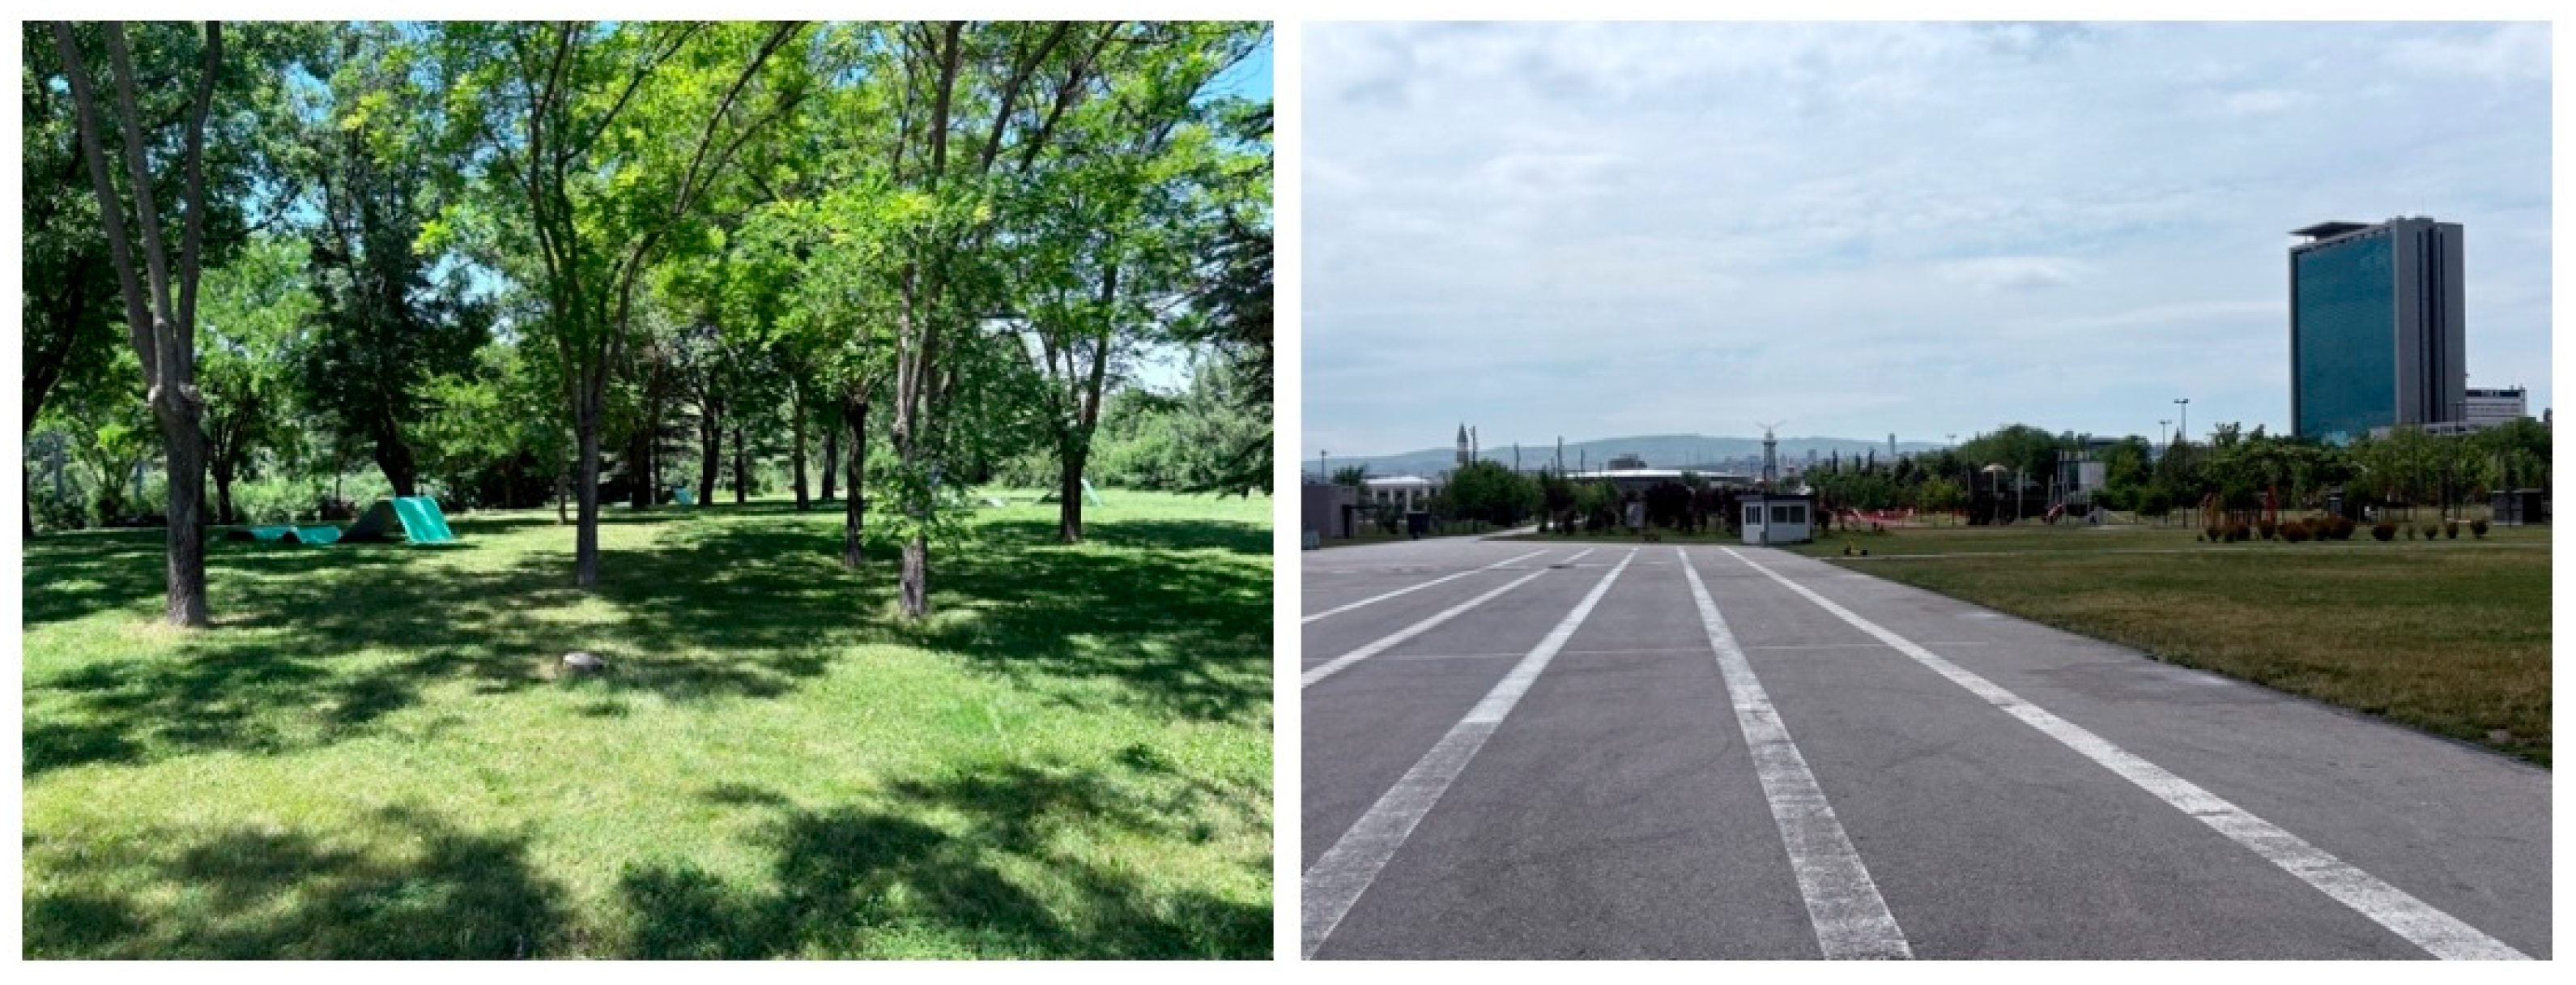
Figure 7.
Representative examples of differences in Thermal Comfort Potential between the study areas: (left) continuous and extensively distributed shaded areas in the National Botanical Garden; and (right) comparatively limited provision and spatial continuity of shading elements in the Capital National Garden. Photos taken by the authors during field observations in June 2026.
2.4. Field-Based Observation and Indicator Scoring
Field assessments were conducted in June 2026 by the two authors, both academics holding PhDs in Landscape Architecture and experienced in inclusive-design and accessibility research. Each visit was a full-day field session conducted on a sunny day from 10:00 to 18:00, allowing the distribution and continuity of shade to be assessed under comparable conditions. The Capital National Garden was visited three times, whereas the larger National Botanical Garden was visited five times to ensure adequate coverage. During the visits, the authors jointly traversed all publicly accessible circulation routes and assessed the associated public-use spaces observable from those routes. Each author recorded the 38 indicator ratings independently using the same rubric.
Each indicator was rated using four ordered categories: 0 = absent, unusable or constituting a major barrier; 1 = limited provision or substantial deficiencies; 2 = generally usable but incomplete, inconsistent or insufficiently distributed provision; and 3 = consistently usable, appropriately distributed and supportive of inclusive use. For the non-monotonic indicators—S4 (appropriate balance between shade and light supporting comfort and legibility), S5 (appropriate level of visual complexity supporting coherence and legibility) and T4 (appropriate balance between exposed and sheltered spaces)—a score of 3 represents the defined optimum rather than the maximum quantity of any one condition. Indicator-specific operational anchors are provided in Supplementary Table S2 and were informed by the original PIDI, the inclusive-design literature and outdoor-accessibility guidance [13,14,20].
Inter-rater reliability was evaluated using linearly weighted Cohen’s kappa because the ratings were ordinal and one-category disagreements were less consequential than larger disagreements. Exact agreement was also reported. The final analytical value for each indicator was the unrounded arithmetic mean of the two independent integer ratings. Accordingly, values ending in 0.5 are aggregated means and do not constitute additional rubric categories. The complete independent ratings are reported in Supplementary Table S3.
2.5. Min–Max Normalisation
Min–max normalisation was applied to transform the indicator scores into a comparable scale. This method is among the most widely used normalisation techniques in multi-criteria decision-making and composite indicator studies [21]. Rather than deriving the minimum and maximum values from the observed scores of the two study sites, normalisation was performed using the fixed lower and upper bounds of the original assessment scale (Xmin = 0 and Xmax = 3). Consequently, the normalised values were calculated against an absolute reference range, thereby preventing them from reflecting only the relative differences between the two study sites:
Xnorm = (X − Xmin)/(Xmax − Xmin)
In this study, Xmin and Xmax were fixed at 0 and 3, respectively. Through this transformation, each indicator score was rescaled to a value between 0 and 1. Subsequently, the dimension score (xi) was calculated as the arithmetic mean of the normalised indicator values associated with the respective dimension.
2.6. Criteria Weighting: Expert Panel and the Analytic Hierarchy Process (AHP)
The Analytic Hierarchy Process (AHP) was employed to determine the relative importance and corresponding weights of the five principal dimensions. Developed by Saaty, AHP is one of the most widely applied multi-criteria decision-making methods and enables the relative prioritisation of criteria through systematic pairwise comparisons in complex decision-making problems [22].
The panel comprised eight PhD-holding academics: two each from Architecture, Landscape Architecture, Interior Architecture, and Urban and Regional Planning. Experts were selected according to three eligibility criteria: a PhD in a relevant built-environment discipline, at least ten years of academic or professional experience, and relevant research or practice concerning inclusive design or accessibility. Experts completed the pairwise comparisons independently using Saaty’s fundamental 1–9 scale. Reciprocal values were permitted when the second criterion in a pair was considered more important than the first. The elicitation was a single-round expert-panel consultation rather than an iterative Delphi process [22,23]. The comparison form is presented in Table 7.
Table 7.
Pairwise comparison form used in the expert panel. A value greater than 1 indicates preference for the first criterion; a reciprocal value indicates preference for the second criterion.
The n × n pairwise comparison matrix (A), constructed from each expert’s pairwise judgements, is expressed in the following general form:
For each expert matrix, the priority vector was derived from the normalised principal right eigenvector, satisfying A·w = λmax·w and Σwi = 1 [22]:
For the consistency analysis, the maximum eigenvalue (λmax) was first calculated. Subsequently, the Consistency Index (CI) and Consistency Ratio (CR) were determined using the following equations:
The Random Index (RI) was set to 1.12 for n = 5, based on Saaty’s Random Index table. A Consistency Ratio (CR) below 0.10 indicates that the pairwise comparison judgements exhibit an acceptable level of consistency [22].
A = [aij], aij > 0, aji = 1/aij, aii = 1
A w = λmax w,⋯Σi wi = 1
CI = (λmax − n)/(n − 1)
CR = CI/RI
All eight final matrices satisfied CR < 0.10. The matrices were aggregated by taking the element-wise geometric mean, after which the group priority vector was derived from the principal eigenvector of the aggregated matrix [23]:
“m” denotes the total number of experts (m = 8).
āij = (Πk aij, k)^(1/m)
2.7. Calculation of the E-PIDI Score
The final E-PIDI score for each park was calculated by aggregating the normalised dimension scores (xi) with their corresponding AHP-derived criteria weights (wi):
E-PIDI = Σ(i = 1 → n) wi × xi
This approach is based on the weighted linear combination method, which is widely applied in the multi-criteria decision-making literature [21].
2.8. Statistical Comparison
The Wilcoxon signed-rank test was retained as an exploratory assessment of whether the 38 paired park-level mean indicator values tended to differ systematically [24]. The two-sided test used Wilcoxon’s zero-difference convention and a normal approximation without continuity correction. Because the indicators constitute a fixed, heterogeneous assessment framework rather than a random sample of independent observations, the result was interpreted only as a summary of the included indicator set and not as population-level inference or a test of equivalence between parks.
For each indicator, the raw score difference between the two parks was calculated as:
di = xBotanical,i − xCapital,i
The absolute differences were then ranked, and the test statistic (W) was derived from the sums of the ranks associated with positive and negative differences (W+ and W−, respectively). Indicator pairs with a difference of zero—that is, those receiving identical scores for both parks—were excluded from the analysis in accordance with the standard Wilcoxon signed-rank procedure.
2.9. Robustness and Sensitivity Analysis Procedures
Robustness was examined under equal dimension weights, each expert’s individual priority vector, leave-one-expert-out group weights, each author’s ratings separately, the unrounded mean ratings used in the primary analysis and the previously rounded combined ratings. These scenarios test sensitivity to both expert weighting and field-rating aggregation without changing the underlying observations. Full scenario results are provided in Supplementary Table S4.
3. Results
3.1. Indicator-Based Observation Results
The unrounded arithmetic means of the two independent ratings are presented in Table 8, Table 9, Table 10, Table 11 and Table 12. Half-point values arise only from averaging two adjacent integer ratings and are not additional rubric categories.
Table 8.
Observation scores for the Motor Accessibility (M) indicators.
Table 9.
Observation scores for the Sensory Perceptibility (S) indicators.
Table 10.
Observation scores for the Cognitive and Wayfinding Support (C) indicators.
Table 11.
Observation scores for the Social Inclusivity (SI) indicators.
Table 12.
Observation scores for the Thermal Comfort Potential (T) indicators.
The two authors agreed exactly on 26 of 38 Capital National Garden ratings (68.4%) and 30 of 38 National Botanical Garden ratings (78.9%). Linearly weighted Cohen’s kappa was 0.588 for the Capital National Garden, 0.737 for the National Botanical Garden and 0.675 for the pooled dataset. All 20 disagreements were limited to one category, with no two- or three-category disagreements. After averaging, the two parks had identical values for 14 indicators (36.8%); the largest and most consistent between-park differences occurred within Thermal Comfort Potential.
3.2. Expert Panel and AHP Results
The experts’ pairwise comparison judgements are presented in Table 13.
Table 13.
Experts’ pairwise comparison judgements.
The individual criteria weights and Consistency Ratios (CRs) calculated from the pairwise comparison judgements of the eight experts are presented in Table 14.
Table 14.
Individual criteria weights and Consistency Ratios (CRs).
The aggregated comparison matrix was highly consistent (λmax = 5.07938; CI = 0.01984; CR = 0.01772), and all eight individual matrices satisfied CR < 0.10. Motor Accessibility received the highest group weight (0.3809; 38.09%), followed by Cognitive and Wayfinding Support (0.2231; 22.31%), Social Inclusivity (0.2229; 22.29%), Thermal Comfort Potential (0.0935; 9.35%) and Sensory Perceptibility (0.0795; 7.95%). These weights express the relative priorities of this expert panel and do not imply that lower-weighted dimensions are intrinsically unimportant.
3.3. Dimension-Level Comparison and Statistical Evaluation
The mean dimension-level scores obtained by applying min–max normalisation to the raw scores presented in Table 8, Table 9, Table 10, Table 11 and Table 12 are compared in Table 15.
Table 15.
Comparison of normalised dimension-level scores.
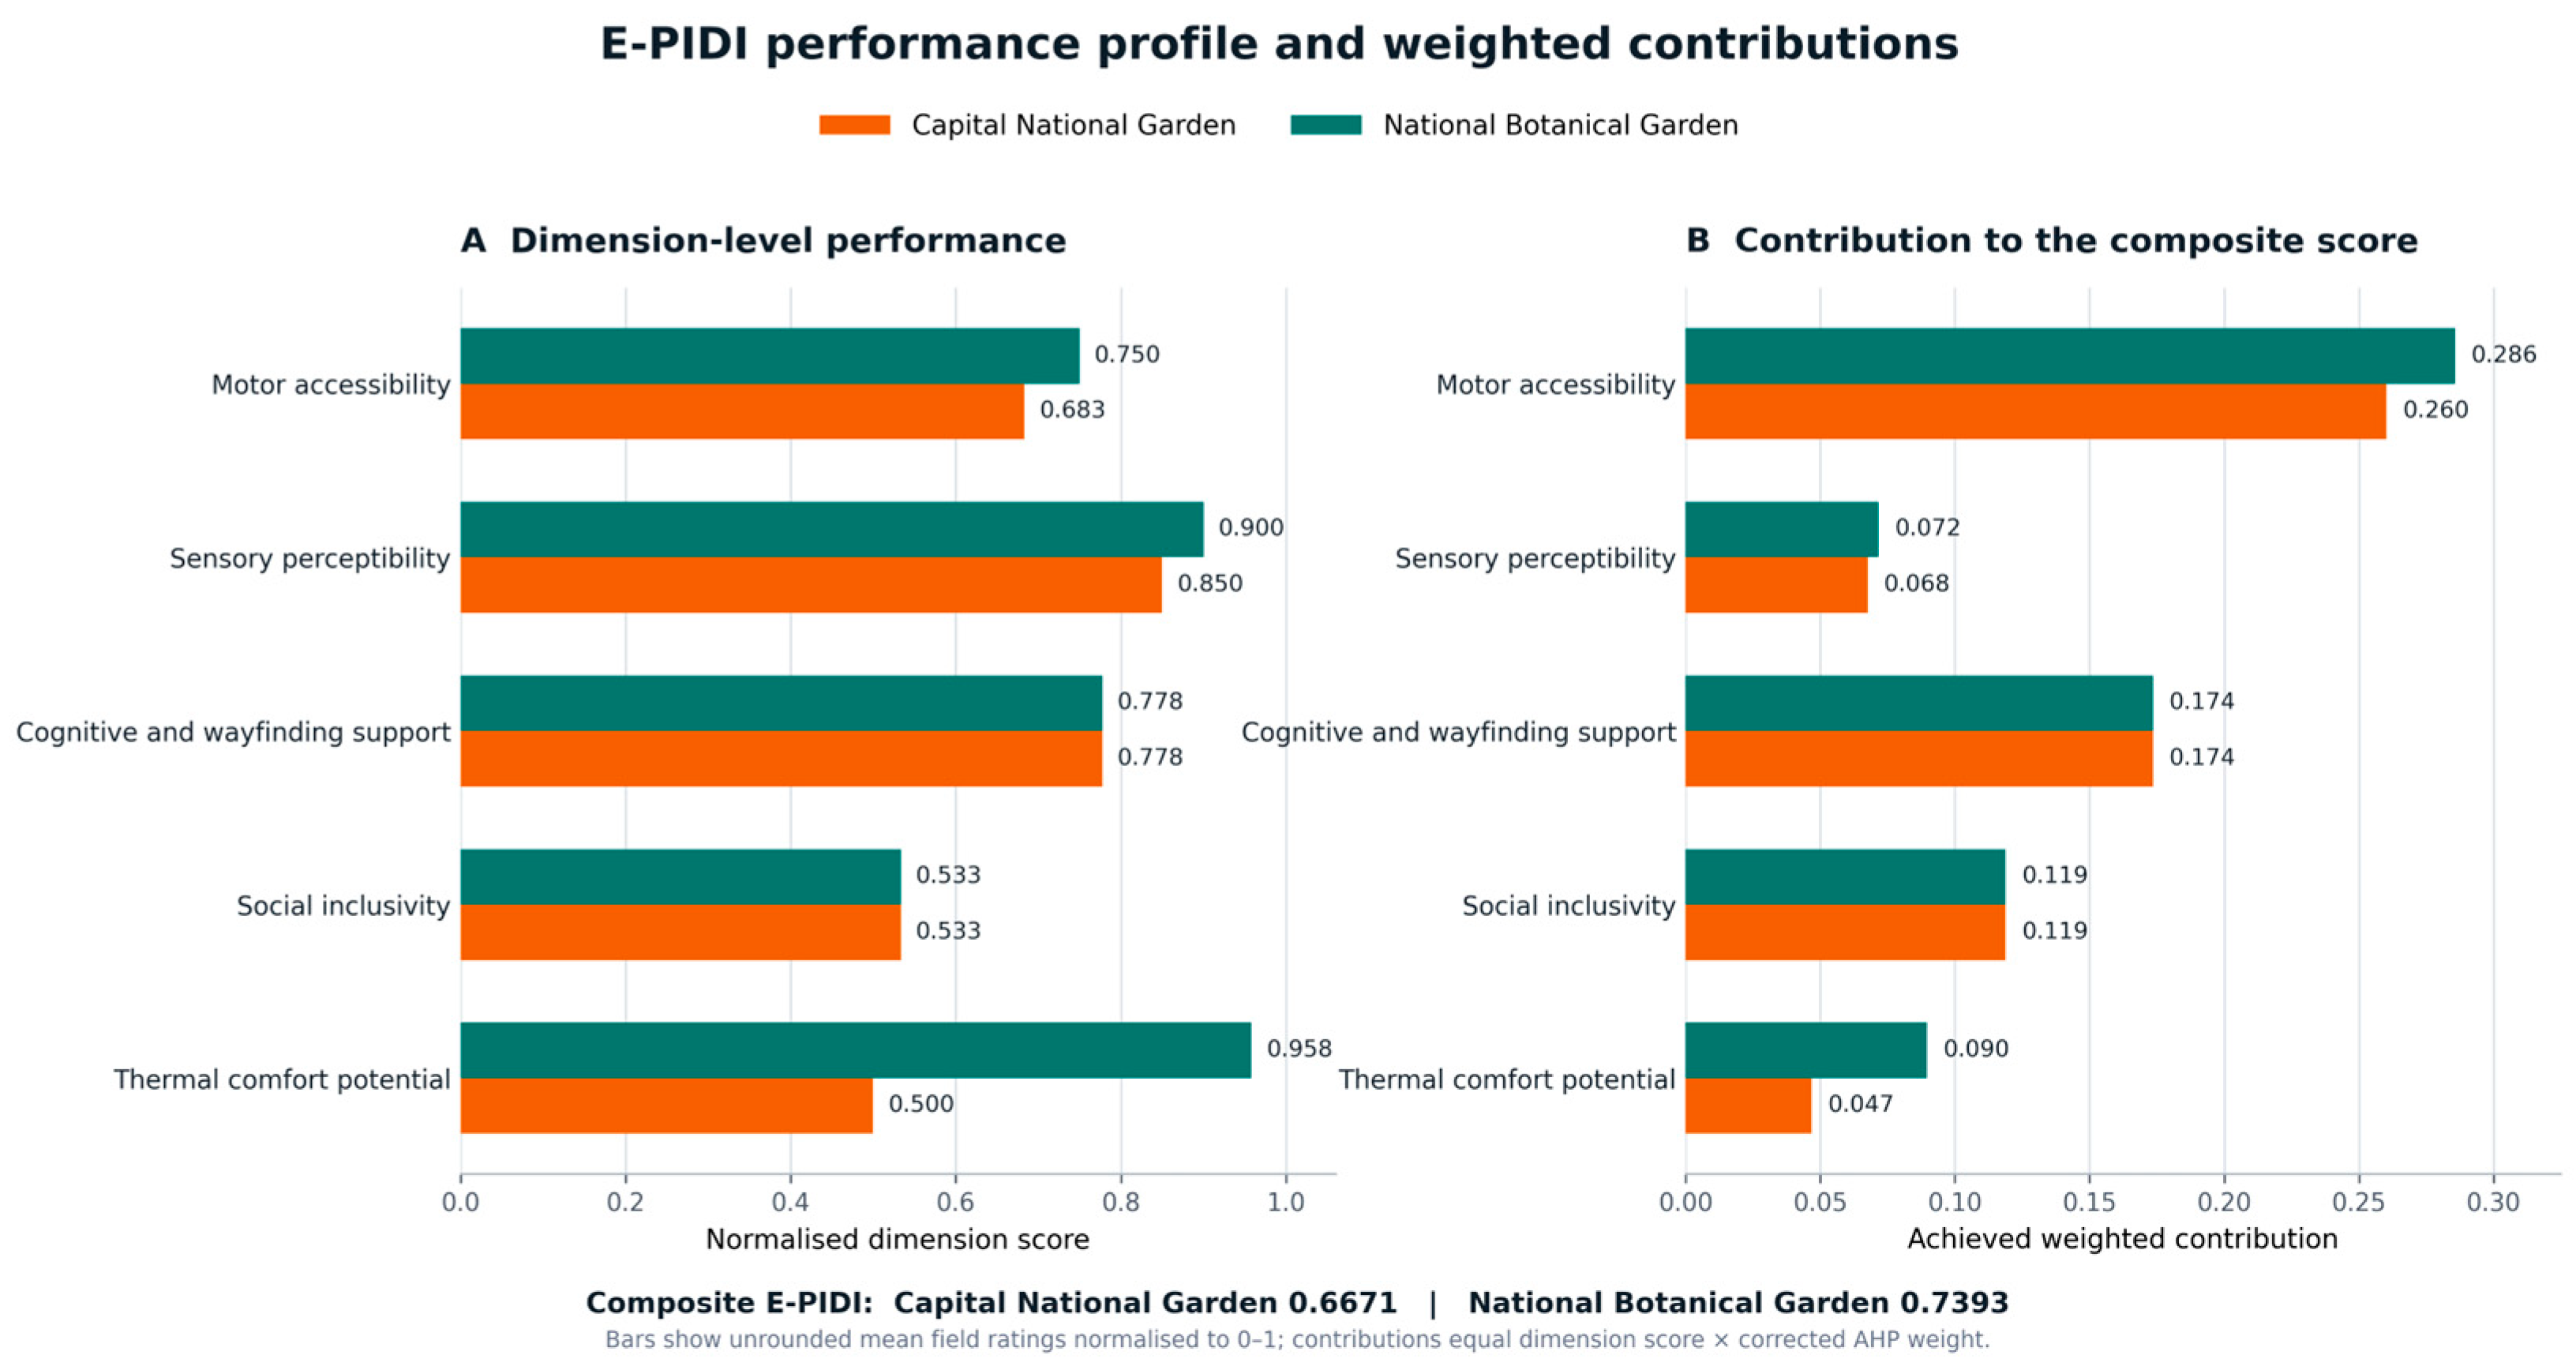
The National Botanical Garden achieved higher normalised scores for Motor Accessibility (0.7500 vs. 0.6833), Sensory Perceptibility (0.9000 vs. 0.8500) and Thermal Comfort Potential (0.9583 vs. 0.5000). The parks obtained identical scores for Cognitive and Wayfinding Support (0.7778) and Social Inclusivity (0.5333). Nevertheless, equal dimension scores mean they arose from different underlying indicator profiles.
The most pronounced dimension-level contrast concerned Thermal Comfort Potential. The National Botanical Garden’s substantially higher value reflected continuous shade, widespread shaded seating and diverse shading elements, whereas the Capital National Garden showed more limited shade continuity and provision. The value of 0.9583 indicates strong observed design potential rather than measured or perceived thermal comfort.
An exploratory Wilcoxon signed-rank test was applied to the 38 paired mean indicator values where: W = 86.5 and p = 0.0627 (two-sided; non-zero pairs = 24).
The exploratory test did not reach the conventional 0.05 threshold (p = 0.0627). This result does not establish equivalence between the parks and does not supersede the dimension- and indicator-level profiles. Fourteen paired indicator values were tied, while the National Botanical Garden was higher on 17 and the Capital National Garden on seven.
Accordingly, the composite difference (Δ = 0.0722) is interpreted as a descriptive contrast within the assessed framework. Its stability is evaluated directly through the sensitivity scenarios reported below.
3.4. Final E-PIDI Scores
The final E-PIDI scores, calculated by multiplying the normalised dimension scores (xi) by their corresponding AHP-derived criteria weights (wi), are presented in Table 16 and Table 17.
Table 16.
E-PIDI calculation—Capital National Garden.
Table 17.
E-PIDI calculation—National Botanical Garden.
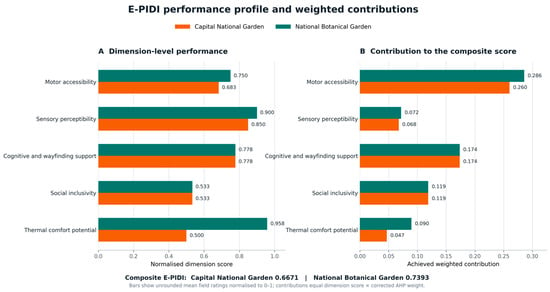
Figure 8 jointly presents the normalised dimension profiles and their achieved AHP-weighted contributions, allowing the composite values to be interpreted without obscuring the underlying dimensions.
Figure 8.
Comparison of (A) normalised dimension-level performance and (B) achieved AHP-weighted contributions based on the unrounded mean field ratings and group AHP weights.
As shown in Figure 8, Motor Accessibility made the largest contribution to both composite scores because it combined the highest weight with relatively strong performance. Thermal Comfort Potential produced the largest between-park contribution difference (0.0429), followed by Motor Accessibility (0.0254) and Sensory Perceptibility (0.0040). Cognitive and Wayfinding Support and Social Inclusivity contributed equally to the two park scores.
The E-PIDI score was 0.6671 for the Capital National Garden and 0.7393 for the National Botanical Garden (Table 16 and Table 17). The 0.0722 difference was therefore attributable to the three dimensions in which the National Botanical Garden achieved higher normalised performance, particularly Thermal Comfort Potential.
3.5. Robustness and Sensitivity Analysis Results
The National Botanical Garden retained a higher composite score under every tested scenario. Equal weights produced scores of 0.6689 and 0.7839, while author-specific ratings produced differences of 0.0766 (Author 1) and 0.0679 (Author 2). Under the eight individual expert weight vectors, the difference ranged from 0.0501 to 0.1408; under leave-one-expert-out group weights, it ranged from 0.0657 to 0.0756. The previously rounded ratings also retained the ranking (Δ = 0.0639). Because the National Botanical Garden was not lower in any of the five unrounded dimension scores, no non-negative weight vector summing to one could reverse the ranking. The principal sensitivity-analysis results are summarised in Table 18.
Table 18.
Summary of primary sensitivity scenarios.
4. Discussion
4.1. Comparative Inclusive-Design Performance
The comparative assessment revealed differentiated performance rather than uniform superiority. The National Botanical Garden achieved a higher composite score (0.7393 vs. 0.6671), and this ordering remained stable across all weighting and rating-aggregation scenarios. The exploratory Wilcoxon result (p = 0.0627) should not be interpreted as evidence of equivalence, because the 38 indicators are a fixed and heterogeneous framework rather than a population sample. The substantive interpretation therefore rests on the dimension and indicator profiles together with the demonstrated robustness of the composite ranking.
Motor Accessibility received the largest AHP weight and consequently exerted substantial influence on the final index. The National Botanical Garden performed better in pathway continuity, pathway width, resting opportunities, entrance accessibility, access to shaded areas and circulation continuity, whereas the Capital National Garden performed better in managing elevation changes and seating accessibility. This pattern demonstrates why dimension means should not replace indicator-level diagnosis: a park can obtain a higher motor score while still containing consequential local barriers. The finding is consistent with research emphasising continuity across the complete user journey rather than compliance by isolated facilities [10,11,13].
The largest dimension-level contrast concerned Thermal Comfort Potential (0.9583 in the National Botanical Garden and 0.5000 in the Capital National Garden). Its weighted contribution difference (0.0429) exceeded the motor (0.0254) and sensory (0.0040) differences. The result supports treating shade continuity, shaded seating and a usable choice between exposed and sheltered spaces as inclusive-design conditions, particularly where children, older adults and some disabled users may be more vulnerable to heat [19]. Nevertheless, the dimension represents observed spatial potential only and cannot demonstrate actual microclimatic or perceived comfort without direct measurement.
The parks obtained the same Cognitive and Wayfinding Support mean (0.7778) but reached it through different profiles. The Capital National Garden performed better in landmark availability and texture- and colour-based directional support, whereas the National Botanical Garden performed better in entrance perceptibility and ease of wayfinding. This finding accords with Lynch’s argument that landmarks, paths and nodes contribute differently to legibility and cognitive mapping [16]. It also illustrates the diagnostic value of retaining indicator-level results when aggregate dimension scores are equal.
The National Botanical Garden achieved a moderately higher Sensory Perceptibility score (0.9000 vs. 0.8500), principally through vegetation texture, shade–light balance and appropriately varied visual conditions. Scores for Social Inclusivity were equal (0.5333), but again reflected different profiles: the National Botanical Garden provided a broader range of activity opportunities, while the Capital National Garden performed better in accessible social and gathering spaces. Both parks received low ratings for inclusive play and seating diversity. Because Social Inclusivity and Cognitive and Wayfinding Support received almost identical secondary weights (22.29% and 22.31%), these shared social deficiencies remain important intervention priorities rather than minor concerns [10,17].
4.2. Methodological Implications
E-PIDI provides a traceable, context-sensitive extension of PIDI rather than an entirely separate framework. The supplementary crosswalk documents how the original 60 indicators were consolidated into 38 observable park-wide indicators and how the social and thermal dimensions were made explicit. The original 48-park application demonstrated the index’s value for broad comparison across multiple park types, while the present application demonstrates a complementary mode of use: intensive diagnosis and direct comparison of very large, internally heterogeneous parks. Fixed-bound normalisation preserves an absolute 0–1 reference scale, while AHP makes the value judgements underlying dimension weights visible. The low group Consistency Ratio (CR = 0.0177), acceptable individual CRs and stable leave-one-expert-out results support the internal robustness of the weighting procedure.
The results also demonstrate the compensatory nature of a weighted linear index: strong performance in one dimension can offset a meaningful deficit in another. E-PIDI should therefore be used as a diagnostic profile as well as a summary score. Reporting independent ratings, inter-rater reliability, dimension scores, raw indicator means and sensitivity scenarios provides a more transparent basis for design decisions than the composite value alone.
4.3. Planning and Design Implications
For the Capital National Garden, priorities include increasing the frequency of resting opportunities, improving continuous access to shaded areas and expanding appropriately distributed shade over seating and circulation spaces. For the National Botanical Garden, attention should focus on step-free alternatives at elevation changes and on accessible seating. Across both parks, inclusive play provision, seating diversity, companion seating, wheelchair positioning and accessible gathering arrangements constitute shared priorities. The indicator-level dashboard allows these interventions to be identified without treating either park as uniformly inclusive or inaccessible.
4.4. Limitations and Future Applications
The intentional case design demonstrates E-PIDI’s intensive comparative use in two very large multifunctional parks under spatially complex conditions. However, the use of two purposively selected parks necessarily limits the generalizability of the site-specific findings and precludes treating the results as representative of parks across Ankara or Türkiye. This limitation should be interpreted in relation to the study’s intended analytical scope, which was to examine the proposed framework in depth within two information-rich cases characterised by extensive circulation systems, substantial internal spatial heterogeneity, and diverse recreational, social, ecological, and cultural functions. This focused case-study design enabled detailed indicator-level observation, repeated field coverage, independent assessment by two raters, and systematic sensitivity testing across complex park environments. Accordingly, the primary limitation concerns the external transferability of the empirical park-level findings—particularly whether the observed accessibility and inclusivity patterns would be reproduced across parks of different types, scales, spatial configurations, and contextual settings—rather than the internal robustness of the present comparison. Internal consistency was strengthened through independent field ratings, assessment of inter-rater reliability, and sensitivity analyses examining the stability of the results under alternative analytical assumptions.
The AHP weights reflect professional priorities from an eight-member academic panel that did not include disabled people or park-user representatives; their future participation could add complementary lived-experience perspectives. The comparative ranking nevertheless remained stable in the individual-weight and leave-one-expert-out analyses. Field scoring necessarily involves professional judgement, but the indicator rubric, independent ratings and reported weighted kappa make that judgement transparent. Finally, Thermal Comfort Potential describes observed shading and spatial configuration during sunny June visits rather than measured or perceived thermal comfort across all seasons.
Further applications may extend E-PIDI from intensive comparison of selected parks to broader benchmarking through larger, systematically selected and typologically diverse samples. They may also repeat observations across seasons, incorporate direct microclimatic measurements, and add evaluations by disabled users, older adults, children and caregivers to examine how expert-based environmental assessments correspond with lived experience. These extensions represent complementary modes of application rather than prerequisites for using the framework to compare specific parks.
5. Conclusions
This study systematically adapted and extended PIDI as E-PIDI and applied the framework comparatively in two very large multifunctional parks in Ankara. Using unrounded means from two independent raters and AHP-derived weights, the National Botanical Garden obtained a composite score of 0.7393 and the Capital National Garden 0.6671. The National Botanical Garden performed better in Motor Accessibility, Sensory Perceptibility and Thermal Comfort Potential, while the parks were equal in Cognitive and Wayfinding Support and Social Inclusivity. Indicator-level results nevertheless revealed different cognitive and social profiles and shared deficiencies in inclusive play and seating diversity.
The comparative ranking remained stable under equal weights, all individual expert weights, leave-one-expert-out group weights, each author’s ratings and the previously rounded ratings. These results support E-PIDI’s use as a transparent diagnostic and prioritisation tool when composite scores are interpreted alongside their underlying dimensions and indicators. The application demonstrates that the framework can support intensive comparison of large, spatially complex parks, while application to larger systematically selected samples can support broader representative benchmarking.
Supplementary Materials
The following supporting information can be downloaded at https://www.mdpi.com/article/10.3390/land15091674/s1, Table S1, PIDI–E-PIDI indicator crosswalk; Table S2, Indicator-specific operational scoring anchors; Table S3, Independent author ratings and unrounded arithmetic means; and Table S4, Complete sensitivity-analysis results.
Author Contributions
Conceptualization, M.F.T. and G.Ç.D.; methodology, M.F.T. and G.Ç.D.; software, M.F.T. and G.Ç.D.; validation, M.F.T. and G.Ç.D.; formal analysis, M.F.T. and G.Ç.D.; investigation, M.F.T. and G.Ç.D.; resources, M.F.T. and G.Ç.D.; data curation, M.F.T. and G.Ç.D.; writing—original draft preparation, M.F.T. and G.Ç.D.; writing—review and editing, M.F.T.; visualisation, M.F.T.; supervision, M.F.T. All authors have read and agreed to the published version of the manuscript.
Funding
This research received no external funding.
Data Availability Statement
The independent field ratings, operational scoring anchors and complete sensitivity results are provided in the Supplementary Materials. Further methodological information may be requested from the corresponding author.
Conflicts of Interest
The authors declare no conflicts of interest.
References
- Twohig-Bennett, C.; Jones, A. The Health Benefits of the Great Outdoors: A Systematic Review and Meta-Analysis of Greenspace Exposure and Health Outcomes. Environ. Res. 2018, 166, 628–637. [Google Scholar] [CrossRef] [Scilit] [PubMed]
- Luo, W.; Chen, H.; Yang, Z.; Liu, J. Accessibility and Equity of Park Green Spaces: Considering Differences in Walking Speeds across Age Groups. Land 2024, 13, 2240. [Google Scholar] [CrossRef] [Scilit]
- United Nations. Transforming Our World: The 2030 Agenda for Sustainable Development; United Nations: New York, NY, USA, 2015. Available online: https://sdgs.un.org/2030agenda (accessed on 3 May 2026).
- United Nations. Convention on the Rights of Persons with Disabilities; United Nations: New York, NY, USA, 2006. Available online: https://www.un.org/development/desa/disabilities/convention-on-the-rights-of-persons-with-disabilities.html (accessed on 3 May 2026).
- World Health Organization. Global Report on Health Equity for Persons with Disabilities; World Health Organization: Geneva, Switzerland, 2022. Available online: https://www.who.int/publications/i/item/9789240063600 (accessed on 17 May 2026).
- Rigolon, A. A Complex Landscape of Inequity in Access to Urban Parks: A Literature Review. Landsc. Urban Plan. 2016, 153, 160–169. [Google Scholar] [CrossRef] [Scilit]
- Clarkson, P.J.; Coleman, R. History of Inclusive Design in the UK. Appl. Ergon. 2015, 46, 235–247. [Google Scholar] [CrossRef] [Scilit] [PubMed]
- Heylighen, A.; Van der Linden, V.; Van Steenwinkel, I. Ten Questions Concerning Inclusive Design of the Built Environment. Build. Environ. 2017, 114, 507–517. [Google Scholar] [CrossRef] [Scilit]
- Papanicolaou, M.; Katafygiotou, M.; Dimopoulos, T. Reframing Urban Accessibility through Universal Design: A Critical Review with Case Insights from Kaimakli Linear Park. Land 2025, 14, 2017. [Google Scholar] [CrossRef] [Scilit]
- Wu, K.C.; Song, L.Y. A Case for Inclusive Design: Analyzing the Needs of Those Who Frequent Taiwan’s Urban Parks. Appl. Ergon. 2017, 58, 254–264. [Google Scholar] [CrossRef] [Scilit] [PubMed]
- Perry, M.A.; Devan, H.; Fitzgerald, H.; Han, K.; Liu, L.T.; Rouse, J. Accessibility and Usability of Parks and Playgrounds. Disabil. Health J. 2018, 11, 221–229. [Google Scholar] [CrossRef] [Scilit] [PubMed]
- Liao, Y.; Furuya, K. A Case Study on Children’s Accessibility in Urban Parks in Changsha City, China: Developing an Improved 2SFCA Method. Land 2024, 13, 1522. [Google Scholar] [CrossRef] [Scilit]
- Shi, W.; Mahdzar, S.S.S.; Li, W. Park Inclusive Design Index as a Systematic Evaluation Framework to Improve Inclusive Urban Park Uses: The Case of Hangzhou Urban Parks. Appl. Sci. 2023, 13, 12954. [Google Scholar] [CrossRef] [Scilit]
- Steinfeld, E.; Maisel, J. Universal Design: Creating Inclusive Environments; John Wiley & Sons: Hoboken, NJ, USA, 2012. [Google Scholar]
- Kaplan, R.; Kaplan, S. The Experience of Nature: A Psychological Perspective; Cambridge University Press: Cambridge, UK, 1989. [Google Scholar]
- Lynch, K. The Image of the City; MIT Press: Cambridge, MA, USA, 1960. [Google Scholar]
- Seeland, K.; Nicolè, S. Public Green Space and Disabled Users. Urban For. Urban Green. 2006, 5, 29–34. [Google Scholar] [CrossRef] [Scilit]
- Nikolopoulou, M.; Lykoudis, S. Thermal Comfort in Outdoor Urban Spaces: Analysis across Different European Countries. Build. Environ. 2006, 41, 1455–1470. [Google Scholar] [CrossRef] [Scilit]
- World Health Organization Regional Office for Europe. Heat and Health in the WHO European Region: Updated Evidence for Effective Prevention; WHO Regional Office for Europe: Copenhagen, Denmark, 2021. Available online: https://iris.who.int/handle/10665/339462 (accessed on 29 August 2026).
- U.S. Access Board. Guide to the ABA Accessibility Standards: Chapter 10—Outdoor Developed Areas. Available online: https://www.access-board.gov/aba/guides/chapter-10-outdoor/ (accessed on 29 August 2026).
- Nardo, M.; Saisana, M.; Saltelli, A.; Tarantola, S.; Hoffmann, A.; Giovannini, E. Handbook on Constructing Composite Indicators: Methodology and User Guide. OECD Stat. Work. Pap. 2005, 2005/03. [Google Scholar] [CrossRef]
- Saaty, T.L. The Analytic Hierarchy Process: Planning, Priority Setting, Resource Allocation; McGraw-Hill: New York, NY, USA, 1980. [Google Scholar]
- Forman, E.H.; Peniwati, K. Aggregating Individual Judgments and Priorities with the Analytic Hierarchy Process. Eur. J. Oper. Res. 1998, 108, 165–169. [Google Scholar] [CrossRef] [Scilit]
- Wilcoxon, F. Individual Comparisons by Ranking Methods. Biom. Bull. 1945, 1, 80–83. [Google Scholar] [CrossRef] [Scilit]

Disclaimer/Publisher’s Note: The statements, opinions and data contained in all publications are solely those of the individual author(s) and contributor(s) and not of MDPI and/or the editor(s). MDPI and/or the editor(s) disclaim responsibility for any injury to people or property resulting from any ideas, methods, instructions or products referred to in the content. |
© 2026 by the authors. Licensee MDPI, Basel, Switzerland. This article is an open access article distributed under the terms and conditions of the Creative Commons Attribution (CC BY) license.