


Abstract
While e-commerce has transformed consumption patterns, online shopping behavior remains influenced by the physical environment. Using Shanghai as a case study, this research applies machine learning, SHAP analysis, and K-Means clustering to examine the nonlinear impacts and spatial variations in the built environment on e-shopping. The findings reveal that: (1) E-shopping expenditure follows a long-tail distribution and displays a concentric spatial pattern, peaking between the Outer and Suburban Rings while decreasing within the Inner Ring and beyond the Suburban Ring. (2) Built-environment factors exhibit non-linear effects, with local shopping potential and transit distance playing dominant roles. Indicators such as store density and delivery facility coverage show inverted U-shaped threshold effects, indicating a shift from complementarity to substitution between offline and online retail. (3) The urban space can be clustered into three sub-district types—traditional residential, single-function, and mixed-use—each with distinct e-shopping patterns and drivers. This research highlights the spatial mechanisms shaping digital consumption, providing empirical evidence for context-specific retail planning in megacities.
1. Introduction
In the mobile internet era, e-commerce has lowered spatial barriers to shopping, fundamentally changing urban residents’ consumption decisions. As online and offline retail converge, metropolitan commerce in cities like Shanghai has entered an omnichannel era, comprising physical shopping, e-commerce, and mobile e-commerce [1]. Nevertheless, the surge in online consumption has not eliminated geographical boundaries. E-shopping behaviors remain rooted in physical locations, showing distinct spatial heterogeneity [2]. This heterogeneity stems from the intricate relationships between physical retail spaces and e-shopping behaviors—substitution, complementarity, neutrality, and modification [3,4]. However, macro-level theories have difficulty explaining micro-level variations within urban districts [5]. Thus, investigating how the multidimensional built environment affects residents’ e-shopping behaviors and exploring the interactions between physical spaces and online shopping not only clarifies the underlying spatial logic of urban consumption in the digital era [6] but also provides practical guidance for optimizing metropolitan commercial resource allocation and advancing international consumption centers.
Existing studies have primarily explored the relationship between e-shopping and physical retail across three main dimensions: spatial factors, individual socio-economic attributes, and online–offline channel interactions [7]. In terms of individual attributes, research has consistently found that groups with higher income, greater educational attainment, and extensive experience with digital technology are more likely to engage in online shopping [8]. In terms of spatial factors, built environment indicators such as distance to commercial centers, transport accessibility, and the density of physical stores influence residents’ online shopping frequency and expenditure [9]. Regarding online–offline interactions, research indicates that rather than a simple substitution effect, the two channels exhibit asymmetric characteristics. For instance, a moderate frequency of online shopping can stimulate demand for offline experiences, whereas an excessively high frequency can diminish physical store consumption [10]. Existing studies still have two main limitations in explaining these influencing factors. Methodologically, previous studies relied on multiple linear regression or structural equation modeling (SEM). These linear models assume constant variable impacts, making it difficult to measure the nonlinear and threshold effects of the built environment on e-shopping decisions [11]. On the other hand, in spatial analysis, the existing literature mostly focuses on single factors or city-wide macro-level analyses. Few studies combine the multidimensional built environment with residents’ consumption characteristics, lacking the clustering and typological classification of residents’ e-shopping patterns at the micro-spatial level [12].
Studies in retail geography increasingly explore the interaction between physical environments and digital commerce through the framework of digital urbanism [13]. A key finding in this literature is that digital consumption does not eliminate spatial constraints but operates within existing urban structures. For instance, research in European and North American contexts shows that built environments influence e-shopping adoption and create spatial variations in e-commerce accessibility [14,15]. Additionally, the integration of physical retail networks and last-mile logistics has become a central focus in urban planning [16,17]. demonstrating how spatial realities and digital platforms jointly shape consumer behavior [18]. To analyze these complex and non-linear interactions, AI-driven analysis has emerged as a valuable methodological tool, providing deeper insights into how multidimensional built environments shape localized e-shopping patterns [19].
Most existing studies rely on single-dimensional linear assumptions. They rarely combine individual attributes with the built environment to assess nonlinear effects, and often overlook micro-scale spatial variations. To address these gaps, this research constructs a multidimensional measurement framework using Shanghai as a case study. Specifically, the study first describes the spatial patterns of residents’ e-shopping behavior. Subsequently, it introduces machine learning and the SHAP model to uncover the nonlinear driving mechanisms of the multidimensional built environment, thereby identifying the relationship between physical and online shopping and the threshold effects. Finally, utilizing K-Means clustering, it conducts a typological classification and detailed analysis of consumption spaces at the sub-district level. This study not only deepens understanding of the evolutionary patterns of urban consumption spaces in the omnichannel era, but also provides empirical support for Shanghai’s development into an international consumption center and for the fine-grained allocation of commercial resources.
2. Materials and Methods
2.1. Research Framework
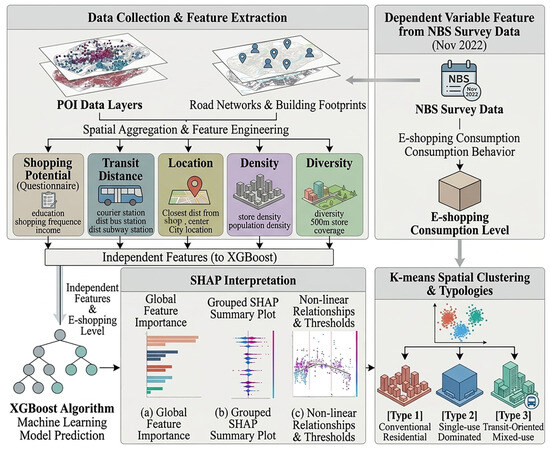
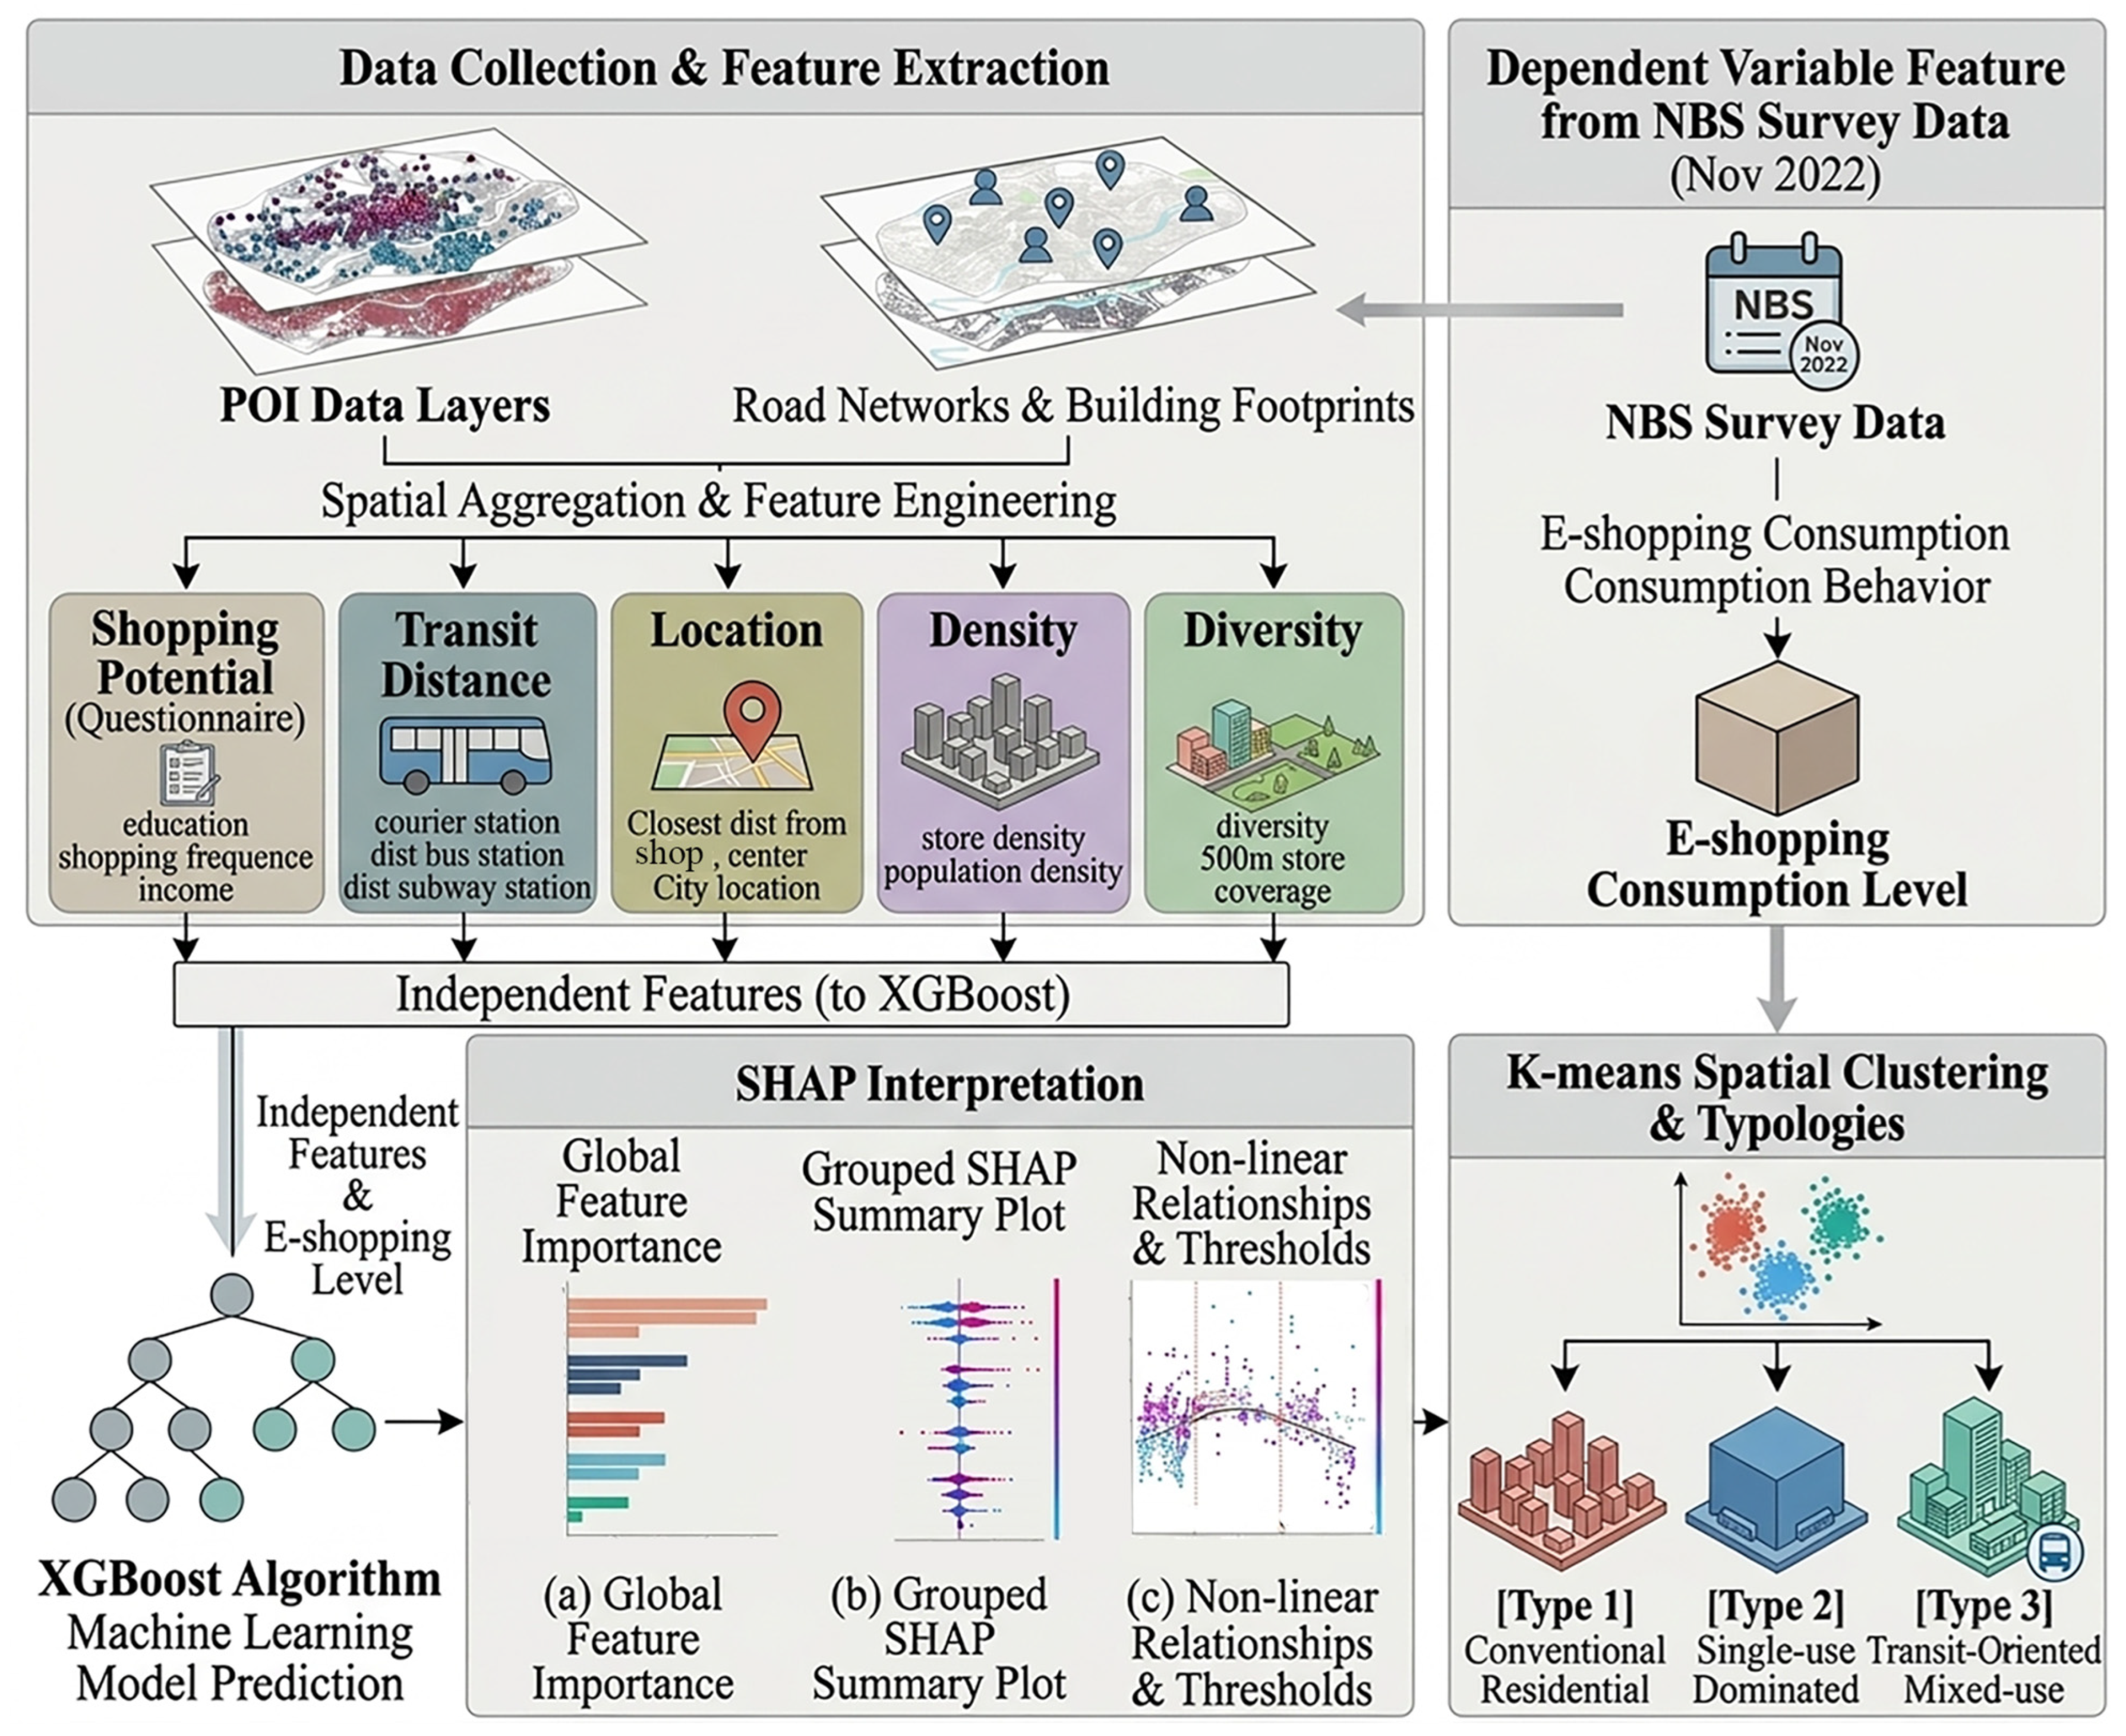
The overall analytical framework of this study comprises three parts: feature extraction, mechanism measurement, and typological classification (Figure 1). In the data processing stage, the study integrates questionnaire surveys with multi-source spatial data to construct a feature variable system encompassing socio-spatial attributes and the multidimensional built environment. During model construction, the extracted variables are used to train and compare machine learning models. Utilizing the SHAP method, the study conducts an in-depth analysis of the driving mechanisms behind e-shopping decisions from the perspectives of global feature importance and non-linear thresholds. In the spatial analysis stage, combined with the K-Means algorithm, a clustering analysis is conducted on micro-spatial units to extract differentiated types of urban consumption spaces. This aims to further reveal the spatial heterogeneity of the built environment’s impact, thereby providing a basis for formulating differentiated spatial interventions and policy guidelines.
Figure 1.
Research Framework.
2.2. Research Data
The research data primarily consists of two components: resident survey data and multi-source urban spatial data. The resident survey data were derived from the “Online Shopping Consumption Habits of E-shoppers” survey conducted by the National Bureau of Statistics in November 2022. The data were collected through a random household survey conducted by investigators from the Ministry of Natural Resources (MNR), designed to provide a representative and reliable sample. Administered via random household visits by professional surveyors, the survey yielded 551 valid questionnaires.
Among the 551 valid respondents, females accounted for 69.15%, and 95.64% were aged 30 or above. Educational levels were evenly distributed from junior high to bachelor’s degrees. Individual monthly incomes primarily fell into three brackets: 2001–5000 RMB (34.3%), 5001–10,000 RMB (44.1%), and 10,001–15,000 RMB (17.97%). Importantly, this socio-demographic structure generally aligns with the profile of active e-shoppers in Shanghai, supporting the sample’s representativeness. The questionnaire primarily collected information on respondents’ online shopping expenditures over the past 3 months, daily shopping habits, and personal socio-economic attributes. Based on this information, the study uses respondents’ e-shopping expenditures as the dependent variable. Meanwhile, considering that individual socio-economic attributes (such as income and education level) are often strongly correlated with residential space, this study integrates these micro-individual attributes into a “consumption potential” dimension representing the neighborhood-level consumption capacity, which is then incorporated into the model’s independent variable system.
The individual survey records, which contained no missing values, were spatially joined to the built environment indicators of their corresponding sub-districts using ArcGIS Pro 3.2 . Furthermore, because the independent variables were measured in different units and scales (e.g., meters for distance and percentages for density), Z-score standardization was applied to all features. This normalization is necessary to prevent variables with larger numeric ranges from disproportionately influencing the XGBoost training and K-Means clustering algorithms.
Regarding urban spatial data, this research primarily relied on the Amap Open Platform (API) to acquire multi-source urban data within the study area, specifically including various Points of Interest (POIs) and urban road networks. By aggregating and extracting features from these data, the study measured the micro-scale built environment across four dimensions: transport accessibility, spatial location, density and diversity, and road design. These four spatial dimensions, together with the aforementioned consumption potential, constitute the independent variables of this study. They were collectively input into the machine learning models for subsequent non-linear relationship analysis and spatial clustering.
2.3. Research Methods
2.3.1. XGBoost
XGBoost (Extreme Gradient Boosting) is a highly efficient ensemble machine learning algorithm based on gradient-boosted decision trees. Given the complex, multidimensional variables in this study, XGBoost effectively handles multicollinearity among spatial and socio-economic factors. Furthermore, it accurately captures potential nonlinear relationships and identifies the threshold effects of spatial factors on residents’ shopping decisions. During model construction, the algorithm linearly adds and iteratively trains a series of weak classifiers based on the negative gradient of the loss function. The core calculation formula of the model is as follows:
where represents the loss function of XGBoost, m is the number of trees that have been trained, is the actual value, and is the predicted result of the sample. Here, L denotes the cumulative loss of the predictions. is utilized to control model complexity, and a second-order Taylor expansion is applied to the loss function.
2.3.2. SHAP
To overcome the black-box nature of machine learning models, this study introduces the game-theory-based SHAP (Shapley Additive exPlanations) method to interpret the outputs of the XGBoost model. The SHAP method can accurately quantify the marginal contribution of each input feature to residents’ shopping decisions. Its core advantage lies in its ability not only to evaluate the global impact weights of spatial factors and socio-economic attributes on e-shopping expenditures, but also to extract the partial dependence relationships for each variable. This thereby intuitively demonstrates the non-linear characteristics and threshold effects of these complex factors. In the SHAP dependence plots, the zero-value line acts as a threshold separating positive from negative effects. Additionally, inflection points on these non-linear curves indicate rapid changes in the local slope, revealing critical tipping points in the built environment’s spatial influence. The calculation formula is as follows:
where is the predicted value for sample i, is the indicator vector of the sample, denotes the mean prediction value, and is the SHAP value of the j-th feature. When the SHAP value > 0, it indicates that the feature increases the predicted value; conversely, it decreases the predicted value.
2.3.3. K-Means Algorithm
In this research, the K-means clustering algorithm is primarily utilized to classify micro-spatial units, aiming to reveal the spatial heterogeneity of the built environment’s influence on online shopping behaviors. Based on the previously extracted multidimensional feature matrix—encompassing transport accessibility, spatial location, development density, functional diversity, and spatial consumption potential—this algorithm is applied to partition complex sub-district spaces into several typical consumption space typologies (such as the transit-oriented mixed type and the traditional residential-oriented type). As a classical unsupervised machine learning algorithm, the core philosophy of K-means is to divide the sample set into K disjoint clusters through iterative computation, ensuring that intra-cluster differences are minimized while inter-cluster differences are maximized. The algorithm achieves clustering primarily by minimizing the Sum of Squared Errors (SSE) within clusters. Its objective function is formulated as follows:
where is the sum of squared errors; is the specified number of clusters; represents the -th cluster; is the multi-dimensional feature sample point assigned to the cluster; and is the centroid vector of the cluster , i.e., the mean of all sample feature attributes within that cluster.
2.4. Study Area
This study selects Shanghai as the case study area. On the one hand, as one of China’s first pilot International Consumption Center Cities, Shanghai not only possesses a high-density physical retail network, but its digital economy penetration also consistently ranks at the forefront nationally. The complementary and substitution relationship between online and offline consumption is highly typical [20]. On the other hand, in terms of spatial morphology, Shanghai exhibits a concentric ring structure of “core area–inner ring–middle ring–outer ring–suburbs,” and there is spatial heterogeneity in the built environment elements across these different rings [21]. Therefore, taking Shanghai—a megacity with a diverse population structure and complex urban fabric—as the research object allows for a clearer capture of the non-linear impacts of the multi-dimensional built environment on e-shopping decisions, as well as their underlying patterns of spatial heterogeneity.
The sub-district (Jiedao/Zhen) was chosen as the spatial unit for this analysis. This scale aligns with the administrative boundaries used for demographic and socioeconomic census data in China, which facilitates reliable data integration. Additionally, the spatial extent of a sub-district generally matches residents’ daily activity ranges (such as the 15 min neighborhood) and the service areas of last-mile delivery stations. These features make it a suitable scale for analyzing the interactions between local built environments and e-shopping behavior.
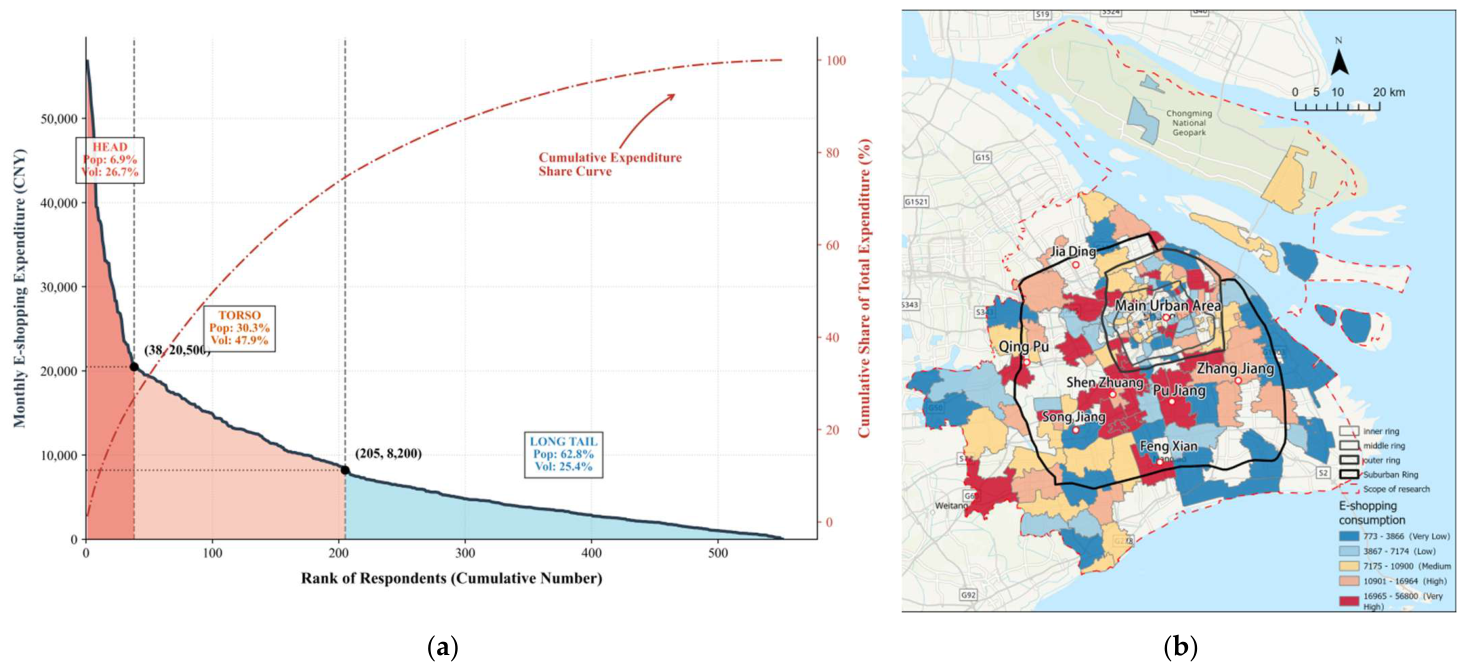
Based on the survey sample (Figure 2a), the average monthly e-shopping expenditure of the surveyed residents exhibits a long-tail distribution. Specifically, the curve shows two distinct inflection points at 6.9% and 37.2% of the cumulative sample size. Prior to the first inflection point, a very small head group maintains e-shopping expenditures at 20,500 yuan; by the second inflection point, the corresponding amount drops to approximately 8400 yuan. This distribution pattern—characterized by a highly concentrated head and an extremely long tail—indicates significant disparities and polarization in e-shopping consumption levels among metropolitan residents.
Figure 2.
The distribution of resident online shopping. (a) Basic Characteristics of Residents’ Online Shopping. (b) Spatial Distribution of Online Shopping.
Spatially (Figure 2b), residents’ e-shopping expenditures exhibit both central clustering and a gradient decline. Overall, high-value e-shopping areas are primarily clustered between the Inner Ring and the Outer Ring. In contrast, the main core urban area within the Inner Ring and the far suburbs beyond the Suburban Ring exhibit relatively lower values, forming an overall spatial pattern characterized as “high in the outer and suburban rings, and low within the middle ring and beyond the suburban ring.”
This phenomenon is primarily driven by the high density of physical retail in the core urban area, which exerts a substitution effect on e-shopping. Conversely, in peripheral areas far from the city center, e-shopping expenditures do not simply decay with increasing distance; rather, they are concentrated in peripheral new towns and urban sub-centers. For instance, evident high-value e-shopping clusters have emerged in the core areas of Zhangjiang, Shenzhuang, and Pujiang, as well as Jiading and Songjiang. Conversely, far suburban areas lacking large commercial nodes, such as western Qingpu and southern Fengxian, record lower levels of e-shopping consumption. Such spatial distribution disparities intuitively reflect the influence of the micro-built environment on residents’ e-shopping behavior.
3. Non-Linear Relationships of Factors Influencing Residents’ Shopping Decisions
3.1. Model Construction and Fitting Performance
Although the mobile internet has lowered the spatial barriers to shopping, the concentric zonal distribution of e-shopping expenditures among Shanghai residents indicates that online consumption remains closely related to the built environment. Therefore, building upon the classic “5Ds” framework of the built environment (Density, Diversity, Design, Destination accessibility, and Distance to transit) [22] and integrating the consumption characteristics of the internet era, this study constructs a comprehensive indicator system encompassing consumption potential and four dimensions of the built environment (Table 1). Specifically, individuals’ socio-economic attributes serve as the internal foundation determining their consumption preferences [23], while multi-dimensional physical spatial characteristics constitute the external conditions. Together, they shape micro-level e-shopping decisions.
Table 1.
Selection of evaluation metrics for the model.
Regarding the specific composition of indicators, the consumption potential dimension integrates respondents’ education, income, and shopping frequency to characterize the consumption features of the residents’ neighborhoods [18]. The transit accessibility dimension, in addition to traditional distances to bus and subway stations, incorporates an indicator for the coverage rate of express delivery stations within 500 m, specifically tailored to e-shopping characteristics [24]. The location dimension measures the impact of the macro-commercial gradient on e-shopping through the distance to the nearest commercial center and the urban spatial hierarchy [25]. The density dimension selects population density and physical store density to capture the substitution effect of high-density physical retail on online consumption [26]. Lastly, the diversity and design dimension not only utilizes the Shannon index to measure the richness of retail formats [27] but also constructs a commercial coverage indicator based on the service radii of convenience stores, supermarkets, and shopping centers, intuitively reflecting the importance of micro-commercial facilities to residents’ daily consumption.
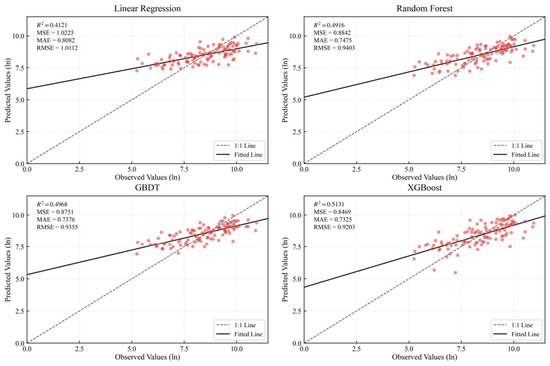
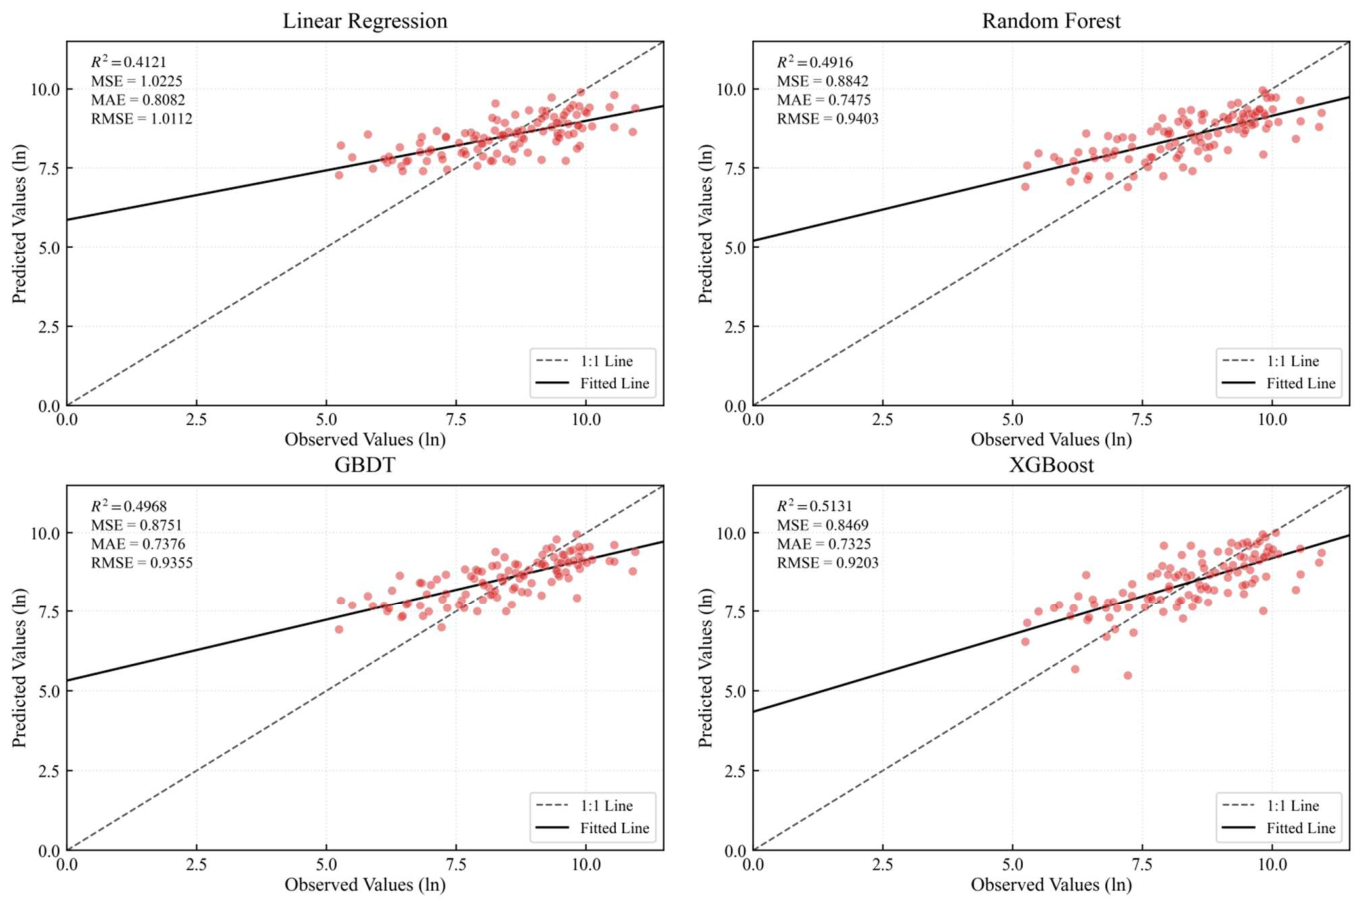
In this study, the natural logarithm of the average monthly online shopping expenditure was used as the dependent variable, while the multi-dimensional indicators listed in Table 1 served as the independent variables. Four models—Multiple Linear Regression (MLR), Random Forest (RF), Gradient Boosting Decision Tree (GBDT), and eXtreme Gradient Boosting (XGBoost)—were constructed, trained, and compared. As shown by the fitted scatter plots and evaluation metrics in Figure 3, the traditional linear regression model exhibited a relatively poor goodness-of-fit ( = 0.4121), indicating the presence of nonlinear relationships between the built environment and online shopping behavior. In contrast, the tree-based ensemble learning algorithms demonstrated superior overall performance. Specifically, the fitted regression line of the XGBoost model was the closest to the 1:1 reference line, achieving the highest coefficient of determination ( = 0.5131). Furthermore, its error metrics were the lowest among the four evaluated models (MSE = 0.8469, MAE = 0.7325, RMSE = 0.9203). Therefore, this study ultimately selected XGBoost, which yielded the highest fitting accuracy, as the core measurement model. Additionally, the SHAP (Shapley Additive exPlanations) method was integrated to further interpret the impact mechanisms of the various built environment indicators.
Figure 3.
Comparison of machine learning models.
The predictive model was constructed using the Extreme Gradient Boosting (XGBoost) algorithm. To optimize model performance while preventing overfitting, grid-search cross-validation was employed for hyperparameter tuning. The final configuration set the maximum tree depth to 4, the learning rate to 0.05, and the number of boosting iterations to 100.
To evaluate the stability and generalizability of this setup, a randomized 10-fold cross-validation (seed = 42) was conducted as a robustness check. As detailed in Table 2, the model demonstrated consistent predictive accuracy across all validation folds. The average coefficient of determination (R2) reached 0.513 ± 0.041. Furthermore, the error metrics exhibited minimal variance, yielding a mean MSE of 0.846 ± 0.053, a mean RMSE of 0.920 ± 0.061, and a mean MAE of 0.732 ± 0.045. These constrained standard deviations confirm that the model’s performance is robust to variations in the training data and is not driven by specific sample splits.
Table 2.
Results of the 10-Fold Cross-Validation Robustness Check.
3.2. Overall Contribution of Influencing Factors to Shopping Expenditure
3.2.1. Feature Importance and Effects
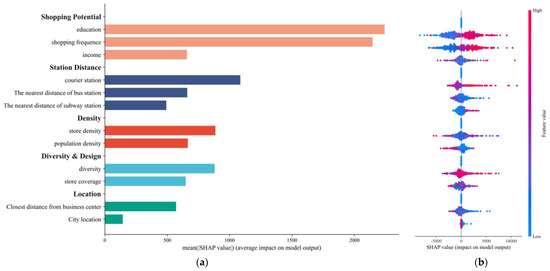
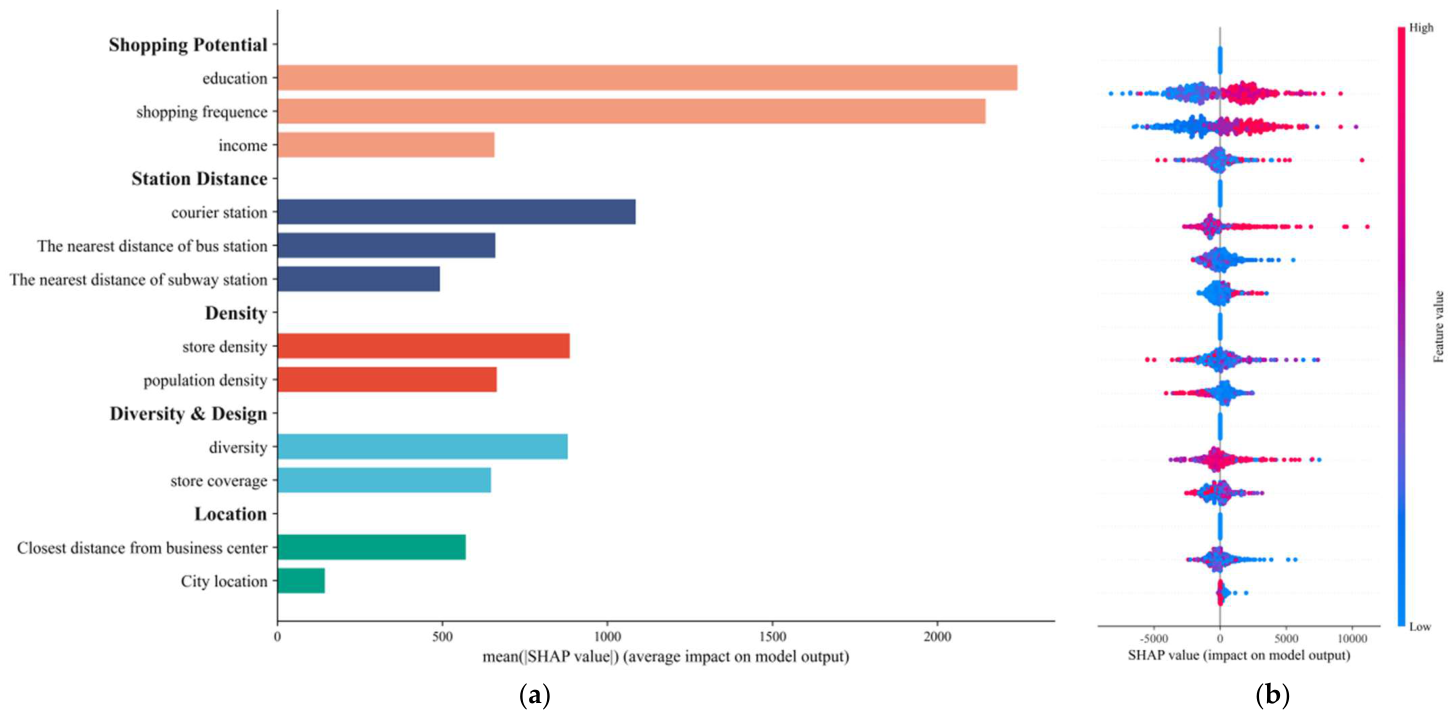
Overall, the shopping potential dimension is the most significant. Education level and shopping frequency rank as the top two contributors, both exerting strong positive impacts at higher levels. As illustrated by the SHAP feature importance bar chart and summary plot (Figure 4), the indicators across various dimensions differ in their magnitude of impact and direction of effect on residents’ shopping decisions. Within the station distance dimension, the contribution of courier stations ranks third overall, presenting a clear, high-value, positive influence. Conversely, indicators related to density, diversity, and design exhibit the opposite effect: lower store density, population density, and store coverage tend to promote online shopping.
Figure 4.
Global Feature Importance and SHAP Summary Plot. (a) Average SHAP Ranking; (b) Ranking of Contributions to Model Output.
3.2.2. Local Explanation
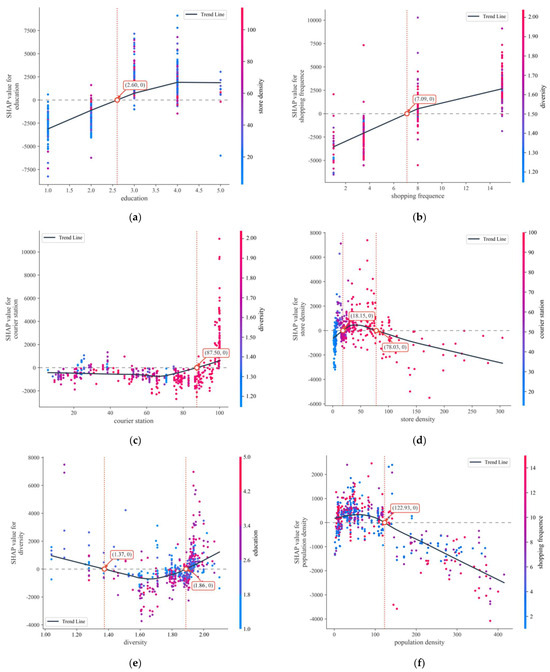
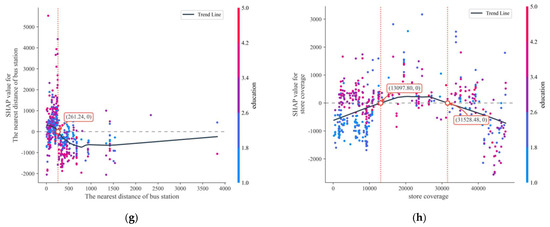
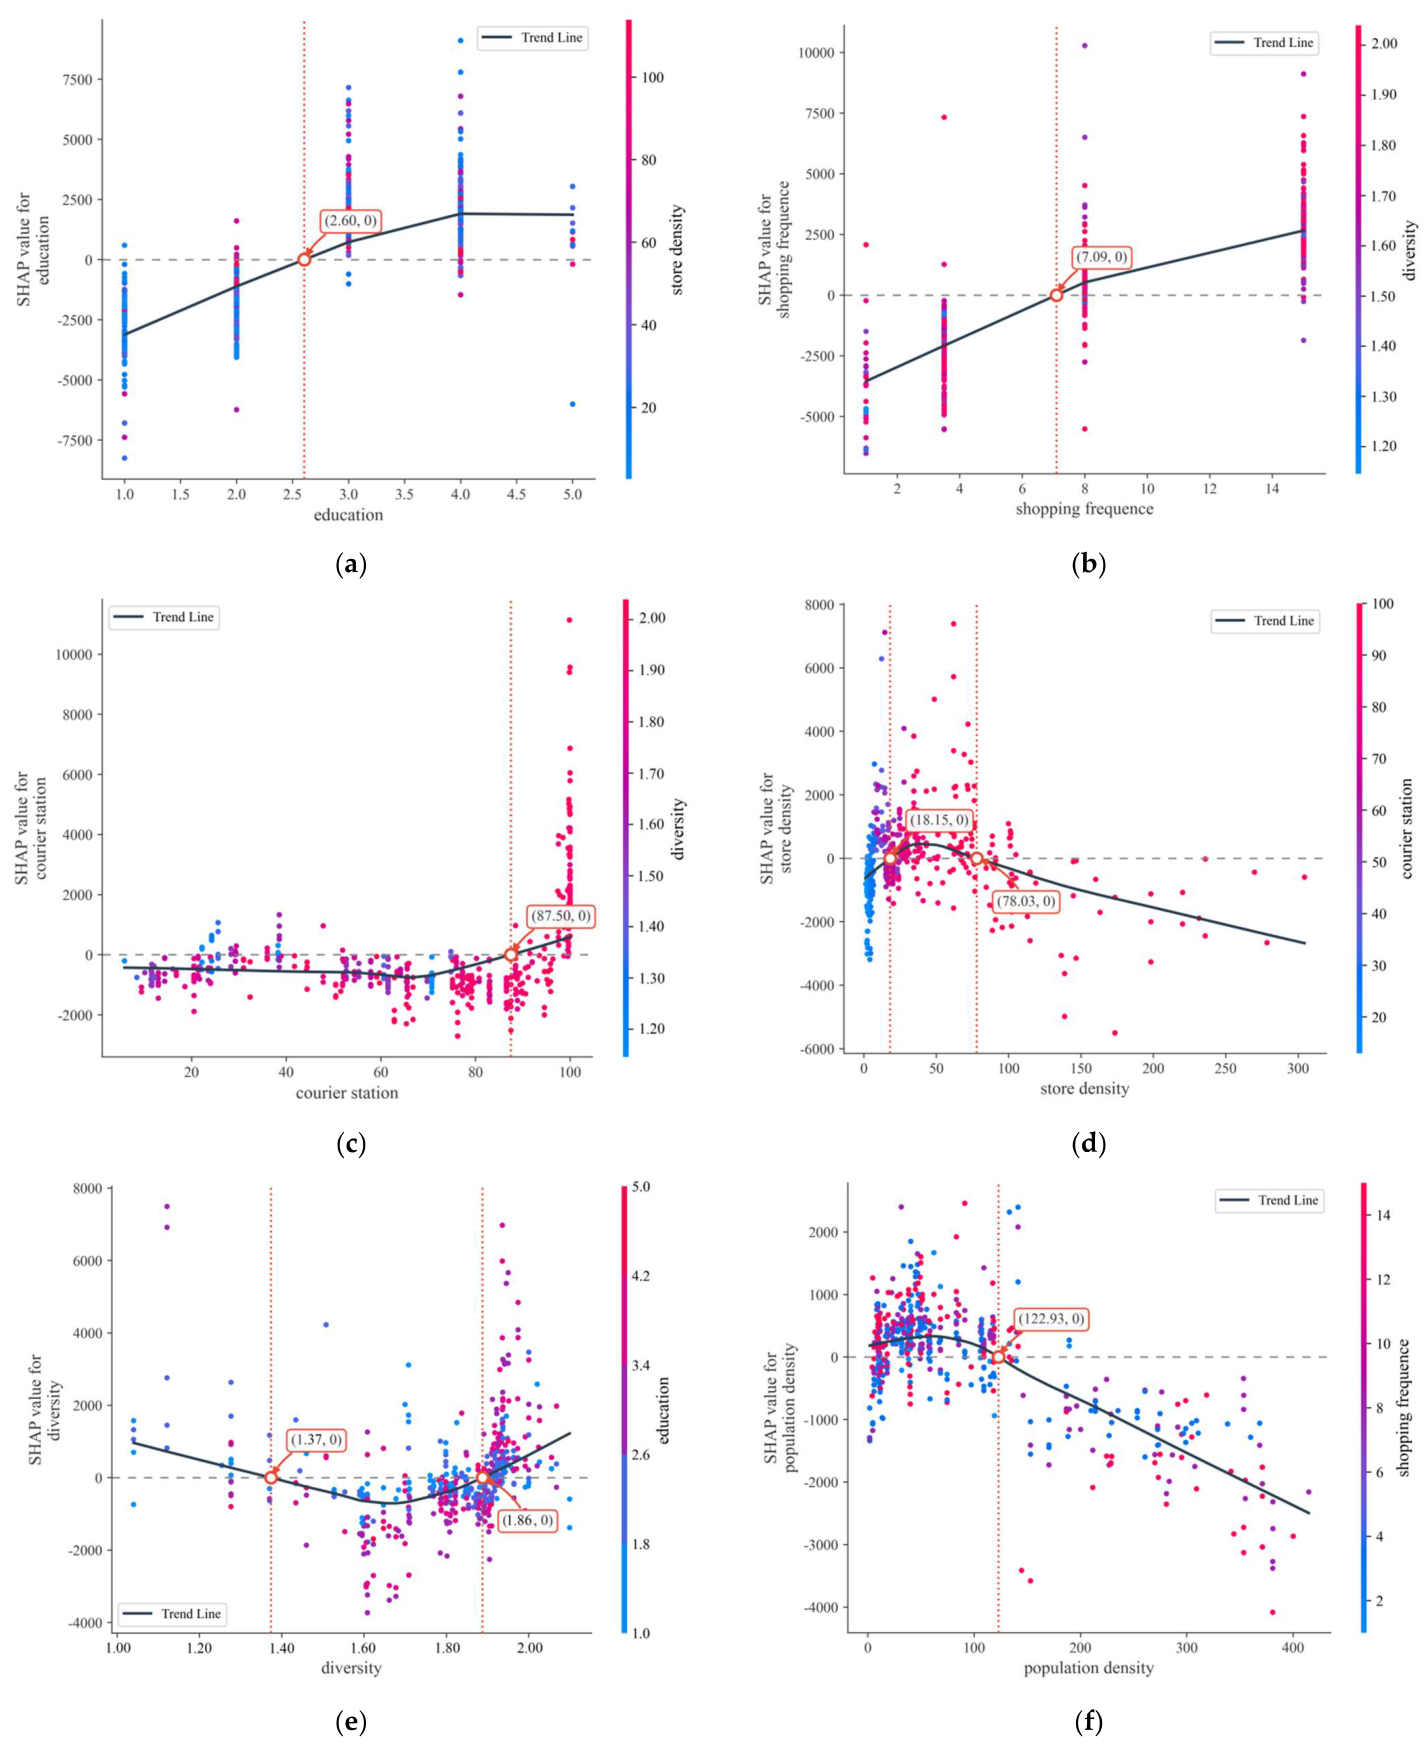
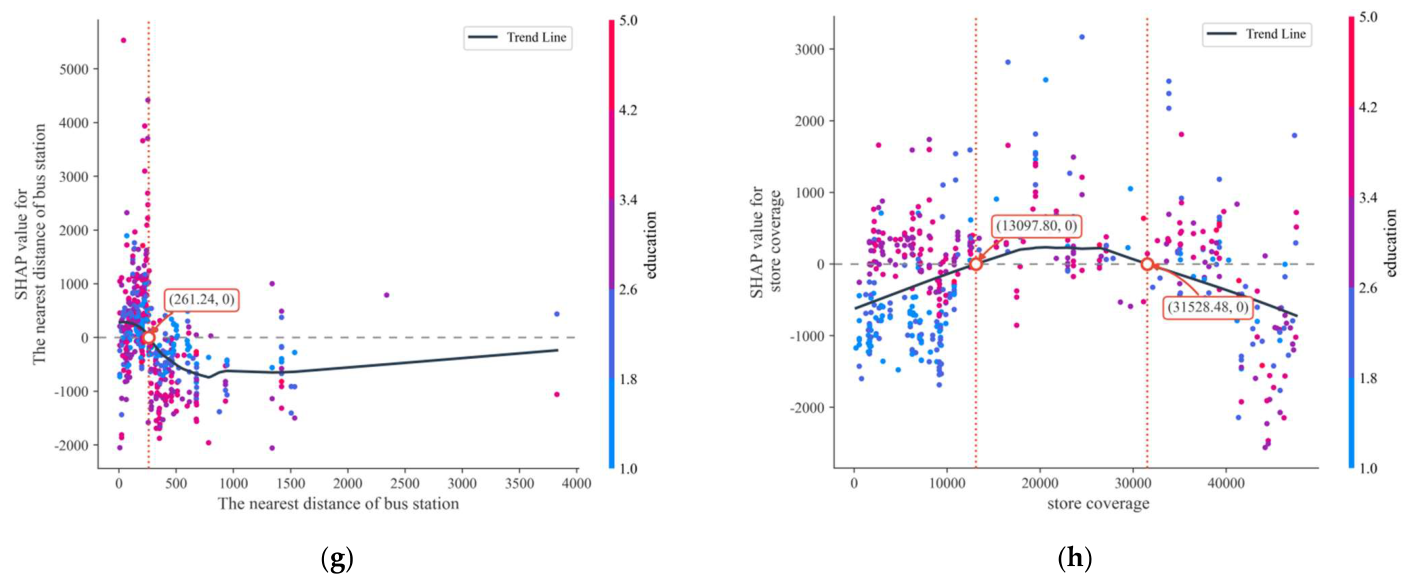
In the commercial built environment, various elements generally exhibit nonlinear relationships with online shopping behavior (Figure 5). The relationship between store density and online shopping spending follows an “inverted U-shaped” pattern. At moderate levels, store density is positively associated with online consumption, demonstrating a complementary pattern (SHAP values > 0). However, beyond a certain threshold, a highly developed offline commercial environment provides sufficient convenience to substitute for online shopping, thereby exhibiting a negative association. Similarly, store coverage also displays an “inverted U-shaped” trend, where moderate coverage correlates with higher online shopping levels, while excessive coverage shifts to a negative association.
Figure 5.
Local effects of features on online shopping spending. (a) education. (b) shopping frequency. (c) courier station. (d) store density. (e) diversity. (f) population density. (g) nearest bus station. (h) store coverage.
Conversely, store diversity shows a “U-shaped” association. It is negatively associated with online shopping at lower levels of diversity, but rapidly shifts to a positive correlation once it crosses the zero point. Interaction feature analysis reveals that areas with high store diversity often attract more highly educated individuals, whose robust overall consumption power subsequently drives higher online shopping expenditures.
Regarding other built environment factors, delivery station coverage must reach a relatively high level to demonstrate a significant positive association. Once the coverage exceeds 87.5%, its positive correlation increases sharply. Population density primarily shows a negative association. Furthermore, closer residential proximity to bus stops is positively associated with online shopping spending, but beyond a specific distance threshold, this shifts to a stable negative association.
4. Sub-District Typologies Affecting Residents’ Shopping Decisions and Their Underlying Mechanisms
4.1. Classification of Sub-Districts Influencing Residents’ Shopping Decisions
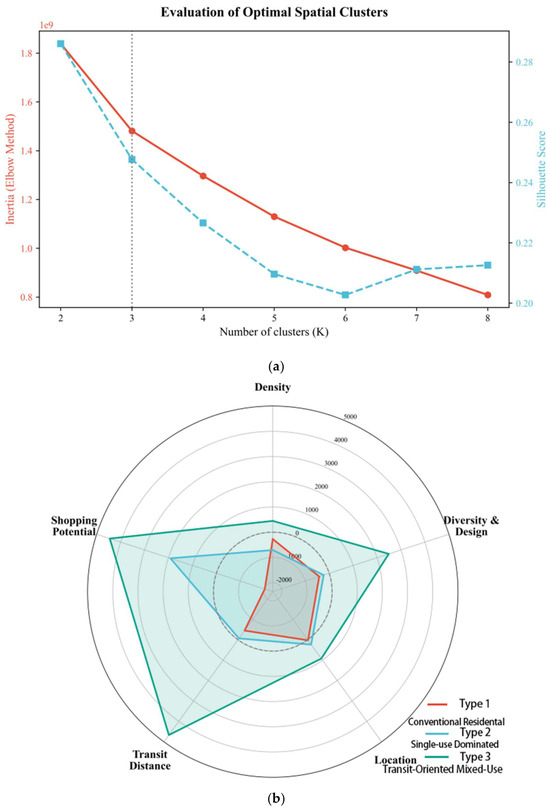
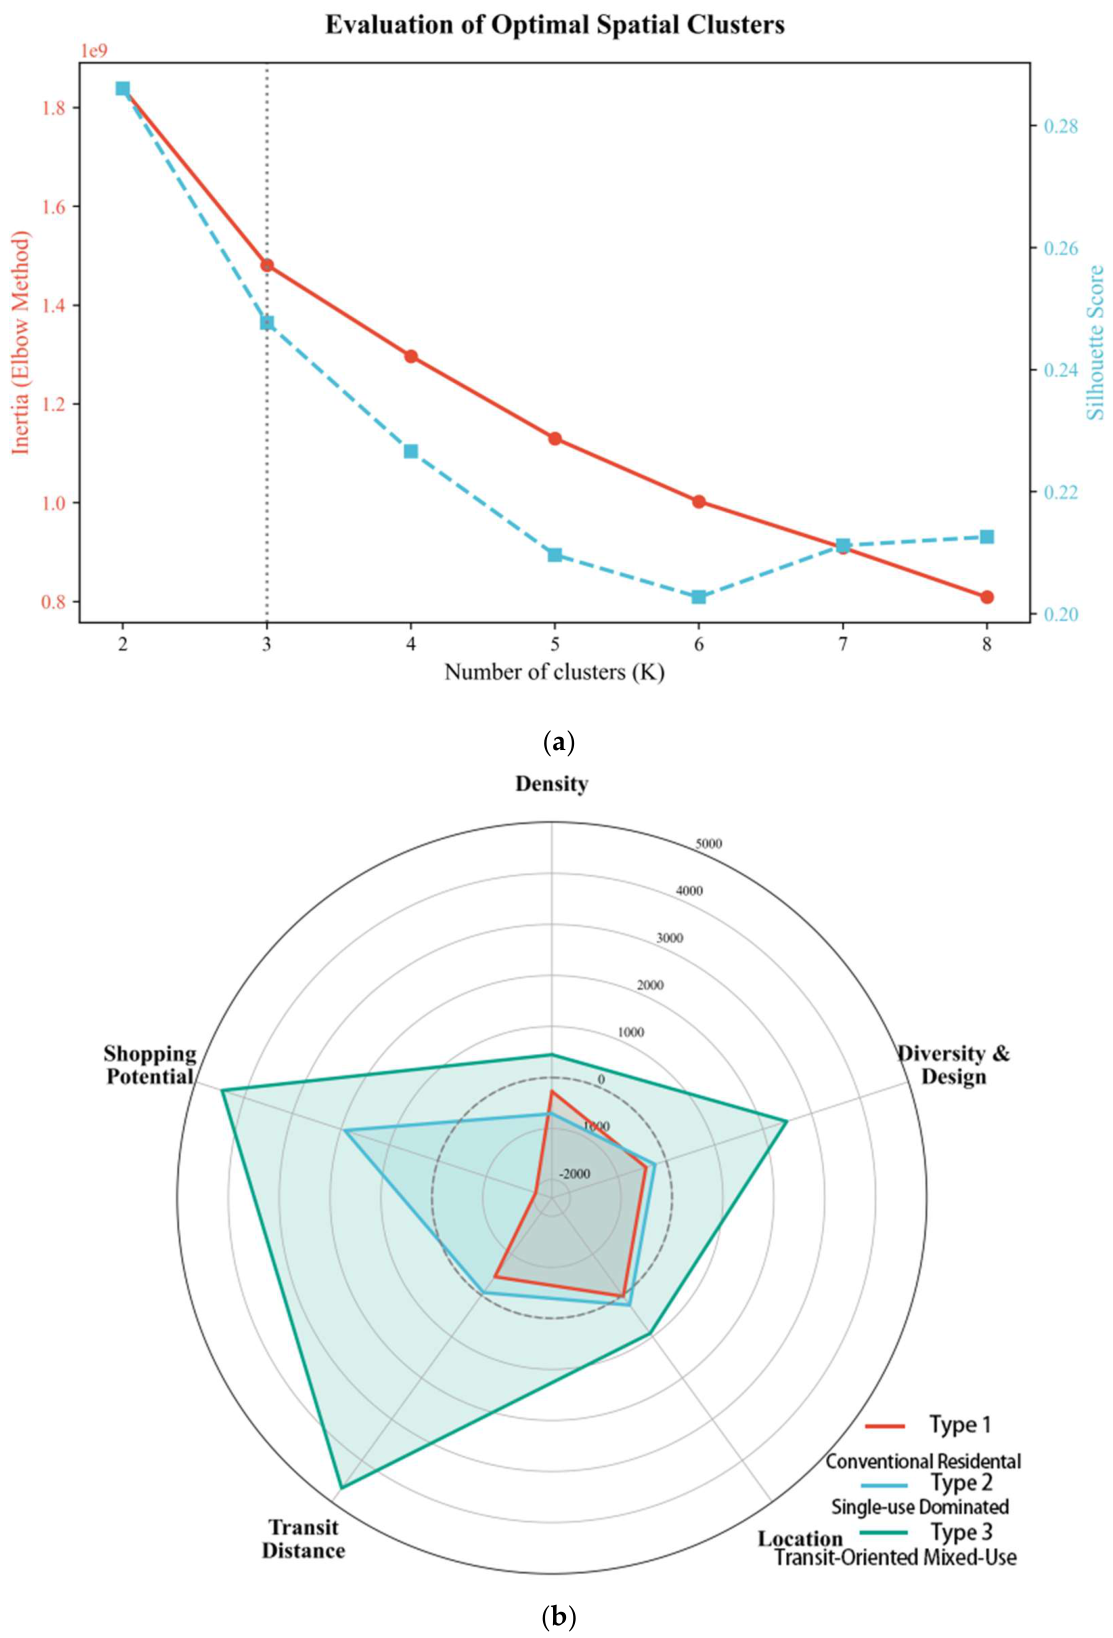
To reveal the spatial heterogeneity regarding the impact of the multi-dimensional built environment on residents’ online shopping decisions, this study introduces the K-means clustering algorithm to classify micro-scale sub-district spaces. Multi-dimensional feature indicators, including transportation accessibility, spatial location, development density, functional diversity, and consumption potential, are utilized as model inputs. To determine the optimal number of clusters, this study comprehensively employs the Elbow Method and the Silhouette Coefficient for objective evaluation. At K = 3, an inflection point emerges in the trend of the sum of squared errors (SSE), and the silhouette coefficient reaches a local optimum. This indicates that under this classification, the spatial samples exhibit the highest intra-cluster cohesion and inter-cluster separation. Based on these findings, this study scientifically categorizes the intricate micro-scale sub-district spaces into three typical zones (Table 3).
Table 3.
Mean Values of Built Environment Variables Across the Three Sub-District Types.
As shown in the radar chart and clustering statistics in Figure 6b, the three sub-district typologies differ in spatial location, transportation networks, development intensity, and consumption potential. Their core characteristics can be summarized into three urban spatial morphologies.
Figure 6.
Clustering evaluation and feature radar chart of sub-district spaces. (a) The evaluation of Optimal Clusters. (b) Radar chart of three sub-district space types.
Type 1: Traditional residential sub-districts: These are generally located in peripheral urban areas with lower transportation accessibility and fewer commercial facilities. They have the longest average distances to municipal commercial centers (over 9700 m) and transit nodes. They also show the lowest development density and functional mix (diversity index of 1.27) among the three categories. With limited delivery station coverage (approximately 61%) and a demographic showing lower average income and shopping frequency (5.84), these areas generally present lower commercial maturity and consumption activity.
Type 2: Single-function dominant sub-districts: This category, primarily comprising suburban residential areas or industrial parks, shows moderate built-environment indicators. While their distance to commercial centers is intermediate (averaging 6865 m) and local retail formats are relatively homogeneous (diversity index of 1.58), these areas contain a higher proportion of educated residents with higher average incomes (around 7868). This indicates a potential gap between local offline retail capacity and residents’ consumption demands, which may explain their high online shopping frequency (10.31).
Type 3: Mixed-function sub-districts: Mostly located around urban centers or major transportation hubs, these sub-districts represent more accessible and mature commercial environments. They show the highest values in development intensity, transit accessibility, and functional diversity (index of 2.03). Furthermore, these areas have high delivery station coverage (99%) and attract a higher-income demographic (averaging 8355) with the highest shopping frequency (10.77). The combination of comprehensive physical retail and developed logistics networks reflects a highly active consumption space.
4.2. Spatial Distribution of Traditional Residential Sub-Districts
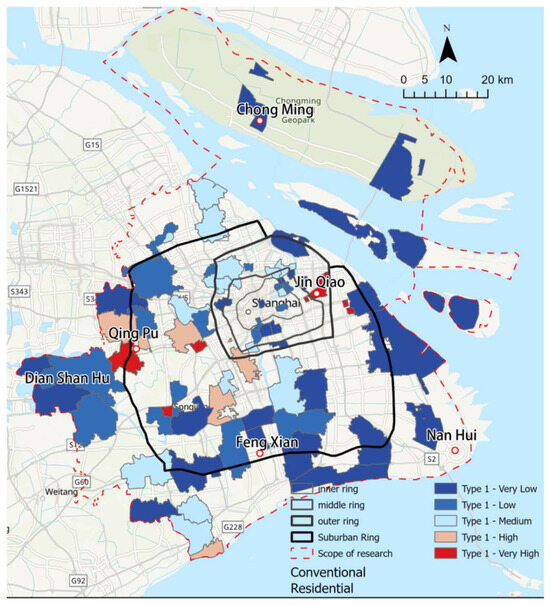
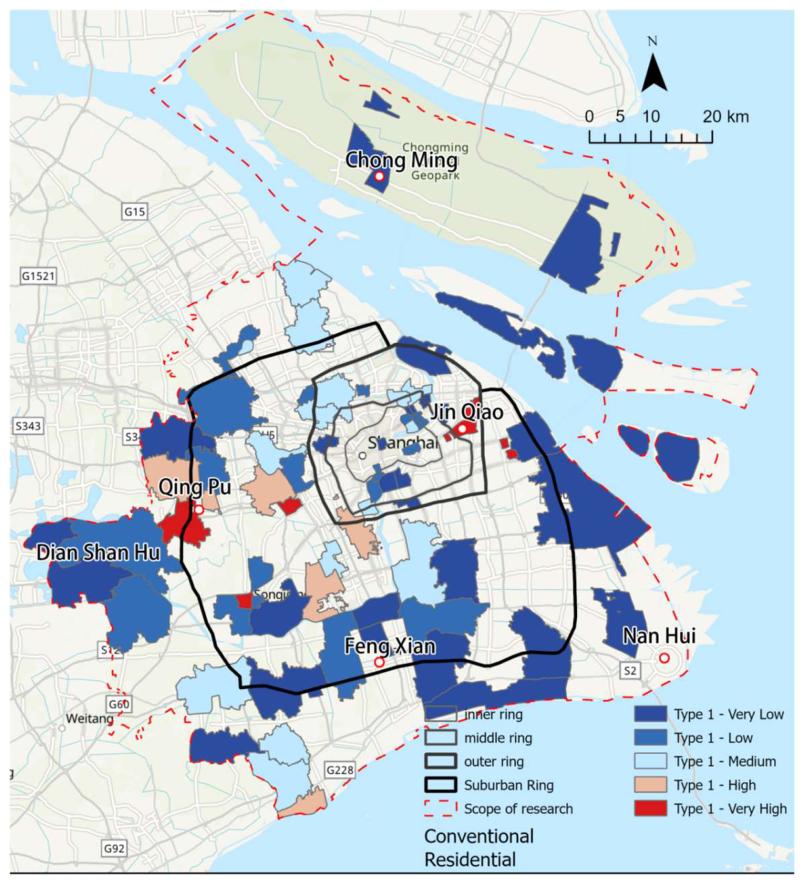
Regarding spatial distribution, Type 1 (traditional residential sub-districts) generally forms clusters of low online shopping activity across different urban zones. This typology is primarily found in large continuous areas beyond the Outer Ring Road, such as Chongming Island, southern Fengxian, the Dianshan Lake area, and peripheral Pudong. Consistent with their built environment, the long distances to commercial centers and limited logistics coverage restrict e-commerce accessibility. Combined with lower average incomes, these constraints lead to reduced online shopping frequency and expenditure, making these areas e-commerce cold spots.
This type also appears in smaller clusters within core urban areas inside the Middle Ring Road, including the Huangpu, Jing’an, and Xuhui districts (Figure 7). These clusters mainly correspond to older residential neighborhoods. Although their internal commercial diversity is low, their close proximity to major municipal commercial districts provides convenient access to physical stores. This mature offline retail environment likely creates a substitution effect, reducing residents’ reliance on e-commerce. Consequently, despite their central locations, these inner-city neighborhoods exhibit low online shopping activity similar to the suburban areas.
Figure 7.
Spatial Distribution of Online Shopping Spending in Traditional Residential Sub-Districts.
There are a few exceptions with high online shopping activity within this typology, mainly located in developing zones like Qingpu New City and Pudong Jinqiao. These variations may result from recent demographic changes, such as the influx of younger, higher-income populations related to new industrial parks, or they might be statistical outliers. Overall, the primary pattern for Type 1 remains one of low online shopping activity shaped by built environment constraints.
4.3. Spatial Distribution of Single-Function Dominant Sub-Districts
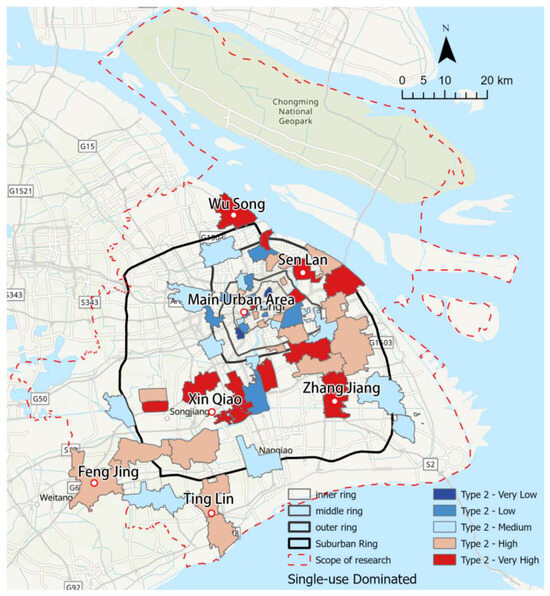
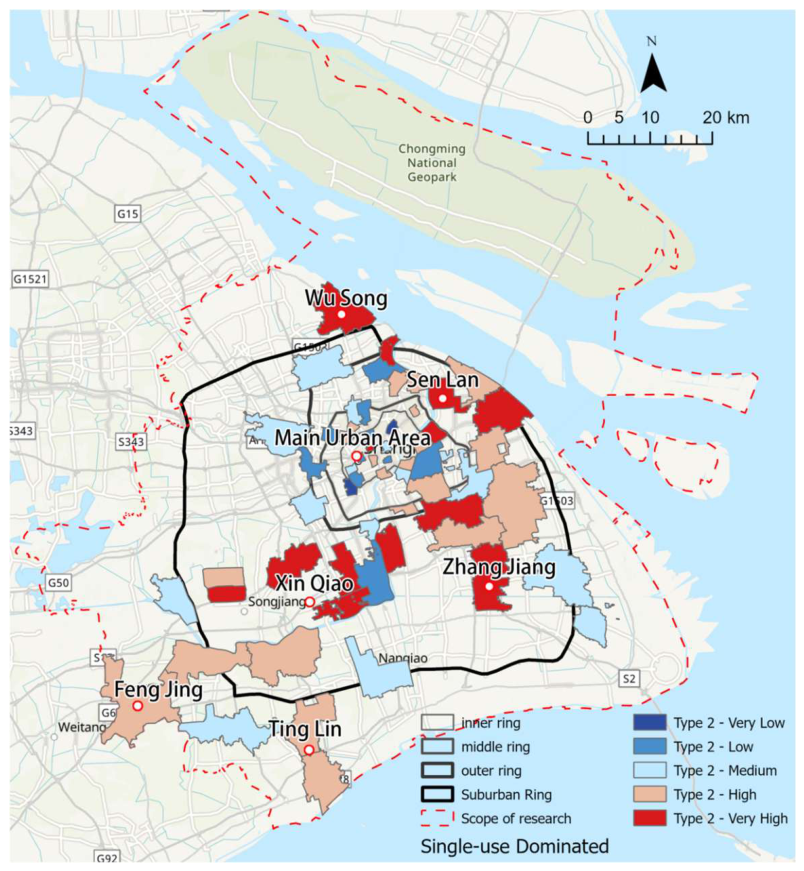
Spatially, Type 2 (single-function dominant sub-districts) shows distinct high and low online shopping patterns (Figure 8).
Figure 8.
Spatial Distribution of Online Shopping Spending in Single-Function Dominant Sub-Districts.
The high-value areas are mainly located between the Middle and Suburban Ring Roads, including suburban industrial hubs and residential communities such as Zhangjiang, Senlan, Xinqiao, and Wusong. Residents in these areas have relatively high purchasing power but limited local retail diversity. In this context, online shopping plays a complementary role. It meets the diverse consumer demands that local physical stores cannot fulfill, resulting in high online shopping activity in these suburban zones.
Conversely, the low-value areas within this typology are concentrated in core urban districts inside the Inner and Middle Ring Roads. Although these locations have limited internal retail diversity, their close proximity to major commercial centers (such as Huaihai Road and Xujiahui) provides convenient access to diverse physical stores. This high accessibility to mature offline markets likely creates a substitution effect on e-commerce. Therefore, despite having similar consumption potential, residents in these inner-city locations rely more on physical retail, leading to lower online shopping activity.
4.4. Spatial Distribution of Mixed-Function Sub-Districts
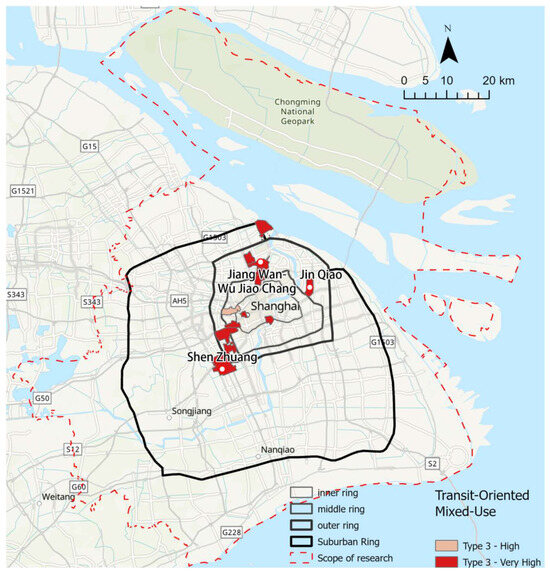
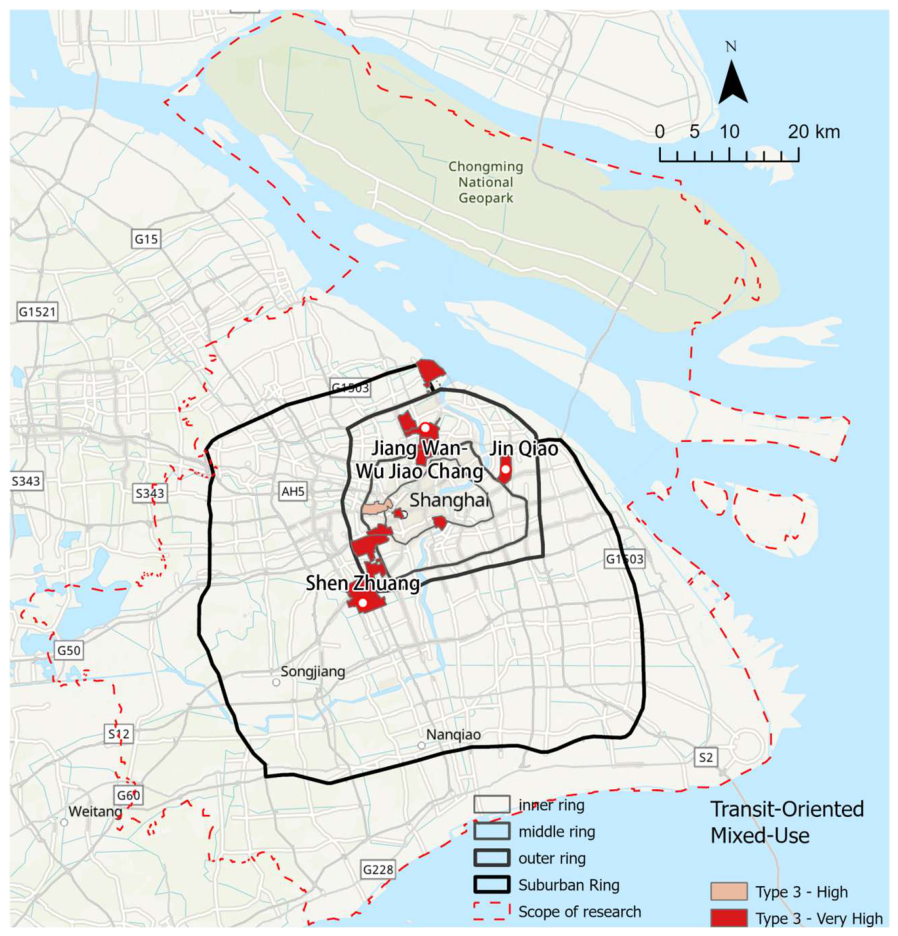
Spatially, Type 3 (mixed-function sub-districts) is characterized by distinct clusters of high online shopping expenditure, with very few low-value areas observed (Figure 9). These high-value clusters are primarily located around urban sub-centers and major transit hubs between the Middle and Outer Ring Roads, including areas such as Jiangwan-Wujiaochang, Jinqiao, and Shenzhuang.
Figure 9.
Spatial Distribution of Online Shopping Spending in Mixed-Function Sub-districts.
The high online shopping activity in these sub-districts illustrates a complementary effect between online and offline channels. As previously described, these areas attract higher-income residents and feature mature, mixed commercial environments. Despite the density of local physical retail, it may not fully meet the diverse and specialized demands of consumers with strong purchasing power. Consequently, e-commerce serves as an effective complement to offline stores by fulfilling these specific needs. Furthermore, the extensive coverage of last-mile delivery infrastructure in these sub-districts provides the necessary logistical support for high volumes of online consumption.
5. Conclusions and Recommendations
5.1. Conclusions
Using Shanghai as a case study, this research integrates machine learning and spatial clustering to explore the non-linear associations and spatial heterogeneity of the built environment in shaping residents’ e-shopping behavior.
(1) E-shopping in the metropolis deviates from the traditional core-to-periphery distance-decay pattern of physical commerce. Demographically, e-shopping expenditure shows a “long-tail” distribution, where a small group of consumers accounts for most of the spending. Spatially, high-activity areas are concentrated in the expanding zones between the Middle and Suburban Ring Roads, while core urban areas inside the Inner Ring Road and exurban areas beyond the Suburban Ring Road show lower online shopping activity.
(2) This spatial pattern is linked to the non-linear effects and threshold behaviors of built environment factors. Local shopping potential and public transit accessibility are primary factors associated with e-shopping decisions. Additionally, offline commercial indicators, such as store density and delivery facility coverage, display specific threshold effects. Within a certain density range, physical amenities show a negative association with e-shopping (suggesting a substitution effect); once this threshold is crossed, the association becomes positive (suggesting a complementary effect) to help meet diverse consumer needs.
(3) Sub-district e-shopping behavior can be classified into three spatial typologies. First, traditional residential sub-districts show overall low online shopping activity. In exurban areas, this is likely linked to limited logistics and lower purchasing power, whereas in older inner-city areas, it appears driven by the substitution effect of dense physical retail networks. Second, single-function sub-districts display a spatial divergence. In suburban residential and industrial areas, limited local retail diversity and strong purchasing power shift consumption online. In contrast, similar locations in core urban areas show lower values, likely due to substitution from nearby major commercial centers. Third, mixed-use sub-districts form high-activity clusters around urban sub-centers and transit hubs. These areas possess developed last-mile logistics and mature commercial facilities, allowing e-commerce to complement offline retail in fulfilling the specialized demands of higher-income residents.
5.2. Recommendations
While based on the Shanghai context, these findings offer broader implications for retail planning in megacities transitioning to omnichannel environments. Rather than applying uniform policies, urban planning should adopt differentiated strategies based on local built environments:
(1) Traditional residential sub-districts: Address the spatial digital divide. These areas, mainly located in exurbs and older inner-city neighborhoods, typically have fewer basic amenities and lower online shopping activity. This reflects a broader “digital divide” common in older or lower-income communities. To promote spatial equity, planners should prioritize public investment in last-mile logistics infrastructure to reduce residents’ pickup costs. Additionally, coordinating with broader economic policies to improve local employment and income is necessary to boost the foundational consumption potential of these areas.
(2) Single-function dominant sub-districts: Improve local retail and formalize logistics spaces. Suburban residential areas (often acting as “bedroom communities”) possess strong purchasing power, but their limited local retail drives demand heavily toward online channels. To address this imbalance, planners can apply the “15 - min city” concept. Encouraging diverse ground-floor retail can improve local commercial self-sufficiency. Furthermore, to support high e-commerce demand, delivery stations and pickup lockers should be formally integrated into neighborhood planning to prevent them from encroaching on public spaces.
(3) Mixed-use sub-districts: Promote omnichannel retail and transit-oriented development (TOD). Located near urban sub-centers and transit hubs, these areas have developed infrastructure that supports online–offline retail complementarity. In these high-density nodes, further vertical integration of commercial, office, and residential spaces should be encouraged. Planners can guide physical stores toward a model combining offline experiences with online ordering and delivery, fostering adaptable commercial spaces for the digital era.
Evaluating the effectiveness of these interventions requires tailored metrics for each sub-district type. In traditional residential areas, improvements can be tracked using the per capita density of last-mile logistics facilities alongside local ncome trends. Single-function areas can be assessed using retail diversity indices (such as the Shannon Diversity Index) for ground-floor commerce and the coverage of formal delivery stations. For mixed-use areas, the adoption rate of omnichannel models among local retailers can serve as a key indicator. Together, these metrics offer a practical framework for evidence-based spatial planning.
5.3. Limitations
This study has several limitations. First, the moderate predictive power of the XGBoost model (R2 = 0.513) indicates that spatial variables cannot entirely explain e-shopping behavior, largely because individual shopping decisions are highly unpredictable. Unobserved non-spatial factors, such as personal preferences and platform promotions, likely account for the remaining variance. Unobserved non-spatial factors, such as personal preferences and platform promotions, likely account for the remaining variance. Second, the sample size (n = 551) limits the feasibility of fine-grained spatial analyses within specific neighborhoods. The dataset may also underrepresent digitally marginalized groups, such as the elderly. Third, relying on cross-sectional data restricts the ability to capture temporal dynamics. Future research using longitudinal data is needed to verify whether the identified built-environment thresholds remain stable over time. Finally, the findings are subject to the Modifiable Areal Unit Problem (MAUP) and geographic context. The specific thresholds observed at the sub-district level in Shanghai may differ at other spatial scales or in other cities, although the analytical approach can be adapted for broader applications.
Author Contributions
Conceptualization, C.Z. and R.Y.; methodology, R.Y.; software, R.Y. and Y.Z.; validation, R.Y., Y.Z. and D.W.; formal analysis, R.Y. and D.W.; investigation, R.Y.; resources, C.Z.; data curation, Y.Z.; writing—original draft preparation, R.Y.; writing—review and editing, C.Z., Y.Z. and D.W.; visualization, D.W.; supervision, C.Z.; project administration, C.Z.; funding acquisition, C.Z. All authors have read and agreed to the published version of the manuscript.
Funding
This research was funded by the National Natural Science Foundation of China, grant number 52378078. The APC was funded by the National Natural Science Foundation of China.
Data Availability Statement
The data presented in this study are available on request from the corresponding author. The resident survey data are not publicly available due to privacy restrictions and third-party confidentiality agreements associated with the “Online Shopping Consumption Habits of E-shoppers” survey conducted by the National Bureau of Statistics, as well as licensing restrictions on the multi-source urban spatial data.
Acknowledgments
The authors have reviewed and edited the output and take full responsibility for the content of this publication.
Conflicts of Interest
Author Yangfan Zhang was employed by the Shanghai Tongji Urban Planning and Design Institute Co., Ltd. The remaining authors declare that the research was conducted in the absence of any commercial or financial relationships that could be construed as a potential conflict of interest.
References
- Beckers, J.; Cárdenas, I.; Verhetsel, A. Identifying the geography of online shopping adoption in Belgium. J. Retail. Consum. Serv. 2018, 45, 33–41. [Google Scholar] [CrossRef] [Scilit]
- Cai, Y.J.; Lo, C.K. Omni-channel management in the new retailing era: A systematic review and future research agenda. Int. J. Prod. Econ. 2020, 229, 107729. [Google Scholar] [CrossRef] [Scilit]
- Cao, X.; Chen, Q.; Choo, S. Geographic distribution of e-shopping: Application of structural equation models in the Twin Cities of Minnesota. Transp. Res. Rec. 2013, 2383, 18–26. [Google Scholar] [CrossRef] [Scilit]
- Cervero, R.; Kockelman, K. Travel demand and the 3Ds: Density, diversity, and design. Transp. Res. Part D Transp. Environ. 1997, 2, 199–219. [Google Scholar] [CrossRef] [Scilit]
- Zhai, Q.; Cao, X.; Mokhtarian, P.L.; Zhen, F. The interactions between e-shopping and store shopping in the shopping process for search goods and experience goods. Transportation 2017, 44, 885–904. [Google Scholar] [CrossRef] [Scilit]
- Dolega, L.; Rowe, F.; Branicki, E. Going digital? The impact of social media and e-commerce on retail resilience. J. Retail. Consum. Serv. 2021, 60, 102533. [Google Scholar] [CrossRef] [Scilit]
- Ewing, R.; Cervero, R. Travel and the built environment: A meta-analysis. J. Am. Plan. Assoc. 2010, 76, 265–294. [Google Scholar] [CrossRef] [Scilit]
- Farag, S.; Weltevreden, J.W.J.; van Rietbergen, T.; Dijst, M.; van Oort, F. E-shopping in the Netherlands: Does geography matter? Environ. Plan. B Plan. Des. 2006, 33, 59–74. [Google Scholar] [CrossRef] [Scilit]
- Winslott Hiselius, L.; Smidfelt Rosqvist, L.; Adell, E. Travel behaviour of online shoppers in Sweden. Transp. Telecommun. 2015, 16, 21–30. [Google Scholar] [CrossRef] [Scilit]
- Xi, G.; Zhen, F.; Cao, X.; Xu, F. The interaction between e-shopping and store shopping: Empirical evidence from Nanjing, China. Transp. Lett. 2020, 12, 157–165. [Google Scholar] [CrossRef] [Scilit]
- Lee, R.J.; Sener, I.N.; Mokhtarian, P.L.; Handy, S.L. Relationships between the online and in-store shopping frequency of Davis, California residents. Transp. Res. Part A Policy Pract. 2017, 100, 40–52. [Google Scholar] [CrossRef] [Scilit]
- Liu, W.; Yang, Z.; Gui, C.; Li, G.; Xu, H. Investigating the nonlinear relationship between the built environment and urban vitality based on multi-source data and interpretable machine learning. Buildings 2025, 15, 1414. [Google Scholar] [CrossRef] [Scilit]
- Harun, I.; Yigitcanlar, T. Urban Land Use and Value in the Digital Economy: A Scoping Review of Disrupted Activities, Behaviours, and Mobility. Land 2025, 14, 1647. [Google Scholar] [CrossRef] [Scilit]
- Farag, S.; Schwanen, T.; Dijst, M.; Faber, J. Shopping online and/or in-store? A structural equation model of the relationships between e-shopping and in-store shopping. J. Transp. Geogr. 2007, 15, 125–141. [Google Scholar] [CrossRef] [Scilit]
- Weltevreden, J.W. Substitution or complementarity? How the Internet changes city centre shopping. J. Retail. Consum. Serv. 2007, 14, 192–207. [Google Scholar] [CrossRef] [Scilit]
- Beck, N.; Rygl, D. Categorization of multiple channel retailing in Multi-, Cross-, and Omni-Channel Retailing for retailers and retailing. J. Retail. Consum. Serv. 2015, 27, 170–178. [Google Scholar] [CrossRef] [Scilit]
- Singleton, A.D.; Dolega, L.; Riddlesden, D.; Longley, P.A. Measuring the spatial vulnerability of retail centres to online consumption through a framework of e-resilience. Geoforum 2016, 69, 5–18. [Google Scholar] [CrossRef] [Scilit]
- Shi, K.; Shao, R.; De Vos, J.; Witlox, F. Do e-shopping attitudes mediate the effect of the built environment on online shopping frequency of e-shoppers? Int. J. Sustain. Transp. 2023, 17, 41–51. [Google Scholar] [CrossRef] [Scilit]
- Huang, Y.; Chen, B.; Webster, C. Does e-shopping weaken the link between land use and neighborhood shopping behavior? Evidence from large-scale mobile phone data. Appl. Geogr. 2025, 186, 103809. [Google Scholar] [CrossRef] [Scilit]
- Zhang, E.; Zhou, Y.; Chen, G.; Wang, G. Classified Spatial Clustering and Influencing Factors of New Retail Stores: A Case Study of Freshippo in Shanghai. Sustainability 2024, 16, 6643. [Google Scholar] [CrossRef] [Scilit]
- Shao, Q.; Zhang, W.; Cao, X.; Yang, J. Threshold and moderating effects of land use on metro ridership in Shenzhen: Using gradient boosting decision trees. J. Transp. Geogr. 2020, 89, 102878. [Google Scholar] [CrossRef] [Scilit]
- Stevens, M.R. Does compact development make people drive less? J. Am. Plan. Assoc. 2017, 83, 7–18. [Google Scholar] [CrossRef] [Scilit]
- Dominici, A.; Boncinelli, F.; Gerini, F.; Marone, E. Determinants of online food purchasing: The impact of socio-demographic and situational factors. J. Retail. Consum. Serv. 2021, 60, 102473. [Google Scholar] [CrossRef] [Scilit]
- Loo, B.P.Y.; Wang, B. Factors associated with home-based e-working and e-shopping in Nanjing, China. Transportation 2018, 45, 365–384. [Google Scholar] [CrossRef] [Scilit]
- Le, H.T.K.; Carrel, A.L.; Shah, H. Impacts of online shopping on travel demand: A systematic review. Transp. Rev. 2022, 42, 273–295. [Google Scholar] [CrossRef] [Scilit]
- Xi, G.; Cao, X.; Zhen, F. The impacts of same day delivery online shopping on local store shopping in Nanjing, China. Transp. Res. Part A Policy Pract. 2020, 136, 35–47. [Google Scholar] [CrossRef] [Scilit]
- Zhen, F.; Du, X.; Cao, J.; Mokhtarian, P.L. The association between spatial attributes and e-shopping in the shopping process for search goods and experience goods: Evidence from Nanjing. J. Transp. Geogr. 2018, 66, 291–299. [Google Scholar] [CrossRef] [Scilit]

Disclaimer/Publisher’s Note: The statements, opinions and data contained in all publications are solely those of the individual author(s) and contributor(s) and not of MDPI and/or the editor(s). MDPI and/or the editor(s) disclaim responsibility for any injury to people or property resulting from any ideas, methods, instructions or products referred to in the content. |
© 2026 by the authors. Licensee MDPI, Basel, Switzerland. This article is an open access article distributed under the terms and conditions of the Creative Commons Attribution (CC BY) license.