


Abstract
Agricultural management influences progress towards carbon neutrality through its effects on water consumption, energy use, and greenhouse gas (GHG) emissions. However, few studies have translated policies across sectors into management scenarios and evaluated their combined consequences for the agricultural carbon neutrality. We quantified the water, energy use, and carbon nexus for wheat, rice, and corn production across the North China Plain using 2018 as a baseline scenario. We then evaluated conditional management scenarios informed by China’s 14th Five-Year Plan. The three crop production generated net emissions of 1.8 × 10¹⁰ kg C yr−1 in 2018, while cropland net ecosystem productivity offset 16.9% of GHG emissions related to crop production. Energy use was positively correlated with GHG emissions (r = 0.74, p < 0.01). The integrated scenario combining a 30% reduction in nitrogen fertilizer, more efficient nitrogen fertilizer production, sprinkler irrigation, and a 50% crop straw return rate reduced the water footprint, energy use, and GHG emissions by 4.9%, 27.6%, and 39.2%, respectively. By contrast, drip irrigation alone reduced the water footprint but increased energy use by 6.8% and GHG emissions by 12.9%. The results show that water saving measures do not necessarily improve the carbon neutrality when their energy requirements are overlooked. These findings also provide more enlightenment for local policy-makers.
1. Introduction
Agriculture must meet rising food demand while reducing pressure on land, water, energy, and the climate system [1,2,3]. China’s carbon neutrality commitment has intensified the need for mitigation pathways across different sectors [4]. In agriculture, water scarcity, energy use, and greenhouse gas (GHG) emissions create interconnected socioecological challenges [5,6]. Therefore, evaluating these links within a common accounting boundary is essential to avoid policies that shift burdens among sectors.
The agricultural contribution to carbon neutrality depends on both carbon emissions and carbon uptake. Irrigation method, water source, and pumping depth determine irrigation energy demand [7,8,9]. Fertilizer and pesticide manufacture generates CO2 emissions, while fertilizer application and rice production generate N2O and CH4, respectively [10,11,12,13]. Crop straw can substitute for part of the mineral nutrient input [14]. Previous assessments often focused on a single practice or partial GHG emissions [5,15]. Additionally, straw yields have increased markedly with increasing crop yields, but analysis scenarios for the effects of straw return on carbon neutrality have not been developed yet [14,16]. Therefore, assessing CO2, N2O, CH4, energy inputs, water consumption, and cropland carbon uptake under an integrated framework is of great significance for guiding future agricultural management.
Nexus approaches provide a structured way to evaluate cross-sectoral synergies and trade-offs [17,18,19,20]. Cross-sectoral integration has already generated various fundamental discoveries, but more efforts are needed to convert such discoveries into policies and agricultural practices [21]. China’s 14th Five-Year Plan sets policy directions for fertilizer control, water-saving irrigation, and crop straw utilization, but the policy target does not establish the joint effects of implementing several practices [22]. For example, existing studies mostly evaluated the impacts of single agricultural management practice (e.g., structural adjustment of crops or irrigation upgradation) on carbon emissions, but rarely consider synergies and trade-offs of nexus in cross-sectoral agriculture management practices, which might solve one problem while exacerbating others [5,16]. In particular, current assessments did not explore the relationships among water, energy, and carbon neutrality in large-extend agricultural areas like North China Plain (NCP) [18,19]. Therefore, new analyses of the water–energy–carbon neutrality nexus in agriculture should build on China’s existing policies that influencing agricultural management practices.
Accordingly, we proposed two hypotheses. First, energy use would be positively associated with GHG emissions related to crop production because groundwater pumping and the manufacture of agricultural inputs are energy intensive. Second, the water footprint would not necessarily covary with carbon neutrality potential because the water-saving technology can increase energy demand and associated emissions. We therefore aimed to (1) quantify the water–energy–carbon neutrality nexus and the relationships among its components during crop production in the NCP; (2) evaluate conditional cross-sectoral management scenarios, and identify policy priorities while making the accounting boundary, assumptions, and limitations explicit.
2. Materials and Methods
2.1. Study Area
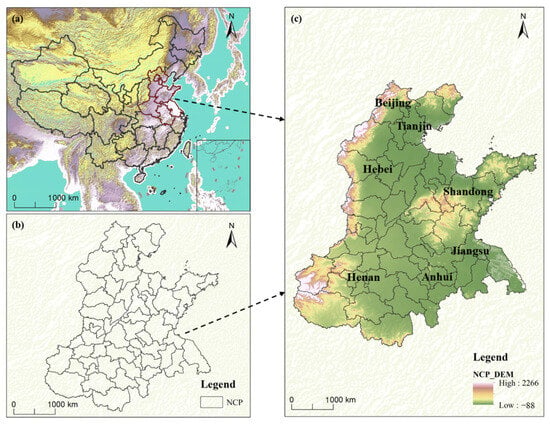
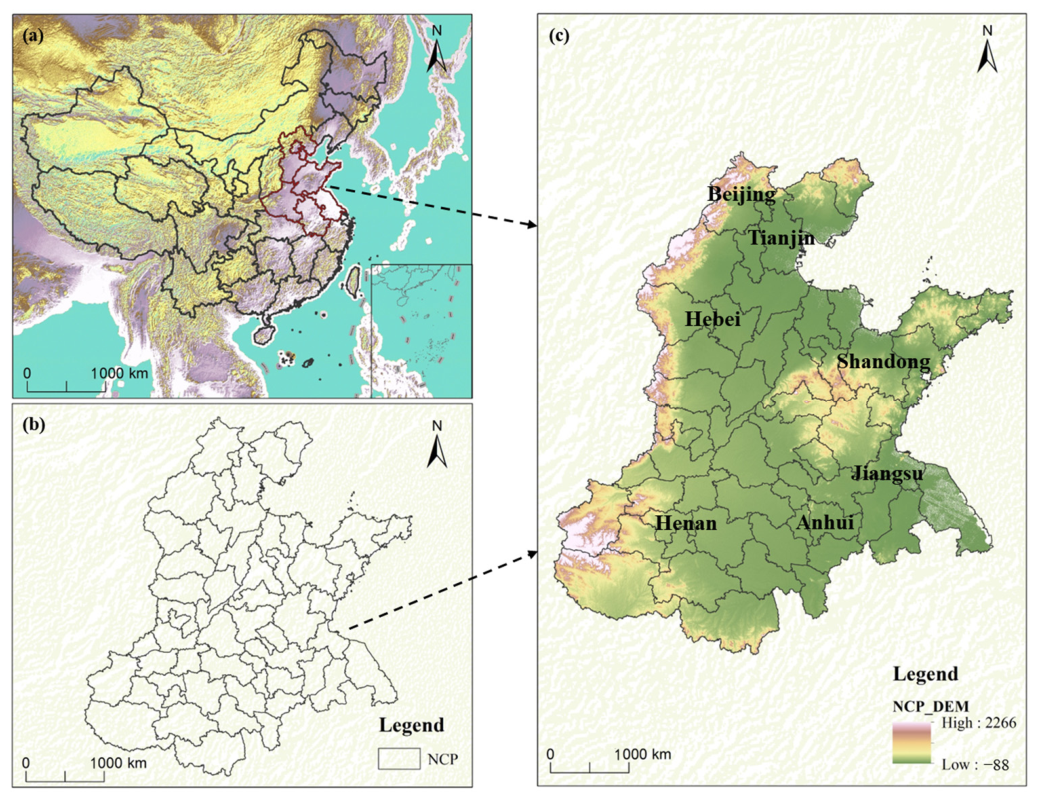
The NCP (defined here as 32–40° N and 114–121° E) is one of China’s largest and most densely populated plains (Figure 1). The region is characterized by temperate and subtropical monsoon climates, while its flat terrain and fertile soils provide favorable conditions for intensive crop production [23]. In 2018, the cropland area in NCP was 3.86 × 10⁷ ha, equivalent to 23.5% of China’s reported cropland area. Wheat, rice, and corn (hereafter, the three crops) account for 97% of the total sown area [24]. Irrigated agriculture has expanded extensively in the NCP, and groundwater pumping is a major contributor to agricultural energy use and associated emissions [7,23]. The NCP is therefore an appropriate system in which to examine trade-offs among water, energy, and GHG emissions, as well as their implications for carbon neutrality in agriculture.
Figure 1.
Geographical location and topographic characteristics of the North China Plain (NCP). (a) Location of the NCP in China with topographic background (red outline indicates the NCP boundary); (b) spatial extent and administrative divisions of the NCP; (c) elevation distribution of the NCP based on the digital elevation model. Black dashed arrows indicate the region enlargement relationships.
2.2. Data Sources
Annual crop yields and agricultural inputs for wheat, rice, and corn were obtained from the relevant 2018 statistical yearbooks [24]. The agricultural inputs included fertilizer application, pesticide use, and diesel consumption for field operations. Precipitation data were obtained from the China Meteorological Data Service Centre. Crop water footprint was assessed over the respective growing seasons of wheat, rice, and corn. Precipitation and evapotranspiration were therefore accumulated within the growing period of each crop. Evapotranspiration was derived from the MODIS Terra eight-day evapotranspiration product, MOD16A2 Version 6, which is based on the Penman Monteith framework [25,26]. The ESA Climate Change Initiative land cover dataset was used to identify cropland pixels [27]. The eight-day evapotranspiration layers were then aggregated over the corresponding growing season of each crop. Net ecosystem productivity (NEP) was obtained from the Global Daily Net Ecosystem Productivity Simulation Product distributed by the National Ecosystem Science Data Center [28]. The product was generated using the Boreal Ecosystem Productivity Simulator and has a daily temporal resolution and a native spatial resolution of 0.072727° × 0.072727°. Daily NEP values for 2018 were summed to derive annual cumulative NEP. An annual time boundary was adopted because ecosystem carbon exchange continues during both crops growing and nongrowing periods. The NEP product had previously been evaluated by its developers using observational and reference datasets [28,29]. The NEP estimates were used primarily to characterize broad spatial patterns and relative differences among regions. Energy use and GHG emissions were calculated over the production cycle of each crop using the annual crop specific activity data and the corresponding energy coefficients and emission factors. Energy conversion coefficients and GHG emission factors were drawn from published studies and recognized databases, including the China Life Cycle Assessment Basic Database, Oak Ridge National Laboratory, and the China Products Carbon Footprint Factors Database (Table 1 and Table 2) [30,31,32].
Table 1.
Energy conversion coefficients (ecs) for crop production.
Table 2.
Emission factors (efs) for crop production.
2.3. Water–Energy–Carbon Neutrality Accounting Framework
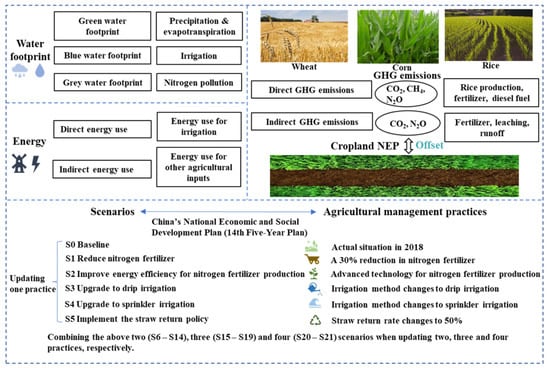
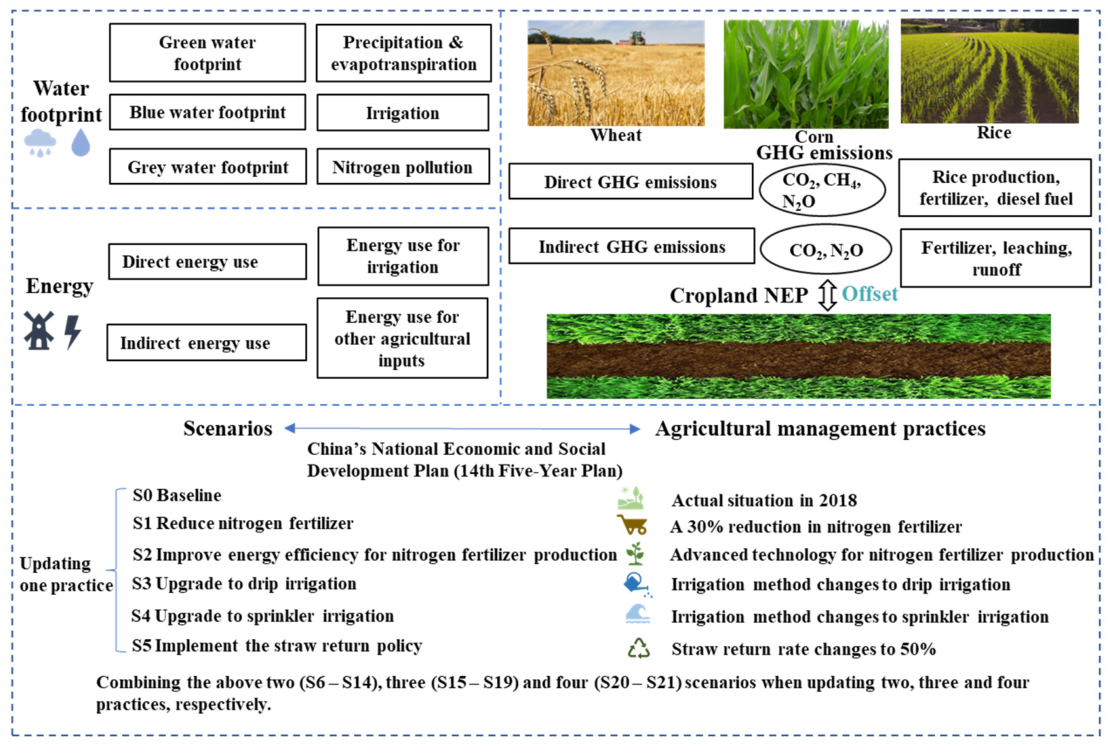
Figure 2 summarizes the accounting framework. The system boundary extends from the upstream production of fertilizers, pesticides, diesel fuel, and polyethylene irrigation pipes through crop production. It includes energy used for groundwater pumping, other direct and indirect energy inputs, and the associated direct and indirect GHG emissions. We also combine NEP with GHG emissions to assess the carbon neutrality potential of crop production in the NCP.
Figure 2.
Accounting framework for the water–energy–carbon neutrality nexus in the NCP.
2.3.1. Water Footprint
The total water footprint is the water consumed during production of the three crops. For each crop, rainfall and evapotranspiration were accumulated over the growing period used in the water balance calculation. Crop water requirement under the specified conditions was represented by crop evapotranspiration (ETc). The green water footprint (WFgreen) represents effective rainfall consumed during crop production, whereas the blue water footprint (WFblue) represents consumed surface water and groundwater supplied through irrigation [36]. We calculated WFgreen and WFblue as follows:
where ETgreen and ETblue were crop evapotranspiration supplied by rainfall and irrigation, respectively; Ai is the sown area of each area (km2); b is the depth to volume conversion coefficient (1000 m3 km−2 mm−1); ETc is crop evapotranspiration (mm); and Pe is effective rainfall (mm). Pe was estimated using the empirical method of the US Department of Agriculture Natural Resources Conservation Service. Ptotal is total rainfall (mm) in Equation (5):
The grey water footprint (WFgrey) is the volume of water required to dilute a pollutant load to the specified water quality threshold. The intensive use of nitrogen fertilizers in the NCP poses a significant pollution risk [36]. We focused on nitrogen to assess the grey water footprint. WFgrey was calculated as:
where αtotal = 0.25 is the assumed total nitrogen leaching fraction; AC is chemical fertilizer application per unit area (kg ha−1); Cmax is the maximum acceptable concentration (g L−1); and Cnat is the natural background concentration (g L−1) [37].
2.3.2. Energy Use
We separated energy use into direct and indirect components. Direct energy comprised diesel used for field operations and electricity used to pump groundwater. Indirect energy comprised the energy embodied in fertilizer and pesticide production and, for drip irrigation, polyethylene pipe. Surface water abstraction energy was assumed to be negligible, and only groundwater pumping energy was calculated [8]. Direct irrigation energy (EUdire) was calculated as [9,38]:
where TWFblue is the blue water footprint of the three crops (m3); irrigation efficiency was set to 0.54 [39]; and the groundwater share (PGW) was set to 0.66 [9]. EUirri is the energy required to lift 1 m3 of water by 1 m [9], and 3.6 MJ kWh−1 converts electricity to energy. Raise is groundwater lift (m), and Eff is pump efficiency (0.4) [7]. Raise levels for each province were shown in Table S1. The indirect energy use (EUindi) was calculated with the energy coefficients in Table 1.
where Ai represents the sown area of three crops; qik is the application rate of energy input k for three crops; eck is energy coefficient; n is the NCP cities, and k represents different energy sources.
2.3.3. GHG Emissions
Total GHG emissions (CO2, N2O, CH4) from crop production were calculated as:
where and are direct and indirect CO2 emissions, respectively; is direct N2O from nitrogen application; is indirect N2O associated with volatilization, atmospheric deposition, leaching, and runoff [40,41]; and is direct CH4 from rice fields. We expressed all GHG as kilograms of CO2 equivalent (kg CO2-eq) using 100 years global warming potentials and converted CO2-equivalent totals to carbon mass only when calculating net emissions.
Direct CO2 emissions arose from electricity used for irrigation. We assumed that groundwater pumps in the NCP were powered by electricity and calculated direct CO2 emissions () as:
where EFelec-carbon (0.95 kg CO2-eq kWh−1) is the electricity emission factor [7].
We calculated indirect emissions associated with diesel, fertilizers, pesticides, and polyethylene pipe using the emission factors in Table 2.
where Ai represents the sown area of three crops; qij is the application rate of agricultural input j for three crops; efj is emission factor of input; n is the NCP cities.
Direct and indirect N2O emissions were calculated as:
where Nferti-i is nitrogen-fertilizer application (kg N ha−1); EFdire-N is the direct emission factor (kg N2O-N kg−1 N); EFad is the emission factor for volatilized NH3-N and NOx-N deposited to soils and water (0.01 kg N2O-N kg−1 N); Fracgasm is the fraction of applied nitrogen that volatilizes as NH3 and NOx (0.10); EFleach is the emission factor for nitrogen lost by leaching or runoff (0.0075 kg N2O-N kg−1 N); and Fracleach is the fraction lost by leaching or runoff. The ratio 44/28 converts N2O-N to N2O. We used a 100-year global warming potential of 265 for N2O [42].
We calculated CH4 emissions from rice as:
where is the rice CH4 emission factor (5231 kg CO2-eq ha−1 yr−1) and Arice is rice sown area (ha) [13].
2.3.4. Carbon Neutrality
The NEP is the difference between the mass of carbon fixed by photosynthesis and that lost by ecosystem respiration. NEP captures the cumulative carbon within the entire ecosystem. The positive NEP values indicate net ecosystem carbon uptake, whereas negative values indicate carbon release. We defined net emissions (NE) to assess the potential of agriculture for achieving carbon neutrality in this study. NE was calculated as:
where NEP (kg C yr−1) represents the carbon sequestration in cropland. The coefficient 12/44 is the conversion factor from CO2 equivalents to carbon content. The lower the net emissions, the greater the carbon neutrality potential. In addition, we estimated nutrient resources of crop straw for scenario analysis (Text S1).
2.3.5. Pearson Correlation Analysis
We assess the relationships among water footprint, energy use, and carbon neutrality nexus by Pearson correlation analysis. The Pearson correlation coefficient () of two variables X and Y is formally defined as the covariance of the two variables divided by the product of their standard deviations (which acts as a normalization factor) and it can be equivalently defined by is calculated as:
where xi and yi are sample observations contained in sample X and sample Y (n = 54). The value of r is in the interval [−1, 1]. Its sign indicates the direction of the linear association, and its absolute value indicates association strength. When r = 1, X and Y are completely positive correlation. When r = −1, X and Y are completely negative correlation. When r = 0, the linear correlation between X and Y is not obvious.
2.4. Scenario Analysis of Agricultural Management Practices
The baseline scenario (S0) was based on crop production in 2018. Scenarios S1 to S21 were hypothetical management scenarios developed to assess the potential effects of alternative agricultural practices on water footprint, energy use, and GHG emissions. The scenarios were designed according to the policy priorities of China’s 14th Five-Year Plan and published evidence on the effective agricultural management practices. They represent conditional management interventions rather than forecasts of future water use, energy consumption, or GHG emissions. Because future NEP was not simulated, the scenario analysis focused on changes in water footprint, energy use, and GHG emissions relative to S0 rather than predictions of the achievement of carbon neutrality.
Five single practice scenarios were first established. Scenario S1 assumed a 30% reduction in nitrogen fertilizer application. This assumption was based on field studies indicating that such a reduction could be achieved without significant yield loss under appropriate management conditions [43,44]. Scenario S2 represented an improvement in the energy efficiency of nitrogen fertilizer production based on published estimates [34]. Scenarios S3 and S4 replaced the baseline irrigation method with drip irrigation and sprinkler irrigation, respectively. The corresponding water saving rates were assumed to range from 60% to 85% for drip irrigation and from 50% to 75% for sprinkler irrigation [45]. Scenario S5 assumed that 50% of crop straw was returned to the field. This proportion was selected by considering current residue utilization patterns and the policy objective of increasing residue utilization under China’s 14th Five-Year Plan [22]. Combined scenarios S6 to S21 represented the simultaneous implementation of two to four management practices (Figure 2).
3. Results
3.1. Carbon Neutrality and GHG Emissions for Crop Production in the NCP
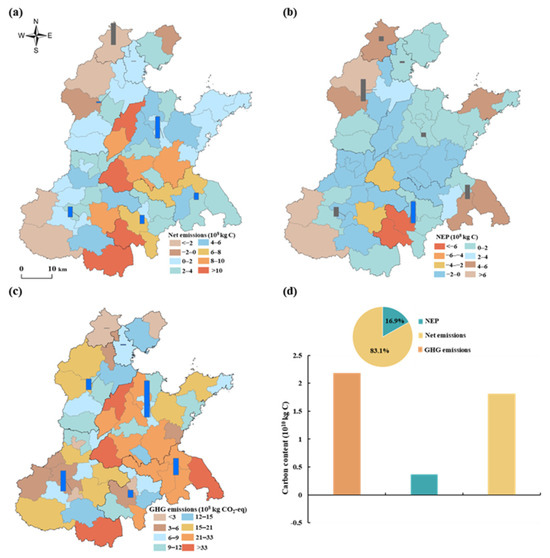
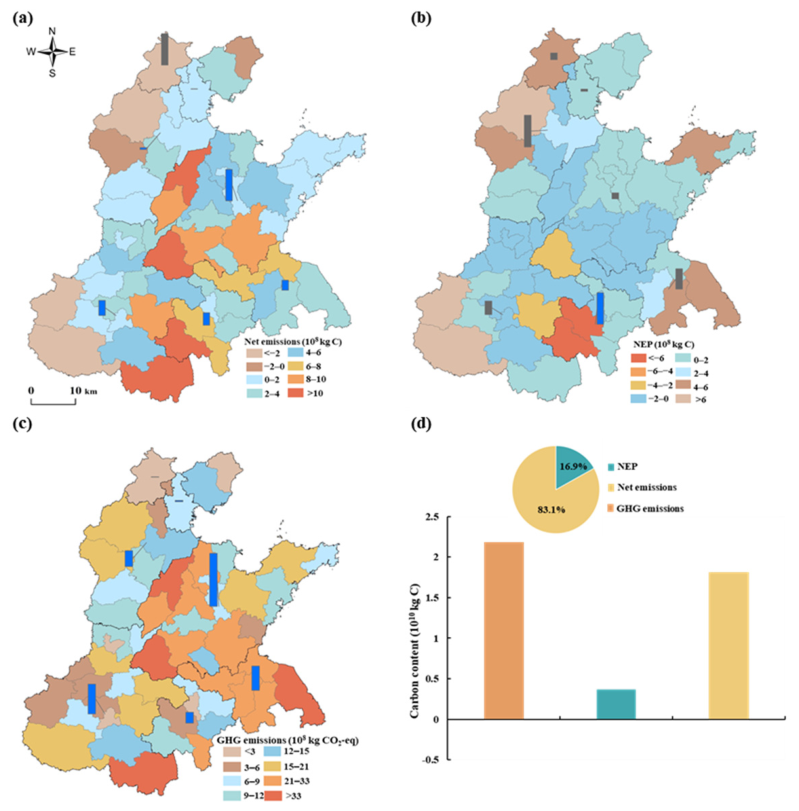
Production of the three crops generated net emissions of 1.8 × 10¹⁰ kg C yr−1 in 2018 (Figure 3). Beijing had negative net emissions and therefore functioned as net sinks (Figure 3a). Tianjin and Hebei had positive net emissions but were among the regions with the lowest net emissions. In contrast, Shandong and Henan had the highest positive net emissions in the NCP. Within Henan Province, only Nanyang and Luoyang had negative net emissions, with values of −3.8 × 10⁸ and −9.6 × 10⁸ kg C yr−1, respectively. Both cities therefore functioned as net sinks. All other cities in Henan were net sources. At the regional scale, net source areas were concentrated in the central and southern parts of the NCP and accounted for 88.9% of the NCP. In contrast, several areas in the northern and southwestern parts of the region functioned as net sinks (Figure 3a). Total GHG emissions associated with crop production amounted to 8 × 10¹⁰ kg CO2-eq yr−1 (Figure 3c). Shandong had the highest GHG emissions in the NCP, reaching 3.13 × 10¹⁰ kg CO2-eq yr−1. Heze contributed the largest share of the provincial total. Beijing had the lowest GHG emissions, at 0.01 × 10¹⁰ kg CO2-eq yr−1. Annual cropland NEP amounted to 0.37 × 10¹⁰ kg C yr−1, and this carbon sinks offset 16.9% of the GHG emissions associated with crop production (Figure 3d). At the provincial level, NEP was positive in all regions except Anhui, indicating that most provincial level regions functioned as carbon sinks when NEP was considered alone (Figure 3b). Fuyang recorded the most negative NEP value, at −8.8 × 10⁸ kg C yr−1. Hebei had the largest total positive NEP, with Baoding contributing the largest share of the provincial carbon sinks.
Figure 3.
Spatial distributions across the 54 administrative units of (a) net emissions, (b) net ecosystem productivity (NEP), and (c) greenhouse gas (GHG) emissions in the NCP. The blue and grey bars indicate the corresponding provincial totals. (d) GHG emissions expressed in carbon content.
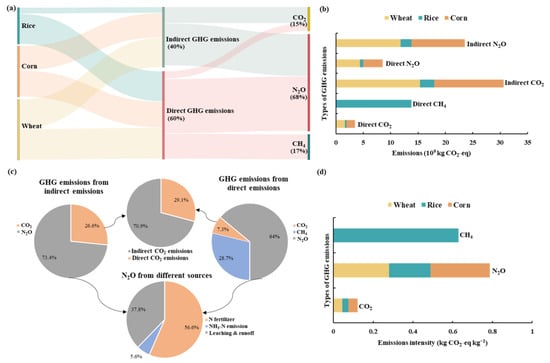
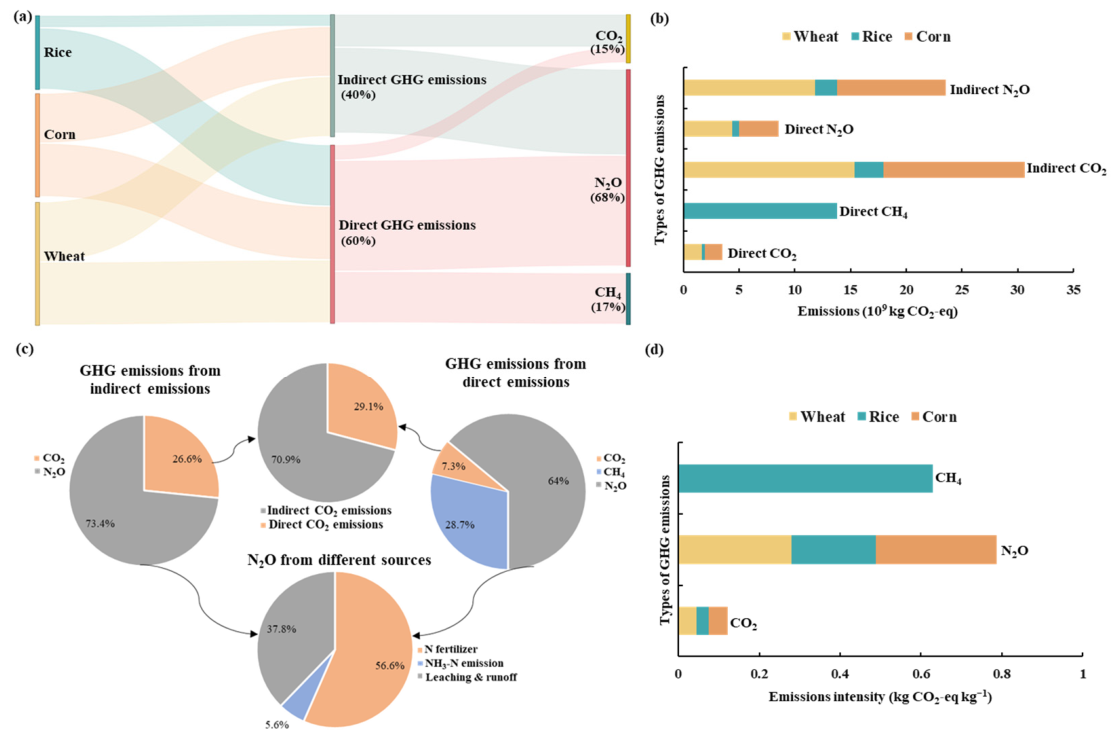
The contributions of different emission sources varied among crops (Figure 4). N2O was the largest component, accounting for 68% of total GHG emissions (Figure 4a). Direct N2O emissions from nitrogen fertilizer application accounted for 56.6% of total N2O emissions (Figure 4c). For CO2 emissions, electricity used for irrigation and indirect emissions associated with diesel, fertilizer, and pesticide production contributed 29.1% and 70.9%, respectively (Figure 4c). CH4 emissions originated from rice cultivation and accounted for 28.7% of direct GHG emissions. Among the three crops, rice had the highest emission intensity, whereas wheat generated the largest total GHG emissions, amounting to 3.3 × 10¹⁰ kg CO2-eq (Figure 4b,d).
Figure 4.
Greenhouse gas (GHG) emissions associated with wheat, rice, and corn production. (a) Sankey diagram of GHG emissions among three crops. (b) Total GHG emissions from the three crops. (c) Contributions of different sources to GHG emissions. (d) Emission intensities of CO2, CH4, and N2O for wheat, rice, and corn.
3.2. Relationships Among Water Footprint, Energy Use, and Carbon Neutrality
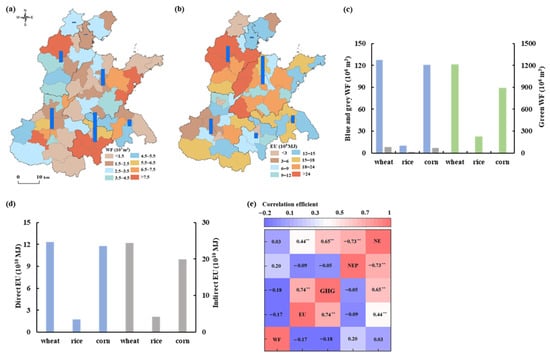
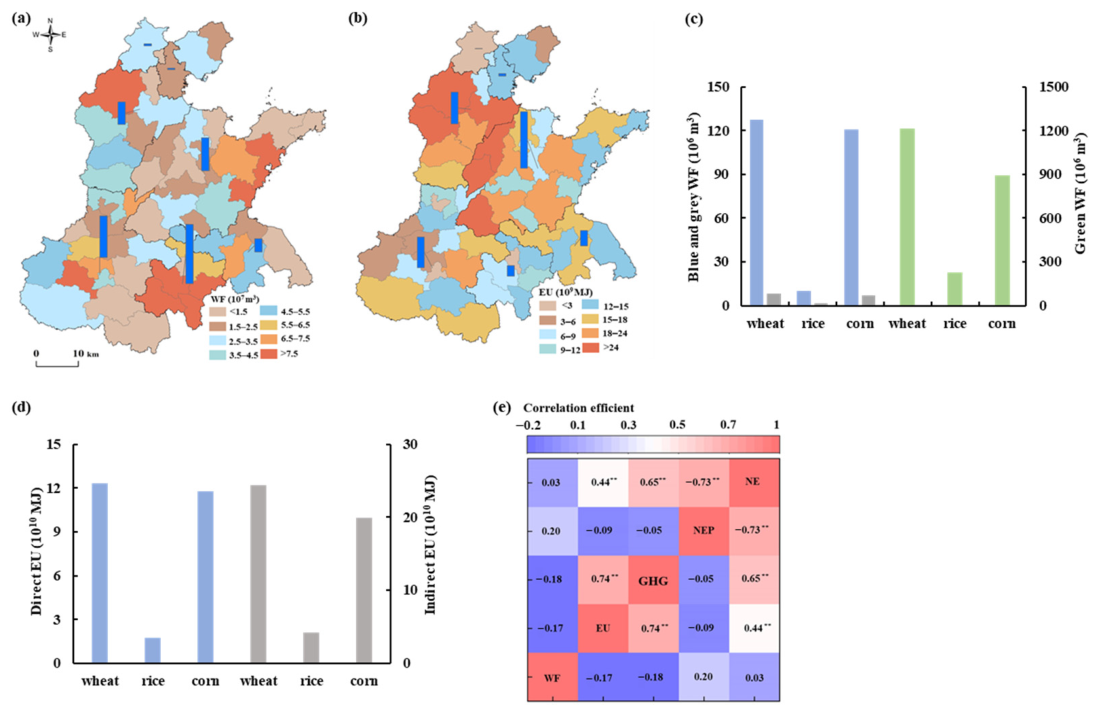
The water footprint, energy use, GHG emissions, NEP, and net emissions associated with crop production showed pronounced spatial variation across the NCP (Figure 3a–c and Figure 5a–d). Northern Hebei and central Shandong were characterized by high water footprints, energy use, and GHG emissions. However, these regions had relatively low net emissions because their high NEP offset a substantial proportion of the emissions associated with crop production (Figure 3a,b). The production of the three crops generated a total water footprint of 2.6 × 10⁹ m3 and consumed 7.4 × 10¹¹ MJ of energy use (Figure 5b,d). Anhui had the largest provincial water footprint, reaching 8.95 × 10⁸ m3, whereas Tianjin had the lowest water footprint in the NCP. Bozhou contributed a substantial share of Anhui’s total water footprint. Shandong had the highest energy use, whereas Beijing had the lowest (Figure 5a,b). Within Shandong Province, Heze contributed the largest share of total energy use.
Figure 5.
(a) Spatial distribution of water footprint (WF). Blue bars indicate the corresponding provincial totals. (b) Spatial distribution of energy use (EU). Blue bars indicate the corresponding provincial totals. (c) The amount of blue, green, and grey WF among three crops. (d) The amount of direct and indirect EU among three crops. (e) Correlation efficient among WF, EU, greenhouse gas (GHG) emissions, net ecosystem productivity (NEP), and net emissions (NE). ** represents a significant correlation between any two in the nexus of WF, EU, GE, NEP, and NE (p < 0.01).
Water footprint was not significantly correlated with energy use, GHG emissions, NEP, or net emissions across the NCP (Figure 5e). Water footprint was weakly positively correlated with NEP (r = 0.20) and net emissions (r = 0.03), but weakly negatively correlated with energy use (r = −0.17) and GHG emissions (r = −0.18). Energy use and GHG emissions showed negligible negative correlations with NEP, with correlation coefficients of −0.09 and −0.05, respectively. Energy use was significantly and positively correlated with both GHG emissions and net emissions. The strongest relationship was observed between energy use and GHG emissions (r = 0.74). NEP and GHG emissions were also significantly and positively correlated with net emissions, with correlation coefficients of −0.73 and 0.65, respectively.
3.3. Analysis of Agricultural Management Scenarios
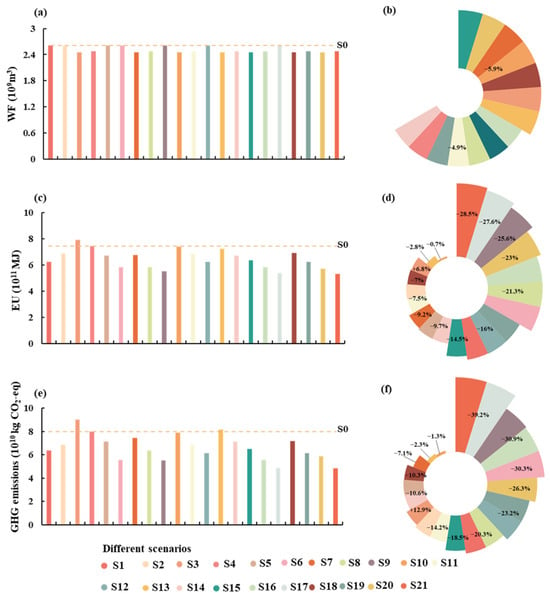
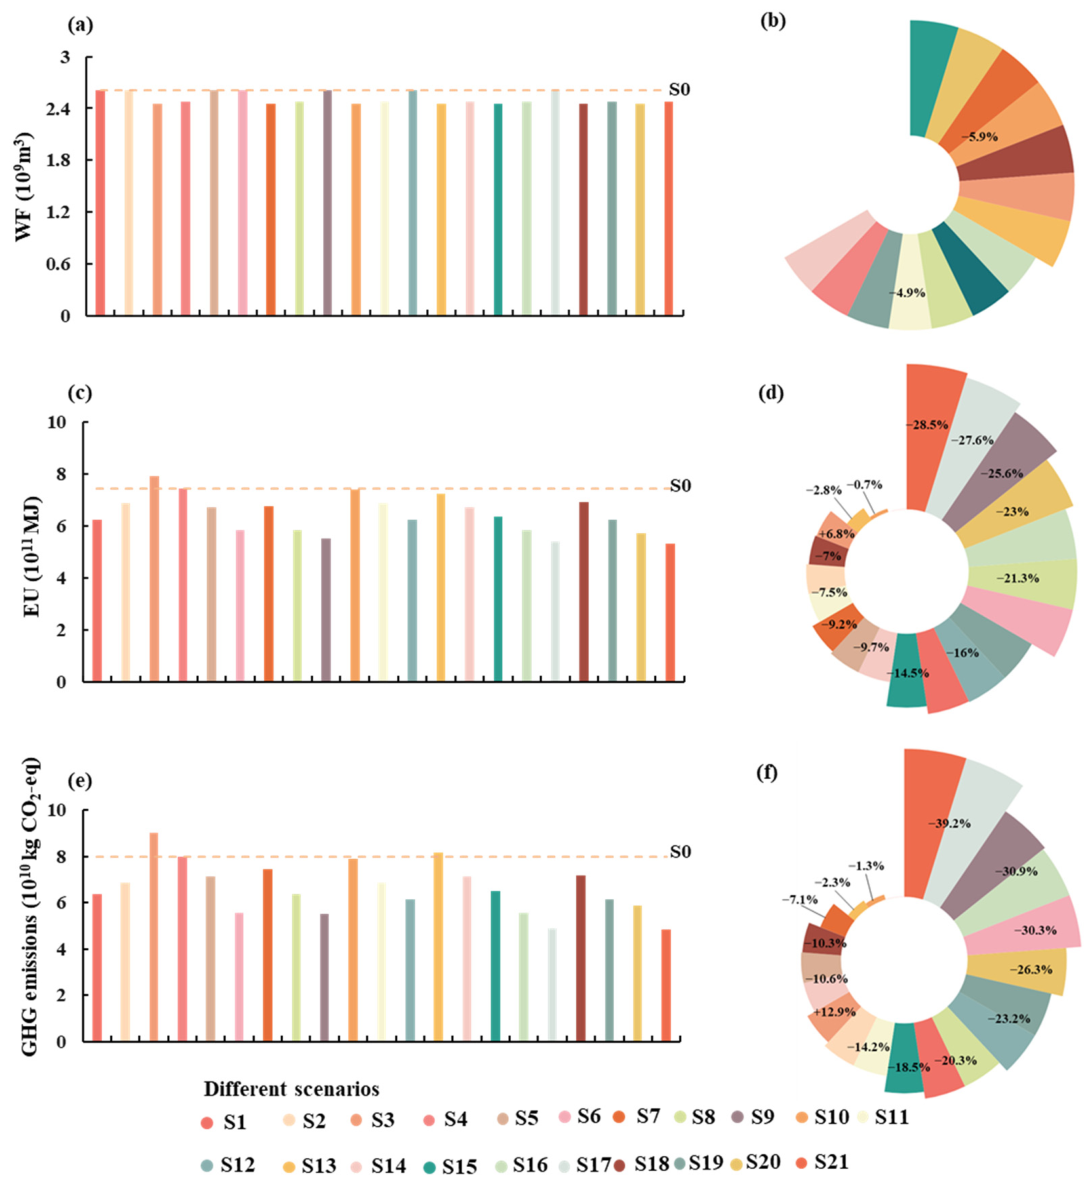
The integrated S21 scenario reduced the water footprint by 4.9%, energy use by 28.5%, and GHG emissions by 39.2% relative to S0 (Table S4 and Figure 6). Total crop straw production was estimated at 2.3 × 10¹¹ kg, containing 5.56 × 10⁹ kg of theoretical N, P2O5, and K2O resources before application of a return fraction (Tables S2, S3, S5 and S6). Scenarios S17 and S21 achieved the greatest reductions in GHG emissions, both reaching 39.2%. The largest reported energy use reductions occurred in S21 (28.5%), followed by S17 (27.6%). Seven scenarios that included drip irrigation, namely S3, S7, S10, S13, S15, S18, and S20, achieved the greatest reduction in water footprint, at 5.9%. However, drip irrigation alone under S3 increased energy use by 6.8% and GHG emissions by 12.9%. These results indicate that the scenario with the greatest water saving did not necessarily deliver the largest energy or GHG benefits. All percentages represent conditional changes relative to the 2018 baseline inventory.
Figure 6.
(a) Water footprint (WF) under different scenarios. (b) Percentage changes for the WF compared to baseline scenario (S0). (c) Energy use (EU) under different scenarios. (d) Percentage changes for the EU compared to S0. (e) Greenhouse gas (GHG) emissions under different scenarios. (f) Percentage changes for the GHG emissions compared to S0. The positive and negative values represent increased and decreased effects compared to S0, respectively.
4. Discussion
4.1. Impacts of Water, Energy, and GHG Emissions on Carbon Neutrality
The 2018 inventory indicated that the production for the three crops functioned as a net source within the defined accounting boundary, although cropland NEP offset 16.9% of production related GHG emissions. Irrigation energy use averaged 8365.9 MJ ha−1, which was close to the previously reported value of 8500 MJ ha−1 for the NCP [38]. Indirect energy accounted for 65.3% of total energy use, within the published ranges of 52.2% to 75.8% for the NCP and 58% to 83% for the Sanjiang Plain [5]. Nitrogen fertilizer was the largest energy input, accounting for 53.4% of total energy use. This finding is consistent with the important contribution of fertilizer manufacture in other intensive cropping systems [46]. Recent farm survey evidence has likewise identified irrigation and agricultural input management as major determinants of the carbon footprint of wheat and corn production systems in the NCP [47]. The importance of management practices is also consistent with global evidence showing that GHG emission intensity from cropland varies substantially among production systems [48]. Recent farm survey evidence has likewise identified irrigation and agricultural input management as major determinants of the carbon footprint of wheat and corn production systems in the NCP [47]. The importance of management practices is also consistent with global evidence showing that GHG emission intensity from cropland varies substantially among production systems [48,49,50]. Interannual climate variability may affect the absolute magnitude and spatial distribution of the indicators reported in this study. During hot and dry years, increased atmospheric evaporative demand and limited precipitation may increase irrigation requirements and the energy used for groundwater pumping. However, severe soil water stress can restrict stomatal conductance, leaf-area development, evapotranspiration, and photosynthetic carbon uptake, thereby reducing cropland NEP. Wet years may reduce irrigation demand and pumping-related emissions, but excessive rainfall and waterlogging can suppress crop growth and alter soil N2O and CH4 emissions. Long-term observations in the NCP have shown that climatic factors strongly affect crop evapotranspiration, while field experiments have demonstrated that GHG emissions and the performance of water and nitrogen management differ among wet, normal, and dry years [51,52].
Differences among provinces likely reflected variation in cropped area and crop composition, irrigation water sources and pumping lift, fertilizer input intensity, and climatic water demand. Wheat and corn rotation systems and dependence on groundwater irrigation are particularly prominent in Hebei, Henan, and Shandong. In contrast, rice production makes a greater contribution to the water footprint and CH4 emissions of Jiangsu and Anhui. However, the mapped values represent totals for administrative units. A high total may therefore result from a large cropland area rather than a high intensity per hectare. These comparisons support the importance of the emission and energy sources identified in this study. Nevertheless, differences in system boundaries, crop composition, electricity emission factors, and reporting units preclude direct comparison among estimates. N2O dominated the baseline GHG inventory in this study, consistent with the global importance of agricultural nitrogen losses [12]. This finding highlights nitrogen management as a near-term mitigation priority. Site specific soil testing, split or deep fertilizer placement, and the appropriate use of enhanced efficiency fertilizers can reduce nitrogen losses while maintaining crop yields [53]. Improvements in nitrogen fertilizer production can provide additional upstream mitigation benefits. Zhang et al. estimated that advanced production technologies could reduce emissions associated with nitrogen fertilizer manufacture by 20–43% [34]. Policy measures should therefore combine improvements in field level nitrogen use efficiency with cleaner fertilizer production. The effects on crop yields and N2O emissions should also be evaluated under local conditions.
4.2. Policy Implications and Limitations
The scenario analysis demonstrates that agricultural management strategies should consider water, energy use, and GHG emissions jointly. Single objective policies may improve one environmental indicator while worsening another. Previous co-optimization studies in the NCP have similarly shown that fertilizer, irrigation, and crop straw management must be coordinated to maintain crop yields while reducing environmental pressure [54]. Recent nexus research has also emphasized that mitigation outcomes depend on the accounting boundary and on interactions among land, water, energy, and GHG components [6]. The practices evaluated in this study were selected according to the policy priorities of China’s 14th Five-Year Plan. They are therefore policy-relevant, although their practical effectiveness will depend on local production conditions. Nitrogen management should be a near-term priority. Reducing nitrogen fertilizer application and improving fertilizer use efficiency substantially decreased both energy use and GHG emissions in the scenario analysis. When water saving was not treated as the primary objective, which combined three management practices, we achieved the lowest GHG emissions (S17, Figure 6). These results support the use of soil testing, site specific fertilizer recommendations, split application, and improved fertilizer production technologies. They are also consistent with China’s Action Plan for Zero Growth in Fertilizer Use by 2020, which aimed to improve fertilizer use efficiency and limit further increases in fertilizer consumption [55]. However, fertilizer reduction rates should be adjusted locally to avoid yield losses and unintended changes in N2O emissions [34,43,44].
The drip irrigation scenarios illustrate an important water–energy–GHG trade-off. Drip irrigation produced the largest reduction in water footprint but increased energy use and GHG emissions when implemented alone. Water saving technologies should therefore not be prioritized solely from a GHG mitigation perspective unless water scarcity is severe or the energy used for pumping has a low emission intensity. Sprinkler and drip irrigation may remain appropriate in water stressed areas, but their adoption should be based on an integrated assessment of water savings, pumping energy, GHG emissions, and economic costs [9,45,56]. This finding is consistent with recent research showing that advanced irrigation technologies can save water while increasing energy consumption and associated emissions in the NCP. Implementation should follow a phased and spatially differentiated approach. In the near term, agricultural extension services can prioritize soil testing, improved nitrogen management, and monitoring of practices associated with N2O emissions. In the medium term, crop straw return can be expanded where nutrient substitution and soil benefits outweigh additional field emissions. In the longer term, irrigation infrastructure should be targeted toward areas where water scarcity justifies the additional energy and financial costs. Adoption will also depend on farmers’ willingness, access to technical support, capital and operating costs, and stable financial incentives [57]. Technical assistance, stakeholder coordination, and appropriately designed agricultural subsidies may help farmers adopt these practices.
Several limitations should be considered in this study. First, the scenarios represent conditional changes relative to the 2018 baseline rather than forecasts of future agricultural production. Future NEP was not simulated, so the analysis assessed changes in water footprint, energy use, and GHG emissions but not changes in the complete net GHG balance. Second, owing to limited data availability, the baseline inventory was developed using data from a single year. The results may therefore not fully capture the effects of interannual climate variability, including drought, extreme heat, and heavy rainfall, on evapotranspiration, irrigation demand, field GHG emissions, and NEP. Future research should use multiyear datasets, evaluate NEP estimates against available flux observations, and incorporate crop and soil specific responses, economic costs, farmer adoption behavior, and policy incentives such as agricultural subsidies. Resource allocation and optimization models could also be developed to identify management combinations that balance water conservation, energy efficiency, GHG mitigation, crop production, and economic feasibility [58,59].
5. Conclusions
This study assessed the carbon neutrality potential of alternative agricultural management practices from a water–energy–GHG nexus perspective under the policy priorities of China’s 14th Five-Year Plan. Within the defined accounting boundary, production of wheat, rice, and corn in the NCP functioned as a net GHG source in 2018. Beijing, Tianjin, and Hebei were the three provincial level regions with the lowest net emissions. Among the three GHG emissions considered, N2O made the largest contribution, accounting for 68% of total emissions. These emissions were mainly associated with nitrogen fertilizer application. Areas with high water footprints in northern Hebei and central Shandong also had high energy use and GHG emissions. Water footprint was not significantly correlated with energy use, GHG emissions, NEP, or net emissions. In contrast, energy use was significantly and positively correlated with both GHG emissions and net emissions. Across the 21 management scenarios, the integrated S21 scenario reduced water footprint by 4.9%, energy use by 28.5%, and GHG emissions by 39.2% relative to the 2018 baseline. However, the scenarios that achieved the greatest reductions in water footprint did not necessarily provide the largest energy or GHG benefits. This result indicates that policies focused exclusively on water conservation may weaken progress toward GHG mitigation and carbon neutrality. Overall, this study provides new insights into the agricultural water–energy–GHG nexus and offers evidence to support farm management decisions and coordinated policy development.
Supplementary Materials
The following supporting information can be downloaded at: https://www.mdpi.com/article/10.3390/land15081454/s1, Table S1: Groundwater elevation in different provinces; Text S1: Supplementary Methods [14,60,61,62,63]; Table S2: Field residue indices (FR) of the three crops (wheat, rice, corn) of the provinces in the North China Plain (NCP); Table S3: Nutrient content coefficients (NCN, NCP, and NCK) of the three crops straw in the NCP; Table S4: Scenario settings for agricultural management practices in the NCP and percentage changes of water footprint, energy use, and GHG emissions in different scenarios relative to the 2018 baseline scenario (S0). Scenarios are grouped as baseline (S0), single-measure (S1–S5), two-measure (S6–S14), three-measure (S15–S19), and integrated four-measure (S20–S21) cases. (“-” indicates no change on the sector; “↑” indicates an increase on the sector; and “↓” represents a decrease on the sector.); Table S5: Crop straw yield (SY) of the three crops of the provinces in the NCP in 2018; Table S6: Straw nutrient resources (, , and ) of the three crops straw in the NCP.
Author Contributions
Conceptualization, M.L. and Y.C.; methodology, M.L.; software, J.Z. and Y.L.; validation, M.L., Y.C. and Q.H.; formal analysis, M.L.; investigation, M.L.; writing—original draft preparation, M.L. and J.Z.; writing—review and editing, M.L.; visualization, M.L.; supervision, M.L. and Y.L.; project administration, M.L.; funding acquisition, M.L., Y.C. and Q.H. All authors have read and agreed to the published version of the manuscript.
Funding
This research was funded by Youth Project of the Natural Science Foundation of Henan Province (grant number 262300420645), University Science and Technology Innovation Team in Henan Province (grant number 25IRTSTHN004), Major Key Projects of the School of Geographical Sciences and Engineering in Henan University (grant number DLXKKY250315), and the National Key Research and Development Program of China (grant number 2024YFC3212200).
Data Availability Statement
Data will be made available on request.
Acknowledgments
The authors appreciate the efforts of the research team who collected and processed the original data.
Conflicts of Interest
The authors declare no conflicts of interest.
References
- Liu, B.; Gu, W.; Yang, Y.; Lu, B.; Wang, F.; Zhang, B.; Bi, J. Promoting potato as staple food can reduce the carbon–land–water impacts of crops in China. Nat. Food 2021, 2, 570–577. [Google Scholar] [CrossRef] [Scilit] [PubMed]
- Lamb, A.; Green, R.; Bateman, I.; Broadmeadow, M.; Bruce, T.; Burney, J.; Carey, P.; Chadwick, D.; Crane, E.; Field, R.; et al. The potential for land sparing to offset greenhouse gas emissions from agriculture. Nat. Clim. Change 2016, 6, 488–492. [Google Scholar] [CrossRef] [Scilit]
- Porter, J.R.; Howden, M.; Smith, P. Considering agriculture in IPCC assessments. Nat. Clim. Change 2017, 7, 680–683. [Google Scholar] [CrossRef] [Scilit]
- Zhao, X.; Ma, X.; Chen, B.; Shang, Y.; Song, M. Challenges toward carbon neutrality in China: Strategies and countermeasures. Resour. Conserv. Recycl. 2022, 176, 105959. [Google Scholar] [CrossRef] [Scilit]
- Fan, X.; Zhang, W.; Chen, W.; Chen, B. Land–water–energy nexus in agricultural management for greenhouse gas mitigation. Appl. Energy 2020, 265, 114796. [Google Scholar] [CrossRef] [Scilit]
- Xuan, X.; Bai, Y.; Sikka, G.; Weng, C.; Deng, X. A land–water–energy–greenhouse gas nexus framework informs climate change mitigation in agriculture: A case study in the North China Plain. Geogr. Sustain. 2025, 6, 100354. [Google Scholar] [CrossRef] [Scilit]
- Wang, J.; Rothausen, S.G.S.A.; Conway, D.; Zhang, L.; Xiong, W.; Holman, I.P.; Li, Y. China’s water–energy nexus: Greenhouse-gas emissions from groundwater use for agriculture. Environ. Res. Lett. 2012, 7, 014035. [Google Scholar] [CrossRef] [Scilit]
- Daccache, A.; Ciurana, J.S.; Rodriguez Diaz, J.A.; Knox, J.W. Water and energy footprint of irrigated agriculture in the Mediterranean region. Environ. Res. Lett. 2014, 9, 124014. [Google Scholar] [CrossRef] [Scilit]
- Cremades, R.; Rothausen, S.G.S.A.; Conway, D.; Zou, X.; Wang, J. Co-benefits and trade-offs in the water–energy nexus of irrigation modernization in China. Environ. Res. Lett. 2016, 11, 054007. [Google Scholar] [CrossRef] [Scilit]
- Wu, H.; MacDonald, G.K.; Galloway, J.N.; Zhang, L.; Gao, L.; Yang, L.; Yang, J.; Li, X.; Li, H.; Yang, T. The influence of crop and chemical fertilizer combinations on greenhouse gas emissions: A partial life-cycle assessment of fertilizer production and use in China. Resour. Conserv. Recycl. 2021, 168, 105303. [Google Scholar] [CrossRef] [Scilit]
- Wang, Z.B.; Chen, J.; Mao, S.C.; Han, Y.C.; Chen, F.; Zhang, L.F.; Li, Y.B.; Li, C.D. Comparison of greenhouse gas emissions of chemical fertilizer types in China’s crop production. J. Clean. Prod. 2017, 141, 1267–1274. [Google Scholar] [CrossRef] [Scilit]
- Tian, H.; Xu, R.; Canadell, J.G.; Thompson, R.L.; Winiwarter, W.; Suntharalingam, P.; Davidson, E.A.; Ciais, P.; Jackson, R.B.; Janssens-Maenhout, G.; et al. A comprehensive quantification of global nitrous oxide sources and sinks. Nature 2020, 586, 248–256. [Google Scholar] [CrossRef] [Scilit] [PubMed]
- Feng, J.; Chen, C.; Zhang, Y.; Song, Z.; Deng, A.; Zheng, C.; Zhang, W. Impacts of cropping practices on yield-scaled greenhouse gas emissions from rice fields in China: A meta-analysis. Agric. Ecosyst. Environ. 2013, 164, 220–228. [Google Scholar] [CrossRef] [Scilit]
- Yin, H.; Zhao, W.; Li, T.; Cheng, X.; Liu, Q. Balancing straw returning and chemical fertilizers in China: Role of straw nutrient resources. Renew. Sustain. Energy Rev. 2018, 81, 2695–2702. [Google Scholar] [CrossRef] [Scilit]
- He, L.; Xu, Z.; Wang, S.; Bao, J.; Fan, Y.; Daccache, A. Optimal crop planting pattern can be harmful to reach carbon neutrality: Evidence from a food–energy–water–carbon nexus perspective. Appl. Energy 2022, 308, 118364. [Google Scholar] [CrossRef] [Scilit]
- Pu, C.; Chen, J.-S.; Wang, H.-D.; Virk, A.L.; Zhao, X.; Zhang, H.-L. Greenhouse gas emissions from the wheat–maize cropping system under different tillage and crop residue management practices in the North China Plain. Sci. Total Environ. 2022, 819, 153089. [Google Scholar] [CrossRef] [Scilit] [PubMed]
- Xu, Z.; Chen, X.; Liu, J.; Zhang, Y.; Chau, S.; Bhattarai, N.; Wang, Y.; Li, Y.; Connor, T.; Li, Y. Impacts of irrigated agriculture on food–energy–water–CO2 nexus across metacoupled systems. Nat. Commun. 2020, 11, 5837. [Google Scholar] [CrossRef] [Scilit] [PubMed]
- Ding, T.; Fang, L.; Chen, J.; Ji, J.; Fang, Z. Exploring the relationship between water–energy–food nexus sustainability and multiple ecosystem services at the urban agglomeration scale. Sustain. Prod. Consum. 2023, 35, 184–200. [Google Scholar] [CrossRef] [Scilit]
- Mondal, K.; Chatterjee, C.; Singh, R. Examining the coupling and coordination of water–energy–food nexus at a sub-national scale in India: Insights from the perspective of sustainable development goals. Sustain. Prod. Consum. 2023, 43, 140–154. [Google Scholar] [CrossRef] [Scilit]
- Albrecht, T.R.; Crootof, A.; Scott, C.A. The water–energy–food nexus: A systematic review of methods for nexus assessment. Environ. Res. Lett. 2018, 13, 043002. [Google Scholar] [CrossRef] [Scilit]
- Dalin, C.; Qiu, H.; Hanasaki, N.; Mauzerall, D.L.; Rodriguez-Iturbe, I. Balancing water resource conservation and food security in China. Proc. Natl. Acad. Sci. USA 2015, 112, 4588–4593. [Google Scholar] [CrossRef] [Scilit] [PubMed]
- Ministry of Agriculture and Rural Affairs of the People’s Republic of China. National Agricultural Green Development Plan for the 14th Five-Year Plan Period (2021–2025); Ministry of Agriculture and Rural Affairs of the People’s Republic of China: Beijing, China, 2021. (In Chinese)
- Kang, S.; Eltahir, E.A.B. North China Plain threatened by deadly heatwaves due to climate change and irrigation. Nat. Commun. 2018, 9, 2894. [Google Scholar] [CrossRef] [Scilit] [PubMed]
- National Bureau of Statistics of China. China Rural Statistical Yearbook 2019; China Statistics Press: Beijing, China, 2019. (In Chinese)
- He, M.; Kimball, J.S.; Yi, Y.; Running, S.W.; Guan, K.; Moreno, A.; Wu, X.; Maneta, M. Satellite data-driven modeling of field-scale evapotranspiration in croplands using the MOD16 algorithm framework. Remote Sens. Environ. 2019, 230, 111201. [Google Scholar] [CrossRef] [Scilit]
- Mu, Q.; Zhao, M.; Running, S.W. Improvements to a MODIS global terrestrial evapotranspiration algorithm. Remote Sens. Environ. 2011, 115, 1781–1800. [Google Scholar] [CrossRef] [Scilit]
- Li, W.; MacBean, N.; Ciais, P.; Defourny, P.; Lamarche, C.; Bontemps, S.; Houghton, R.A.; Peng, S. Gross and net land cover changes in the main plant functional types derived from the annual ESA CCI land cover maps (1992–2015). Earth Syst. Sci. Data 2018, 10, 219–234. [Google Scholar] [CrossRef] [Scilit]
- Ju, W.; Zhou, Y. Global Daily Net Ecosystem Productivity Simulation Product, 1981–2019 [Dataset]; National Ecosystem Science Data Center: Beijing, China, 2021. [CrossRef]
- Chen, J.M.; Ju, W.; Ciais, P.; Viovy, N.; Liu, R.; Liu, Y.; Lu, X. Vegetation structural change since 1981 significantly enhanced the terrestrial carbon sink. Nat. Commun. 2019, 10, 4259. [Google Scholar] [CrossRef] [Scilit] [PubMed]
- IKE Environmental Technology Co., Ltd.; Sichuan University. Chinese Life Cycle Database (CLCD). Available online: https://www.ike-global.com/ (accessed on 4 August 2026).
- West, T.O.; Marland, G. A synthesis of carbon sequestration, carbon emissions, and net carbon flux in agriculture: Comparing tillage practices in the United States. Agric. Ecosyst. Environ. 2002, 91, 217–232. [Google Scholar] [CrossRef] [Scilit]
- China City Greenhouse Gas Working Group. China Products Carbon Footprint Factors Database 2022; China Environmental Publishing Group: Beijing, China, 2022. (In Chinese) [Google Scholar]
- Jin, Z.; Zhang, L.; Liu, H.; Nie, L. Energy assessment of different rice–wheat rotation systems. Food Energy Secur. 2021, 10, e284. [Google Scholar] [CrossRef] [Scilit]
- Zhang, W.F.; Dou, Z.X.; He, P.; Ju, X.T.; Powlson, D.; Chadwick, D.; Norse, D.; Lu, Y.L.; Zhang, Y.; Wu, L.; et al. New technologies reduce greenhouse gas emissions from nitrogenous fertilizer in China. Proc. Natl. Acad. Sci. USA 2013, 110, 8375–8380. [Google Scholar] [CrossRef] [Scilit] [PubMed]
- Diotto, A.V.; Folegatti, M.V.; Duarte, S.N.; Romanelli, T.L. Embodied energy associated with the materials used in irrigation systems: Drip and centre pivot. Biosyst. Eng. 2014, 121, 38–45. [Google Scholar] [CrossRef] [Scilit]
- Mekonnen, M.M.; Hoekstra, A.Y. The green, blue and grey water footprint of crops and derived crop products. Hydrol. Earth Syst. Sci. 2011, 15, 1577–1600. [Google Scholar] [CrossRef] [Scilit]
- Franke, N.A.; Boyacioglu, H.; Hoekstra, A.Y. Grey Water Footprint Accounting: Tier 1 Supporting Guidelines; Value of Water Research Report Series No. 65; UNESCO-IHE Institute for Water Education: Delft, The Netherlands, 2013. [Google Scholar]
- Rothausen, S.G.S.A.; Conway, D. Greenhouse-gas emissions from energy use in the water sector. Nat. Clim. Change 2011, 1, 210–219. [Google Scholar] [CrossRef] [Scilit]
- Li, X.; Jiang, W.; Duan, D. Spatiotemporal analysis of irrigation water use coefficients in China. J. Environ. Manag. 2020, 262, 110242. [Google Scholar] [CrossRef] [Scilit] [PubMed]
- Intergovernmental Panel on Climate Change. 2019 Refinement to the 2006 IPCC Guidelines for National Greenhouse Gas Inventories; IPCC: Geneva, Switzerland, 2019.
- Ma, Y.C.; Kong, X.W.; Yang, B.; Zhang, X.L.; Yan, X.Y.; Yang, J.C.; Xiong, Z.Q. Net global warming potential and greenhouse gas intensity of annual rice–wheat rotations with integrated soil–crop system management. Agric. Ecosyst. Environ. 2013, 164, 209–219. [Google Scholar] [CrossRef] [Scilit]
- Myhre, G.; Shindell, D.; Bréon, F.-M.; Collins, W.; Fuglestvedt, J.; Huang, J.; Koch, D.; Lamarque, J.-F.; Lee, D.; Mendoza, B.; et al. Anthropogenic and Natural Radiative Forcing. In Climate Change 2013: The Physical Science Basis. Contribution of Working Group I to the Fifth Assessment Report of the Intergovernmental Panel on Climate Change; Stocker, T.F., Qin, D., Plattner, G.-K., Tignor, M., Allen, S.K., Boschung, J., Nauels, A., Xia, Y., Bex, V., Midgley, P.M., et al., Eds.; Cambridge University Press: Cambridge, UK; New York, NY, USA, 2013; pp. 659–740. [Google Scholar]
- Li, H.; Li, X.; Mei, X.; Nangia, V.; Guo, R.; Hao, W.; Wang, J. An alternative water-fertilizer-saving management practice for a wheat–maize cropping system in the North China Plain: Based on a four-year field study. Agric. Water Manag. 2023, 276, 108053. [Google Scholar] [CrossRef] [Scilit]
- Si, Z.; Zain, M.; Mehmood, F.; Wang, G.; Gao, Y.; Duan, A. Effects of nitrogen application rate and irrigation regime on growth, yield, and water–nitrogen use efficiency of drip-irrigated winter wheat in the North China Plain. Agric. Water Manag. 2020, 231, 106002. [Google Scholar] [CrossRef] [Scilit]
- Chen, X.; Thorp, K.R.; van Oel, P.R.; Xu, Z.; Zhou, B.; Li, Y. Environmental impact assessment of water-saving irrigation systems across 60 irrigation construction projects in northern China. J. Clean. Prod. 2020, 245, 118883. [Google Scholar] [CrossRef] [Scilit]
- Kazemi, H.; Kamkar, B.; Lakzaei, S.; Badsar, M.; Shahbyki, M. Energy flow analysis for rice production in different geographical regions of Iran. Energy 2015, 84, 390–396. [Google Scholar] [CrossRef] [Scilit]
- Huo, Y.; Mi, G.; Zhu, M.; Chen, S.; Li, J.; Hao, Z.; Cai, D.; Zhang, F. Carbon footprint of farming practices in farmland ecosystems on the North and Northeast China plains. J. Environ. Manag. 2024, 354, 120378. [Google Scholar] [CrossRef] [Scilit] [PubMed]
- Carlson, K.M.; Gerber, J.S.; Mueller, N.D.; Herrero, M.; MacDonald, G.K.; Brauman, K.A.; Havlik, P.; O’Connell, C.S.; Johnson, J.A.; Saatchi, S.; et al. Greenhouse gas emissions intensity of global croplands. Nat. Clim. Change 2017, 7, 63–68. [Google Scholar] [CrossRef] [Scilit]
- Lin, J.; Li, J.; Rao, Z.; Zeng, Y. Association Between Morphological Spatial Patterns of Built-Up Land and Carbon Emissions: Evidence from 303 Cities in China. Systems 2026, 14, 595. [Google Scholar] [CrossRef] [Scilit]
- Romeo, L.M. CO2 Emissions Scenarios in the European Union—The Urgency of Carbon Capture and Controlled Economic Growth. Sustainability 2026, 18, 1043. [Google Scholar] [CrossRef] [Scilit]
- Cheng, Y.; Elrys, A.S.; Wang, J.; Xu, C.; Ni, K.; Zhang, J.; Wang, S.; Cai, Z.; Pacholski, A. Application of enhanced-efficiency nitrogen fertilizers reduces mineral nitrogen usage and emissions of both N2O and NH3 while sustaining yields in a wheat–rice rotation system. Agric. Ecosyst. Environ. 2022, 324, 107720. [Google Scholar] [CrossRef] [Scilit]
- Yang, C.; Lei, H.M. Climate and management impacts on crop growth and evapotranspiration in the North China Plain based on long-term eddy covariance observation. Agric. For. Meteorol. 2022, 325, 109147. [Google Scholar] [CrossRef] [Scilit]
- Gao, Z.Z.; Wang, C.; Zhao, J.; Wang, K.; Shang, M.; Qin, Y.; Bo, X.; Chen, F.; Chu, Q. Adopting different irrigation and nitrogen management based on precipitation year types balances winter wheat yields and greenhouse gas emissions. Field Crops Res. 2022, 280, 108484. [Google Scholar] [CrossRef] [Scilit]
- Xiao, L.; Wang, G.; Wang, E.; Liu, S.; Chang, J.; Zhang, P.; Zhou, H.; Wei, Y.; Zhang, H.; Zhu, Y.; et al. Spatiotemporal co-optimization of agricultural management practices towards climate-smart crop production. Nat. Food 2024, 5, 59–71. [Google Scholar] [CrossRef] [Scilit] [PubMed]
- Ministry of Agriculture of the People’s Republic of China. Action Plan for Zero Growth in Fertilizer Use by 2020; Ministry of Agriculture and Rural Affairs of the People’s Republic of China: Beijing, China, 2015. (In Chinese)
- Ning, D.; Zhang, Y.; Qin, A.; Gao, Y.; Duan, A.; Zhang, J.; Liu, Z.; Zhao, B.; Liu, Z. Interactive effects of irrigation system and level on grain yield, crop water use, and greenhouse gas emissions of summer maize in the North China Plain. Sci. Total Environ. 2023, 864, 161165. [Google Scholar] [CrossRef] [Scilit] [PubMed]
- Piñeiro, V.; Arias, J.; Dürr, J.; Elverdin, P.; Ibáñez, A.M.; Kinengyere, A.; Opazo, C.M.; Owoo, N.; Page, J.R.; Prager, S.D.; et al. A scoping review on incentives for adoption of sustainable agricultural practices and their outcomes. Nat. Sustain. 2020, 3, 809–820. [Google Scholar] [CrossRef] [Scilit]
- Mansour, F.; Al-Hindi, M.; Abou Najm, M.; Yassine, A. Multi-objective optimization for comprehensive water–energy–food nexus modeling. Sustain. Prod. Consum. 2023, 38, 295–311. [Google Scholar] [CrossRef] [Scilit]
- Zou, H.; Fan, J.; Zhang, F.; Xiang, Y.; Wu, L.; Yan, S. Optimization of drip irrigation and fertilization regimes for high grain yield, crop water productivity and economic benefits of spring maize in Northwest China. Agric. Water Manag. 2020, 230, 105958. [Google Scholar] [CrossRef] [Scilit]
- Wang, X.; Yang, L.; Steinberger, Y.; Liu, Z.; Liao, S.; Xie, G. Field crop residue estimate and availability for biofuel production in China. Ren. Sustain. Energy Rev. 2013, 27, 864–875. [Google Scholar] [CrossRef] [Scilit]
- Wang, X.Y.; Xue, S.; Xie, G.H. Value-taking for residue factor as a parameter to assess the field residue of field crops. J. China Agricul. Univ. 2012, 17, 1–8. (In Chinese) [Google Scholar]
- Gao, L.W.; Ma, L.; Zhang, W.F.; Wang, F.H.; Ma, W.Q.; Zhang, F.S. Estimation of nutrient resource quantity of crop straw and its utilization situation in China. Trans. Chin. Soc. Agric. Eng. 2009, 25, 173–179. (In Chinese) [Google Scholar]
- He, P.A.; Li, R. Organic Fertilizer Nutrient in China. In National Agro-Tech Extension and Service Center (NATESC); China Agriculture Press: Beijing, China, 1999. (In Chinese) [Google Scholar]

Disclaimer/Publisher’s Note: The statements, opinions and data contained in all publications are solely those of the individual author(s) and contributor(s) and not of MDPI and/or the editor(s). MDPI and/or the editor(s) disclaim responsibility for any injury to people or property resulting from any ideas, methods, instructions or products referred to in the content. |
© 2026 by the authors. Licensee MDPI, Basel, Switzerland. This article is an open access article distributed under the terms and conditions of the Creative Commons Attribution (CC BY) license.