


Abstract
India faces large, persistent yield gaps across eight major crops—wheat, rice, maize, soybean, pulses, mustard, cotton, and sugarcane—that collectively limit food security and rural income. This review synthesises evidence from over 100 peer-reviewed studies (1990–2024) to provide the first comprehensive, multi-crop, agro-climatically resolved yield gap analysis for India. Applying the three-tier framework of potential yield (), attainable yield (), and farmer yield (), exploitable yield gaps are quantified at national and agro-climatic zone level, ranked limiting factors are identified, and projected climate change impacts are assessed. Yield gaps range from 20 to 35% in irrigated rice of the north-western Indo-Gangetic Plain to 60–75% in rainfed cotton and pulses of the semi-arid tropics. Yield gaps of blackgram across 20 major districts average 515 kg ha−1, driven by moisture stress, biotic pressure, and management constraints. Nitrogen management, irrigation access, variety adoption, and sowing-date optimisation collectively explain 80–85% of exploitable gaps, while nitrogen and irrigation alone account for 40–58%. Closing 50% of exploitable yield gaps could add approximately 100 million tonnes of food grain annually without expanding cultivated area, directly supporting Sustainable Development Goal (SDG 2). However, climate change is projected to widen yield gaps of rainfed rice by 15–30% by the 2040s under Representative Concentration Pathway (RCP) 8.5. Beyond this crop-by-crop synthesis, the review proposes a constraint-transition framework in which the dominant type of limiting factor shifts predictably from biophysical (water, climate) in the largest-gap rainfed systems to agronomic management (nitrogen, sowing date, variety) at intermediate gap levels and to institutional and socioeconomic constraints (credit, extension, land tenure, gender) as gaps narrow in the best-resourced irrigated systems, thus offering a conceptual lens for prioritising interventions by development stage rather than by crop alone.
1. Introduction
1.1. The Global Food Challenge and India’s Role
Global food demand is projected to increase by 50–70% by 2050 relative to 2010 levels, driven by a combination of population growth exceeding 9.7 billion people, rising per capita incomes in emerging economies, and dietary transitions towards more animal-based proteins [1]. Meeting this demand within the boundaries of a finite planet—characterised by declining per capita arable land, increasing water scarcity, increasing soil degradation, and changing climate—represents one of the defining challenges of the twenty-first century [2,3,4]. While agricultural land area expansion remains an option in some sub-Saharan African countries, land is largely unavailable in South Asia, where most arable land is already under cultivation and further expansion comes at unacceptable environmental costs [3].
India occupies a pivotal position in this global food system. With 168 million hectares under cultivation—the largest cropland area in the world as of 2021—India is the world’s second largest producer of wheat and rice, the largest producer of pulses, and among the top producers of sugarcane, cotton, and oilseeds [5,6]. India’s total food grain production reached a record 332.3 million tonnes in 2023–24 [7], yet the country continues to grapple with malnutrition, micronutrient deficiencies, and significant rural poverty—a paradox that arises partly from persistent yield gaps, which prevents the full realisation of agricultural production potential [8,9].
Despite the dramatic productivity gains achieved during the Green Revolution from the late 1960s onward, yield growth rates for major crops have slowed significantly since the 1990s [10,11]. In several major wheat (Triticum aestivum L.) producing states—Punjab, Haryana, UP—and rice-producing regions, yield growth has effectively stagnated, approaching what researchers have termed ‘yield plateaus’ or ‘yield ceilings’ [12,13]. At the same time, the gap between yields achieved at research stations and experiment farms and those realised by average farmers has remained large and, in some crops and regions, has actually widened [14,15]. This gap—the exploitable yield gap—represents the most tractable and policy-relevant challenge in Indian agriculture (Figure 1).
Figure 1.
Three-tier yield levels (Potential, Attainable, and Farmer yield) across eight major crops of India (* Sugarcane values divided by 10 for display purposes).
1.2. The Yield Gap Concept
A yield gap is formally defined as the difference between the yield achievable under a specific set of conditions and the yield actually achieved by farmers [16]. The yield gap framework used in contemporary research recognises a hierarchy of yield levels. Potential yield () represents the maximum yield achievable by a given crop variety when grown without any limitation other than solar radiation, temperature, CO2 concentration, and the genetic capacity of the variety—in other words, with optimal water, nutrient, and pest management [17,18]. For rainfed systems, the relevant benchmark is water-limited yield (), which represents the maximum yield achievable under prevailing rainfall without irrigation, but with otherwise optimal management [17].
Below the potential yield ceiling, attainable yield () represents the yield achievable by the best farmers in a region under prevailing economic and management conditions—typically operationalised as the 90th–95th percentile of farm yields or the yield achieved in farmer field demonstrations using recommended practices [19,20]. The difference between and actual farmer yield () constitutes the exploitable yield gap—the component that can realistically be addressed through improved agronomy, technology transfer, policy, and institutional support [16,21]. Three yield gap types are thus defined: Yield Gap I (YGI ), representing the research-to-demonstration gap; Yield Gap II (YGII ), the actionable exploitation gap; and the Technology Gap (TG ), the total unrealised potential [14,15].
Crop simulation models—including DSSAT (Decision Support System for Agrotechnology Transfer), ORYZA2000, APSIM (Agricultural Production Systems sIMulator), WOFOST (World Food Studies), and Hybrid-Maize—are the primary tools used to estimate and from first principles, using daily weather data, soil data, and crop genetic coefficients [22]. The Global Yield Gap Atlas (GYGA), a collaborative initiative of Wageningen University and the University of Nebraska-Lincoln, has applied a standardised methodology using these models to estimate and for major crops worldwide, including wheat, rice, maize, sorghum, and pearl millet for India [23]. Complementary approaches include boundary function analysis—where is estimated statistically as the upper frontier of a large dataset of farmer yields plotted against a key input or management variable—and stochastic frontier analysis [24,25].
1.3. The Knowledge Gap This Review Addresses
Previous research on yield gaps in India has been characterised by three major limitations: crop specificity, geographic narrowness, and analytical shallowness. Singh (2014) provided a valuable state-level analysis of yield gaps in rice, wheat, and pulses, but did not cover oilseeds, maize, cotton, or sugarcane, and lacked an agro-climatic zone framework [26]. The GYGA provides potential yield estimates for wheat, rice, maize, sorghum, and pearl millet using standardised simulation protocols [23], but does not cover soybean, mustard, cotton, or sugarcane, and does not decompose limiting factors or analyse temporal trends. ICRISAT reports quantified yield gaps for soybean, groundnut, pigeonpea, and chickpea using WOFOST and DSSAT [27,28] but lacked cereal and commercial crops. Madhukar et al. (2019) examined yield trends for wheat, rice, and maize across 29 states [12], but this was a trend analysis rather than a yield gap assessment. A 2024 study provided a global yield gap time series for ten crops including India [13], but at coarse resolution without India-specific factor analysis.
Critically, no existing review has integrated the following dimensions simultaneously: (i) remote sensing-based spatial yield gap evidence [29,30,31]; (ii) India’s Soil Health Card scheme data in relation to yield gaps; (iii) gender-disaggregated yield analysis [32]; (iv) effects of conservation agriculture on yield gap closure [33,34]; (v) farm-size structural yield disparities in Indian agriculture [30,35]. This systematic review addresses all these gaps in a single comprehensive synthesis.
1.4. Objectives
This review has six primary objectives to: (1) quantify yield gap magnitude and temporal trends for eight major crops of India at both national and agro-climatic zone level; (2) decompose yield gaps into their three-tier components (, , ) wherever data allow; (3) rank and quantify the contribution of key limiting factors—nitrogen, irrigation, variety, sowing date, soil health, pest and disease—to observed yield gaps; (4) assess the implications of yield gap closure for India’s food security and SDG 2 targets; (5) synthesise novel analytical dimensions including remote sensing, soil health, gender, conservation agriculture, and farm-size effects; (6) synthesise projected future yield gap trajectories under climate change scenarios (RCP 4.5 and RCP 8.5) and recommend evidence-based strategies for sustainable gap closure.
1.5. Hypotheses
Based on the stated objectives, this review tests five working hypotheses. (H1) Rainfed and semi-arid agro-climatic zone yield gaps are significantly larger than those in irrigated north-western Indo-Gangetic Plain (NW-IGP) zones across all eight major crops. (H2) Nitrogen management and irrigation access together explain more than 50% of exploitable yield gaps across all crops. (H3) Closing 50% of exploitable yield gaps across the six crops carried forward on a comparable weight basis would add approximately 100 million tonnes (Mt) of food grain equivalent annually without expanding cultivated area. (H4) Climate change under the high-emission scenario (RCP 8.5) will widen rainfed rice yield gaps by more than 15% by the 2040s relative to the 1981–2005 baseline period. (H5) Smallholder and women farmers face structurally larger yield gaps than medium and large farms owing to restricted access to productive resources.
2. Methodology
2.1. Literature Search and PRISMA Protocol
A systematic literature search was conducted following the PRISMA 2020 (Preferred Reporting Items for Systematic Reviews and Meta-Analyses) guidelines [36]. Four major bibliographic databases searched were: Scopus, Web of Science (WoS), Google Scholar, and the ICAR eShodhSindhu database (India’s national agricultural research database). Additional searches were conducted in the CABI databases, CGIAR repository, FAO document library, and ICRISAT publication portal. Searches covered publications from January 1990 to December 2024.
Search queries combined the following terms using Boolean operators: (“yield gap” OR “yield potential” OR “attainable yield” OR “technology gap” OR “extension yield gap”) AND (“India” OR “Indian” OR specific state names) AND (“wheat” OR “rice” OR “maize” OR “soybean” OR “pulse” OR “chickpea” OR “pigeonpea” OR “lentil” OR “mustard” OR “cotton” OR “sugarcane”). Searches were conducted across four databases: Scopus, Web of Science, Google Scholar, and ICAR eShodhSindhu. This generated an initial pool of 4218 records. After removal of duplicates, 2945 unique records were screened by title and abstract, of which 2612 were excluded as off-topic. Of the remaining 333 full-text articles assessed for eligibility, 226 were excluded due to absence of quantitative yield gap data, duplication across databases, or non-India focus, leaving 107 peer-reviewed studies that met the inclusion criteria and form the primary evidence base of this review (Figure 2). Additional grey literature—including reports from ICRISAT, CIMMYT, IRRI, ICAR, FAO, and GYGA, as well as government statistical publications—were retrieved manually and incorporated to supplement the peer-reviewed evidence base.
Figure 2.
PRISMA flow diagram illustrating the systematic literature search and selection process for studies on yield gaps in major crops of India.
2.2. Inclusion and Exclusion Criteria
Studies were included if they: (a) were conducted wholly or substantially in India; (b) reported quantitative yield data for at least one of the eight target crops, including either actual farmer yield, demonstration plot yield, potential yield estimate, or yield gap value; (c) were published in peer-reviewed journals, institutional reports, or government statistical databases; and (d) provided sufficient methodological description to assess data quality. Studies were excluded if they: reported only qualitative observations; covered crops outside the eight target crops; focused exclusively on post-harvest losses without yield gap data; or were duplicate reports of the same underlying dataset.
2.3. Agro-Climatic Zone Classification
India was classified into six broad agro-climatic regions, derived from the ICAR 15-zone agro-climatic classification [37] aggregated for multi-crop comparative analysis: (1) North-Western Indo-Gangetic Plain (NW-IGP): Punjab, Haryana, western Uttar Pradesh (UP), Uttarakhand plains; (2) Eastern Indo-Gangetic Plain (E-IGP): Bihar, eastern UP, Jharkhand, West Bengal plains; (3) Central India: Madhya Pradesh (MP), Chhattisgarh, Vidarbha (Maharashtra), eastern Rajasthan; (4) Peninsular India: Andhra Pradesh (AP), Telangana, Karnataka, Tamil Nadu, Kerala, coastal Maharashtra; (5) Western Arid Zone: western Rajasthan, Gujarat, Kutch; (6) Hill, Mountain and North-Eastern Zone: Uttarakhand hills, Himachal Pradesh (HP), Jammu and Kashmir, the North-Eastern states. Each yield gap estimate from the reviewed literature was geo-referenced to one or more of these zones.
2.4. Yield Gap Calculation and Synthesis
Yield gap percentages were calculated using the formula:
where is the benchmark yield (, , or depending on data availability) and is actual farmer yield. Prior to averaging, extracted estimates were categorised by crop, agro-climatic zone, benchmark-yield category (, , or ), and underlying data-source type (crop-simulation model, frontline demonstration/on-farm trial, farmer survey, or remote-sensing product); grouping within the crop-zone-period categories reported in this review was restricted to studies sharing the same benchmark-yield category, and estimates derived from materially different crop simulation models (DSSAT, APSIM, WOFOST, CANEGRO) were not pooled directly where this would obscure model-driven differences. We emphasise that the synthesis reported here is a structured narrative synthesis and not a reproducible weighted meta-analysis. The primary literature reviewed reports yield gap estimates predominantly as ranges, zone means, or single point values, and the majority of these sources do not report the study-level sample sizes that a sample-size-weighted pooling procedure or a formal 3 outlier screen would require. No numerical weighting scheme was therefore applied. Where multiple studies reported estimates for the same crop-zone-period combination and benchmark-yield category, the reported minimum, representative, and maximum values were carried forward unweighted, and the resulting range, rather than a single point estimate, should be interpreted as the primary uncertainty bound throughout this review. Data-source type (simulation/demonstration/survey/remote sensing) is indicated in Tables 1–5 wherever the underlying study reported it, and the citations underlying each numeric claim in this review are traceable via Tables S1–S11 (Supplementary Materials), in which every tabulated and plotted value is listed alongside the specific sources supporting it. The three-tier decomposition framework of van Ittersum et al. [17] was applied wherever , , and data were simultaneously available. Factor contribution estimates were synthesised from regression-based studies, stochastic frontier analyses, and agronomic experiment data reporting the yield response to individual management improvements. All yields are expressed on a harvested grain or seed basis at standard moisture content, with two explicit exceptions. Rice yields follow the Global Yield Gap Atlas convention and are reported as unmilled grain at 14% moisture; where national statistics are published on a milled basis, they have been converted at a 67% milling ratio for comparability. Sugarcane is reported as fresh cane. These two crops are consequently not on a common dry-weight basis with the remaining crops, and this is handled explicitly in Section 5.3.
3. Conceptual Framework: Yield Gap Hierarchy and Decomposition
The yield gap framework adopted in this review follows the hierarchical model of van Ittersum et al. [17], which is the international standard for yield gap analysis at scales from plot to global [19,38]. Four hierarchical yield levels are recognised.
Potential yield () is determined by solar radiation, temperature, CO2 concentration, and the genetic characteristics of the crop variety under conditions of optimal water, nutrient, and pest management—in other words, yield is limited only by climate and genetics [18]. For irrigated systems, is the appropriate benchmark. Estimation methods include: (i) crop growth simulation models such as DSSAT-CERES, APSIM, ORYZA2000, and WOFOST calibrated and validated against experimental data [22]; (ii) experimental data from well-managed agronomic trials at research stations; (iii) upper-boundary functions derived from large datasets of farmer field yields across environments [19].
Water-limited yield () is the yield achievable under rainfed conditions with optimal management of all factors other than water [17]. is the appropriate benchmark for rainfed systems and is estimated using the same models as but driven by measured or climate-model-derived rainfall rather than full irrigation. is intrinsically more variable than because of inter-annual rainfall variability, and this variability propagates directly into yield gap estimates for rainfed crops [39,40].
Attainable yield () is defined as the highest yield achievable by farmers under the best available management, economic, and social conditions prevailing in a region—operationally defined as the top 5–10th percentile of farm yields in a large survey dataset or the yield achieved under recommended management practices in farmer field demonstrations (Frontline Demonstrations, FLDs) [14,15]. is an important benchmark because it reflects what is actually achievable without major new technological breakthroughs, and hence defines the exploitable yield gap most directly relevant to extension and policy [41].
Actual farmer yield () is the yield realised by the average farmer under prevailing socioeconomic, edaphic, cultural, and management conditions [21]. is typically sourced from government crop cutting experiment data, national agricultural statistics, or large-scale farmer surveys. The difference constitutes the exploitable yield gap—the primary focus of this review. The difference (or for rainfed) reflects the fundamental constraints of the farming system that cannot be overcome without major new investments in technology, infrastructure, or land quality improvement [17].
Sendhil et al. [14] and Dhaka [15] introduced a structured three-tier typology for classifying yield losses in Indian agriculture that maps closely onto this framework: Yield Gap I (research station yield minus demonstration yield) reflecting the technology-transfer gap; Yield Gap II (demonstration yield minus actual farmer yield) reflecting the extension and adoption gap; and the Technology Gap (research station yield minus actual farmer yield). The most significant erosion in Indian agriculture consistently occurs between demonstration plots and farmers’ fields—the YGII—pointing to inadequate extension support, delayed input supply, limited technical knowledge, and socioeconomic barriers to technology adoption as the primary action points [26,42].
4. Crop-Wise Yield Gap Analysis
4.1. Wheat (Triticum aestivum L.)
4.1.1. Production Context and Yield Status
Wheat is India’s second most important food grain crop after rice, cultivated on approximately 29–31 million hectares (Mha) primarily as a rabi (winter season, October–April) crop. The Indo-Gangetic Plain—comprising Punjab, Haryana, Uttar Pradesh, Madhya Pradesh, Bihar, and Rajasthan—accounts for over 90% of India’s wheat production [6]. The national average wheat yield reached approximately 3600 kg ha−1 in FY2024, representing a sustained increase from 2280 kg ha−1 in 1990 [6]. However, this growth rate has decelerated significantly since 2000, and yield stagnation has been reported in 13 of 29 major wheat-growing states [12].
4.1.2. Yield Gap Magnitude and Decomposition
Under irrigated conditions in the NW-IGP, potential yield () estimated by DSSAT-CERES-Wheat ranges from 6000 to 7500 kg ha−1, while attainable yield () in demonstration plots ranges from 5000 to 6200 kg ha−1, giving YGI of approximately 1000–1800 kg ha−1 [14,23]. Against average farmer yields of 3200–4000 kg ha−1 in the NW-IGP, YGII ranges from 1500 to 2500 kg ha−1, which corresponds to an exploitable yield gap of approximately 30–42% of [14,24]. In rainfed conditions of central and eastern India, is estimated at 3500–4500 kg ha−1 against farmer yields of 1800–2500 kg ha−1, implying rainfed yield gaps of 45–55% [15,28]. The Eastern IGP—Bihar, eastern UP—shows the largest exploitable wheat yield gap nationally, at 50–60% of potential, driven by late sowing after delayed rice harvest, limited irrigation infrastructure, and poor access to quality seed [14,26] (Figure 3).
Figure 3.
Wheat yield trends and yield gap trajectory in India (1990–2024)—shaded bands show the exploitable gap () in dark blue and potential gap () in light blue.
4.1.3. Key Limiting Factors
Nitrogen management is the single most important limiting factor for wheat in India, accounting for an estimated 25–35% of the exploitable yield gap. Optimal nitrogen rates for irrigated wheat in the NW-IGP are approximately 120–150 kg N ha−1, but average application across India is only 80–100 kg N ha−1, with large spatial heterogeneity [14,43]. Nano urea and conservation tillage combinations have shown promise for improving nitrogen use efficiency under zero-till wheat [44]. Late sowing—a consequence of delayed rice harvest in the rice-wheat system of the IGP—is the second most important factor, reducing yield potential by 200–500 kg ha−1 for every week of delay beyond the optimal sowing window of 1–15 November [11,45]. Variety replacement rate (seed replacement rate) averages only 20–25% in self-pollinated wheat nationally, against the recommended 25–33%, contributing an estimated 10–15% to the yield gap [26]. Soil organic carbon depletion below 0.5% in sandy IGP soils reduces nitrogen retention and water-holding capacity, contributing to 5–10% of the gap [46,47]. Terminal heat stress during grain filling (March–April) is increasingly important under climate change: each 1 °C rise in maximum temperature during heading reduces wheat yield by 1.5–3.0% in the IGP [48,49,50].
4.2. Rice (Oryza sativa L.)
4.2.1. Production Context and Yield Status
Rice is India’s most important food grain crop, cultivated on approximately 43–44 Mha, approximately 30% of total cultivable land, across 17 major rice-growing states [51]. Kharif (June–October) rice accounts for over 85% of total rice area and production. National average rice yield in 2023–24 was approximately 4075 kg ha−1 expressed as unmilled grain, equivalent to 2730 kg ha−1 on the milled basis used in national food grain statistics, but with extreme state-level variation: from 2090 kg ha−1 in Madhya Pradesh to 5776 kg ha−1 in Punjab [6,51]. All rice yields reported in this review, including those in Table 1 and Table 2, are on the unmilled-grain basis at 14% moisture used by the Global Yield Gap Atlas. India cultivates rice under an exceptionally wide range of production systems: transplanted irrigated, direct-seeded irrigated, rainfed lowland, rainfed upland, and deep-water/flood-prone systems, each with distinct yield gap characteristics [52].
4.2.2. Irrigated Rice Yield Gap
In the NW-IGP, where rice is intensively irrigated (typically 20–30 irrigations per season consuming 1200–1500 mm water), yield gaps are relatively small. Using GYGA protocols with APSIM, for irrigated rice in Punjab and Haryana is estimated at 9.0–10.5 Mg ha−1, while average farmer yields of 5.5–6.5 Mg ha−1 imply a yield gap of approximately 20–35% of [23,24]. A landmark study using stochastic frontier analysis of 4107 farmer fields in the NW-IGP found rice yield gaps of approximately 2.7 Mg ha−1 (20% of ), attributed primarily to a technology yield gap of 1.8 Mg ha−1 (15% of ) [24]. Efficiency and resource yield gaps were negligible (<5% of ), indicating that input levels are already high in this region and that further nitrogen increases would not significantly close the yield gap [24].
4.2.3. Rainfed Rice Yield Gap
Rainfed rice—grown on approximately 50% of India’s rice area—shows substantially larger yield gaps. Simulated rainfed potential yield () ranges from 4.5 to 6.5 t ha−1, against average farmer yields of 1.5–2.5 Mg ha−1 in eastern India and Odisha, implying yield gaps of 45–65% [28,51]. Rainfed rice yield gaps of up to 2500 kg ha−1 have been documented [28]. Climate change analysis using the RegCM4 regional climate model projects that mean rainfed rice actual yield will decline from 2.13 Mg ha−1 (historical period 1981–2005) to 1.67 Mg ha−1 during the 2030s and 2040s under RCP 8.5 [51], implying a widening of the rainfed rice yield gap by approximately 20–25%. Key constraints include unreliable rainfall, late transplanting, lack of improved variety adoption in tribal and marginal areas, poor soil fertility management, and biotic stresses including blast, bacterial leaf blight, and brown planthopper [52,53].
4.3. Maize (Zea mays L.)
Maize ranks third among cereals in India, cultivated on 9.0–9.5 Mha across both kharif (summer) and rabi (winter) seasons. The crop serves multiple purposes: food grain, livestock feed, starch, and biofuel feedstock [54]. Major producing states include Karnataka, Telangana, Maharashtra, Bihar, Rajasthan, and Andhra Pradesh. India’s national average maize yield of approximately 2800–3200 kg ha−1 is among the lowest in the world for countries with comparable agricultural development levels, contrasting sharply with potential yields (, i.e., under full irrigation; the rainfed water-limited benchmark for kharif maize is lower and is not separately reported by the cited source) of 8000–11,000 kg ha−1 estimated by Hybrid-Maize model simulations [23,55]. This implies a national yield gap of approximately 60–70%—the largest proportional gap among the cereal crops reviewed.
A detailed study in Telangana’s three agro-climatic zones—Northern, Central, and Southern—found Yield Gap I ( minus progressive farmer yield) highest in the Southern Telangana Zone (STZ) at 1.33 Mg ha−1 and lowest in the Central Telangana Zone (CTZ) at 0.96 Mg ha−1, while Yield Gap II ( minus actual farmer yield) reached 3.34 Mg ha−1 in STZ [15]. Key constraints driving the large maize yield gap include: low adoption of high-yielding hybrid seed (many farmers still grow OPVs or farm-saved hybrid seed); sub-optimal plant population density; zinc deficiency—a widespread soil micronutrient problem across peninsular and central India; susceptibility to waterlogging in kharif that can eliminate 30–50% of yield in poorly drained Vertisols; and pest pressures including fall armyworm (Spodoptera frugiperda), which has spread across India since 2018 [56,57]. Conservation agriculture (CA)—defined as minimum soil disturbance combined with permanent soil cover and crop rotation and distinct from zero tillage (ZT), which refers solely to no-tillage planting, including reduced tillage, residue retention, and maize-legume rotations—has shown promising results for yield gap closure in the IGP maize system [34,58].
4.4. Soybean (Glycine max (L.) Merr.)
Soybean is India’s most important oilseed crop by area, cultivated on approximately 10–12 Mha primarily in Madhya Pradesh (∼52%), Maharashtra (∼25%), and Rajasthan. Despite being among the world’s largest soybean producers by area, India’s productivity is strikingly low [59]. Water-limited yield (; the appropriate benchmark for this predominantly rainfed crop) is estimated at 2000–3500 kg ha−1 from CROPGRO-soybean model simulations [27,60], while the national average yield has been largely stagnant at 900–1100 kg ha−1 for several decades—implying a yield gap of 55–70% [27,59]. Soybean yields were found to be 67% below their water non-limiting potential across the Central Zone [28].
India has five agro-climatic zones for soybean: northern hill, northern plain, north-eastern, central, and southern zones, with zone-specific varieties released [59]. Key constraints include: early-season waterlogging in the heavy clay soils of Vidarbha and MP—a consequence of high-intensity monsoon onset—that reduces germination and early growth; poor Rhizobium inoculation practices (fixing atmospheric nitrogen accounts for 50–70% of soybean’s nitrogen needs, but inoculant use is low); varietal stagnation with old varieties covering 40–50% of area; pest pressure from pod-borer complex; and rainfall distribution mismatch with crop water requirements [60,61].
4.5. Pulses (Chickpea, Pigeonpea, Lentil, Mungbean)
4.5.1. National Production and Yield Gap Overview
India is the world’s largest producer and consumer of pulses, cultivating approximately 28–30 Mha across multiple pulse species. Pulses produced 25.75 million Mg (Tg) in 2021–22, contributing 9% of total food grain production [62]. Pulse productivity in India at approximately 889 kg ha−1 is below the global average of 964 kg ha−1 [62]. Net per capita availability of pulses has declined from 60 g/day in 1951 to approximately 40 g/day currently, driven by stagnant production and rapid population growth [26,63]. India’s pulse requirement is projected at 39 million Mg by 2050 [64]. The gap between demand and supply has been widening, necessitating imports of 2.4 million tonnes in 2021–22 [62].
4.5.2. Chickpea (Cicer arietinum L.)
Chickpea is the most important rabi pulse, cultivated on approximately 9–10 Mha primarily in Madhya Pradesh, Rajasthan, Maharashtra, and UP. India is the largest chickpea-producing country globally, accounting for 64% of world production [65]. Water-limited yield potential estimated from CROPGRO-chickpea ranges from 1500 to 2800 kg ha−1 against average farmer yields of 700–1000 kg ha−1, implying yield gaps of 50–70% [27,66]. Frontline Demonstration (FLD) data from the Tungabhadra command area of Koppal district, Karnataka (2021–23) found demonstration yields of 1340–1425 kg ha−1 against farmer yields of 1120–1202 kg ha−1—a yield gap of 19%, with a technology index of 10.93–16.25% [67]. The technology index in chickpea ranges from 30 to 65% across states [68]. Primary constraints include Fusarium wilt—causing up to 100% yield loss in susceptible varieties—terminal drought stress, poor seed replacement, and inadequate phosphorus nutrition [65,69].
4.5.3. Pigeonpea (Cajanus cajan (L.) Millsp.)
Pigeonpea is grown on approximately 4.5–5.0 Mha in the kharif (summer) season. Extension yield gaps in pigeonpea (demonstration minus farmer yield) range from 470 to 640 kg ha−1 in Himachal Pradesh [68]. Technology gaps of 59–65% have been found in Bundelkhand, where quality seed access, insect damage, and blue bull depredation are major constraints [70]. Improved technology adoption in Himachal Pradesh demonstration programmes raised productivity by 112–129% in pigeonpea [68]. Wilt and sterility mosaic diseases are the most damaging biotic constraints [69] (Figure 4).
Figure 4.
Technology index (%) for pulse crops (chickpea, pigeonpea, lentil) across major Indian states—higher values indicate larger unmet yield potential relative to the 45% reference line [26,65,66,68,69,70].
4.5.4. Lentil and Mungbean
Lentil (Lens culinaris Medik.) is cultivated on approximately 1.5 Mha primarily in UP, MP, and Bihar. Extension yield gaps in lentil range from 277 to 512 kg ha−1 in HP demonstration programmes, with technology gaps of 44.3–60.2% [68]. Short-duration mungbean varieties have proven particularly successful as catch crops in the rice-wheat system, offering gap closure opportunities of 39–82% through improved variety adoption alone [69,71]. Drought remains the main cause of yield reduction across all pulse crops as they are predominantly grown under residual soil moisture without irrigation [69].
4.5.5. Blackgram (Vigna mungo L.)
Blackgram (Vigna mungo L.), commonly known as urd or urad, is an important pulse crop in India, occupying nearly 4 Mha and contributing about 10.25% of total pulse production, with India accounting for more than 70% of global blackgram production. Despite its importance, national average yields remain low (542–662 kg ha−1) compared to attainable yields under improved management. A recent APSIM-based assessment across 20 major blackgram-growing districts revealed substantial yield gaps averaging about 515 kg ha−1, with the highest gaps observed in rainfed Central Zone districts due to erratic rainfall, moisture stress, terminal heat, and low input use. The APSIM model showed high accuracy in simulating potential yields, while analyses identified nutrient-water interactions, soil organic carbon, and yield components as major factors influencing productivity. Blackgram was also found to function as a net carbon sink, highlighting its role in climate-smart agriculture. Major constraints include moisture stress, MYMV disease, insect pests, weed infestation, and poor access to quality seed and improved technologies. The study suggested zone-specific interventions such as disease-resistant varieties, supplemental irrigation, conservation tillage, rainwater harvesting, and integrated pest management to reduce yield gaps and improve productivity and water use efficiency in blackgram cultivation [72].
4.6. Mustard/Rapeseed (Brassica juncea L.)
Indian mustard (Brassica juncea) is the dominant winter oilseed crop, cultivated on approximately 6–7 Mha primarily in Rajasthan (∼46%), Haryana, UP, and MP. The crop occupies a critical position in India’s edible oil self-sufficiency, which remains challenged by a large structural import dependency. Potential yield under optimal management is estimated at 3000–4000 kg ha−1 from experimental data, while the national average yield has languished at 1200–1500 kg ha−1 for over a decade, implying yield gaps of 55–65% [73,74]. Frost injury during podding and seed development—particularly in the Trans-Gangetic plains in January—causes significant yield losses in susceptible varieties [73]. A sustainable intensification study in the Shivalik Himalayan region found mustard seed yield increased by 63.9% over five years with consistent straw residue recycling and raised bed planting [75]. Key limiting factors include: late sowing due to delayed kharif crop harvest (most critical in the IGP where mustard follows rice); sub-optimal plant population; inadequate sulphur nutrition—sulphur deficiency is widespread in Indian soils, and mustard is highly responsive to sulphur application; aphid (Lipaphis erysimi) infestation during reproductive stage; and limited adoption of high-yielding varieties [73,74].
4.7. Cotton (Gossypium hirsutum L. and G. arboreum L.)
India has the world’s largest cotton cultivation area—approximately 11–12 Mha—with major growing states including Maharashtra (Vidarbha), Telangana, Gujarat, Karnataka, and Punjab (irrigated). The introduction of Bt cotton (2002) transformed Indian cotton production, rapidly increasing national yields from approximately 300 kg lint ha−1 to 500–550 kg ha−1 by 2010. However, yields have stagnated or declined since 2015, with increasing pink bollworm resistance to Bt proteins and the spread of sucking pests [76]. Potential seed cotton yield () in irrigated Punjab is estimated at 2800–3200 kg ha−1 against farmer yields of 1800–2200 kg ha−1—a yield gap of approximately 35–45% [15]. In rainfed Vidarbha and Telangana, water-limited yield () is approximately 1500–2000 kg ha−1 against farmer yields of 400–600 kg ha−1—yield gaps of 60–75% [15,28]. Climate sensitivity analysis found a 1 °C rise in minimum temperature increases cotton yield by 20.8%, while a 1 °C rise in maximum temperature decreases yield by 10.3% [77]. Key constraints include erratic rainfall distribution in rainfed systems, pink bollworm resistance, excessive pesticide use disrupting natural enemy populations, micronutrient deficiencies (zinc, boron, iron), and late sowing in rainfed Vidarbha where cotton is sown after the monsoon onset but often on poorly drained Vertisols.
4.8. Sugarcane (Saccharum officinarum L.)
Sugarcane is cultivated on approximately 5.0–5.5 Mha, predominantly in Uttar Pradesh (∼45%), Maharashtra (∼20%), Karnataka, Tamil Nadu, and Andhra Pradesh. India is the world’s second largest sugarcane producer by area and production, yet national average productivity of 70–75 Mg fresh cane ha−1 trails behind global competitors: Brazil achieves 80–85 Mg ha−1 and Australia over 90 Mg ha−1 [6]. Potential yield under optimal management has been estimated at 110–140 Mg ha−1 from CANEGRO and DSSAT model simulations, implying national yield gaps of approximately 35–50% [78]. Late planting—particularly in April and May in UP and Maharashtra where sugarcane is planted after the spring season rather than the recommended October–February plant cane season—is identified as one of the most important causes of low productivity [78]. Machine learning models integrating SAR and optical satellite data (Sentinel-1, Sentinel-2) have achieved 85–90% accuracy in sugarcane yield prediction across UP and Karnataka [79]. Key constraints include: ratoon yield decline (ratoon crop yields 15–25% less than plant cane but is widely practised for cost reasons); inefficient water use (sugarcane consumes 1500–2500 mm water per crop season making it one of the most water-intensive crops in India); delayed harvesting beyond the optimal juice quality window; limited adoption of precision drip irrigation; and poor intercrop management in plant cane [6].
5. Cross-Crop Synthesis and Comparative Analysis
5.1. Yield Gap Magnitude Comparison
Table 1 presents a consolidated summary of yield gap estimates for all eight crops. A clear gradient emerges: commercial and oilseed crops (cotton, maize, soybean, mustard) show the largest proportional yield gaps (55–75%), while irrigated cereals (rice, wheat) in well-infrastructure regions show the smallest gaps (20–42%). Pulses consistently show some of the largest yield gaps nationally (50–70%), reflecting their relegation to marginal, rainfed lands with limited input use [26,27,71]. The comparison underscores that India’s food security challenge is not uniform across crops—targeted interventions for pulses, maize, and soybean offer the greatest proportional gains, while wheat and irrigated rice are approaching yield plateaus in the NW-IGP that require more fundamental physiological or genetic breakthroughs [10,13] (Figure 5 and Figure 6).
Figure 5.
Yield gap (%) across major crops of India—points represent mean estimates; horizontal bars show the reported range across reviewed studies [14,15,23,24,26,27,60,73,78,79].
Figure 6.
Yield gap (%) profile across major crops of India (radar chart)—distance from centre indicates magnitude of yield gap as percentage of potential yield ().
Table 1.
Summary of yield gap estimates for eight major crops of India. = potential yield; = attainable yield; = farmer yield; YG = yield gap (% of or ); irr. = irrigated; rf. = rainfed. † Sugarcane values in t fresh cane ha−1. S = sulphur; N = nitrogen.
5.2. Agro-Climatic Zone Analysis
Yield gap variation across India’s agro-climatic zones is substantial, reflecting differences in soil quality, water availability, input access, cropping system intensity, and farmer capacity. The NW-IGP consistently shows the smallest exploitable yield gaps for cereal crops, driven by strong irrigation infrastructure, access to quality inputs, active extension services, and higher farmer education and capacity levels [47,80]. Conversely, the Eastern IGP—comprising Bihar, eastern UP, Jharkhand, and West Bengal—shows the largest yield gaps for wheat, rice, and pulses, driven by fragmented landholdings, limited irrigation infrastructure, high groundwater depth, and market access constraints [81,82]. Central India—MP, Chhattisgarh, Vidarbha—shows large yield gaps in soybean, cotton, and pulses driven primarily by erratic monsoon rainfall, heavy clay soils prone to waterlogging, and low fertiliser use [42,83]. The Western Arid Zone shows the largest mustard yield gaps due to frost risk and water scarcity. Table 2 presents a zone × crop yield gap matrix summarising these spatial patterns (Figure 7).
Figure 7.
Yield gap (%) by agro-climatic zone and crop across India using six agro-climatic zones (NW-IGP, Eastern IGP, Central India, Peninsular India, Western Arid Zone, Hill/Mountain and North-Eastern Zone)—darker shading indicates larger yield gap; values represent best estimates synthesised from reviewed literature.
Table 2.
Yield gap (%) across eight major crops by agro-climatic zone in India. NW-IGP = North-Western IGP; E-IGP = Eastern IGP; C-India = Central India; Penins. = Peninsular India; W-Arid = Western Arid Zone; Hill/NE = Hill and North-Eastern Zone. Cells showing >60% indicate priority intervention areas [12,14,23,24,26,51,72].
5.3. Food Security Implications of Yield Gap Closure
The food security implications of yield gap closure are substantial. Additional production potential was calculated directly in absolute yield units as , where is the exploitable yield gap taken from the three-tier estimates in Table 1 and Table S1, and f is the assumed closure fraction. Expressing the gap directly as avoids the bias introduced by multiplying farmer yield by a gap percentage that is itself normalised to a higher benchmark yield, which understates the absolute gap by a factor of . If India closes 50% of exploitable yield gaps across the six crops carried forward on a comparable weight basis—wheat, rice, maize, soybean, pulses, and mustard—the additional production would be approximately 100 million tonnes of grain-and-oilseed equivalent annually (Table S10). Cotton and sugarcane are reported separately in Figure 8 rather than summed into this total: cotton lint is not a food-grain-equivalent commodity, and sugarcane is conventionally measured in tonnes of fresh cane (70–90% water content) rather than dry-matter equivalent, so including it directly in a food-grain-equivalent sum would overstate the food-security contribution; a fresh-cane-to-grain-equivalent conversion (e.g., via sugar or dry-biomass content) would be required before sugarcane could be added to this total, and we have not applied one here. This would be achievable without expanding the cultivated area, without additional water withdrawals from groundwater, and without new land under irrigation—representing a true sustainable intensification scenario [2,38]. For context, India’s total food grain production in 2023–24 was a record 332.3 million Mg [7]. This national total counts rice on a milled basis, whereas the gap-closure estimate above expresses rice as unmilled grain, so the two figures are indicative of relative magnitude rather than directly additive. Even a 25% gap closure across these six crops would add an estimated approximately 51 million Mg—equivalent to eliminating India’s annual pulse and oilseed import bill and making India a net exporter of several commodities. These projections directly support India’s national food security goal of 350 million tonnes of food grain production by 2030 [8,84] (Figure 8).
Figure 8.
Additional food production potential (million tonnes) achievable through 25% and 50% yield gap closure across major crops of India without expanding cultivated area.
5.4. Limiting Factor Ranking
Across all eight crops, nitrogen management emerges as the single most important limiting factor, explaining an estimated 25–35% of yield gaps in cereals and oilseeds [21,85,86]. This is consistent with global analyses: Mueller et al. (2012) found that nutrient and water management were key to closing yield gaps globally because yield variability is primarily affected by fertiliser use, irrigation, and climate [21]. Irrigation access and scheduling account for 15–40% of yield gaps in rainfed and semi-irrigated systems [40,87]. Variety adoption rate contributes 10–25%—seed replacement rates in India remain well below recommended levels for all crops except hybrid maize [26,65]. Sowing date deviation from the optimum contributes 10–15%, particularly for wheat (late sowing) and sugarcane (late planting) [11,45]. Soil health degradation—declining SOC, micronutrient deficiencies, salinity—contributes an estimated 5–10% to yield gaps and is the least addressed factor in current extension programmes [43,46]. The data in Table 3 provides a quantitative summary of factor contributions by crop (Figure 9).
Table 3.
Estimated contribution (%) of key limiting factors to yield gaps across eight major crops of India. Values represent approximate percentage of total exploitable yield gap explained by each factor. Columns may not sum to 100% due to interaction effects and study variability [14,21,24,26,30,43,46,72,88]. Ranges were compiled directly from the factor-attribution values reported in the cited primary and review sources (regression-based yield-response studies, stochastic frontier decompositions such as [24], and controlled agronomic trials); where a cited source reported a single point estimate rather than a range, that value was retained as reported without further statistical recalculation. This table is therefore a literature synthesis, not an independently re-estimated multi-factor model; a pooled regression or meta-regression re-estimation across the full study set is identified as a priority extension for future work. Table S4 (Supplementary Materials) reports the corresponding normalised point estimates, rescaled within each crop so that the factor contributions sum to 100%; the hypothesis evaluation in Section 8 uses those normalised values.
Figure 9.
Estimated contribution (%) of key limiting factors to exploitable yield gaps across eight major crops of India.
5.5. A Constraint-Transition Framework Across the Development Gradient
The crop-wise and factor-ranking evidence assembled above (Section 4 and this section) repeatedly surfaces the same limiting factors—water availability, nitrogen management, variety/seed adoption, extension access, and infrastructure—across eight otherwise dissimilar crops. Read individually, these look like eight parallel lists of constraints. Read together, however, they reveal a systematic pattern: which type of constraint dominates shifts predictably with the size of the yield gap itself, suggesting that yield gap closure is better understood as a staged transition between three qualitatively different constraint regimes rather than as a single undifferentiated “limiting factor” problem.
Stage 1—biophysical dominance (large gaps, >60%). In rainfed pulses, cotton, and maize in the semi-arid tropics and Central India (Table 2), water availability and terminal drought/heat stress are consistently reported as the primary constraint (Table 3: irrigation contributes 35–48% of the exploitable gap in pulses and cotton), with nitrogen and variety effects present but secondary. Here the yield gap is dominated by the difference between and -type biophysical ceilings rather than by management or institutional failure—closing it requires water-centred interventions (supplemental irrigation, moisture conservation, drought-tolerant varieties) before agronomic fine-tuning becomes the binding constraint.
Stage 2—agronomic-management dominance (intermediate gaps, 30–60%). In wheat, irrigated cotton, sugarcane, and the better-resourced pulse and mustard production systems, nitrogen management, sowing-date optimisation, and variety replacement rate collectively explain the largest share of the remaining gap (Table 3: N management 25–35% in wheat and mustard; sowing date 14–28% in wheat and sugarcane). Water is no longer the primary limitation—irrigation infrastructure is present—and the gap is instead an agronomic-management and technology-transfer problem, consistent with the YGII (demonstration-to-farmer) gap identified as the dominant erosion point in Section 4 above [26,42].
Stage 3—institutional/socioeconomic dominance (smallest gaps, <35%). In irrigated rice and wheat in the NW-IGP—the most input-intensive, best-infrastructure systems reviewed—the residual gap is small (20–35%) and increasingly attributed to factors that are not primarily agronomic: the stochastic frontier decomposition of Van Oort et al. [24] found efficiency and resource gaps below 5% of once the technology gap was accounted for, and the smallholder- and gender-linked constraints discussed in Section 4 and Section 6.3 (land tenure, credit access, extension contact) become proportionally more important as the biophysical and agronomic gaps close. This is consistent with these systems approaching a ‘ceiling pressure’ regime [13] in which further gains depend on institutional delivery and, ultimately, genetic/physiological breakthroughs rather than incremental management change.
This staged pattern is necessarily descriptive rather than causally established—the review design (narrative synthesis of heterogeneous secondary studies) cannot formally test whether constraint type shifts as a consequence of gap closure or is simply correlated with it across different crop-zone combinations observed at one point in time. We present it as a conceptual organising framework for future primary research (e.g., panel studies tracking the same crop-zone system as its yield gap narrows over time) rather than as a validated causal model, and suggest that irrigated/rainfed status and development stage, rather than crop identity alone, may be a more informative axis for future synthesis.
6. Novel Dimensions in India’s Yield Gap Analysis
6.1. Remote Sensing and Satellite-Based Yield Gap Mapping
Remote sensing (RS) has emerged as a transformative methodology for scaling yield gap analysis from plot and district to regional and national levels. The fundamental advantage of satellite-based approaches is the ability to generate spatially continuous, temporally dense yield maps that reveal spatial heterogeneity invisible to point-based survey methods [30]. In India, multiple satellite platforms provide complementary information: MODIS (250 m, 8-day composites) provides national-scale vegetation indices; Sentinel-2 (10–20 m, 5-day revisit) enables district-scale LAI and biomass estimation; INSAT-3D (4 km) provides radiation inputs; and IRS Resourcesat-2 (LISS-III) supports the government’s FASAL (Forecasting Agricultural output using Space, Agro-meteorology and Land based observations) programme [31].
A landmark multi-satellite fusion study using Sentinel-2, MODIS, and INSAT-3D estimated yields for wheat, cotton, and rice at gram panchayat (GP) and taluka level using a radiation-use efficiency semi-physical model [31]. Root mean square error (RMSE) was 5.8% for wheat at district level and 15% for rice at GP level—sufficient precision for yield gap mapping at administrative unit scales. NASA-supported research demonstrated that satellite imagery could identify nitrogen deficiency as a major spatial driver of yield gaps in Indian wheat fields, with on-farm nitrogen management explaining a large fraction of the spatial variability in remote sensing-derived yield estimates [29]. Paliwal et al. (2023) used microsatellite data to show that yield differences between smallholder fields in India persist across multiple years [30], indicating that the drivers of field-level yield gaps are structural (soil quality, farm resources, management capacity) rather than random (weather). This finding has critical implications for targeting extension and input delivery programmes. The integration of RS-derived yield gap maps with administrative databases of input delivery, credit access, and extension coverage could enable the first spatially explicit, field-scale yield gap targeting system for India.
6.2. Soil Health Card Programme and Soil-Yield Gap Nexus
India’s Soil Health Card (SHC) scheme, launched in 2015, represents the world’s largest government-led soil monitoring and advisory programme. By 2023, over 23.5 crore SHCs had been issued to farmers across India through a network of over 8000 soil testing laboratories, including static, mobile, mini, and village-level units. Each SHC provides farmers with individualised soil assessments including pH, electrical conductivity, organic carbon, and macro- and micronutrient profiles, alongside crop-specific fertiliser recommendations. The scheme has been shown to enhance nutrient use efficiency and reduce agriculture’s carbon footprint through more targeted fertiliser application [89].
The connection between soil health and yield gaps is deeply important and under-explored. Nearly 32% of India’s agricultural land is classified as degraded and 25% faces desertification [90]. Declining soil organic carbon (SOC) below 0.5% in sandy IGP soils and below 0.3% in many Rajasthani and Gujarati soils reduces nitrogen retention, water-holding capacity, and microbial activity—all of which contribute directly to yield gap widening [43,46]. The SHC scheme, for the first time, creates a district-level spatial database of soil health parameters that could be overlaid with yield gap estimates to identify regions where soil degradation is the primary driver of poor farmer yields. At present, however, this potential remains conceptual: to our knowledge, no published study has yet released a district-level, SHC-linked SOC/micronutrient dataset paired with matching yield-gap estimates for the six agro-climatic zones used in this review, and the reviewed literature [43,46,47] reports SOC thresholds and yield-gap direction qualitatively rather than as a jointly tabulated, zone-resolved statistical relationship. We therefore present this as an explicit evidence gap rather than a quantified coupling, and outline the analytical workflow needed to close it: (i) acquire anonymised, aggregated SHC soil-test records at district level from the Department of Agriculture and Farmers Welfare SHC portal; (ii) classify districts into SOC/available-N/P/K/micronutrient tertiles within each of the six agro-climatic zones; (iii) join this classification to district-level yield-gap estimates (Table 1) using a common district identifier (Census 2011 LGD codes); (iv) test the SOC-tertile × yield-gap association within zone using a mixed-effects model with zone as a random effect, to separate the soil signal from zone-level confounding (irrigation, market access); (v) validate against the independent case-study evidence available for central India soybean and Indo-Gangetic Plain wheat. Systematic integration of SHC data with crop yield statistics and agro-climatic zone maps represents a high-priority analytical task that could transform soil-targeted extension in India and is identified as a priority for a dedicated follow-up analysis. Conservation agriculture practices—zero tillage, residue retention, crop diversification—have been shown to improve SOC and reduce yield gaps simultaneously, offering a co-benefit pathway [33,34,58] (Figure 10).
Figure 10.
Relationship between soil organic carbon (%) and wheat yield gap (%) across major Indian states—bubble size = wheat cultivated area (Mha); orange zone = low SOC risk.
6.3. Gender Yield Gap in Indian Agriculture
Gender inequality in Indian agriculture is a deeply structural issue with direct implications for yield gaps. Women constitute approximately 60–80% of the agricultural labour force in India but have significantly restricted access to land ownership, formal credit, quality seeds, fertilisers, extension services, and market information [91]. CGIAR evidence from smallholder farming systems in developing countries demonstrates that plots managed by women yield 20–30% less than those managed by men, driven primarily by restricted access to productive resources and assets rather than differences in farming knowledge or effort [32]. Social Institutions and Gender Inequality (SIGI) indicators document that discriminatory social institutions perpetuate these resource access gaps across South Asia [32].
In India, income is highly unequally distributed among farm households, with a Gini coefficient of 0.48 in Punjab—one of India’s most agriculturally productive states—where marginal farm households have an annual economic surplus of only Rs 8890 per capita after meeting consumption needs [88]. Women farmers face compounded disadvantages: smaller average landholding, exclusion from formal credit, limited mobility to access input markets and extension offices, and underrepresentation in farmer producer organisations (FPOs). Gender-targeted agricultural programmes in India—including the Mahila Kisan Sashaktikaran Pariyojana (MKSP)—have shown positive impacts on women’s access to improved seeds and practices, but coverage remains limited [91]. This section—unlike the crop-wise analyses in Section 4—is a synthesis of the (largely non-Indian) gender–agriculture literature rather than a quantitative decomposition of Indian gender yield gaps by crop and zone; we did not identify, within the 107 studies meeting our inclusion criteria, a sufficient number of India-specific studies reporting sex-disaggregated plot-level yields to construct such a decomposition without extrapolating beyond the evidence. Table 4 sets out the decomposition structure—the four resource-constraint channels through which gender differentials are hypothesised to act on yield gaps, following [32,91]—as a framework for future crop- and zone-specific quantification once sex-disaggregated national surveys (e.g., an ICAR- or NSSO-coordinated plot-level module) become available, rather than as populated results.
Table 4.
Proposed decomposition framework for gender yield gaps in Indian agriculture, showing the resource-constraint channels through which gender differentials are hypothesised to act, and the data currently available to populate each channel. This is a conceptual framework, not a set of quantified results.
No existing yield gap review for India has explicitly quantified the gender dimension; doing so requires sex-disaggregated plot-level yield data that are only beginning to be collected systematically by ICAR and international organisations.
6.4. Conservation Agriculture and Yield Gap Closure
Conservation agriculture (CA)—combining minimum soil disturbance (zero or reduced tillage), permanent soil organic cover (crop residue retention or cover crops), and diversified crop rotations—offers one of the most promising pathways for simultaneously closing yield gaps and building climate resilience in Indian agriculture [34,58]. A comprehensive 2024 study evaluated CA impacts on soil carbon sequestration and crop productivity across IGP farming systems over 3–5 year periods [33]. Zero-till direct-seeded rice (ZT-DSR) combined with residue retention in the western IGP significantly improved SOC while maintaining or improving crop yields, with GHG emission reductions of 15–25% [92].
Large-scale on-farm demonstration data from Bihar provide compelling evidence: 44,476 demonstrations across 38 project hubs and four agro-climatic zones of Bihar (2019–2022) showed that zero tillage, direct-seeded rice, timely sowing, and legume integration together improved crop productivity, profitability, resource-use efficiency, and overall sustainability of rice-wheat-mungbean systems [86]. Rice straw burning—a major sustainability problem in the IGP affecting over 80% of straw in Punjab and Haryana [93]—can be eliminated through CA residue retention, which also improves soil nitrogen cycling and reduces the input yield gap. Mustard seed yield increased by 63.9% over five years with straw residue recycling [75]. Sharma and Behera (2009) demonstrated that legume residue recycling in maize–wheat systems improved nitrogen cycling and reduced yield gaps while reducing fertiliser requirements [94].
6.5. Farm-Size Structural Yield Gap
India’s agricultural structure is dominated by smallholders: of approximately 146 million farm holdings, 86% are smaller than 2 ha, and 67% are below 1 ha [35]. This extreme fragmentation creates structural yield gaps that persist regardless of technology availability: small farms face diseconomies of scale in mechanisation, higher per-unit input costs due to limited bargaining power, difficulty accessing formal credit and insurance, and reduced capacity to adopt precision agronomic practices [30,88]. Microsatellite data analysis showed that yield differences between fields persist for multiple years in smallholder systems—indicating structural rather than weather-driven causes [30]. The ‘last-mile delivery’ challenge—getting quality seeds, balanced fertilisers, and agronomic advisory to remote smallholders in time for appropriate planting—is perhaps the most fundamental barrier to yield gap closure in Indian agriculture [95] (Figure 11).
Figure 11.
Yield (t ha−1) by farm size category across six major crops of India—smallholder farms consistently achieve lower yields than medium and large farms.
Structured last-mile interventions have shown promise: Bayer’s Better Life Farming (BLF) programme, operating through 2700 centres serving approximately 1 million smallholders across India, reported that 90% of enrolled farmers in UP and Jharkhand achieved increased crop production and 87% reported higher income [95]. Farmer producer organisations (FPOs), digital agricultural platforms (eNAM, Kisan Suvidha), and mobile-based agro-advisory services represent scalable pathways for addressing the last-mile problem and narrowing the smallholder yield gap.
7. Climate Change and Future Yield Gap Trajectories
7.1. Observed Climate Trends and Current Impacts
India’s agriculture is already experiencing the effects of climate change through multiple channels: rising mean temperatures, increased frequency and severity of extreme heat events, changing monsoon patterns including both droughts and extreme rainfall events, and rising atmospheric CO2 [96,97]. A rising trend in annual and seasonal mean maximum and minimum temperatures has been observed across all four agro-climatic zones of the Gangetic Plains from 1966 to 2011, while rainfall shows a declining trend [77]. Overall, climate change has adversely impacted crop yields across India, with the magnitudes varying spatially and by crop [98,99].
The 2024 global yield gap time series study, covering 1975–2010 for ten major crops, identified India’s wheat and rice zones as experiencing ‘ceiling pressure’—where attainable yields are stagnating while actual yields approach the attainable ceiling—a pattern the authors show correlates with subsequent yield stagnation [13]. Rice has 84% of its area and wheat has 56% of its area experiencing this ‘ceiling pressure’ globally—a warning signal for food security [13].
7.2. Projected Yield Gap Changes Under Climate Scenarios
The Global Gridded Crop Model Intercomparison (GGCMI) project has generated crop yield projections for major crops including wheat, rice, maize, and soybeans until 2100 based on CMIP6 experimental designs [100,101]. Under the high-emission scenario (SSP585/RCP 8.5), crop productivity losses are predominantly projected in low-latitude areas—which includes large parts of peninsular and central India—posing risks for Indian food security [101].
For rice, simulated rainfed actual yield is projected to decline from 2.13 Mg ha−1 (historical 1981–2005) to 1.67 Mg ha−1 during the 2030s–2040s under RCP 8.5 [51], implying the rainfed rice yield gap widens by approximately 20–25% under business-as-usual emissions. A mean rainfed yield gap of 1.49 Mg ha−1 is projected under future climate [51]. For wheat, terminal heat stress during grain filling (March–April) is the primary climate risk: Asseng et al. (2015) showed that each 1 °C increase in temperature reduces global wheat yield by 6% on average [48], and Indian wheat is particularly vulnerable given its production concentrated in the March–April harvest window. Pathak et al. (2003) showed a yield of both rice and wheat in the IGP that already declined 5–10% from 1990 to 2002 due to climate change [11].
For maize, yields are projected to increase in cooler northern zones (6% increase in Lower Gangetic Plains by 2050s) but the hotter peninsular zones face increasing heat stress during grain filling [77]. For soybean, GGCMI/CMIP6 ensemble projections place the largest productivity losses in low-latitude production regions, which include the central Indian soybean belt [100,101]; we do not report a single-value temperature sensitivity coefficient for Indian soybean, having identified no India-specific study reporting one within the included literature. For cotton, contrasting effects are projected: a 1 °C rise in minimum temperature increases cotton yield by 20.8%, but a 1 °C rise in maximum temperature decreases yield by 10.3% [77]. Rapeseed/mustard yield gains of 3.8% are projected in Trans-Gangetic Plains by 2050 [77], though frost risk to pods remains a concern under erratic cold spells. Table 5 provides a crop-wise quantitative summary of baseline yield gaps and their projected changes under RCP 4.5 and RCP 8.5. We note explicitly that each row of Table 5 is derived from a single regional climate model or a single crop-climate sensitivity study (cited in the final column) rather than from a CMIP6 multi-model ensemble mean; consequently, the RCP 4.5 and RCP 8.5 columns should be read as illustrative, literature-anchored scenarios rather than as formal ensemble projections with defined confidence intervals. Where the underlying studies separately reported temperature and rainfall effects (e.g., the 1.5–3.0% °C−1 wheat heat-stress sensitivity of [48,49], and the contrasting +20.8%/−10.3% cotton / response of [77]), these are reported alongside the composite projections in Table 5 so that the temperature-driven component can be distinguished from rainfall-variability and adaptation effects; a formal multi-model, multi-driver decomposition using GGCMI/CMIP6 ensemble output is identified as a priority for future work rather than attempted here from single-model sources. The two-pathway adaptation contrast—no adaptive measures versus widespread conservation agriculture and heat-tolerant varieties—is addressed qualitatively in Section 7.3, where individual adaptation measures are linked to specific gap-closure ranges (e.g., a single supplemental irrigation at flowering closing 20–30% of the rainfed pulse gap); a quantitative combined scenario would require running these measures through the same climate model used for the baseline projection, which is beyond the literature-synthesis scope of this review.
Table 5.
Projected changes in yield gap (%) under climate change scenarios for major crops of India. Baseline = observed yield gap under current climate (2000–2023). RCP 4.5 and RCP 8.5 projections are for the 2040–2060 period. Positive change (+) indicates yield gap widening. pp = percentage points change from baseline. Each row is derived from the single regional climate model or crop-climate sensitivity study cited in the final column (not a CMIP6 multi-model ensemble); values should therefore be read as literature-anchored illustrative scenarios rather than formal ensemble projections with defined uncertainty bounds.
7.3. Climate Adaptation and Yield Gap Closure
Climate adaptation strategies can both prevent yield gap widening and contribute to gap closure. Key strategies include: (i) adjusted sowing windows—advancing wheat sowing in the IGP by 10–15 days reduces heat stress exposure and can recover 200–500 kg ha−1 of yield; (ii) development and adoption of heat-tolerant, drought-tolerant, and early-maturing varieties across all eight crops; (iii) residue mulching to moderate soil temperature extremes and conserve moisture; (iv) supplemental irrigation during critical growth stages for rainfed systems—even a single irrigation of 50–60 mm at flowering stage can close 20–30% of the rainfed pulse yield gap [69,71]; (v) crop diversification to reduce reliance on temperature-sensitive crops during vulnerable seasons [102]; (vi) precision agro-meteorological advisory services that provide farmers with real-time, location-specific guidance on sowing dates, irrigation scheduling, and pest management based on weather forecasts [97].
8. Strategies for Sustainable Yield Gap Closure
8.1. Agronomic Interventions
Improving nitrogen management is the highest-priority agronomic intervention across all crops. Soil-test-based nitrogen recommendations—using either traditional soil testing or the new Leaf Colour Chart (LCC) and Soil Plant Analysis Development (SPAD) meter-based in-season nitrogen management tools—can improve nitrogen use efficiency by 15–25% while maintaining or improving yields [24,43]. Nano urea and polymer-coated slow-release urea products, evaluated under conservation tillage in the IGP, show comparable yields with reduced N application [44]. Integrated nutrient management combining organic inputs (FYM, green manures, crop residues) with inorganic fertilisers—particularly to address micronutrient deficiencies in zinc, sulphur, and boron that are widespread across India [103]—can close 5–15% of the yield gap attributable to soil health decline and declining soil organic carbon in rainfed systems [46,83,104].
Optimising sowing windows—advancing wheat sowing in the IGP, ensuring timely rice transplanting within the recommended monsoon onset window, planting sugarcane in October–February rather than April–May, and using pre-monsoon or early-monsoon kharif sowing dates for maize—can add 10–20% to farmer yields without any additional input costs [11,45]. Increasing seed replacement rates—particularly through quality seed distribution at subsidised rates for pulses, soybean, and mustard—is one of the most cost-effective interventions for yield gap closure, with potential gains of 10–20% in these crops [26,65]. Micro-irrigation expansion through drip and sprinkler systems is critical for cotton, sugarcane, and mustard, where conventional flood irrigation wastes 30–50% of water while causing soil physical degradation [6].
8.2. Policy and Institutional Interventions
Policy interventions need to be spatially targeted based on zone-specific yield gap analysis. The Eastern IGP—Bihar, eastern UP, Jharkhand—emerges as the highest-priority zone for policy intervention, with large yield gaps across wheat, rice, and pulses driven partly by institutional failures rather than agronomic knowledge gaps [26,81]. The potential and challenges of rainfed farming in India—which dominates the Eastern IGP and Central India—have been comprehensively assessed, underscoring the need for targeted policy support to bridge the resource access gap [105] (Figure 12).
Figure 12.
Spatial heterogeneity in yield gap (%), dominant agronomic constraints, pulse technology index (%), and soil organic carbon (%) across Indian states and agro-climatic zones.
Key policy priorities include: (i) strengthening district-level extension staffing and transitioning to ICT-based agro-advisory services (SMS, mobile apps, digital kiosks) for last-mile delivery [95]; (ii) pulse mission expansion with subsidised quality seed distribution and assured minimum support prices to incentivise pulse cultivation on marginal lands [64]; (iii) integrating Soil Health Card recommendations into the fertiliser subsidy system—making subsidy access contingent on SHC-based nutrient management—to improve fertiliser use efficiency nationally; (iv) gender-sensitive agriculture programmes ensuring women farmers receive equal access to extension services, credit, and quality inputs [91]; (v) promoting conservation agriculture through zero-tillage equipment subsidies and crop residue management incentives in the IGP [34,58].
8.3. Technology and Innovation Pathways
Precision agriculture technologies are increasingly viable for smallholder systems as smartphone penetration exceeds 60% in rural India. Machine learning models integrating SAR and optical satellite data can now predict crop yields at field scale [31,79], enabling precision advisory services that recommend variable-rate inputs based on within-field yield gap analysis. The FASAL programme’s district-level yield forecasts, combined with RS-derived spatial yield gap maps, could enable the targeting of government schemes (seed subsidies, irrigation investments, credit) to districts with the largest exploitable yield gaps. Genomic breeding for heat tolerance, drought tolerance, and nitrogen use efficiency—particularly in pulses, cotton, and soybean where the current variety pipeline is thin—is essential for preventing yield gap widening under climate change [65,106]. Farmer producer organisations (FPOs) and e-commerce platforms can reduce transaction costs for input procurement and market access, addressing the smallholder structural yield gap [95].
9. Conclusions
9.1. Hypothesis Testing
We report these findings as literature-consistent patterns rather than statistically tested hypothesis confirmations since the underlying evidence base is a narrative synthesis of heterogeneous studies rather than a single pooled dataset amenable to formal hypothesis testing. H1—Rainfed and semi-arid zone yield gaps (55–75% in pulses, maize, cotton, and mustard) were consistently larger in the reviewed literature than irrigated NW-IGP gaps (20–42% in wheat and rice), a pattern consistent with the hypothesis across all eight crops. H2—Evaluated as formulated, nitrogen management and irrigation access together were attributed 40–58% of the exploitable yield gap across the eight crops (mean 49%; Table S4). The hypothesised 50% threshold was exceeded in rice (53%), soybean (53%), pulses (52%), and cotton (58%), but not in wheat (45%), maize (45%), mustard (47%), or sugarcane (40%). H2 is therefore only partially consistent with the reviewed evidence, and the two-factor formulation does not hold across all crops as originally stated. When variety adoption and sowing-date deviation are included, these four factors together account for 80–85% of the attributed gap (mean 82%), indicating that the limiting-factor structure of Indian yield gaps is better described by a four-factor than a two-factor decomposition. H3—Closing 50% of exploitable gaps across the six crops carried forward on a comparable weight basis was estimated—from reported yields and areas—to add approximately 100 million tonnes of grain-and-oilseed equivalent annually without land expansion; this is an arithmetic scenario projection rather than a validated forecast and is consistent with the hypothesis. H4—Climate change under RCP 8.5 is projected—based on the single-model sources summarised in Table 5—to widen rainfed rice yield gaps by 15–30% by the 2040s relative to the 1981–2005 baseline, which is consistent with and exceeding the hypothesised 15% threshold, though we note this rests on single-model projections rather than a multi-model ensemble. H5—Smallholder and women farmers are reported in the reviewed literature to exhibit structurally larger yield gaps across several crops and regions, which is attributable to restricted access to inputs, credit, extension services, and productive resources; as discussed above, the gender component of this pattern is supported by non-India evidence and qualitative Indian evidence rather than a quantified India-specific decomposition.
9.2. Principal Conclusions
- Yield gaps are large and persistent: Irrigated wheat and rice in the NW-IGP carry gaps of 20–42%, while rainfed pulses, maize, cotton, and mustard show gaps of 55–75%. Blackgram alone averages a 515 kg ha−1 gap across 20 districts, underscoring the severity of underperformance in rainfed systems.
- Management factors dominate the exploitable gap: Nitrogen management, irrigation, improved variety adoption, and optimised sowing dates together explain 80–85% of exploitable yield gaps, with nitrogen and irrigation alone accounting for 40–58%, thus identifying these as the highest-priority intervention targets for extension and policy.
- Yield gap closure offers substantial food security gains: Closing 50% of exploitable gaps across the six crops carried forward on a comparable weight basis (wheat, rice, maize, soybean, pulses, mustard) could deliver approximately 100 million tonnes of additional grain-and-oilseed equivalent annually without agricultural land expansion, which is an arithmetic scenario estimate that would contribute towards SDG 2 (Zero Hunger).
- Climate change poses an escalating threat to rainfed systems: Under RCP 8.5, rainfed rice yield gaps are projected to widen by 15–30% by the 2040s, necessitating urgent integration of climate adaptation strategies alongside conventional gap-closure interventions.
- Critical analytical dimensions remain under-researched: Remote sensing-based gap mapping, Soil Health Card data integration, gender-disaggregated yield analysis, conservation agriculture adoption, and farm-size effects on productivity represent significant gaps in the current evidence base that future research must address.
- Smallholder structural disadvantage is the most persistent cross-cutting driver. Restricted access to inputs, credit, mechanisation, and advisory services systematically elevates yield gaps among smallholders—a pattern with direct India-specific quantitative support in the reviewed literature (Section 4); the gender dimension of this disadvantage is supported by non-Indian and qualitative Indian evidence, rather than an India-specific quantitative decomposition (Section 6.3), across all crops and agro-climatic zones, thus requiring targeted policy and institutional responses.
- Research and Policy Priorities. National remote sensing-based yield gap monitoring, spatial integration of Soil Health Card data with district-level gap estimates, mandatory gender-disaggregated data collection in national crop surveys, and development of zone-specific yield gap closure roadmaps linked to PM-KISAN, NFSM, and PMFBY delivery mechanisms are identified as priorities for translating synthesis findings into measurable field-level impact.
Supplementary Materials
The following supporting information can be downloaded at: https://www.mdpi.com/article/10.3390/land15081453/s1.
Author Contributions
P.G.D.: Conceptualisation, Formal analysis, Methodology, Writing—original draft. R.S.B.: Conceptualisation, Methodology, Writing—review and editing. Y.B.: Methodology, Formal analysis, Writing—review and editing. A.S.: Investigation, Data curation, Writing—review and editing. P.S.B.: Investigation, Data curation. K.L.: Writing—review and editing. H.O.: Writing—review and editing. T.J.: Investigation, Data curation, Visualisation. C.S.R.: Methodology, Review and Editing. R.L.: Conceptualisation, Review and Editing. All authors have read and agreed to the published version of the manuscript.
Funding
This research received no external funding.
Data Availability Statement
No new data were created or analysed in this study. Data sharing is not applicable to this article.
Acknowledgments
The authors thank ICAR–Indian Agricultural Research Institute for institutional support and the anonymous reviewers for their constructive comments. During the preparation of this manuscript, the authors used Grammarly (https://www.grammarly.com) to assist with grammar, spelling, and language clarity. The authors subsequently reviewed and edited the content to ensure accuracy and take full responsibility for the final version of the manuscript.
Conflicts of Interest
The authors declare no conflicts of interest.
Abbreviations
The following abbreviations are used in this manuscript:
| APSIM | Agricultural Production Systems sIMulator |
| CA | Conservation Agriculture |
| DSSAT | Decision Support System for Agrotechnology Transfer |
| E-IGP | Eastern Indo-Gangetic Plain |
| FAO | Food and Agriculture Organization |
| FLD | Frontline Demonstration |
| GYGA | Global Yield Gap Atlas |
| ICAR | Indian Council of Agricultural Research |
| IGP | Indo-Gangetic Plain |
| NW-IGP | North-Western Indo-Gangetic Plain |
| PRISMA | Preferred Reporting Items for Systematic Reviews and Meta-Analyses |
| RCP | Representative Concentration Pathway |
| SDG | Sustainable Development Goal |
| SHC | Soil Health Card |
| SOC | Soil Organic Carbon |
| TG | Technology Gap |
| Ya | Attainable Yield |
| Yf | Farmer Yield |
| YG | Yield Gap |
| YGII | Yield Gap II |
| YGI | Yield Gap I |
| Yp | Potential Yield |
| Yw | Water-limited Yield |
| ZT-DSR | Zero-Till Direct-Seeded Rice |
References
- FAO. The State of Food and Agriculture 2018: Migration, Agriculture and Rural Development; Food and Agriculture Organization of the United Nations: Rome, Italy, 2018. [Google Scholar]
- Foley, J.; Ramankutty, N.; Brauman, K.; Cassidy, E.; Gerber, J.; Johnston, M.; Mueller, N.; O’Connell, C.; Ray, D.; West, P.; et al. Solutions for a cultivated planet. Nature 2011, 478, 337–342. [Google Scholar] [CrossRef] [Scilit] [PubMed]
- Tilman, D.; Balzer, C.; Hill, J.; Befort, B. Global food demand and the sustainable intensification of agriculture. Proc. Natl. Acad. Sci. USA 2011, 108, 20260–20264. [Google Scholar] [CrossRef] [Scilit]
- Godfray, H.; Beddington, J.; Crute, I.; Haddad, L.; Lawrence, D.; Muir, J.; Pretty, J.; Robinson, S.; Thomas, S.; Toulmin, C. Food security: The challenge of feeding 9 billion people. Science 2010, 327, 812–818. [Google Scholar] [CrossRef] [Scilit] [PubMed]
- FAO. FAOSTAT Statistical Database; Food and Agriculture Organization of the United Nations: Rome, Italy, 2023. [Google Scholar]
- DES. Crop Production Statistics; Department of Economic Statistics, Ministry of Agriculture and Farmers Welfare, Government of India: New Delhi, India, 2024.
- Ministry of Agriculture and Farmers Welfare. Final Estimates of Major Agricultural Crops 2023–24; Press Information Bureau, Government of India: New Delhi, India, 2024.
- NITI Aayog. State of Agriculture in India; Government of India: New Delhi, India, 2021.
- Chand, R. Demand for food grains. Econ. Polit. Wkly. 2007, 42, 10–13. [Google Scholar]
- Grassini, P.; Eskridge, K.; Cassman, K. Distinguishing between yield advances and yield plateaus in historical crop production trends. Nat. Commun. 2013, 4, 2918. [Google Scholar] [CrossRef] [Scilit] [PubMed]
- Pathak, H.; Ladha, J.; Aggarwal, P.; Peng, S.; Das, S.; Singh, Y.; Singh, B.; Kamra, S.; Mishra, B.; Sastri, A.; et al. Trends of climatic potential and on-farm yields of rice and wheat in the Indo-Gangetic Plains. Field Crops Res. 2003, 80, 223–234. [Google Scholar] [CrossRef] [Scilit]
- Madhukar, A.; Pradhan, R.; Lalrammawia, C.; Parihar, C. Spatial and temporal trends in the yields of three major crops: Wheat, rice and maize in India. Int. J. Plant Prod. 2019, 14, 29–41. [Google Scholar] [CrossRef] [Scilit]
- Gerber, J.; Ray, D.; Makowski, D.; Butler, E.; Mueller, N.; West, P.; Johnson, J.; Polasky, S.; Samberg, L.; Siebert, S.; et al. Global spatially explicit yield gap time trends reveal regions at risk of future crop yield stagnation. Nat. Food 2024, 5, 125–135. [Google Scholar] [CrossRef] [Scilit] [PubMed]
- Sendhil, R.; Singh, R.; Ramasundaram, P.; Kumar, A.; Singh, S.; Sharma, I. Yield gap in wheat: Approach, quantification and resetting research priorities in India. J. Wheat Res. 2014, 6, 138–149. [Google Scholar]
- Agrawal, P.K.; Hebbar, K.B.; Venugopalan, M.V.; Rani, S.; Bala, A.; Biswal, A.; Wani, S.P. Quantification of Yield Gaps in Rain-fed Rice, Wheat, Cotton and Mustard in India: Global Theme on Agroecosystems Report No. 43; Patancheru 502 324; International Crops Research Institute for the Semi-Arid Tropics: Andhra Pradesh, India, 2008; pp. 1–36. [Google Scholar]
- Lobell, D.; Cassman, K.; Field, C. Crop yield gaps: Their importance, magnitudes, and causes. Annu. Rev. Environ. Resour. 2009, 34, 179–204. [Google Scholar] [CrossRef] [Scilit]
- van Ittersum, M.; Cassman, K.; Grassini, P.; Wolf, J.; Tittonell, P.; Hochman, Z. Yield gap analysis with local to global relevance—A review. Field Crops Res. 2013, 143, 4–17. [Google Scholar] [CrossRef] [Scilit]
- van Ittersum, M.; Rabbinge, R. Concepts in production ecology for analysis and quantification of agricultural input-output combinations. Field Crops Res. 1997, 52, 197–208. [Google Scholar] [CrossRef] [Scilit]
- Grassini, P.; van Bussel, L.; Van Wart, J.; Wolf, J.; Claessens, L.; Yang, H.; Boogaard, H.; de Groot, H.; van Ittersum, M.; Cassman, K. How good is good enough? Data requirements for reliable crop yield simulations and yield-gap analysis. Field Crops Res. 2015, 177, 49–63. [Google Scholar] [CrossRef] [Scilit]
- Cassman, K. Ecological intensification of cereal production systems: Yield potential, soil quality, and precision agriculture. Proc. Natl. Acad. Sci. USA 1999, 96, 5952–5959. [Google Scholar] [CrossRef] [Scilit] [PubMed]
- Mueller, N.; Gerber, J.; Johnston, M.; Ray, D.; Ramankutty, N.; Foley, J. Closing yield gaps through nutrient and water management. Nature 2012, 490, 254–257. [Google Scholar] [CrossRef] [Scilit] [PubMed]
- Jones, J.; Hoogenboom, G.; Porter, C.; Boote, K.; Batchelor, W.; Hunt, L.; Wilkens, P.; Singh, U.; Gijsman, A.; Ritchie, J. The DSSAT cropping system model. Eur. J. Agron. 2003, 18, 235–265. [Google Scholar] [CrossRef] [Scilit]
- Global Yield Gap Atlas—GYGA. India—Global Yield Gap Atlas; Wageningen University & Research: Wageningen, The Netherlands, 2024. [Google Scholar]
- Nayak, H.S.; Silva, J.V.; Parihar, C.M.; Kakraliya, S.K.; Krupnik, T.J.; Bijarniya, D.; Jat, M.L.; Sharma, P.C.; Jat, H.S.; Sidhu, H.S.; et al. Rice yield gaps and nitrogen-use efficiency in the Northwestern Indo-Gangetic Plains of India: Evidence based insights from heterogeneous farmers’ practices. Field Crops Res. 2022, 275, 108328. [Google Scholar] [CrossRef] [Scilit]
- Magombeyi, M.S.; Taigbenu, A.E.; Barron, J. Effectiveness of agricultural water management technologies on rainfed cereals crop yield and runoff in semi-arid catchment: A meta-analysis. Int. J. Agric. Sustain. 2018, 16, 418–441. [Google Scholar] [CrossRef] [Scilit]
- Singh, M. Yield gap analysis in rice, wheat and pulses in India. Ann. Agric. Res. 2014, 33. [Google Scholar]
- ICRISAT. Yield Gap Analysis of Soybean, Groundnut, Pigeonpea and Chickpea in India Using Simulation Modelling; Global Theme on Agroecosystems Report No. 31; International Crops Research Institute for the Semi-Arid Tropics: Patancheru, India, 2004. [Google Scholar]
- ICRISAT. Yield Gaps in Rain-fed Rice, Wheat, Cotton and Mustard in India; Global Theme on Agroecosystems Report No. 43; International Crops Research Institute for the Semi-Arid Tropics: Hyderabad, India, 2007. [Google Scholar]
- Pazhanivelan, S.; Kumaraperumal, R.; Vishnu Priya, M.; Rengabashyam, K.; Shankar, K.; Nivas Raj, M.; Yadav, M.K. Multi-Temporal analysis of cropping patterns and intensity using optical and SAR satellite data for sustaining agricultural production in Tamil Nadu, India. Sustainability 2025, 17, 1613. [Google Scholar] [CrossRef] [Scilit]
- Paliwal, A.; Poonia, S.; Jain, M. Using microsatellite data to estimate the persistence of field-level yield gaps in smallholder systems. Sci. Rep. 2023, 13, 11170. [Google Scholar] [CrossRef] [Scilit] [PubMed]
- Tripathy, R.; Chaudhari, K.N.; Bairagi, G.D.; Pal, O.; Das, R.; Bhattacharya, B.K. Towards fine-scale yield prediction of three major crops of India using data from multiple satellite. J. Indian Soc. Remote Sens. 2022, 50, 271–284. [Google Scholar] [CrossRef] [Scilit]
- Nchanji, E.; Collins, O.; Katungi, E.; Karanja, D.; Wozemba, D.; Pamba, S. What does gender yield gap tell us about smallholder farming in developing countries? Sustainability 2021, 13, 77. [Google Scholar] [CrossRef] [Scilit]
- Mishra, A.; Shinjo, H.; Jat, H.; Parihar, C.; Parihar, M.; Datta, A.; Nayak, H.; Bhatt, B. Conservation agriculture enhances crop productivity and soil carbon fractions in Indo-Gangetic Plains of India. Front. Sustain. Food Syst. 2024, 8, 1476292. [Google Scholar] [CrossRef] [Scilit]
- Jat, M.L.; Chakraborty, D.; Ladha, J.K.; Rana, D.S.; Gathala, M.K.; McDonald, A.; Gerard, B. Conservation agriculture for sustainable intensification in South Asia. Nat. Sustain. 2020, 3, 336–343. [Google Scholar] [CrossRef] [Scilit]
- Agricultural Census India. Agricultural Census of India 2015–16; Ministry of Agriculture and Farmers Welfare, Government of India: New Delhi, India, 2016.
- Page, M.; McKenzie, J.; Bossuyt, P.; Boutron, I.; Hoffmann, T.; Mulrow, C.; Shamseer, L.; Tetzlaff, J.; Akl, E.; Brennan, S.; et al. The PRISMA 2020 statement: An updated guideline for reporting systematic reviews. BMJ 2021, 372, n71. [Google Scholar] [CrossRef] [Scilit] [PubMed]
- ICAR. Agro-Climatic Zones of India; Indian Council of Agricultural Research: New Delhi, India, 2015. [Google Scholar]
- Cassman, K.; Grassini, P. A global perspective on sustainable intensification research. Nat. Sustain. 2020, 3, 262–268. [Google Scholar] [CrossRef] [Scilit]
- Hochman, Z.; van Rees, H.; Carberry, P.; Hunt, J.; McCown, R.; Gartmann, A.; Holzworth, D.; van Rees, S.; Dalgliesh, N.; Long, W.; et al. Re-inventing model-based decision support with Australian dryland farmers. Crop Pasture Sci. 2009, 60, 1057–1070. [Google Scholar] [CrossRef] [Scilit]
- Turner, N. Agronomic options for improving rainfall-use efficiency of crops in dryland farming systems. J. Exp. Bot. 2004, 55, 2413–2425. [Google Scholar] [CrossRef] [Scilit] [PubMed]
- Tittonell, P.; Giller, K. When yield gaps are poverty traps: The paradigm of ecological intensification in African smallholder agriculture. Field Crops Res. 2013, 143, 76–90. [Google Scholar] [CrossRef] [Scilit]
- Vittal, K.; Bhanu Prasad, V.; Chary, G. Technology gap analysis for dry land crops in different agro-climatic zones of India. Indian J. Dryland Agric. Res. Dev. 2004, 19, 77–82. [Google Scholar]
- Ladha, J.; Pathak, H.; Krupnik, T.; Six, J.; van Kessel, C. Efficiency of fertilizer nitrogen in cereal production: Retrospects and prospects. Adv. Agron. 2005, 87, 85–156. [Google Scholar] [CrossRef] [Scilit]
- Nayak, H.; Silva, J.; Parihar, C.; Kakraliya, S.; Laing, A.; Krupnik, T.; Bijarniya, D.; Jat, M.; Sidhu, H.; Sharma, P. Yield, nitrogen-use efficiency and nitrate-N distribution in zero-till wheat in eastern IGP. Front. Environ. Sci. 2022, 10, 970017. [Google Scholar] [CrossRef] [Scilit]
- Timsina, J.; Connor, D. Productivity and management of rice-wheat cropping systems: Issues and challenges. Field Crops Res. 2001, 69, 93–132. [Google Scholar] [CrossRef] [Scilit]
- Nambiar, K. Soil Fertility and Crop Productivity under Long-Term Fertilizer Use in India; Indian Council of Agricultural Research: New Delhi, India, 1994. [Google Scholar]
- Singh, R. Environmental consequences of agricultural development: A case study from the Green Revolution state of Haryana, India. Agric. Ecosyst. Environ. 2000, 82, 97–103. [Google Scholar] [CrossRef] [Scilit]
- Asseng, S.; Ewert, F.; Martre, P.; Rötter, R.; Lobell, D.; Cammarano, D.; Kimball, B.; Ottman, M.; Wall, G.; White, J.; et al. Rising temperatures reduce global wheat production. Nat. Clim. Change 2015, 5, 143–147. [Google Scholar] [CrossRef] [Scilit]
- Farooq, M.; Bramley, H.; Palta, J.; Siddique, K. Heat stress in wheat during reproductive and grain-filling phases. Crit. Rev. Plant Sci. 2011, 30, 491–507. [Google Scholar] [CrossRef] [Scilit]
- Aggarwal, P.; Mall, R. Climate change and rice yields in diverse agro-environments of India. II. Effect of uncertainties in scenarios and crop models on impact assessment. Clim. Change 2002, 52, 331–343. [Google Scholar] [CrossRef] [Scilit]
- Debnath, S.; Mishra, A.; Mailapalli, D.; Raghuwanshi, N.; Sridhar, V. Assessment of rice yield gap under a changing climate in India. J. Water Clim. Change 2021, 12, 1245–1267. [Google Scholar] [CrossRef] [Scilit]
- Siddiq, E. Bridging the rice yield gap in India. In Bridging the Rice Yield Gap in the Asia-Pacific Region; FAO: Bangkok, Thailand, 2000. [Google Scholar]
- Laborte, A.; de Bie, K.; Smaling, E.; Moya, P.; Boling, A.; Van Ittersum, M. Rice yields and yield gaps in Southeast Asia: Past trends and future outlook. Eur. J. Agron. 2012, 36, 9–20. [Google Scholar] [CrossRef] [Scilit]
- Shiferaw, B.; Prasanna, B.M.; Hellin, J.; Bänziger, M. Crops that feed the world 6. Past successes and future challenges to the role played by maize in global food security. Food Sec. 2011, 3, 307–327. [Google Scholar] [CrossRef] [Scilit]
- CIMMYT. Maize for Food and Feed in Asia and the Pacific; International Maize and Wheat Improvement Center: Mexico City, Mexico, 2013. [Google Scholar]
- Sairam, A.; Lal, K.; Sindhu, V.; Khanna, M.; Sudhishri, S.; Brahmanand, P.; Hossain, A. Coupling Subsurface Drip Irrigation and Integrated Crop Management in a Maize–Wheat Rotation for Increased Food, Water, and Energy Security in Northwest India. Food Energy Secur. 2025, 14, e70158. [Google Scholar] [CrossRef] [Scilit]
- Parihar, C.M.; Jat, H.S.; Jat, S.L.; Kakraliya, S.K.; Nayak, H.S. Precision nutrient management for higher nutrient use efficiency and farm profitability in irrigated cereal-based cropping systems. Indian J. Fert. 2020, 16, 1000–1014. [Google Scholar]
- Sapkota, T.B.; Jat, M.L.; Jat, R.K.; Kapoor, P.; Stirling, C. Yield estimation of food and non-food crops in smallholder production systems. In Methods for Measuring Greenhouse Gas Balances and Evaluating Mitigation Options in Smallholder Agriculture; Springer International Publishing: Cham, Switzerland, 2016; pp. 163–174. [Google Scholar]
- Singh, U.; Gupta, R.; Bhattacharya, J. Soybean: Introduction, improvement and utilization in India—Problems and prospects. Agric. Res. 2013, 2, 293–300. [Google Scholar] [CrossRef] [Scilit]
- Bhatia, V.S.; Singh, P.; Wani, S.P.; Chauhan, G.S.; Rao, A.K.R.K.; Mishra, A.K.; Srinivas, K. Analysis of potential yields and yield gaps of rainfed soybean in India using CROPGRO-Soybean model. Agric. For. Meteorol. 2008, 148, 1252–1265. [Google Scholar] [CrossRef] [Scilit]
- Kumari, V.; Bhatt, B.; Raza, M.; Kumar, M. Yield gap analysis of important oilseeds and pulse crops in Bihar, India. J. Pharmacogn. Phytochem. 2019, 8, 1042–1047. [Google Scholar]
- Murugananthi, D.; Shivakumar, K.M.; Palanichamy Venkatesa, N.; Prabha Aruna, S.; Somasundaram, E.; Rohini, A.; Devi Parimala, R.; Selvanayaki, S.; Kavitha, P.G. Demand and supply projections for pulses in India. Legume Res. 2024, 47, 1335–1341. [Google Scholar] [CrossRef] [Scilit]
- Reddy, A. Pulses production technology: Status and way forward. Econ. Polit. Wkly. 2009, 44, 73–80. [Google Scholar] [CrossRef] [Scilit]
- NITI Aayog. Demand and Supply Projections for Pulses 2017–18 to 2025–26; Government of India: New Delhi, India, 2018.
- Mahto, R.K.; B. S., C.; Singh, R.K.; Kumar, A.; Kumar, S.; Yadav, R.; Dey, D.; Hamwieh, A.; Kumar, R. Symbiotic nitrogen fixation for sustainable chickpea yield and prospects for genome editing in changing climatic situations. Front. Plant Sci. 2025, 16, 1621191. [Google Scholar] [CrossRef] [Scilit] [PubMed]
- Parthasarathy Rao, P.; Birthal, P.; Bhagavatula, S.; Bantilan, M. Chickpea and Pigeonpea Economies in Asia: Facts, Trends and Outlook; ICRISAT: Andhra Pradesh, India, 2010. [Google Scholar]
- Yaligar, R.; Jyothi, R.; Narappa, G.; Radha, J.; Arabhanvi, F.; Revathi, R.M.; Shruthi, N. Productivity, profitability and yield gap analysis in chickpea under FLD in Tungabhadra command area. Legume Res. 2024, 48, 437–443. [Google Scholar] [CrossRef] [Scilit]
- Rimal, N.S.; Kumar, S. Yield gap analysis of major pulses in India. J. Inst. Agric. Anim. Sci. 2018, 33, 213–219. [Google Scholar] [CrossRef] [Scilit]
- Rathore, S.; Shekhawat, K.; Kandpal, B.; Singh, V.; Premi, O.; Kandpal, H. Pulse production in India: Major constraints and way forward. Int. J. Curr. Microbiol. Appl. Sci. 2020, 9, 3687–3707. [Google Scholar]
- Hajjarpoor, A.; Vadez, V.; Soltani, A.; Gaur, P.; Whitbread, A.; Suresh Babu, D.; Gumma, M.K.; Diancoumba, M.; Kholová, J. Characterization of the main chickpea cropping systems in India using a yield gap analysis approach. Field Crops Res. 2018, 223, 93–104. [Google Scholar] [CrossRef] [Scilit]
- Ali, M.; Gupta, S. Carrying capacity of Indian agriculture: Pulse crops. Curr. Sci. 2012, 102, 874–881. [Google Scholar]
- Dodewar, P.; Brahmanand, P.; Pillai, S.; Srivastava, S.; Bana, R.; Prajapati, V.; Chellapilla, B.; Sudhishri, S.; Jena, T. Crop simulation-based assessment of yield gaps and water productivity for improving blackgram (Vigna mungo L.) production across diverse ecologies of India. Front. Agron. 2026, 8, 1775298. [Google Scholar] [CrossRef] [Scilit]
- Singh, R.; Chauhan, B. Managing impact of climatic vagaries on the productivity of wheat and mustard in India. MAUSAM 2016, 67, 205–222. [Google Scholar] [CrossRef] [Scilit]
- Dhandapani, A.; Jayaprakash, J.; Singh, G.; Nain, A. Yield gap of mustard in Uttar Pradesh under frontline demonstrations. J. Oilseeds Res. 2022, 39, 14–19. [Google Scholar]
- Singh, S.P.; Mahapatra, B.S.; Kumar, A.; Meena, V.S.; Joshi, N. Sustainable intensification of Indian mustard: Integrating irrigation, planting, and mulching for enhanced yield and soil health in the Shivalik Himalayas, India. Environ. Dev. Sustain. 2025. [Google Scholar] [CrossRef] [Scilit]
- Ministry of Agriculture and Farmers Welfare. Annual Report 2022–23; Ministry of Agriculture and Farmers Welfare, Government of India: New Delhi, India, 2023.
- Kumar, N.R.; Abdulla; Kapoor, S.; Singh, N.; Jha, G.; Srivastava, S. Impact of climate change on agriculture in Indo-Gangetic Plains of India. Agric. Econ. Res. Rev. 2024, 37, 47–58. [Google Scholar] [CrossRef] [Scilit]
- Guhan, V.; Annadurai, K.; Easwaran, S.; Marimuthu, M.; Balu, D.; Vigneswaran, S.; Navinkumar, C. Assessing the impact of climate change on water requirement and yield of sugarcane over different agro-climatic zones of Tamil Nadu. Sci. Rep. 2024, 14, 8239. [Google Scholar] [CrossRef] [Scilit] [PubMed]
- Das, A.; Kumar, M.; Kushwaha, A.; Dave, R.; Dakhore, K.K.; Chaudhari, K.; Bhattacharya, B.K. Machine learning model ensemble for predicting sugarcane yield through synergy of optical and SAR remote sensing. Remote Sens. Appl. Soc. Environ. 2023, 30, 100962. [Google Scholar] [CrossRef] [Scilit]
- Murgai, R.; Ali, M.; Byerlee, D. Productivity growth and sustainability in post-Green Revolution agriculture: The case of the Indian and Pakistani Punjabs. World Bank Res. Obs. 2001, 16, 199–218. [Google Scholar] [CrossRef] [Scilit]
- Regmi, A.P.; Ladha, J.K.; Pathak, H.; Pasuquin, E.; Bueno, C.; Dawe, D.; Hobbs, P.R.; Joshy, D.; Maskey, S.L.; Pandey, S.P. Yield and soil fertility trends in a 20-year rice–rice–wheat experiment in Nepal. Soil Sci. Soc. Am. J. 2002, 66, 857–867. [Google Scholar] [CrossRef]
- Saharawat, Y.S.; Ladha, J.K.; Pathak, H.; Gathala, M.; Chaudhary, N.; Jat, M.L. Simulation of resource-conserving technologies on productivity, income and greenhouse gas (GHG) emission in rice-wheat system. J. Soil Sci. Environ. Manag. 2012, 3, 9–22. [Google Scholar] [CrossRef]
- Wani, S.; Pathak, P.; Jangawad, L.; Eswaran, H.; Singh, P. Improved management of Vertisols in the semiarid tropics for increased productivity and soil carbon sequestration. Soil Use Manag. 2003, 19, 217–222. [Google Scholar] [CrossRef]
- FAO. SDG Goal 2: Zero Hunger; Food and Agriculture Organization of the United Nations: Rome, Italy, 2015. [Google Scholar]
- Sinclair, T.; Rufty, T. Nitrogen and water resources commonly limit crop yield increases, not necessarily plant genetics. Glob. Food Secur. 2012, 1, 94–98. [Google Scholar] [CrossRef] [Scilit]
- Chakraborty, D.; Ladha, J.K.; Das, B.; Rana, D.S.; Gathala, M.K.; Jat, M.L.; Krupnik, T.J. Global insights into nitrogen losses and efficiency in rice, wheat, and maize cultivation. Field Crops Res. 2025, 334, 110138. [Google Scholar] [CrossRef] [Scilit]
- Waddington, S.; Li, X.; Dixon, J.; Hyman, G.; de Vicente, M. Getting the focus right: Production constraints for six major food crops in Asian and African farming systems. Food Secur. 2010, 2, 27–48. [Google Scholar] [CrossRef] [Scilit]
- Saini, R.; Kaur, M.; Singh, R.; Arora, K.; Singh, G.; Kaur, G.; Singh, S.; Singh, A.; Singh, D. Understanding sustenance of small farm holders: A study of income inequality among farm households in Indian Punjab. Sustainability 2022, 14, 13438. [Google Scholar] [CrossRef] [Scilit]
- Reddy, A.A. Impact Study of Soil Health Card Scheme; National institute of agricultural extension management (MANAGE): Hyderabad, India, 2018; p. 106. [CrossRef] [Scilit]
- FAO. The State of Food and Agriculture 2024; Food and Agriculture Organization of the United Nations: Rome, Italy, 2024. [Google Scholar]
- Dev, M. Transformation of Indian agriculture? Growth, inclusiveness and sustainability. Indian J. Agric. Econ. 2019, 74, 9–61. [Google Scholar] [CrossRef]
- Parihar, C.M.; Parihar, M.D.; Sapkota, T.B.; Nanwal, R.K.; Singh, A.K.; Jat, S.L.; Nayak, H.S.; Mahala, D.M.; Singh, L.K.; Kakraliya, S.K.; et al. Long-term impact of conservation agriculture and diversified maize rotations on carbon pools and stocks, mineral nitrogen fractions and nitrous oxide fluxes in inceptisol of India. Sci. Total Environ. 2018, 640–641, 1382–1392. [Google Scholar] [CrossRef] [Scilit] [PubMed]
- Mishra, A.K.; Shinjo, H.; Jat, H.S.; Jat, M.L.; Jat, R.K.; Funakawa, S. Assessing the impact of rice-wheat-maize residue decomposition rate and nutrient dynamics in IGP. Front. Sustain. Food Syst. 2024, 8, 1409370. [Google Scholar] [CrossRef] [Scilit]
- Sharma, A.; Behera, U. Recycling of legume residues for nitrogen economy and higher productivity in maize-wheat cropping system. Nutr. Cycl. Agroecosyst. 2009, 83, 197–210. [Google Scholar] [CrossRef] [Scilit]
- GAP Initiative. Boosting Yields and Incomes in India; Global Agricultural Productivity Initiative, Virginia Tech: Blacksburg, VA, USA, 2024; Available online: https://globalagriculturalproductivity.org/bayer-gap-report-story/boosting-yields-and-incomes-in-india/ (accessed on 3 August 2026).
- Mall, R.; Singh, R.; Gupta, A.; Srinivasan, G.; Rathore, L. Impact of climate change on Indian agriculture: A review. Clim. Change 2006, 78, 445–478. [Google Scholar] [CrossRef] [Scilit]
- Aggarwal, P. Global climate change and Indian agriculture: Impacts, adaptation and mitigation. Indian J. Agric. Sci. 2008, 78, 911–919. [Google Scholar]
- Kalra, N.; Aggarwal, P.; Chander, S.; Pathak, H.; Choudhary, R.; Chaudhary, A.; Gosain, A.; Singh, S.; Sehgal, M.; Lal, M. Impacts of climate change on agriculture. In Climate Change and India: Vulnerability Assessment and Adaptation; Universities Press: Hyderabad, India, 2007; pp. 153–177. [Google Scholar]
- Kumar, S.; Aggarwal, P.; Rani, S.; Jain, S.; Saxena, R.; Chauhan, N. Impact of climate change on crop productivity in Western Ghats, coastal and northeastern regions of India. Curr. Sci. 2011, 101, 332–341. [Google Scholar]
- Jägermeyr, J.; Müller, C.; Ruane, A.; Elliott, J.; Balkovic, J.; Castillo, O.; Faye, B.; Foster, I.; Folberth, C.; Franke, J.; et al. Climate impacts on global agriculture emerge earlier in new generation of climate and crop models. Nat. Food 2021, 2, 873–885. [Google Scholar] [CrossRef] [Scilit] [PubMed]
- Ajewole, K.; Sabala, E.; Beckman, J. Evaluating the Impacts of Projected Yield Changes on India’s Wheat and Rice Markets; U.S. Department of Agriculture, Economic Research Service: Washington, DC, USA, 2025. [CrossRef] [Scilit]
- Byjesh, K.; Kumar, S.; Aggarwal, P. Simulating impacts, potential adaptation and vulnerability of maize to climate change in India. Mitig. Adapt. Strateg. Glob. Change 2010, 15, 413–431. [Google Scholar] [CrossRef] [Scilit]
- Srinivasarao, C.; Vittal, K.; Gajbhiye, P.; Kundu, S.; Sharma, K. Distribution of micronutrients in soils in rainfed production systems of India. Indian J. Dryland Agric. Res. Dev. 2008, 23, 29–35. [Google Scholar]
- Srinivasarao, C.; Lal, R.; Kundu, S.; Prasad Babu, M.; Venkateswarlu, B.; Singh, A. Soil carbon sequestration in rainfed production systems in the semiarid tropics of India. Sci. Total Environ. 2013, 487, 587–603. [Google Scholar] [CrossRef] [Scilit] [PubMed]
- Srinivasa Rao, C.; Lal, R.; Prasad, J.; Gopinath, K.; Singh, R.; Jakkula, V.; Sahrawat, K.; Venkateswarlu, B.; Sikka, A.; Virmani, S. Potential and challenges of rainfed farming in India. Adv. Agron. 2015, 133, 113–181. [Google Scholar] [CrossRef] [Scilit]
- Swaminathan, M. From Green Revolution to Evergreen Revolution. In The Hindu Survey of Indian Agriculture; Kasturi & Sons: Chennai, India, 2010; pp. 1–4. [Google Scholar]
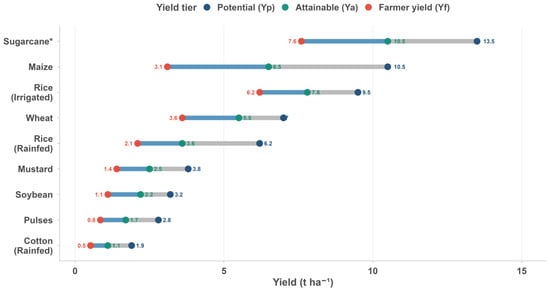
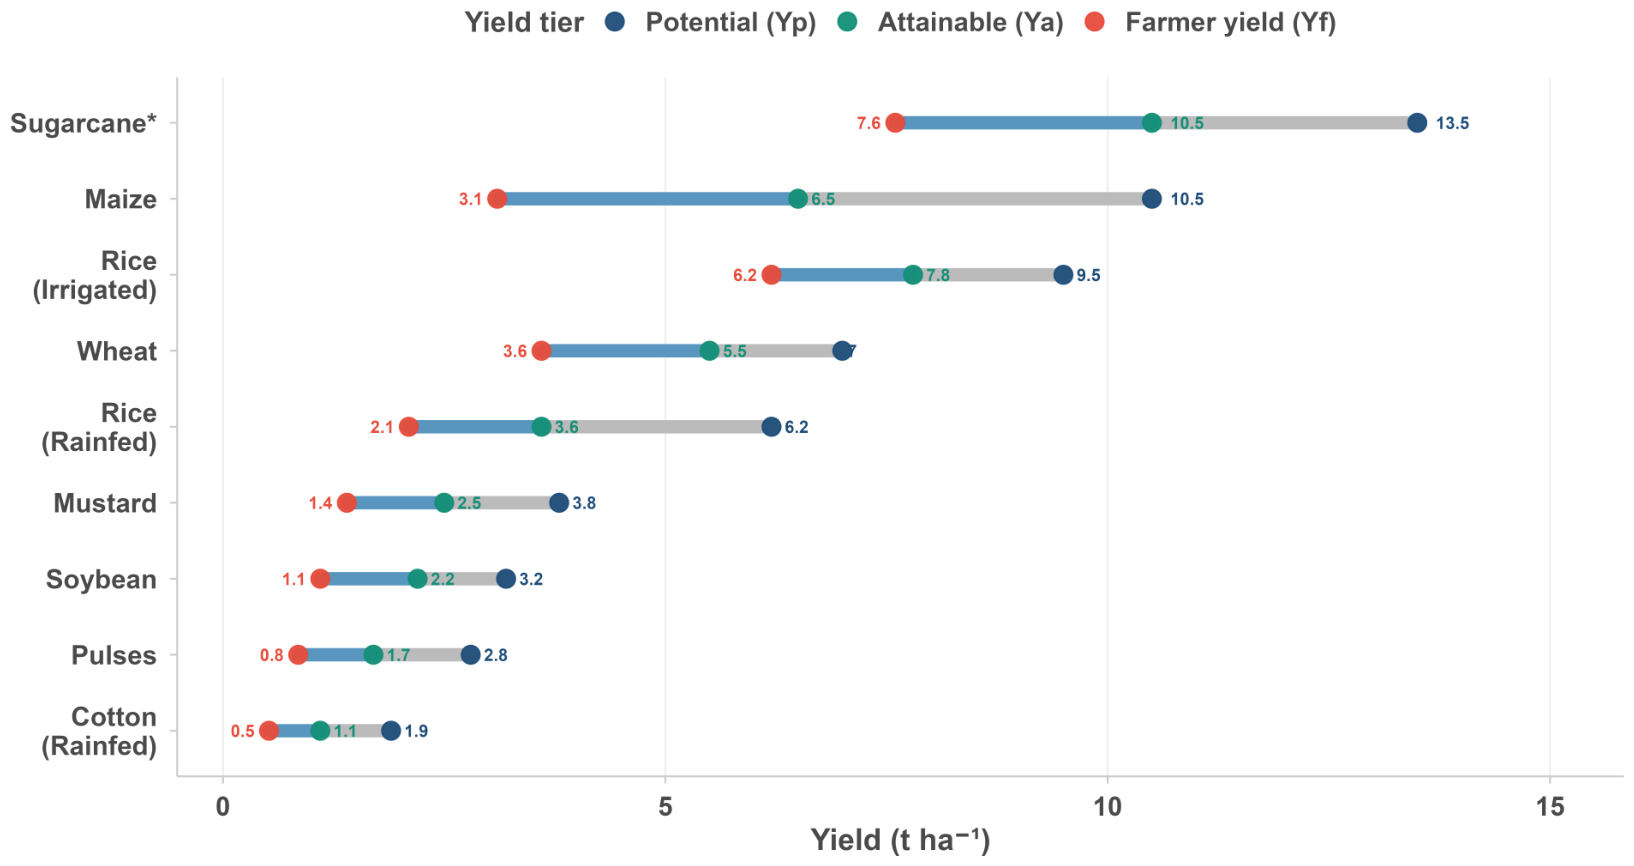
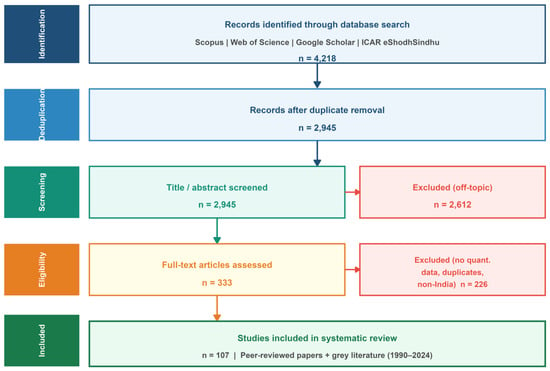
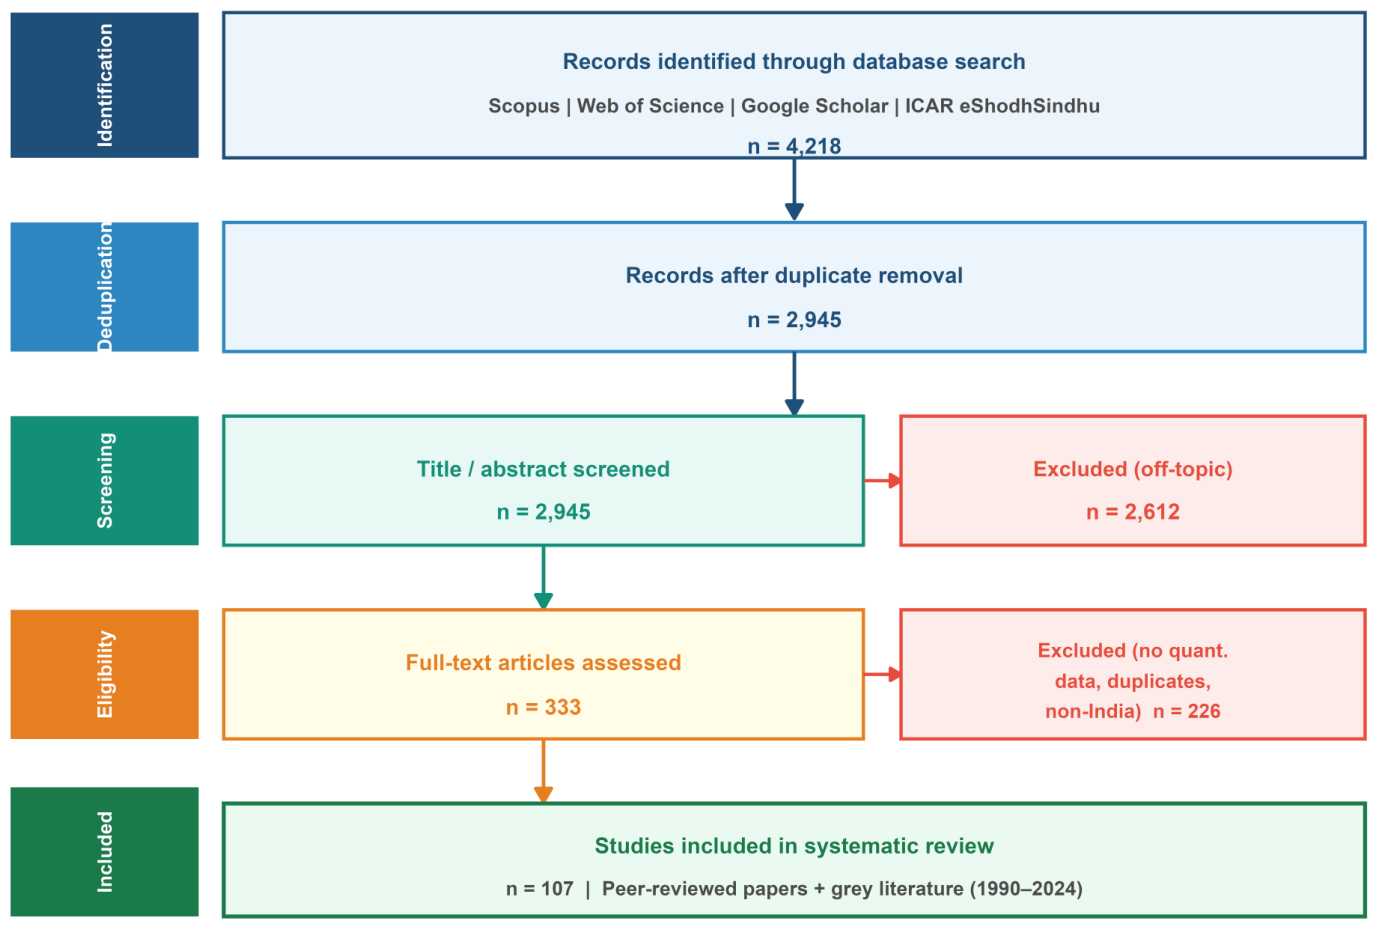
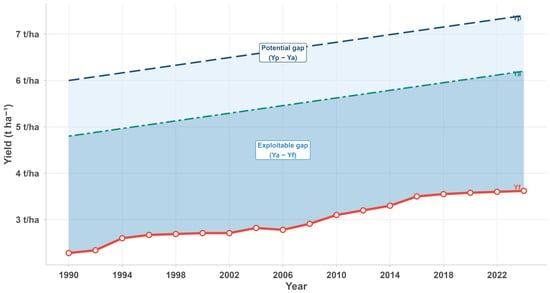
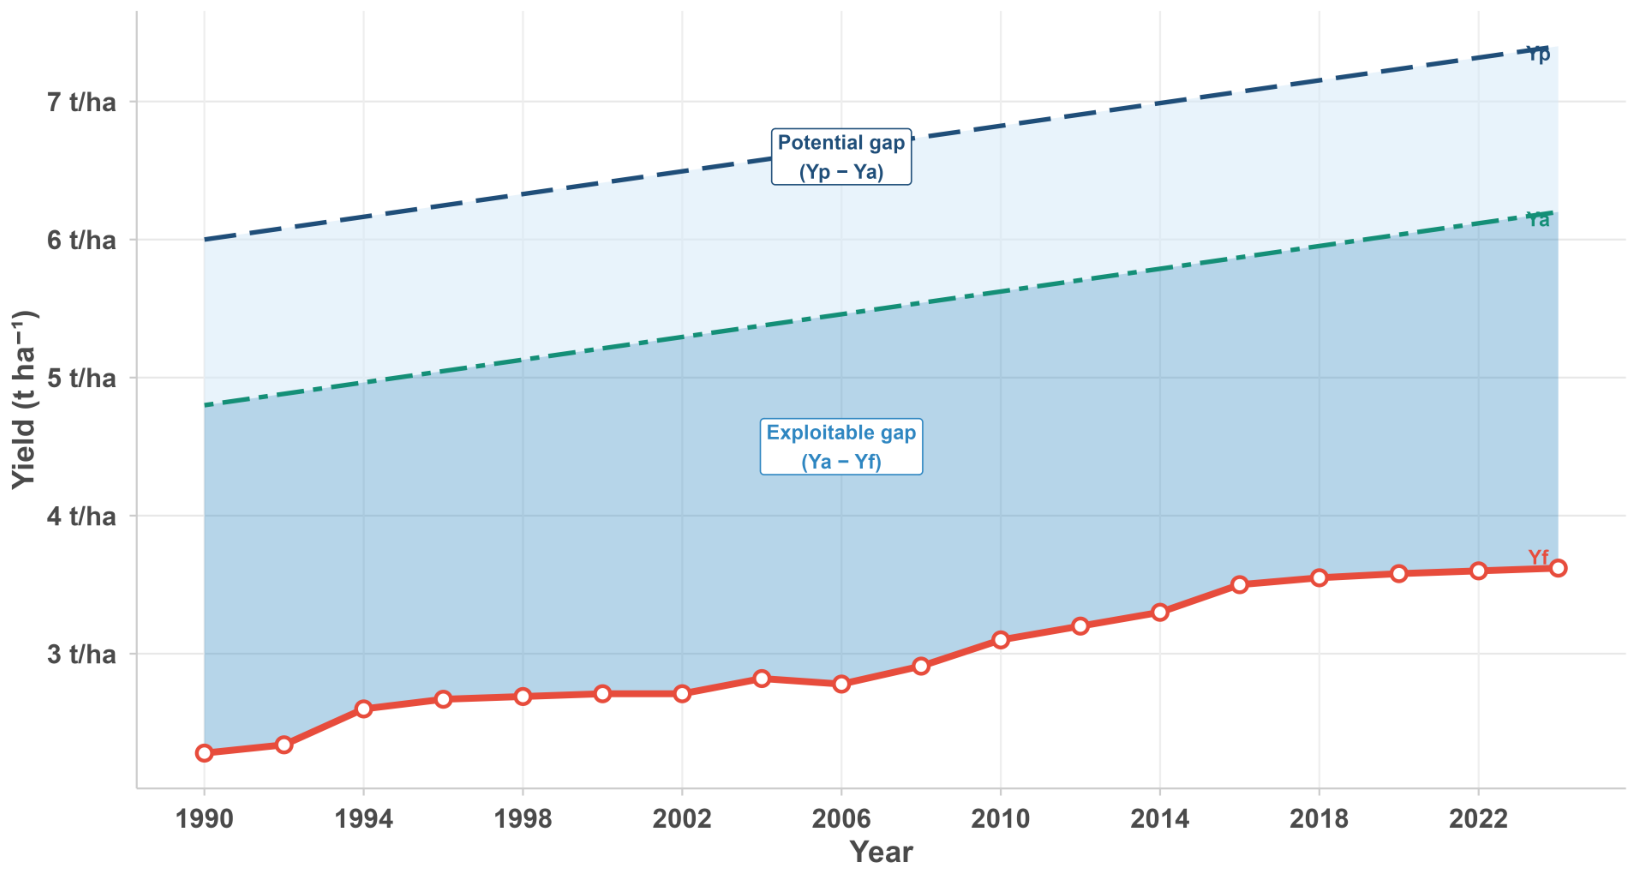
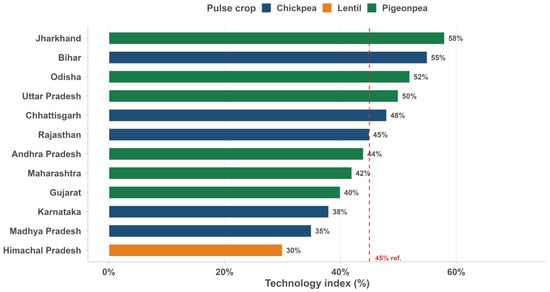
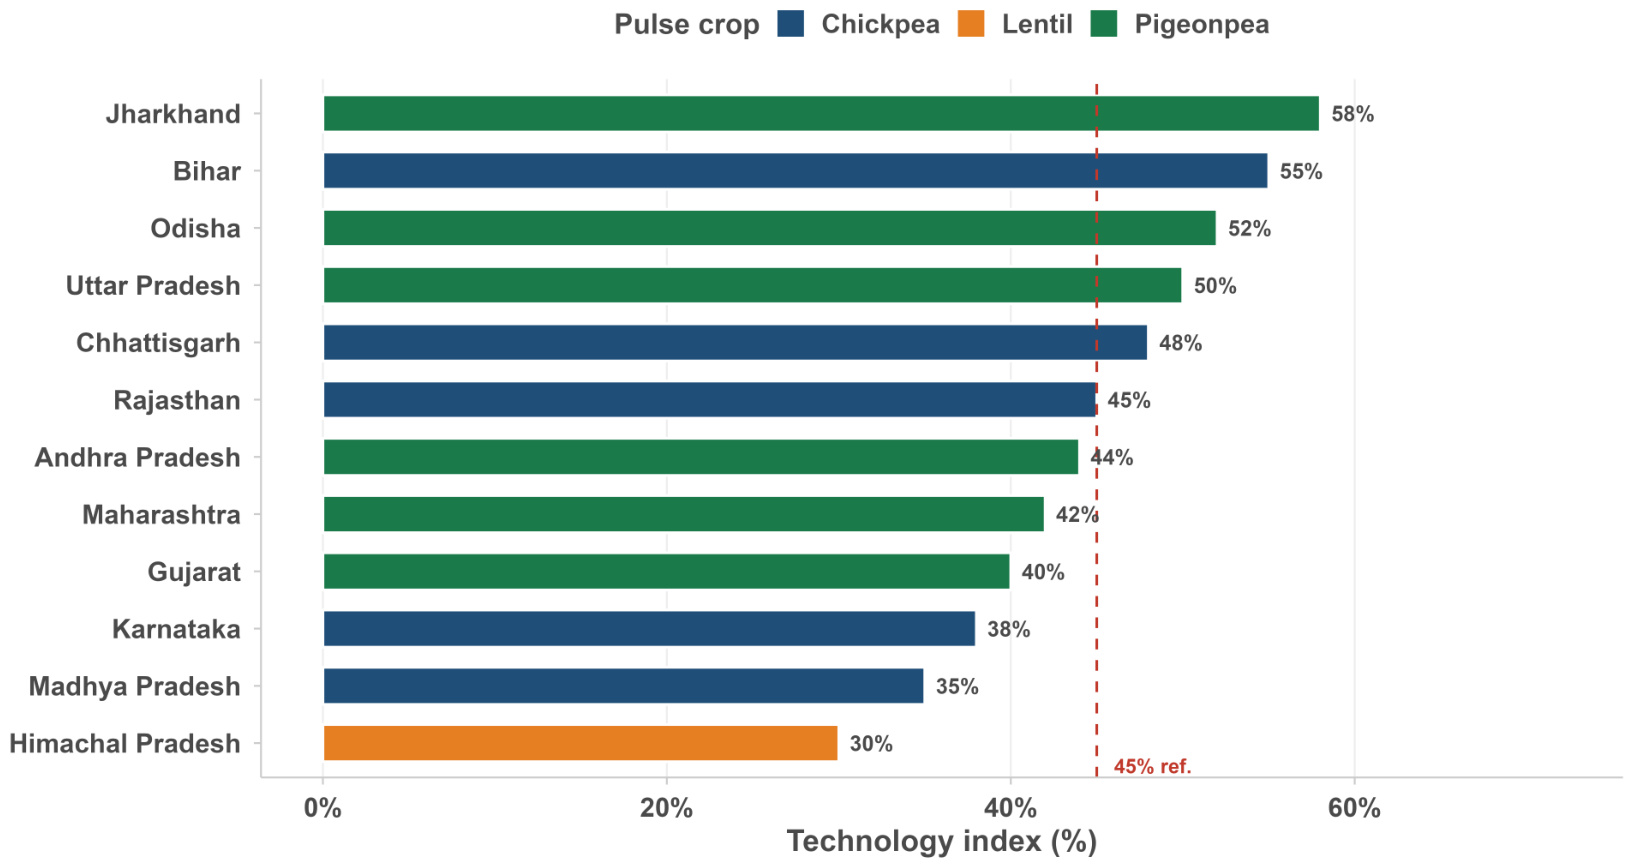
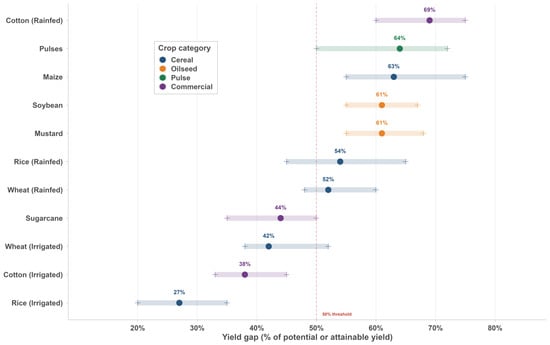
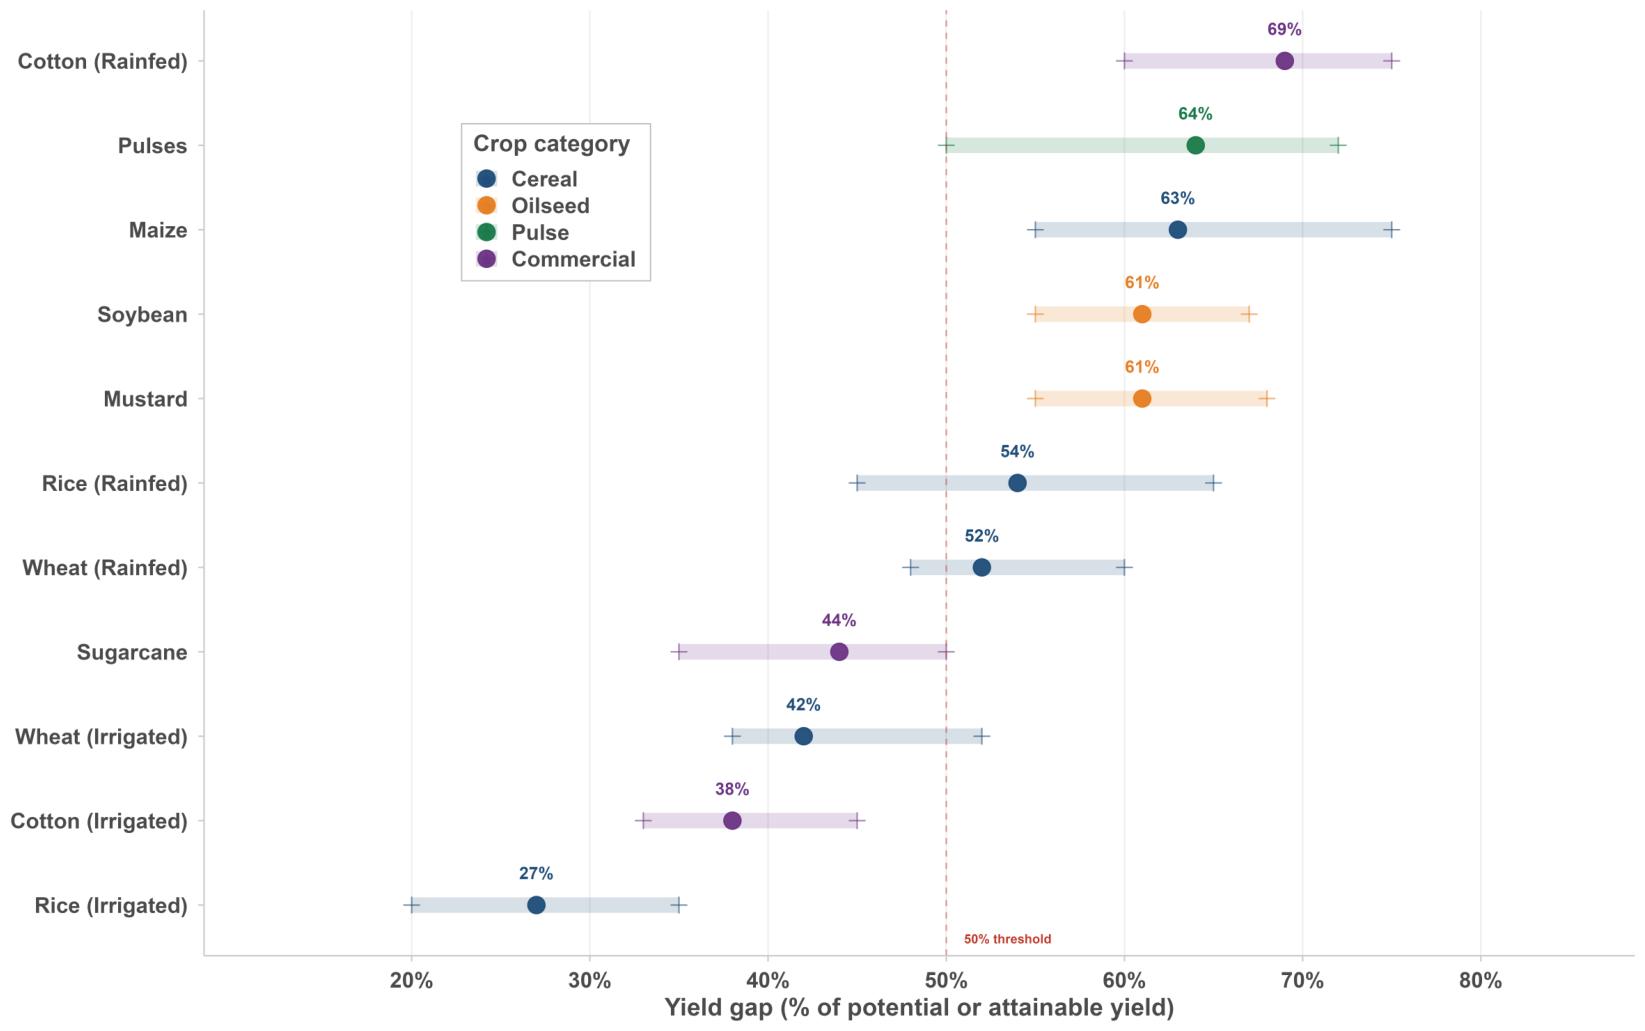
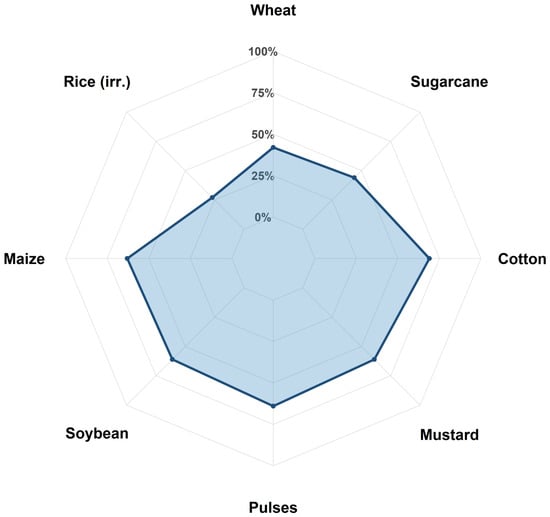
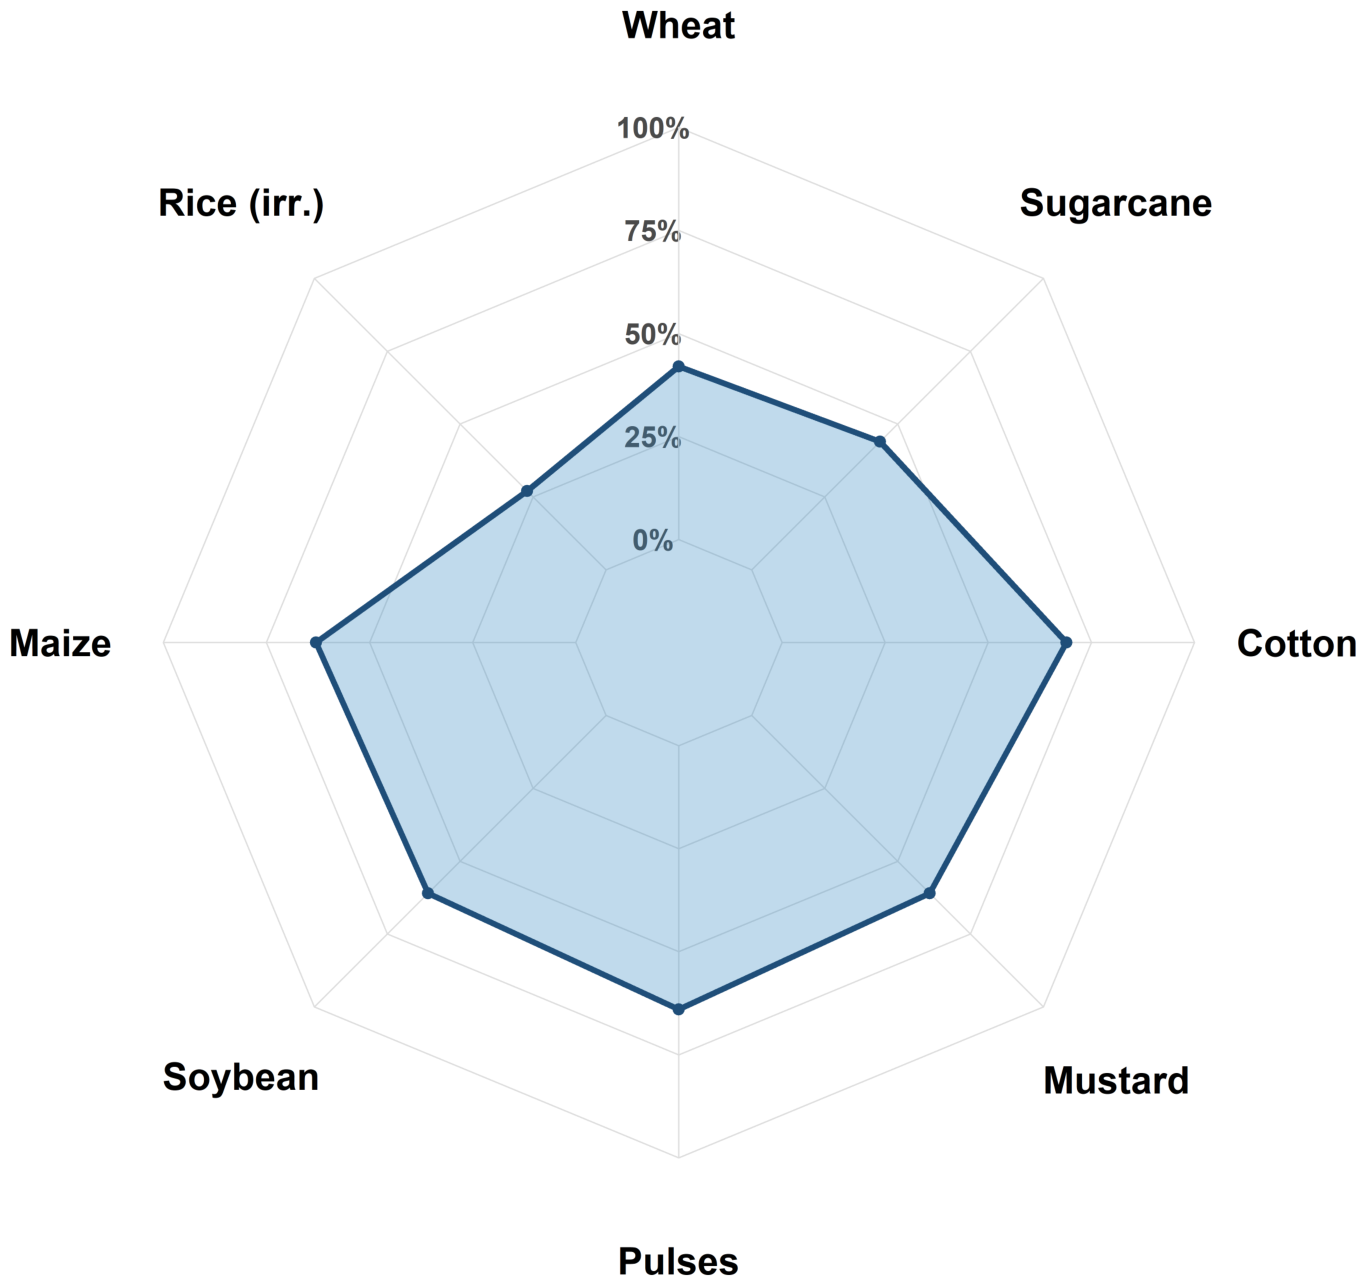
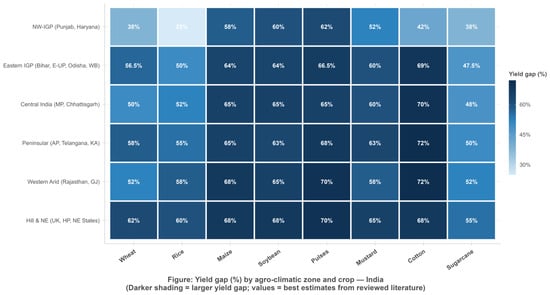
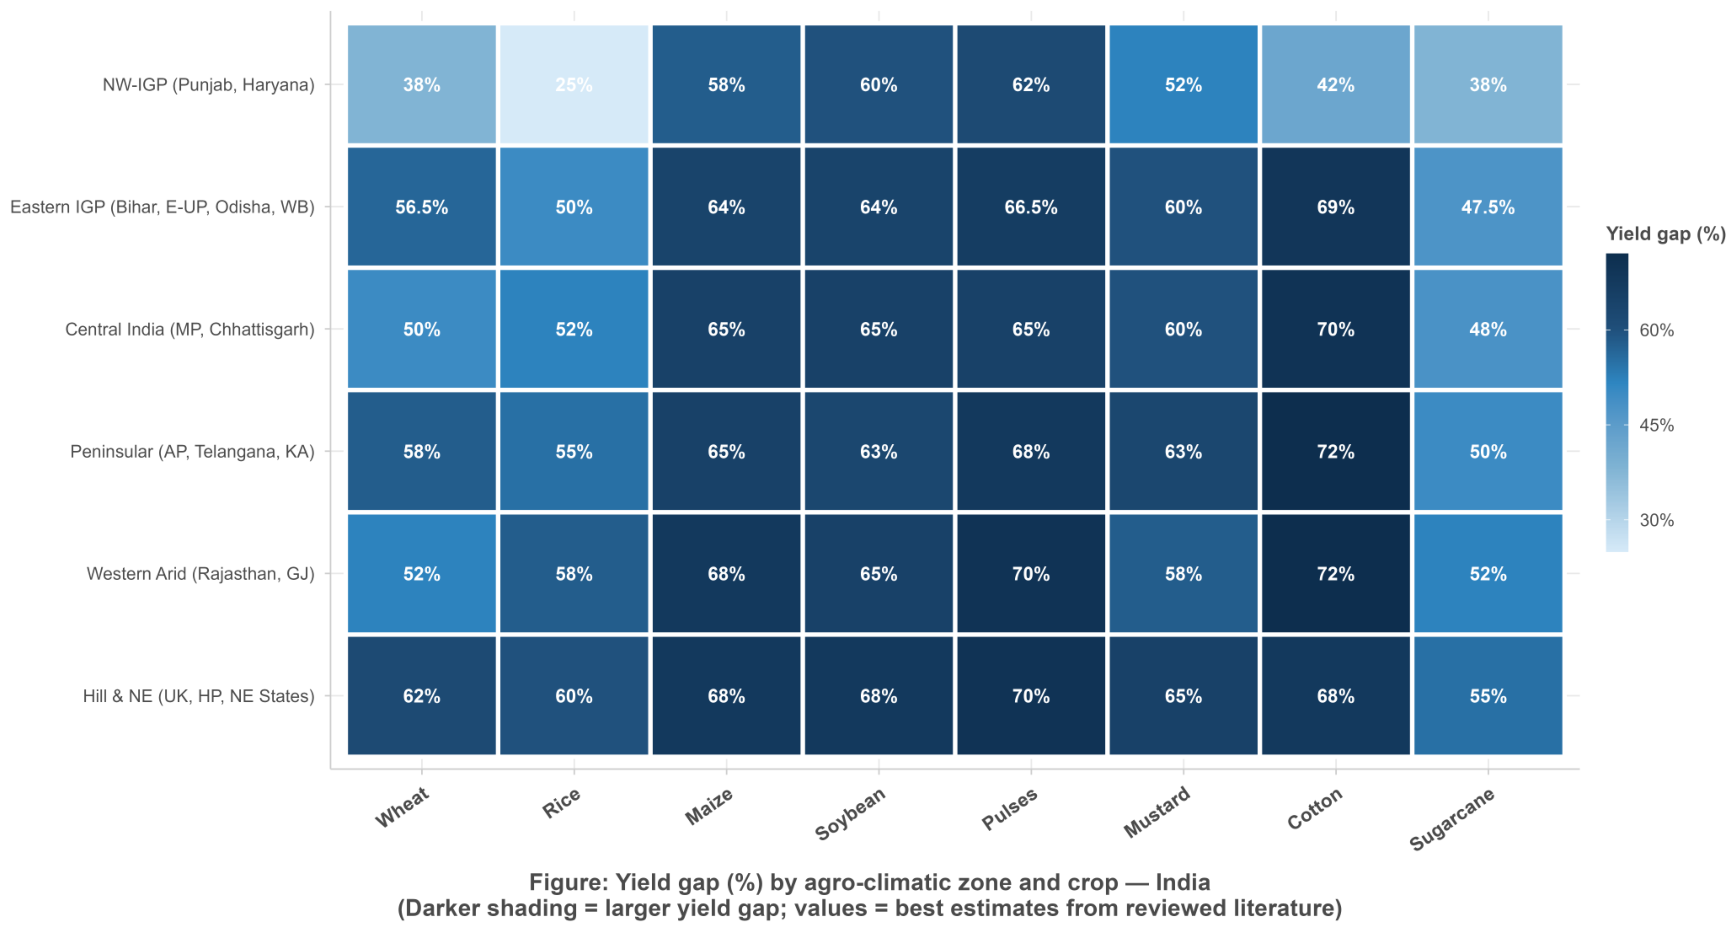
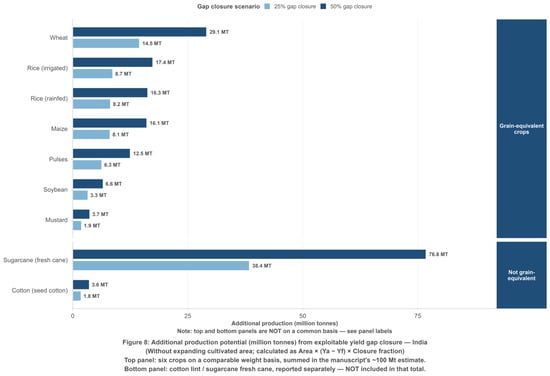
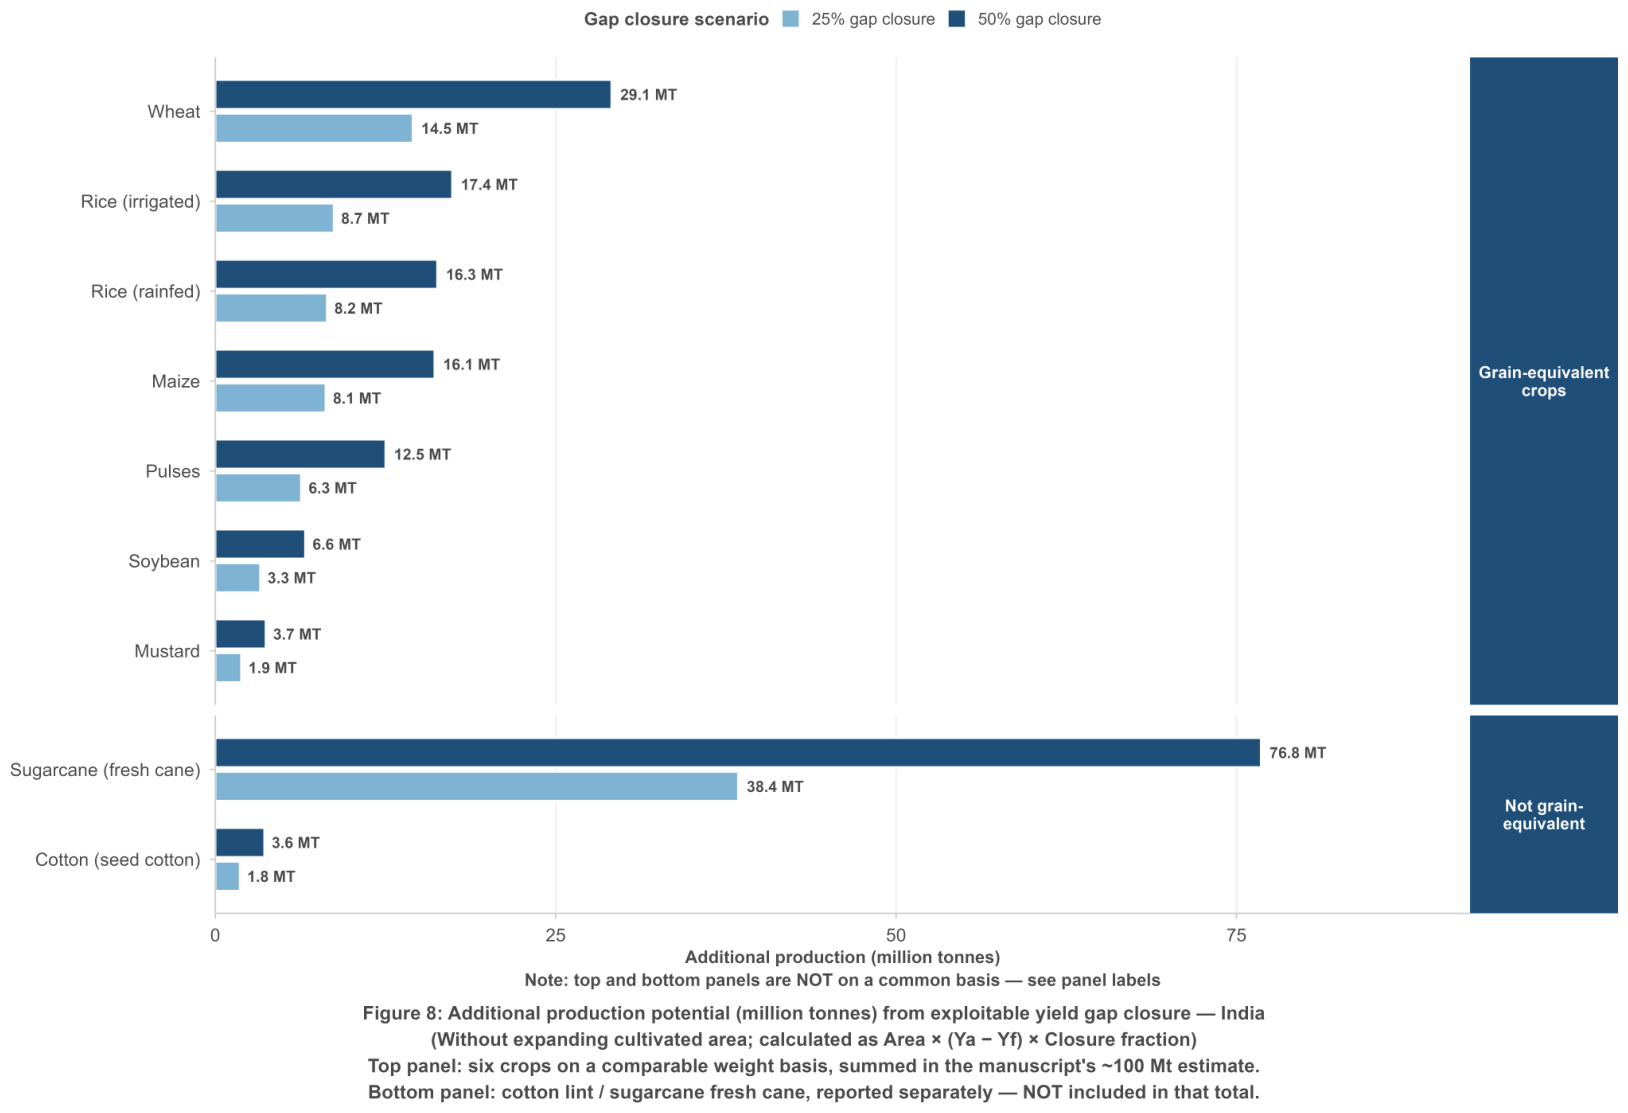
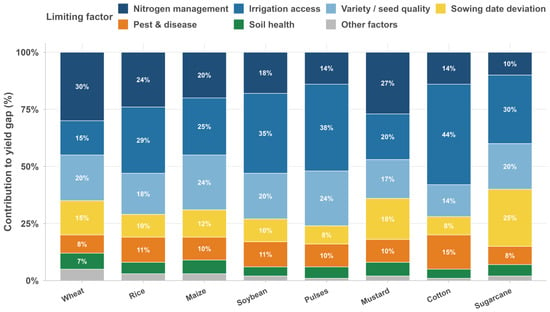
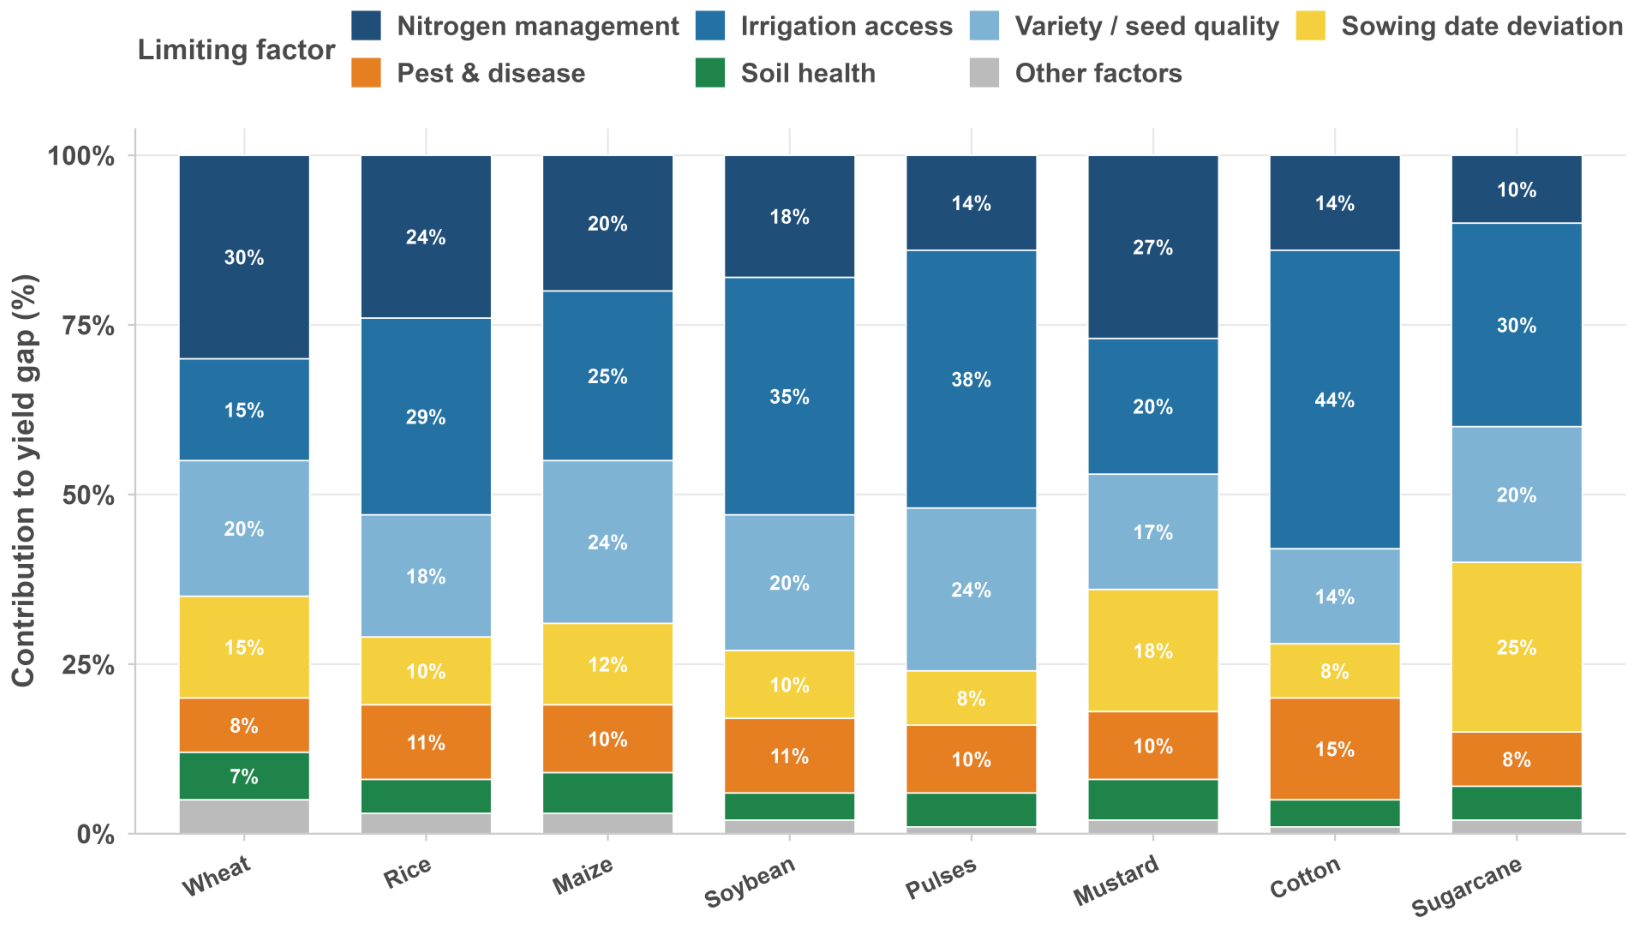
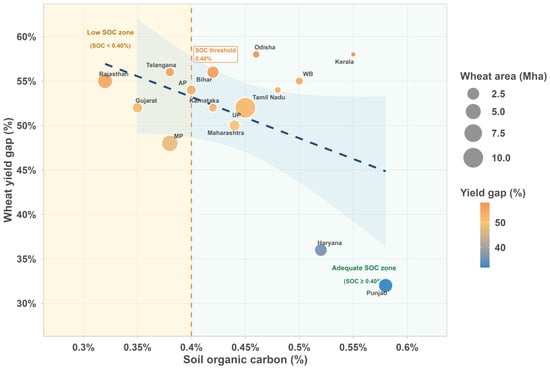
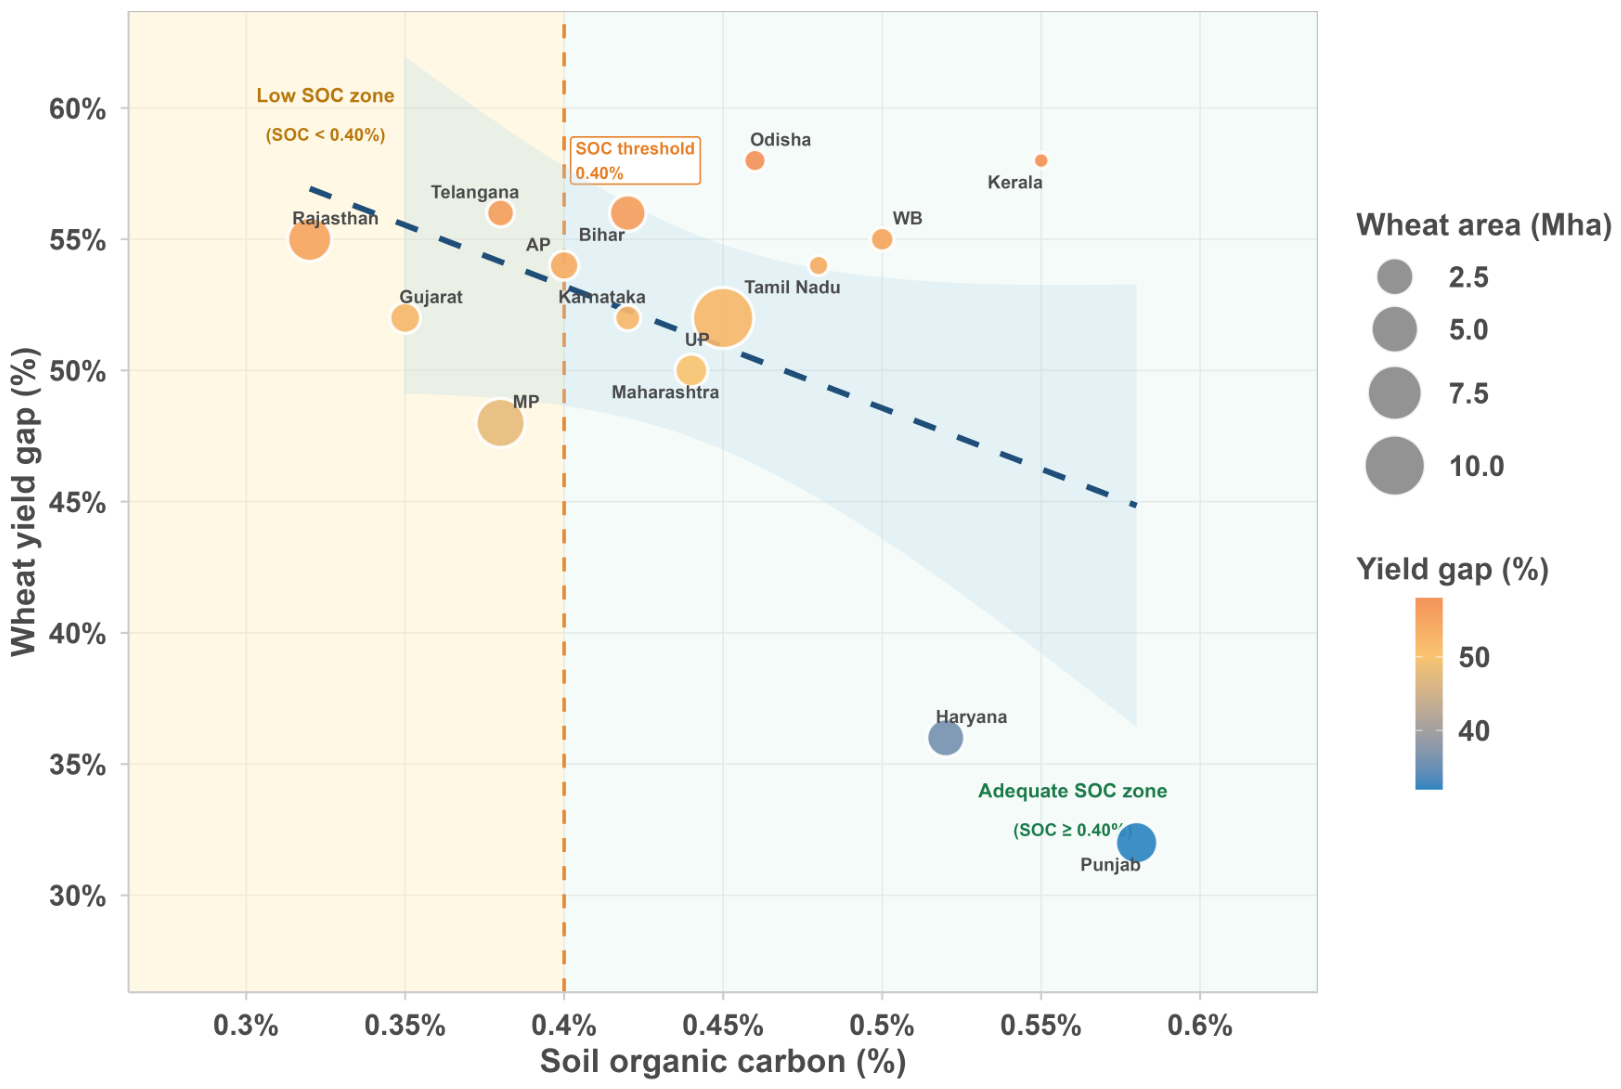
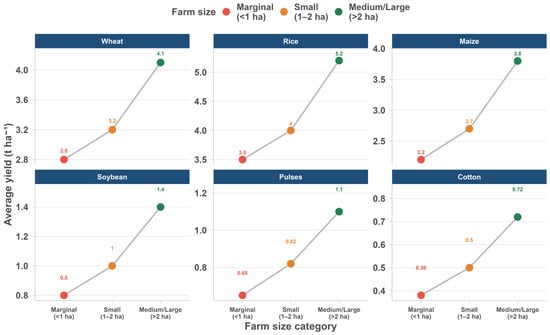
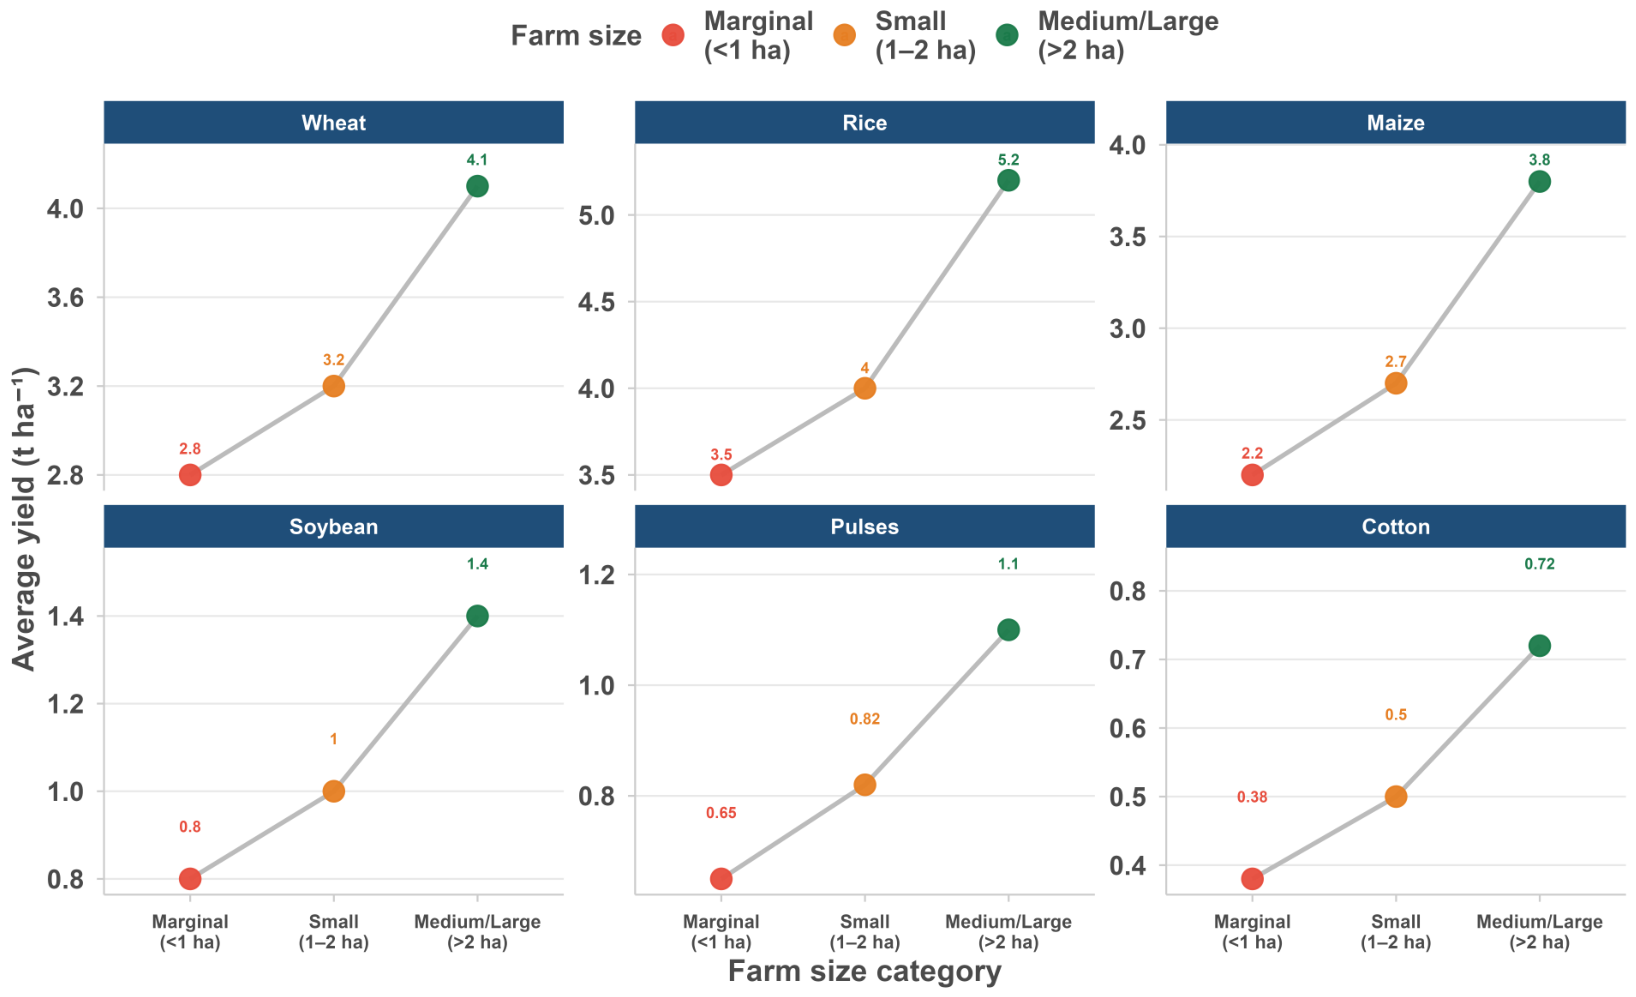
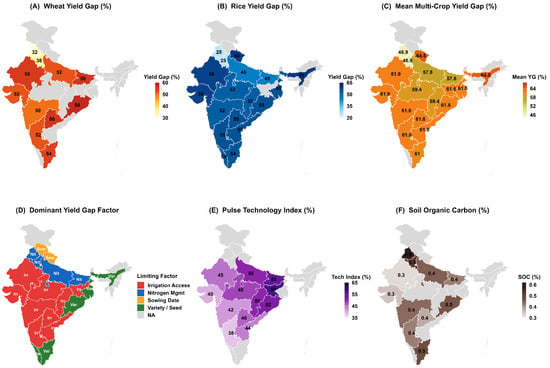
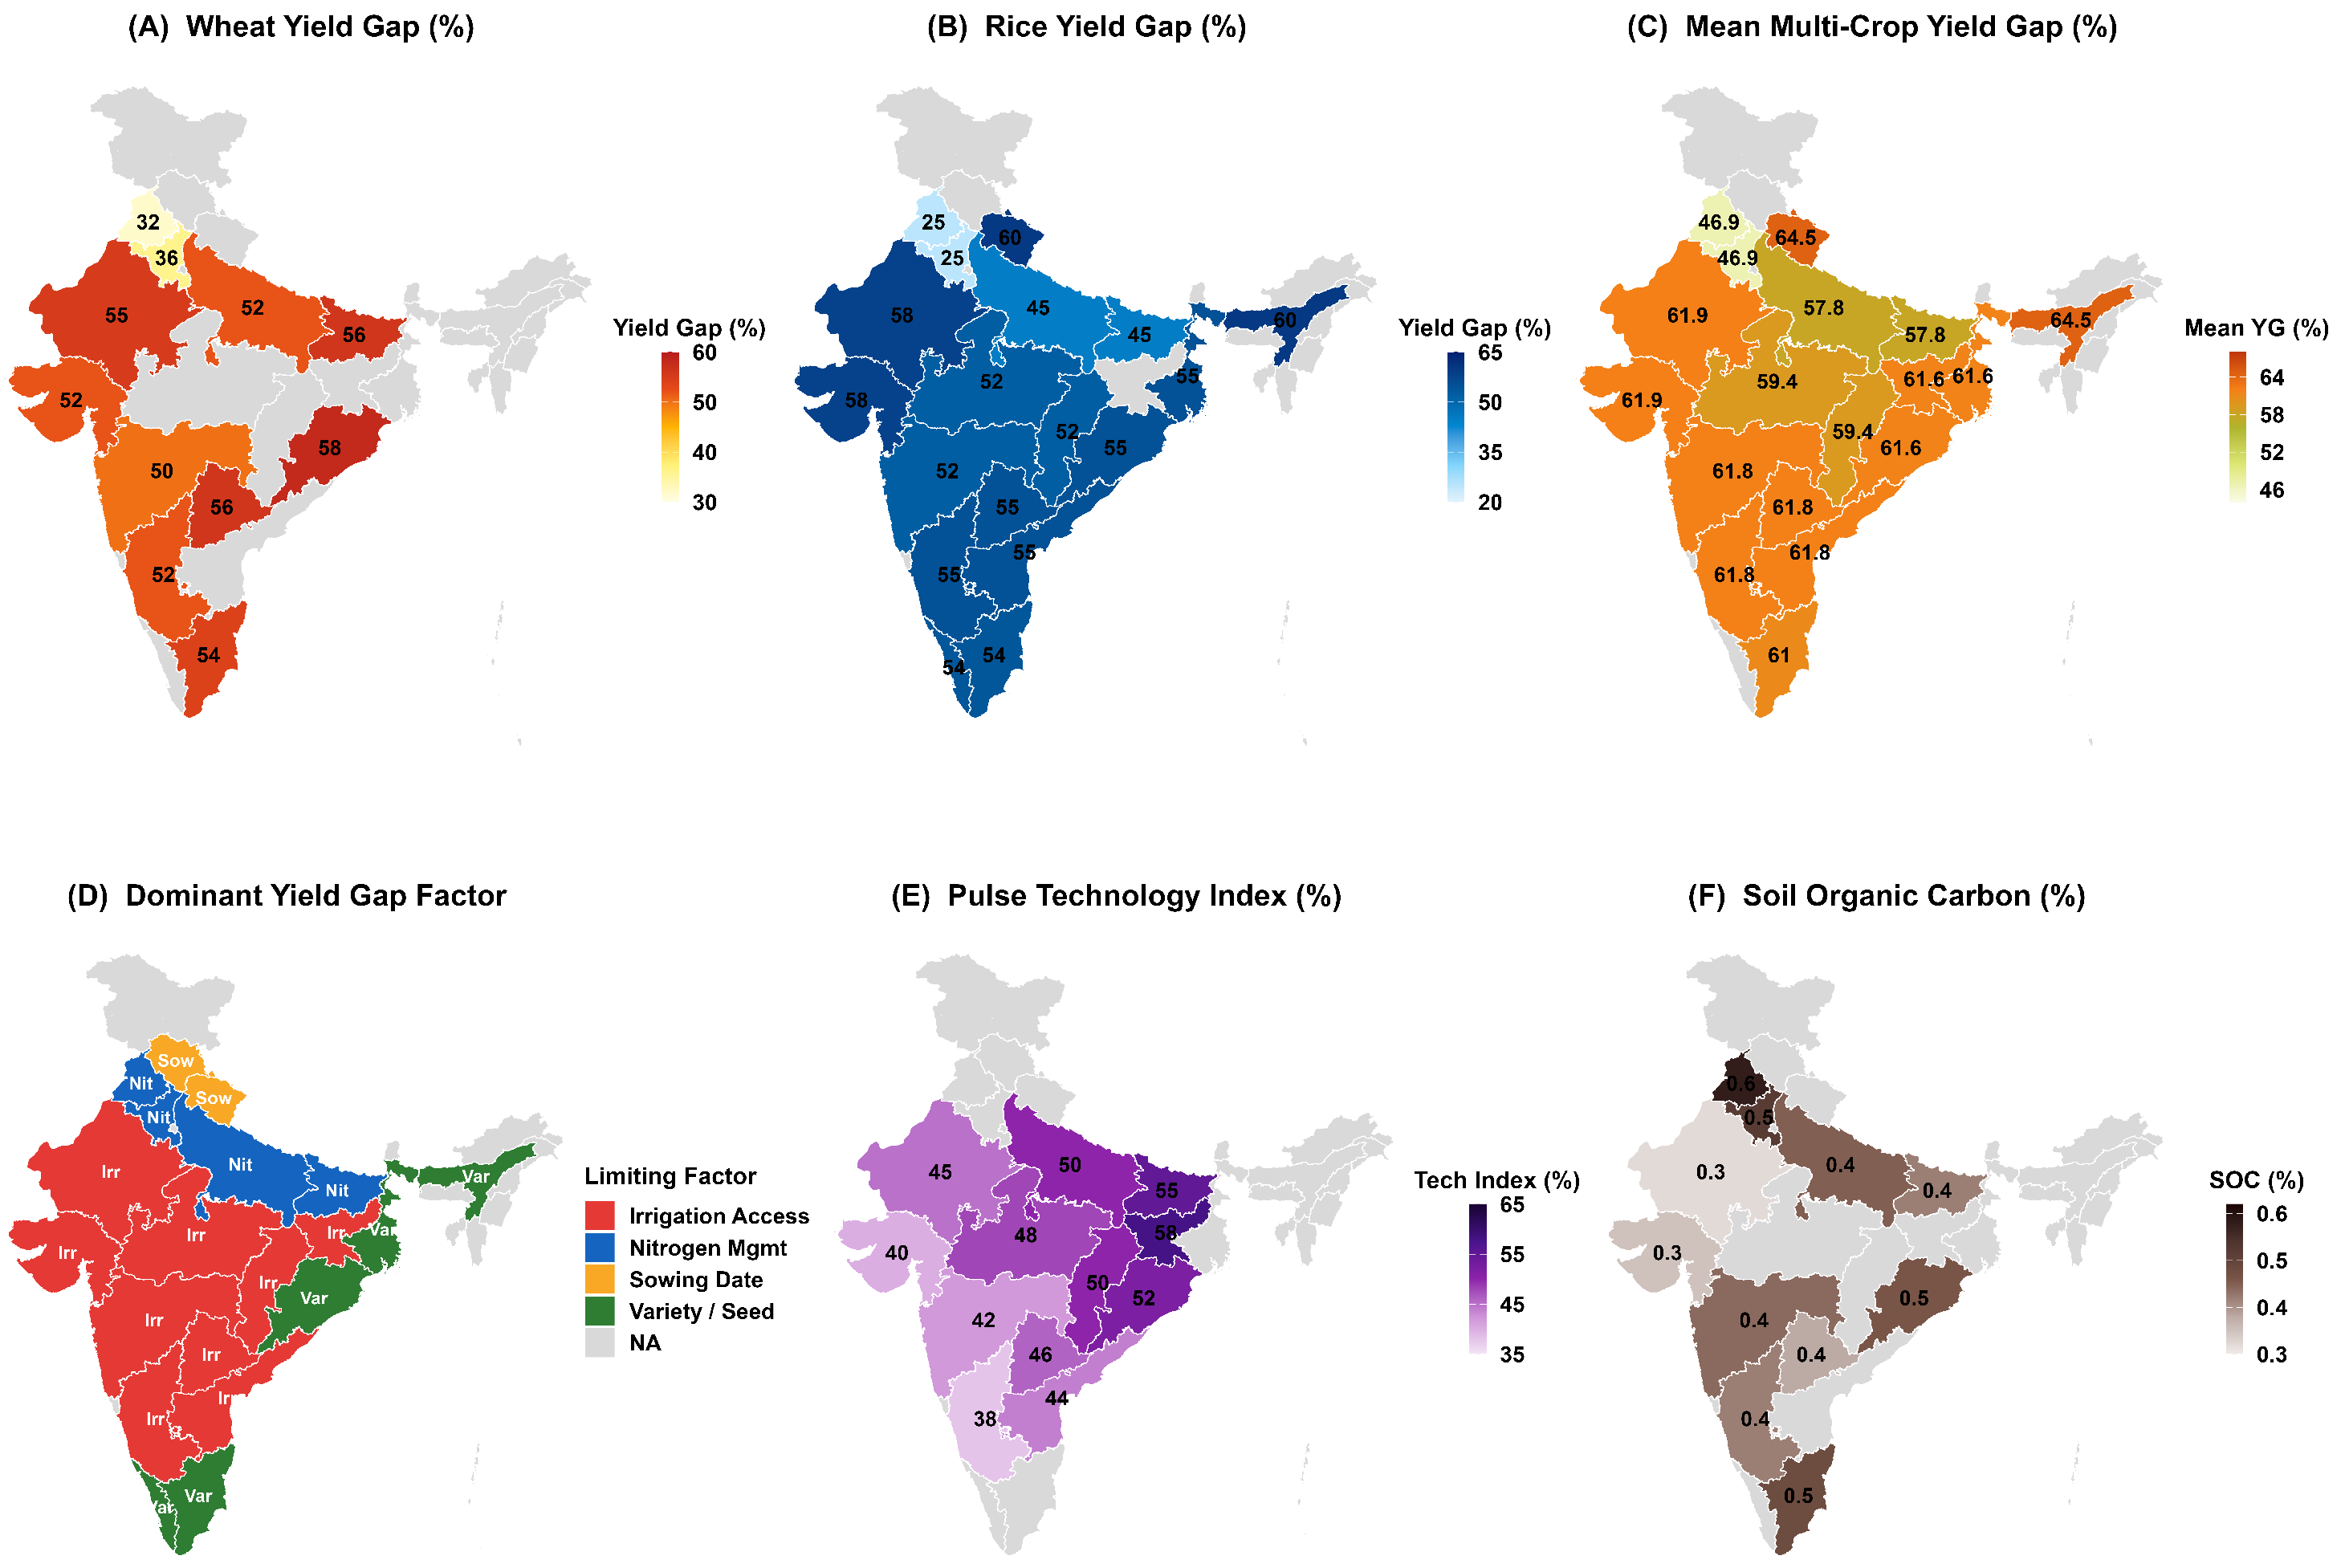

Disclaimer/Publisher’s Note: The statements, opinions and data contained in all publications are solely those of the individual author(s) and contributor(s) and not of MDPI and/or the editor(s). MDPI and/or the editor(s) disclaim responsibility for any injury to people or property resulting from any ideas, methods, instructions or products referred to in the content. |
© 2026 by the authors. Licensee MDPI, Basel, Switzerland. This article is an open access article distributed under the terms and conditions of the Creative Commons Attribution (CC BY) license.