


Abstract
Urban expansion directly reduces vegetation via impervious surface growth, though indirect urban environmental effects may partially offset these losses. This study examines the Beijing–Tianjin–Hebei (BTH) region from 2000 to 2025 by integrating multi-source remote sensing and socioeconomic data to investigate the effects of urban expansion on vegetation greenness (NDVI) and productivity (NPP). The results show that impervious surfaces expanded from 21,747 km2 to 33,688 km2. Yet NDVI and NPP did not decline in tandem. Instead, they responded differently. NDVI exhibited broad increases—particularly in the northwest ecological zones. NPP was more sensitive to impervious surface expansion. Further analysis reveals that impervious surface coverage is the primary driver of NPP, while per capita GDP dominates NDVI. Correlation analysis confirms these relationships are consistent in direction. The combined contribution of socio-economic variables (GDP, per capita GDP, and population) substantially exceeds that of impervious surface area. This suggests that economic development, as a whole, is the dominant force shaping vegetation greenness in the region. These findings challenge the conventional trade-off narrative between urban growth and vegetation health. They demonstrate that urban expansion and ecological improvement can advance in parallel. This requires sustained greening investments and coordinated regional planning. The results offer actionable insights for carbon-sensitive land-use regulation in rapidly urbanizing regions.
1. Introduction
Urbanization is one of the most profound human activities reshaping the Earth’s surface in the 21st century [1]. Currently, about half of the world’s population lives in cities, and this proportion is projected to reach 68% by the middle of this century, with approximately 6.5 billion people living in urban areas [2,3]. Urbanization has become a key driver reshaping global land-use patterns and altering the structure and function of terrestrial ecosystems [4]. As a central driver of socioeconomic development, the rapid expansion of urban Impervious Surface Area (ISA) has become a hallmark of urbanization. Artificial surfaces such as buildings and roads are constantly encroaching on ecological lands—including native vegetation and farmland—leading to a physical contraction of vegetation habitats. This directly reduces vegetation greenness and ecosystem productivity, representing a key negative impact of urbanization on ecosystems [5]. As a key component of the ecosystem’s carbon cycle, vegetation’s productivity and carbon sink capacity undergo dynamic changes that are closely linked to land use and the intensity of human activities, and these factors directly determine the regional carbon source-sink pattern [6,7]. However, amid rapid urbanization, the conflict between urban expansion and ecological conservation has become increasingly prominent. How to balance these two priorities has become a central issue on the global sustainable development agenda and a key component of United Nations Sustainable Development Goal 11 (Sustainable Cities and Communities).
Striking a balance between pursuing economic growth and improving environmental quality is a long-term, fundamental task for achieving sustainable development, and this is particularly urgent for developing countries [8,9]. However, the effectiveness of implementing the Sustainable Development Goals is greatly constrained by regional levels of socioeconomic development and natural resource conditions [9,10]. Regions with relatively weak developmental foundations often prioritize economic growth and accelerate industrialization and infrastructure development. While promoting social development, this inevitably harms the urban ecological environment, thereby posing a serious challenge to sustainable urban development [10]. Urban expansion and human activities are widely regarded as the primary drivers of environmental degradation, and as a result, natural systems around the world are under increasing pressure. Early research focused primarily on the direct effects of urban expansion on vegetation—specifically, the loss of greenness and productivity resulting from the replacement of vegetation by impervious surfaces. Liu et al. [11] found, based on DMSP/OLS nighttime light data, that urbanization in global metropolitan areas is significantly negatively correlated with vegetation degradation, and that the rate of vegetation loss is exponentially related to the intensity of urbanization. A study by Chen et al. [12] on Liaoning Province indicates that urban expansion between 2000 and 2010 led to a decline in net primary productivity (NPP) of approximately 12.7%, and that the intensity of this impact increased with the size of the city. Li et al. [13] used the InVEST model to study the spatiotemporal evolution of carbon stocks in the Beijing–Tianjin–Hebei (BTH) metropolitan area and found that urban land expansion is the primary driver of carbon loss, but they did not distinguish between different impact pathways.
Urban development and the ecological environment can be mutually reinforcing; urbanization can not only alter carbon sinks through land-use changes but also indirectly influence vegetation carbon uptake by altering the urban environment [14]. Driven by a combination of factors—including ecological policies, increased investment in urban greening, meticulous human management, and changes in the local urban climate—the greenness and productivity of urban vegetation have improved [15,16,17,18]. Zhao et al. [19] used vegetation indices to distinguish between the direct and indirect effects of urbanization on vegetation and found that indirect effects offset approximately 40% of the direct loss of vegetation in China’s provincial capitals. In their study of urban environments in the United States, Jia et al. [16] found that more than 88% of urban pixels contribute to carbon sinks, offsetting approximately 30% of carbon losses on average. In their study of the Yangtze River Delta urban agglomeration, Yin et al. [20] confirmed that between 2000 and 2020, ISA, the Enhanced Vegetation Index (EVI), and Gross Primary Production (GPP) all increased simultaneously in the region. Following the implementation of the ecological civilization strategy, the positive indirect effects of urbanization experienced explosive growth, underscoring the key role of policy in balancing urban development and ecological conservation. Chen et al. [12] further compared differences between urban agglomerations in the Northern and Southern Hemispheres and concluded that the vegetation-carbon sink systems of urban agglomerations in developing countries are more responsive to human intervention, and that policy measures and investments in greening can effectively offset the negative impacts of urban expansion.
Since the beginning of the 21st century, developing countries have undergone rapid urban expansion, with China serving as a prime example [20,21]. In recent years, China has undergone the largest and fastest urbanization process in the world. Urban agglomerations have become the core spatial entities supporting population concentration, economic production, and land development, and serve as a prime testing ground for analyzing the coupling between human activities and terrestrial ecosystems [22,23,24]. The BTH metropolitan area is the economic hub of northern China and a region of national strategic importance. In 2024, the region’s gross domestic product reached 11.5 trillion yuan, 2.1 times the level recorded in 2013. In 2014, the coordinated development of the BTH region was elevated to a national strategy, and the relocation of non-capital functions became the core task of the region’s coordinated development [25]. However, the region also faces serious ecological challenges, such as vegetation degradation in the northwestern ecological barrier zone, the intensifying urban heat island effect in the southeastern plains, and the region’s steadily widening carbon deficit [26,27]. Previous studies have confirmed that between 2000 and 2020, driven primarily by an increase in land converted to urban use, the intensity of land development in the BTH region showed an overall upward trend; anthropogenic carbon emissions in the region exceeded carbon absorption by vegetation, but this trend gradually slowed and began to reverse after 2011 [26]. This unique policy context and the characteristics of its ecological evolution make the BTH urban agglomeration an ideal case study for researching the interactions between urbanization and ecosystem carbon sinks.
While numerous studies have examined urbanization effects on either vegetation greenness (NDVI) or NPP in Chinese cities [16,19,20], three critical gaps remain. First, most studies treat NDVI and NPP as interchangeable indicators of vegetation condition, implicitly assuming that greening equates to carbon sink enhancement. However, NDVI reflects structural vegetation cover, which can be rapidly improved through tree planting, whereas NPP reflects functional carbon fixation capacity, which depends on complete ecosystem processes that are more difficult to restore. This distinction carries fundamentally different policy implications, yet the divergent responses of NDVI and NPP to urban expansion have received insufficient attention. Second, existing Random Forest applications in urban vegetation studies typically report individual variable importance rankings, but when predictors are correlated (as GDP, per capita GDP, and population often are), these rankings become unstable. A grouped interpretation strategy that aggregates socio-economic variables as a coherent ‘economic development’ dimension would provide more robust evidence for policy-making. Third, the BTH region offers a unique case for examining the NDVI–NPP divergence because it has experienced both rapid urban expansion and intensive greening investments under the coordinated development strategy, providing a natural setting for testing whether structural greening and functional recovery follow the same trajectory.
To address these gaps, this study asks: Do vegetation greenness and productivity respond to urban expansion in the same way, or do they follow divergent pathways, and what does this divergence imply for carbon sink management? By simultaneously examining NDVI and NPP, using a grouped interpretation of Random Forest importance to address collinearity, and interpreting our findings within the context of the BTH region, we provide novel insights into the differential sensitivity of structural versus functional vegetation indicators to urbanization. These findings offer transferable lessons for carbon sink management and land-use regulation in other rapidly urbanizing regions.
At the same time, we deeply recognize that although climatic factors such as precipitation and temperature are generally considered to be important drivers of vegetation dynamics, the focus of this study lies in quantifying the relative importance of urbanization and socio-economic factors. This focus is supported by a growing body of evidence indicating that human activities, especially land use change and urban expansion, are the dominant forces shaping vegetation change across most of the region [28,29,30,31]. We acknowledge the influence of climate factors but emphasize that the primary objective of this study is to assess the impacts of urbanization on vegetation greenness and productivity, rather than to comprehensively separate all climatic and anthropogenic drivers.
2. Data and Methods
2.1. Study Area
The BTH region is located in the heart of northern China (Figure 1). It comprises Beijing, Tianjin, and 11 prefecture-level cities in Hebei Province, and is situated between 36°01′ and 42°40′ north latitude and 113°04′ and 119°53′ east longitude. The total land area of the region is approximately 216,000 km2 [32]. The region’s topography forms a stepped pattern, with the northwest being higher and the southeast lower. The Yanshan and Taihang Mountains in the northwest are predominantly forested, while the central and southeastern parts consist of the North China Alluvial Plain, and the eastern part borders the Bohai Sea. The region has a temperate, semi-humid, semi-arid, continental monsoon climate, with an average annual temperature of 4–14 °C and average annual precipitation of 350–700 mm. Vegetation types, from northwest to southeast, are forests, shrublands, grasslands, and cropland [26].
Figure 1.
Geographic location (a), topography (b), and land use/land cover in 2025 (c) of the BTH region.
2.2. Data Sources and Processing
2.2.1. Urbanization Analysis Data
This study uses impervious surfaces to characterize trends in urbanization. The China Land Cover Dataset (CLCD), developed by Yang and Huang [33], was used to extract and analyze impervious surfaces. The CLCD dataset has now been updated through 2025 [34] with a spatial resolution of 30 m. This dataset employs a classification system that divides land cover types into nine categories: cropland, forest, shrubland, grassland, water bodies, snow and ice, bare ground, impervious surfaces, and wetlands. The training samples for the CLCD dataset were obtained through two methods: (1) stable samples extracted from the China Land Use/Cover Dataset (CLUD); (2) samples derived from visual interpretation based on satellite time-series data and high-resolution imagery from Google Earth and Google Maps. This ultimately resulted in the construction of a training dataset that comprehensively covers the major land cover classes of mainland China. Validation results based on 5463 independent visually interpreted samples indicate that the overall accuracy of CLCD reaches 79.31% [30]. A comparative validation study by Xu et al. (2024) [35] based on regions in China indicates that CLCD is the most accurate 30-m land cover dataset, with an overall accuracy of 86.98 ± 0.76%, outperforming CNLUCC, GLC_FCS30, and GlobeLand30.
2.2.2. Vegetation Greenness Data
Vegetation greenness was assessed using the MODIS 16-day 250-m continuous time-series Normalized Difference Vegetation Index (NDVI) product (MOD13Q1.061 Terra Vegetation Indices 16-Day Global 250 m) [36]. This product is based on observation data from the Moderate Resolution Imaging Spectroradiometer (MODIS) aboard the Terra satellite, with a spatial resolution of 250 m and a temporal resolution of 16 days (https://lpdaac.usgs.gov/products/mod13a2v061/), URL (accessed on 22 April 2026). In this study, annual NDVI maximum values were generated from raw data using the Maximum Value Composition (MVC) method. NDVI is defined as the ratio of the difference between the reflectance in the near-infrared band and the red band to the sum of the two:
In the equation, represents the surface albedo in the near-infrared band (858 nm), and represents the surface albedo in the red band (645 nm). NDVI values range from −1 to 1, with negative values typically corresponding to clouds, water bodies, and snow-covered areas; values near zero correspond to bare soil or rock; and positive values indicate vegetation cover and increase as the coverage increases.
2.2.3. NPP Data
This study uses NPP to conduct a spatiotemporal quantitative analysis of ecological carbon sinks in the BTH region. The data are sourced from the MOD17A3HGF v061 global annual NPP product released by NASA Earthdata [36,37]. It is based on observations from the Moderate Resolution Imaging Spectroradiometer (MODIS) aboard the Terra satellite, and the annual NPP is derived by combining all 8-day net photosynthesis (PSN) products (MOD17A2H) for a given year. The PSN value is defined as the difference between gross primary productivity (GPP) and maintenance respiration (MR) (GPP–MR), where GPP is calculated using the MOD15A2H leaf area index (LAI)/photosynthetically active radiation (FPAR) ratio product and daily meteorological reanalysis data, implemented using an improved light use efficiency model. The dataset has a spatial resolution of 500 m and a temporal resolution of 1 year, covering global land areas from 2000 to the present; the product has now been updated through 2025.
2.2.4. Socioeconomic Data
This study uses GDP, GDP per capita, and population (POP) as the primary socioeconomic indicators. GDP and population data are sourced from the China Statistical Yearbook published by the National Bureau of Statistics. GDP per capita is calculated based on GDP and population data.
All GDP and per capita GDP figures are expressed in Chinese yuan (CNY) at constant 2000 prices to account for inflation. Since the analysis focuses on cross-temporal comparisons within China, and the yuan is the unit of measurement most relevant and easily understood by Chinese stakeholders, the yuan is retained as the primary unit.
2.3. Methods
This study employs a multi-step analytical framework combining trend analysis, machine learning regression, and spatial statistics. The Theil–Sen median slope estimator and the Mann–Kendall test were selected for trend detection because they are non-parametric, robust to outliers, and do not require normality assumptions—making them particularly suitable for long-term NDVI and NPP time series that often contain missing values and non-normal distributions [38,39,40,41]. For driver importance assessment, we adopted Random Forest regression over conventional linear regression or geographically weighted regression for three reasons: (1) Random Forest captures non-linear relationships and high-order interactions among predictors without prior specification; (2) it handles multicollinearity better than ordinary least squares; and (3) its permutation-based importance metric provides a robust ranking of predictor contributions that is less sensitive to scaling than regression coefficients [42,43,44,45].
All remote sensing datasets were resampled to a common 500 m resolution using bilinear interpolation to ensure spatial alignment across analyses. Socioeconomic data (GDP, POP) were assigned to all pixels within each city administrative boundary, assuming uniform distribution across each city. While this aggregation approach is standard in regional-scale urban ecological studies, it may introduce uncertainty in the spatial relationships.
2.3.1. Trend and Statistical Analysis
This study employs a combined approach using the Theil-Sen median slope estimate [38,39] and the Mann–Kendall significance test [40,41] to analyze long-term trends in ecological and environmental indicators in the BTH region. Sen’s trend analysis is used to quantify the rate of year-over-year change in time-series indicators; it characterizes the overall trend strength by calculating the median of the slopes between all pairs of samples in the sequence [39]. The Mann–Kendall significance test is used to determine whether a time series exhibits a significant monotonic trend [40,41]. This method has been widely applied in studies of vegetation dynamics and the carbon cycle. It offers advantages such as no requirements regarding data distribution and insensitivity to outliers and missing values, making it particularly suitable for trend analysis of long-term remote sensing data [42,43].
2.3.2. Analysis of Relationships Among Variables
To quantify the relative importance of ISA, POP, GDP, and per capita GDP on NDVI and NPP, this study employed a Random Forest Regression model. Random Forest is a non-parametric ensemble learning algorithm based on decision trees. It uses bootstrap sampling to generate multiple training subsets, constructs a regression decision tree for each subset, and averages the predictions from all trees as the final output. This method is robust to multicollinearity, effectively captures non-linear relationships and high-order interactions among predictors without requiring prior specification, and does not assume normality of the data—making it particularly suitable for complex ecological and environmental data [20,43,44]. It is particularly well suited for complex interaction scenarios in ecological and environmental data [43,45].
The analysis was conducted at the region-year level, where each observation represents one year (2000–2025) for the entire BTH region, yielding a total sample size of n = 26. The dataset was randomly split into a training set (70%) and a testing set (30%), with a fixed random seed set before analysis to ensure reproducibility. The model was configured with the following parameters: number of trees (ntree) = 100; splitting criterion = mean squared error (MSE); minimum samples for internal node split = 2; minimum samples for leaf node = 1; maximum tree depth = 10; and all features considered at each split (mtry = number of predictors = 4). Model performance was evaluated using ten-fold cross-validation, with metrics including R2, MSE, RMSE, MAE, and MAPE. Variable importance was assessed using the percentage increase in mean squared error (%IncMSE)—the decline in prediction accuracy after randomly permuting the values of a given variable. A larger decline indicates greater importance of that variable. Given the limited sample size (n = 26), we assessed the stability of variable importance rankings using Bootstrap resampling (1000 iterations). For each iteration, a Random Forest model was fitted to a bootstrap sample of the data, and importance scores (%IncMSE) were recorded for each predictor. The 2.5th and 97.5th percentiles of the bootstrap distribution were used as 95% confidence intervals for each variable’s importance. A stability score was also calculated as the proportion of bootstrap iterations in which each predictor maintained its relative rank position. While Random Forest is inherently robust to multicollinearity, highly correlated predictors can cause importance scores to be diluted—the model distributes importance among correlated variables rather than assigning full credit to a single one. To avoid over-interpreting the minor differences among these economic indicators, we adopted a grouped interpretation strategy, emphasizing the combined contribution of economic variables as a unified socioeconomic dimension.
To further clarify the directionality of the relationships, we supplemented the Random Forest analysis with Pearson correlation analysis. The correlation matrix shows the sign and strength of pairwise correlations between ISA, POP, GDP, per capita GDP and NDVI/NPP, providing directional evidence to complement the importance rankings. The two methods are complementary: correlation analysis reveals the direction of linear relationships, while Random Forest quantifies the explanatory power of each predictor.
2.3.3. Software and Tools
All statistical analyses, including Theil–Sen slope estimation, Mann–Kendall trend tests, Random Forest regression, Bootstrap resampling, and Pearson correlation analysis, were performed in R (version 4.3.1). Specifically, the Theil–Sen and Mann–Kendall tests were implemented using the trend package (version 1.1.4), Random Forest regression using the Random Forest package (version 4.7-1.1), and Bootstrap resampling using the boot package (version 1.3-30). Spatial data preprocessing and mapping were conducted in ArcGIS 10.7. Remote sensing data acquisition and initial processing were carried out on the Google Earth Engine (GEE) platform. Figures and data visualization were prepared using Origin 2024. A fixed random seed was set for all Random Forest and Bootstrap analyses to ensure result reproducibility.
3. Results
3.1. Spatio-Temporal Characteristics of ISA
The ISA in the BTH region increased significantly over time from 2000 to 2025, and a significant upward trend was observed in each of the three subregions—Beijing, Tianjin, and Hebei (Figure 2). In 2000, the total area of impervious surfaces in the BTH region was approximately 21,747 km2, accounting for about 10.1% of the region’s total land area. Since then, urban land use has continued to expand, reaching a total area of approximately 33,688 km2 by 2025, with the proportion rising to about 15.6%. Over the course of 25 years, the cumulative expansion was approximately 11,941 km2, with an average annual expansion of about 477.6 km2. In terms of the expansion phase, urban expansion in the BTH region has exhibited a phased pattern of initially accelerating and then slowing down. From around 2000 to 2015, the expansion rate was relatively fast, averaging approximately 572.7 km2 per year; from 2015 to 2025, the expansion rate slowed, averaging approximately 335.1 km2 per year (Figure 2).
Figure 2.
Trends in ISA in the BTH Region, 2000–2025. Beijing (a); Tianjin (b); Hebei (c); BTH (d).
At the provincial level, Hebei Province is the primary driver of urban expansion in the BTH region, with its area expanding from 16,915 km2 in 2000 to approximately 25,889 km2 in 2025, resulting in an increase of approximately 8974 km2 of impervious surface. Tianjin Municipality ranks second, with an increase of approximately 1617 km2 of impervious surface. Beijing Municipality saw the smallest increase, at approximately 1350 km2. It is worth noting that around 2015, the area of impervious surfaces in Beijing and Tianjin had stabilized, with the rate of increase gradually slowing, while Hebei Province continued to experience rapid growth between 2000 and 2025 (Figure 2).
In terms of spatial distribution, impervious surfaces in the BTH region are primarily concentrated in the southeastern area. Beijing, Tianjin, and Langfang form a high-density, continuous belt of impervious surfaces along their shared border. Meanwhile, the central urban areas of prefecture-level cities in central and southern Hebei—including Shijiazhuang, Tangshan, Handan, Baoding, Cangzhou, and Hengshui—continue to expand outward, resulting in a pattern of integrated, contiguous development of impervious surfaces. In contrast, Zhangjiakou and Chengde are primarily covered by forests and grasslands, with only small, concentrated patches of impervious surfaces in their respective city centers. There is no large-scale expansion into the suburbs, and impervious surfaces are distributed as isolated, scattered points (Figure 3).
Figure 3.
Distribution of Impervious Surfaces in the BTH Region, 2000–2025. The red areas represent areas covered by impervious surfaces; the sections on the right show, in order, detailed maps of Beijing, Tianjin, and Shijiazhuang. The years represented in the figure are 2000 (a); 2005 (b); 2010 (c); 2015 (d); 2020 (e); 2025 (f).
A detailed analysis of the distribution of impervious surfaces in Beijing, Tianjin, and Shijiazhuang—the capital of Hebei Province—reveals that Beijing and Tianjin have high levels of urbanization, with impervious surfaces expanding in concentric rings; the central urban areas are completely covered by high-density impervious surfaces. As a secondary urban center in Hebei Province, Shijiazhuang’s impervious surfaces expand in concentric circles outward from the central urban area as a single focal point. High-density impervious surfaces are concentrated in the city center, while those in the outlying suburbs are fragmented and scattered, resulting in a much lower degree of contiguity compared to Beijing and Tianjin. Consequently, the city’s sphere of influence is smaller, and the integration of urban and rural construction land remains relatively low.
3.2. Characteristics of Changes in NDVI and NPP
We calculated the annual average greening index for the BTH region. Overall, over the past 26 years, vegetation greenness in the region declined after a slight increase in 2005, followed by a slight increase after 2020 (Figure 4). This indicates that the region’s vegetation has gradually recovered following a period of rapid urban development.
Figure 4.
Trends in NDVI in the BTH Region, 2000–2025.
Spatially, vegetation greenness in the BTH region exhibits a spatial pattern characterized by higher values in the northwest and lower values in the southeast, and the area of vegetation cover has shown a gradual expansion over time (Figure 5). Areas with high vegetation cover are primarily distributed in the northwestern part of the study area, where the terrain is more undulating and human disturbance is relatively minimal. From a temporal perspective, areas with high vegetation cover expanded steadily from west to east and then from north to south between 2000 and 2025. Areas with moderate vegetation cover were primarily distributed in the southeastern part of the North China Plain. Compared to 2000, the area of moderate vegetation cover patches in this region increased significantly by 2025, reflecting an improvement in urban greening levels alongside rapid urbanization. Areas with low vegetation cover are primarily located in the central built-up areas of major cities such as Beijing, Tianjin, and Shijiazhuang, as well as in some saline-alkali and tidal flat regions in the southeast. From 2000 to 2025, vegetation greenness in city centers has steadily increased, while areas with low vegetation cover have gradually decreased.
Figure 5.
Spatial Distribution Characteristics of NDVI in the BTH Region, 2000–2025. The years represented in the figure are 2000 (a); 2005 (b); 2010 (c); 2015 (d); 2020 (e); 2025 (f).
Figure 6 shows the interannual trends in NPP in the BTH region from 2000 to 2025. Overall, the NPP in the study area exhibits a fluctuating upward trend over the time series, with the annual average NPP rising from 0.42 kg C·m−2·yr−1 to approximately 0.56 kg C·m−2·yr−1, an increase of about 33.3% (Figure 6). NPP in the three subregions of Beijing, Tianjin, and Hebei all show an upward trend, but there are significant differences among them. Specifically, the multi-year average NPP in Beijing is approximately 0.71 kg C·m−2·yr−1, with an NPP of about 0.57 kg C·m−2·yr−1 in 2000, increase to approximately 0.80 kg C·m−2·yr−1 by 2025—a rise of about 40.4%. Tianjin has the highest NPP value, with a long-term average of approximately 0.86 kg C·m−2·yr−1, but the rate of increase is modest. The annual average NPP rose from 0.80 kg C·m−2·yr−1 in 2000 to 0.83 kg C·m−2·yr−1 in 2025, an increase of approximately 3.8%. NPP in Hebei Province is relatively low, with a long-term average of approximately 0.47 kg C·m−2·yr−1. The annual average NPP is projected to rise from 0.38 kg C·m−2·yr−1 in 2000 to 0.52 kg C·m−2·yr−1 in 2025, representing an increase of approximately 36.8%.
Figure 6.
Trends in NPP in the BTH Region, 2000–2025.
Spatially, NPP in the BTH region exhibits significant spatial variation (Figure 7). In terms of spatial patterns, NPP in the BTH region exhibits a distribution characterized by higher values in the northwest and lower values in the southeast. High-value areas (NPP > 0.8 kg C·m−2·yr−1) are primarily concentrated in the Yanshan–Taihang Mountains in the northwest. This region is dominated by forests and grasslands, features high vegetation cover, and experiences minimal human disturbance, making it the core carbon sink area of the BTH region. Areas with low carbon sequestration rates (<0.2 kg C·m−2·yr−1) are primarily located in the urban areas of Beijing and Tianjin, as well as in the urban clusters of the central and southern plains of Hebei Province. These areas are characterized by dense development, a high proportion of impervious surfaces, and relatively weak carbon sequestration capacity of vegetation. From a temporal perspective, between 2000 and 2025, the extent of the high-value zones in the BTH region showed a trend of gradual expansion year by year, with the most pronounced expansion occurring between 2010 and 2020. By 2025, the area of the high-value zones in the northwest had further increased, while the area of the low-value zones in the southeast had somewhat decreased, indicating that the region’s vegetation carbon sequestration capacity generally improved spatially over the study period.
Figure 7.
Spatial Distribution Characteristics of NPPs in the BTH Region, 2000–2025. The years represented in the figure are 2000 (a); 2005 (b); 2010 (c); 2015 (d); 2020 (e); 2025 (f).
We also analyzed the spatial trends in vegetation greenness and NPP in the BTH region (Figure 8). In terms of trend strength, both the slopes of change for NDVI and NPP exhibited a spatial pattern of positive trends in the northwest and negative trends in the southeast. Areas with a significant increase in NDVI (slope > 0.03/year) are primarily located in the Yanshan–Taihang Mountains region in the northwest, while areas showing a declining trend in NDVI (slope < −0.003/year) are concentrated in the built-up areas of the core urban districts of Beijing and Tianjin and the urban agglomeration of central and southern Hebei. The trend in NPP is generally consistent with that of NDVI; areas of significant increase (Slope > 20 g C·m−2·yr−1) are also concentrated in the northwestern ecological land-use zones, while areas of decline (Slope < −5 g C·m−2·yr−1) primarily correspond to urban expansion hotspots.
Figure 8.
Trends in NDVI and NPP in the BTH Region, 20002025. The subgraphs respectively represent NDVI Slop (a); NPP Slop (b); NDVI Trend (c); NPP Trend (d).
In terms of trend significance, the upward trends in NDVI and NPP in the northwest mostly passed the significance test, indicating a statistically significant increase and suggesting that the improvement in vegetation in this region is statistically robust; in contrast, the downward trends in the agricultural areas of the southeastern plains and the urban fringe zones exhibit considerable spatial heterogeneity, with some areas failing to pass the significance test.
3.3. The Relationship Between ISA, NDVI and NPP
We first analyzed the relationship between three socioeconomic indicators (population, GDP, and GDP per capita) and ISA, and then used a random forest model to conduct a comprehensive analysis of the socioeconomic factors affecting NDVI and NPP (Figure 9). The results indicate that population, GDP, and GDP per capita all have significant positive correlations with ISA, with GDP showing a stronger correlation with ISA, with an R2 of 0.948 (Figure 9b).
Figure 9.
Relationships between POP (a), GDP (b), and GDP per capita (c) and ISA, as well as the relative importance of socioeconomic factors and ISA on vegetation. (d) shows the relative importance of NDVI, and (e) shows the relative importance of NPP.
To further examine the direction and strength of all pairwise relationships, we calculated Pearson correlation coefficients among ISA, POP, GDP, per capita GDP, NDVI, and NPP (Figure 10). The results show that all variables are significantly positively correlated with each other (p < 0.01), with correlation coefficients ranging from 0.6 to 1.0. Notably, the three economic variables (GDP, per capita GDP, and POP) exhibit very strong inter-correlations, and ISA shows strong correlations with all economic variables and with NPP. NDVI shows the strongest correlation with per capita GDP (r = 0.753), followed by GDP (r = 0.747) and ISA (r = 0.740). These correlation patterns provide directional evidence that vegetation greenness and productivity tend to increase alongside urbanization and economic development at the regional scale.
Figure 10.
Correlation Between Variables. All the results passed the significance test, and the p-values were all less than 0.01.
The results of the random forest model show that per capita GDP has the highest relative importance for NDVI, at 26.5%, followed by GDP, with a relative importance of 26.3%; together, these two factors account for more than 52% (Figure 9d), indicating that economic scale and level of economic development are the most significant factors influencing vegetation greenness in the BTH region. The relative importance of population is 25.9%; the relative importance of ISA is 21.3%, ranking last among the four factors.
However, given the strong collinearity among GDP, per capita GDP, and population revealed by the correlation analysis (r > 0.95) and the limited sample size (n = 26), the minor differences among these three economic indicators (26.5% vs. 26.3% vs. 25.9%) should not be interpreted as a meaningful rank order. Instead, we emphasize that socio-economic variables as a group (GDP + per capita GDP + population) account for 78.7% of the importance for NDVI, substantially exceeding the 21.3% contribution of ISA. This grouped difference is robust, as confirmed by Bootstrap 95% confidence intervals which overlap among individual economic variables but consistently separate the economic group from ISA across all 1000 bootstrap iterations.
Unlike NDVI, the relative importance of ISA for NPP increased significantly to 27.6%, making it the primary factor influencing vegetation productivity (Figure 9e). This is followed by GDP per capita, with a relative importance of 26.0%, then population, with a relative importance of 24.0%, and GDP, with a relative importance of 22.4%. This reflects that vegetation productivity is more directly and sensitively affected by changes in land cover than by vegetation greenness.
For NPP, the Bootstrap confidence intervals show that ISA’s importance is consistently higher than that of individual economic variables, though the grouped economic contribution (72.4%) still exceeds ISA individually. This suggests that while ISA has the strongest individual effect on NPP, economic factors as a whole remain highly influential.
4. Discussion
4.1. Spatio-Temporal Patterns of Impervious Surface Expansion in the BTH Region
This study found that impervious surfaces in the BTH region continued to expand between 2000 and 2025, but the rate of expansion exhibited a phased pattern—accelerating initially and then slowing down—a trend that closely aligns with the region’s policy transition. Following the implementation of the BTH Coordinated Development Strategy in 2014, Beijing became the nation’s first megacity to pursue “development through reduction,” shifting its urban expansion from “incremental expansion” to “optimization of existing development” [46]. This pattern of phased changes is highly consistent with the theory of impervious surface evolution stages, which was derived from a 30-year global time series of urban remote sensing data [47].
At the spatial level, the gradient differentiation of rings is a core characteristic of impervious surface distribution. Impervious surfaces account for a stable proportion of over 60% in urban core areas, while the suburban rings surrounding the city center serve as key growth hubs, and impervious surfaces on rounded plains exhibit a “0–3” pattern of distribution. In the Yanshan and Taihang Mountains ecological barrier zone in the north, where terrain and ecological red line regulations impose restrictions, the growth of impervious surfaces has virtually stalled, exhibiting a distinct pattern of “sparse in the northwest and dense in the southeast.” The plains of central and southern Hebei feature flat terrain and extensive contiguous farmland without topographical barriers, making it extremely easy for large, contiguous areas of impervious surfaces to form. In contrast, the northern mountainous and plateau regions are subject to strict ecological conservation policies, resulting in extremely low urban development intensity over the long term [48]. This spatial differentiation not only reflects differences in topography and socioeconomic conditions but also demonstrates the regulatory impact of the BTH Main Functional Zone Plan on urban expansion.
4.2. Trends in Vegetation Development During Urbanization
This study found that from 2000 to 2025, both NDVI and NPP in the BTH region showed an overall upward trend, exhibiting a spatial pattern characterized by “high values in the northwest and low values in the southeast,” with areas of high vegetation cover steadily expanding from the northwest toward the southeast. This result is consistent with the findings of Zhang et al. [31], which indicate that vegetation cover in the BTH region has shown a fluctuating upward trend, and that vegetation dynamics exhibit a distinct north–south differentiation. This suggests that urbanization does not necessarily lead to a decline in vegetation productivity and may even improve vegetation recovery. This has also been confirmed in a study of China’s Yangtze River Delta [20].
At the same time, we also found significant spatial heterogeneity in the trends of NDVI and NPP. Vegetation improvement in the northwest has primarily benefited from the continued implementation of policies such as converting farmland to forests, closing off mountains for afforestation, and ecological compensation, while vegetation changes in the southeastern plains have been driven by both urban expansion and urban greening. On the one hand, the expansion of impervious surfaces has led to a reduction in local vegetation; on the other hand, urban greening and park development have, to some extent, increased vegetation coverage within cities, reflecting the complexity of urbanization’s impact on vegetation [31].
However, it is important to note that the observed vegetation improvements in the BTH region cannot be attributed solely to these policy drivers. Climatic factors, particularly precipitation and temperature, also play a significant role in driving vegetation dynamics. In the Taihang–Yanshan ecological barrier area, NPP is positively correlated with precipitation in most areas, while its correlation with temperature is generally weak and negative [49]. Moreover, previous studies have shown that the dominant climate-driven area accounts for only about 6% of the total study area, and that human activities are the primary cause of vegetation degradation in urban areas [28]. However, background climate remains an important influence on vegetation phenology in the Beijing urban area [50]. Our analytical framework did not include these climatic covariates, and thus we refrain from making causal claims about the relative contribution of policy versus climate drivers. The observed associations are consistent with the hypothesis that greening policies have contributed to vegetation improvement, but they do not demonstrate causation. We acknowledge this as a limitation of our analytical framework and recommend that future research incorporating climatic covariates further refine the separation of natural and anthropogenic drivers.
Urban expansion and vegetation improvement can coexist in parts of the BTH region is consistent with recent studies examining land-use conversion patterns in this region. Xue and Hu [51] found that when croplands and grasslands are converted to construction lands in the BTH region, vegetation greenness declines while productivity paradoxically increases—a pattern not observed in the Yangtze River Delta or Pearl River Delta. This suggests that the ’coexistence ‘phenomenon may be related to the specific types of land-use conversions occurring in different functional zones [52]. Furthermore, policy-driven conversions from agricultural land to ecological land have made significant contributions to vegetation recovery, particularly during periods when land regulation policies were actively implemented [53]. While our study did not conduct a spatially explicit zoning analysis to delineate the precise distribution of these coexistence areas, the available evidence indicates that such areas are likely concentrated in regions where policy-driven ecological restoration and urban expansion have occurred in parallel—such as the northwestern ecological conservation zones and the peripheries of major urban centers [52,54]. Future research incorporating spatially explicit land-use conversion analysis would help further clarify the distribution and mechanisms of these coexistence patterns.
It is necessary to clarify the conceptual difference between annual NPP and long-term stable ecosystem carbon sinks in this study. NPP only characterizes the total carbon fixed by vegetation photosynthesis within one year, representing the annual carbon sequestration flux of vegetation communities, rather than the net carbon storage accumulated in vegetation and soil pools over a long period. Previous global terrestrial carbon cycle studies have proven that elevated NPP does not equal improved long-term carbon sink sustainability. Fast-growing pioneer vegetation (e.g., young shrubs and annual crops) often presents high annual NPP but short turnover cycles; most fixed carbon is consumed by autotrophic and heterotrophic respiration within a short time, resulting in limited net carbon accumulation in soil organic pools. In contrast, mature forest ecosystems with moderate NPP can form persistent carbon sinks due to slow biomass turnover and stable soil organic carbon input. This paper solely relies on MODIS annual NPP products to reflect vegetation carbon fixation capacity, lacking net ecosystem productivity (NEP) or soil carbon pool auxiliary data to separate respiratory carbon loss. Therefore, all statements about carbon sink changes in this manuscript strictly refer to annual vegetation carbon fixation flux, rather than permanent ecosystem carbon stock growth. When interpreting the NPP rising trend in mountain ecological zones, we avoid overstating that regional long-term carbon storage capacity has been substantially enhanced. Follow-up research can combine GPP/NEP datasets to decompose carbon turnover efficiency and distinguish short-term carbon flux from long-term stable carbon sinks.
4.3. The Impact of Urbanization on Vegetation
The impact of urbanization on vegetation carbon sinks can be broken down into two pathways: direct and indirect effects. Direct effects refer to the loss of carbon sinks resulting from impervious surfaces replacing vegetation. Indirect effects refer to the promoting or inhibiting effects that changes in the urban environment brought about by urbanization have on the remaining vegetation carbon sinks [20,37].
Our finding that ISA is the primary driver for NPP (relative importance of 27.6%) but ranks lower for NDVI (21.3%) is consistent with the conceptual framework of Jia et al. [16] and Zhao et al. [19], who argued that vegetation greenness can be maintained or even enhanced through urban greening management, while productivity recovery depends on more fundamental ecosystem functional restoration. However, our ISA importance for NDVI (21.3%) is lower than that reported for the Yangtze River Delta by Yin et al. [20], where ISA was the dominant factor for both NDVI and NPP. This discrepancy may reflect the different urbanization stages of the two regions—the BTH region entered a ‘de-growth’ phase after 2014, where urban renewal and ecological restoration gradually weakened the negative impact of ISA on NDVI [46]. In contrast, the Yangtze River Delta experienced more continuous and intense urban expansion throughout the study period, with less emphasis on ‘de-growth’ policies until later years.
Following 2014 (the launch of the BTH Coordinated Development Strategy), ISA expansion rates showed a deceleration, while NDVI and NPP continued to rise. While these temporal patterns are consistent with the hypothesis that the coordinated development strategy may have contributed to this shift, we do not claim causal attribution. Our analytical framework does not employ quasi-experimental designs (e.g., breakpoint regression and difference-in-differences) to separate policy effects from natural trends.
Comparing our findings with other major urban agglomerations, the Yangtze River Delta (YRD) showed concurrent increases in ISA, NDVI, and GPP with strong indirect positive effects after 2011 [1], while the BTH region shows a similar pattern but with a later turning point (post-2014). In the Pearl River Delta (PRD), rapid urbanization in the 2000s led to initial vegetation degradation, followed by recovery in the 2010s due to greening policies [51]. The Chengdu–Chongqing region, which is at an earlier urbanization stage, still shows ongoing vegetation loss associated with urban expansion in some areas. These comparisons indicate that the relationship between urban expansion and vegetation dynamics follows a phased trajectory: rapid expansion, followed by congestion and degradation, then stabilization, and finally greening. However, the specific timing and intensity vary depending on regional policy environments and development stages.
The results of the random forest model in this study indicate that ISA is the primary factor influencing NPP (relative importance of 27.6%), whereas the relative importance of ISA in NDVI drops to last place, at 21.3%. This difference reveals distinct mechanisms by which greenness and productivity respond to urban expansion; NPP is more sensitive to urban expansion than NDVI. NDVI reflects vegetation greenness or vegetation cover, which can be improved in the short term through urban greening. NPP, on the other hand, reflects vegetation’s carbon sequestration capacity, and its recovery depends on the restoration of full ecosystem functions, which requires a longer time scale. This discrepancy has important policy implications for carbon sink management: while greening can “increase greenery,” it does not necessarily “increase carbon sinks”; the substantive restoration of carbon sink functions requires fundamentally curbing the encroachment of urban expansion on ecological space.
Luo et al. [55], based on a study of 1298 Chinese cities, found that urbanization affects vegetation carbon sinks through both direct and indirect pathways; urban expansion has negative direct and indirect effects, while green restoration has positive effects; population and economic urbanization primarily affect carbon sinks through indirect pathways. Among the mediating variables in the urban environment, the thermal environment is the key mediating variable [55]. This explains why, in the BTH region, despite the continued expansion of impervious surfaces, the regional NPP has continued to rise: the urban heat island effect has extended the growing season for vegetation, and investments in urban greening have increased vegetation coverage, with these indirect positive effects partially offsetting the direct loss of carbon [56,57]. A study by Shao et al. [45] of 112 Chinese cities further quantified this compensatory effect, finding that the indirect positive effect of urbanization on vegetation was strongest in old urban areas and weakest in suburban areas. A study by Wu et al. [58] found that although urban expansion directly encroaches on natural spaces, indirect urbanization effects have promoted increased urban vegetation growth and enhanced carbon sequestration capacity nationwide, thereby offsetting approximately 38.5% of the carbon loss resulting from the conversion to impervious surfaces. However, this indirect positive effect has thresholds, and these thresholds exhibit strong climate dependence [44]. For the BTH region, the fact that it spans both semi-arid and semi-humid climate zones means that the thresholds for indirect effects vary significantly among different cities, providing a scientific basis for differentiated urban greening management.
While our analytical framework distinguishes between direct and indirect effects, the specific transmission mechanisms of the indirect effects—including the urban heat island effect, CO2 fertilization, nitrogen deposition, and enhanced irrigation—were not directly quantified in this study. However, our empirical results are consistent with known indirect pathways documented in the literature [59,60]. Recent studies have demonstrated that urbanization promotes indirect vegetation growth through multiple pathways: the urban heat island effect extends the growing season and enhances photosynthetic activity in urban areas [59]; elevated CO2 concentrations in urban environments exert a fertilization effect that enhances vegetation productivity [60]; and nitrogen deposition from urban emissions can influence plant growth and biomass allocation, though effects vary by plant functional group [61]. Additionally, enhanced irrigation and urban greening management constitute important anthropogenic indirect pathways that have been shown to offset some of the direct carbon losses associated with urban expansion [59]. These mechanisms likely contribute to the positive indirect effects observed in this study.
We acknowledge that climatic covariates (precipitation, temperature) were not included in our analytical framework. However, previous studies have demonstrated that human activities are the dominant driver of vegetation change in the BTH region. Zhang et al. [31] identified land use type as the dominant overall factor affecting vegetation dynamics, with human activities playing the primary role. Zhao and Qie [30] quantified that human activities account for 54.89% of NPP change, slightly exceeding the 45.11% contribution of climate change. In the Taihang–Yanshan ecological barrier area, recent studies have demonstrated that only 23% of the region exhibits a strong correlation between NPP and climatic variables, while human activities exert a dominant influence across 79% of the area [28,29,30]. Similarly, climate-driven areas have been found to constitute merely 5.98% of the entire BTH region, with vegetation degradation overwhelmingly driven by anthropogenic pressures [28]. Their analysis further confirmed that among precipitation, temperature, and human activities, the latter exerts the greatest influence on vegetation variation. These findings provide strong contextual support for our analytical emphasis on socioeconomic and urbanization drivers. Nonetheless, we acknowledge that a more comprehensive framework integrating climate variables would further refine the separation of natural and anthropogenic influences, and we have identified this as a priority direction for future research.
The combination of Random Forest importance rankings and Pearson correlation coefficients suggests two distinct pathways through which urbanization affects vegetation in the BTH region. First, the direct pathway, the strong correlation between ISA and NPP and ISA’s high importance for NPP, reflects the immediate loss of carbon fixation capacity when vegetation is replaced by impervious surfaces. This is consistent with the well-established direct impact pathway documented by Zhao et al. [19] and Jia et al. [16]. Second, the indirect pathway—the strong grouped importance of economic variables for NDVI and the positive correlations between per capita GDP and NDVI, reflects the capacity of economic development to enable greening investments, urban management, and ecological restoration. This is consistent with the environmental Kuznets curve framework, where economic development beyond a certain threshold becomes compatible with environmental improvement. These two pathways operate simultaneously in the BTH region, explaining the ‘synergistic coexistence’ of urban expansion and vegetation improvement observed in this study.
Ecosystem responses to urbanization and management interventions often involve time lags, as vegetation productivity in a given year may reflect the cumulative effects of greening efforts and climatic conditions over several previous years. Studies in the BTH region have reported time lags of approximately three years for policy effects on vegetation [31]. Our contemporaneous Random Forest model captures the instantaneous relationships between predictors and vegetation indicators within the same year and does not account for such delayed responses. Future research could address this by incorporating lagged variables such as 1 to 3 year lags of ISA expansion, greening investments, and climatic conditions into the analytical framework, or by using distributed lag models such as ARDL (Autoregressive Distributed Lag) or panel regression approaches to quantify the temporal dynamics of vegetation responses to urbanization drivers. Such analyses would provide deeper insights into the timing and persistence of urbanization effects on vegetation carbon sinks.
4.4. Management Strategies
The differentiated responses of NDVI and NPP to urban expansion provide an evidence-based foundation for refining carbon management strategies in the BTH region. The following policy recommendations translate the empirical findings into actionable measures.
- (1)
- Functional-Zone Differentiation in Land-Use Regulation
Empirical studies have shown that ISA is the primary factor causing changes in NPP, but its impact on NDVI is only a secondary factor. This indicates that the carbon sink capacity of vegetation is more susceptible to the influence of urban expansion than its greenness. This has direct implications for spatial planning, and the planning should be adjusted according to the unique characteristics of each functional area.
Core urban functional zones (central Beijing and Tianjin): These areas should prioritize “stock optimization” strategies to enhance carbon sinks without expanding ISA. Specifically, we recommend (i) establishing minimum green cover ratios for new and renovated buildings (e.g., ≥30% green roof coverage for public buildings, as practiced in several Chinese cities), (ii) converting underutilized industrial and commercial land into pocket parks or community green spaces, and (iii) integrating carbon sequestration targets (e.g., NPP increment per capita) into the performance evaluation system for urban renewal projects.
Urban expansion zones (suburbs of Langfang, Baoding, and Shijiazhuang): In these rapidly developing peri-urban areas, policy should focus on “incremental control.” Since farmland conversion accounted for 91% of ISA expansion-related carbon loss in the BTH region [62], we recommend (i) establishing a differentiated ISA quota system that imposes stricter limits on the conversion of high-productivity farmland and core ecological patches, (ii) mandating Low-Impact Development (LID) practices—such as permeable pavements, retention basins, and green buffers—for all new large-scale developments, and (iii) requiring developers to achieve a minimum NPP compensation ratio through off-site greening or restoration projects for any unavoidable ISA expansion.
The differentiated management strategies proposed above are directly informed by the spatial heterogeneity observed in our results. The northwest ecological zones, particularly Zhangjiakou and Chengde in the Yanshan–Taihang mountain belt, require continued emphasis on ecological restoration and protection. Given that these areas contribute disproportionately to regional carbon sinks, policy should focus on “strengthening protection” through multiple coordinated actions: (i) continuing and expanding the Grain-for-Green and ecological restoration programs, with specific targets for afforestation and grassland recovery; (ii) increasing ecological compensation payments, indexed to annual NPP increments verified through remote sensing; and (iii) strictly enforcing the ecological redline policy to prevent any new ISA expansion within core conservation zones. In these areas, climatic factors may play a more significant role alongside policy interventions, and management strategies should remain adaptive to climate variability while maintaining the momentum of ecological recovery.
In contrast, the southeast urban and agricultural zones (Beijing, Tianjin, and the Hebei plain), where human activities dominate, require focused interventions on ISA control and greening investments. This spatial differentiation is essential for effective carbon sink management in the BTH region. The spatially targeted recommendations reflect our current understanding at the regional scale; future research at the sub-regional level would further refine these recommendations by identifying location-specific driver rankings and enabling more precise policy interventions.
- (2)
- Phased-Regulation Aligned with Urbanization Stages
Urban expansion is not an evenly distributed process over time; instead, it shows distinct acceleration, peak, and deceleration phases among different sub-regions [63,64]. Although we did not conduct a segmented analysis in detail, our research results initially revealed that this situation exists. This indicates that a one-size-fits-all policy is inappropriate; instead, the regulatory intensity should be adjusted according to different stages of urbanization.
During rapid expansion phases—characterized by high annual ISA growth rates and extensive conversion of farmland and natural land covers—policy should prioritize direct loss control by implementing stricter ISA caps, protecting high-productivity farmland, and enforcing ecological redlines. These measures aim to minimize the immediate carbon losses caused by land conversion.
During mature or post-growth phases—where ISA expansion has slowed and urban renewal becomes the dominant form of urban development—policy should shift emphasis toward indirect gain enhancement by sustaining and scaling up greening investments, promoting vertical greening and green infrastructure, and integrating carbon sink targets into urban regeneration projects. This phase also calls for strengthening the management of urban thermal environments to amplify the indirect positive effects of urbanization on vegetation productivity.
To operationalize this, we propose a biennial monitoring and review cycle that tracks ISA, NDVI, and NPP trends, and triggers adjustments in the regulatory framework when key indicators exceed predefined thresholds (e.g., annual ISA growth rate exceeding a regional baseline, or sustained NPP decline over two consecutive years in ecological function zones). This adaptive mechanism ensures that regulatory intensity remains responsive to the evolving urbanization trajectory and its carbon implications.
- (3)
- Multi-Level Carbon Compensation and Adaptive Governance
Given the spatial mismatch between carbon sources (concentrated in Beijing and Tianjin) and carbon sinks (concentrated in the ecological function zones of Zhangjiakou and Chengde), a multi-level carbon compensation mechanism is essential for achieving regional carbon neutrality.
Establish a horizontal carbon compensation fund, where high-emission urban districts contribute financial transfers to high-carbon-sink counties. The transfer amount should be indexed to annual NPP increments verified through satellite observations.
Introduce payments for ecosystem services (PES) that reward local communities for maintaining or improving vegetation productivity, monitored through annual NPP assessments and linked to verifiable improvements.
Align these compensation mechanisms with the existing ecological redline policy to ensure that protected areas receive adequate conservation funding and are integrated into broader spatial planning frameworks.
Finally, given the dynamic nature of urbanization and climate change, we recommend an adaptive governance approach in which the above policies are periodically evaluated and adjusted based on updated monitoring data and socio-economic projections. A biennial review cycle—aligned with the release of updated MODIS and CLCD data—would allow for timely policy adjustments and ensure that carbon management remains responsive to emerging challenges and opportunities.
4.5. Limitations of the Study
Several limitations should be acknowledged. First, the mismatch in spatial scales among datasets—30 m ISA, 250 m NDVI, 500 m NPP, and city-level socioeconomic data—may introduce aggregation uncertainties and potential distortions in statistical relationships. Although we resampled all remote sensing data to a common 500 m resolution, this process inevitably leads to loss of spatial detail and may affect the precision of the ISA-NDVI-NPP relationships at finer scales. Second, although our analyses were conducted at the regional scale using annual aggregated data—which substantially reduces the influence of local spatial dependencies—we acknowledge that spatial autocorrelation may still exist at the sub-regional level. Our use of non-parametric trend estimators (Theil–Sen and Mann–Kendall) and Bootstrap resampling partially mitigates this concern. Future sub-regional analyses should explicitly account for spatial autocorrelation using appropriate spatial statistical methods. Third, climatic covariates (precipitation, temperature) were not included in the Random Forest model. While previous studies indicate that human activities are the dominant driver of vegetation change in the BTH region [28,29,30,31], we acknowledge that climate factors play a role, particularly in the northwest mountainous areas. Future research integrating climate variables is needed to more precisely separate natural and anthropogenic influences. Fourth, the allocation of city-level socioeconomic data uniformly to all pixels within each administrative boundary may introduce aggregation uncertainty. This is a common approach in regional-scale studies, but finer-resolution socioeconomic data would improve spatial accuracy in future work. Fifth, the single NPP indicator has limitations for evaluating long-term carbon sink stability. This study only adopts annual vegetation NPP to characterize carbon sequestration flux, without introducing NEP or soil carbon data to deduct ecosystem respiration consumption. Higher NPP may correspond to rapid vegetation turnover and weak soil carbon accumulation, which cannot fully represent the persistent carbon storage capacity of the land ecosystem. Subsequent research can integrate GPP/NEP products to further quantify the sustainability of regional carbon sinks.
Future research should: (1) integrate climate variables (temperature, precipitation, and their seasonal patterns) to better separate natural and anthropogenic drivers—potentially using explainable machine learning methods such as SHAP values or Partial Dependence Plots to further strengthen the interpretation of Random Forest results by revealing the direction and shape of the relationships between urbanization drivers and vegetation indicators; (2) conduct sub-regional analyses at the city or county level to capture spatial heterogeneity in driver-response relationships; and (3) extend the direct vs. indirect impact framework to future scenarios (SSPs) to support proactive land-use planning and carbon neutrality pathways. Furthermore, we acknowledge that urbanization quality indicators, such as urban compactness, morphological complexity, and the intensity of greenery management, may also influence vegetation dynamics. Our study focused primarily on the quantity of urbanization, measured by ISA expansion, as the most direct and measurable driver of land cover change at the regional scale. Urban form characteristics such as landscape shape index, patch density, and compactness ratio, as well as management intensity indicators such as greening investment per capita, irrigation input, and park density, could provide a more comprehensive assessment of urbanization effects on vegetation. Future research should integrate these metrics to better capture the full spectrum of urbanization impacts, particularly in understanding how different urban forms affect the direct versus indirect pathways of vegetation change. Such integration would also help refine the spatially differentiated management strategies proposed in this study, as the effectiveness of interventions such as ‘stock optimization ‘and ‘pocket park ‘development may vary depending on local urban form characteristics. Our Random Forest analysis was conducted at the region-year level (n = 26), which provides an average overview for the entire BTH region. However, our results demonstrate strong spatial heterogeneity, particularly between the northwestern mountainous areas (Zhangjiakou, Chengde) and the southeastern plains (Beijing, Tianjin, Hebei plain). The ranking of driving factors may differ significantly between these sub-regions, as climatic factors likely play a larger role in the northwest while urbanization and socioeconomic factors dominate in the southeast. Our region-level analysis does not capture such spatial variation. This is a key limitation of our study. The region-year level design was intentionally chosen to provide a macro-level understanding of regional trends and to support policymaking at the provincial and inter-provincial scales. However, we acknowledge that this aggregate approach masks sub-regional differences. Future sub-regional analyses at the city or county level are needed to examine whether the relative importance of ISA versus socioeconomic factors differs between ecological function zones and urban expansion zones, and to identify location-specific drivers for targeted policy interventions. Such analyses would provide more nuanced evidence for spatially differentiated land-use regulation and carbon sink management.
It is also worth noting that the 2020–2025 period includes the COVID-19 pandemic years, during which temporary work stoppages and reduced human mobility may have temporarily affected vegetation greenness. While our analysis covers long-term trends (2000–2025) that are unlikely to be dominated by pandemic-related fluctuations, the inclusion of these years may introduce minor deviations from longer-term trends. Future studies with extended post-pandemic data could further clarify whether these effects were transitory or persistent.
5. Conclusions
This study analyzed urban expansion, vegetation dynamics, and their interrelationships in the BTH region from 2000 to 2025 using remote sensing and socioeconomic data. The main conclusions are as follows:
Urban expansion followed a phased pattern of initial acceleration followed by a slowdown. Impervious surfaces expanded from 21,747 km2 to 33,688 km2, with an average annual growth rate of 478 km2. Spatially, the southeastern plains have become nearly fully urbanized. In contrast, urban land in the northwestern Yanshan–Taihang Mountains remains scattered and isolated. This pattern reflects both topographical constraints and the region ‘s designation as an ecological conservation zone.
Vegetation greenness and productivity exhibit a “high in the northwest, low in the southeast” spatial pattern. Their responses to urban expansion, however, differ substantially. High-vegetation areas (NDVI > 0.6) are mainly distributed along the northwestern Yanshan–Taihang Mountains and have steadily expanded over the study period. Low-vegetation areas (NDVI < 0.2) are concentrated in megacity cores and have expanded outward with urban growth. NPP is more sensitive to impervious surface expansion than NDVI. Impervious surface coverage ranks first in importance for NPP (27.6%) but last for NDVI (21.3%). This suggests that vegetation productivity responds more directly and irreversibly to land cover change than greenness does.
The drivers of greenness and productivity also differ. For NDVI, per capita GDP ranks highest in importance (26.5%), followed by GDP (26.3%), population (25.9%), and ISA (21.3%). For NPP, ISA ranks highest (27.6%), followed by per capita GDP (26.0%), POP (24.0%), and GDP (22.4%). These contrasting rankings reveal a fundamental distinction: vegetation greenness is largely shaped by overall economic development and the capacity to invest in greening, whereas vegetation productivity remains most sensitive to the physical footprint of urban expansion and depends on full ecosystem recovery.
Urban expansion and vegetation improvement can coexist in parts of the BTH region. In the period following the 2014 Coordinated Development Strategy, urban expansion slowed while NDVI and NPP continued to rise. This suggests that urban greening investments, ecological restoration, and industrial restructuring may have contributed to positive indirect effects that offset some direct carbon losses from impervious surface growth. These findings provide empirical support for the view that urban expansion and ecological improvement can advance in parallel under appropriate policy and investment conditions. They also offer actionable insights for carbon-sensitive land-use regulation in rapidly urbanizing regions.
Author Contributions
Conceptualization, R.X., A.W. and Y.Z.; methodology, R.X. and A.W.; software, R.X.; validation, A.W. and B.N.; investigation, H.S. and Y.Q.; resources, R.X.; data curation, R.X.; writing—original draft preparation, R.X.; writing—review and editing, R.X.; visualization, R.X.; supervision, Y.Z. and X.L.; funding acquisition, R.X. All authors have read and agreed to the published version of the manuscript.
Funding
Pilot Project of the Fundamental Research Operating Expenses System of the Hebei Academy of Sciences (2026PF08).
Institutional Review Board Statement
Not applicable.
Informed Consent Statement
Not applicable.
Data Availability Statement
The data presented in this research are available on request from the corresponding author.
Conflicts of Interest
The authors declare no conflicts of interest.
References
- Yin, C.L.; Chen, R.S.; Xiao, X.M.; Qin, Y.W.; Meng, F.; Yao, Y.; Pan, L.; Zheng, L.L. Spatio-temporal evolution of vertical urban growth in China’s Yangtze River Delta from 1990 to 2020. Land Use Policy 2025, 153, 107542. [Google Scholar] [CrossRef] [Scilit]
- United Nations. World Urbanization Prospects: The 2018 Revision, ST/ESA/SER.A/420; United Nations Department of Economics and Social Affairs, Population Division: New York, NY, USA, 2019. [Google Scholar]
- United Nations. World Population Prospects 2022: Summary of Results; United Nations: New York, NY, USA, 2022. [Google Scholar]
- Gong, P.; Li, X.C.; Wang, J.; Bai, Y.Q.; Chen, B.; Hu, T.Y.; Liu, X.P.; Xu, B.; Yang, J.; Zhang, W.; et al. Annual maps of global artificial impervious area (GAIA) between 1985 and 2018. Remote Sens. Environ. 2020, 236, 111510. [Google Scholar] [CrossRef] [Scilit]
- Chen, J.; Qiu, B.; Chakraborty, T.C.; Miao, X.; Cao, Y.P.; Li, L.F.; Zhao, S.W.; Ni, Y.Y.; Tian, X.H.; Qian, Y.; et al. Contrasting effects of urbanization on vegetation between the Global South and Global North. Nat. Sustain. 2025, 8, 373–384. [Google Scholar] [CrossRef] [Scilit]
- Endreny, T.A. Strategically growing the urban forest will improve our world. Nat. Commun. 2018, 9, 1160. [Google Scholar] [CrossRef] [Scilit] [PubMed]
- Kondo, M.C.; Fluehr, J.M.; McKeon, T.; Branas, C.C. Urban green space and its impact on human health. Int. J. Environ. Res. Public Health 2018, 15, 445. [Google Scholar] [CrossRef] [Scilit] [PubMed]
- Seto, K.C.; Golden, J.S.; Alberti, M.; Turner, B.L. Sustainability in an urbanizing planet. Proc. Natl. Acad. Sci. USA 2017, 114, 8935–8938. [Google Scholar] [CrossRef] [Scilit] [PubMed]
- Liu, B.S.; Wang, T.; Zhang, J.M.; Wang, X.M.; Chang, Y.; Fang, D.P.; Yang, M.J.; Sun, X.Z. Sustained sustainable development actions of China from 1986 to 2020. Sci. Rep. 2021, 11, 8008. [Google Scholar] [CrossRef] [Scilit] [PubMed]
- Wang, J.; Zhang, Y.Z.; Zhang, X.L.; Song, M.Q.; Ye, J.P. The spatio-temporal trends of urban green space and its interactions with urban growth: Evidence from the Yangtze River Delta region, China. Land Use Policy 2023, 128, 106598. [Google Scholar] [CrossRef] [Scilit]
- Liu, Y.; Wang, Y.; Peng, J.; Du, Y.; Liu, X.; Li, S.; Zhang, D. Correlations between Urbanization and Vegetation Degradation across the World’s Metropolises Using DMSP/OLS Nighttime Light Data. Remote Sens. 2015, 7, 2067–2088. [Google Scholar] [CrossRef] [Scilit]
- Chen, T.; Huang, Q.H.; Liu, M.; Li, M.C.; Qu, L.A.; Deng, S.L.; Chen, D. Decreasing Net Primary Productivity in Response to Urbanization in Liaoning Province, China. Sustainability 2017, 9, 162. [Google Scholar] [CrossRef] [Scilit]
- Li, H.R.; Liu, Y.; Li, Y.X.; Li, X.X.; Yan, S.Y.; Zheng, X. How to Realize Synergistic Emission Reduction in Future Urban Agglomerations: Spatial Planning Approaches to Reducing Carbon Emissions from Land Use: A Case Study of the Beijing–Tianjin–Hebei Region. Land 2024, 13, 554. [Google Scholar] [CrossRef] [Scilit]
- Jia, W.X.; Zhao, S.Q.; Zhang, X.Y.; Liu, S.G.; Henebry, G.M.; Liu, L.L. Urbanization imprint on land surface phenology: The urban-rural gradient analysis for Chinese cities. Glob. Change Biol. 2021, 27, 2895–2904. [Google Scholar] [CrossRef] [Scilit] [PubMed]
- Rosol, M.; Béal, V.; Mössner, S. Greenest cities? The (post-)politics of new urban environmental regimes. Environ. Plan. A Econ. Space 2017, 49, 1710–1718. [Google Scholar] [CrossRef] [Scilit]
- Jia, W.X.; Zhao, S.Q.; Liu, S.G. Vegetation growth enhancement in urban environments of the conterminous United States. Glob. Change Biol. 2018, 24, 4084–4094. [Google Scholar] [CrossRef] [Scilit] [PubMed]
- Ma, J.; Xiao, X.M.; Miao, R.H.; Li, Y.; Chen, B.Q.; Zhang, Y.; Zhao, B. Trends and controls of terrestrial gross primary productivity of China during 2000–2016. Environ. Res. Lett. 2019, 14, 084032. [Google Scholar] [CrossRef] [Scilit]
- Liu, X.Y.; Cui, Y.P.; Xiao, X.M.; Shi, Z.F.; Li, M.D.; Li, N.; Dong, J.W. Multi-scale analysis of urbanization and gross primary productivity during 2000–2018 in Beijing, China. Environ. Res. Lett. 2024, 19, 014023. [Google Scholar] [CrossRef] [Scilit]
- Zhao, S.Q.; Liu, S.G.; Zhou, D.C. Prevalent vegetation growth enhancement in urban environment. Proc. Natl. Acad. Sci. USA 2016, 113, 6313–6318. [Google Scholar] [CrossRef] [Scilit] [PubMed]
- Yin, C.L.; Xiao, X.M.; Pan, L.; Chen, R.S.; Yin, Y.; Qin, Y.W.; Shi, W.J.; Voorde, T.V.D.; Yin, S.L.; Yao, Y.; et al. Concurrent Increases of Impervious Surface Area and Vegetation Greenness and Productivity in China’s Yangtze River Delta. Earth’s Future 2025, 13, e2025EF006652. [Google Scholar] [CrossRef] [Scilit]
- Huang, X.; Xia, J.H.; Xiao, R.; He, T. Urban expansion patterns of 291 Chinese cities, 1990–2015. Int. J. Digit. Earth 2019, 12, 62–77. [Google Scholar] [CrossRef] [Scilit]
- He, Q.; Zeng, C.; Xie, P.; Tan, S.; Wu, J. Comparison of urban growth patterns and changes between three urban agglomerations in China and three metropolises in the USA from 1995 to 2015. Sustain. Cities Soc. 2019, 50, 101649. [Google Scholar] [CrossRef] [Scilit]
- Huang, M.; Wang, Z.; Pan, X.; Gong, B.; Tu, M.; Liu, Z. Delimiting China’s Urban Growth Boundaries Under Localized Shared Socioeconomic Pathways and Various Urban Expansion Modes. Earth’s Future 2022, 10, e2021EF002572. [Google Scholar] [CrossRef] [Scilit]
- Zhou, Y.; Zhao, Y. Multi-Dimensional Analysis of Urban Growth Characteristics Integrating Remote Sensing Data for Beijing-Tianjin-Hebei. Remote Sens. 2025, 17, 548. [Google Scholar] [CrossRef] [Scilit]
- National Development and Reform Commission. Outline of the Beijing-Tianjin-Hebei Coordinated Development Plan. 2015. Available online: https://www.ndrc.gov.cn/gjzl/jjjxtfz/201911/t20191127_1213171.html (accessed on 15 June 2026).
- Ma, Z.R.; Wu, J.J.; Yang, H.C.; Yang, J.H.; Zhang, J.H. Unraveling the effects of land use change on carbon balance: A systematic study in the Beijing-Tianjin-Hebei region, China. Ecol. Indic. 2025, 179, 114109. [Google Scholar] [CrossRef] [Scilit]
- Yang, Y.Y.; Yang, M.Y.; Zhao, B.X.; Lu, Z.W.; Sun, X.; Zhang, Z.F. Spatially explicit carbon emissions from land use change: Dynamics and scenario simulation in the Beijing-Tianjin-Hebei urban agglomeration. Land Use Policy 2025, 150, 107473. [Google Scholar] [CrossRef] [Scilit]
- Zhao, Y.; Sun, R.; Ni, Z. Identification of Natural and Anthropogenic Drivers of Vegetation Change in the Beijing-Tianjin-Hebei Megacity Region. Remote Sens. 2019, 11, 1224. [Google Scholar] [CrossRef] [Scilit]
- Feng, F.; Yang, X.; Jia, B.; Li, X.; Xu, C.; Wang, K. Variability of urban fractional vegetation cover and its driving factors in 328 cities in China. Sci. China Earth Sci. 2024, 67, 466–482. [Google Scholar] [CrossRef] [Scilit]
- Zhao, Y.; Qie, X. Quantitative assessment of the relative impacts of climate change and human activities on net primary productivity of vegetation in the Beijing-Tianjin-Hebei region. Front. Environ. Sci. 2024, 12, 1508433. [Google Scholar] [CrossRef] [Scilit]
- Zhang, Y.; Liu, G.R.; Li, S.M.; Sun, B.; Zhang, H.Y.; Liu, Q. Insights into spatiotemporal dynamics of vegetation in the Beijing-Tianjin-Hebei urban agglomeration: Exploring urbanization stage-specific responses and nonlinear driving mechanisms. Ecol. Indic. 2025, 178, 114108. [Google Scholar] [CrossRef] [Scilit]
- Kong, D.M.; Cui, K.H.; Wang, Y.Q.; Xu, S.R. Spatiotemporal Patterns and Improvement Strategies for Urban Resilience in the Beijing–Tianjin–Hebei Urban Agglomeration. J. Urban Plan. Dev. 2025, 151, 04025061. [Google Scholar] [CrossRef] [Scilit]
- Yang, J.; Huang, X. The 30 m annual land cover dataset and its dynamics in China from 1990 to 2019. Earth Syst. Sci. Data 2021, 13, 3907–3925. [Google Scholar] [CrossRef] [Scilit]
- Yang, J.; Huang, X. The 30 m annual land cover datasets and its dynamics in China from 1985 to 2025. In Earth System Science Data; Zenodo: Geneva, Switzerland, 2026. [Google Scholar] [CrossRef]
- Xu, X.L.; Li, D.; Liu, H.X.; Zhao, G.; Cui, B.S.; Yi, Y.J.; Yang, W.; Du, J.Z. Comparative Validation and Misclassification Diagnosis of 30-Meter Land Cover Datasets in China. Remote Sens. 2024, 16, 4330. [Google Scholar] [CrossRef] [Scilit]
- Running, S.; Mu, Q.; Zhao, M. MOD17A3HGF MODIS/Terra Net Primary Production Gap-Filled Yearly L4 Global 500m SIN Grid V061; NASA Land Processes Distributed Active Archive Center: Sioux Falls, SD, USA, 2021. [Google Scholar] [CrossRef]
- Zhao, M.; Running, S.W.; Nemani, R.R. MOD17A3HGF User Guide; NASA LP DAAC: Sioux Falls, SD, USA, 2021. [Google Scholar]
- Theil, H. A rank-invariant method of linear and polynomial regression analysis. Indag. Math. 1950, 12, 173. [Google Scholar]
- Sen, P.K. Estimates of the regression coefficient based on Kendall’s tau. J. Am. Stat. Assoc. 1968, 63, 1379–1389. [Google Scholar] [CrossRef]
- Mann, H.B. Nonparametric tests against trend. Econometrica 1945, 13, 245–259. [Google Scholar] [CrossRef] [Scilit]
- Kendall, M.G. Rank correlation methods. Griffith J. Inst. Actuar. 1948, 75, 140–141. [Google Scholar]
- Wang, Y.; Chen, X.; Gao, M.; Dong, J. The use of random forest to identify climate and human interference on vegetation coverage changes in southwest China. Ecol. Indic. 2022, 144, 109463. [Google Scholar] [CrossRef] [Scilit]
- Sun, L.Q.; Chen, J.; Li, Q.L.; Huang, D. Dramatic uneven urbanization of large cities throughout the world in recent decades. Nat. Commun. 2020, 11, 5366. [Google Scholar] [CrossRef] [Scilit] [PubMed]
- Schmid, L.; Gerharz, A.; Groll, A.; Pauly, M. Tree-based ensembles for multi-output regression: Comparing multivariate approaches with separate univariate ones. Comput. Stat. Data Anal. 2023, 179, 107628. [Google Scholar] [CrossRef] [Scilit]
- Breiman, L. Random forests. Mach. Learn. 2001, 45, 5–32. [Google Scholar] [CrossRef] [Scilit]
- Li, R.T.; Liu, X.Y.; Li, M.Y.X. Spatial vitality assessment of urban post-industrial landscapes using multi-source data: A case study of Beijing Shougang Park. Land 2025, 14, 1859. [Google Scholar] [CrossRef] [Scilit]
- Xia, Y.; Guan, Y.; Yang, T.; Qian, J.; Wei, Z.; Yao, W.; Deng, R.; Zhang, C.; Guo, S. Spatiotemporal Trends and Driving Factors of Global Impervious Surface Area Changes from 2001 to 2020. Remote Sens. 2025, 17, 3309. [Google Scholar] [CrossRef] [Scilit]
- Shao, H.; Qu, M.; Zhang, Y. Regional Differences in the Direct and Indirect Impacts of China’s Urbanization Process on Vegetation. Earth Space Sci. 2026, 13, e2026EA005001. [Google Scholar] [CrossRef] [Scilit]
- Yi, M.; Zhang, D.; An, Z.; Cong, P.; Li, K.; Liu, W.; Sui, K. Spatiotemporal Dynamics and Drivers of Vegetation NPP in the Yanshan-Taihang Mountain Ecological Conservation Zone from 2004 to 2023. Sustainability 2025, 17, 9552. [Google Scholar] [CrossRef] [Scilit]
- Fu, X.; He, B.-J. Synergistic Impacts of Built-Up Characteristics and Background Climate on Urban Vegetation Phenology: Evidence from Beijing, China. Forests 2024, 15, 728. [Google Scholar] [CrossRef] [Scilit]
- Xue, F.; Hu, Y. Diverse Responses of Vegetation Greenness and Productivity to Land Use and Climate Change: A Comparison of Three Urban Agglomerations in China. Sustainability 2024, 16, 5900. [Google Scholar] [CrossRef] [Scilit]
- He, X.; Li, Y.; Li, W.; Shen, Z.; Xie, B.; Yu, S.; Wang, S.; Wang, N.; Li, Z.; Zhao, J.; et al. Assessing the Trade-Offs and Synergies Among Ecosystem Services Under Multiple Land-Use Scenarios in the Beijing–Tianjin–Hebei Region. Land 2025, 14, 2176. [Google Scholar] [CrossRef] [Scilit]
- Zeng, L.; Yang, L.; Su, L.; Hu, H.; Feng, C. The impact of policies on land use and land cover changes in the Beijing–Tianjin–Hebei region in China. Environ. Impact Assess. Rev. 2025, 110, 107676. [Google Scholar] [CrossRef] [Scilit]
- Hu, Y.; Xu, X.; Huang, X.; Li, Y.; Cao, J.; Yan, Y.; Hu, X.; Wu, S. Urban Spatial Management and Planning Based on the Interactions Between Ecosystem Services: A Case Study of the Beijing–Tianjin–Hebei Urban Agglomeration. Remote Sens. 2025, 17, 1258. [Google Scholar] [CrossRef] [Scilit]
- Luo, Q.L.; Yao, L.B.; Liu, M.X.; Liu, F.; Huang, R.J. Pathways of multi-dimensional urbanization affecting vegetation carbon sequestration mediated by the urban environment: Evidence from 1298 Chinese cities. Sustain. Cities Soc. 2025, 134, 106963. [Google Scholar] [CrossRef] [Scilit]
- Meng, L.; Mao, J.; Zhou, Y.; Richardson, A.D.; Lee, X.; Thornton, P.E.; Ricciuto, D.M.; Li, X.; Dai, Y.; Shi, X.; et al. Urban warming advances spring phenology but reduces the response of phenology to temperature in the conterminous United States. Proc. Natl. Acad. Sci. USA 2020, 117, 4228–4233. [Google Scholar] [CrossRef] [Scilit] [PubMed]
- Zhang, X.; Friedl, M.A.; Schaaf, C.B.; Strahler, A.H.; Schneider, A. The footprint of urban climates on vegetation phenology. Geophys. Res. Lett. 2004, 31, L12209. [Google Scholar] [CrossRef] [Scilit]
- Wu, B.W.; Zhang, Y.Y.; Wang, Y.; He, Y.M.; Dong, Z.F. Indirect Urbanization Impacts Shape Vegetation Growth and Carbon Sink Dynamics: Synergies and Trade-Offs across China. Environ. Sci. Technol. 2026, 60, 3186–3201. [Google Scholar] [CrossRef] [Scilit] [PubMed]
- Gao, S.; Chen, Y.; Li, K.; Chen, H.W.; He, B. Urban compound heatwaves substantially offset by cooling from urbanization–promoted vegetation growth. Sustain. Cities Soc. 2026, 140, 107249. [Google Scholar] [CrossRef] [Scilit]
- Liu, Z.; Xu, X.; Liu, X. Multi-scale determinants of net primary productivity in China’s urban agglomerations. J. Environ. Manag. 2026, 378, 112345. [Google Scholar] [CrossRef] [Scilit] [PubMed]
- Zhang, Q.; Zhu, J.; Liang, J.; Li, M.; Huang, S.; Li, H. Urban Dominant Trees Followed the Optimal Partitioning Theory and Increased Root Biomass Allocation and Nutrient Uptake under Elevated Nitrogen Deposition. Forests 2024, 15, 199. [Google Scholar] [CrossRef] [Scilit]
- Liang, J.; Li, H.; Jiao, A.; Lv, H.; Feng, Z. Urban Expansion-Driven Cropland NPP Change in the Beijing-Tianjin-Hebei Region, China (2001–2020): Spatiotemporal Patterns, Ecological Selectivity, and Spatially Varying Driver Effects. Remote Sens. 2026, 18, 933. [Google Scholar] [CrossRef] [Scilit]
- Liu, M.X.; Luo, Q.L.; Huang, R.J.; Wu, Y.Y.; Zhou, J.F. Dynamic impacts of urban expansion on vegetation growth in urban environments: A sustainable land management framework. Land Use Policy 2025, 153, 107541. [Google Scholar] [CrossRef] [Scilit]
- Wang, Y.P.; Mao, J.F.; Brelsford, C.M.; Ricciuto, D.M.; Yuan, F.M.; Shi, X.Y.; Rastogi, D.; Mayes, M.M.; Kao, S.; Warren, J.M.; et al. Thermal, water, and land cover factors led to contrasting urban and rural vegetation resilience to extreme hot months. PNAS Nexus 2024, 3, 147. [Google Scholar] [CrossRef] [Scilit] [PubMed]
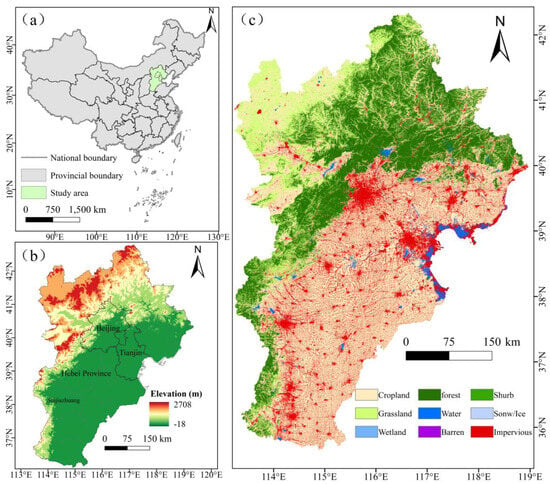
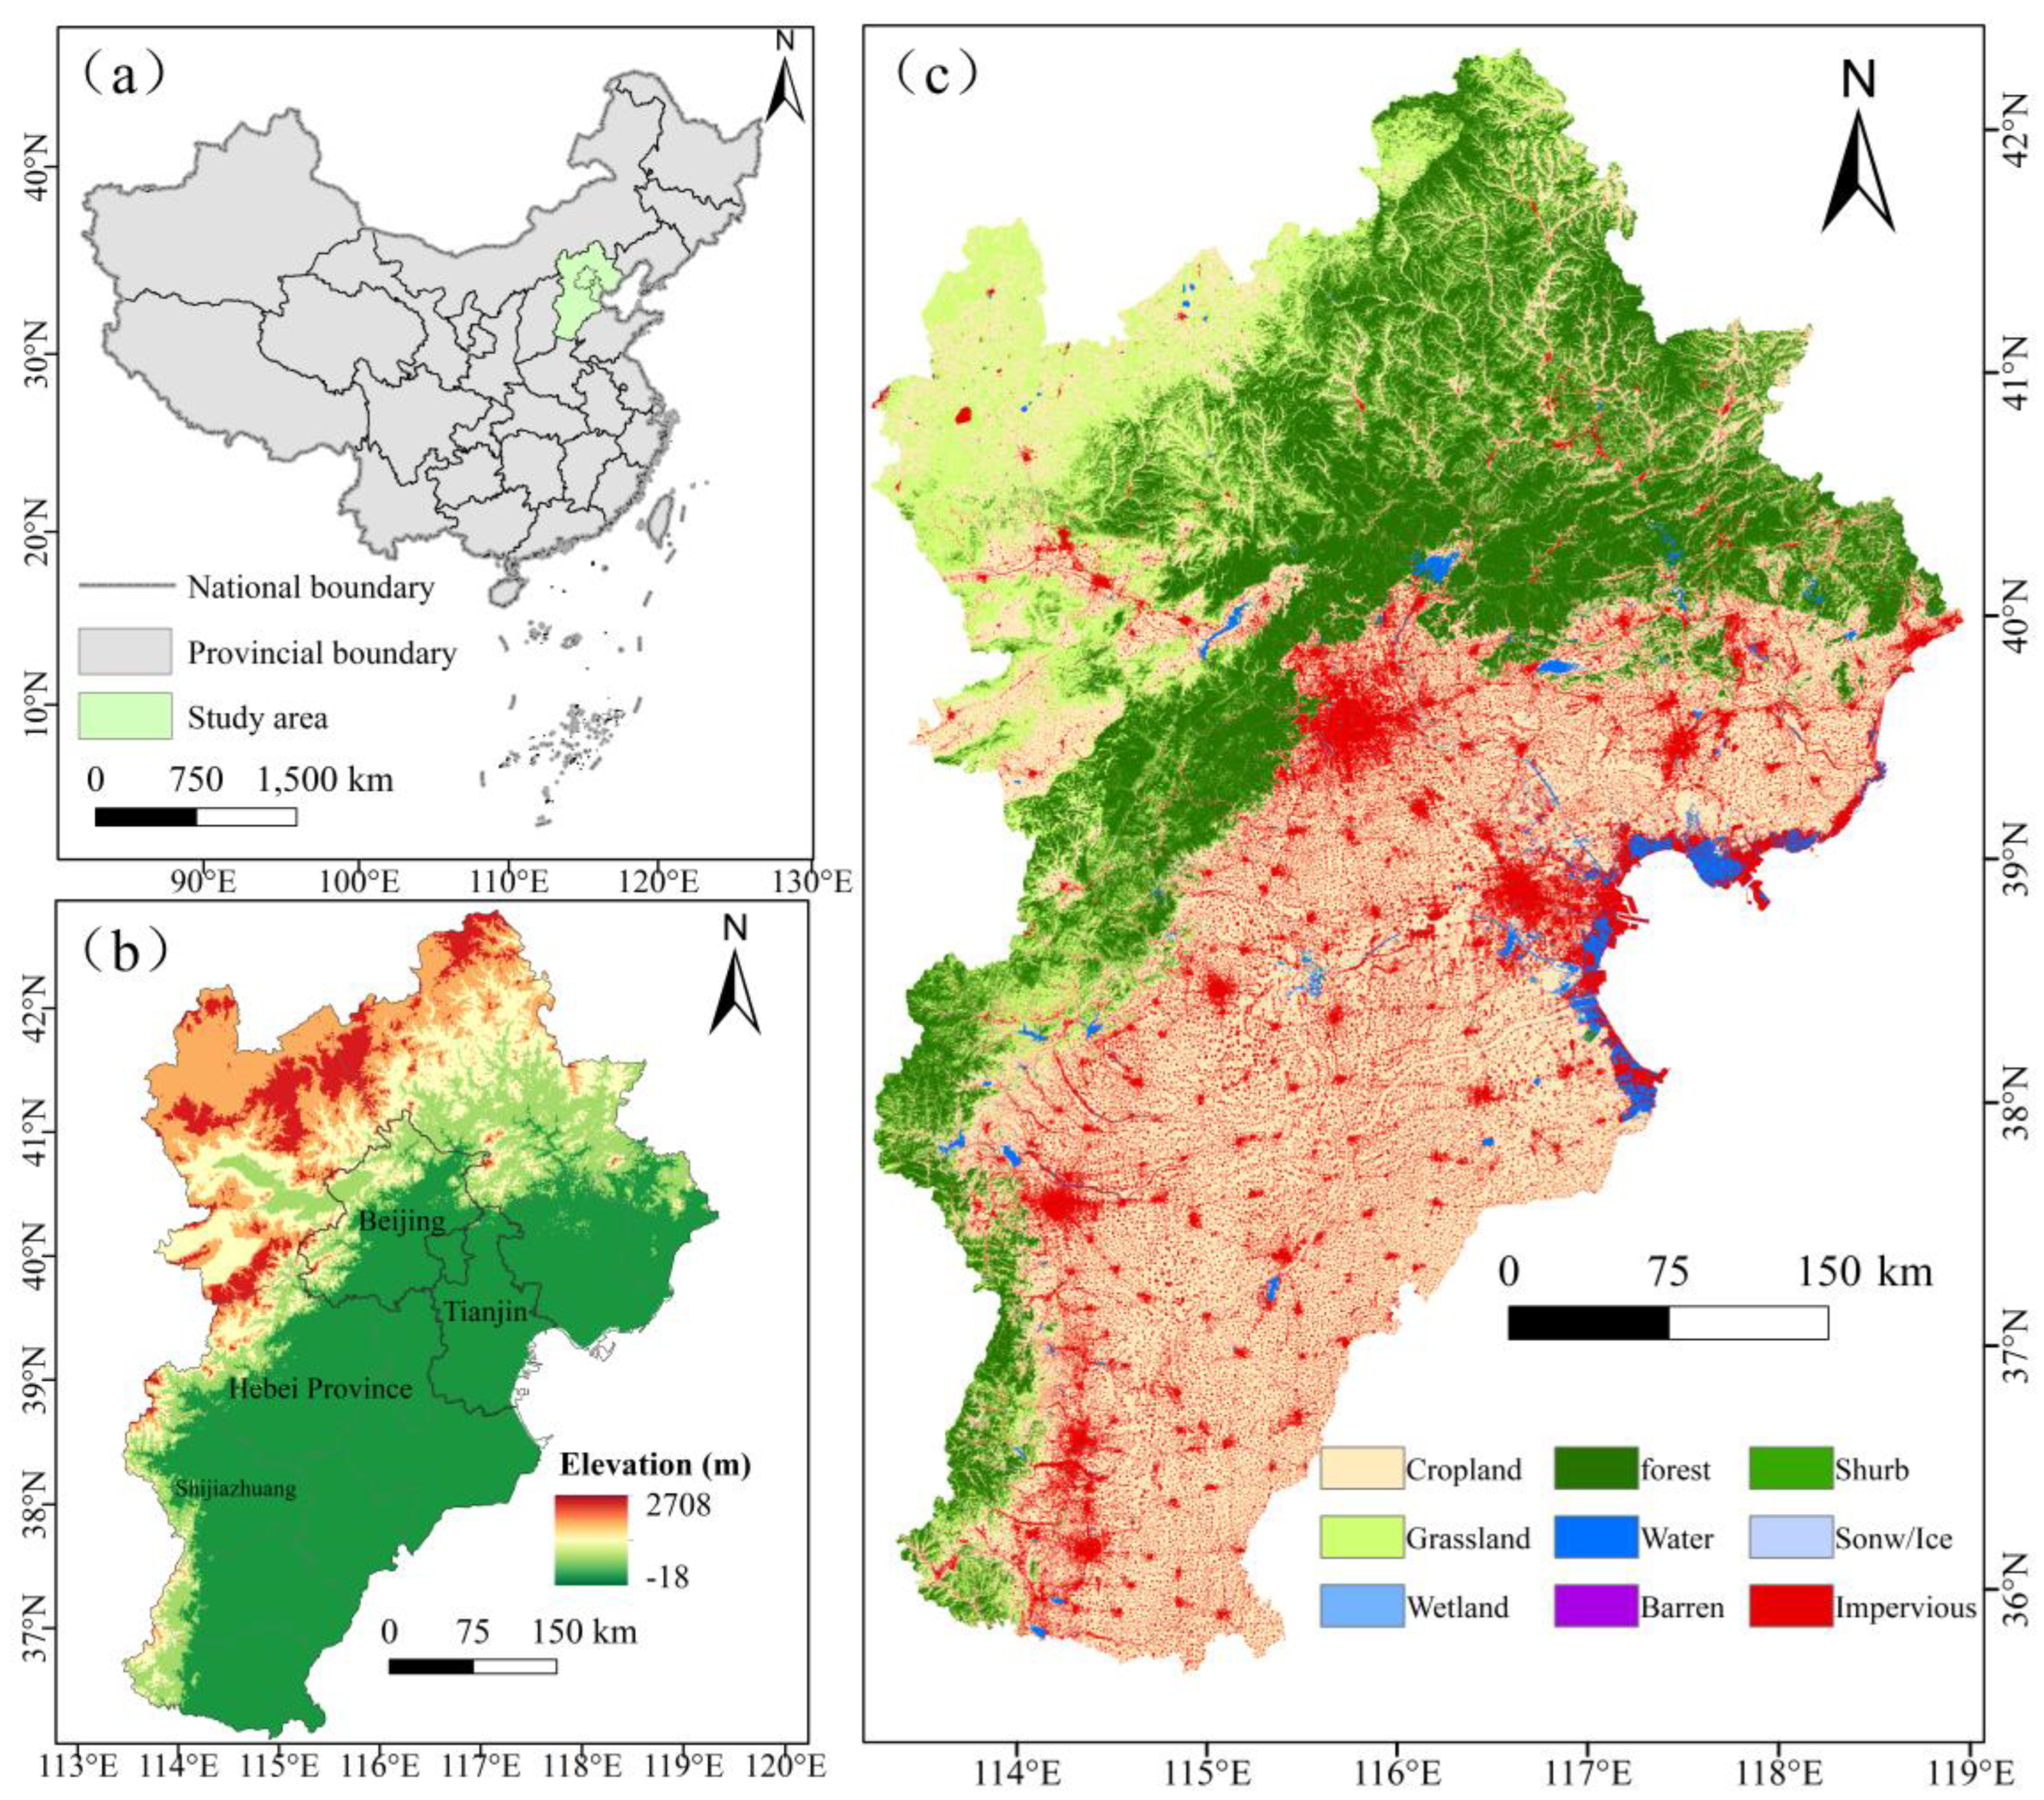
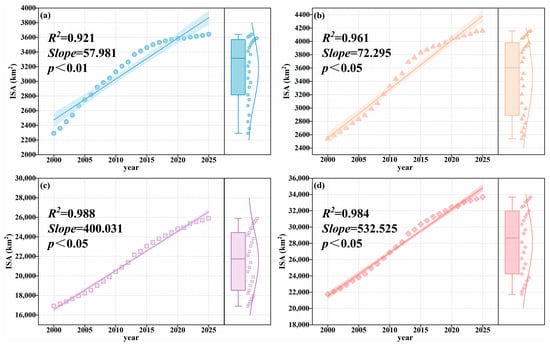
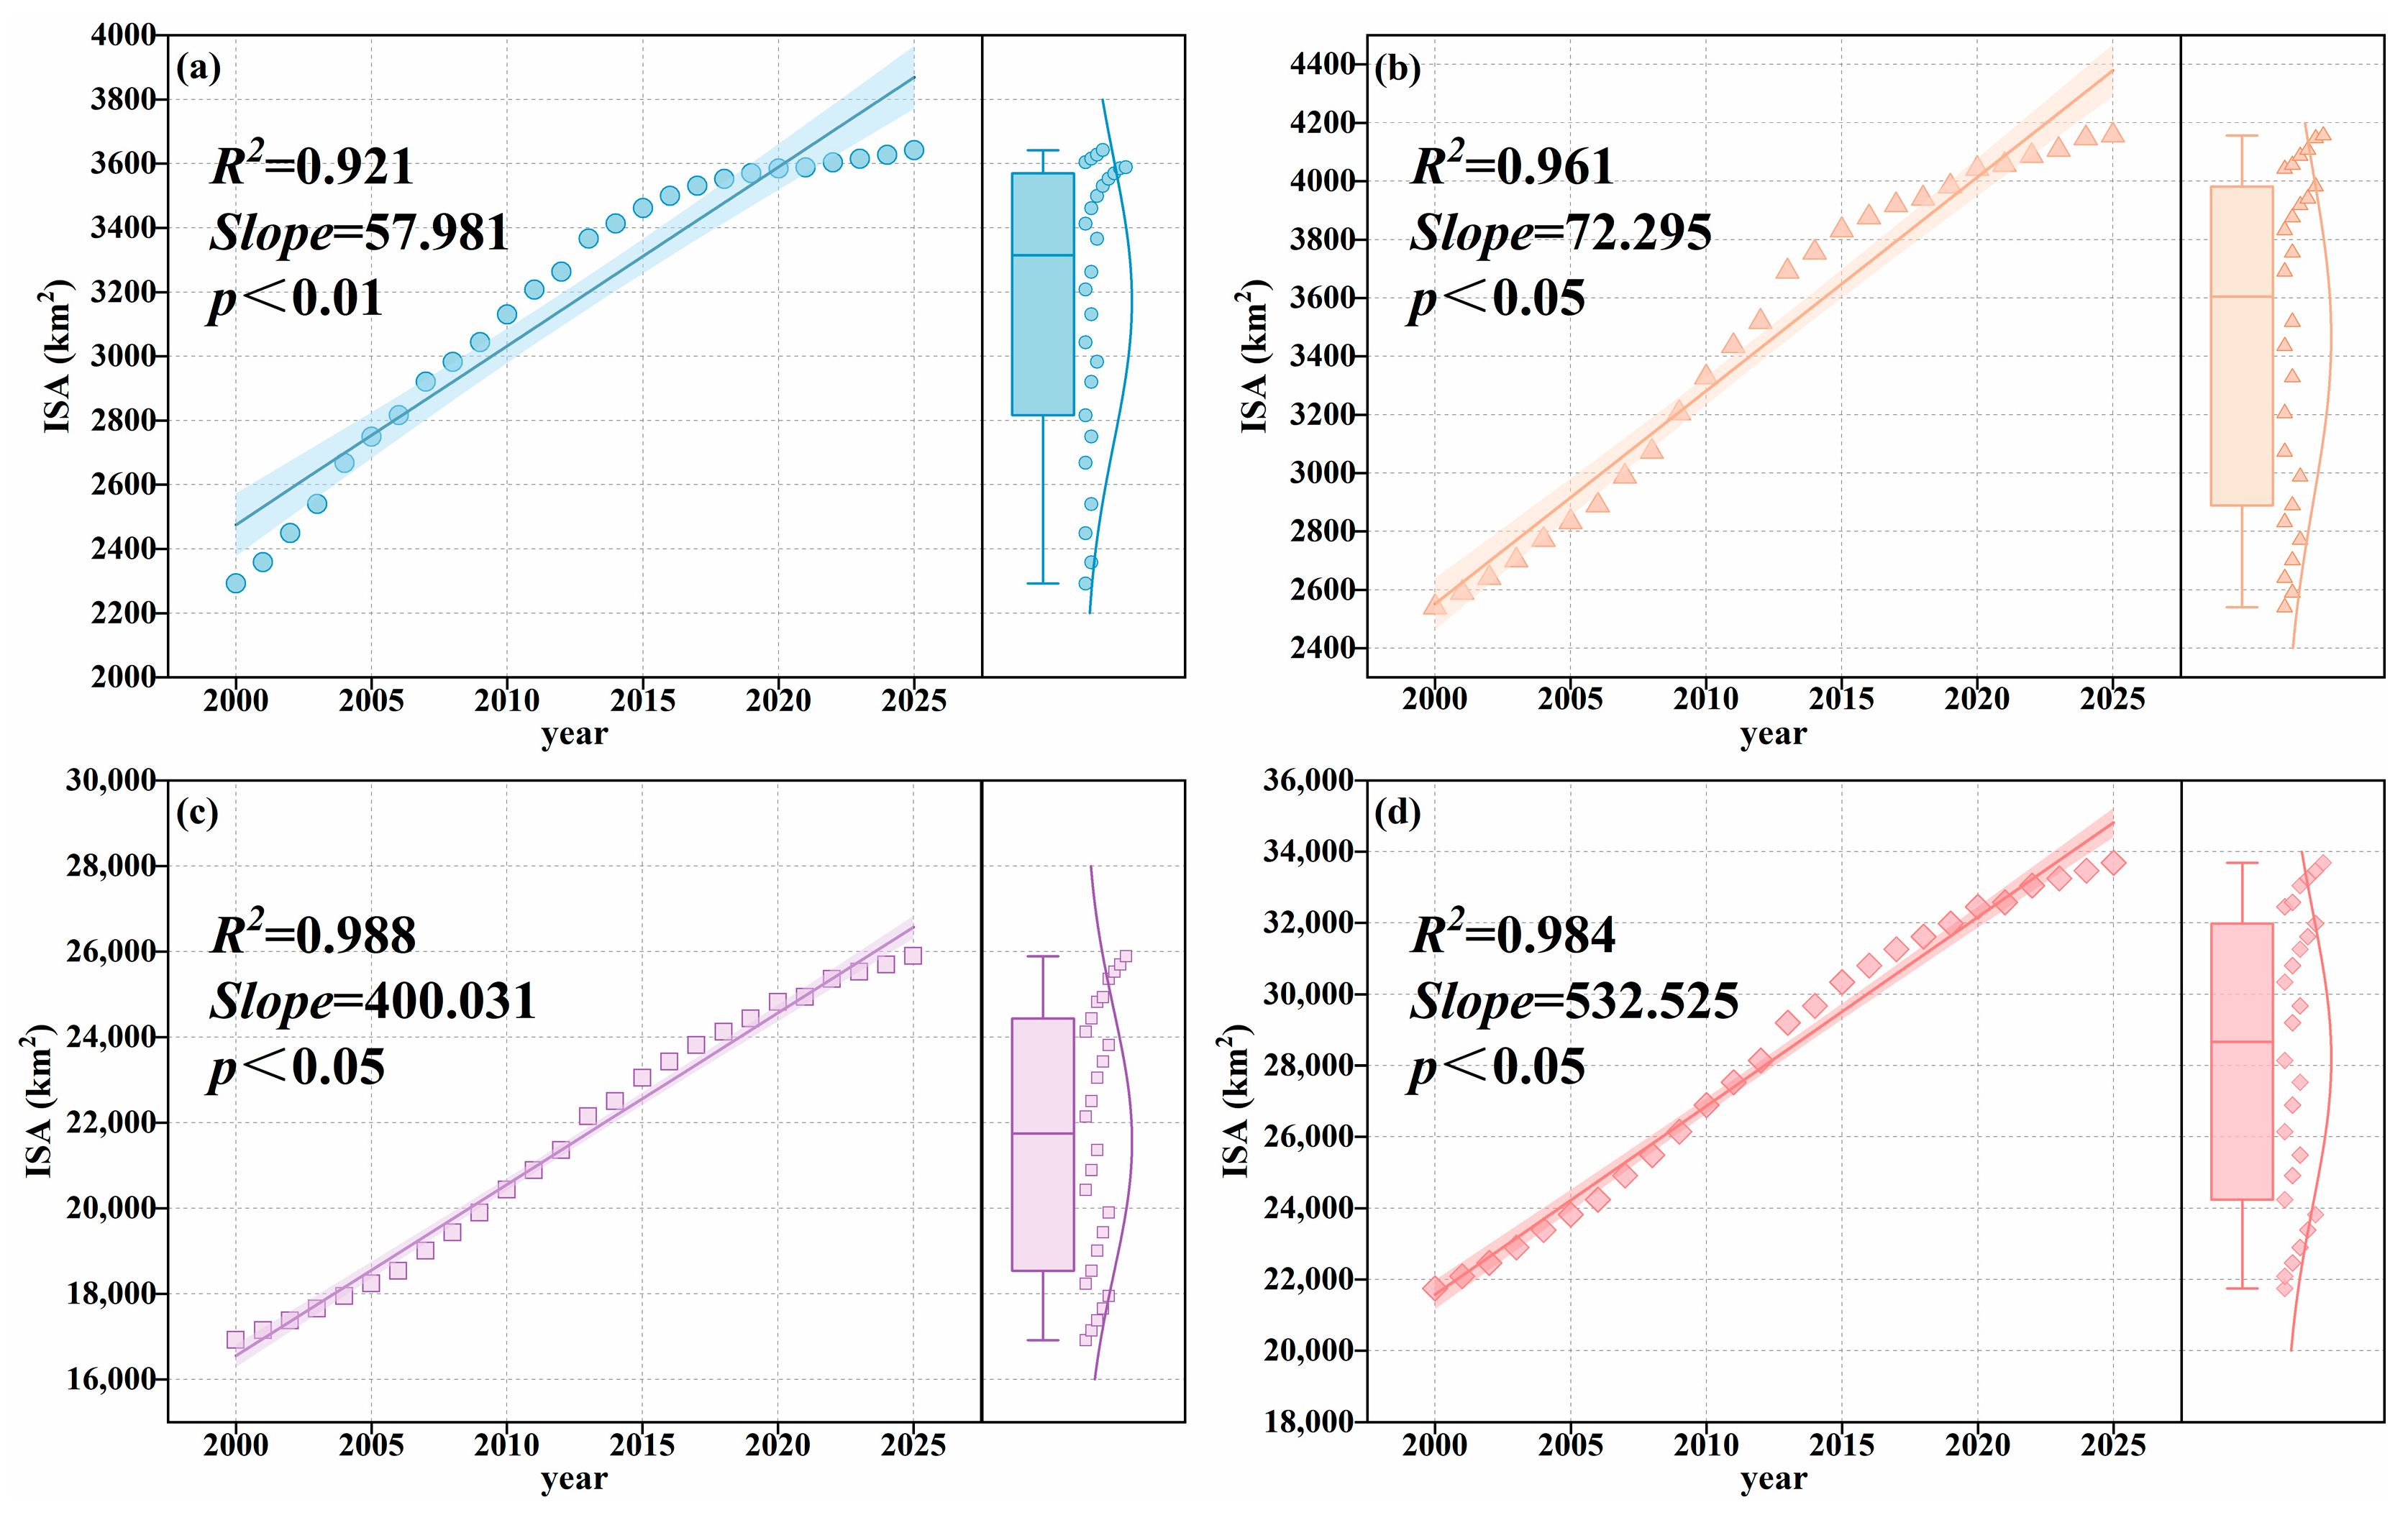
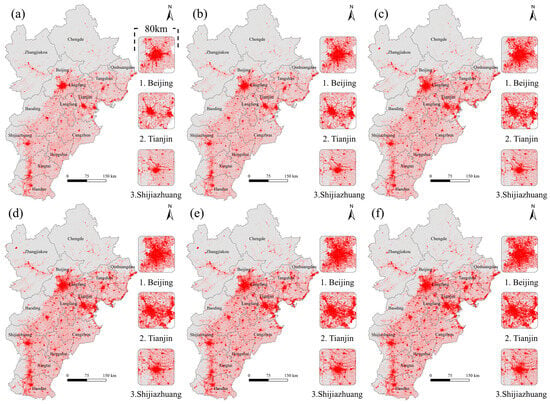
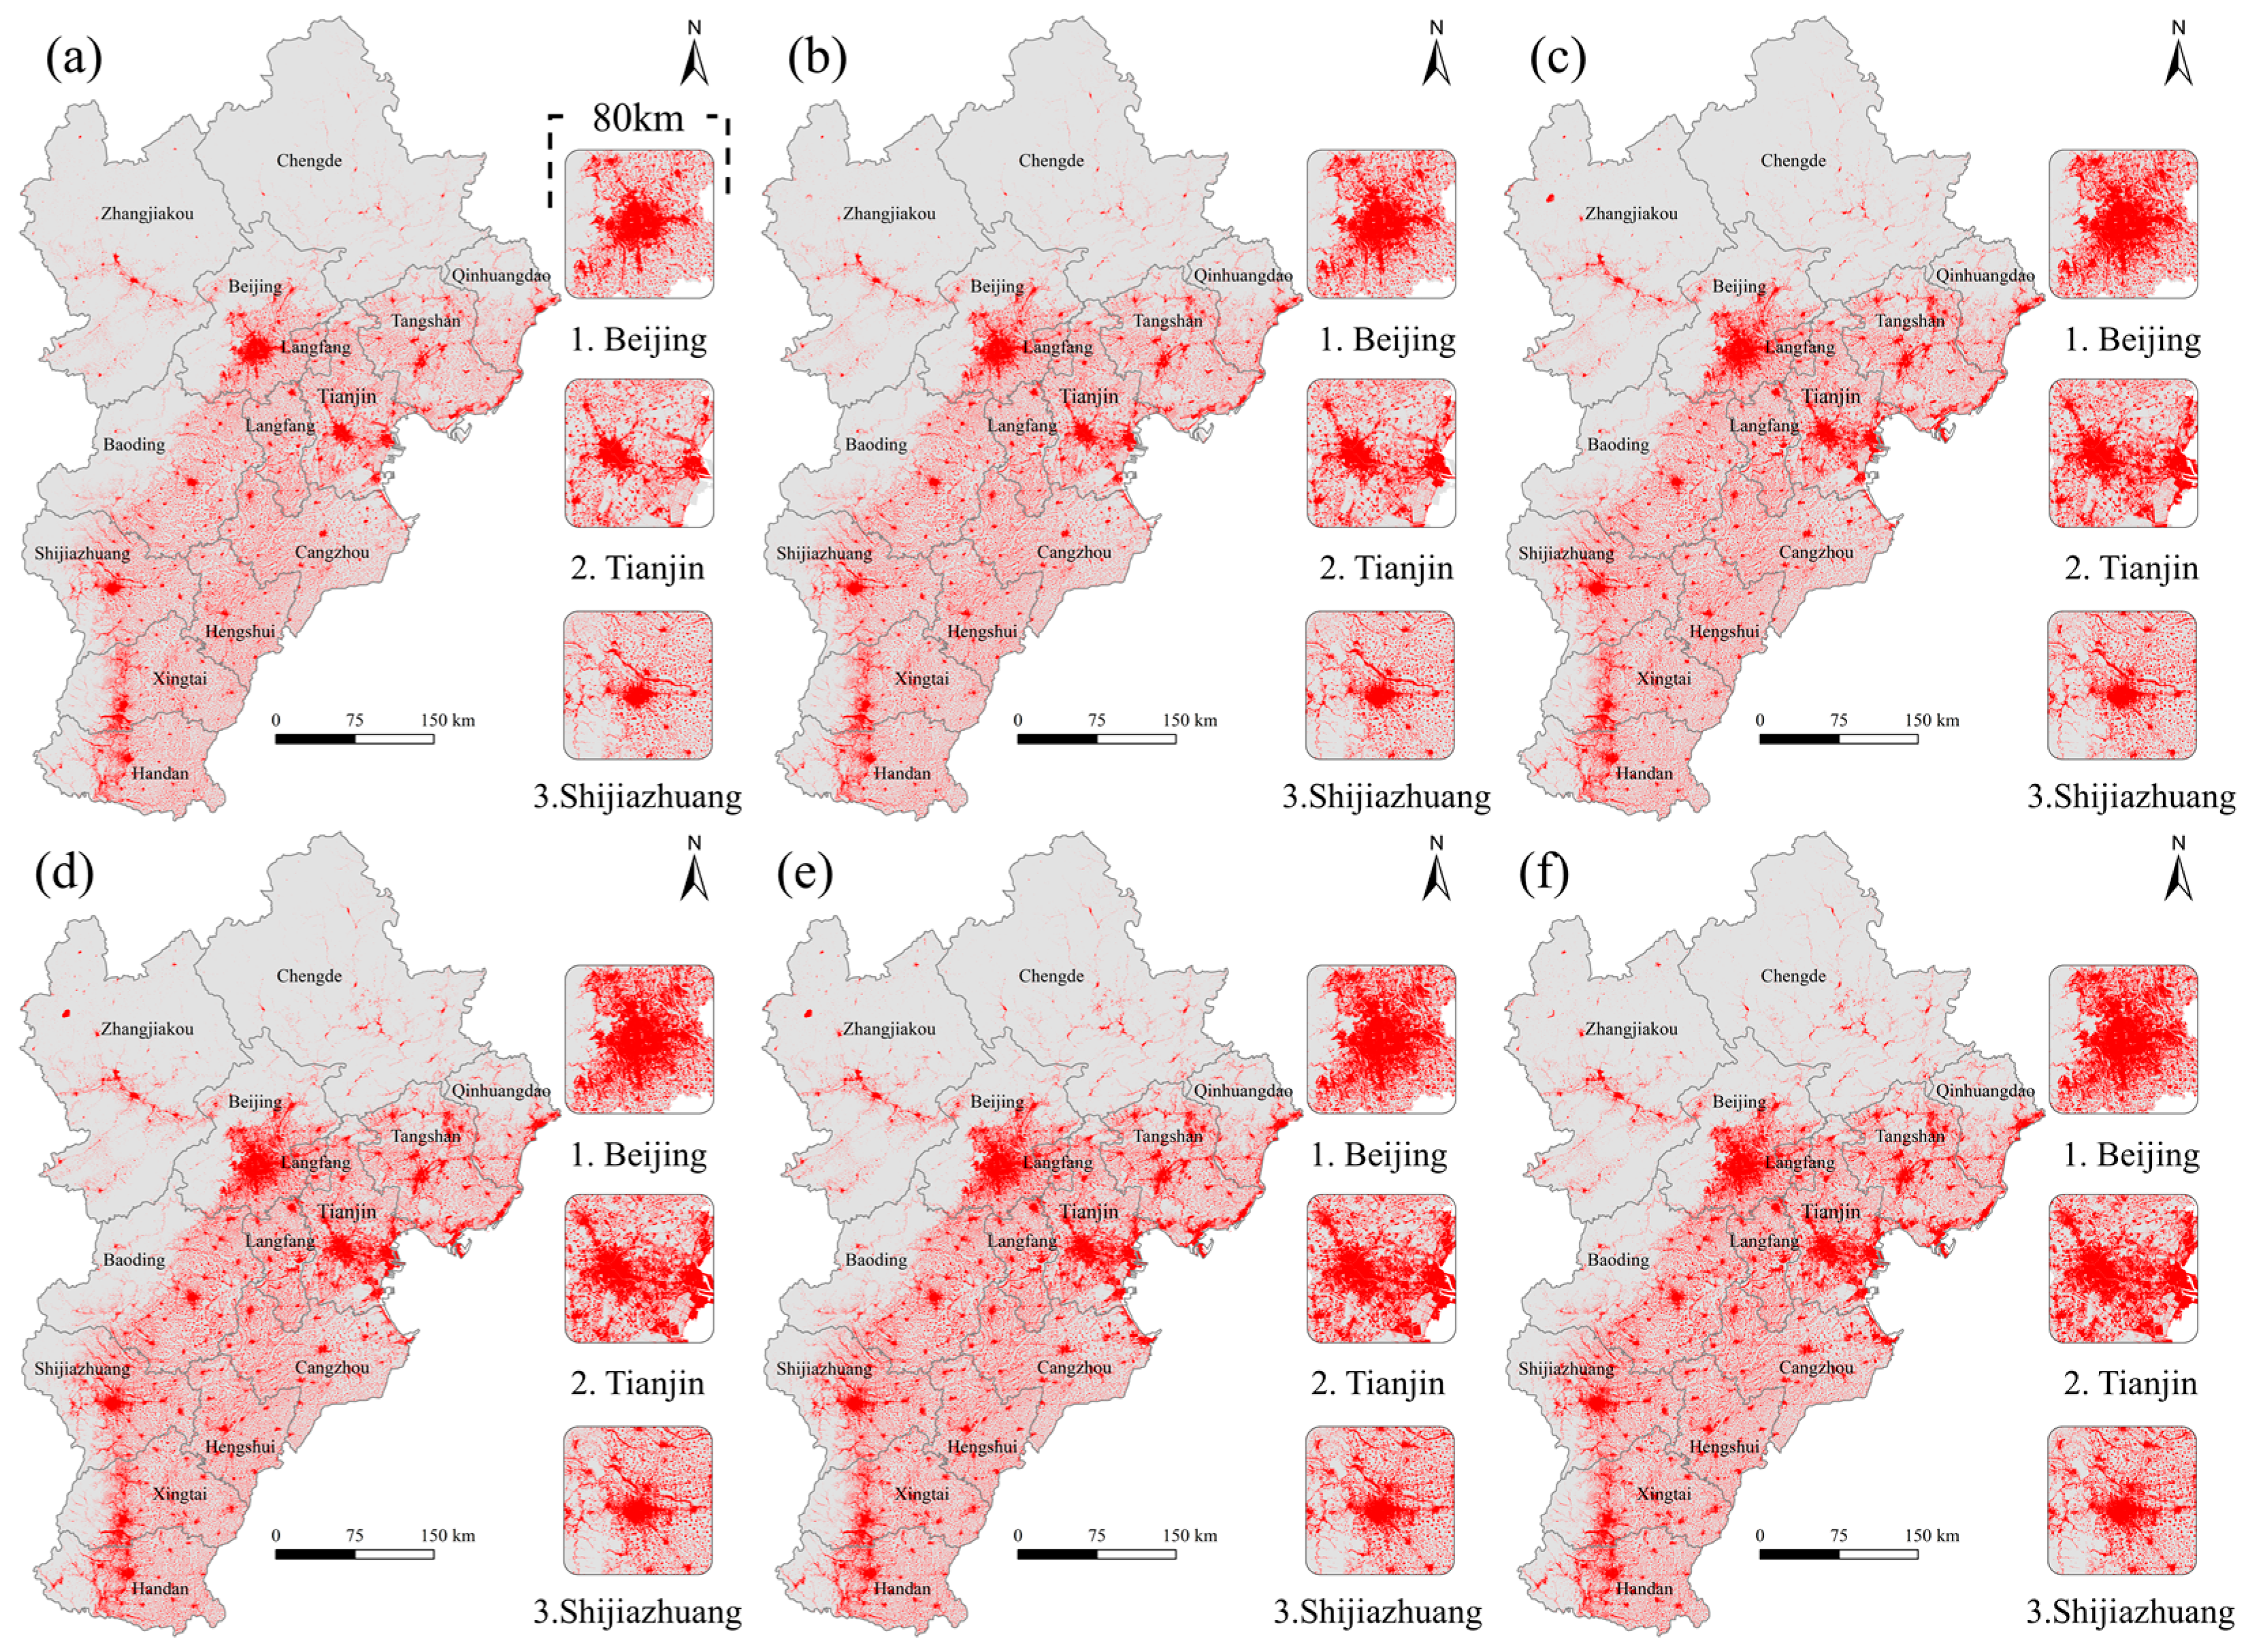
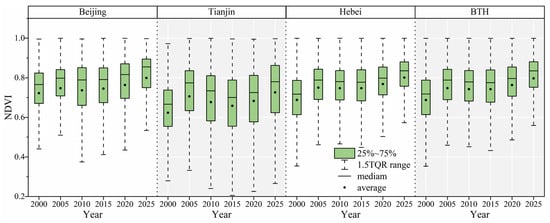
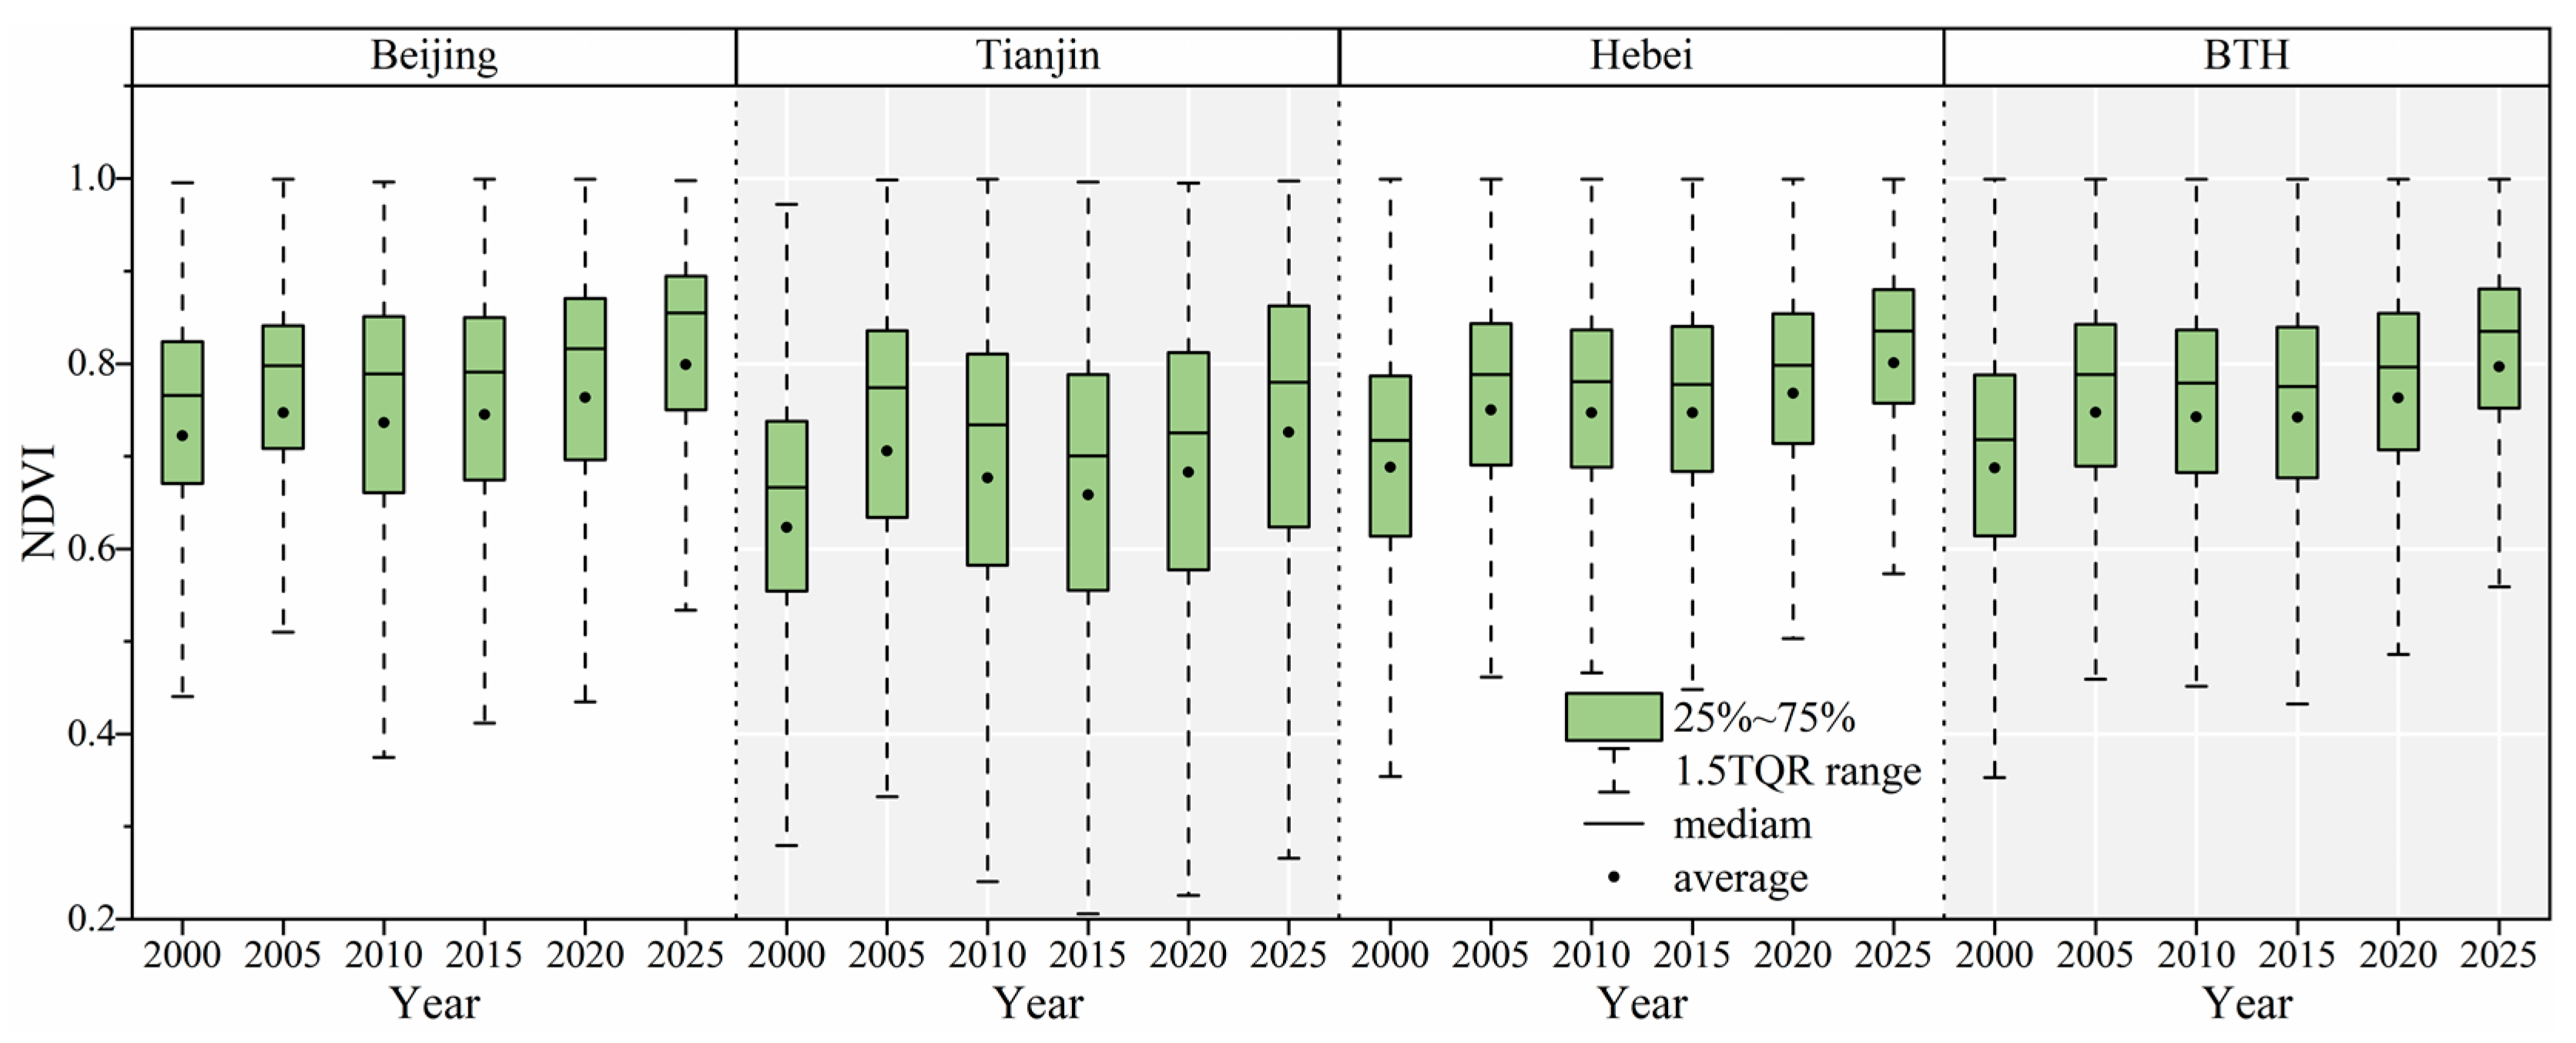
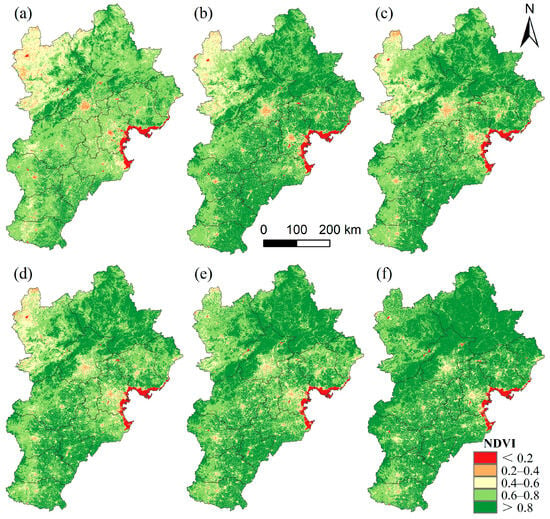
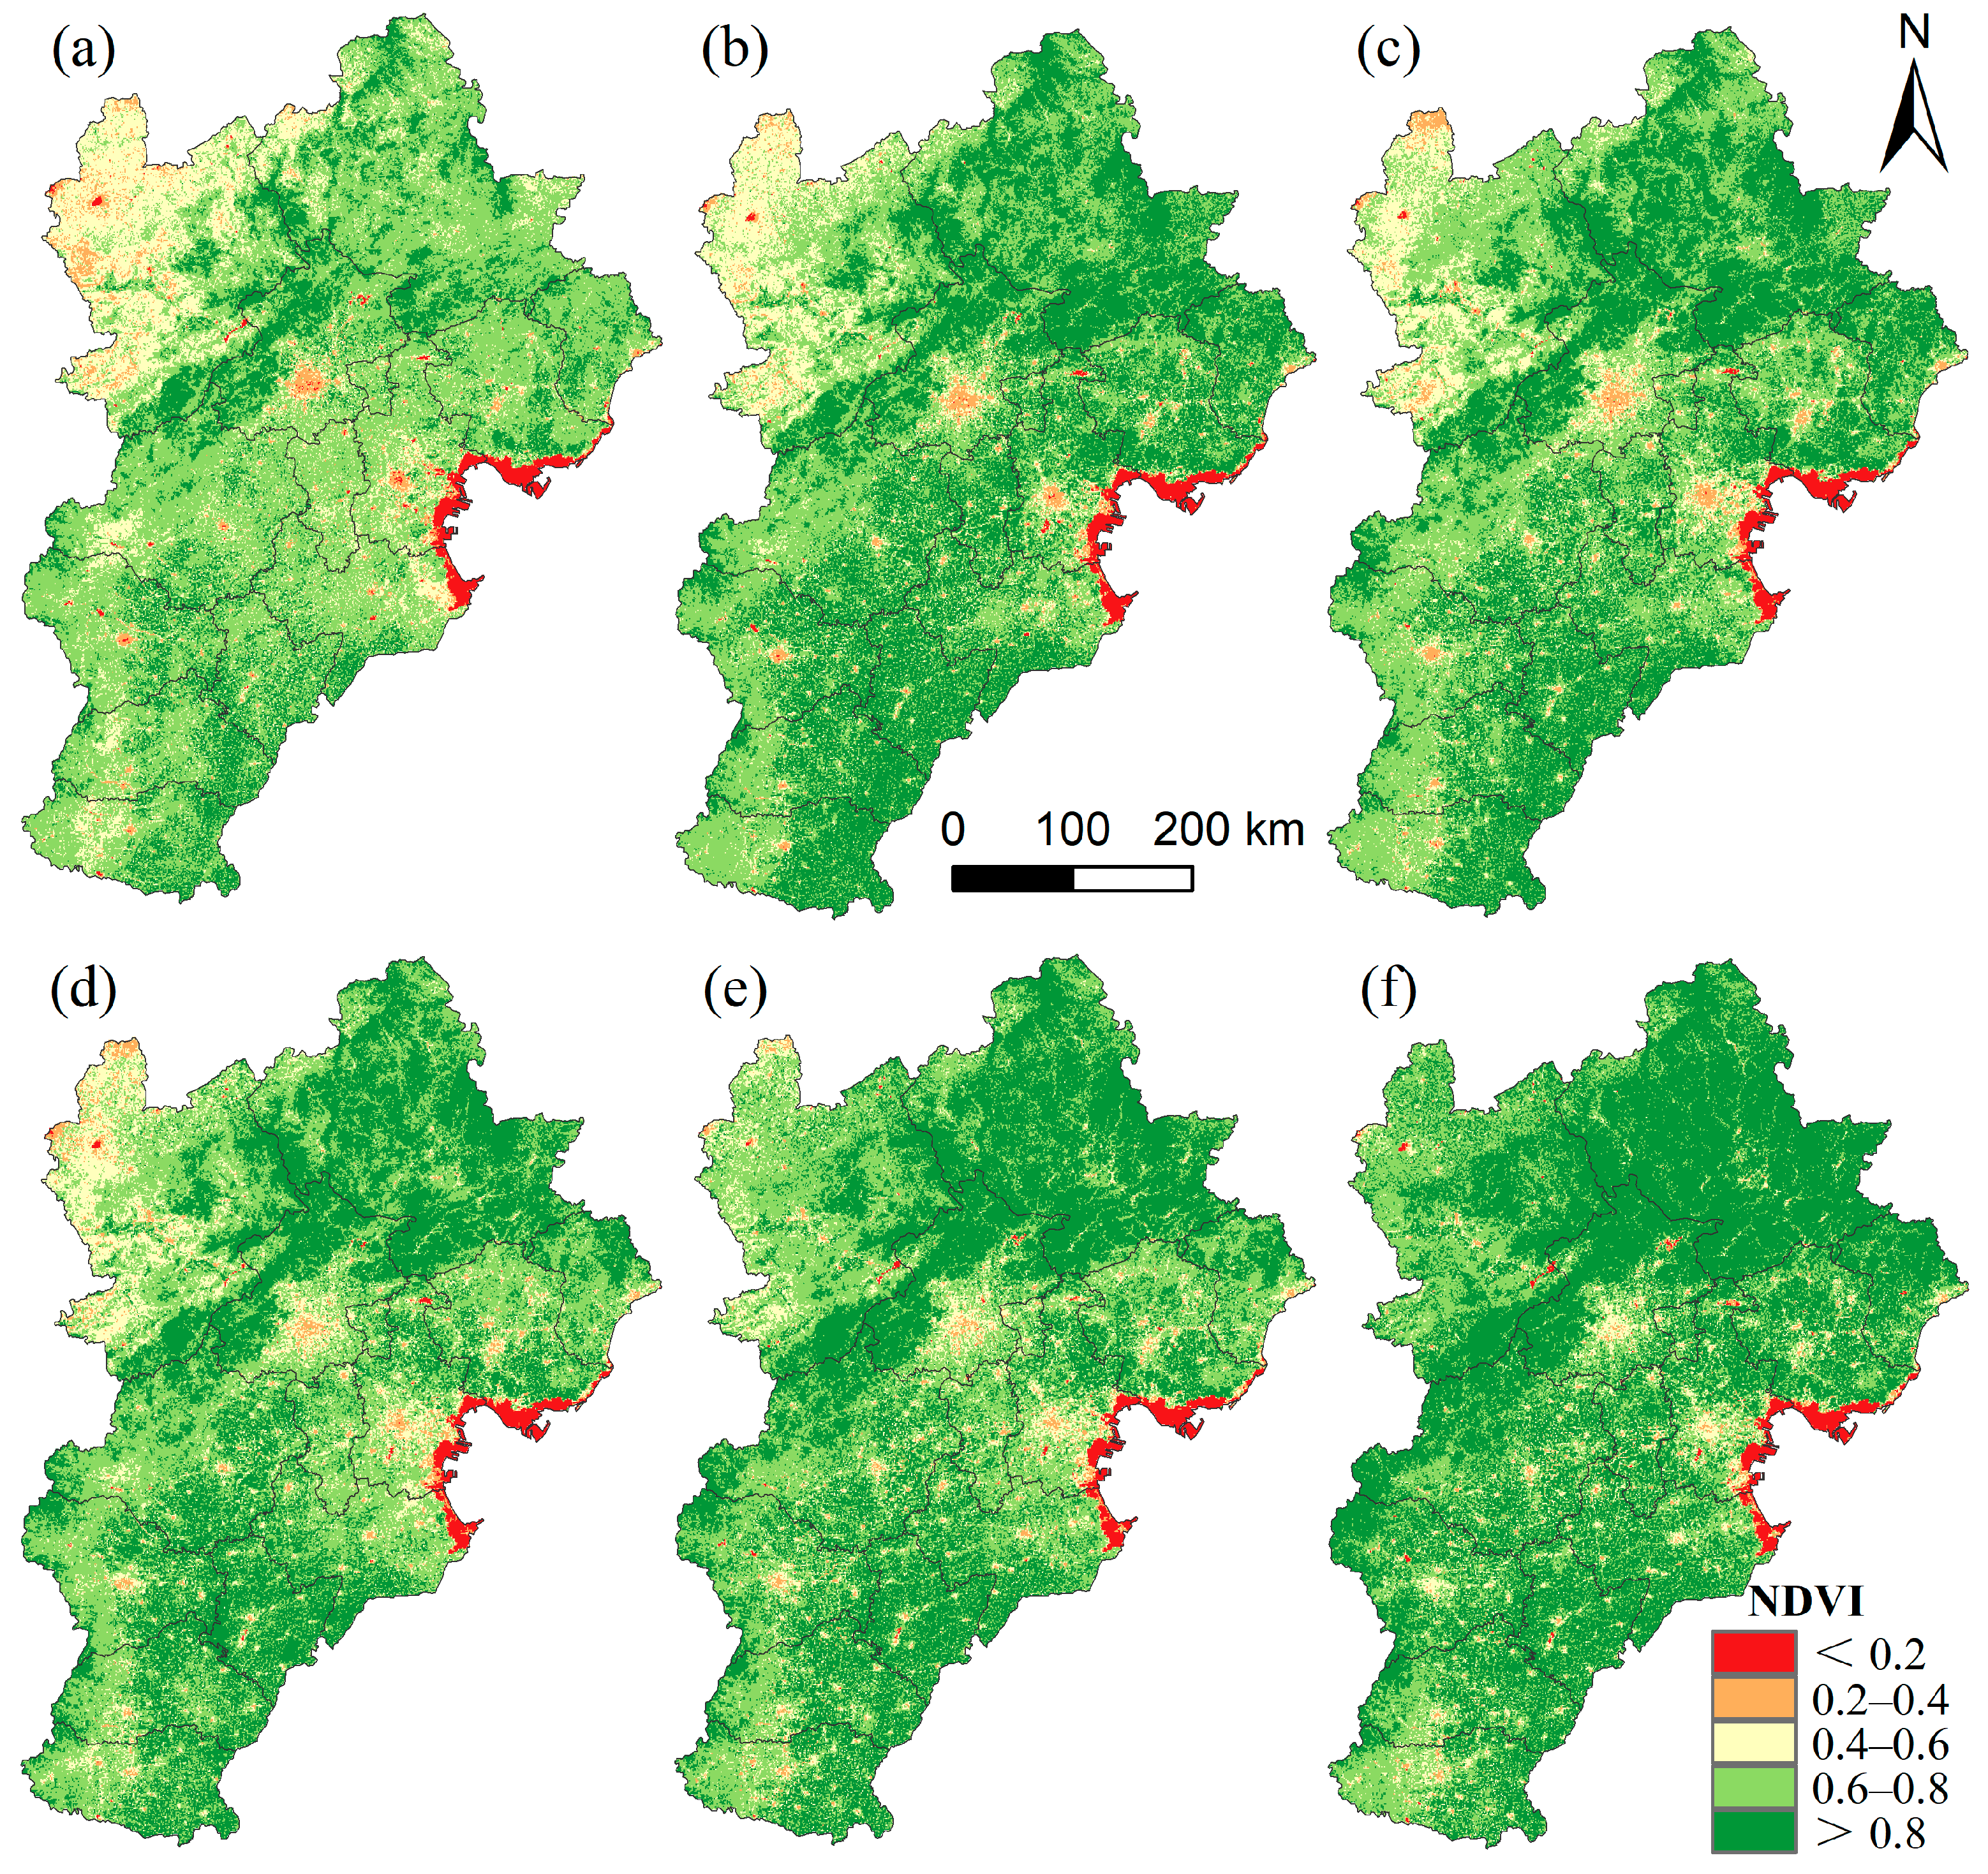
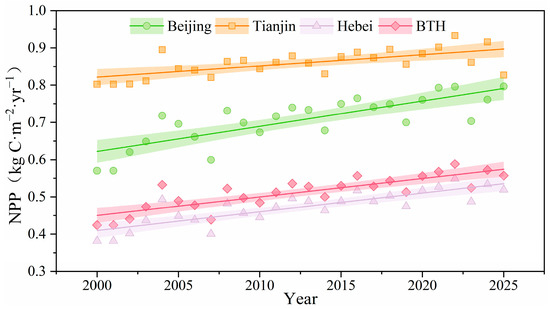
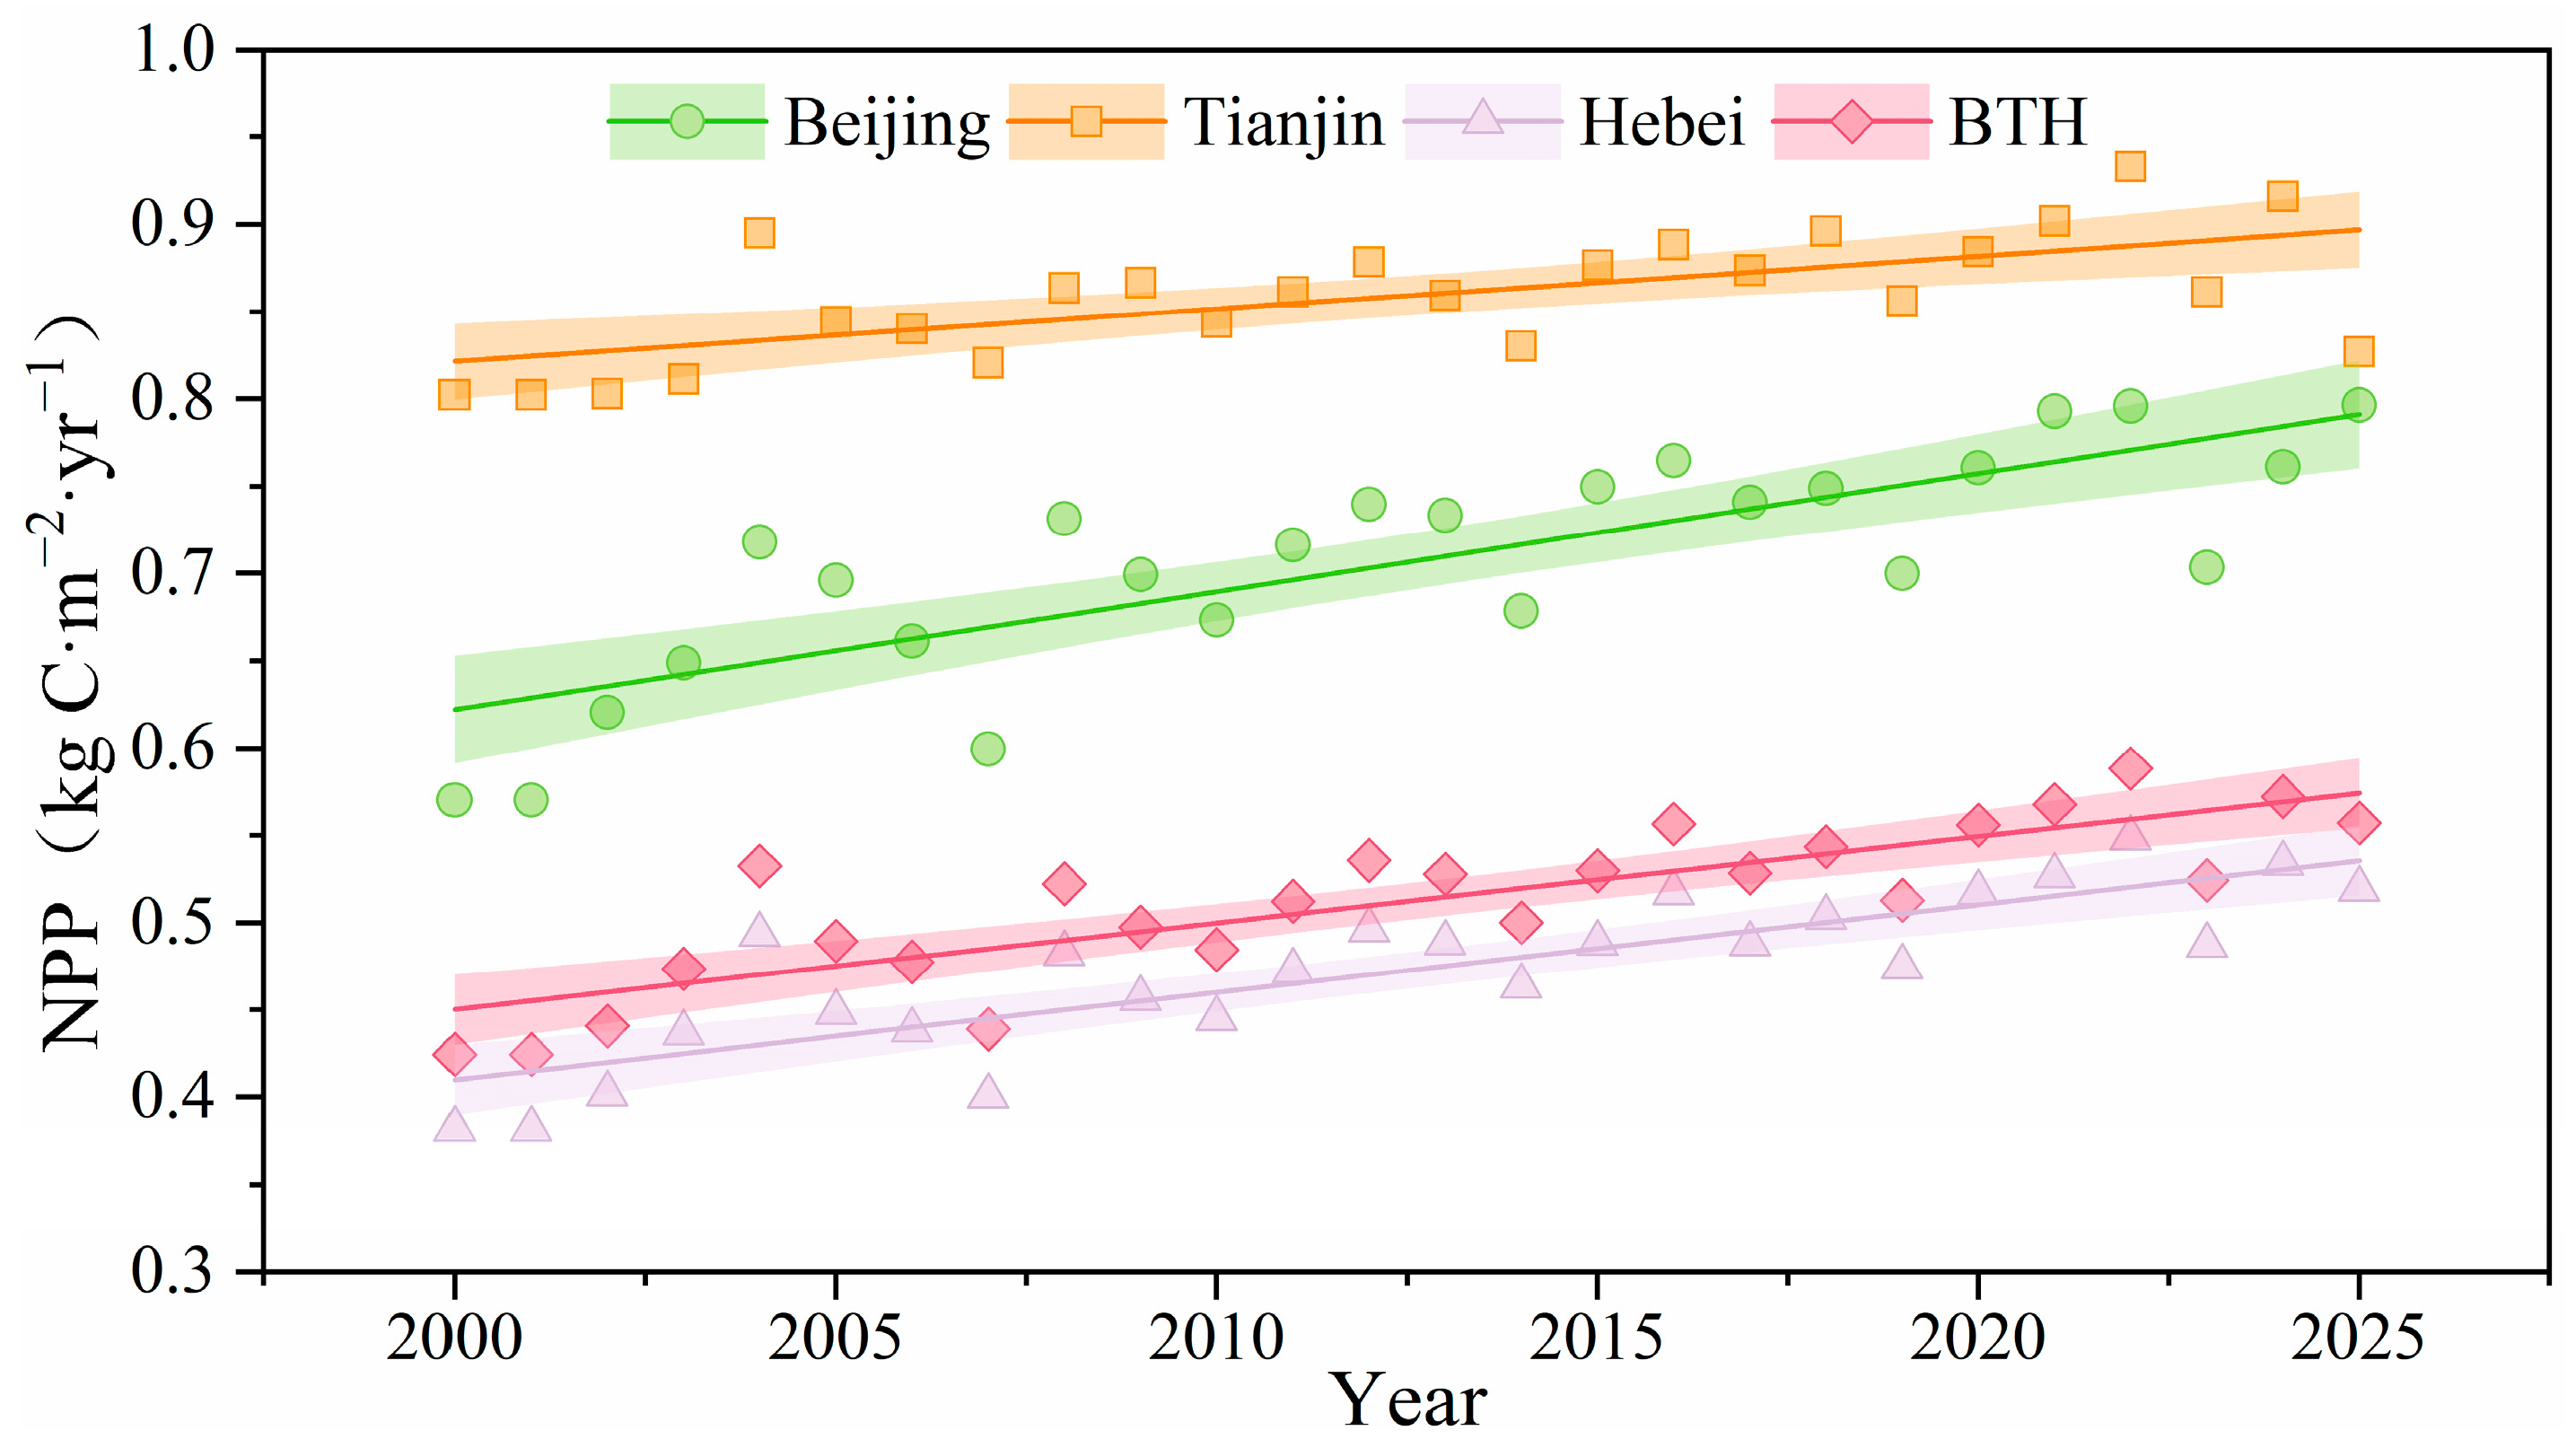
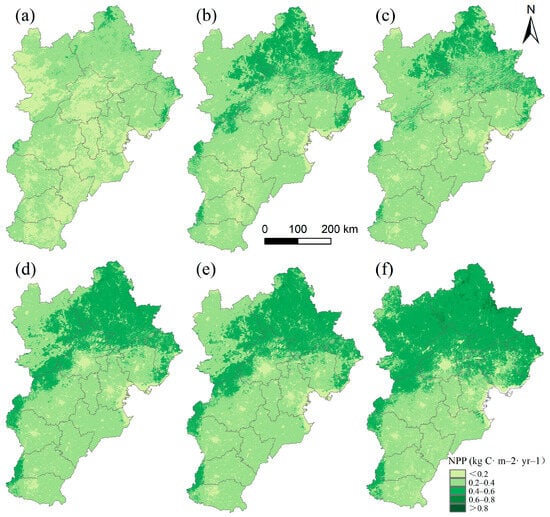
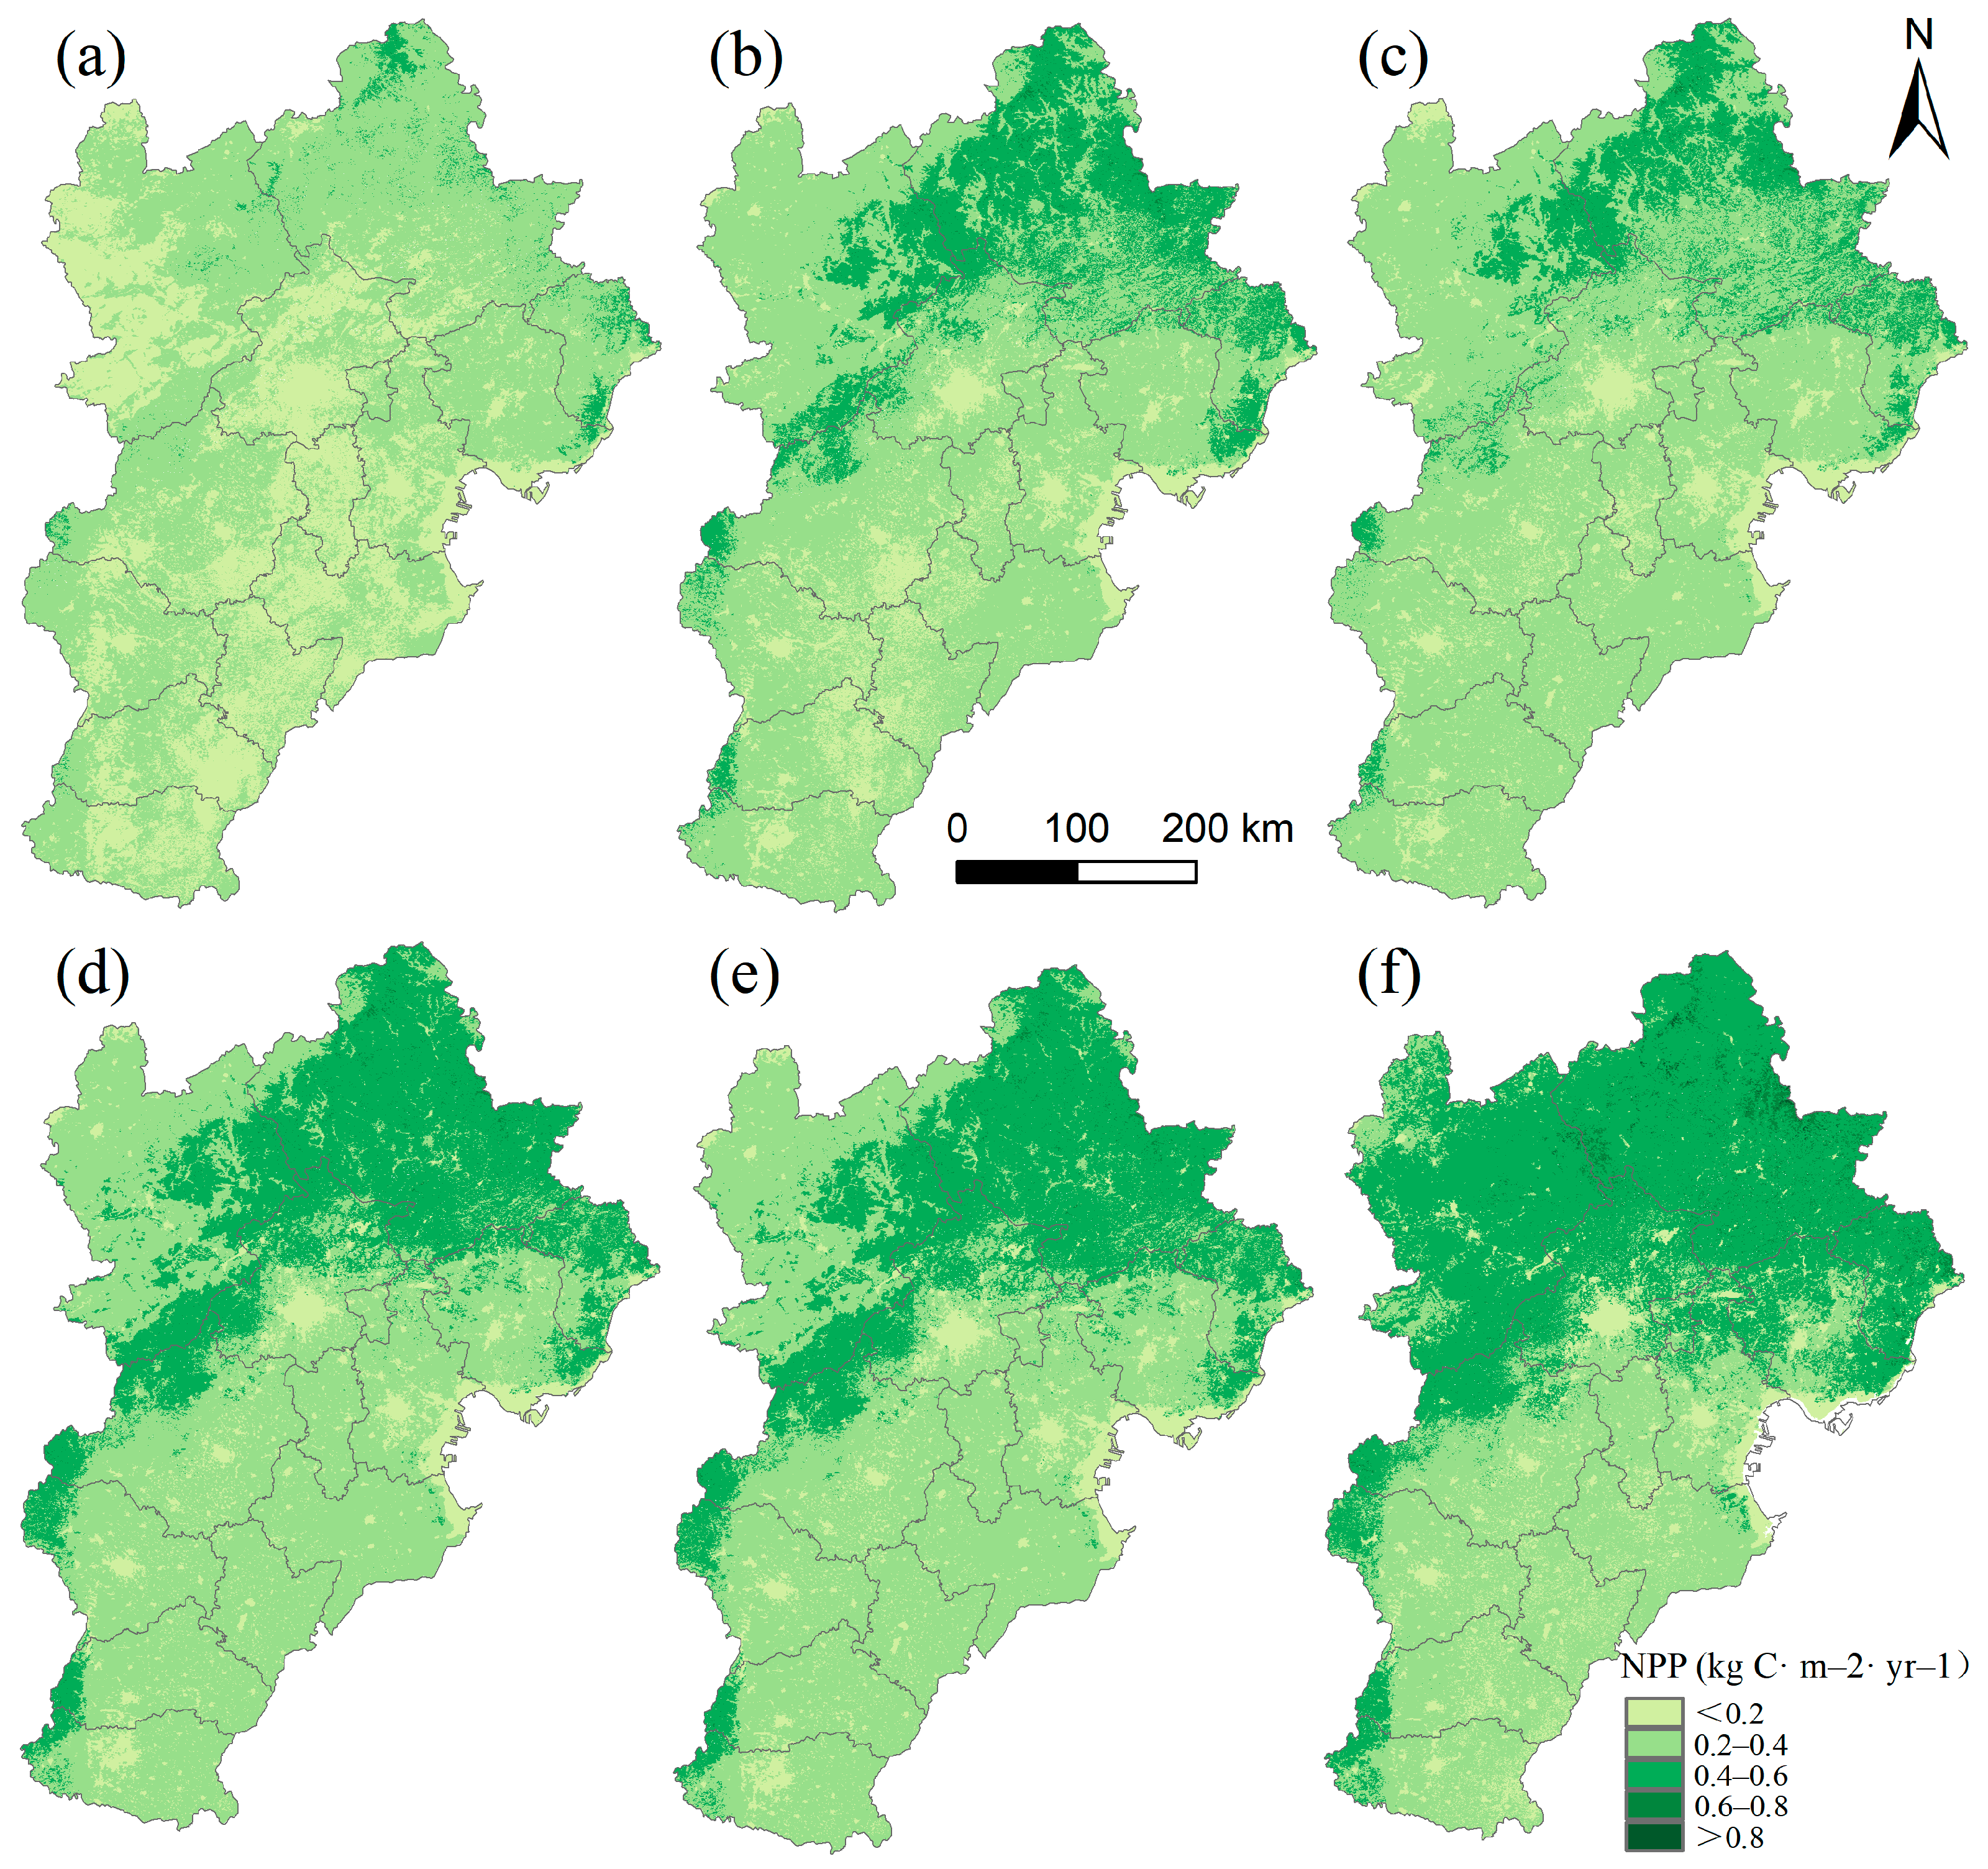
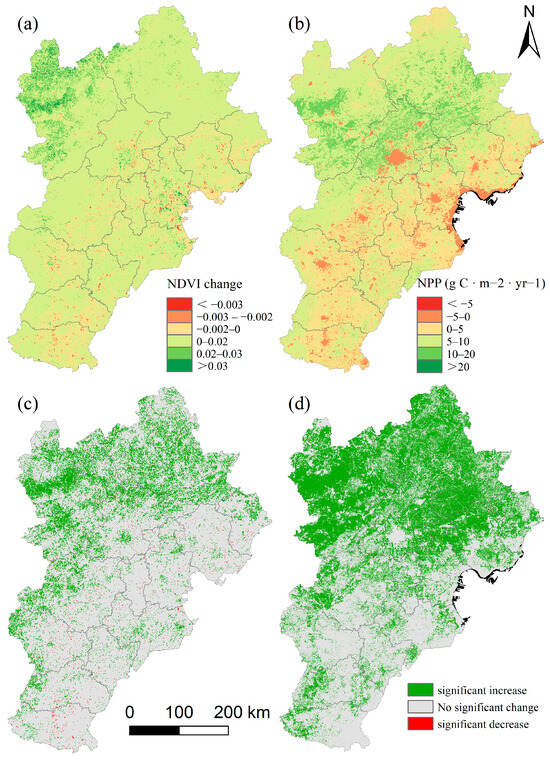
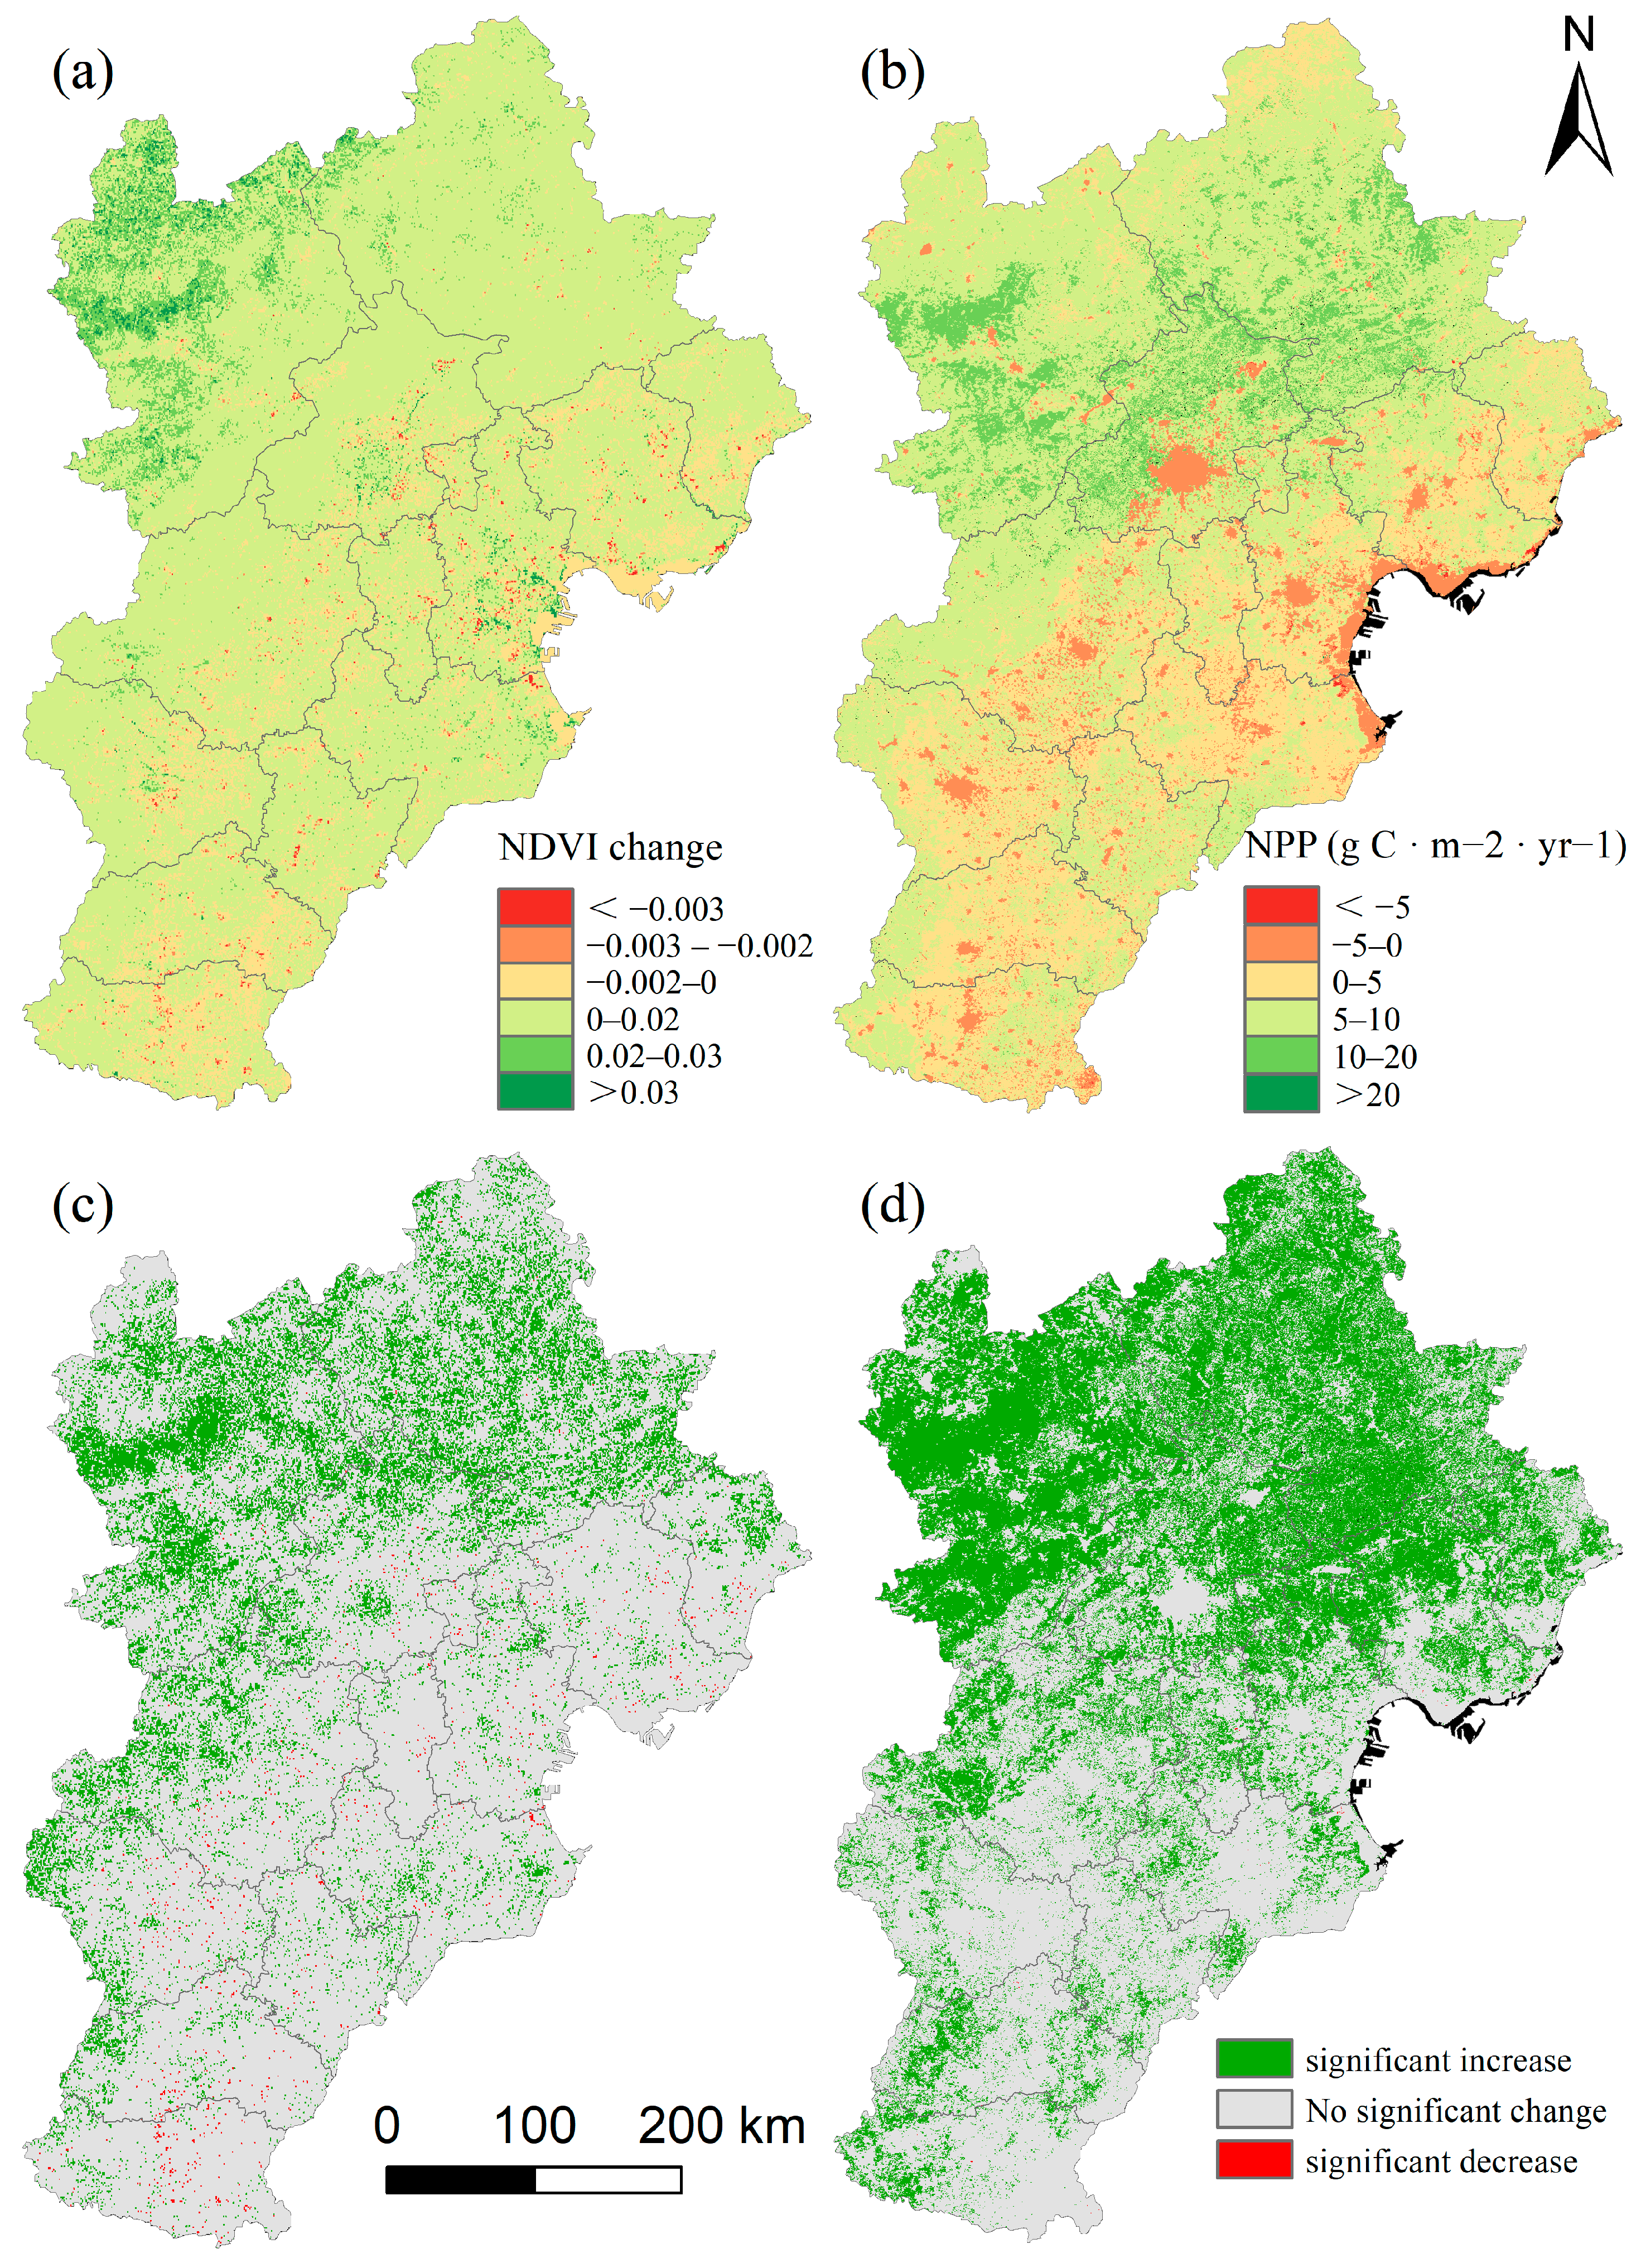
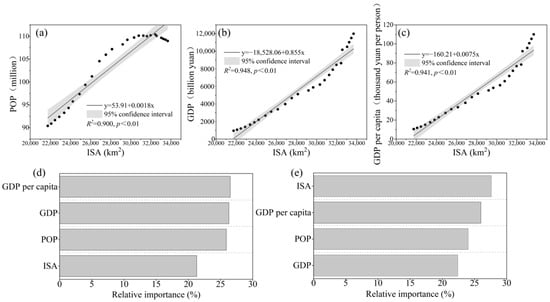
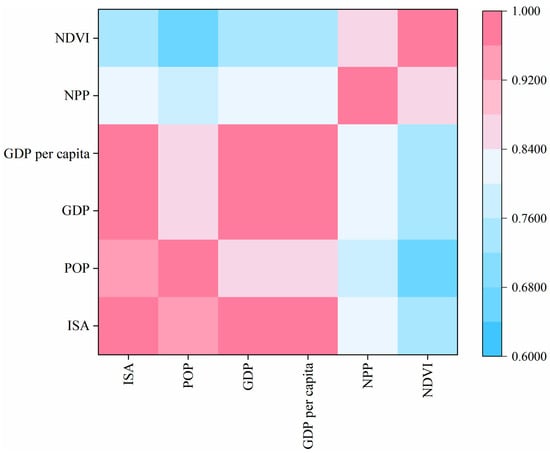
Disclaimer/Publisher’s Note: The statements, opinions and data contained in all publications are solely those of the individual author(s) and contributor(s) and not of MDPI and/or the editor(s). MDPI and/or the editor(s) disclaim responsibility for any injury to people or property resulting from any ideas, methods, instructions or products referred to in the content. |
© 2026 by the authors. Licensee MDPI, Basel, Switzerland. This article is an open access article distributed under the terms and conditions of the Creative Commons Attribution (CC BY) license.