


Abstract
This study examines how rising tourism demand reshapes residents’ environmental responsibility behaviors (ERB) in South Korea, and the moderating role of metropolitan status therein. Using a balanced panel of 174 municipalities over 2015–2023, semi-log regression with a quadratic tourism-demand term and Driscoll–Kraay standard errors is applied to address heteroskedasticity, autocorrelation, and cross-sectional dependence. The estimates show that tourism demand displays a positive effect on ERB (a 6.6% increase in recycling volume proxy per million visitors) up to a certain threshold, beyond which the influence reverses—consistent with an inverted U-shaped relationship under overtourism. Turning points are approximately 11.06 million visitors for non-metropolitan municipalities and 6.95 million for metropolitan ones, where saturation occurs earlier. The negative interaction between metropolitan status and the squared tourism-demand term indicates that the erosion is sharper in metropolitan areas. Among controls, inbound visitor share (+2.8%), regional population (+3.6% per ten thousand residents), resident cost-sharing ratio (+0.4%), tourism special zones (≈1.45 times non-designated areas), tourism complexes (+19.2%), and COVID-19 intervention (≈1.30 times pre-pandemic) are significant, while the fiscal self-reliance ratio exhibits a small adverse impact. These findings suggest tourism policy should favor demand-management over growth-oriented strategies, aligned with regional structural differences and community-based environmental governance.
1. Introduction
While tourism has contributed to regional economic growth, it has also resulted in environmental degradation and social imbalances [1,2,3]. In particular, the recent spatial and temporal overconcentration of tourism demand threatens community sustainability beyond the mere physical problems of traffic congestion, heightened waste generation, and noise pollution [4]. Short-term surges in tourist arrivals sharply increase demand for public services—waste management, sewage systems, and transportation infrastructure—thereby imposing burdens that may exceed local governments’ environmental management capacity and disrupt routine operational systems [5]. These cumulative environmental and social pressures not only degrade residents’ quality of life but also induce behavioral fatigue, which in turn impairs everyday pro-environmental behaviors such as norm compliance and source-separated waste disposal [6,7,8].
Against this background of intricate issues, prior studies have primarily focused on the adverse environmental and societal effects of tourism, dissecting overtourism from multiple perspectives. Representative research themes include the irreversible impacts of tourism growth on environmental pollution (CO2 emissions) [9], the relationship between overtourism and solid waste generation [10], physical pressure and environmental stress in urban tourism contexts [11], nighttime tourism economies and the erosion of local livability [12], tourist–resident conflicts and the differentiation of residents’ emotional responses [13], the transition mechanism of resident perceptions from hospitality to hostility [14], and value destruction and communal resistance among residents [15]. Overall, the literature has approached the effects of overtourism along two main lines: one stream rigorously scrutinizes the physical and environmental consequences of increasing tourist volumes, namely waste generation, land-use pressure, and ecological degradation, while the other focuses on social and behavioral adaptations, including changes in residents’ perceptions and declines in tourism tolerance.
Despite the accumulation of scholarship on overtourism, less visible yet consequential sustainability dimensions—particularly residents’ environmental responsibility behaviors (ERB)—are relatively underexplored in data-driven research. Notable academic and practical gaps thus result (search base: Web of Science, Scopus, ScienceDirect, Google Scholar, and others, as of June 2026; keywords centered on overtourism and environmental responsibility; a combined search returned only two records, neither directly examining residents’ ERB—a scarcity in line with prior work that concentrates on tourists rather than host communities [16,17]). Overtourism can transfer the negative externalities of increasing visitor numbers onto residents, weakening their ERB and potentially destabilizing long-established local resource-circulation practices and everyday norms [5,7]. This phenomenon is theoretically linked to a common dilemma, in which individuals’ environmental actions become attenuated as the pressure on public goods intensifies [18]. Such dynamics suggest that overtourism should be understood not merely as an issue of tourism revenue or traffic control, but as a process through which local resource governance and residents’ everyday pro-environmental behaviors deteriorate.
Accordingly, this study empirically investigates how excessive growth in tourism demand reshapes residents’ ERB. Methodologically, the current inquiry holds academic significance by quantitatively testing the relationship between rising tourism demand and residents’ ERB. It also carries practical implications by providing a basis for assessing whether tourism policies diminish or strengthen regions’ endogenous environmental governance capacity. To examine this structural linkage, the present study adopts South Korea as its research setting. Existing studies on overtourism in South Korea have been concentrated on specific thematic clusters: host-tourist conflict and anti-tourist attitudes in urban historic districts [19,20], psychological carrying capacity and touristification of traditional neighborhoods [21], and social-media-induced transformation in urban centers and fishing villages [22,23], while evidence on nature- and forest-based contexts remains relatively limited [24].
South Korea is particularly suitable for municipal-level comparative analysis, as it exhibits substantial regional variation in tourism demand while maintaining systematically compiled administrative and environmental data at the local government tier [25,26,27,28]. Overtourism impacts tend to manifest more clearly at the regional level than at the national scale; tracing how tourism pressure affects residents’ ERB across municipalities is therefore both theoretically and empirically important [29]. Moreover, South Korea exhibits relatively compressed cycles of tourism growth, congestion intensification, regulatory intervention, and renewed expansion, making it a case in which the evolution of overtourism and corresponding policy responses can be observed within an accelerated timeframe [30,31]. Being confined to a single national setting, it offers conditional insights for institutionally comparable contexts rather than a universally generalizable model for all regions undergoing rapid tourism expansion.
Furthermore, this study extends the analytical framework by incorporating interaction effects associated with tourism intensity, recognizing that the focal relationship may vary according to regional structural characteristics [32]. Specifically, regional differences between metropolitan and non-metropolitan areas are specified as a moderator to identify heterogeneity in the effects of tourism demand growth on residents’ ERB across localities [32,33]. Regions with higher tourism intensity and those with lower intensity differ in administrative capacity, infrastructure provision, and resident composition; consequently, behavioral responses to escalating visitor pressure are likely to manifest differently across such contexts [34]. In particular, South Korea displays pronounced disparities between metropolitan and non-metropolitan areas in terms of population density, tourism infrastructure, and fiscal capacity, rendering it a suitable context to capture spatial heterogeneity through moderation analysis [25,27,35,36].
The specific research objectives of this study are as follows. First, it empirically analyzes the effects of increasing tourism demand on residents’ ERB at the municipal level. Second, it examines whether tourism intensity differences between metropolitan and non-metropolitan areas moderate this relationship. Third, it identifies potential thresholds or transition patterns through which environmental management systems weaken as tourism demand increases. Through these objectives, this study aims to clarify how overtourism generates differentiated environmental and social pressures across local communities, and to derive theoretical and policy implications for municipal tourism governance.
To this end, this study follows a structured research procedure. Beginning with the identification of the research problem, the study proceeds through a review of relevant literature, model specification, the collection of reliable secondary public data, and the construction of an analytical framework. A nonlinear regression model is then estimated, incorporating control and moderating variables centered on overtourism and ERB, to detect potential transition points at which local environmental management systems become imperceptibly undermined once tourism demand exceeds a certain level [37]. Finally, the study derives theoretical and policy implications from the empirical findings.
2. Literature Review
2.1. Overtourism
This section reviews the definition of overtourism and its structural characteristics. Overtourism has been discussed from multiple perspectives in the literature, with scholars framing the concept along dimensions such as destination saturation, residents’ quality of life, and the sustainability of host–guest relationships. Goodwin [38] described overtourism as a situation in which local residents (hosts) or visitors (guests) perceive that there are “too many visitors,” resulting in an unacceptable deterioration in residents’ quality of life or the visitor experience. Similarly, Koens et al. [11] defined overtourism as tourism that exerts excessive negative impacts on host communities and natural environments.
In addition, Alonso-Almeida et al. [39] conceptualized overtourism as a phenomenon in which the positive economic and social outcomes generated by the tourism sector are undermined, thereby provoking resistance among local residents. Notably, the UNWTO [40] characterized overtourism as a state in which tourism severely deteriorates both resident well-being and visitor satisfaction. In essence, overtourism can be understood as a condition in which tourism activity exceeds a destination’s carrying capacity, placing community life, environmental systems, and local infrastructure under sustained and compounding strain.
Indeed, overtourism intensifies congestion at tourist sites and amplifies pressure on waste management, transportation networks, and ecological resources, which leads to physical environmental degradation [2,41]. Moreover, the concentration of tourism activity fosters commercialization and compromises local living conditions, giving rise to social fractures such as heightened resident fatigue and deepening community conflicts [42]. Collectively, rising tourism demand sharply expands public service needs, which in turn compounds fiscal and administrative burdens and ultimately forms a structural vicious cycle that erodes municipal environmental management systems [43]. A recent study [44] has extended this discussion beyond congestion itself, reframing overtourism as a set of multifaceted challenges encompassing climate and environmental stressors, the depletion of local resources, and emerging strains on urban governance.
In the South Korean context, rapid tourism growth, the influx of inbound visitors, and widening regional disparities have accelerated the accumulation of both physical and social impacts of overtourism, thereby stimulating a growing body of related research [30,36,45,46]. This pattern emerges more sharply at the local level, where tourism-related shocks are filtered through variations in municipal administrative capacity, infrastructure limits, and degrees of social capital, which produce markedly differentiated outcomes even in response to comparable increases in tourism demand [33,34,47]. These contextual characteristics, therefore, justify specifying tourism demand as the key explanatory variable and tourism intensity as a moderating factor in the analytical framework.
2.2. Overtourism and Environmental Responsibility Behaviors
Specifically, the concept of ERB is introduced to further examine overtourism, providing a basis for understanding the less visible sustainability dimensions that are central to the current study [48]. This study construes ERB not as individual attitudes or institutional outcomes, but as collective practices—such as routine household waste separation—that are repeatedly enacted and accumulated in residents’ everyday lives [49,50]. To facilitate a more comprehensive view of ERB, the theoretical foundations of local knowledge systems are reviewed first. Local knowledge systems refer to the environmental management practices, norms, and experiential knowledge that residents have developed through daily life—encompassing locally embedded rules, resource-circulation processes, and livelihood-based modes of land and material use [51]. Through such systems, context-specific and application-oriented management capacities emerge in alignment with regional characteristics and resource-circulation structures. As local knowledge systems weaken, the normative foundations that support residents’ ERB are gradually undermined, leading to a decline in individual pro-environmental conduct and a corresponding deterioration of collective management behaviors [52].
Within the tourism literature, ERB and local knowledge systems have also drawn scholarly attention, though primarily through cross-sectional or case-study approaches (e.g., [5,48,53]). Much of this work relied on proxy indicators—such as recycling volumes and recycling rates—to measure ERB. In this context, the breakdown of local knowledge systems is posited to mediate the relationship between overtourism and ERB. Concretely, rising tourism demand triggers a commons dilemma that diminishes the perceived effectiveness of individual actions and weakens social norms, through which overtourism progressively destabilizes ERB in less visible ways [18,54]. The adverse effects of overtourism have been predominantly examined with a focus on intensified physical environmental burdens, including waste generation, traffic congestion, and land-use pressures. However, empirical research addressing changes in ERB and local knowledge systems has remained scarce [41,44,55]. Such relational effects are also insufficiently investigated in the South Korean context (search base: KCI [Korea Citation Index], RISS, DBpia, KISS, e-article, and Scholar, as of June 2026; keywords centered on overtourism, environmental responsibility, and recycling; a combined search returned no records), further underscoring the need for municipal-level empirical analysis.
2.3. Metropolitan vs. Non-Metropolitan Tourism Intensity Moderation
In this part, the theoretical and empirical rationale for specifying the moderator is established by explaining how the relationship between overtourism and ERB may vary with place-based conditions. Of particular interest is the possibility that the main effect of overtourism on ERB may operate differently across regions with varying levels of tourism intensity. The notion can be understood not merely as the number of visitors, but as the extent to which tourism demand strains a locality’s carrying capacity and the spatial scope of local community life [32,56]. That is, the concept integrates factors including the ratio of visitors to residents, spatial density, and the capacity of transportation and environmental infrastructure. Accordingly, even identical increases in tourist volumes may generate markedly different environmental and social burdens in diverse regions [29,32,56,57]. In the case of South Korea, these attributes are structurally differentiated between metropolitan and non-metropolitan areas [35,58]. Empirically, the country exhibits substantial spatial disparities in both inbound and domestic tourist flows, yielding pronounced contrasts in the pressure that tourism demand places on local communities [45,59,60,61].
From the preceding viewpoint, variations in tourism intensity are more realistically captured as structural differences rooted in locale-specific characteristics rather than as marginal gaps in any single indicator [56,62]. Building on this rationale, the present study operationalizes tourism intensity not through continuous indicators but through metropolitan versus non-metropolitan status, used as a binary proxy [33,63]. Metropolitan status denotes a category of areas that systematically vary across the attributes outlined above, thereby effectively representing underlying distinctions between regions [35,64]. Such an approach also offers methodological advantages. When continuous indicators of tourism intensity, such as visitor-to-resident ratios, are used in panel data, they may introduce multicollinearity or unstable temporal fluctuations; by contrast, metropolitan status is time-invariant and exogenous, providing a more stable basis for moderation analysis [65,66]. Consistent with this position, previous studies (e.g., [2,29,32,67]) have reported that in localities with high tourism dependence or relatively limited infrastructural capacity, the negative effects of increasing tourism demand tend to accumulate more rapidly.
These findings suggest that regions with higher tourism intensity respond more sensitively to changes in tourism demand, and the resulting shocks exert a stronger imprint on residents’ ERB. In South Korea’s policy landscape, tourism debates have consistently centered on mitigating excessive concentration in the metropolitan core while promoting the dispersion of tourism demand toward non-metropolitan areas. This dichotomous framework aligns with approaches that seek to manage tourism demand while simultaneously addressing region-specific environmental burdens [30,68]. Taken together, conceptual, methodological, and policy considerations jointly justify treating tourism intensity in the South Korean setting as a destination-level attribute indexed by this proxy. Consequently, metropolitan status is employed as a moderating variable to examine structural heterogeneity in overtourism effects.
In this study, the metropolitan category refers not to officially designated cities in general but to the Capital Region—Seoul, Incheon, and Gyeonggi Province (the Seoul Capital Area). Indeed, tourism demand in South Korea is heavily concentrated in the Capital Region; about 78.7% of inbound leisure visitors visited Seoul in 2015 [69], and roughly half of all domestic visitors to Jeju, the country’s leading destination, originate in the Capital Region [59]. This structural concentration leaves it particularly vulnerable to overtourism [45]. Across this densely concentrated region, saturation surfaces less from ordinary growth in tourism demand than from pressure accumulating beyond a threshold [11,40]. Recent urban-tourism work similarly reports that tourism intensity shapes urban and resident outcomes in a nonlinear rather than monotonic fashion [70,71]. METRO is therefore specified as a binary moderator rather than a mean-shift dummy, a form that stays exogenous and time-invariant while yielding a clear metropolitan/non-metropolitan contrast for policy interpretation, isolating the nonlinear vulnerability that emerges once visitor pressure exceeds local absorptive capacity.
2.4. Control Variables
This section delineates key control variables that may operate as covariates and discusses their theoretical foundations and empirical evidence in order to more clearly isolate the relationship between overtourism and ERB. Regional population size directly affects the absolute levels of municipal solid waste generation and recycling activities, thereby serving as a fundamental structural factor that explains spatial variation in ERB [72,73]. More importantly, population size is likely to be highly correlated with principal explanatory variables—including tourism demand, infrastructure scale, and fiscal capacity. The correlation requires its incorporation as a control to disentangle the net effect of tourism [35,67,72]. In addition, the proportion of inbound visitors reflects the relative presence of cultural outsiders among tourists in a given region, which functions as a social-contextual condition that may influence residents’ ERB [54,74,75,76]. As the share rises, local communities may strengthen environmental responses aimed at image management and order maintenance; the variable should therefore be controlled separately from overall tourism demand effects [42,74,77].
The fiscal self-reliance of the sanitation budget and the resident cost-sharing ratio are institutional indicators of whether a region’s environmental management system relies on central government grants or is funded through local and resident-based revenues [78,79]. The former measures the extent to which a municipality finances waste management through its own-source revenues, representing the capacity for autonomous operation of the local environmental administration system without dependence on intergovernmental transfers [80]. The latter denotes the proportion of waste treatment costs directly borne by residents and captures the institutional structure of cost sharing, along with the behavioral incentives tied to residents’ financial responsibility for environmental stewardship [81]. Such fiscal and institutional differences can bear directly on environmental outcomes independently of tourism demand, thereby necessitating control to prevent overestimation or underestimation of the effects of tourism—and, by the same token, helping to isolate the behavioral signal of the proxy (i.e., recycling volume) from its institutional drivers.
The level of tourism development can affect not only the scale of tourist inflows but also the composition of waste generation and management practices, which warrants separate control from tourism demand itself [2,82]. The designation of tourism special zones and tourism complexes represents the degree to which tourism activities are institutionally organized and spatially concentrated within a region. Tourism special zone status reflects whether a region is legally and administratively designated for centralized tourism management, encompassing spatial congestion structures associated with the clustering of commercial and leisure functions and increased population mobility [83,84]. The number or presence of tourism complexes indicates the extent of planned tourism infrastructure concentration and corresponds to the development intensity through which large-scale accommodation- and leisure-oriented activities shape local environmental burdens [82,85].
COVID-19 constitutes an exogenous shock that disrupted local environmental management conditions through sharp declines in tourism demand, changes in consumption patterns, and shifts in waste streams [86,87]. If such temporal disturbances remain uncontrolled, the relationship between tourism demand and ERB may be distorted; the variable is therefore included as a covariate in the analysis.
2.5. Research Questions
Based on the review of prior studies, three key issues are identified. First, existing research has predominantly emphasized the physical and environmental impacts of tourism, while studies that structurally analyze behavioral and intangible dimensions—namely residents’ ERB and local knowledge systems—remain comparatively few. Second, although the cumulative effects of tourism demand and the gradual evolution of residents’ ERB should be observed over time, much of the prior empirical work has been based on cross-sectional designs, which constrains the ability to capture structural changes across municipalities. Third, even at comparable levels of tourism demand growth, its influence may diverge depending on regional tourism intensity and local absorptive capacity; however, few studies have explicitly tested this heterogeneity by incorporating tourism intensity—including tourism density or capacity constraints—as a moderating factor.
Given these limitations, the current research argues that the impacts of overtourism on regional sustainability should be analyzed from a more structural and dynamic perspective. Most notably, further empirical inquiry is required to clarify how rising tourism demand alters residents’ ERB in municipal settings. In addition, the present study tests the moderating role of tourism intensity (proxied by metropolitan status) to more precisely characterize regional heterogeneity in these effects. Accordingly, the following research questions (RQ) are proposed:
RQ1.
How do increasing tourism demand and the resulting overtourism dynamics affect residents’ ERB at the municipal level?
RQ2.
Does the relationship between overtourism and residents’ ERB differ between metropolitan and non-metropolitan areas?
RQ3.
How are structural and institutional factors—including regional population size, the proportion of inbound visitors, environmental fiscal structures, levels of tourism development, and the COVID-19 shock—associated with residents’ ERB, and in what manner do they qualify the estimated effects of tourism demand?
3. Materials and Methods
3.1. Variable Selection
Drawing on prior research, this study explores the structural relationship between overtourism and residents’ ERB and selects core explanatory variables to enter the regression model. Specifically, tourism demand and its squared term—embodying the nonlinear (inverted U-shape) dynamics of overtourism [11,38,39,40]—are treated as the primary predictors [18,43,54]. Alongside these, tourism intensity [29,32,56,57], approximated by metropolitan status, is taken as the moderator that may inflect this relationship. Within the analytical framework, several covariates are included to adjust for confounding biases. These cover the proportion of inbound visitors [54,74,75,76], regional population size [67,72,73], the fiscal self-reliance of the sanitation budget [78,80], the resident cost-sharing ratio [81], tourism special zone status [83,84], the number of tourism complexes [82,85], and a COVID-19 intervention [86,87] for the temporal shock. Notably, the two fiscal covariates additionally control for institutional drivers of recycling volume—the operational proxy of ERB. Table 1 presents the composition of independent variables included in the research model on overtourism and residents’ ERB, together with their theoretical implications.
Table 1.
Summary of input variables and theoretical foundations.
3.2. Data Collection
For the empirical analysis, secondary quantitative data were sourced primarily from nationally recognized public data portals to ensure reliability and consistency. At the outset, residents’ ERB were operationalized using recycling volume, for which household-level municipal data were obtained from the Korean Statistical Information Service (KOSIS). It is treated here not as a direct measure of residents’ environmental attitudes but as a revealed, indirect indicator of their ERB—an observed behavioral outcome [49,88,89]. Objective recycling quantities have already been used as the dependent variable in municipal- and regional-level panel regressions, estimated directly against socioeconomic and policy covariates [90,91,92,93]. Municipal recycling data cover the living-sphere waste stream, which by statute also encompasses waste from small businesses without dedicated discharge facilities—tourism-related restaurants, cafés, and lodging—so the aggregate scales partly with population and visitor numbers (the Wastes Control Act of the Republic of Korea, Article 2). By the same statutory scope, the variable excludes industrial, construction, designated, and large-emission-facility streams, and therefore does not represent a region’s total waste. These businesses are nonetheless local actors whose recyclables enter the records only through the same sorting act required of households, so their inclusion mirrors the reality of a tourism-pressured locality rather than contamination of the measure. Their sorting is thus counted as behavior, while the volume their scale mechanically generates is absorbed by the controls for tourism demand, tourism special zone status, and the number of tourism complexes.
Critically, under the volume-based disposal fee—chargeable general waste, but recyclables collected at no volume-based charge—and mandatory source separation, recorded recycling is not an automatic or infrastructural by-product but the outcome of deliberate sorting by residents and businesses [88,94,95]. This mandate sets the institutional condition but does not guarantee full compliance: enforcement and deterrence matter, and households may evade the fee through illegal dumping, so recorded recycling reflects realized, variable participation [96,97]. Within the model, the scale effects of tourism and commerce are absorbed by these same tourism-related controls; the resident population enters as its own control; time-invariant structural conditions are captured by municipality fixed effects; fiscal and institutional conditions, by the sanitation-budget and cost-sharing controls; and season-driven population shifts, by the annual data frequency. The non-behavioral drivers raised as alternatives are thus partialled out rather than left in the residual, so the remaining within-municipality variation can be read as a scale-adjusted behavioral signal—identified by ruling these alternatives out rather than by assumption, without claiming to eliminate all confounding [65,98].
In this study, recycling volume was selected as the proxy over the recycling rate. The rate expresses the share of generated waste that is separated and thus indexes the relative efficiency of source separation; its denominator, however—total waste generation—depends not only on population and consumption but also on tourism inflows [99,100,101]. Because tourists themselves generate waste, rising tourism demand directly enlarges that denominator, so the rate may move independently of residents’ actual sorting effort, allowing the tourism effect to become mechanically entangled through it [102]. Recycling volume, by contrast, captures the amount that residents and businesses actually sort and set out, directly measuring the magnitude of source-separation behavior that this study seeks to explain [103,104]. Population scale is arguably better handled by including resident population as a covariate and controlling for fixed effects than by pre-dividing into a ratio; the former is more flexible and less prone to spurious correlation [105,106]. The rate is also a fraction bounded within [0, 1] that would call for a fractional-response model, whereas the log of recycling volume fits naturally into the semi-log panel used here [107]. Finally, under Korea’s volume-based waste fee, recyclables are collected free of charge and recorded as quantities (tons), with the recycling rate derived from them [88,94]. Recycling volume was therefore judged the more appropriate measure for examining how overtourism affects the magnitude of residents’ source-separation behavior.
Furthermore, tourism demand was measured from visitor entry data for major tourist attractions published by the Korea Culture and Tourism Institute and the TourGo platform. The designation of tourism special zones, along with the number of tourism complexes, was retrieved from the Tourism Development Information System (TDSS). Data on regional population size, the fiscal self-reliance of the sanitation budget, and the resident cost-sharing ratio were also compiled from KOSIS. Apart from these, the overtourism phenomenon and the proportion of inbound visitors were constructed through additional processing of the source data. Dummy variables were created to represent metropolitan status and the COVID-19 intervention period based on regional and temporal characteristics. The temporal scope of the study was defined to build a panel dataset. Ultimately, a balanced panel comprising 174 municipalities over a nine-year period (2015–2023) was assembled without missing values, ensuring full compatibility with the research objectives. Table 2 describes the units of measurement and data sources for the extracted and derived explanatory variables.
Table 2.
Units of measurement and data sources.
3.3. Data Transformation
First, an assessment of the normality of the dependent variable revealed substantial right-skewness, with concentration in the upper-value range, as evidenced by the Kolmogorov–Smirnov statistic (D = 0.425, p < 0.001) and the Shapiro–Wilk statistic (W = 0.626, p < 0.001). To stabilize the distribution and facilitate comprehension of the results, a semi-log functional form was adopted. This transformation allows the estimated coefficients to be interpreted as relative percentage changes in residents’ ERB associated with a one-unit change in each independent variable. Tourism demand was rescaled in units of one million visitors to enhance clarity, and its squared term was added to capture potential nonlinear effects of tourism pressure. Doing so relaxes the linear assumption that the marginal effect of tourism demand remains constant across all its levels. This mirrors the logic of the Environmental Kuznets Curve, which posits a nonlinear threshold rather than a fixed relationship [3]. The specification is consistent with overtourism, which implies that the initially positive effect of tourism demand may weaken or reverse once pressure exceeds the destination’s absorptive capacity. The squared term is therefore not a separate direct measure of overtourism, but a nonlinear tourism-pressure term that lets the model test for diminishing or reversing marginal effects and estimate the corresponding turning point. Metropolitan status, the COVID-19 intervention period, and tourism special zone status were coded as dummy variables, with a value of 1 when the condition applied and 0 otherwise. Here, METRO denotes municipalities in the Capital Region—Seoul, Incheon, and Gyeonggi Province.
In estimating moderation effects, interaction terms between tourism demand (and its squared term) and metropolitan status were generated. To mitigate potential multicollinearity, all constituent variables were mean-centered prior to constructing these interaction terms, following Aiken and West [108]. The resulting centered products were then included in the analysis. Other variables—including the proportion of inbound visitors, the fiscal self-reliance of the sanitation budget, and the resident cost-sharing ratio—were retained in their original ratio scales, while the number of tourism complexes was treated as a continuous count variable. Finally, regional population size was expressed in units of ten thousand residents for readability.
The baseline regression model is formally given in Equation (1).
In this specification of lnERB, through denote the regression coefficients of the explanatory variables, where is the intercept, i covers the 174 municipalities, t represents the nine annual time points, and ε signifies the idiosyncratic error term. The dependent variable, ERB, refers to environmental responsibility behaviors, proxied by recycling volume. TOUR denotes tourism demand, while TOUR2 models its nonlinear effect and is interpreted as the tourism-pressure component. Accordingly, the marginal effect of tourism demand is not constant but varies with its level, given by + 2·TOUR, so that a positive with a negative implies an influence that diminishes and may reverse as demand rises. METRO is a dummy variable indicating whether a municipality belongs to the metropolitan area. TXM and TXM2 represent the interaction terms between TOUR and METRO, and between TOUR2 and METRO, respectively, reflecting moderation effects associated with tourism intensity. Among the control variables, FOREIGN indicates the proportion of inbound visitors, RESIDENT denotes the regional population size, CLEAN represents the fiscal self-reliance of the sanitation budget, and BURDEN refers to the resident cost-sharing ratio for waste management costs. In addition, SPECIAL and COMPLEX denote tourism special zone status and the number of tourism complexes within a municipality, respectively. Finally, COVID19 is a dummy variable indicating the COVID-19 intervention period. Furthermore, Figure 1 illustrates the theoretical framework proposed in this study.
Figure 1.
Research model.
3.4. Analytical Modeling
In this study, a panel data model that accommodates both spatial and temporal variations across municipalities was applied. This approach allows for the simultaneous consideration of regional heterogeneity and time-series dynamics, which renders it especially suitable for analyzing changes in residents’ ERB as overtourism intensifies across regions in South Korea [109]. Panel data analysis is generally classified into the fixed effects (FE) model and the random effects (RE) model, depending on the structure of the error term and the underlying assumptions regarding unobserved heterogeneity. The FE model assumes that slope coefficients are identical across units, while intercepts are allowed to vary, thus controlling for unobserved, time-invariant individual characteristics. In contrast, the RE model treats individual-specific effects as stochastic components and rests on the assumption that these effects are uncorrelated with the explanatory variables across all time periods.
Due to these differences, the FE model eliminates individual-specific effects through within transformation, leaving time-invariant explanatory variables unidentifiable. More specifically, by demeaning these time-invariant characteristics, the estimator removes persistent differences in collection infrastructure, system maturity, and geography by construction rather than by assumption [65]. The RE model, conversely, permits the simultaneous estimation of both time-varying and time-invariant variables, conditional upon the assumption that individual effects are uncorrelated with the explanatory variables [110]. Both models can be expressed using the following baseline specification as shown in Equation (2):
where denotes the dependent variable; i indexes municipalities; t denotes time; represents the intercept; and is the vector of coefficients. The term refers to the set of explanatory variables, absorbs unobserved individual-specific effects, and denotes the residual error term.
The fundamental distinction between the FE and RE models lies in the treatment of : the FE model regards it as a parameter to be estimated, whereas the RE model assumes it to be a random variable. Moreover, the RE model requires the assumption that is uncorrelated with the explanatory variables, an assumption that is not imposed under the FE model framework. When it is necessary to further control for unobserved characteristics that vary over time but are common across units, the model can be extended as expressed in Equation (3) below:
In this specification, represents unobserved time-specific effects that affect all municipalities simultaneously. This formulation corresponds to a two-way error component regression model. When the individual-specific effect, , is treated as a fixed parameter, the model becomes a two-way fixed effects (TWFE) model; when it is assumed to be a random variable, it becomes a two-way random effects (TWRE) model. The most appropriate model for interpretation is selected through a series of statistical tests.
The Chow test is employed to assess the adequacy of the FE model relative to the pooled ordinary least squares (OLS) model, while the Lagrange Multiplier (LM) test evaluates the suitability of the RE model against the pooled specification. Lastly, the Hausman test is used to determine whether the FE or RE model provides consistent and efficient estimates. Beyond model selection, panel data are often subject to econometric issues such as heteroskedasticity, autocorrelation, and the presence of time-fixed effects. Accordingly, this study systematically diagnoses these issues and identifies the optimal model specification to ensure robust and reliable inference. The turning points of the quadratic relationship—obtained as −/(2) from Equation (1)—are derived from the estimated coefficients via the delta method, and each is reported as a point estimate with its 95% confidence interval (CI). All statistical analyses were conducted using Stata/MP 15.0 (StataCorp LLC, College Station, TX, USA).
4. Results
4.1. Descriptive Statistics
Prior to model estimation, descriptive statistics for all variables were examined, with the results reported in Table 3. The panel-dataset summaries present the overall means along with the decomposition of variation into “between” and “within” components (shown as the corresponding rows in Table 3). In particular, the “between” standard deviation (SD) reflects dispersion in municipality-level means, whereas the “within” SD captures year-to-year variation within each municipality over the study period. The partitioning reveals that major tourism-related variables—such as TOUR, TOUR2, and TXM2—exhibit substantial between-municipality variation, suggesting pronounced regional heterogeneity in tourism behaviors. By contrast, COVID19 is the only variable whose within-municipality SD exceeds its between-municipality SD, since the pandemic period is defined identically across the entire panel and therefore contributes solely to within-municipality temporal variation. For all other variables, between-municipality variation remains the dominant source. Overall, the descriptive patterns point to a mixed structure in which both core analytical and control variables register heterogeneous spatial and temporal differences. This underscores the need for more rigorous diagnostic tests to determine the most appropriate panel data model for the subsequent empirical analysis.
Table 3.
Descriptive statistics of the input variables.
4.2. Multicollinearity Diagnostics
In panel data analysis, some degree of multicollinearity is often unavoidable due to the time-series nature of the observations. Distortions arising from temporal dependence can be partially addressed through the inclusion of fixed effects [111]. However, assessing multicollinearity among independent variables calls for a separate diagnostic procedure. Thus, a variance inflation factor (VIF) test was conducted, and Table 4 summarizes the findings. Although acceptable thresholds for multicollinearity may vary across studies, all explanatory variables yield VIF values comfortably below the conventional cutoff of 10, suggesting that multicollinearity does not pose a substantive concern in the present analysis (the mean VIF falls to 1.43 once the quadratic and interaction terms are excluded) [112]. While some correlation is observed between tourism demand and its squared term, such an association is theoretically expected and does not constitute an abnormal empirical pattern in the context of nonlinear social phenomena.
Table 4.
Variance inflation factor (VIF) diagnostics for the explanatory variables.
4.3. Model Estimation
To identify the most suitable panel model for analyzing residents’ ERB, this study compared several candidate models—the pooled OLS model, the FE model, and the RE model, with the latter two accounting for both individual- and time-specific effects. The estimation results are presented in Table 5. First, Model (1) reports the pooled OLS estimates, in which neither individual- nor time-specific effects are controlled. The coefficients of TOUR, METRO, RESIDENT, BURDEN, COMPLEX, and COVID19 were statistically significant at the 1% level, and their estimated signs aligned with the theoretical expectations. Notably, the nonlinear term TOUR2 and the interaction term TXM2 also achieved significance. Yet, when unobserved heterogeneity exists across regions or over time, the FE and RE models may be preferable to the pooled OLS model. Model (2) provides the FE estimates, with time-invariant individual heterogeneity at the municipal level controlled. Model (3) reports the RE results, treating regional effects as random variables drawn from a common distribution. To compare the pooled OLS and FE models, a Chow test was conducted. The results, F(173, 1381) = 17.84, p < 0.001, confirm that the FE model fits the data significantly better than the pooled OLS model. Likewise, the LM test comparing the pooled OLS and RE models yielded χ2(1) = 2285.89, p < 0.001, rejecting the null hypothesis of no random effects (see Table 6).
Table 5.
Estimation results across the alternative panel models.
Table 6.
Diagnostic tests and fit measures for panel model selection.
Subsequently, the Hausman test was performed to determine the proper model between the FE and RE models. The test result, χ2(11) = 73.01, p < 0.001, refutes the null hypothesis—that the RE estimator is consistent and efficient—and supports the FE model due to potential correlation between individual effects and the regressors, rendering the RE estimator inconsistent. The importance of accounting for cross-sectional heterogeneity is further evident in the estimated ρ values of the FE and RE models, which were 0.751 and 0.646, respectively.
Meanwhile, Models (6) and (7) correspond to the TWFE and TWRE models, respectively. In two-way error component models, however, including both individual and time effects simultaneously may lead to a considerable loss of degrees of freedom, which can compromise the estimates [98]. In practice, the estimates from these models produced unstable outcomes, with discrepancies in the theoretical signs of several coefficients and the absence of statistical significance for key variables. Crucially, the test for time-fixed effects gave F(7, 1546) = 0.51, p = 0.831, signaling that the use of time-fixed effects was not statistically justified. Consequently, time-fixed effects were excluded from the final model selection (some year dummies were omitted to ensure model identification, given linear combinations with COVID19 and SPECIAL).
Building on this, additional model diagnostic tests were carried out to choose the appropriate model more conservatively, as shown in Table 6. The Modified Wald test (χ2(174) = 29,355.70, p < 0.001) demonstrated group-wise heteroskedasticity, the Wooldridge test (F(1, 173) = 23.373, p < 0.001) confirmed serial autocorrelation, and Pesaran’s CD test (CD = 6.305, p < 0.001) indicated significant cross-sectional dependence across municipalities. Hence, to correct for these issues simultaneously, the present study additionally estimated the model with Driscoll–Kraay (DK) standard errors. Model (4) was selected as the final model, and the following discussion of results centers primarily on this model. Notably, in the DK model, the METRO variable could not be estimated because time-invariant variables are absorbed by the fixed effects transformation. To recover the coefficient of the time-invariant METRO variable, the present study separately estimated a Hausman–Taylor (HT) model. For more efficient estimators, the HT model was extended to the Amemiya and MaCurdy (AM) model, which strengthens the instrumental variable conditions. The HT-AM specification—the HT estimator with its AM extension—is reported as Model (5).
First, the estimated coefficients of the key variables in the DK model were all consistent with the expected theoretical directions. The within R2 of 13.0% signified reasonable explanatory power [62]. The significance tests revealed that TOUR, FOREIGN, RESIDENT, BURDEN, SPECIAL, COMPLEX, and COVID19 were statistically significant at the 1% level, while CLEAN and the overtourism-related variables TOUR2 and TXM2 were significant at the 5% level. In contrast, the interaction term TXM and the METRO variable estimated in Model (5) were not statistically significant.
Specifically, a one-unit (one-million-visitor) increase in TOUR corresponded to an approximately 6.6% rise in recycling volume—used as a proxy for residents’ ERB—under the semi-log functional form. A one-unit increase in the proportion of inbound visitors (FOREIGN) was associated with an estimated 2.8% rise in recycling output, while an additional 10,000 residents (RESIDENT) corresponded to an estimated 3.6% gain. Furthermore, the fiscal self-reliance ratio (CLEAN) and the resident cost-sharing ratio (BURDEN) had statistically significant but relatively modest effects. A one-percentage-point increase in CLEAN was linked to an estimated 0.1% decrease in recycling volume, whereas a one-percentage-point increase in BURDEN produced an estimated 0.4% rise. Regarding tourism development variables, each additional tourism complex (COMPLEX) led to an estimated 19.2% uplift in recycling volume. In the case of tourism special zones (SPECIAL), recycling volumes were estimated to be approximately 1.45 times the levels in non-designated areas (dummy variable effects: %ΔY = (e^β − 1) × 100). The COVID-19 dummy (COVID19) likewise exerted a statistically significant positive effect on recycling volume, which during the pandemic period was approximately 1.30 times its pre-pandemic level.
Most importantly, overtourism—operationalized as the squared term of tourism demand (TOUR2)—exhibited a statistically significant negative coefficient, indicating diminishing marginal effects: the positive impact of tourism demand on ERB gradually attenuates as tourism pressure accumulates. Furthermore, the interaction analysis indicated that the moderating role of metropolitan status was not significant for tourism demand (TXM) but significantly negative for overtourism (TXM2). This finding suggests that the overtourism-driven decline in ERB is more pronounced in metropolitan areas. Figure 2 illustrates the moderating effect of metropolitan status on the overtourism–ERB relationship. To locate the policy-relevant threshold implied by the quadratic specification, the turning points were calculated separately for the non-metropolitan and metropolitan subsamples. Among non-metropolitan municipalities, the marginal effect of tourism demand turns from positive to negative at approximately 11.06 million annual visitors (95% CI [5.59, 16.53]). Within the metropolitan subsample, this reversal occurs much earlier, at 6.95 million (95% CI [4.75, 9.15]). A more detailed discussion of these estimation results is provided in the Discussion section.
Figure 2.
Interaction effect of metropolitan status on the overtourism–ERB relationship.
5. Discussion
This section interprets the main estimates from the Driscoll–Kraay model and discusses their implications for the tourism–ERB relationship. The results indicated that tourism demand had a statistically significant positive influence on ERB. Specifically, a one-unit (one-million-visitor) increase in tourism demand was associated with an approximately 6.6% rise in recycling volume, suggesting that in the early stages of tourism growth, expanding visitor demand may stimulate local environmental management activities or strengthen resource circulation systems, at least in part. In contrast, overtourism—captured by the quadratic tourism-demand term—produced a significant negative coefficient. This pattern revealed a nonlinear structure in which the upward impact of tourism demand on ERB gradually weakens beyond a certain threshold. Taken together, these findings empirically confirm that ERB do not simply respond linearly with growing tourism demand; rather, the initial positive effect may decline or diminish as excessive demand intensifies. The decline beyond the turning point is hard to explain by scale alone, since more arrivals would, by themselves, only add to the recorded volume; it instead points to a weakening of residents’ sorting effort and cooperative norms as visitor pressure mounts.
The moderation analysis further reinforced the same structure. While the interaction between tourism demand and metropolitan status was not significant, that involving overtourism was significantly negative. The dampening influence of overtourism on ERB may thus be more pronounced in metropolitan areas when tourism demand reaches high levels. That is, during the initial phase of tourism demand growth, differences between metropolitan and non-metropolitan areas are not clearly evident. However, under overtourism conditions, the structural context of metropolitan areas may amplify the vulnerability of ERB. This pattern indicates that the Capital Region’s distinctive features bear on the tourism–ERB link only past a nonlinear threshold. At low to moderate demand, its administrative capacity and waste-management infrastructure accommodate additional visitors, so metropolitan and non-metropolitan municipalities behave alike in the ordinary effect, consistent with the non-significant TOUR × METRO. Once demand exceeds this range, however, those same features—dense settlement, overlapping residential and tourism space, high baseline waste-management loads, and intensifying congestion [19]—shift from buffer to saturation constraint, eroding residents’ routine recycling more rapidly, as shown by the significant negative TOUR2 × METRO. The estimated turning points make this divergence concrete: at 6.95 versus 11.06 million annual visitors, the region reverses far earlier, near the 90th percentile of its own demand distribution, whereas the non-metropolitan turning point falls in the upper 1% tail of its own distribution, so that few municipalities ever reach it. Metropolitan status thus deepens the susceptibility of the overtourism stage rather than reshaping the ordinary linear effect, in line with threshold and carrying-capacity arguments in urban tourism [11,70,71]. The control-variable estimates also imply that ERB are closely tied to regional structural and institutional conditions. The proportion of inbound visitors displayed a significant positive relationship with ERB. In quantitative terms, each one-unit increase brought about an estimated 2.8% rise in recycling volume. Regional population size likewise exerted a positive and significant effect on ERB; each additional ten thousand residents translated into a 3.6% gain in recycling output.
The control-variable results further underscore that population size and visitor composition, together with the scale characteristics of the dependent variable (recycling volume), may be closely connected with changes in local environmental management behavior. With respect to environmental finance, the fiscal self-reliance ratio of the sanitation budget was weakly but significantly negative, whereas the resident cost-sharing ratio was significantly positive. Such patterns suggest that the financial basis of environmental management systems and cost-sharing arrangements may directly inform municipal-level environmental governance practices. Significant effects also emerged for tourism development variables. Tourism special zones had recycling volumes approximately 1.45 times those of non-designated areas, while each additional tourism complex corresponded to an estimated 19.2% rise in recycling volume. Environmental management outcomes thus appear to differ systematically in areas where tourism activities are institutionally organized and spatially concentrated. Lastly, the COVID-19 dummy exhibited a significant positive association with ERB; recycling volumes during the pandemic period reached approximately 1.30 times their pre-pandemic level. This positive association, however, should not be read solely as evidence of heightened hygiene awareness or reorganized waste management. During the pandemic, longer time at home, mobility restrictions, and expanded home-based and delivery consumption may have mechanically raised household waste and recyclable materials, independently of any change in environmental attitudes. The COVID-19 effect is therefore better understood as a composite pandemic effect combining home-based consumption growth, shifts in waste-stream composition, hygiene-related awareness, and municipal administrative responses. At the same time, because recycling volume in South Korea is recorded only after source separation and collection, the additional materials still had to be sorted and discharged by residents and businesses before they entered the recorded total, so a behavioral component remains within the composite effect.
Situating these results in the literature, the current study shares certain commonalities with previous research on the relationship between tourism and local environmental management, while also offering several distinct contributions. In particular, the positive influence of tourism demand on ERB is broadly consistent with earlier studies suggesting that increased tourism activity can expand the demand for environmental stewardship and potentially enhance municipal environmental administration systems. Furthermore, the observed weakening of tourism demand’s positive effect on ERB at higher demand intensities aligns with discussions in the overtourism literature [11,38,40,44] regarding rising environmental pressures and the limits of ecological carrying capacity. Prior work [5,6,7,8,18] has likewise pointed out that increasing visitor numbers can heighten host environmental burdens and potentially weaken residents’ pro-environmental behaviors. However, whereas much of the existing research [2,9,10,41,55] has focused primarily on the physical environmental consequences of tourism—such as waste generation or environmental degradation—the present study extends this discussion by empirically demonstrating that the relationship between tourism demand and ERB may follow a nonlinear pattern. Such a threshold structure echoes similar findings reported for urban livability and tourism carrying capacity [70,71], yet, unlike those studies, the present analysis locates the turning point empirically and shows that it shifts with metropolitan status. In addition, how tourism demand influences ERB is found to vary according to regional tourism intensity. Notably, the stronger negative impact of overtourism on ERB in metropolitan areas suggests that tourism’s effects may interact with area-level structural conditions [29,32,35,56,57], including population density, infrastructure capacity, and administrative resources. In this respect, the result corroborates the broader literature [2,29,32,33,34,47,67] emphasizing that tourism’s outcomes are shaped by local context and place-specific absorptive limits.
6. Conclusions
6.1. Summary
This study empirically examined how increasing tourism demand affects residents’ ERB at the municipal level, focusing on heterogeneity between metropolitan and non-metropolitan areas. Using a balanced panel of 174 municipalities in South Korea over the period 2015–2023, the analysis adopted a semi-log specification with a quadratic tourism-demand term to account for potential nonlinear overtourism effects, alongside interaction terms with metropolitan status to test the moderating role. The model selection procedure validated the use of panel estimation: the Chow and LM tests favored FE and RE, respectively, over the pooled OLS model, while the Hausman test further supported FE over RE. Subsequent diagnostics detected heteroskedasticity, autocorrelation, and cross-sectional dependence; to ensure robust inference, the DK estimator was ultimately adopted as the preferred model.
The key results can be summarized as follows. Tourism demand was found to raise residents’ ERB—by about 6.6% in recycling volume per million visitors—up to a turning point, beyond which its influence reversed, tracing an inverted U-shape under overtourism. This threshold fell at roughly 11.06 million visitors in non-metropolitan municipalities but only 6.95 million in metropolitan ones, and the negative interaction with the squared tourism-demand term confirmed that the downturn was sharper in the Capital Region. Among the controls, inbound visitor share (+2.8%), regional population (+3.6% per ten thousand residents), the resident cost-sharing ratio (+0.4%), tourism special zones (≈1.45 times non-designated areas), tourism complexes (+19.2%), and the COVID-19 period (≈1.30 times pre-pandemic) were positive, whereas the fiscal self-reliance ratio carried a small adverse weight (−0.1%).
6.2. Contributions and Implications
Several distinctive approaches set the current analysis apart from prior studies examining the relationship between overtourism and ERB. Notably, while much of the available scholarship has emphasized the visible environmental burdens of tourism—including waste accumulation and ecological degradation—overtourism is approached here through the lens of residents’ ERB. In doing so, the focus extends to how increasing tourism demand may shape local environmental management systems and residents’ everyday environmental practices from a behavioral standpoint.
More importantly, the nexus between tourism demand and ERB is framed in this study as one that may not follow a simple linear pattern. A nonlinear specification including a squared tourism-demand term is applied, and the analysis reveals that tourism demand initially strengthens ERB but, beyond a certain threshold, its positive contribution tapers off—indicating diminishing marginal effects under conditions of overtourism. Relatedly, tourism intensity is proxied by metropolitan status as a structural attribute, and regional heterogeneity in tourism demand effects is tested through a moderation analysis. Such an empirical examination provides evidence that tourism demand’s influence may vary across regional contexts, highlighting the importance of place-based factors in shaping the environmental consequences of tourism expansion.
These findings carry several important policy implications, particularly given that the link observed between rising tourism demand and local environmental management departs from a simple linear structure. First, while tourism demand may bolster municipal waste-management operations and resource circulation systems up to a certain point, excessive accumulation may gradually erode its positive contribution to ERB. Tourism policy should therefore move beyond a growth-oriented approach and be designed to also account for the environmental management capability and carrying capacity of local communities. Second, the nonlinearity that connects tourism demand and ERB implies that tourism policy should attend to the density and management of tourism demand rather than the sheer volume of visitors. Once tourism demand exceeds a certain threshold, this system may come under increasing strain, signaling the centrality of demand-management policy.
Third, the significant association identified between institutional tourism development arrangements—such as tourism special zones and tourism complexes—and ERB also carries direct policy relevance. Accordingly, tourism development policy should not be confined to expanding tourism infrastructure but should instead be integrated with environmental management policies, including waste management systems and resource circulation strategies. Fourth, the sharper erosion of ERB under overtourism in metropolitan areas suggests that tourism policy should reflect regional structural differences. These regulatory strategies may need to adopt tailored measures that align with regional disparities in visitor flows and infrastructure conditions. Finally, the interplay between tourism activities and the local sanitation system is intertwined with residents’ day-to-day environmental conduct, indicating that tourism policy should extend beyond crowd management to encompass community-based environmental management frameworks and resident participation. These implications apply most directly where municipal governments hold substantial responsibility for managing household-type waste and tourism demand, administrative environmental data are systematically compiled, and visitor pressure is spatially concentrated—as in South Korea. They should therefore be transferred only cautiously to countries whose waste-management institutions or administrative structures differ substantially.
6.3. Limitations and Future Research
Although this study empirically investigated the overtourism–ERB nexus, several limitations should be acknowledged. Crucially, recycling volume was employed as a proxy indicator for ERB. The measure is widely accepted in earlier work but does not directly represent residents’ ecological awareness or the broader spectrum of pro-environmental behaviors, warranting cautious interpretation. Future studies may benefit from drawing on survey-based instruments or behavioral data that more closely tap into residents’ attitudes and practices in this area. Because fixed effects absorb only time-invariant heterogeneity, year-to-year variation in how completely separated recyclables are collected and recorded—rather than in residents’ sorting itself—may remain in the residual. Moreover, data were obtained from municipalities in South Korea alone, which may limit external validity—the generalizability of the findings. In addition, South Korea’s waste-management system operates within a relatively centralized and institutionally specific administrative structure, so the findings should be extended with caution beyond similar institutional settings. Since tourism demand profiles and environmental administration differ across countries and regions, future research could undertake comparative studies spanning multiple geographic contexts.
Further, tourism demand was measured primarily using visitor counts at major tourist attractions. Although the indicator is useful for gauging tourism scale, it may not fully convey the finer features of visitor behavior, such as length of stay, mobility patterns, or spending. Future work could leverage mobility data or spatially detailed datasets to better trace the dynamics of tourism activities. As a binary marker of Capital Region membership, METRO also cannot resolve micro-spatial heterogeneity within the region—for instance, between central Seoul, Incheon, and the Gyeonggi periphery. Lastly, the focus rested on quantitatively assessing the empirical association between tourism demand and ERB. Consequently, this study did not fully address the underlying social and behavioral mechanisms. Subsequent research could pursue more micro-level explanations by considering elements such as residents’ perceptions, community norms, and environmental governance systems—and could disentangle the multiple pandemic-related pathways bundled within the COVID-19 period dummy, which the present model cannot separately identify.
Funding
This research received no external funding.
Institutional Review Board Statement
Not applicable.
Informed Consent Statement
Not applicable.
Data Availability Statement
The sources of data used in this study are listed in the text.
Conflicts of Interest
The author declares no conflicts of interest.
References
- Wijesekara, C.; Tittagalla, C.; Jayathilaka, A.; Ilukpotha, U.; Jayathilaka, R.; Jayasinghe, P. Tourism and economic growth: A global study on Granger causality and wavelet coherence. PLoS ONE 2022, 17, e0274386. [Google Scholar] [CrossRef] [Scilit] [PubMed]
- Baloch, Q.B.; Shah, S.N.; Iqbal, N.; Sheeraz, M.; Asadullah, M.; Mahar, S.; Khan, A.U. Impact of tourism development upon environmental sustainability: A suggested framework for sustainable ecotourism. Environ. Sci. Pollut. Res. 2023, 30, 5917–5930. [Google Scholar] [CrossRef] [Scilit]
- Alam, M.S.; Paramati, S.R. The impact of tourism on income inequality in developing economies: Does Kuznets curve hypothesis exist? Ann. Tour. Res. 2016, 61, 111–126. [Google Scholar] [CrossRef] [Scilit]
- Mihalic, T.; Kuščer, K. Can overtourism be managed? Destination management factors affecting residents’ irritation and quality of life. Tour. Rev. 2022, 77, 16–34. [Google Scholar] [CrossRef] [Scilit]
- Bashir, S.; Goswami, S. Tourism induced challenges in municipal solid waste management in hill towns: Case of Pahalgam. Procedia Environ. Sci. 2016, 35, 77–89. [Google Scholar] [CrossRef] [Scilit]
- Türker, N.; Koçoğlu, C.M.; Saraç, Ö. Effect of overtourism on residents’ quality of life in World Heritage cities. J. New Tour. Trends 2024, 5, 1–16. [Google Scholar] [CrossRef] [Scilit]
- Xu, S.; Hu, Y. How do residents respond to negative environmental impacts from tourism? The role of community participation in empowering residents’ environmentally responsible behavior. Int. J. Tour. Res. 2021, 23, 1099–1111. [Google Scholar] [CrossRef] [Scilit]
- Keizer, K.; Lindenberg, S.; Steg, L. The spreading of disorder. Science 2008, 322, 1681–1685. [Google Scholar] [CrossRef] [Scilit] [PubMed]
- Sun, Y.Y.; Faturay, F.; Lenzen, M.; Gössling, S.; Higham, J. Drivers of global tourism carbon emissions. Nat. Commun. 2024, 15, 10384. [Google Scholar] [CrossRef] [Scilit] [PubMed]
- Martins, A.M.; Cró, S. The impact of tourism on solid waste generation and management cost in Madeira Island for the period 1996–2018. Sustainability 2021, 13, 5238. [Google Scholar] [CrossRef] [Scilit]
- Koens, K.; Postma, A.; Papp, B. Is overtourism overused? Understanding the impact of tourism in a city context. Sustainability 2018, 10, 4384. [Google Scholar] [CrossRef] [Scilit]
- Nofre, J. The touristification of nightlife: Some theoretical notes. Urban Geogr. 2021, 42, 1552–1561. [Google Scholar]
- González-Reverté, F. The perception of overtourism in urban destinations. Empirical evidence based on residents’ emotional response. Tour. Plan. Dev. 2022, 19, 451–477. [Google Scholar]
- Linderová, I.; Scholz, P.; Almeida, N. Attitudes of local population towards the impacts of tourism development: Evidence from Czechia. Front. Psychol. 2021, 12, 684773. [Google Scholar] [CrossRef] [Scilit] [PubMed]
- Duignan, M.B.; Everett, S.; McCabe, S. Events as catalysts for communal resistance to overtourism. Ann. Tour. Res. 2022, 96, 103438. [Google Scholar] [CrossRef] [Scilit]
- Su, L.; Huang, S.; Pearce, J. How does destination social responsibility contribute to environmentally responsible behaviour? A destination resident perspective. J. Bus. Res. 2018, 86, 179–189. [Google Scholar] [CrossRef] [Scilit]
- Huo, X.; Zou, X.; Zhang, Y.; Ma, R. Driving factors of pro-environmental behavior among rural tourism destination residents—Considering the moderating effect of environmental policies. Sci. Rep. 2025, 15, 7663. [Google Scholar] [PubMed]
- Briassoulis, H. Sustainable tourism and the question of the commons. Ann. Tour. Res. 2002, 29, 1065–1085. [Google Scholar] [CrossRef] [Scilit]
- Park, H.; Kovacs, J.F. Arts-led revitalization, overtourism and community responses: Ihwa Mural Village, Seoul. Tour. Manag. Perspect. 2020, 36, 100729. [Google Scholar] [CrossRef] [Scilit] [PubMed]
- Kim, S.; Kang, Y. Why do residents in an overtourism destination develop anti-tourist attitudes? An exploration of residents’ experience through the lens of the community-based tourism. Asia Pac. J. Tour. Res. 2020, 25, 858–876. [Google Scholar]
- Kwon, Y.; Kim, J.; Kim, J.; Park, C. Mitigating the impact of touristification on the psychological carrying capacity of residents. Sustainability 2021, 13, 2737. [Google Scholar] [CrossRef] [Scilit]
- Jang, H.; Park, M. Social media, media and urban transformation in the context of overtourism. Int. J. Tour. Cities 2020, 6, 233–260. [Google Scholar] [CrossRef] [Scilit]
- Oh, Y. Insta-gaze: Aesthetic representation and contested transformation of Woljeong, South Korea. Tour. Geogr. 2022, 24, 1040–1060. [Google Scholar] [CrossRef] [Scilit]
- Yoon, T.K.; Myeong, J.Y.; Lee, Y.; Choi, Y.E.; Lee, S.; Lee, S.; Byun, C. Are you okay with overtourism in forests? Path between crowding perception, satisfaction, and management action of trail visitors in South Korea. For. Policy Econ. 2024, 161, 103184. [Google Scholar] [CrossRef] [Scilit]
- Cai, L.; Xu, Y.; Yang, E. How does summer extreme weather affect regional variations in tourism demand? Tour. Geogr. 2026, 28, 383–404. [Google Scholar]
- Yang, E.; Kim, M.J.; Hall, C.M. Tourism challenges within a high cost of living crisis. Tour. Econ. 2025, 31, 951–957. [Google Scholar]
- Park, S.; Zhong, R.; Xu, Y. Understanding seasonal and diurnal variations of inter-city tourism destination network. J. Travel Tour. Mark. 2022, 39, 432–447. [Google Scholar] [CrossRef] [Scilit]
- Hong, S.; Kweon, I.; Lee, B.H.; Kim, H. Indicators and assessment system for sustainability of municipalities: A case study of South Korea’s assessment of sustainability of cities (ASC). Sustainability 2019, 11, 6611. [Google Scholar] [CrossRef] [Scilit]
- Bergantino, A.S.; Buongiorno, A.; Intini, M. Assessing the vulnerability of tourist destinations to overtourism: An empirical approach. Tour. Econ. 2026, 32, 489–496. [Google Scholar]
- Kim, S.; Kim, N. A social cost-benefit analysis of the vehicle restriction policy for reducing overtourism in Udo, Korea. Sustainability 2020, 12, 612. [Google Scholar] [CrossRef] [Scilit]
- Choi, J.O.; Hyun, S.S. Chaos theory perspective on tourism crisis management: A case study of the COVID-19 pandemic in South Korea. Int. J. Tour. Res. 2024, 26, e2713. [Google Scholar]
- Lança, M.; Silva, J.A.; Andraz, J.; Nunes, R.; Pereira, L.N. The moderating role of tourism intensity on residents’ intentions towards pro-tourism behaviours. J. Sustain. Tour. 2025, 33, 822–839. [Google Scholar] [CrossRef] [Scilit]
- Rasoolimanesh, S.M.; Roldán, J.L.; Jaafar, M.; Ramayah, T. Factors influencing residents’ perceptions toward tourism development: Differences across rural and urban World Heritage sites. J. Travel Res. 2017, 56, 760–775. [Google Scholar]
- Rijal, S.; Huang, Y.H.; Lin, H.Y. An integrated approach to municipal solid waste recycling performance evaluation by incorporating local demographic features. Sustainability 2021, 13, 10446. [Google Scholar] [CrossRef] [Scilit]
- Chang, I.; Choi, Y.Y.; Park, S.K.; Kim, B.H.S. Regional demographic changes and financial independence of local governments in Korea. Asian J. Soc. Sci. 2023, 51, 188–197. [Google Scholar] [CrossRef] [Scilit]
- OECD. Adapting Regional Policy in Korea: Preparing Regions for Demographic Change; OECD Rural Studies; OECD Publishing: Paris, France, 2022. [Google Scholar]
- Lv, Z.; Xu, T. Tourism and environmental performance: New evidence using a threshold regression analysis. Tour. Econ. 2023, 29, 194–209. [Google Scholar]
- Goodwin, H. The Challenge of Overtourism; Responsible Tourism Partnership Working Paper No. 4; Responsible Tourism Partnership: Manchester, UK, 2017; pp. 1–19. [Google Scholar]
- Alonso-Almeida, M.D.M.; Borrajo-Millán, F.; Yi, L. Are social media data pushing overtourism? The case of Barcelona and Chinese tourists. Sustainability 2019, 11, 3356. [Google Scholar] [CrossRef] [Scilit]
- World Tourism Organization (UNWTO). ‘Overtourism’?—Understanding and Managing Urban Tourism Growth Beyond Perceptions, Executive Summary; UNWTO: Madrid, Spain, 2018. [Google Scholar]
- Capocchi, A.; Vallone, C.; Pierotti, M.; Amaduzzi, A. Overtourism: A literature review to assess implications and future perspectives. Sustainability 2019, 11, 3303. [Google Scholar] [CrossRef] [Scilit]
- Gössling, S.; McCabe, S.; Chen, N.C. A socio-psychological conceptualisation of overtourism. Ann. Tour. Res. 2020, 84, 102976. [Google Scholar] [CrossRef] [Scilit] [PubMed]
- Russo, A.P. The “vicious circle” of tourism development in heritage cities. Ann. Tour. Res. 2002, 29, 165–182. [Google Scholar] [CrossRef] [Scilit]
- Mihalic, T. Conceptualising overtourism: A sustainability approach. Ann. Tour. Res. 2020, 84, 103025. [Google Scholar] [CrossRef] [Scilit]
- Suh, H.; Park, C.; No, W.; Kim, J.; Lee, G.; Jeong, Y.; Kim, Y. Where might tourism-residence conflict emerge? A spatial-analysis-based research framework for overtourism management. Tour. Geogr. 2025, 27, 1736–1764. [Google Scholar]
- Kim, H.; Kim, Y.G.; Woo, E. Examining the impacts of touristification on quality of life (QOL): The application of the bottom-up spillover theory. Serv. Ind. J. 2020, 41, 787–802. [Google Scholar] [CrossRef] [Scilit]
- Fang, Y.; Huang, J.; Huang, Z.; Li, Y. Tourism economic resilience and its influence factors in China’s three major urban agglomerations based on threshold effect. Humanit. Soc. Sci. Commun. 2025, 12, 615. [Google Scholar] [CrossRef] [Scilit]
- Su, L.; Swanson, S.R. The effect of destination social responsibility on tourist environmentally responsible behavior: Compared analysis of first-time and repeat tourists. Tour. Manag. 2017, 60, 308–321. [Google Scholar] [CrossRef] [Scilit]
- Stern, P.C. New environmental theories: Toward a coherent theory of environmentally significant behavior. J. Soc. Issues 2000, 56, 407–424. [Google Scholar] [CrossRef] [Scilit]
- Nguyen, A.T.; Nguyen, N.; Phung, P.; Yến-Khanh, N. Residents’ waste management practices in a developing country: A social practice theory analysis. Environ. Chall. 2023, 13, 100770. [Google Scholar] [CrossRef] [Scilit]
- Raymond, C.M.; Fazey, I.; Reed, M.S.; Stringer, L.C.; Robinson, G.M.; Evely, A.C. Integrating local and scientific knowledge for environmental management. J. Environ. Manag. 2010, 91, 1766–1777. [Google Scholar] [CrossRef] [Scilit]
- Gómez-Baggethun, E.; Mingorría, S.; Reyes-García, V.; Calvet, L.; Montes, C. Traditional ecological knowledge trends in the transition to a market economy: Empirical study in the Doñana natural areas. Conserv. Biol. 2010, 24, 721–729. [Google Scholar] [CrossRef] [Scilit] [PubMed]
- Li, J.; Lee, T.J.; Chen, N.; Park, K.S. Pro-environmental behaviour of the residents in sensitive tourism destinations. J. Vacat. Mark. 2023, 29, 291–308. [Google Scholar]
- Van Vugt, M. Averting the tragedy of the commons: Using social psychological science to protect the environment. Curr. Dir. Psychol. Sci. 2009, 18, 169–173. [Google Scholar]
- Han, H. Consumer behavior and environmental sustainability in tourism and hospitality: A review of theories, concepts, and latest research. J. Sustain. Tour. 2021, 29, 1021–1042. [Google Scholar] [CrossRef] [Scilit]
- McCool, S.F.; Lime, D.W. Tourism carrying capacity: Tempting fantasy or useful reality? J. Sustain. Tour. 2001, 9, 372–388. [Google Scholar]
- Bertocchi, D.; Camatti, N.; Salmasi, L.; van der Borg, J. Assessing the tourism sustainability of EU regions at the NUTS-2 level with a composite and regionalised indicator. J. Sustain. Tour. 2023, 31, 1738–1755. [Google Scholar]
- Lee, S.; Im, J.; Cho, K. Understanding spatial inequalities and stratification in transportation accessibility to social infrastructures in South Korea: Multi-dimensional planning insights. Sci. Rep. 2024, 14, 18445. [Google Scholar] [CrossRef] [Scilit] [PubMed]
- Lee, K.S.; Eom, J.K. Spatiotemporal dynamics of visitors to Jeju Island: Hotspot and spatial autocorrelation analyses using mobile phone data. PLoS ONE 2025, 20, e0321694. [Google Scholar] [CrossRef] [Scilit] [PubMed]
- Kim, H.; Sultana, S. The impacts of high-speed rail extensions on accessibility and spatial equity changes in South Korea from 2004 to 2018. J. Transp. Geogr. 2015, 45, 48–61. [Google Scholar] [CrossRef] [Scilit]
- Han, S. Spatial stratification and socio-spatial inequalities: The case of Seoul and Busan in South Korea. Humanit. Soc. Sci. Commun. 2022, 9, 23. [Google Scholar] [CrossRef] [Scilit]
- Torres-Díaz, V.; del Río-Rama, M.d.l.C.; Álvarez-García, J.; Simonetti, B. Environmental sustainability and tourism growth: Convergence or compensation? Qual. Quant. 2025, 59, 2129–2152. [Google Scholar]
- Liao, Z.; Zhang, L.; Wang, X.; Liang, S. Structural characteristics and influencing factors of a spatial correlation network for tourism environmental efficiency in China. Sci. Rep. 2024, 14, 2658. [Google Scholar] [CrossRef] [Scilit] [PubMed]
- Park, J.; Kim, D. Regional economic resilience and long-term employment growth: Decomposing structural transitions in South Korean metropolitan areas. Ann. Reg. Sci. 2025, 74, 54. [Google Scholar] [CrossRef] [Scilit]
- Wooldridge, J.M. Econometric Analysis of Cross Section and Panel Data, 2nd ed.; MIT Press: Cambridge, MA, USA, 2010. [Google Scholar]
- Plümper, T.; Troeger, V.E. Efficient estimation of time-invariant and rarely changing variables in finite sample panel analyses with unit fixed effects. Polit. Anal. 2007, 15, 124–139. [Google Scholar] [CrossRef] [Scilit]
- Ni, X.; Liu, Y.; Zhao, H. Impact of tourism intensity on destination economic resilience: Quasi-natural experiments based on double machine learning. Tour. Manag. 2026, 113, 105353. [Google Scholar]
- OECD. Perspectives on Decentralisation and Rural-Urban Linkages in Korea; OECD Rural Studies; OECD Publishing: Paris, France, 2021. [Google Scholar]
- Kang, S.; Lee, G.; Kim, J.; Park, D. Identifying the spatial structure of the tourist attraction system in South Korea using GIS and network analysis: An application of anchor-point theory. J. Destin. Mark. Manag. 2018, 9, 358–370. [Google Scholar] [CrossRef] [Scilit]
- Liu, J.; Chen, J.M.; Nijkamp, P.; Petrick, J.F. Threshold effect of tourism density on urban livability: A modeling study on Chinese cities. Ann. Reg. Sci. 2023, 70, 315–331. [Google Scholar]
- Tokarchuk, O.; Gabriele, R.; Maurer, O. Estimating tourism social carrying capacity. Ann. Tour. Res. 2021, 86, 102971. [Google Scholar] [CrossRef] [Scilit]
- Hondroyiannis, G.; Sardianou, E.; Nikou, V.; Evangelinos, K.; Nikolaou, I. Recycling rate performance and socioeconomic determinants: Evidence from aggregate and regional data across European Union countries. J. Clean. Prod. 2024, 434, 139877. [Google Scholar]
- Hondroyiannis, G.; Sardianou, E.; Nikou, V.; Evangelinos, K.; Nikolaou, I. Waste generation and macroeconomic drivers: A panel study for European countries and regions. Manag. Environ. Qual. 2024, 35, 1118–1136. [Google Scholar] [CrossRef] [Scilit]
- Confente, I.; Scarpi, D. Achieving environmentally responsible behavior for tourists and residents: A norm activation theory perspective. J. Travel Res. 2021, 60, 1196–1212. [Google Scholar]
- Ribeiro, M.A.; Woosnam, K.M.; Pinto, P.; Silva, J.A. Tourists’ destination loyalty through emotional solidarity with residents: An integrative moderated mediation model. J. Travel Res. 2018, 57, 279–295. [Google Scholar]
- Gössling, S.; Scott, D.; Hall, C.M. Pandemics, tourism and global change: A rapid assessment of COVID-19. J. Sustain. Tour. 2021, 29, 1–20. [Google Scholar]
- Kavaratzis, M. Place branding: A review of trends and conceptual models. Mark. Rev. 2005, 5, 329–342. [Google Scholar] [CrossRef] [Scilit]
- García-Buades, M.E.; García-Sastre, M.A.; Alemany-Hormaeche, M. Effects of overtourism, local government, and tourist behavior on residents’ perceptions in Alcúdia (Majorca, Spain). J. Outdoor Recreat. Tour. 2022, 39, 100499. [Google Scholar] [CrossRef] [Scilit]
- Choi, N. Analyzing local government capacity and performance: Implications for sustainable development. Sustainability 2021, 13, 3862. [Google Scholar] [CrossRef] [Scilit]
- Ezeudu, O.B.; Bristow, D. Financing methods for solid waste management: A review of typology, classifications, and circular economy implications. Sustain. Dev. 2025, 33, 3062–3085. [Google Scholar]
- Valente, M. Policy evaluation of waste pricing programs using heterogeneous causal effect estimation. J. Environ. Econ. Manag. 2023, 117, 102755. [Google Scholar]
- Arbulú, I.; Rey-Maquieira, J.; Sastre, F. The impact of tourism and seasonality on different types of municipal solid waste (MSW) generation: The case of Ibiza. Heliyon 2024, 10, e33894. [Google Scholar] [CrossRef] [Scilit] [PubMed]
- de la Calle-Vaquero, M.; García-Hernández, M.; Mendoza de Miguel, S. Urban planning regulations for tourism in the context of overtourism. Applications in historic centres. Sustainability 2021, 13, 70. [Google Scholar]
- Kim, H.; Kim, E.J. Tourism as a key for regional revitalization? A quantitative evaluation of tourism zone development in Japan. Sustainability 2021, 13, 7478. [Google Scholar] [CrossRef] [Scilit]
- Diaz-Farina, E.; Díaz-Hernández, J.J.; Padrón-Fumero, N. Analysis of hospitality waste generation: Impacts of services and mitigation strategies. Ann. Tour. Res. Empir. Insights 2023, 4, 100083. [Google Scholar]
- Yousefi, M.; Oskoei, V.; Jonidi Jafari, A.; Farzadkia, M.; Hasham Firooz, M.; Abdollahinejad, B.; Torkashvand, J. Municipal solid waste management during COVID-19 pandemic: Effects and repercussions. Environ. Sci. Pollut. Res. 2021, 28, 32200–32209. [Google Scholar] [CrossRef] [Scilit]
- Škare, M.; Soriano, D.R.; Porada-Rochoń, M. Impact of COVID-19 on the travel and tourism industry. Technol. Forecast. Soc. Change 2021, 163, 120469. [Google Scholar] [PubMed]
- Park, S. Factors influencing the recycling rate under the volume-based waste fee system in South Korea. Waste Manag. 2018, 74, 43–51. [Google Scholar] [CrossRef] [Scilit] [PubMed]
- Argentiero, A.; Chiarini, B.; Marzano, E. Do social capital and the quality of institutions affect waste recycling? Waste Manag. 2023, 155, 240–251. [Google Scholar] [PubMed]
- Huffman, A.H.; Van Der Werff, B.R.; Henning, J.B.; Watrous-Rodriguez, K. When do recycling attitudes predict recycling? An investigation of self-reported versus observed behavior. J. Environ. Psychol. 2014, 38, 262–270. [Google Scholar] [CrossRef] [Scilit]
- Andrews, A.; Gregoire, M.; Rasmussen, H.; Witowich, G. Comparison of recycling outcomes in three types of recycling collection units. Waste Manag. 2013, 33, 530–535. [Google Scholar] [CrossRef] [Scilit] [PubMed]
- Starr, J.; Nicolson, C. Patterns in trash: Factors driving municipal recycling in Massachusetts. Resour. Conserv. Recycl. 2015, 99, 7–18. [Google Scholar] [CrossRef] [Scilit]
- Soukiazis, E.; Proença, S. The determinants of waste generation and recycling performance across the Portuguese municipalities—A simultaneous equation approach. Waste Manag. 2020, 114, 321–330. [Google Scholar] [PubMed]
- Park, S.; Lah, T.J. Analyzing the success of the volume-based waste fee system in South Korea. Waste Manag. 2015, 43, 533–538. [Google Scholar] [CrossRef] [Scilit] [PubMed]
- Lee, S.; Paik, H.S. Korean household waste management and recycling behavior. Build. Environ. 2011, 46, 1159–1166. [Google Scholar] [CrossRef] [Scilit]
- Kim, G.-S.; Chang, Y.-J.; Kelleher, D. Unit pricing of municipal solid waste and illegal dumping: An empirical analysis of Korean experience. Environ. Econ. Policy Stud. 2008, 9, 167–176. [Google Scholar] [CrossRef] [Scilit]
- Kim, S. Antecedents of compliance intention and its impact on waste separation behavior: Based on rational choice theory and deterrence theory. Behav. Sci. 2023, 13, 424. [Google Scholar] [CrossRef] [Scilit] [PubMed]
- Baltagi, B.H. Econometric Analysis of Panel Data, 4th ed.; John Wiley & Sons: Chichester, UK, 2008. [Google Scholar]
- Mateu-Sbert, J.; Ricci-Cabello, I.; Villalonga-Olives, E.; Cabeza-Irigoyen, E. The impact of tourism on municipal solid waste generation: The case of Menorca Island (Spain). Waste Manag. 2013, 33, 2589–2593. [Google Scholar] [CrossRef] [Scilit] [PubMed]
- Diaz-Farina, E.; Díaz-Hernández, J.J.; Padrón-Fumero, N. The contribution of tourism to municipal solid waste generation: A mixed demand-supply approach on the island of Tenerife. Waste Manag. 2020, 102, 587–597. [Google Scholar] [CrossRef] [Scilit] [PubMed]
- Zeng, Y.; Filimonau, V.; Wang, L.; Zhong, L. The impact of tourism on municipal solid waste generation in China. J. Clean. Prod. 2023, 427, 139255. [Google Scholar] [CrossRef] [Scilit]
- Agamuthu, P.; Hotta, Y. Indicators as a tool to evaluate waste management efficiency. Waste Manag. Res. 2014, 32, 1147–1148. [Google Scholar] [CrossRef] [Scilit] [PubMed]
- Van Houtven, G.L.; Morris, G.E. Household behavior under alternative pay-as-you-throw systems for solid waste disposal. Land Econ. 1999, 75, 515–537. [Google Scholar]
- Jenkins, R.R.; Martinez, S.A.; Palmer, K.; Podolsky, M.J. The determinants of household recycling: A material-specific analysis of recycling program features and unit pricing. J. Environ. Econ. Manag. 2003, 45, 294–318. [Google Scholar] [CrossRef] [Scilit]
- Kronmal, R.A. Spurious correlation and the fallacy of the ratio standard revisited. J. R. Stat. Soc. Ser. A 1993, 156, 379–392. [Google Scholar] [CrossRef] [Scilit]
- Firebaugh, G.; Gibbs, J.P. User’s guide to ratio variables. Am. Sociol. Rev. 1985, 50, 713–722. [Google Scholar]
- Papke, L.E.; Wooldridge, J.M. Econometric methods for fractional response variables with an application to 401(k) plan participation rates. J. Appl. Econom. 1996, 11, 619–632. [Google Scholar] [CrossRef] [Scilit]
- Aiken, L.S.; West, S.G.; Reno, R.R. Multiple Regression: Testing and Interpreting Interactions; Sage Publications: Newbury Park, CA, USA, 1991. [Google Scholar]
- Egger, P.; Winner, H. How corruption influences foreign direct investment: A panel data study. Econ. Dev. Cult. Change 2006, 54, 459–486. [Google Scholar] [CrossRef] [Scilit]
- McCulloch, C.E.; Searle, S.R.; Neuhaus, J.M. Generalized, Linear, and Mixed Models, 2nd ed.; John Wiley & Sons: Hoboken, NJ, USA, 2008. [Google Scholar]
- Ernst, H. Patent applications and subsequent changes of performance: Evidence from time-series cross-section analyses on the firm level. Res. Policy 2001, 30, 143–157. [Google Scholar]
- O’Brien, R.M. A caution regarding rules of thumb for variance inflation factors. Qual. Quant. 2007, 41, 673–690. [Google Scholar] [CrossRef] [Scilit]
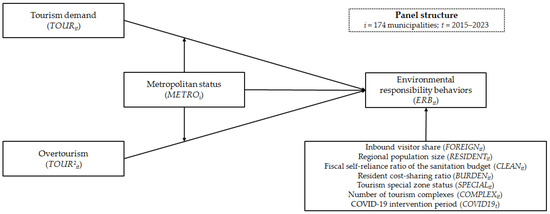
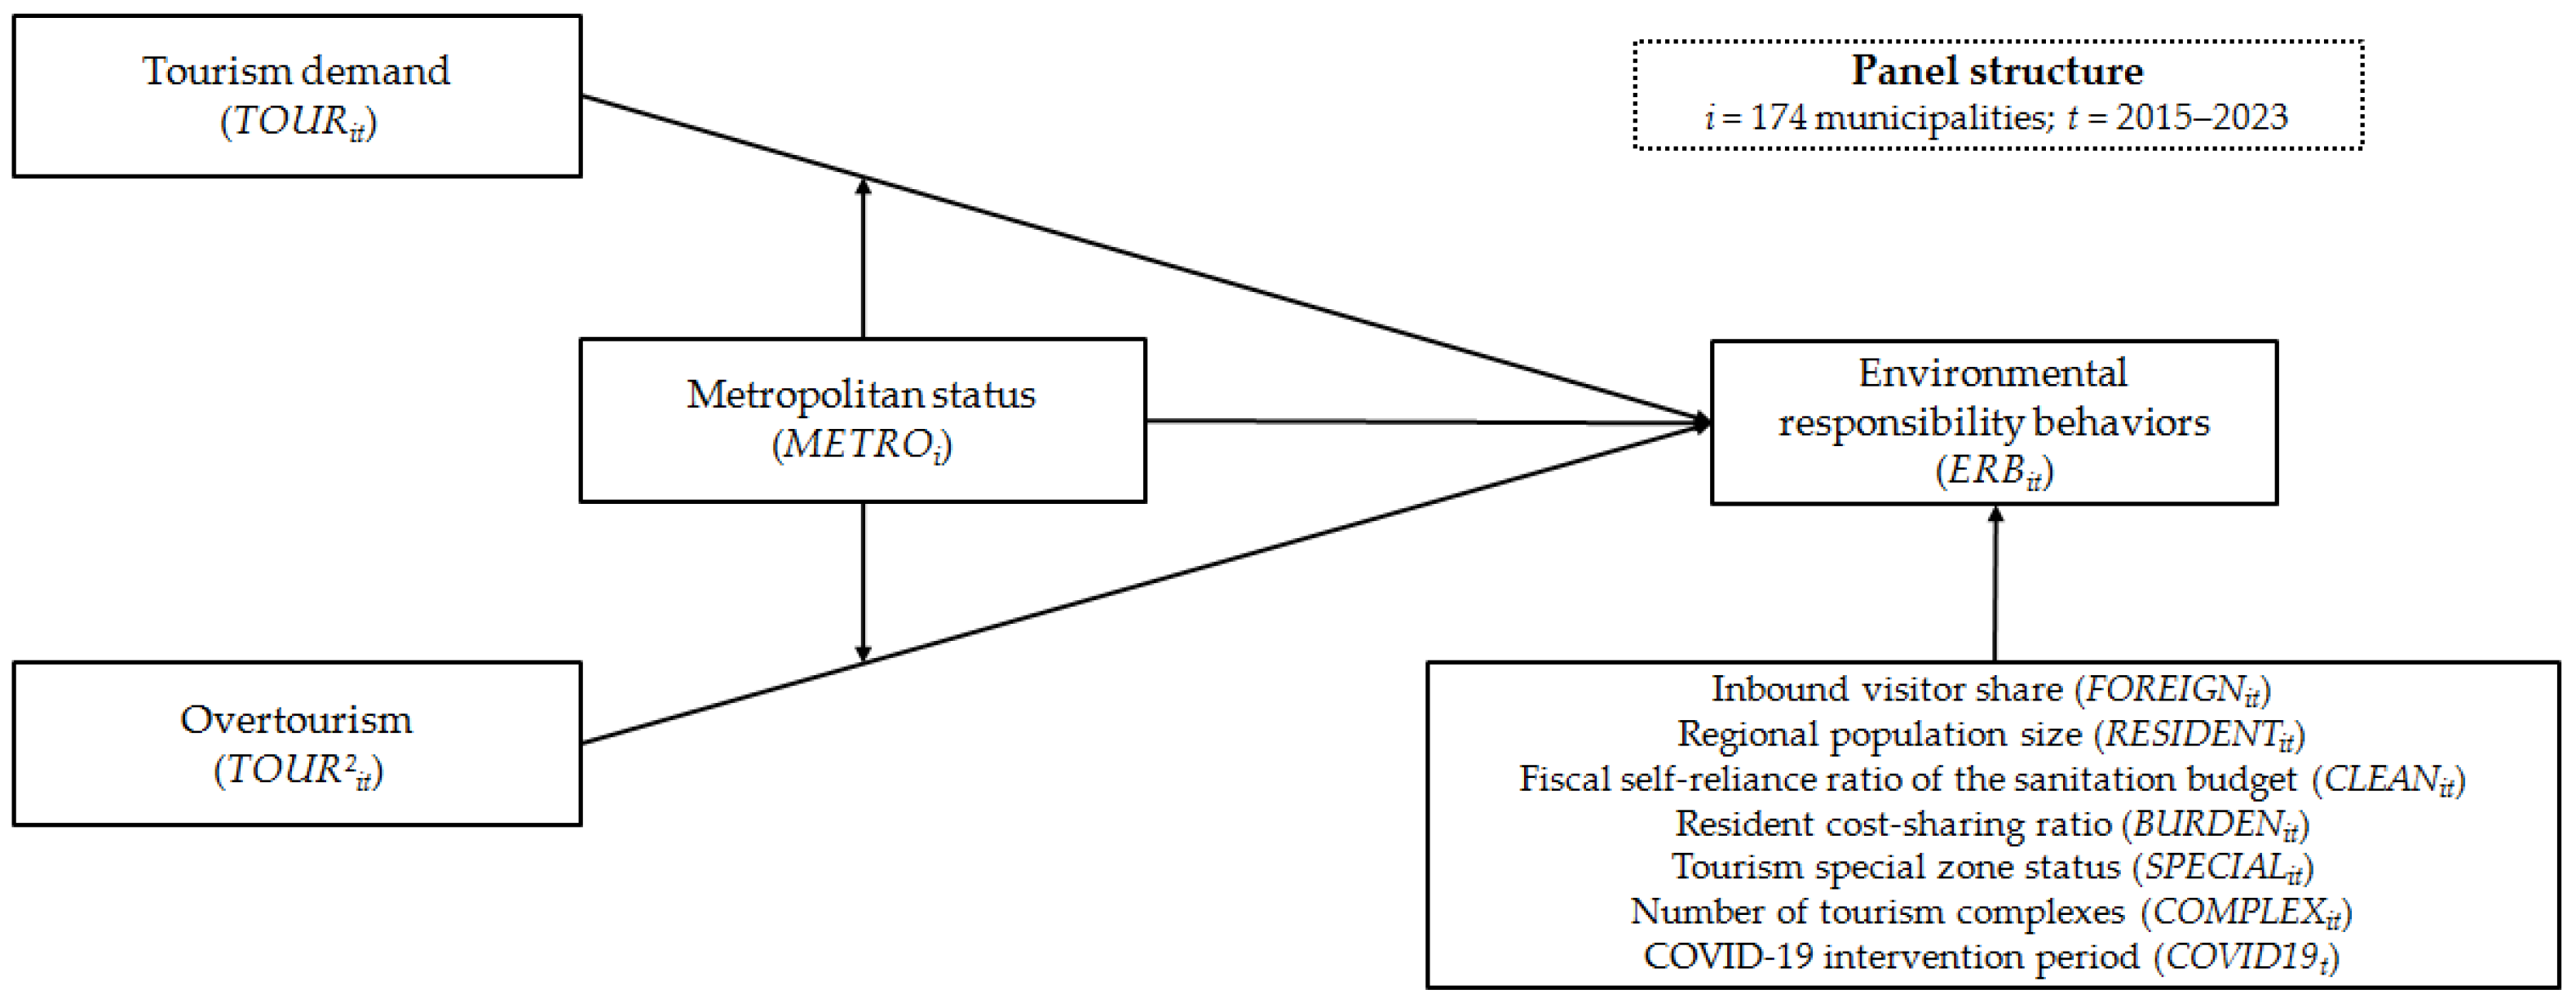
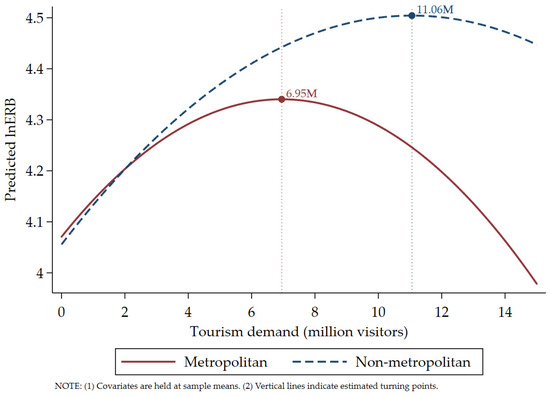
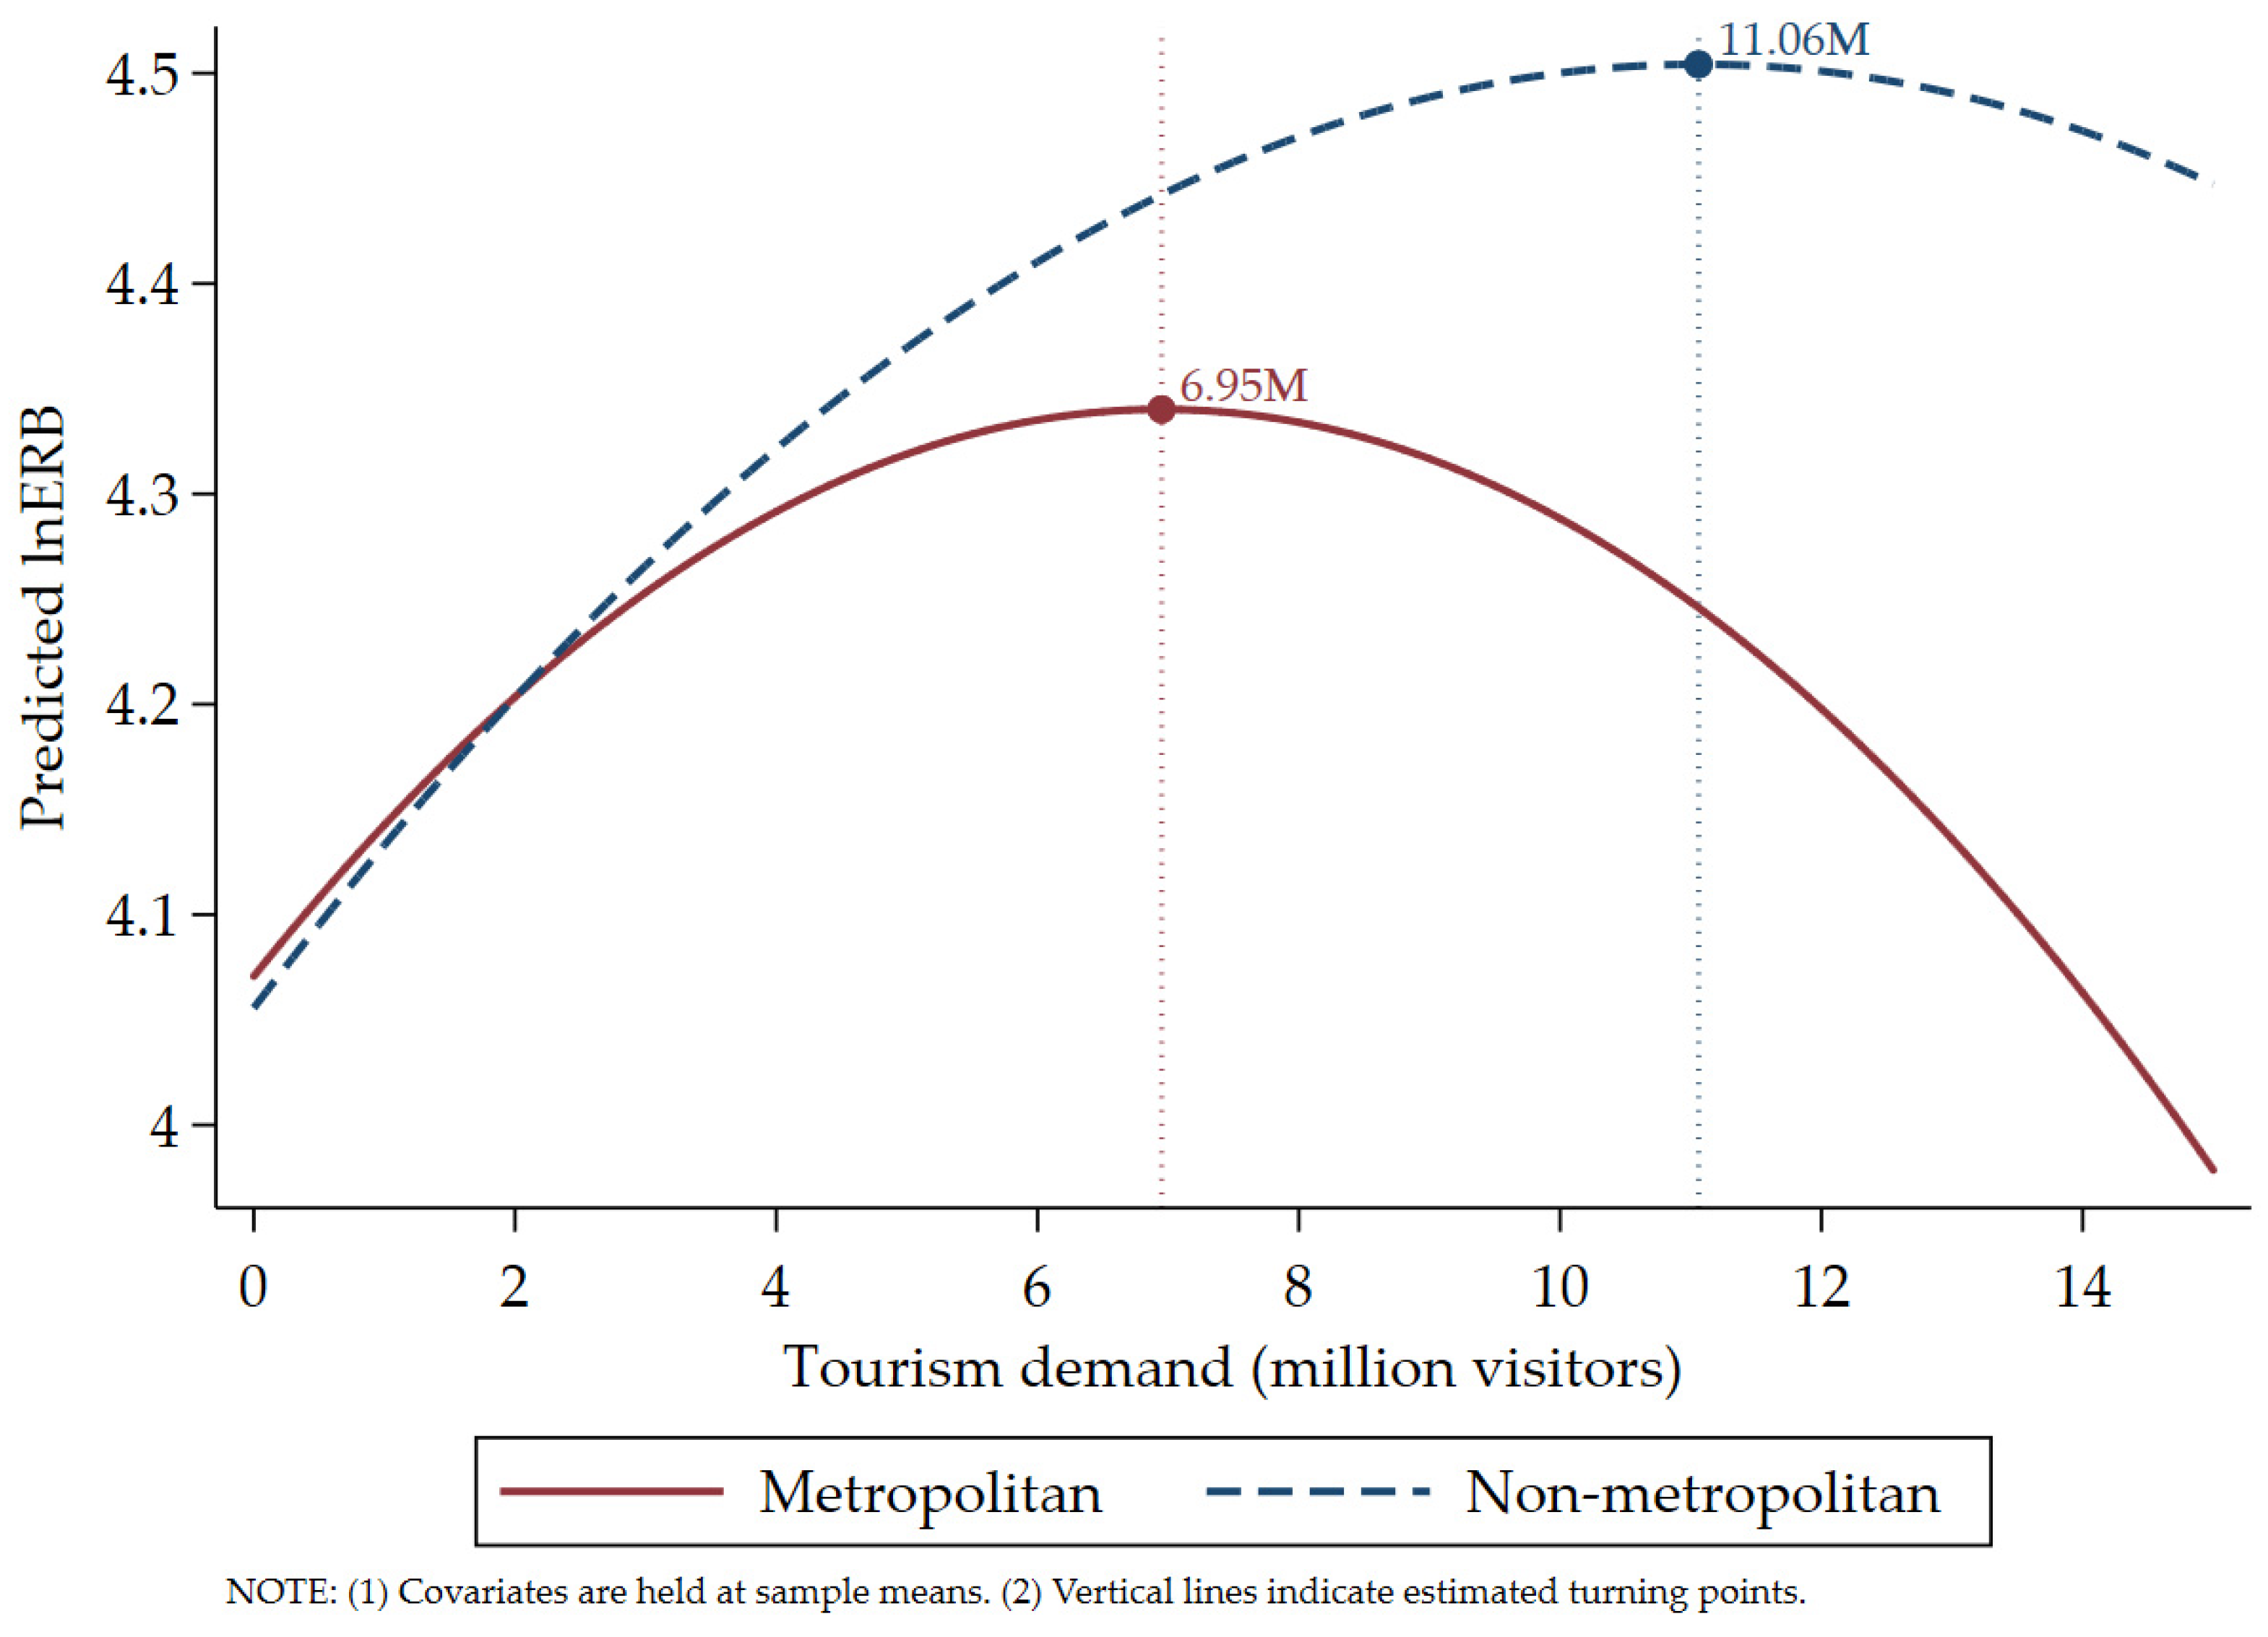

Disclaimer/Publisher’s Note: The statements, opinions and data contained in all publications are solely those of the individual author(s) and contributor(s) and not of MDPI and/or the editor(s). MDPI and/or the editor(s) disclaim responsibility for any injury to people or property resulting from any ideas, methods, instructions or products referred to in the content. |
© 2026 by the author. Licensee MDPI, Basel, Switzerland. This article is an open access article distributed under the terms and conditions of the Creative Commons Attribution (CC BY) license.