


Abstract
High-spatial-resolution soil data collected on behalf of the private sector (e.g., farmers) represents a largely untapped resource for EU soil monitoring initiatives. Georeferenced soil samples also raise privacy issues since sampling locations can be linked to individual farm parcels and their respective activities. This work presents a Privacy-Preserving Digital Soil Mapping Framework (PP-DSM) that enables integration of private georeferenced soil datasets while releasing only aggregated spatial outputs, minimising risks of individual farm identification. The framework consists of three components: a secure soil data processing environment that keeps private point data under institutional control, a Quantile Regression Forest (QRF) engine that produces spatially explicit predictions and uncertainty estimates, and spatial aggregation of raster outputs to the EU LUCAS 2 × 2 km monitoring grid, releasing only anonymised polygon-level statistics based on polygons centred on the grid points. This methodology is demonstrated using a case study of a published georeferenced soil dataset of organic carbon (403 topsoil samples) from the Kastoria region, Northern Greece. Aggregated predictions preserved regional soil patterns while eliminating farm-level identifiability. Across six independently validated LUCAS polygons, QRF polygon statistics differed from independent test set means by an average difference of 0.070% SOC, consistent with the expected spatial smoothing. This study suggests that privately held soil datasets can support EU monitoring infrastructures within the existing regulatory environment, contributing to Soil Monitoring Law objectives and Carbon Removals and Carbon Farming initiatives.
1. Introduction
The General Data Protection Regulation (GDPR) [1] was adopted on 14 April 2016 and put into effect on 25 May 2018 by the European Union (EU). This regulation imposes obligations on organisations anywhere in the world, so long as they process personal data relating to individuals in the EU. Among the many data types processed under these rules, environmental data are also included whenever they are linked to identifiable natural persons, and soil data are of particular relevance in this context. A key feature of many soil datasets is that they contain geospatial information, which can be combined with land use or parcel-level data to identify landowners, farmers, or other individuals and their activities. For this reason, point soil data with known coordinates or high-resolution soil geodatabases may be considered to contain or reveal personal data and are therefore subject to GDPR requirements on lawfulness, purpose limitation, data minimisation, and safeguards, which can constrain their collection, sharing, and reuse, including for public interest monitoring. These constraints raise significant challenges in monitoring the implementation of all the EU strategic plans associated with soil, such as the European Green Deal [2], the Carbon Removals and Carbon Farming (CRCF) [3], the Farm to Fork [4], the Soil Strategy 2030 [5] initiatives and of course the Common Agricultural Policy (CAP) [6] because the robust monitoring of these frameworks increasingly requires soil data at farm level.
Another issue is that the soil data per se can be classified as “public” or “private” property depending on the funding source. “Public” soil data typically result from EU or state-funded soil surveys, whereas “private” soil data arise from analyses commissioned and paid for by private actors. The annual volume of private soil data in EU per year is presumed to be even two orders of magnitude larger than the public ones (see Section 2.1 for this estimation), yet there is not an official instrument to control who paid the soil analysis service, for what reason, who produced the data and how, how the data were handled and by who after the provision of the service.
Private soil data is of great importance since they are used (a) by farmers to control the land suitability to establish new crops and for precision farming purposes (e.g., fertilisation), (b) by companies to control their environmental impact, (c) by construction companies to evaluate the soil as a physical platform for infrastructures, etc. These uses address fundamental issues related to land viability and profitability and are therefore fully aligned with the objectives of EU initiatives. Moreover, private soil data could be used (a) to significantly reduce the cost and time of public-funded soil surveys by providing much larger datasets and (b) to support EU initiatives such as the Regulation 2021/2115 Article 15-4(g) [6] for the use of Farm Sustainability Tools for Nutrients by farm advisors. Nevertheless, these datasets remain largely disconnected from public monitoring infrastructures. Therefore, the problem is not data scarcity but a lack of technical frameworks that enable the safe integration of private high-spatial-resolution soil data (HSRSD) into monitoring systems while ensuring that individual farms or other types of private lands cannot be identified. A framework for reusing private HSRSD must incorporate mechanisms that prevent disclosure while preserving the spatial information content needed for regional monitoring, control, and targeted intervention (e.g., in cases of locally identified pollution).
Even though the Water Framework Directive (WFD) [7] and Air Quality Directive (AQD) [8] established legally binding monitoring obligations decades ago for water and air, respectively, no equivalent instrument for soil existed until the adoption of the new Soil Monitoring Law (SML) [9]. The EU Soil Strategy 2030 and the SML establish a harmonised framework for soil health assessment across the EU. The SML organises monitoring through soil districts and soil units that are spatial units defined by soil, climate, and land use/cover type, which typically consist of multiple farm holdings. Soil health data are reported publicly at the soil unit level, and the SML explicitly prohibits assessment outputs from being traced back to individual land parcels. Even though the required monitoring output scale by EU (soil district/unit) is considerably broader than the individual parcel, the high-resolution soil measurements at farm scale remain indispensable for properly characterising the conditions within soil units.
A brief reading of the recent literature suggests that soil data protection is usually treated as a special case of geospatial-data privacy. A practical starting point is not anonymization alone, but governed data-sharing frameworks. For example, public–private soil data sharing models emphasise controlled exchange among industry, government, and other actors, balancing access with stewardship and trust [10]. For anonymization, the strongest directly relevant evidence comes from geodata privacy research. A recent survey by Lorestani et al. [11] reviews geomasking techniques and develops a taxonomy of methods for reducing privacy risk in geographic/soil data when sampling locations can reveal landowners, farms, or sensitive sites. More specifically, differential privacy has been proposed for location privacy protection, offering a formal way to perturb spatial information while retaining analytical utility [12]. In parallel, privacy-preserving computation such as private geo-distance evaluation can support location-based analysis without directly exposing exact coordinates [13]. An alternative to releasing detailed raw soil data is to share derived products. Reviews of AI for soil health show that machine learning can generate soil property predictions, pedotransfer functions, and assessment tools, and may thereby reduce the need to distribute full sensitive datasets [14]. Likewise, large-scale geospatial inference methods such as iSoLIM illustrate the feasibility of model-based soil mapping workflows that may substitute for open dissemination of point-level observations [15]. Overall, the literature suggests a hybrid strategy: governance for access control, geomasking or differential privacy for location protection, and AI/model-based outputs when raw soil records are too sensitive to share.
Following the aforementioned approaches, this study proposes a Privacy-Preserving Digital Soil Mapping Framework (PP-DSM) that addresses this challenge, based on three components. First, a secure soil data processing environment that keeps private point data under institutional control. Second, a Quantile Regression Forest (QRF) engine that generates location-specific predictions and uncertainty estimates of soil parameters. Third, a process where raster outputs of soil parameters are aggregated to the EU LUCAS 2 × 2 km monitoring grid, releasing only anonymised polygon-level statistics based on 2 × 2 km polygons with LUCAS points as centres. The framework operates within the existing EU regulatory environment and is compatible with the SML provisions on data reuse and monitoring infrastructure [9]. This approach facilitates the alignment of private soil data with EU monitoring efforts, supporting the targets set out by the SML and CRCF.
From a statistical perspective, the framework requires outputs that are both non-disclosive and informationally useful, which demands more than simple spatial averaging. This is achieved through QRF, a non-parametric ensemble method that estimates the full conditional distribution of the target variable at each prediction location. By computing the 15.9, 50, and 84.1 percentiles at every pixel, the framework produces not only a median prediction surface but also spatially variable uncertainty bounds, the 68.2% prediction interval width called Uindex, without imposing normality assumptions. When aggregated to the LUCAS polygon scale, this uncertainty information is propagated to the polygon scale: each polygon receives a central estimate alongside quantile-based bounds that reflect local training data density and covariate representativeness. Critically, because the released statistics derive from a smoothed prediction raster rather than raw sample values, the aggregation is not practically reversible. Therefore, no individual sample location or value can be reconstructed from the polygon outputs, providing a practical reduction in re-identification risk that complements the minimum-sample suppression rule described in Section 3.3.
The proposed framework is technically evaluated using a soil organic carbon (SOC) dataset from the Kastoria region in Northern Greece. This dataset was previously analysed for digital soil mapping purposes by Nikou and Tziachris [16] and is reused here exclusively as a demonstration dataset to evaluate the proposed privacy-preserving aggregation architecture. The scientific contribution of the present study is not the DSM modelling that has already been documented in the aforementioned publication. Instead, it is the privacy-preserving aggregation framework itself and its applied capacity to integrate private soil data into EU monitoring grids while ensuring that individual land parcels remain untraceable.
The specific objectives of this study are (a) to describe and formalise the components of the PP-DSM; (b) to demonstrate its implementation using the Kastoria case study dataset; (c) to evaluate the effect of spatial aggregation on prediction stability and uncertainty; and (d) to assess the suitability of aggregated LUCAS polygon statistics for EU soil monitoring applications.
2. Background
2.1. Soil Monitoring Infrastructure in the EU
The Land Use/Cover Area frame Survey (LUCAS) is the EU’s primary instrument for monitoring land use and land cover across the EU-27. The LUCAS Master Grid is a systematic tessellation of approximately one million georeferenced points spaced at 2 km intervals, covering all EU-27 territory [17]. The LUCAS-Soil module collects and analyses topsoil samples at selected LUCAS points for soil organic carbon, texture, pH, electrical conductivity, carbonates, and other properties [18]. The LUCAS-Soil database contains approximately 120,000 sampled points across the EU-27 based on four campaigns (2009/2012, 2015, 2018 and 2022), equivalent to roughly one sample per 30–40 km2 at EU scale in total. As a simplified approximation, this represents about one sample per 200–220 km2 per campaign every 3–4 years, though the actual number of samples per campaign varies: about 22,000 in 2009/2012 combined, about 22,000 in 2015, about 19,000 in 2018, and around 40,000 in 2022.
The SML mandates that Member States establish national soil monitoring systems covering their entire territory and organised into soil districts, each assessed against harmonised soil health descriptors [9]. Within each soil district, soil health is monitored at the soil unit level, that is, a spatial unit defined by combinations of soil type, climate zone, and land use category, and results are made publicly available at that scale. Although soil units are larger spatial entities than individual agricultural parcels, their accurate characterisation requires a dense network of field-scale measurements. This creates a data demand that current EU public monitoring infrastructure cannot fully meet: the LUCAS-Soil density is far too coarse to characterise soil unit-level variation reliably, and achieving adequate spatial coverage through new public sampling alone would be prohibitively expensive. A solution to this problem is the inclusion of private soil data into monitoring systems, which correspond to more than one million samples per year [19]. This private data reservoir represents a resource that could improve the spatial resolution of EU soil monitoring if suitable technical methodologies for its integration can be developed and properly implemented to address GDPR issues.
The LUCAS 2 × 2 km polygon grid is a legally neutral, Europe-wide spatial reference system with no direct correspondence to individual cadastral boundaries in any EU jurisdiction [17]. That property makes LUCAS polygons a natural aggregation unit for privacy-preserving soil statistics. Importantly, the LUCAS polygon scale is also compatible with the SML’s soil unit monitoring architecture: soil units, as defined by the SML, typically span areas of tens to hundreds of hectares and are thus comparable to or larger than the LUCAS 2 × 2 km polygon (~400 ha). Aggregation of private soil data to this scale is therefore consistent with SML’s own reporting unit.
2.2. Privacy Considerations in Georeferenced Soil Datasets
Georeferenced soil sampling coordinates are not merely environmental measurements. When sampled from agricultural parcels or other types of private land, they can be spatially linked to cadastral boundaries, which in most EU Member States are associated with publicly accessible land registry information identifying individual landowners. This linkage means that point-format private soil data can be linked with personal data under applicable privacy regulations.
Aggregating spatial predictions to sufficiently large monitoring grid cells eliminates this linkage. When a spatial unit encompasses many separate land holdings, the aggregated statistics cannot be attributed to any individual farm. This approach is analogous to the well-established k-anonymity model in data privacy [20], where k is defined by a minimum sample threshold (5; see Section 3.3). To maintain this standard, any LUCAS polygon with fewer than this minimum number of contributing samples is suppressed, preventing re-identification in sparsely sampled areas or regions with few land holdings. A LUCAS 2 × 2 km polygon (~400 ha), centred on a LUCAS grid point, typically encompasses 20 or more separate farm holdings based on the average EU farm size (~17 ha) [21], providing substantial spatial dilution for most EU agricultural contexts.
EU privacy regulations do not prevent this architecture. The framework renders outputs non-attributable to individuals through a technical design that operates within existing provisions on data reuse and monitoring infrastructure, without requiring modifications to the existing legislation.
3. Proposed Framework: Privacy-Preserving Digital Soil Mapping Architecture
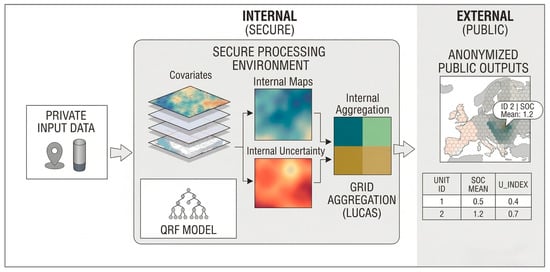
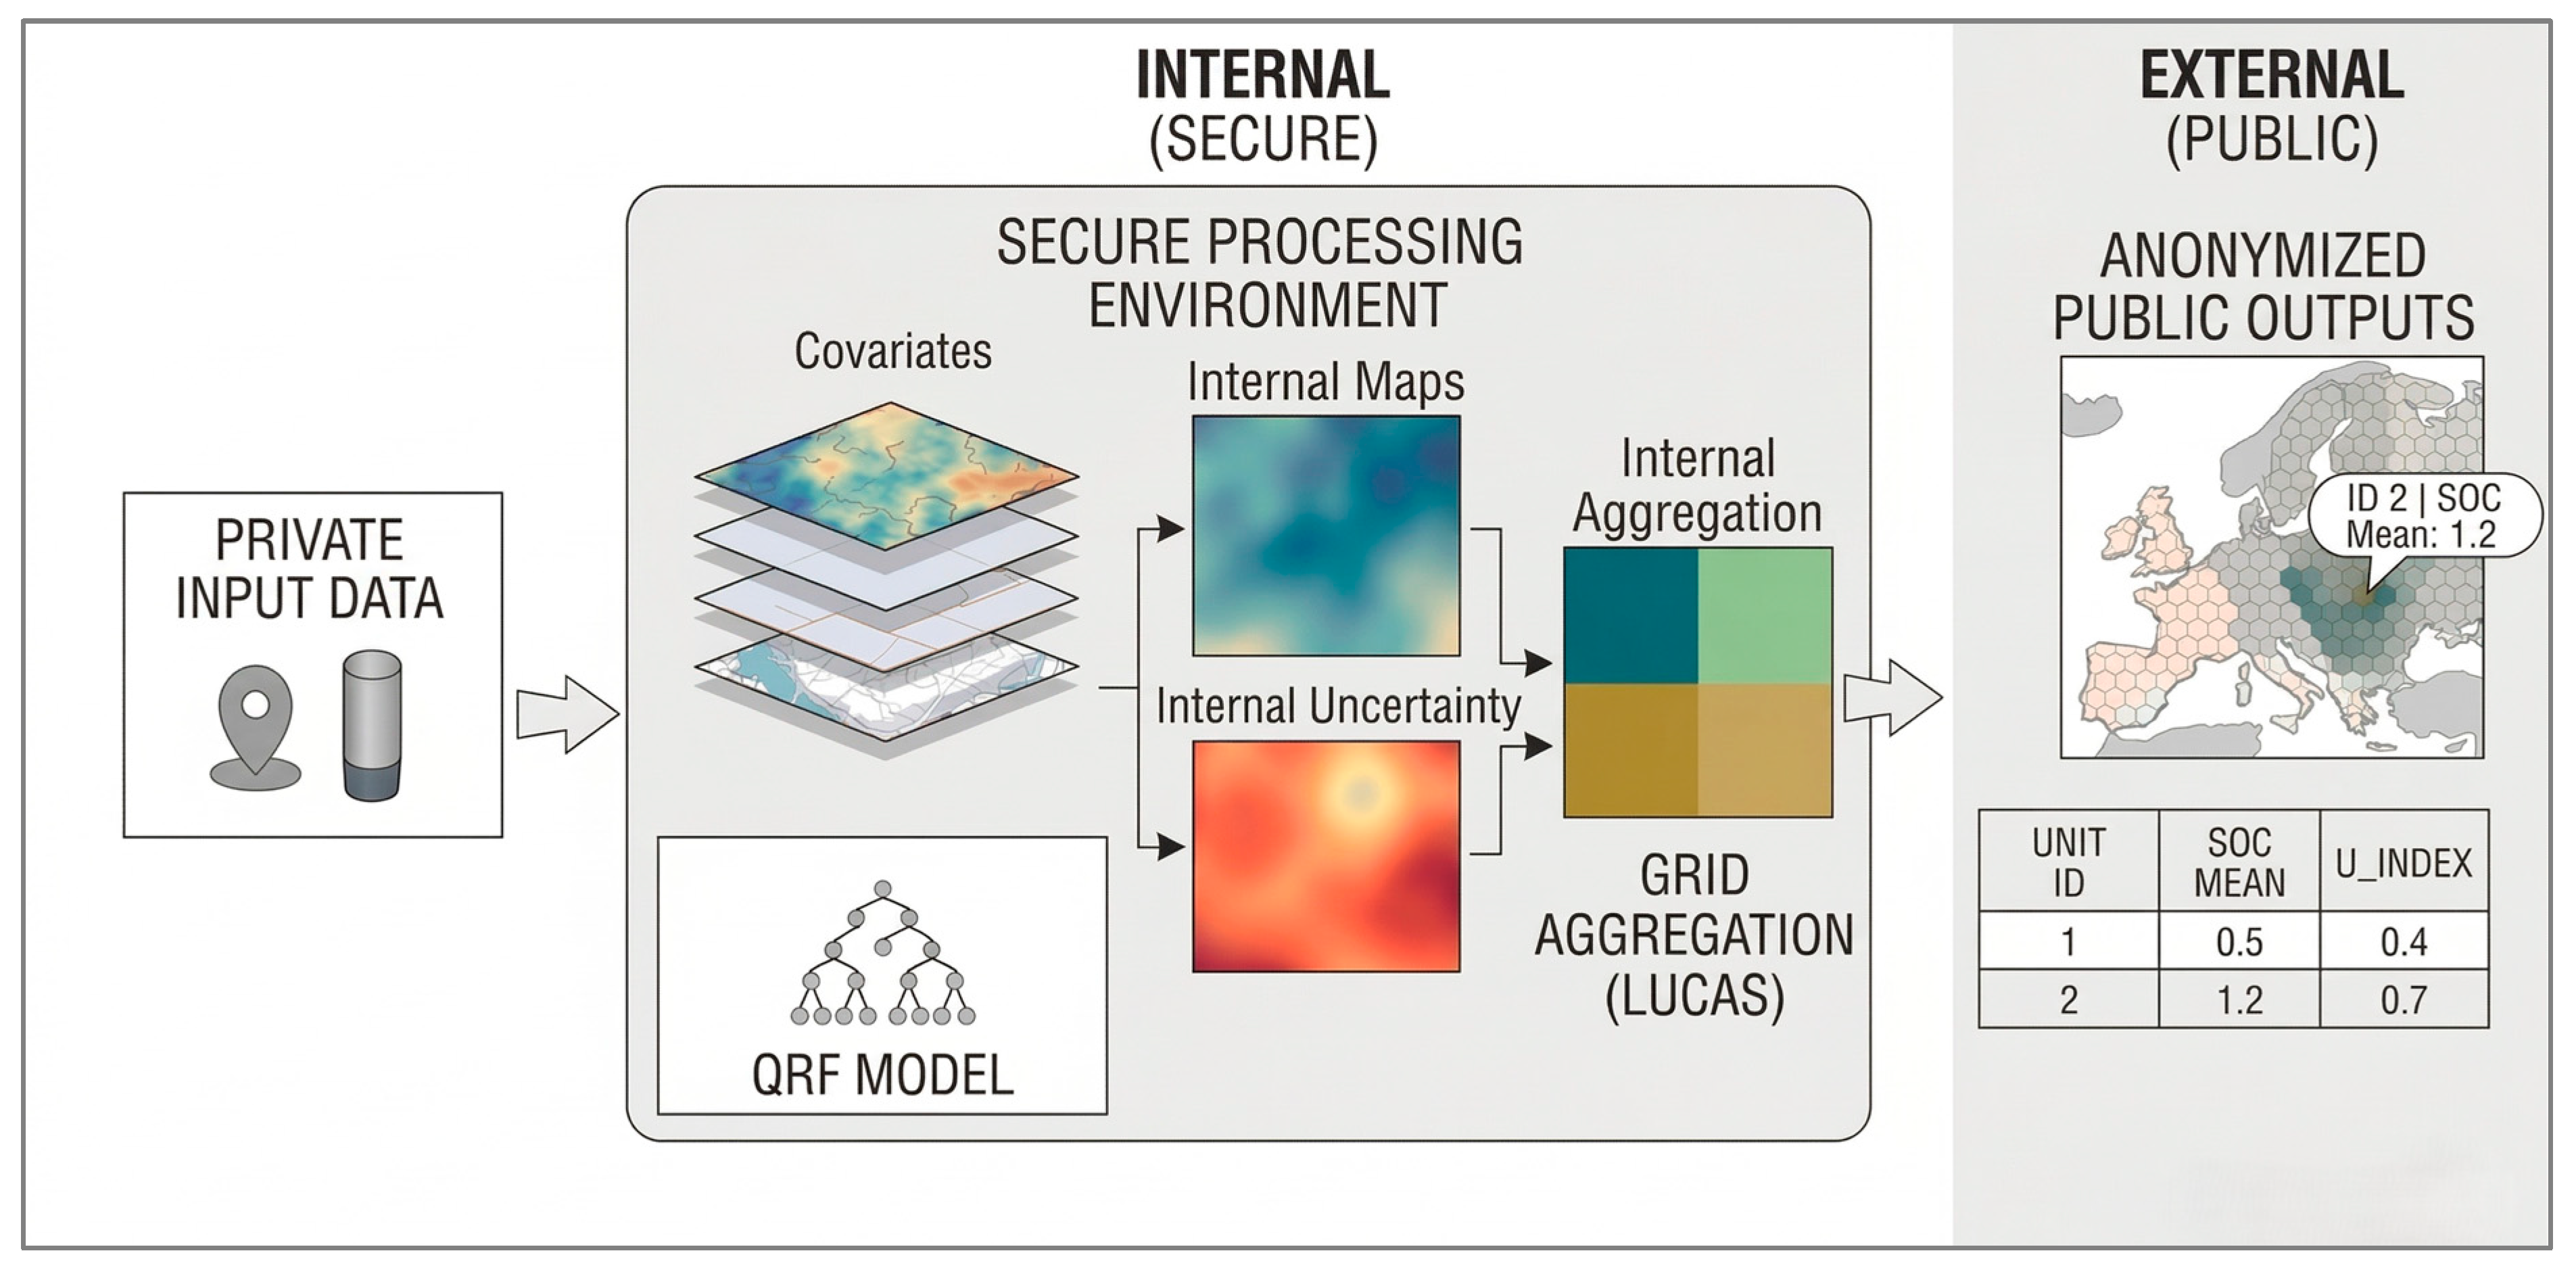
The proposed framework is structured considering three sequential components that form a unidirectional data pipeline (Figure 1) where private soil point data enter the pipeline and only anonymised LUCAS polygon statistics exit. At no point in the pipeline are raw private point data, high-resolution intermediate raster surfaces, or individual sampling coordinates disclosed to external parties.
Figure 1.
Framework Architecture: Privacy-Preserving Digital Soil Mapping Processing Pipeline.
3.1. Component 1: Secure Soil Data Processing Environment
The first component is a secure server environment that is designated as the Secure Soil Data Processing Environment (SSDPE) and is maintained by an authorised public institution (e.g., a national soil monitoring authority or a European one, such as the JRC-ESDAC). Private soil data submitted to the SSDPE are processed internally and never transmitted or exposed externally in their original point form.
The SSDPE confines all processing: cleaning, quality control, covariate extraction, model training, prediction, and aggregation, all of which occur inside the SSDPE. Only the final LUCAS polygons and their statistics are released from it. Even if aggregate outputs are combined with auxiliary spatial data, they cannot be used to reconstruct the locations or values of contributing samples.
Quality control within the SSDPE covers four areas. GPS coordinates are validated against cadastral land parcel databases. Measurement units are standardised across laboratory sources, and interquartile range (IQR) filtering removes outliers. Temporal consistency checks flag samples collected under anomalous conditions. Contributing laboratories must hold accreditation under a recognised proficiency testing program, in accordance with the SML provisions on laboratory quality management [9].
3.2. Component 2: QRF Digital Soil Mapping Engine
The second component is a Quantile Regression Forest [22] digital soil mapping engine. QRF is a non-parametric machine learning method that estimates the full conditional distribution of the target soil property given a set of environmental covariates, providing both a central prediction (50th percentile, median) and spatially explicit uncertainty bounds derived directly from predicted quantiles. Three quantiles are computed at each prediction pixel: the 15.9 percentile (lower bound), the 50 percentile (median), and the 84.1 percentile (upper bound). The pixel-level uncertainty index is the 68.2% prediction interval width Uindex = Q84.1 − Q15.9. The 68.2% coverage corresponds to the ±1σ probability range under normality, but the quantile-based computation makes no normality assumption and is robust to skewness in the QRF conditional distribution [22]. This uncertainty quantification capability is the primary reason why QRF is preferred over standard Random Forests, and the Uindex constitutes a spatially variable data quality index that guides public sampling prioritisation toward polygons where private data coverage is insufficient.
The DSM modelling procedure follows the SCORPAN framework [23], incorporating topographic covariates derived from a Digital Elevation Model (DEM), multitemporal satellite spectral indices (NDVI, NDWI) from Sentinel-2 imagery, and soil-chemistry covariates derived from other properties measured alongside the target variable. Feature selection is performed using the Akaike Information Criterion (stepAIC) technique, assessed for multicollinearity, reducing an initial pool of 20 variables to nine predictors. Model training and validation use spatial k-fold cross-validation (k = 10) to account for spatial autocorrelation and ensure genuinely independent test sets [24]. In the Kastoria case study, soil-chemistry covariates consistently dominated the permutation-based importance ranking in both RF and QRF models, with Zn first, Clay second, and Mg third [16]. The dominance of soil-chemistry covariates over topographic and spectral predictors reflects the relatively flat topography of the study area, which limits the explanatory power of terrain derivatives. Importantly, these rankings are dataset- and region-specific, and scaling the PP-DSM framework to a multi-regional EU infrastructure cannot rely on a fixed covariate template. Each regional deployment would require an independent feature selection step informed by local soil-forming factors.
For a detailed description of the QRF modelling procedure, including hyperparameter optimisation, covariate stack construction, and validation metrics, the reader is referred to Nikou and Tziachris [16], who developed and validated this procedure using the same dataset presented in Section 4.
3.3. Component 3: Spatial Aggregation to the LUCAS Monitoring Grid
The third and novel component is the spatial aggregation procedure that converts the high-resolution QRF prediction raster into publicly releasable LUCAS polygon statistics. This component is the core technical contribution of the present study and was not present in the earlier Nikou and Tziachris [16] publication. In this study, the SOC parameter is used as an example from the initial dataset and analysis.
After model training, the QRF engine generates three continuous raster surfaces: the 15.9 percentile (lower bound), the 50 percentile (median), and the 84.1 percentile (upper bound). At the same time, LUCAS Master Grid points are converted to 2 × 2 km square polygons where each polygon uses each LUCAS point as its centre. For each LUCAS polygon LI, zonal statistics are then extracted. Briefly, these metrics include the following:
- Smean(LI) = (1/nI) × Σ Q50Ij: mean of QRF median pixel predictions within polygon, converted to SOC (central estimate).
- Smedian(LI): median of median pixel predictions (robust to extreme pixels).
- Smax(LI), Smin(LI): maximum and minimum median pixel predictions (hotspot/degradation indicators).
- Slower(LI): zonal mean of Q15.9 raster (worst-case/lower-bound SOC estimate).
- Supper(LI): zonal mean of Q84.1 raster (best-case/upper-bound SOC estimate).
- Uindex(LI) = Supper − Slower: mean 68.2% PI width (Q84.1 − Q15.9) per polygon; data quality index.
- Ntraining(LI): count of training set sample points within polygon; transparency and data-density indicator.
To maintain data privacy, polygons with fewer than five training samples (Ntraining < 5) are suppressed and labelled “Insufficient Data”. This dual-purpose threshold prevents potential re-identification in sparsely sampled regions where farm field density is low and ensures that the reported statistics are derived from a large enough sample size to be stable and representative. The resulting polygon attribute table is the only publicly releasable product; all intermediate high-resolution raster surfaces and raw soil sample data remain strictly within the Secure Soil Data Processing Environment (SSDPE).
3.4. Output Products and Monitoring Applications
Table 1 summarises the publicly released LUCAS polygon output statistics and their primary applications within EU soil monitoring frameworks. Beyond the SML, these outputs have direct relevance to the EU Carbon Removal Certification Framework [3]. Carbon farming activities under the CRCF require verifiable, spatially explicit SOC measurements to establish baseline levels and demonstrate additionality. The Smean, Slower, and Uindex polygon outputs provide precisely the kind of area-representative, uncertainty-bounded SOC estimates that CRCF certification processes require, at a spatial resolution compatible with both soil unit-level monitoring and carbon accounting at the landscape scale.
Table 1.
LUCAS polygon output statistics from the privacy-preserving framework and their monitoring applications.
4. Materials and Methods
4.1. Study Area
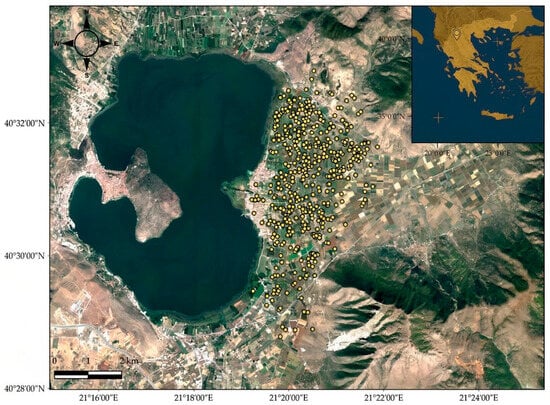
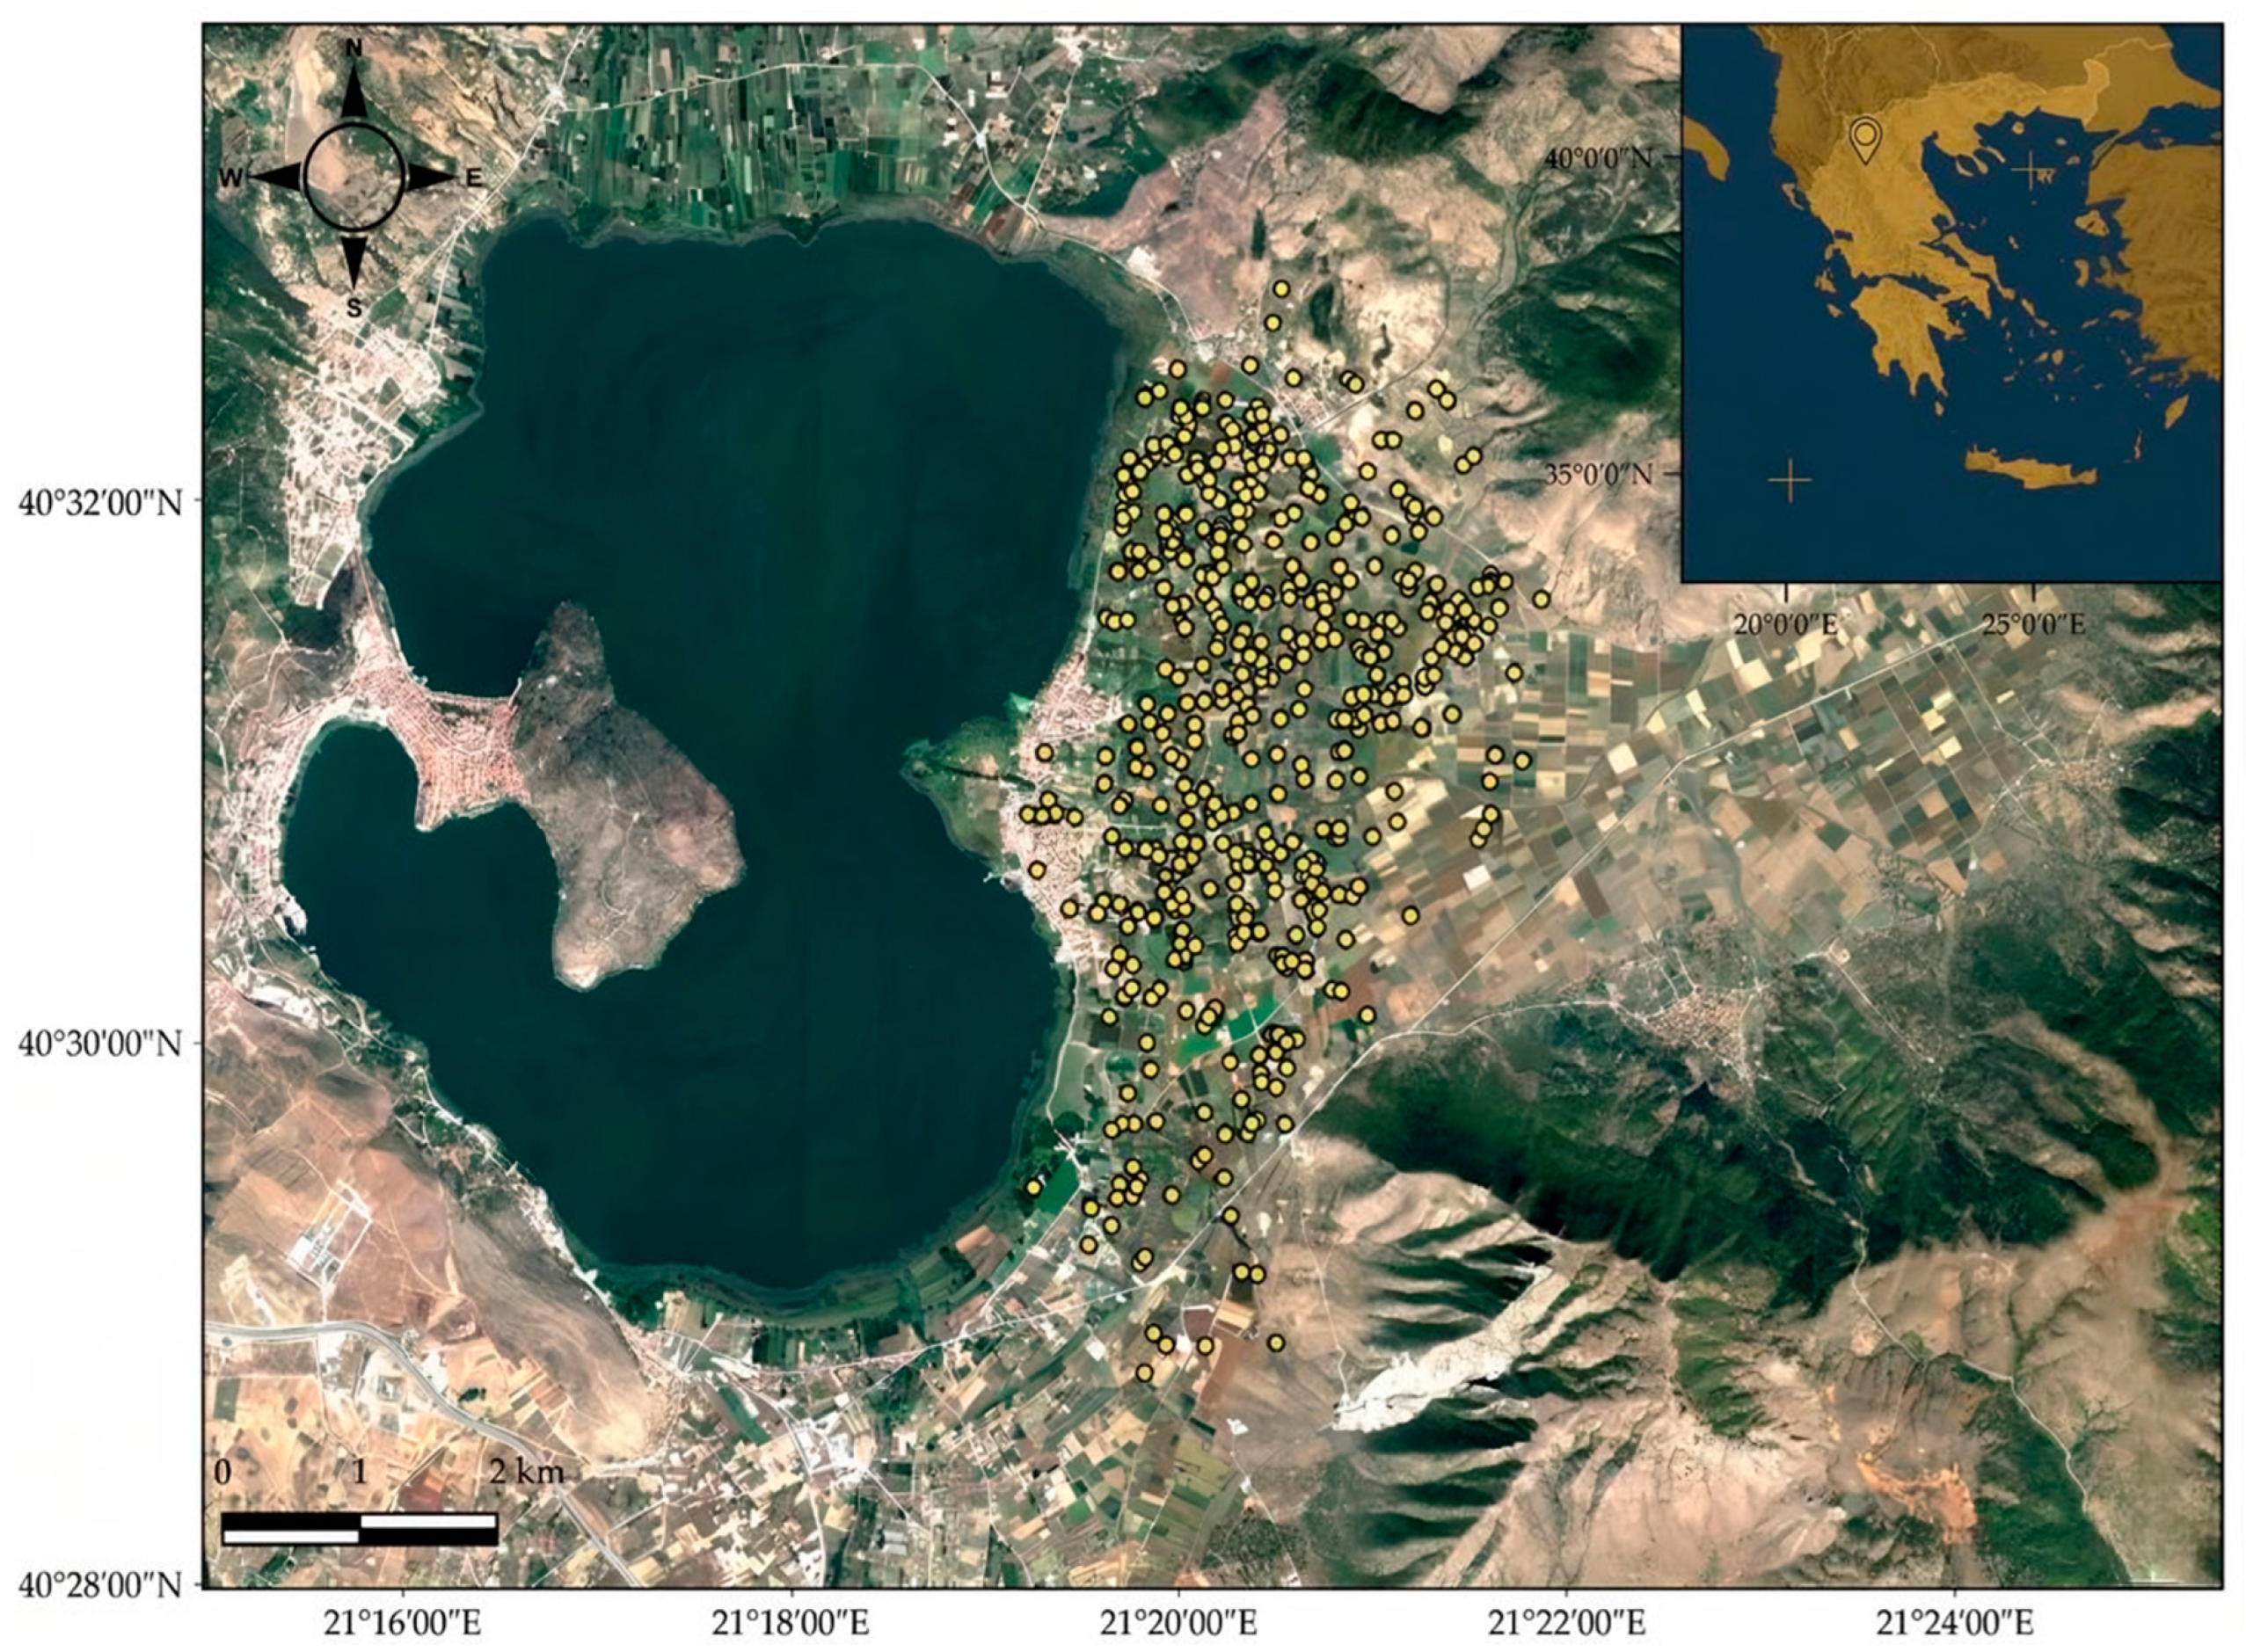
The framework demonstration uses data from the Kastoria regional unit in Northern Greece, situated on the eastern shore of Lake Orestiada (40°28′–40°32′ N, 21°19′–21°23′ E). The terrain is predominantly flat with a mean elevation of approximately 640 m above sea level. The climate is temperate continental with an average annual temperature of 11.5 °C and approximately 636 mm of annual precipitation (https://penteli.meteo.gr/stations/kastoria; accessed on 25 May 2026). Dominant agricultural crops are apple trees and beans. This area is representative of a private precision agriculture service context in which composite soil samples per field (~0.05–0.2 ha) are collected for fertilisation planning purposes (Figure 2).
Figure 2.
The study area on the shore of Lake Orestiada, in the regional unit of Kastoria, Greece. Yellow circles indicate the soil sampling positions.
4.2. Soil Data and Environmental Covariates
A total of 403 topsoil samples (0–30 cm depth) were collected from geographically distinct locations over the period 2012–2019 during late autumn. Sampling positions were recorded using GPS devices with sub-metre accuracy, with a minimum inter-sample distance of 60 m (mean 90 m). Samples were collected by employees of ELGO-DIMITRA for fertilisation advisory services. Given its pivotal importance within MRV studies and the SML, SOC was designated as the focal parameter for this framework evaluation. Twenty covariates were assembled in three categories, following the SCORPAN soil-forming factor framework [23,25]: (a) soil chemistry covariates such as clay, Mg, Zn were interpolated from the dataset using Ordinary Kriging; (b) topographic covariates derived from the ASTER GDEM2 DEM (30 m resolution) were the following: elevation, slope, aspect, SAGA Wetness Index (TWI), Topographic Position Index (TPI), Multiresolution Index of Valley Bottom Flatness (VBF), Topographic Openness (negative/positive), and Deviation from Mean Elevation; and (c) satellite spectral indices such as NDVI and NDWI were derived from Sentinel-2 imagery (10 m, resampled to 30 m) for 2016–2019, capturing soil-vegetation temporal dynamics. Feature selection via Akaike Information Criterion (stepAIC) identified nine covariates as significant predictors, with clay content, magnesium, and multi-year NDVI composites ranking consistently among the highest-importance variables.
The dataset was partitioned into a training set (283 points, 70%) used for QRF model fitting and a hold-out test set (120 points, 30%) retained exclusively for independent model validation and the QRF–point comparison in Section 5.4.
For a complete description of the specific methodological framework, see Nikou and Tziachris [16]. As stated in the Introduction, this dataset serves only to validate the aggregation architecture, leaving the underlying DSM specifics aside.
5. Case Study Implementation and Results
5.1. Model Performance
Four models were trained and evaluated using spatial 10-fold cross-validation: Ordinary Kriging (OK), Kriging with External Drift (KED), Random Forests (RFs) [26], and Quantile Regression Forests (QRFs) [22]. Performance metrics are presented in Table 2 for the SOC parameter.
Table 2.
Cross-validation performance metrics (spatial 10-fold CV). ★ = framework’s selected engine. Source: Nikou and Tziachris [16], extended.
Ordinary Kriging, operating without covariate information, explained only 12.7% of SOC variance (R2 = 0.127) while also showing the worst performance of RMSE and MAE statistics. KED substantially improved performance (R2 = 0.452) by incorporating covariate information into the trend component. Both machine learning methods outperformed geostatistical approaches, in line with the broader DSM literature underscoring the capacity of ML methods to capture non-linear soil–environment relationships [27,28]. Random Forests achieved marginally higher point-accuracy (R2 = 0.538, RMSE = 0.308 SOC%). Quantile Regression Forest (QRF) provided similar performance metrics (R2 = 0.532, RMSE = 0.318 SOC%) while additionally supplying spatially explicit prediction intervals across the full study area. We selected QRF for its robust uncertainty quantification, as the framework prioritises data quality signalling at the polygon level.
Feature importance analysis identified clay content, magnesium, and multi-year NDVI composites as the most influential predictors, in alignment with the mechanistic relationships between soil texture, nutrient status, vegetation productivity, and organic matter accumulation that are well established for temperate agricultural systems in the DSM literature [27,28]. The covariate ranking is therefore not in itself a novel finding. Its relevance to the framework is indirect: the structure of covariate importance determines where prediction uncertainty is highest across the spatial domain, and consequently which polygons are most likely to carry high Uindex values requiring additional monitoring investment.
5.2. Prediction and Uncertainty Maps
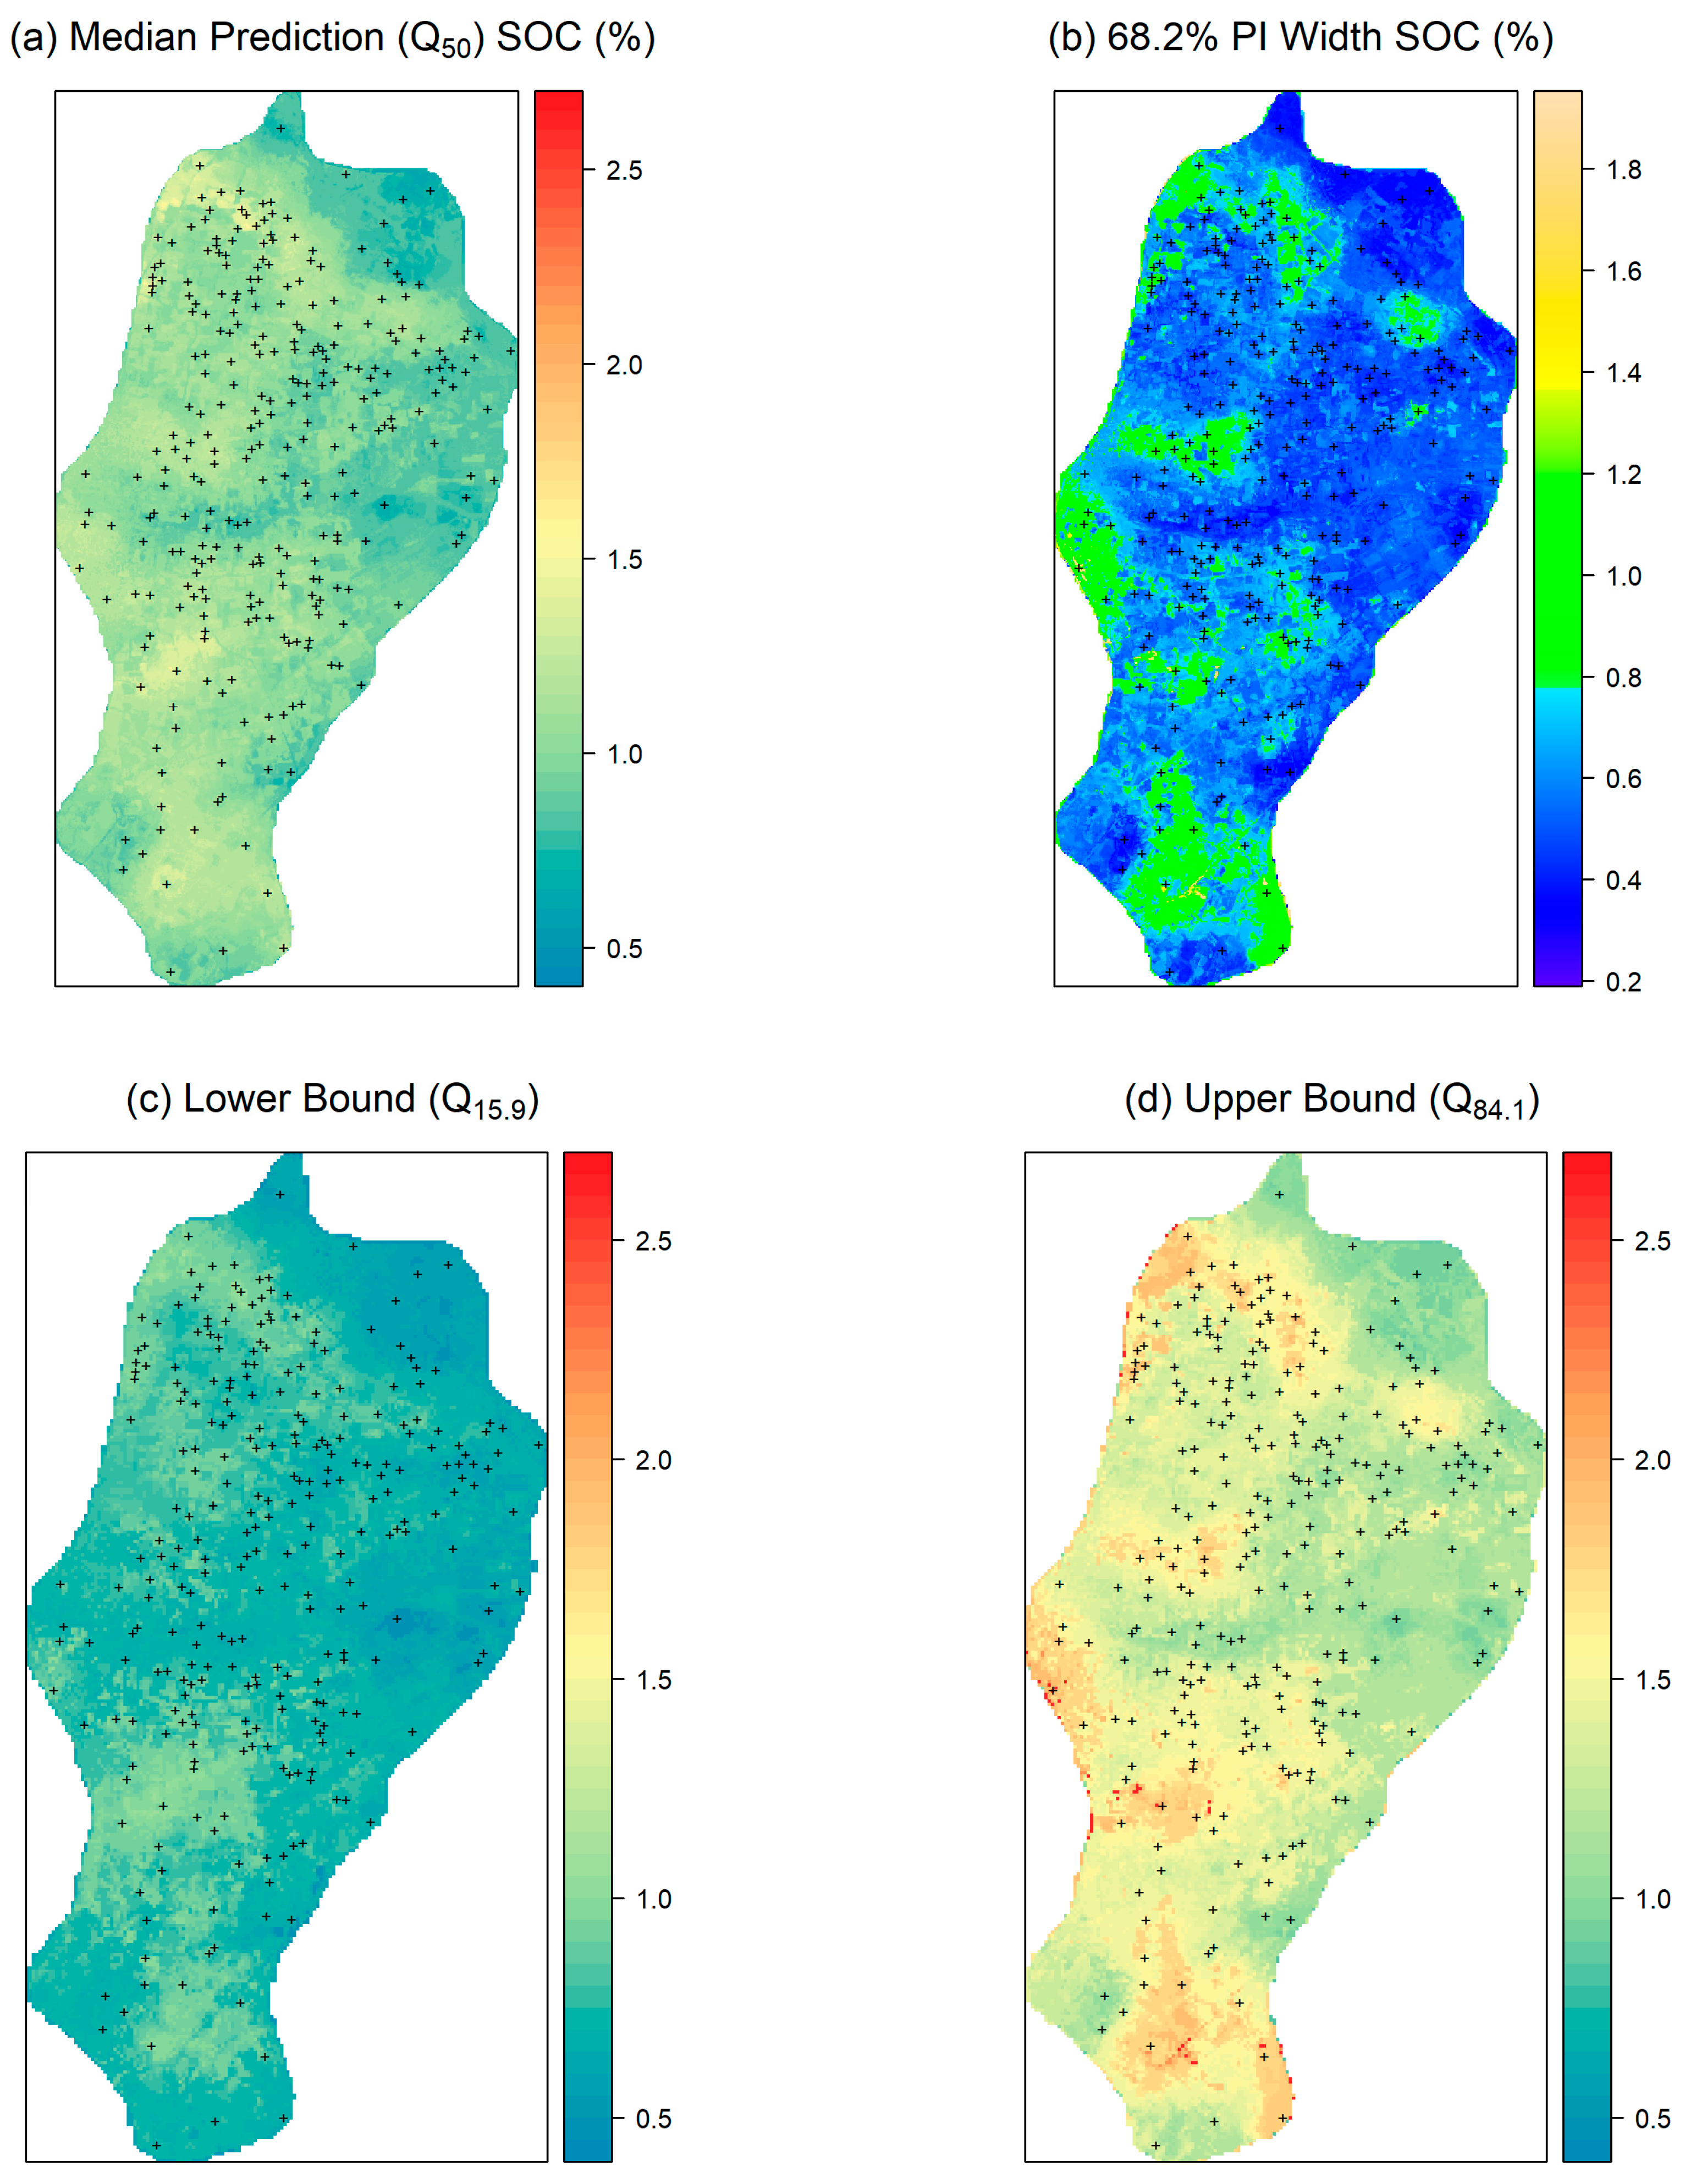
The QRF model was applied to a 30 m resolution prediction grid covering the study area. Three quantile surfaces were generated at each pixel: the 15.9 percentile (Q15.9, lower bound), the 50 percentile (Q50, median prediction), and the 84.1 percentile (Q84.1, upper bound). The pixel-level uncertainty raster was computed as the 68.2% prediction interval width: Uindex = Q84.1 − Q15.9 at each pixel. The quantile set (15.9%, 50%, 84.1%) was selected because the 68.2% coverage corresponds to the ±1σ range under a normal distribution, while the non-parametric quantile approach remains valid for skewed distributions. The Uindex for each LUCAS polygon is the zonal mean of this pixel-level 68.2% PI width, and Uindex/2 is a non-parametric SD-equivalent for comparison with direct point standard deviations.
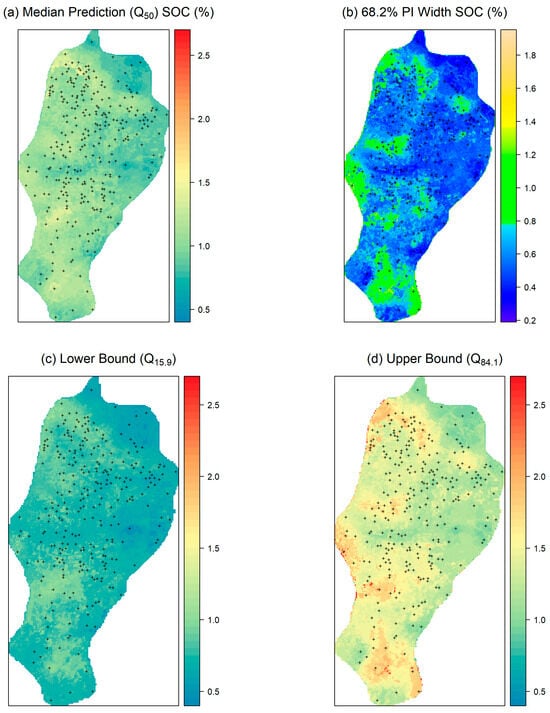
Three output maps characterise the QRF predictions across the study area. The median prediction map (Q50; Figure 3a) shows the central SOC estimate at 30 m resolution with higher values in lower-lying areas near the lake shore and lower values under intensive apple cultivation. The 68.2% PI width map (Figure 3b) shows prediction uncertainty widening in areas with sparser sampling density and at the study area edges where environmental covariate combinations are poorly represented in the training data. The lower-bound map (Q15.9; Figure 3c) and upper-bound map (Q84.1; Figure 3d) represent the worst-case and best-case SOC scenarios at each pixel, providing spatially explicit information on the asymmetry of the prediction distribution. These raster products remain within the Secure Soil Data Processing Environment and are not publicly released.
Figure 3.
(a) Median prediction SOC% map (Q50), (b) the 68.2% PI width SOC% map, (c) the lower-bound SOC% map (Q15.9), (d) the upper-bound SOC% map (Q84.1).
5.3. Aggregated LUCAS Polygon Statistics
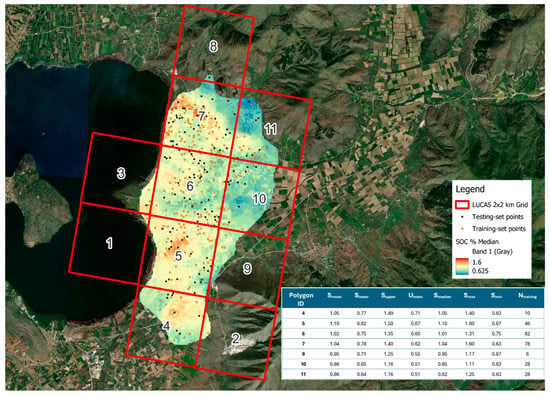
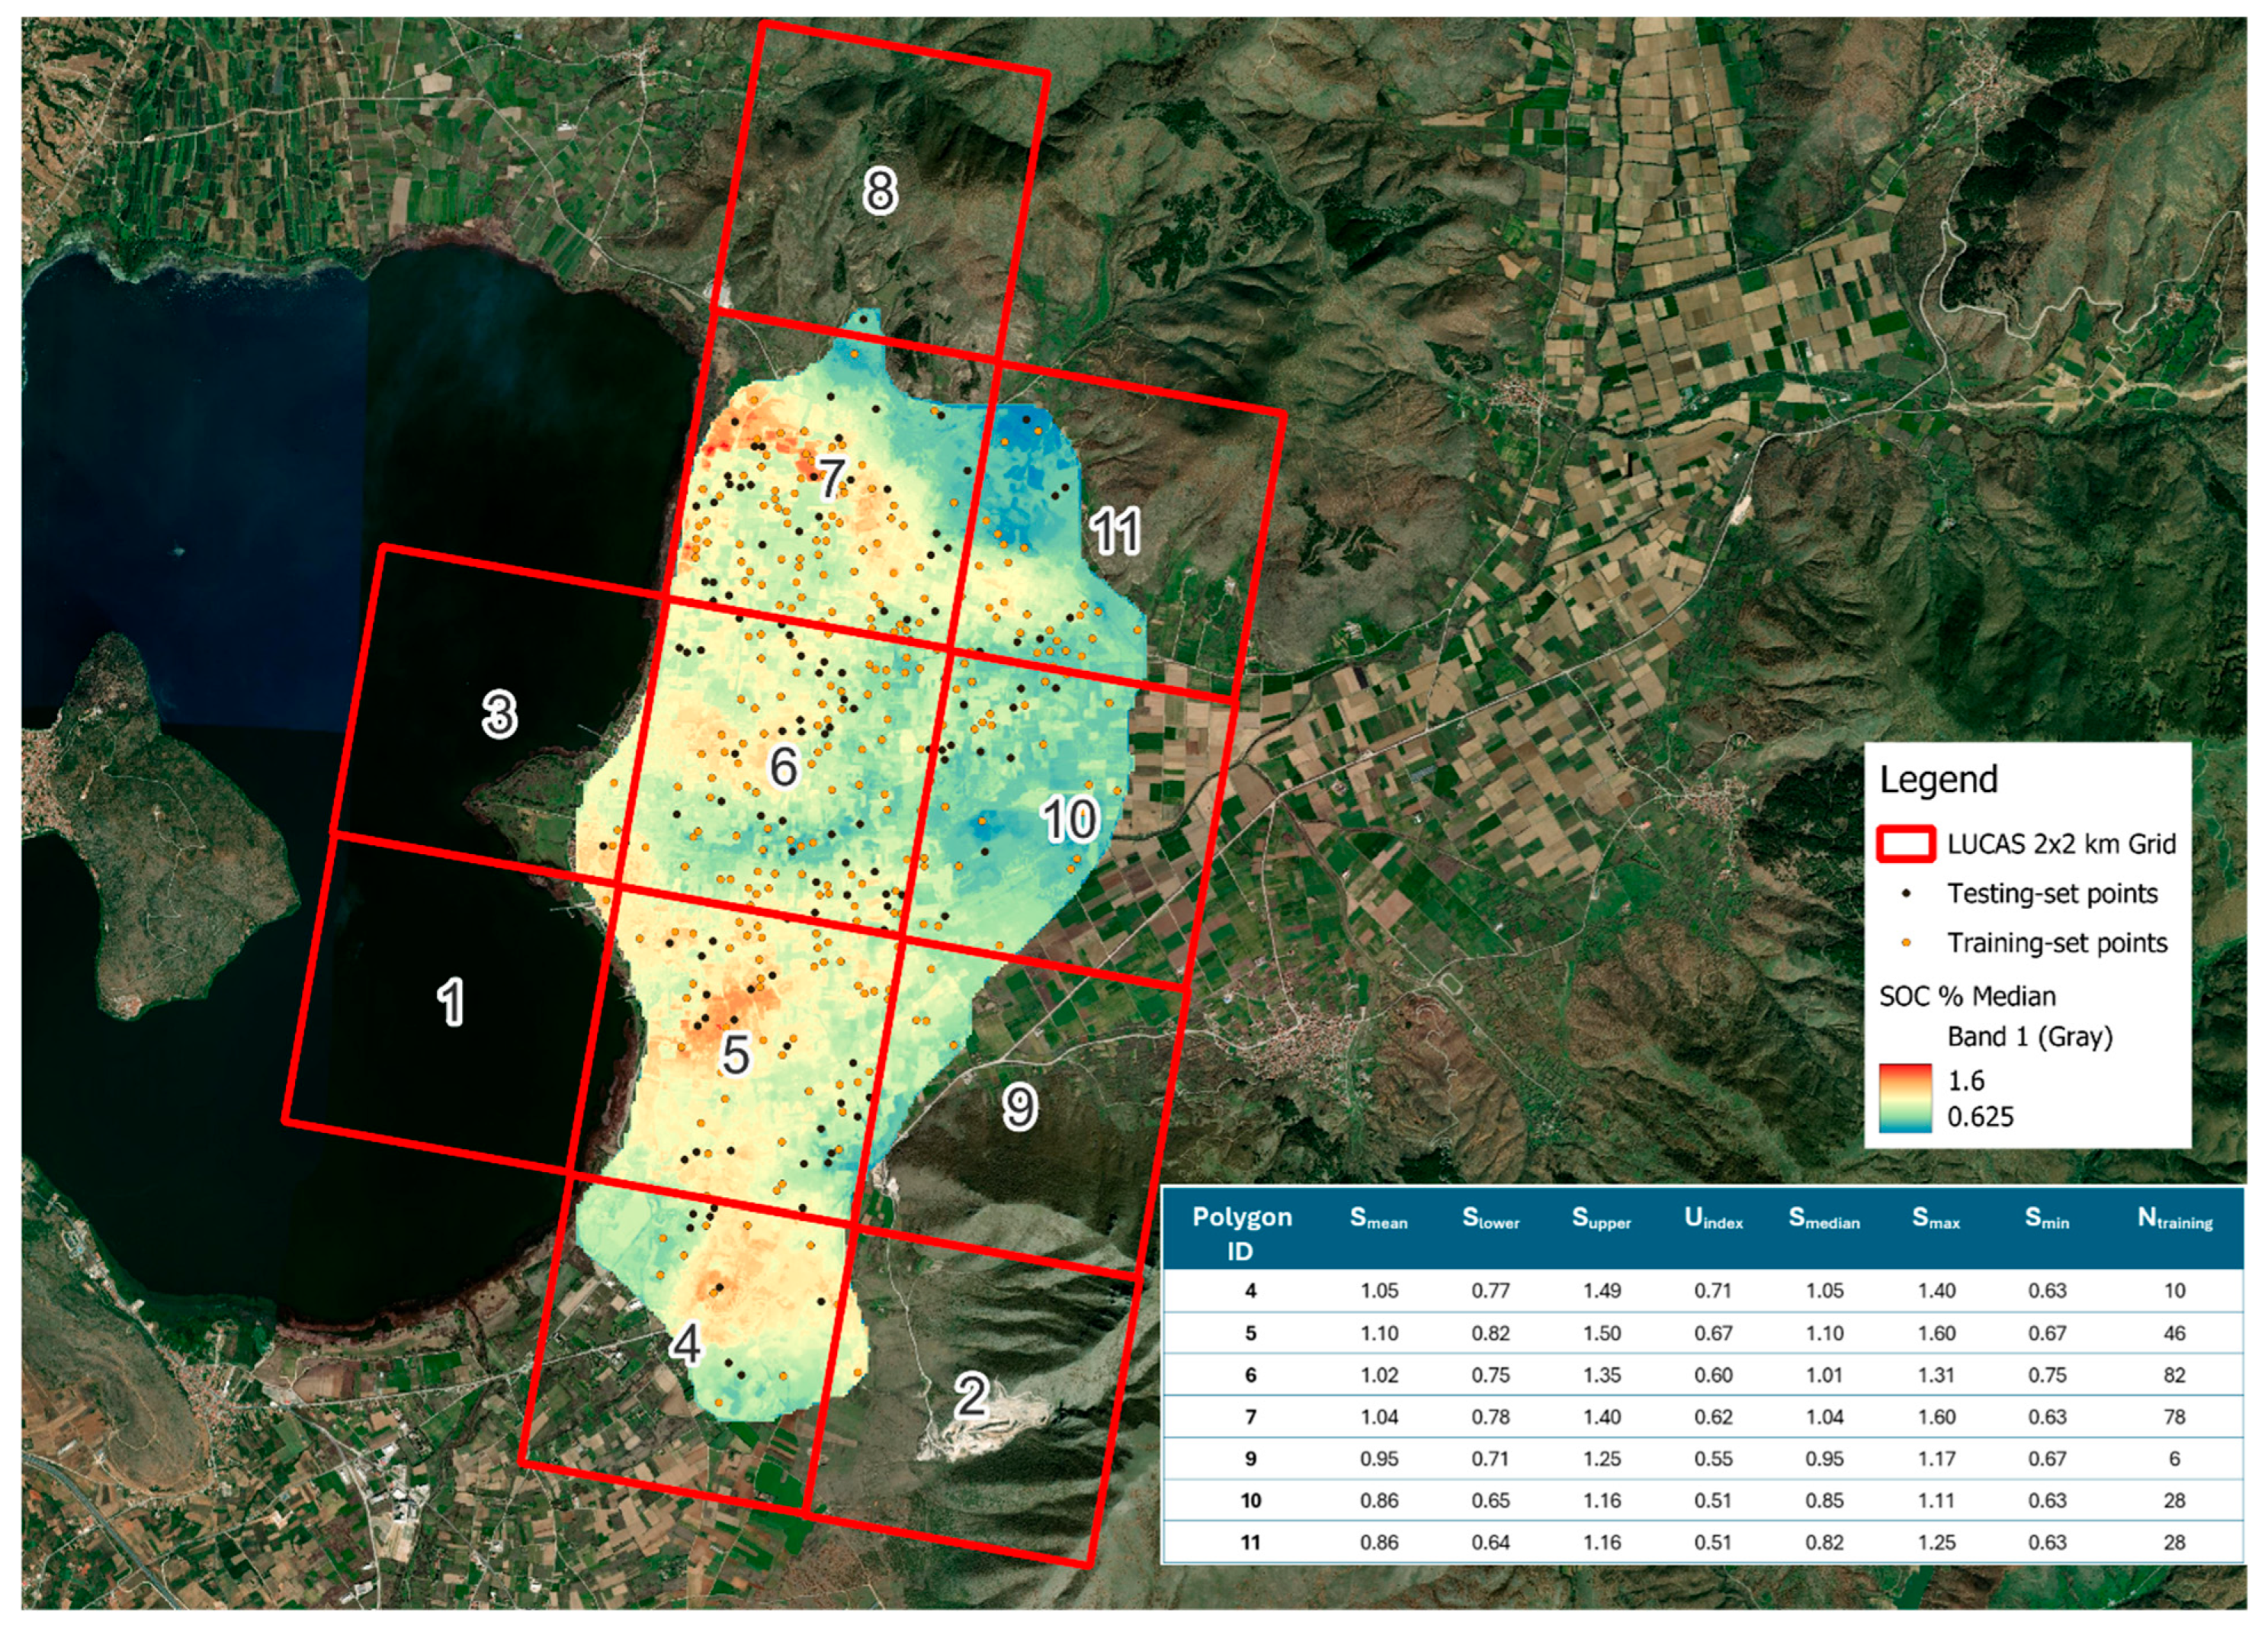
Of the 11 LUCAS 2 × 2 km polygons intersecting the Kastoria study area (Figure 4), seven contain more than five training set points. Zonal statistics were extracted from the QRF raster outputs for these 7 polygons (Table 3). Ntraining ranges from 6 (Polygon 9*) to 82 (Polygon 6). Uindex does not rank monotonically with training sample count: Polygon 4 (Ntraining = 10, Uindex = 0.71% SOC) shows higher uncertainty than Polygon 9 (Ntraining = 6, 0.55% SOC), confirming that local covariate representativeness influences prediction confidence independently of sample density. Slower and Supper span between 0.64 and 0.82% SOC (lower bounds) and 1.16–1.50% SOC (upper bounds) across the seven LUCAS polygons. Figure 4 shows the aggregated SOC surface across the LUCAS grid.
Figure 4.
Aggregated SOC surface across the LUCAS grid.
Table 3.
LUCAS polygon QRF output statistics: public output product. All values in SOC (%). Smean = zonal mean of Q50 raster; Slower = zonal mean of Q15.9; Supper = zonal mean of Q84.1; Uindex = Supper − Slower = mean 68.2% PI width; Smedian/Smax/Smin = zonal statistics of Q50 raster. Ntraining = training set points per polygon. * = Ntraining < 10; treat statistics with caution.
Polygons 10 and 11 show nearly identical statistics (Smean = 0.86% SOC, Uindex = 0.51% SOC, Ntraining = 28 each). This convergence is consistent with their spatial configuration: both polygons lie on the flat plateau at a similar distance from Lake Orestiada, well away from the lake-shore zone where organic matter inputs tend to elevate SOC. Shared elevation, dominant crop types (primarily apple orchards and arable fields), and identical training set density lead to equivalent covariate environments, producing near-identical QRF polygon outputs. This illustrates that spatial adjacency and shared environmental conditions, rather than any modelling artefact, can generate convergent polygon-level statistics.
5.4. Comparison of QRF Polygon Statistics with Direct Point Measurement Statistics
To produce an independent evaluation, only the hold-out test set (data points excluded from the QRF model calibration) is used for the comparison in this section. Using the training points would be circular: the model was fitted to minimise error against those points, making any agreement uninformative about genuine predictive accuracy.
In this specific dataset, Polygon 9 was excluded because it contains fewer than five test data points (Ntesting < 5) falling below a minimum threshold to ensure the statistical reliability of the validation metrics. Sample sizes below this threshold are highly sensitive to individual point-level outliers and cannot provide a stable estimate of the “true” polygon mean for comparison. The remaining six polygons contain Ntesting points between 8 and 37. While some still represent a relatively limited sample size, these polygons collectively contribute 118 of the 120 test-set points and form the basis of the comparison.
The comparison reveals two principal patterns from the independent test set evaluation:
QRF Smean vs. independent test set means: QRF Smean is lower than the test set mean in four out of six polygons (mean absolute difference 0.070% SOC, 5.8%). Polygons 10 (+0.01% SOC, +1.2%) and 11 (+0.07% SOC, +8.9%) show a slight positive bias, while the four remaining polygons show the expected negative smoothing bias. The largest discrepancy is in Polygon 7 (−0.13% SOC, −11.1%), where the test set mean (1.17% SOC, Ntesting = 31) exceeds the QRF polygon mean (1.04% SOC), reflecting within-polygon heterogeneity that the spatial prediction surface smooths toward the regional covariate-driven trend. The mean absolute difference of 0.070% SOC is in alignment with the expected behaviour of spatial prediction models and confirms that the framework does not introduce systematic distortion at the LUCAS polygon scale.
Uindex/2 vs. independent test set SD: The comparison with test set point SDs shows a mixed pattern. Uindex/2 exceeds test set SD in three polygons (Polygon 11: +0.105% SOC, +70.0%; Polygon 4: +0.085, +31.5%; Polygon 10: +0.035, +15.9%) and is lower in the remaining three (Polygon 7: −0.200% SOC, −39.2%; Polygon 5: −0.145, −30.2%; Polygon 6: −0.010, −3.2%). The mean signed difference is −0.022% SOC (mean absolute difference 0.097% SOC). This variability reflects the conceptual distinction between the two metrics: Uindex/2 measures QRF model confidence at a pixel level, driven by covariate-space density in the training set, whereas the test set SD captures the local spatial variability of the 8–37 hold-out points per polygon. Small samples can differ substantially from model uncertainty, especially when points are spatially clustered. The two largest positive differences exist in Polygon 11 (+70.0%, Ntesting = 8) and Polygon 4 (+31.5%, Ntesting = 8). These represent the smallest test set counts in Table 4 and likely reflect imprecision in the small sample SDs (8 points each) rather than systematic model overconfidence. Consequently, Uindex/2 is best interpreted as a data quality governance signal for monitoring applications rather than a direct predictor of within-polygon soil heterogeneity.
Table 4.
Comparison of QRF polygon statistics with independent test set point statistics. Mean diff. = QRF Smean minus test set mean. Uindex/2* = (Supper − Slower)/2; non-parametric SD-equivalent for comparison with Point SD. Ntesting = hold-out test set points per polygon.
6. Discussion
6.1. Potential Contribution to EU Soil Monitoring
The framework can serve four distinct monitoring purposes on behalf of EU Soil Monitoring programmes:
- Independent validation of JRC-ESDAC and/or national soil interpolation products becomes feasible where private data coverage and LUCAS-Soil sampling overlap.
- Anomaly detection (e.g., elevated SOC concentrations “Smax” in a specific polygon) can trigger targeted field verification.
- For carbon accounting under the CRCF, Smean and Slower provide defensible conservative SOC estimates at the polygon scale.
- Uindex can guide the design of public LUCAS-Soil sampling surveys: high uncertainty indicates areas where private data are too sparse, while low uncertainty identifies areas where additional sampling may be redundant.
The CRCF creates a parallel policy demand for SOC data that this framework is well positioned to address. Carbon farming certification under the CRCF requires that baseline SOC levels be established, that additionality be validated relative to a business-as-usual scenario, and that monitoring and verification of carbon stocks be maintained over time. Polygon-level Slower values provide conservative, uncertainty-bounded SOC baselines appropriate for risk-averse carbon accounting. Furthermore, Uindex quantifies prediction uncertainty at the polygon scale, a key requirement for robust MRV systems. Consequently, the framework serves as a bridge between the private soil data infrastructure already in place and the established and forthcoming operational requirements of both the SML and the CRCF, two complementary regulatory instruments with shared data needs.
The economic argument for integration is compelling. If the estimated annual private soil analyses [19] were incorporated into public monitoring grids, the equivalent sampling cost of public surveys would save tens to hundreds of millions annually. That figure significantly outweighs the infrastructure costs of the framework itself, suggesting that spatial monitoring coverage could expand without a commensurate increase in public expenditure.
One result in this case study deserves closer attention in future works: the relationship between Ntraining and Uindex seems non-monotonic. Polygon 4 (Ntraining = 10) shows higher uncertainty (0.71% SOC) than Polygon 9 (Ntraining = 6, 0.55% SOC). This suggests that covariate representativeness, rather than sample density alone, drives prediction confidence. If replicated across other regions, this finding would support the design of public soil sampling surveys on the basis of Uindex. Nonetheless, these findings should be interpreted with caution given the limited sample size of the current study.
6.2. Privacy Protection Through Aggregation
Aggregation to the LUCAS polygon scale eliminates farm-level identification in the Kastoria context, where published polygons contain between 6 and 82 training set points from distinct parcels. The suppression rule (Ntraining < 5) guards against re-identification in sparsely sampled areas. Crucially, the released statistics derive from the smoothed prediction raster rather than raw sample coordinates. Even an external party with full knowledge of the underlying model cannot reconstruct the location or value of any contributing sample from the polygon statistics, as the spatial aggregation function is non-invertible.
6.3. Missing Auxiliary Parameters and Implications for Stock-Based Monitoring
The current implementation operates exclusively on concentration-based SOC outputs (SOC%), a direct consequence of the Kastoria dataset having been collected for fertilisation advisory purposes. Two categories of auxiliary measurements are absent that would be required for a fully operational EU monitoring deployment.
The first is soil bulk density (BD). Converting SOC concentration to organic carbon stock (Mg C ha−1), as required by the CRCF and SML for carbon accounting, requires multiplication of SOC% by BD and sampling depth. Without measured or modelled BD values, the framework’s polygon outputs cannot be directly translated into stock-based indicators suitable for MRV systems or carbon credit calculations. Future operational implementations must therefore incorporate BD either from direct field measurements or validated pedotransfer functions. Incorporating BD into the aggregation pipeline is technically straightforward within the existing SSDPE architecture, as BD rasters can be generated by the QRF engine from the same SCORPAN covariate stack and aggregated to the LUCAS polygon scale following an identical procedure to that described in Section 3.3.
The second is long-term fertiliser application history. Without this contextual record, polygon-level Smax anomaly signals cannot be unambiguously attributed. They may arise from management-driven artefacts rather than genuine SOC enrichment. Integrating fertiliser records into the SSDPE would require a governed data-sharing arrangement with farm advisory services or national Farm Sustainability Tool registries, consistent with CAP Regulation 2021/2115 Article 15-4(g), representing a primarily institutional rather than a technical barrier, and is identified as a priority for future collaborative framework implementations.
6.4. Limitations
Several limitations of the present study should be acknowledged explicitly.
Dataset scope: The specific case study illustrates the framework pipeline adequately for a single relatively homogeneous region but cannot support generalisations about QRF performance across the full diversity of EU pedological environments. Multi-regional validation is needed before operational deployment. While utilising multiple mapping models and selecting the best performer for statistical output extraction is a potential alternative, it falls beyond the current study’s scope.
QRF vs. point comparison limitations: Table 4 uses the independent hold-out test set to avoid training set circularity. Within the Kastoria dataset, Polygon 9 was excluded because it contains fewer than five test data points (Ntesting < 5), falling below a minimum threshold required to ensure statistical reliability. The remaining six polygons contain Ntesting values between 8 and 37. While these provide a sufficient basis for this study, some still represent a limited sample. As a result, their standard deviations should be viewed as approximate, reflecting the specificities of the current study area. More samples and further replication across other regions are needed before these findings can be generalised.
Operational implementation: The framework is presented here as a technical design and proof of concept. The Secure Soil Data Processing Environment has not been operationally implemented or independently security-audited. A full operational deployment would require a formal cybersecurity assessment, institutional governance arrangements, and laboratory accreditation integration. These elements are beyond the scope of the current study.
Data quality and governance: The framework assumes that contributing laboratories meet minimum quality standards through accredited proficiency testing. Full-scale implementation of the framework across 27 Member States requires harmonised data submission standards and quality assurance protocols.
7. Conclusions
This study presented a Privacy-Preserving Digital Soil Mapping Framework (PP-DSM) for integrating private high-spatial-resolution soil data into EU soil monitoring infrastructures. It showed that by performing QRF digital soil mapping within a secure processing environment and releasing only aggregated outputs at the LUCAS grid scale, it is possible to extract monitoring-relevant soil statistics from private farm-scale data without exposing the location or value of any individual sample.
The framework exploits the full information of farm-level data without violating GDPR, while its outputs (anonymised statistics at the LUCAS 2 × 2 km polygon scale) are structurally compatible with the SML soil unit monitoring architecture and with the existing LUCAS Master Grid infrastructure. No new EU-level legislative instruments are required beyond the consent of the owners that their data will be used only for specific purposes (e.g., scientific, policy, etc.). Institutional governance arrangements and national transposition of the SML provide the necessary regulatory context. This work highlights the potential to substantially increase the spatial coverage of EU soil monitoring within the existing regulatory environment, provided there are institutional partnerships between private/public laboratories and competent monitoring authorities.
From a technical standpoint, the outputs are delivered as a polygon attribute table of LUCAS indicators derived from the full QRF conditional distribution, rather than simple averages. Each polygon includes central SOC estimates (Smean, Smedian), range indicators (Smin, Smax), quantile-based bounds (Slower, Supper), the 68.2% prediction interval width (Uindex), the number of contributing samples (Ntraining), and a temporal flag (optional). In the Kastoria case study, Smean matched independent test-set polygon means closely, with an average difference of 0.070% SOC (5.8% relative deviation). This difference is consistent with the expected smoothing effect of spatial aggregation and does not indicate systematic bias at the monitoring scale. The Uindex metric reflects model-based predictive uncertainty derived from the conditional distribution of QRF and is influenced by covariate coverage and training data density. The Uindex/2 can be interpreted as a non-parametric SD-equivalent, capturing model-based uncertainty driven by covariate coverage rather than simply reflecting point variability. Collectively, these outputs provide bias-controlled central estimates, explicit uncertainty bounds, and transparent information on data density. This makes them suitable for MRV applications, supporting traceable estimates, conservative baselines (via Slower), and more targeted management of uncertainty (via Uindex).
Future work should prioritise multi-regional validation across diverse EU pedological zones and a formal security assessment of the processing environment. It should also explore complementary privacy-enhancing technologies, including federated processing approaches. The Kastoria case study should be regarded as step 1 of this staged rollout, providing the first architectural validation of the PP-DSM framework before broader institutional deployment at EU scale. Future implementations should also incorporate soil bulk density, whether from direct measurements or validated pedotransfer functions. This will allow the framework to support stock-based carbon indicators in addition to concentration-based SOC products. With appropriate technical safeguards and institutional arrangements, the integration of private soil datasets can substantially enhance the spatial coverage and informational depth of EU soil monitoring systems.
Author Contributions
Conceptualization, P.T. and V.A.; methodology, P.T. and V.A.; software, P.T. and M.I.; validation, M.I. and V.T.; data curation, P.T.; writing—original draft preparation, P.T., V.T. and V.A.; writing—review and editing, P.T., T.B.-D.-G., K.P.P.M. and V.A.; supervision, P.T. and V.A.; project administration, T.B.-D.-G. and V.A. All authors have read and agreed to the published version of the manuscript.
Funding
This research was funded by the European Union’s Horizon Europe research and innovation programme, Grant Agreement No. 101112951 (Driving high-level conversations to shape carbon farming markets and policies—CREDIBLE; https://www.project-credible.eu/).
Data Availability Statement
The datasets presented in this article are not readily available because the data are part of an ongoing study.
Conflicts of Interest
Author Tristano Bacchetti-De-Gregoris was employed by the company Soluciones Agricolas Ecoinnovadoras (SAE INNOVA), Karina Patricia Prazeres Marques was employed by the company Esférico MRV Systems. The remaining authors declare that the research was conducted in the absence of any commercial or financial relationships that could be construed as a potential conflict of interest.
Abbreviations
The following abbreviations are used in this manuscript:
| AQD | Air Quality Directive |
| CAP | Common Agricultural Policy |
| CRCF | Carbon Removals and Carbon Farming Regulation |
| DEM | Digital Elevation Model |
| DSM | Digital Soil Mapping |
| ELGO-DIMITRA | Hellenic Agricultural Organisation—DIMITRA |
| EU | European Union |
| GDPR | General Data Protection Regulation |
| HSRSD | High-Spatial-Resolution Soil Data |
| JRC-ESDAC | Joint Research Centre—European Soil Data Centre of the EU |
| LUCAS | Land Use and Coverage Area frame Survey |
| MRV | Measurement, Reporting, and Verification system |
| NDVI | Normalised Difference Vegetation Index |
| NDWI | Normalised Difference Water Index |
| PP-DSM | Privacy-Preserving Digital Soil Mapping Framework |
| QRF | Quantile Regression Forest |
| SD | Standard Deviation |
| SHDP | Soil Health Data Portal |
| SML | Soil Monitoring Law |
| SOC | Soil Organic Carbon |
| SSDPE | Secure Soil Data Processing Environment |
| WFD | Water Framework Directive |
References
- European Union. Regulation (EU) 2016/679 of the European Parliament and of the Council of 27 April 2016 on the protection of natural persons with regard to the processing of personal data and on the free movement of such data (General Data Protection Regulation). Off. J. Eur. Union 2016, L119, 1–88. Available online: https://eur-lex.europa.eu/eli/reg/2016/679/oj (accessed on 6 April 2026).
- European Union. European Green Deal; Communication from the Commission to the European Parliament, the Council, the European Economic and Social Committee and the Committee of the Regions; European Commission: Brussels, Belgium. 2019. Available online: https://www.consilium.europa.eu/en/policies/european-green-deal/ (accessed on 6 April 2026).
- European Union. Regulation (EU) 2024/3012 of the European Parliament and of the Council of 27 November 2024 Establishing a Union Certification Framework for Permanent Carbon Removals, Carbon Farming and Carbon Storage in Products; European Commission: Brussels, Belgium, 2024; Available online: https://eur-lex.europa.eu/eli/reg/2024/3012/oj (accessed on 6 April 2026).
- European Union. Communication from the Commission to the European Parliament, the Council, the European Economic and Social Committee and the Committee of the Regions a Farm to Fork Strategy for a Fair, Healthy and Environmentally-Friendly Food System; COM(2020) 381 Final; European Commission: Brussels, Belgium, 2020; Available online: https://eur-lex.europa.eu/legal-content/EN/TXT/?uri=CELEX%3A52020DC0381 (accessed on 6 April 2026).
- European Union. Communication from the Commission to the European Parliament, the Council, the European Economic and Social Committee and the Committee of the Regions EU Soil Strategy for 2030; COM(2021) 699 Final; European Commission: Brussels, Belgium, 2021; Available online: https://eur-lex.europa.eu/legal-content/EN/TXT/?uri=CELEX%3A52021DC0699 (accessed on 6 April 2026).
- European Union. Regulation (EU) 2021/2115 of the European Parliament and of the Council of 2 December 2021 establishing rules on support for strategic plans to be drawn up by Member States under the common agricultural policy. Off. J. Eur. Union 2021, L435, 1–186. Available online: https://eur-lex.europa.eu/eli/reg/2021/2115/oj (accessed on 6 April 2026).
- European Union. Directive 2000/60/EC of the European Parliament and of the Council of 23 October 2000 establishing a framework for Community action in the field of water policy. Off. J. Eur. Union 2000, L327, 1–73. Available online: https://eur-lex.europa.eu/eli/dir/2000/60/oj (accessed on 6 April 2026).
- European Union. Directive 2008/50/EC of the European Parliament and of the Council of 21 May 2008 on ambient air quality and cleaner air for Europe. Off. J. Eur. Union 2008, L152, 1–44. Available online: https://eur-lex.europa.eu/eli/dir/2008/50/oj (accessed on 6 April 2026).
- European Union. Directive (EU) 2025/2360 of the European Parliament and of the Council of 12 November 2025 on soil monitoring and resilience (Soil Monitoring Law). Off. J. Eur. Union 2025. Available online: https://eur-lex.europa.eu/eli/dir/2025/2360/oj (accessed on 6 April 2026).
- Robinson, N.J.; Dahlhaus, P.G.; Wong, M.; MacLeod, A.; Jones, D.; Nicholson, C. Testing the public–private soil data and information sharing model for sustainable soil management outcomes. Soil Use Manag. 2019, 35, 94–104. [Google Scholar] [CrossRef] [Scilit]
- Lorestani, M.A.; Ranbaduge, T.; Rakotoarivelo, T. Privacy risk in GeoData: A survey. arXiv 2024, arXiv:2402.03612. [Google Scholar] [CrossRef] [Scilit]
- Wang, B.; Li, H.; Ren, X.; Guo, Y. An Efficient Differential Privacy-Based Method for Location Privacy Protection in Location-Based Services. Sensors 2023, 23, 5219. [Google Scholar] [CrossRef] [Scilit] [PubMed]
- Yan, Q.; Lou, J.; Vuran, M.C.; Irmak, S. Scalable Privacy-preserving Geo-distance Evaluation for Precision Agriculture IoT Systems. ACM Trans. Sens. Netw. 2021, 17, 1–30. [Google Scholar] [CrossRef] [Scilit]
- Schweng, S.; Bernardini, L.; Keiblinger, K.; Kaul, H.-P.; Fister, I., Jr.; Lukač, N.; Del Ser, J.; Holzinger, A. What can artificial intelligence do for soil health in agriculture? Comput. Sci. Rev. 2026, 59, 100832. [Google Scholar] [CrossRef] [Scilit]
- Zhao, F.-H.; Zhu, A.-X.; Zhu, L.-J.; Qin, C.-Z. iSoLIM: A similarity-based spatial prediction software for the big data era. Ann. GIS 2024, 30, 535–549. [Google Scholar] [CrossRef] [Scilit]
- Nikou, M.; Tziachris, P. Prediction and Uncertainty Capabilities of Quantile Regression Forests in Estimating Spatial Distribution of Soil Organic Matter. ISPRS Int. J. Geo-Inf. 2022, 11, 130. [Google Scholar] [CrossRef] [Scilit]
- Eurostat. LUCAS 2018: Land Use/Cover Area Frame Survey; Eurostat: Luxembourg, 2018; Available online: https://ec.europa.eu/eurostat/web/lucas (accessed on 6 April 2026).
- Orgiazzi, A.; Ballabio, C.; Panagos, P.; Jones, A.; Fernández-Ugalde, O. LUCAS Soil, the largest expandable soil dataset for Europe: A review. Eur. J. Soil Sci. 2018, 69, 140–153. [Google Scholar] [CrossRef] [Scilit]
- Aschonitis, V.; Bacchetti-De-Gregoris, T.; Prazeres Marques, K.P.; Tziachris, P. An Attempt to Estimate the Annual Number of Soil Samples Analysed for the Private Sector in the European Union; Zenodo: Genève, Switzerland, 2026. [Google Scholar] [CrossRef]
- Sweeney, L. k-anonymity: A model for protecting privacy. Int. J. Uncertain. Fuzziness Knowl.-Based Syst. 2002, 10, 557–570. [Google Scholar] [CrossRef] [Scilit]
- Eurostat. Agricultural Production—Crops; Eurostat: Luxembourg, 2020; Available online: https://ec.europa.eu/eurostat/statistics-explained/index.php?title=Agricultural_production_-_crops (accessed on 6 April 2026).
- Meinshausen, N. Quantile regression forests. J. Mach. Learn. Res. 2006, 7, 983–999. Available online: https://jmlr.org/papers/v7/meinshausen06a.html (accessed on 6 April 2026).
- McBratney, A.B.; Mendonça Santos, M.L.; Minasny, B. On digital soil mapping. Geoderma 2003, 117, 3–52. [Google Scholar] [CrossRef] [Scilit]
- Roberts, D.R.; Bahn, V.; Ciuti, S.; Boyce, M.S.; Elith, J.; Guillera-Arroita, G.; Hauenstein, S.; Lahoz-Monfort, J.J.; Schröder, B.; Thuiller, W.; et al. Cross-validation strategies for data with temporal, spatial, hierarchical, or phylogenetic structure. Ecography 2017, 40, 913–929. [Google Scholar] [CrossRef] [Scilit]
- Jenny, H. Factors of Soil Formation: A System of Quantitative Pedology; McGraw-Hill: New York, NY, USA, 1941; pp. 1–281. [Google Scholar]
- Breiman, L. Random Forests. Mach. Learn. 2001, 45, 5–32. [Google Scholar] [CrossRef] [Scilit]
- Hengl, T.; de Jesus, J.M.; Heuvelink, G.B.M.; Gonzalez, M.R.; Kilibarda, M.; Blagotić, A.; Shangguan, W.; Wright, M.N.; Geng, X.; Bauer-Marschallinger, B.; et al. SoilGrids250m: Global gridded soil information based on machine learning. PLoS ONE 2017, 12, e0169748. [Google Scholar] [CrossRef] [Scilit] [PubMed]
- Padarian, J.; Minasny, B.; McBratney, A.B. Machine learning and soil sciences: A review aimed at assessing the response of soil science to the appearance of machine learning algorithms in its field. SOIL 2020, 6, 35–52. [Google Scholar] [CrossRef] [Scilit]

Disclaimer/Publisher’s Note: The statements, opinions and data contained in all publications are solely those of the individual author(s) and contributor(s) and not of MDPI and/or the editor(s). MDPI and/or the editor(s) disclaim responsibility for any injury to people or property resulting from any ideas, methods, instructions or products referred to in the content. |
© 2026 by the authors. Licensee MDPI, Basel, Switzerland. This article is an open access article distributed under the terms and conditions of the Creative Commons Attribution (CC BY) license.