


Abstract
Grassland lake basins are mostly located in arid and semi-arid regions and represent typical ecologically fragile zones. As a representative inland lake in the cold and arid region of northern China, Hulun Lake serves as a crucial node for maintaining the ecological balance of the Hulunbuir grassland. Studying its ecological carrying capacity is particularly key to implementing the philosophy of a holistic approach to the management of mountains, rivers, forests, farmlands, lakes, grasslands, and deserts. Based on data from 2018 to 2024 across four cities (banners, districts) in the Hulun Lake basin, this study constructs an evaluation system to measure ecological carrying capacity across three dimensions—ecosystem support, human activity pressure, and socio-economic response—using the Pressure–State–Response (PSR) model. Spatial analysis and geodetector methods are employed to explore its spatiotemporal differentiation and influencing factors. The findings are as follows: (1) The ecological carrying capacity in the Hulun Lake basin exhibits a significant spatial differentiation pattern, characterized by a gradient of “high in the east, low in the west; high in pastoral areas, low in urban areas.” (2) The overall trend in ecological carrying capacity shows a slow increase amid fluctuations, but the carrying capacity level remains relatively low. (3) The core driving forces of ecological carrying capacity primarily stem from the dimensions of population quality and infrastructure, while the direct influence of agricultural production is relatively limited. (4) Transportation infrastructure plays a strongly influential role as a driving mechanism of ecological carrying capacity in the Hulun Lake basin. Its synergy with factors such as education, information, and industry significantly affects both the ecosystem support capacity and the socio-economic responses of the basin. This study provides a reference for ensuring the ecological security of the Hulun Lake basin.
1. Introduction
Grassland lakes refer to inland closed or semi-closed water bodies distributed in arid and semi-arid grassland regions, whose hydrological processes and ecological functions are deeply constrained by the surrounding grassland environment. Together with the adjacent grasslands, they form a composite ecosystem characterized by high material circulation and energy exchange [1]. As most are located inland, grassland lakes possess a water balance mechanism that is sensitive to precipitation fluctuations, relatively long water renewal cycles, and a rather fragile ecosystem stability. Their expansion and contraction not only directly depict changes in regional hydrological regimes but also profoundly reflect the compounded impacts of climatic fluctuations and human activities. As critical nodes for biodiversity conservation in arid regions, these basins sustain migratory bird routes, fish habitats, and the productivity of surrounding pastures. Their ecological status directly affects the functioning of regional ecological barriers [2].
With the continuous advancement of regional development, various human activities in grassland lake basins are becoming increasingly intertwined. Pressures such as livestock overgrazing, farmland expansion, industrial development, and urban living continuously accumulate, intensifying the human–land conflict. Therefore, conducting ecological carrying capacity research in grassland lake basins helps quantitatively assess the degree of compatibility between the natural baseline and human disturbances, holding significant research importance for defining resource utilization red lines, regulating industrial structures, and formulating differentiated spatial governance policies.
Carrying capacity was originally a concept in mechanics, referring to the maximum load an object can bear without sustaining any damage, which is measurable through experiments or empirical formulas. Subsequently, the concept was gradually introduced into ecology and regional systems research [3]. From the 1960s to the 1970s, with the emergence of global issues such as resource depletion and environmental degradation, humanity gradually recognized the crucial role ecosystems play in their own survival. Against this backdrop, the scope of carrying capacity research rapidly expanded to encompass entire ecosystems. Compared to the concept of simple environmental capacity, ecological carrying capacity research places greater emphasis on analyzing the impacts of environmental changes and human activities on ecosystems [4].
In recent years, scholarly research in this area has grown considerably. From the perspective of assessment and calculation, there are primarily three methods for evaluating ecological carrying capacity. The first involves constructing an evaluation indicator system based on models. By successively introducing elements such as regional development baselines, driving forces, environmental impacts, and ecosystem services, models like “Baseline–Pressure–State–Response (BPSR)” [5], “Driving–Pressure–State–Response (DPSR)” [6], and “Driving Forces–Pressure–State–Impact–Response (DPSIR)” [7] have been developed. These models enable a comprehensive depiction of a regional ecosystem, establishing an evaluation of the cause-and-effect chain, assigning different weights, and ultimately assessing the level of ecological carrying capacity. The second method is based on the ecological footprint approach, introducing two key factors—equivalence factors and yield factors—to calculate ecological carrying capacity while also assessing the ecological footprint [8], supplemented by ecological surplus and deficit, and finally calculating a regional sustainable development index [9], allowing for an overall grasp of the region’s sustainability. The third method involves assessing ecological security. Based on calculations of regional ecological health indices, ecological risk indices, and ecosystem service function indices, this method maps the level of regional ecological carrying capacity, considering the ecosystem’s resilience to risks, service supply capacity, and health status [10].
In terms of research content, the subjects of evaluation are diverse. Regarding natural resources, research mainly focuses on grasslands, farmlands, forest lands, and water resources, calculating the occupation of aboveground productivity by the region’s primary ecological service functions, analyzing the capacity of different land and water body types to support agricultural and pastoral development, and assessing the significant impacts of population growth and economic development on the ecological carrying capacity of natural systems [11,12,13,14]. In terms of human resources, related research primarily concentrates on calculating ecological carrying capacity in areas closely linked to human activities, such as beautiful villages, smart cities, and tourist attractions. This involves evaluating the influencing factors of ecological carrying capacity while adhering to regional ecological security baselines and constructing high-quality, ecologically sound civilization development paths, accurately reflecting the degree of coordinated development between ecosystems and socio-economic activities in human settlement areas [15,16,17].
In summary, the current research on water resources’ ecological carrying capacity pays relatively little attention to grassland lake basins, and the development of statistical indicators is also relatively scarce. Moreover, grassland lake basins are often convergence zones for various human activities, where animal husbandry, agriculture, mineral resource exploitation, and other activities are spatially intertwined and temporally accumulated. The pressure on many basins’ ecosystems far exceeds what can be explained by a single disturbance, rendering them highly significant for research. In the Hulun Lake basin, the New Barag Left Banner and Right Banner are predominantly focused on animal husbandry, bearing the prominent contradiction between livestock numbers and grassland degradation, while Manzhouli City and Jalainur District are oriented towards industrialization and urbanization, facing the dual pressures of energy consumption, emissions, and the compression of ecological space. The basin exhibits strong spatial heterogeneity and diverse types of pressure.
Therefore, this paper conducts an ecological carrying capacity evaluation analysis based on the Pressure–State–Response (PSR) model for environmental assessment. First, it reveals the spatiotemporal evolution characteristics of the ecological carrying capacity from three dimensions: Ecosystem Support (S), Human Activity Pressure (P), and Socio-economic Response (R). Second, it employs geodetectors for single-factor detection and interaction detection analysis to identify the main influencing factors. The study aims to reveal the spatiotemporal evolution patterns and key influencing factors in the Hulun Lake basin, thereby providing a reference for the sustainable development of the basin.
2. Materials and Methods
2.1. Study Area Overview
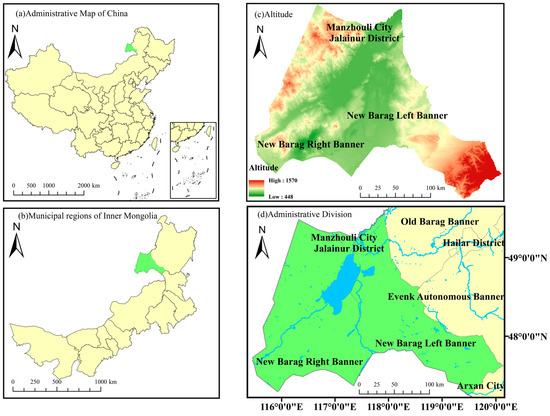
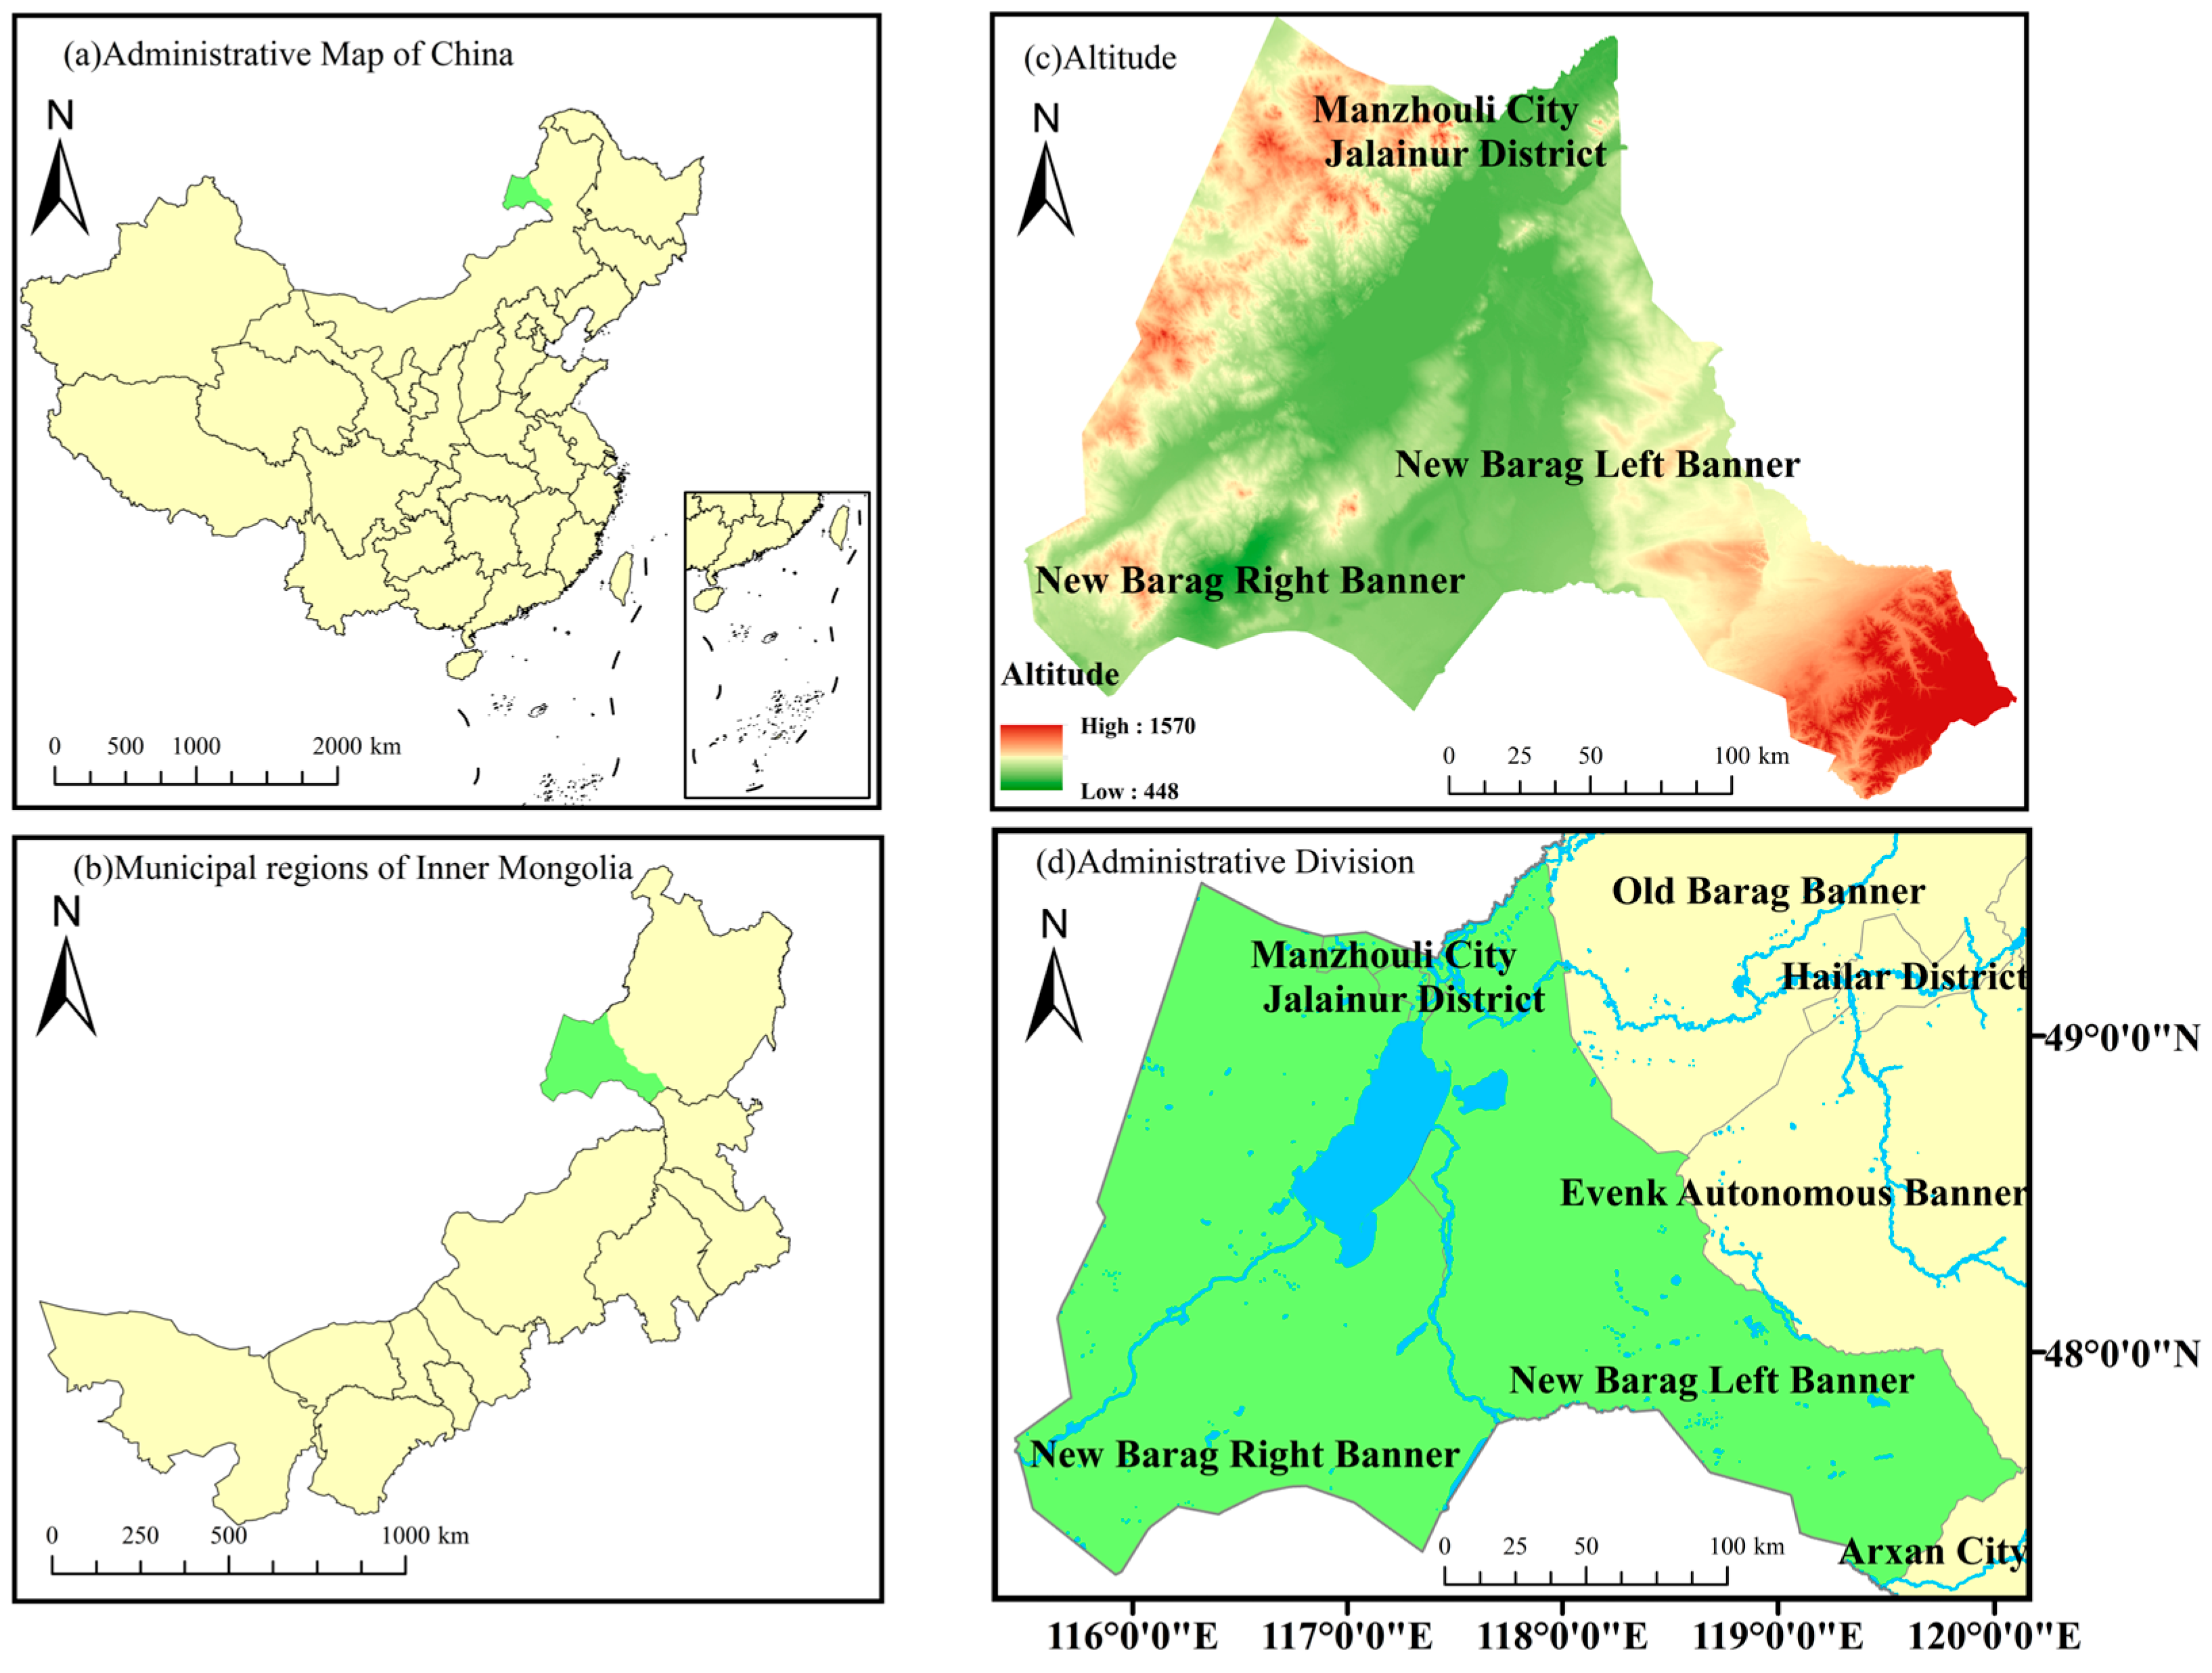
Hulun Lake, also known as Dalai Lake, is the largest lake in the Inner Mongolia Autonomous Region and the fifth largest inland lake in China. The Hulun Lake basin (115°31′–120°12′ E, 47°10′–49°50′ N) is located in the northeastern part of the Inner Mongolia Autonomous Region, on the Hulunbuir Grassland at the western foot of the Greater Khingan Range. The western and southern parts of the basin border Mongolia, while the northern part adjoins Russia. Its administrative divisions encompass Manzhouli City, Jalainur District, New Barag Left Banner, and New Barag Right Banner. The topography generally features higher elevations in the east and lower elevations in the west, dominated by plateau depressions and low mountains and hills. The vegetation primarily consists of meadow steppe and typical steppe, with overall high vegetation coverage. The basin experiences a typical temperate continental monsoon climate, with an annual average temperature ranging from 0 to 3 °C, an annual average wind speed of 3.4 m/s, an accumulated temperature of 1900–2300 °C (≥10 °C), and an annual sunshine duration of 2600–2800 h [18]. Seasonal temperature variations are significant. Winters are cold and long, with an average January temperature as low as −22 °C and a frost-free period of approximately 110 days; summers are mild and short, with the highest average temperature occurring in August at about 18.5 °C. Total precipitation is relatively low with uneven spatiotemporal distribution, ranging from 200 to 300 mm annually. Spatially, precipitation decreases from northeast to southwest, and it is concentrated from June to September, demonstrating marked seasonality [19]. The waters of Hulun Lake and its surrounding wetlands play an irreplaceable role in maintaining the ecological environment of the Hulunbuir Grassland and supporting regional sustainable socio-economic development (Figure 1).
Figure 1.
Schematic map of the geographical location of the Hulun Lake Basin.
2.2. Indicator System Construction
The PSR model, the Pressure-State-Response model, is grounded in the logic that humans impose pressure (P) on the natural environment through their pursuit of survival and development, leading to changes in the existing state of the environment and the quantity of resources (S). In response, humans adopt corresponding regulatory measures (R) to mitigate the impact of pressure and restore environmental health. Owing to its rigorous logic and broad applicability, the model has been extensively applied in the field of ecology and environment. The PSR model treats human activities as interfering factors to explore the causal relationship between environmental pressure and ecosystem degradation. The ecosystem of the Hulun Lake basin is subject to disturbances of varying types and intensities, which align closely with the inherent logic of the PSR model [20]. Based on this theoretical framework and considering both scientific validity and data availability, this study, taking into account the specific characteristics of the Hulun Lake basin, selects 29 indicators to construct an ecological carrying capacity evaluation system from three dimensions: Human Activity Pressure (P), Ecosystem Support Capacity (S), and Socio-Economic Response (R) (Table 1).
Table 1.
Ecological carrying capacity evaluation index system for Hulun Lake Basin.
Given that the Hulun Lake basin is located in an arid and semi-arid grassland region, its lake hydrological processes are closely linked to the surrounding grassland’s ecology. The water resource endowment and rangeland conditions jointly determine the carrying capacity of the ecosystem. Therefore, in the dimension of ecosystem support capacity, land resources and climate resources are selected as secondary indicators to reflect the foundational effect of soil–water conditions and climatic background on the carrying capacity. Furthermore, additional indicators for ecological construction and restoration are introduced to capture the contribution of human intervention to the positive regulation of the natural system. In the dimension of human activity pressure, animal husbandry is the primary activity in the Hulun Lake basin, and livestock numbers are directly related to the balance between grassland carrying capacity and stocking rate. Hence, a separate indicator for livestock carrying pressure is established. Meanwhile, agricultural non-point source pollution, resource consumption, and industrial scale reflect the multiple disturbances of crop farming and industrial activities on the soil and water environment of the basin, thereby aligning with the industrial structure of the basin, which is characterized by “dominant animal husbandry, integration of farming and animal husbandry, and coexistence with industrial and mining activities.” In the dimension of socio-economic response, economic output and benefits reflect the level of regional development; residents’ living standards and social security reflect social welfare and vulnerability; environmental quality represents the effectiveness of ecological governance; and output efficiency measures the sustainability of development from the perspective of resource utilization. Together, these enable the evaluation system to comprehensively reflect the interactions between the socio-economic system and the natural ecosystem in the Hulun Lake basin.
2.3. Research Methods
2.3.1. Entropy Method
The entropy method, based on objective weighting, is used to comprehensively evaluate the ecological carrying capacity and its subsystems. Specifically, the raw data are first standardized to eliminate dimensional effects. Then, the proportion of sample values under each indicator is calculated, and the information entropy of each indicator is obtained. Finally, the coefficient of difference is calculated through information entropy, and the objective weight of each indicator is obtained by normalization, thereby effectively avoiding biases caused by subjective weighting [21]. The specific calculation procedure is as follows:
First, the indicators were standardized by converting each indicator value into a dimensionless relative value normalized within the range of [0, 1]. Zero values among the indicators were assigned a value of 0.0001.
For positive indicators:
For negative indicators:
Secondly, a standardized matrix was constructed on this basis, and the proportion of each indicator was calculated:
Finally, the entropy value and the redundancy of indicator were calculated:
where
On this basis, the weight of indicator was calculated:
Finally, the ecological carrying capacity score was calculated:
2.3.2. Natural Breaks Classification
Also known as the natural breaks method, natural breaks classification is a classification technique based on the inherent distribution characteristics of data. Proposed by the American geographer George F. Jenks, it is widely used in geographic information systems, spatial data analysis, and cartographic visualization. Its core principle is to identify “natural” groupings in a data sequence through an algorithm, minimizing differences within each group while maximizing differences between groups. Specifically, the method calculates and compares the goodness-of-fit variance under different classification schemes, selecting breakpoints that minimize the sum of within-group variances and maximize the sum of between-group variances, thereby achieving optimal classification. This paper uses this method to analyze the spatial evolution of the three dimensions—Human Activity Pressure, Ecosystem Support Capacity, and Socio-Economic Response—and to classify the levels of ecological carrying capacity (Table 2).
Table 2.
Classification criteria for ecological carrying capacity in Hulun Lake Basin.
2.3.3. Geodetector
Geodetector (GD), a tool for analyzing the influence of geographical factors on phenomena, primarily possesses four abilities: interaction detection, differentiation detection, risk area detection, and ecological factor detection. It can effectively detect the spatial differentiation of a region and reveal its underlying driving factors. This paper mainly employs interaction detection and single-factor detection to analyze the driving factors affecting the ecological carrying capacity of the Hulun Lake basin and its subsystems. The core objective of interaction detection is to determine whether the explanatory power of two influencing factors on ecological carrying capacity is enhanced or weakened when they act synergistically. Factor detection, on the other hand, uses the q-statistic to quantitatively assess the explanatory power of a single influencing factor [22].
In the calculation process of the Geodetector employed in this study, each continuous variable among the driving factors was discretized using five distinct methods: Equal Interval, Natural Breaks, Quantile, Geometric Interval, and Standard Deviation. For each continuous variable, combinations of classification numbers across all these methods were systematically attempted. Subsequently, the optimal discretization method was selected based on the magnitude of the q-value—representing the model’s explanatory power—and the corresponding significance level. The results derived from the optimal method were retained for subsequent analysis.
2.4. Data Sources
Data regarding the five categories of land area utilized in this study were obtained from the Land Survey Results Sharing and Application Service Platform of the Ministry of Natural Resources of the People’s Republic of China (https://gtdc.mnr.gov.cn/Share#/ (accessed on 15 March 2026)). Data on emissions were sourced from the National Tibetan Plateau Scientific Data Center (https://data.tpdc.ac.cn/home (accessed on 15 March 2026)). Data on emissions were derived from the Emissions Database for Global Atmospheric Research (EDGAR) (https://edgar.jrc.ec.europa.eu/ (accessed on 15 March 2026)). Specifically, annual grid maps were exported from EDGAR and processed using ArcGIS 10.8.1 software. County-level administrative division vector data for China were employed as spatial masks, and total emissions were calculated by weighted summation based on the actual coverage area of each grid cell within the administrative boundaries. Finally, spatial geometric attributes were removed, and the multi-year cross-sectional data were longitudinally merged to generate a structured long-panel dataset.
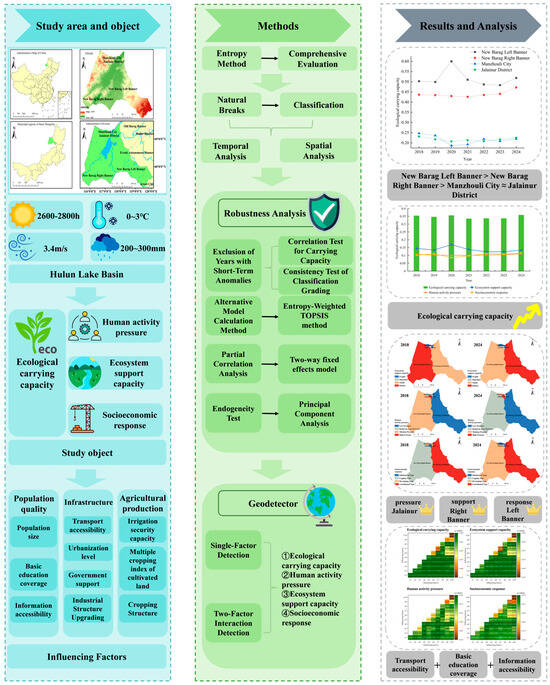
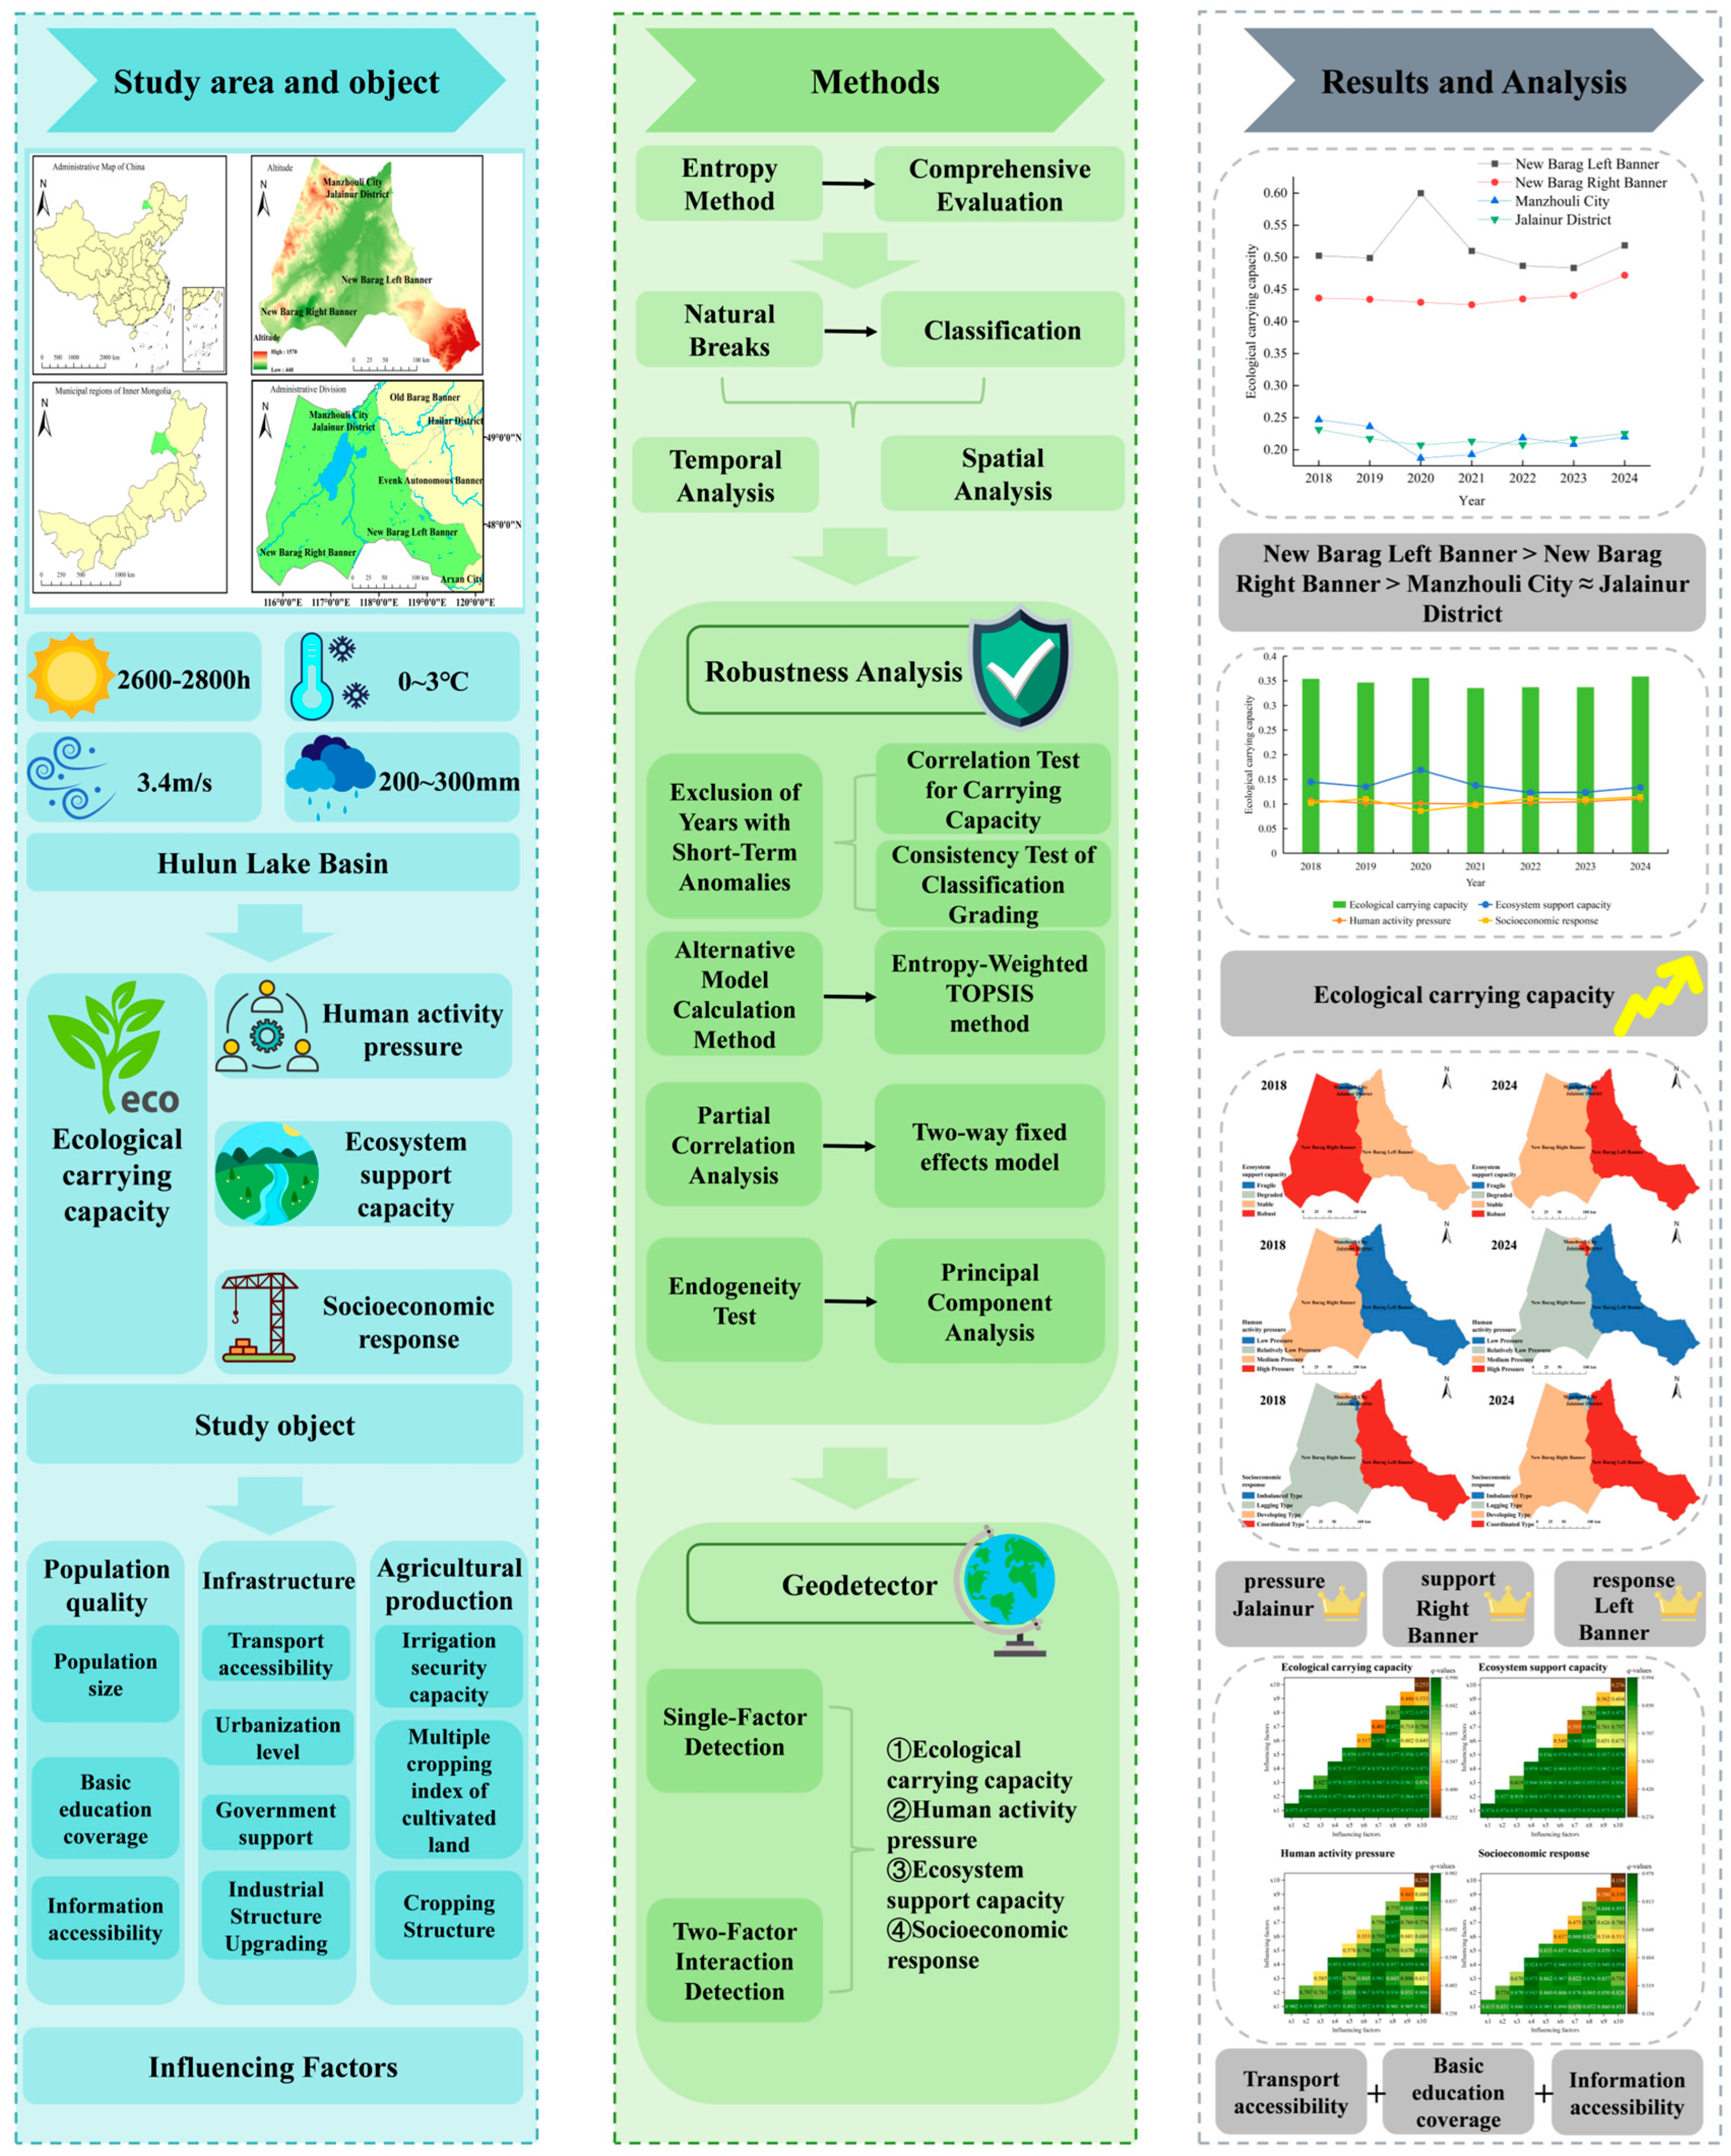
All other data not specified above were extracted from the Hulunbuir Statistical Yearbook (https://tjj.hlbe.gov.cn/ (accessed on 15 March 2026)) and the Inner Mongolia Statistical Yearbook (https://tj.nmg.gov.cn/ (accessed on 15 March 2026)). Missing data points were imputed using linear interpolation. The methodological flowchart of this study is presented below (Figure 2).
Figure 2.
Overall research flowchart.
3. Results and Analysis
3.1. Measurement Results of Ecological Carrying Capacity
Based on the indicator system and research methods constructed above, the ecological carrying capacity levels of the Hulun Lake basin from 2018 to 2024 were calculated (Table 3).
Table 3.
Evaluation results of ecological carrying capacity in Hulun Lake Basin.
The results show that the ecological carrying capacity of the Hulun Lake basin exhibits a relatively clear spatial differentiation pattern. Among the four areas, New Barag Left Banner has the highest carrying capacity, consistently remaining at a relatively high or higher level for a long period, reaching a peak in 2020, and jumping to a high carrying capacity, making it an important support area for the ecological carrying capacity of the Hulun Lake basin. New Barag Right Banner ranks second, mainly at a critical carrying level, and has improved to a relatively high carrying capacity since 2023, gradually transitioning from Class III to Class IV, indicating a favorable improving trend. Manzhouli City and Jalainur District have relatively low carrying capacities, remaining at low and relatively low levels for a long time, with their carrying capacity levels fluctuating between Class I and Class II, representing areas with high ecological pressure across the entire basin. Therefore, the ecological carrying capacity of the Hulun Lake basin presents a relatively clear “core–periphery” structure: New Barag Left Banner is the ecological core area with strong carrying capacity; New Barag Right Banner is the ecological transition area with moderate carrying capacity and showing an improving trend; and Manzhouli City and Jalainur District are ecologically fragile areas with the lowest carrying capacity and limited improvement.
Considering the actual development of the basin, New Barag Left Banner is located at the western foot of the Greater Khingan Range and the eastern shore of Hulun Lake. It is rich in river, lake, and wetland resources and has high-quality grasslands. As an important ecological barrier area of the basin, its natural endowment advantages support a high carrying capacity. Similarly, New Barag Right Banner is situated on the western shore of Hulun Lake and within the Kherlen River basin, with grassland animal husbandry as the leading industry. The pressure of livestock grazing on grasslands is relatively high. Its moderate carrying capacity reflects the dynamic balance between livestock production and ecological protection. In recent years, thanks to the continuous implementation of the grassland ecological protection subsidy and reward policy, the grazing withdrawal and grassland restoration project, and the comprehensive management project of the Hulun Lake basin, the ecological carrying capacity has improved.
Manzhouli City and Jalainur District, areas with a high concentration of urbanization, industry, and mining, have a high proportion of built-up areas and significantly more compressed natural ecological space compared to the previous two areas. Coupled with intensive industrial energy consumption, high pollutant emission intensity, and relatively limited space for ecological restoration due to high urbanization levels, policy effects are difficult to fully reflect in the carrying capacity index. As a result, the ecosystem support capacity is significantly weakened, and the carrying capacity has remained low for a long time.
Therefore, future ecological management in the basin should implement precise measures: carry out preventive protection in high-carrying areas, strengthen ecological restoration in low-carrying areas, and especially increase support for industrial and mining ecological restoration and green transformation in Manzhouli City and Jalainur District, so as to narrow the regional ecological carrying capacity gap and achieve sustainable development of the entire basin.
3.2. Temporal Analysis of Ecological Carrying Capacity
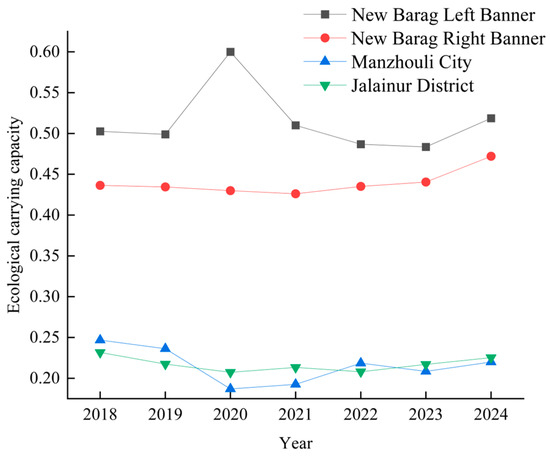
To better understand the dynamic trends of ecological carrying capacity in each county and district of the Hulun Lake basin, a time series line chart was drawn for the four areas based on the above measurement results (Figure 3).
Figure 3.
Dynamic trends of ecological carrying capacity in various counties and districts of the Hulun Lake Basin.
Overall, New Barag Right Banner, with an average annual growth rate of 1.32%, is a region with a relatively rapid increase in carrying capacity over this seven-year period, reflecting the remarkable effectiveness of its ecological governance, with the positive effects of the grassland–livestock balance policy and grassland restoration projects being continuously observed. Although New Barag Left Banner maintained the highest carrying capacity level, its average annual growth rate was only 0.53%, significantly lower than that of the Right Banner. The reason may be that it is already approaching the upper limit of its carrying potential, with relatively limited room for further growth. Manzhouli City and Jalainur District showed negative growth. Manzhouli City, in particular, experienced an average annual decline of 1.90%, with its carrying capacity continuously decreasing, highlighting the difficulty of ecological improvement in urban and industrial–mining areas.
In terms of stages, from 2018 to 2021, the carrying capacity of Manzhouli City and Jalainur District declined sharply, with Manzhouli City dropping by 21.97%. New Barag Right Banner also saw a slight decline of 2.36% during the same period, indicating an overall pressure-bearing trend in the basin at that stage. From 2021 to 2024, New Barag Right Banner achieved a significant increase of 10.77%, showing a relatively outstanding regional performance. Although Manzhouli City and Jalainur District recovered somewhat, the magnitude of recovery was far lower than the previous decline, and they have still not returned to their 2018 levels. New Barag Left Banner maintained moderate growth, continuing its high-level stable trend.
In terms of fluctuation, the coefficients of variation for New Barag Right Banner and Jalainur District were both below 4%, indicating strong stability. A possible reason for this stability in the Right Banner is that its livestock-dominated industrial structure has relatively small fluctuations, and policy interventions have remained consistent in recent years. The low fluctuation in Jalainur District may reflect that its carrying capacity has been low for a long time, lacking the momentum for upward development, but it has also not experienced severe deterioration. New Barag Left Banner and Manzhouli City experienced the greatest fluctuations among the four areas, reflecting the sensitivity of the Left Banner, as an ecological core area, to human activities and climate fluctuations, as well as the fragile response of the ecological carrying capacity of Manzhouli City’s industrial–mining area to external disturbances.
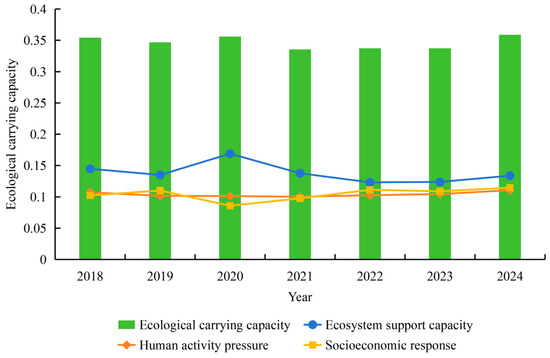
To better grasp the overall change trends in the Hulun Lake basin, the evolution of ecological carrying capacity and its subsystems are plotted (Figure 4).
Figure 4.
Evolution of subsystems of ecological carrying capacity in the Hulun Lake Basin.
The overall trend in the evolution of the ecological carrying capacity in the Hulun Lake basin shows slow growth amid fluctuations, but the carrying capacity level remains relatively low overall, with an average annual compound growth rate of 0.22%, lower than the regional growth level of New Barag Right Banner within the basin during the same period, indicating that the improvement rate of the basin’s overall carrying capacity is relatively slow and constrained by the long-term low levels of Manzhouli City and Jalainur District. In terms of annual fluctuations, the ecological carrying capacity has undergone an evolution process of “stability–rise–decline–recovery”.
Examining the evolution of each subsystem, the ecosystem support capacity fluctuates relatively sharply, human activity pressure continues to rise, and the socio-economic response is steadily improving. The ecosystem support capacity is the only subsystem showing a negative trend. Its evolution is characterized by a peak followed by a decline. It reached a peak in 2020, then declined rapidly, dropped to a low level in 2022–2023, and rebounded slightly in 2024. The drastic fluctuation in support capacity may have been directly affected by climatic conditions during the same period that were related to the annual precipitation and the expansion and contraction of the water area. Notably, even after the rebound at the end of the period, the support capacity was still 7.6% lower than at the base period, indicating that the trend of degradation of the natural environment in the Hulun Lake basin has not yet been fundamentally reversed. Human activity pressure shows a steady upward trend, reaching its highest value at the end of the period, an increase of 3.1% from the base period.
The continuous rise in pressure indicates that the intensity of human activities such as agricultural non-point source pollution, industrial energy consumption, and livestock grazing on the ecosystem is increasing year by year. However, from the temporal characteristics, it can be seen that the pressure score was relatively low in 2020–2021, possibly related to the slowdown in economic activities during the pandemic. Thereafter, pressure rebounded quickly, reflecting the pressure rebound on the ecological environment caused by the resumption of production activities after the pandemic. This trend contrasts with the slow overall growth in ecological carrying capacity; the continuous rise in human activity pressure is gradually offsetting the positive contributions brought about by the improvement in ecosystem support capacity.
The socio-economic response, as the fastest-growing and most stable subsystem among the three, shows a trend of first decreasing and then increasing, reflecting the basin’s positive progress in ecological protection investment, industrial structure adjustment, and improvements in people’s livelihood. The low value in 2020 may also be related to the temporary decline in economic indicators due to the pandemic’s impact. The subsequent sustained increase indicates that the in-depth advancement of the comprehensive management project of the Hulun Lake basin, the green industry transformation, and the continuous implementation of ecological compensation policies have begun to yield results.
It is worth noting that the peak in support capacity in 2020 drove the carrying capacity to its peak, while the sharp drop in support capacity in 2021 led to the trough in carrying capacity, indicating a certain positive correlation between ecosystem support capacity and ecological carrying capacity, confirming the critical influence of changes in natural endowment on the level of ecological carrying capacity in the basin. Similarly, the socio-economic response reached a record high in 2024 and drove the recovery of ecological carrying capacity, which also reflects the important contribution of an active human response to the improvement of the basin’s carrying capacity. Therefore, the overall improvement of the ecological carrying capacity in the Hulun Lake basin still faces the dual squeeze of natural background degradation and rising human pressure. The positive effects of the socio-economic response need to be further transformed into substantial improvements in support capacity.
3.3. Spatial Analysis of Subsystems of Ecological Carrying Capacity
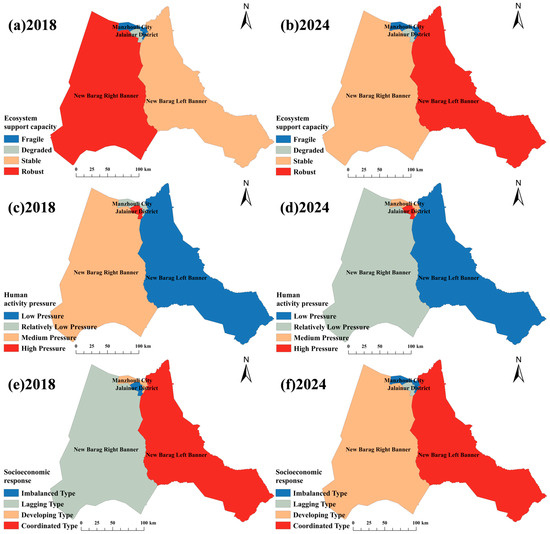
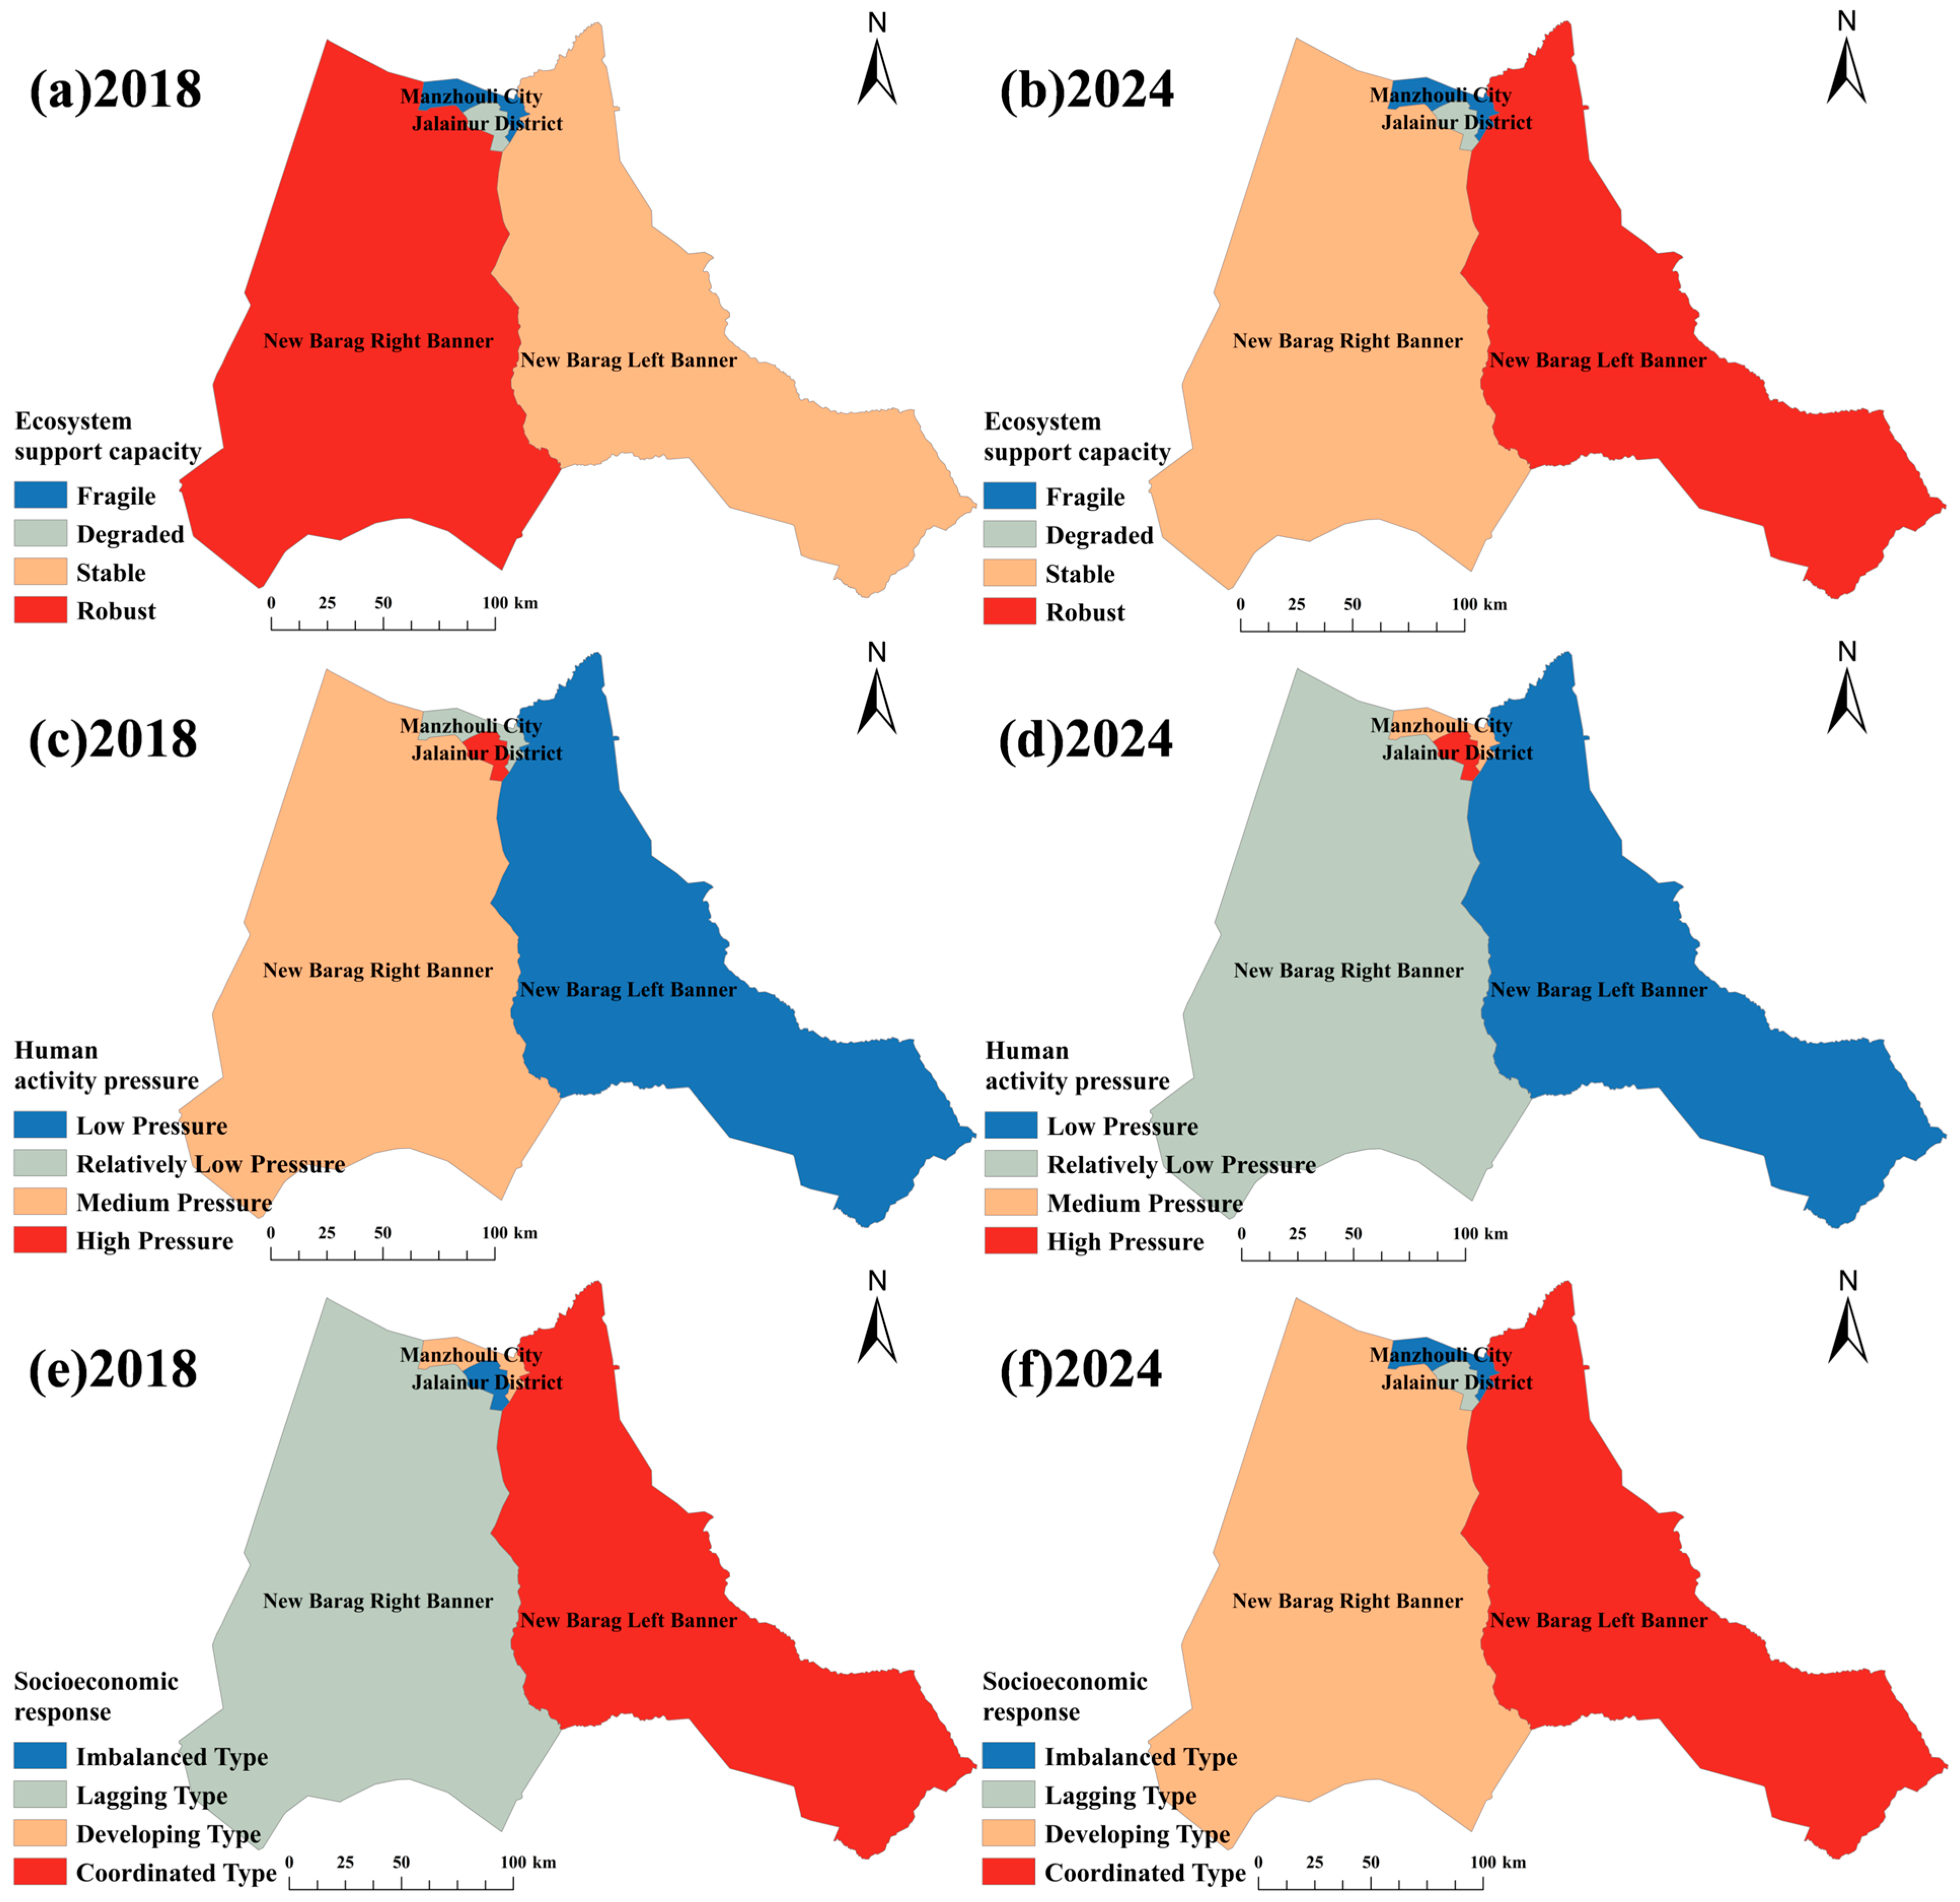
Furthermore, to better grasp the spatial evolution trends of each subsystem, the Natural Breaks method in ArcGIS 10.8.1 software was used to classify the Ecosystem Support Capacity, Human Activity Pressure, and Socio-Economic Response in 2018 and 2024 into four types of zones from high to low (Table 4), and their spatial patterns were visually extracted (Figure 5).
Table 4.
Description of spatial characteristics of each subsystem.
Figure 5.
Spatial evolution of subsystems of ecological carrying capacity in the Hulun Lake Basin.
From the perspective of ecosystem support capacity, New Barag Left Banner jumped from stable to robust, New Barag Right Banner fell from robust to stable, and Jalainur District and Manzhouli City have long remained at the degraded and fragile levels, respectively, forming a spatial evolution pattern characterized by a role reversal between the left and right banners and a low-level lock-in for urban and industrial–mining areas. New Barag Left Banner is located in the transitional zone between the eastern shore of Hulun Lake and the western foot of the Greater Khingan Range. This area has relatively abundant river, lake, and wetland resources. When precipitation conditions improve or upstream inflow increases, the expansion of water area and restoration of wetland ecological functions can receive priority replenishment. Coupled with the remarkable effectiveness of ecological restoration projects such as grazing withdrawal and grassland restoration and the comprehensive management of Hulun Lake implemented in the Left Banner in recent years, these factors have jointly promoted the improvement of land resources and ecological construction, allowing its natural advantages to be fully released.
In contrast, although New Barag Right Banner is also located in a pastoral area, its location on the western shore and the Kherlen River basin may make it more sensitive to reduced upstream inflow and lake level fluctuations, causing its original robust level to fall back to a stable level. It is worth noting that Jalainur District and Manzhouli City, as the core areas of urbanization, industrialization, and mining within the basin, have their natural ecological spaces severely compressed by built-up areas and extraction land. Even if climatic conditions improve or ecological restoration projects advance, their recoverable ecological space remains limited, and the marginal benefits of restoration may be lower than those of large-scale grassland improvement in pastoral areas, resulting in the two districts being locked into degraded and fragile levels for a long time.
From the perspective of human activity pressure, New Barag Right Banner achieved a reduction in pressure level, optimizing from medium to relatively low, making it the area with the most significant improvement in human activity pressure within the basin. Thanks to the continuous deepening of the grassland–livestock balance policy and the effective implementation of the grassland ecological protection subsidy and reward mechanism in recent years, the disturbance intensity of livestock husbandry on grasslands has significantly decreased, and the pressure on the ecosystem has been alleviated. Therefore, it can be seen that in pastoral-dominated regions, policy intervention and green transformation of production methods provide considerable room for regulation and potential to cause an improvement in human activity pressure.
In stark contrast, Manzhouli City rose from relatively low pressure to medium pressure, with its pressure level gradually deteriorating. As a border port city between China and Russia, Manzhouli City serves as a regional trade hub and energy processing base, with an industrial structure dominated by industry and commerce. Some pressure indicators are sensitive to fluctuations in economic activity. The increase in pressure level may be attributed to intensified industrial production, increased logistics and transportation activity, and increased domestic emissions due to urban population agglomeration, leading to a higher intensity of human disturbance to the ecosystem.
From the perspective of socio-economic response, New Barag Left Banner continues to maintain a coordinated level, forming a synergistic relationship of positive interaction between economic development and ecological protection. This indicates that its industrial scale is moderate with low disturbance intensity, per capita disposable income is growing steadily, the gross output value of agriculture, forestry, animal husbandry, and fishery has achieved sustainable improvement under ecological constraints, and environmental quality indicators are better than those in other areas. As an ecological barrier area of the Hulun Lake basin, its functional positioning determines that its development model should be oriented towards ecological priority, allowing it to maintain a coordinated state in the socio-economic response dimension for a long time. New Barag Right Banner jumped from lagging to developing, indicating that its animal husbandry has begun to transition from quantity expansion to quality and efficiency transformation. The comprehensive management project of the Hulun Lake basin has achieved remarkable results, and government support has gradually increased, enabling the Right Banner to achieve steady improvement in economic output while maintaining its ecological foundation.
However, it is worth noting that improvements in socio-economic response in Jalainur District and Manzhouli City have been more difficult. The transformation process for resource-based urban areas remains long. Moving from lagging to development or even to a coordinated approach will require sustained structural reforms and policy support to promote deep adjustment of the industrial structure and the fundamental transformation of governance models to reverse the trend of deterioration. Therefore, the Hulun Lake basin should comprehensively enhance its response capacity, consolidate its coordination advantages, explore mechanisms for realizing the value of ecological products, transform ecological advantages into economic advantages, deepen green transformation on the basis of development, and prevent growth inertia from squeezing ecological space.
3.4. Robustness Analysis of Ecological Carrying Capacity
3.4.1. Exclusion of Years with Short-Term Anomalies
- (1)
- Correlation Test for Carrying Capacity
To avoid bias introduced by exceptional years and ensure the robustness of the results, the data for 2020, which exhibited substantial fluctuation, were excluded. The original ecological carrying capacity and the recalculated ecological carrying capacity after removing the 2020 data were obtained, along with their Pearson correlation coefficient (Table 5).
Table 5.
Correlation test for carrying capacity.
The carrying capacity indices for all regions before and after exclusion exhibited a strong positive correlation (r > 0.91, p < 0.01), indicating that the short-term anomaly in 2020 did not alter the relative ranking or overall trend of regional carrying capacity during the study period. The findings thus demonstrate a certain degree of robustness, and the short-term disturbance did not materially affect the research conclusions.
- (2)
- Consistency Test of Classification Grading
Based on the Natural Breaks classification method, the grading standards for ecological carrying capacity in the Hulun Lake Basin were established. The ecological carrying capacity classifications before and after the exclusion of 2020 data were compared accordingly (Table 6).
Table 6.
Consistency test of classification grading.
Following the exclusion of the year 2020 as a short-term anomaly, the carrying capacity grades for some regions underwent changes; however, the relative ranking among regions remained New Barag Left Banner > New Barag Right Banner > Manzhouli City ≈ Jalainur District. Similarly, the temporal trends in carrying capacity continued to exhibit a pattern of high stability in the Left Banner, steady improvement in the Right Banner, and persistent low-level fluctuation in the urban districts. The research findings remained highly consistent before and after the exclusion, thereby confirming the robustness of the results.
3.4.2. Alternative Model Calculation Method
The ecological carrying capacity was recalculated using the Entropy-Weighted TOPSIS Model. The Entropy-Weighted TOPSIS method integrates the Entropy Weight Method with the TOPSIS (Technique for Order Preference by Similarity to Ideal Solution) approach. In contrast to traditional subjective weighting methods that rely on expert judgment, the Entropy Weight Method determines weights objectively based on the intrinsic information content of the data, thereby generating a new weighted matrix. Subsequently, the comprehensive evaluation score for each sample was computed following the standard TOPSIS procedure, effectively combining the objectivity of entropy weighting with the comparative strengths of TOPSIS.
Similarly, the Pearson correlation coefficient between the ecological carrying capacity scores derived from the two methods was 0.477 (p < 0.01), indicating a significant positive correlation. Furthermore, the relative ranking among regions remained New Barag Left Banner > New Barag Right Banner > Manzhouli City ≈ Jalainur District. Consequently, the original conclusions are considered robust.
3.4.3. Partial Correlation Analysis Controlling for Pandemic Intensity
In the preceding analysis, the pandemic exerted a certain influence on socio-economic activities, which in turn caused relatively pronounced fluctuations in the ecological carrying capacity and its subsystem scores during specific years. This introduced potential bias in the estimated contribution of “Socioeconomic response” to ecological carrying capacity. To ensure the robustness of the results and mitigate the interference of external factors, subject to data availability, this study selected the number of unemployed individuals, fiscal deficit, and per capita GDP as proxy variables for pandemic intensity. The Entropy Method was employed to calculate a composite score representing the magnitude of pandemic impact, which was subsequently introduced as a control variable.
Furthermore, a two-way fixed effects model within an econometric regression framework was applied to conduct the regression analysis, thereby facilitating a partial correlation analysis among these variables (Table 7).
Table 7.
Regression analysis results.
The regression results indicate that after incorporating the control variable for pandemic intensity, both the regression coefficient of “Socioeconomic response” on ecological carrying capacity and its level of significance increased. This finding suggests that pandemic interference constitutes an important confounding factor. Following the control for pandemic interference, the regression coefficient remained significantly positive, thereby affirming the robustness of the core conclusion.
3.4.4. Endogeneity Test
Principal Component Analysis (PCA) was employed to reduce the dimensionality of the data, thereby mitigating potential bias in the measurement of ecological carrying capacity arising from multicollinearity among indicators. The ecological carrying capacity levels derived from PCA were subsequently compared with those obtained via the Entropy Weight Method to verify whether the original analysis might have been compromised by collinearity issues.
Specifically, Pearson correlation coefficients were first computed for 29 indicators. After excluding six indicators exhibiting relatively low correlations, Bartlett’s Test of Sphericity yielded a p-value of 0.000, and the Kaiser–Meyer–Olkin (KMO) measure of sampling adequacy was 0.665. These results confirm the existence of a certain degree of correlation among the remaining variables, thereby validating the suitability of the data for principal component analysis (Table 8).
Table 8.
Principal component factor characteristics.
The original basic indicators were ultimately consolidated into five new composite indicators, namely, five principal component factors extracted and designated as P1, P2, P3, P4, and P5. These five principal components collectively account for 92.30% of the total variance in the original data, indicating that they can effectively replace the original indicators in the analysis of ecological carrying capacity levels.
The ecological carrying capacity score was calculated based on the five indicators derived from Principal Component Analysis (PCA) and subsequently compared with the results obtained using the Entropy Weight Method. The Spearman correlation coefficient between the two sets of scores was 0.801 (p < 0.01), indicating a strong and statistically significant positive correlation. Moreover, the ranking of carrying capacity grades remained unchanged. Therefore, the findings are consistent with the original analysis presented in this study. The ecological carrying capacity results were not materially altered by correlations among the original indicators, confirming the robustness of the conclusions.
3.5. Analysis of Influencing Factors of Ecological Carrying Capacity
3.5.1. Selection of Influencing Factors
The steady improvement of ecological carrying capacity is not only an important factor in building a Beautiful China but also a pragmatic choice for enhancing the level of ecological governance. This study uses geodetectors to identify the influencing factors of ecological carrying capacity and its subsystems in the Hulun Lake basin. Based on a review of existing research results [23,24,25] and considering the actual development situation of the Hulun Lake basin, ten influencing factors are selected from three dimensions—population quality, infrastructure, and agricultural production—and their impact on ecological carrying capacity is analyzed (Table 9).
Table 9.
Selection of ecological carrying capacity and its subsystem driving factors in Hulun Lake Basin.
Population quality reflects regional human capital stock and residents’ environmental awareness, determining the technical efficiency and ecological friendliness of production and lifestyle patterns. Higher population quality can facilitate the adoption of resource-saving production models and reduce the ecological footprint per unit of output. The infrastructure dimension reflects the regional spatial organization efficiency and public resource allocation capacity, determining the spatial pattern of resource flow, industrial agglomeration, and ecological governance. Well-developed infrastructure can improve resource utilization efficiency, while government support is directly related to ecological protection investment and policy implementation effectiveness. The agricultural production dimension focuses on land use intensity and technology choices of the dominant industry in the basin, directly depicting the disturbance intensity and pressure characteristics of farming and animal husbandry activities on soil and water resources. These three driving factors dissect the influencing mechanism of ecological carrying capacity from the perspectives of “human capacity,” “spatial organization,” and “industrial behavior,” respectively.
3.5.2. Single-Factor Detection
Based on the principle of geodetectors, a single-factor detection analysis was conducted on the ecological carrying capacity and its subsystems in the Hulun Lake basin from 2018 to 2024, and the q-value (explanatory power) and significance level of each influencing factor were calculated (Table 10 and Table 11).
Table 10.
Single-factor detection results of ecological carrying capacity from 2018 to 2024.
Table 11.
Single-factor detection results of ecological carrying capacity subsystems from 2018 to 2024.
According to the q-values and significance levels, six influencing factors—transport accessibility, population size, basic education coverage, urbanization level, information accessibility, and irrigation security capacity—all passed the significance test at the 1% level, with relatively high q-values. These are key factors affecting the ecological carrying capacity of the Hulun Lake basin. In contrast, industrial structure upgrading, multiple cropping index of cultivated land, and cropping structure did not pass the significance test, indicating weak explanatory power for ecological carrying capacity. Therefore, the core driving forces of ecological carrying capacity in the Hulun Lake basin mainly come from the dimensions of population quality and infrastructure, while the direct influence of the agricultural production dimension is relatively limited.
Specifically, transport accessibility is the most influential factor, indicating that transportation conditions contribute significantly to the spatial differentiation of ecological carrying capacity. First, improved transport accessibility shortens the distance between pastoral areas and central markets, accelerating the outbound transport of livestock products and tourism development. However, it may also bring about an influx of external populations and increased development intensity. Second, the extension of transport networks alters the pattern of resource flow, affecting grassland utilization intensity and the accessibility of ecological protection areas. As noted earlier, Manzhouli’s role as a transport hub makes it a regional economic center, but it also endures higher ecological pressure. The high q-value of transport accessibility confirms the critical impact of infrastructure spatial layout on the basin’s carrying capacity pattern.
Urbanization level and population size follow in explanatory power. In the context of the Hulun Lake basin’s sparse population, the spatial distribution of population size significantly influences total resource consumption and pollutant emission bases in local areas. New Barag Left Banner and Right Banner have low and dispersed population densities, so their ecological pressure remains relatively controllable. In contrast, Manzhouli City and Jalainur District have relatively concentrated populations, and the expansion of built-up areas combined with domestic emissions significantly increases the ecological load. The high q-value of population size reflects that the uneven spatial distribution of human activity intensity is one of the causes of ecological carrying capacity differentiation.
In regions with a high basic education coverage rate, the improvement of human capital levels has a strong driving effect on the enhancement of ecological carrying capacity. In areas with high basic education coverage, residents have a better understanding of grassland–livestock balance policies and ecological protection knowledge, and are more willing to adopt green production methods, thereby indirectly reducing the disturbance intensity of human activities on the ecosystem. This factor is particularly important in pastoral areas, where the steady improvement of ecological carrying capacity cannot be achieved without herders’ increased awareness and cooperation with grassland–livestock balance policies.
Information accessibility shows that the popularity of modern information technology is becoming an emerging driving force affecting the evolution of ecological carrying capacity. In areas with strong information accessibility, modern breeding techniques, market conditions, and ecological protection knowledge can be more efficiently transmitted to farmers and herders, prompting them to adjust production behavior in a timely manner to adapt to resource and environmental constraints. Improved information infrastructure is of great significance for promoting the green transformation of livestock production methods, and the importance of this factor will further increase in the future.
Irrigation security capacity is the only influencing factor in the agricultural production dimension that passed the significance test. The intensity of agricultural water extraction from surface water and groundwater directly affects the competition between the ecological water demand of lake wetlands and agricultural production. Areas with strong irrigation security capacity have greater agricultural water demand, leading to a more prominent crowding-out effect on basin water resources, thus exerting a significant negative driving force on ecological carrying capacity. This confirms the critical constraint of water resource allocation on the carrying capacity of grassland lake basins.
Based on the analysis of each subsystem, it is found that the explanatory power of these influencing factors on the three subsystems exhibits significant gradient differences. Ecosystem support capacity is most strongly driven by the core factors, with seven factors passing the 1% significance test and showing high q-values. Human activity pressure follows, with six factors passing, but the explanatory power of some factors decreases significantly compared to their relevance to support capacity. The driving pattern of socio-economic response shows structural differences from the previous two, with transport accessibility and urbanization level playing more prominent leading roles. This indicates that there are intrinsic logical connections among the three subsystems of ecological carrying capacity in the Hulun Lake basin: support capacity, as the natural foundation, is influenced by the spatial organization of human activities; pressure, as human disturbance, is driven by both industrial structure and infrastructure; response, as social feedback, depends more on the combined effect of development level and governance capacity.
Specifically, for ecosystem support capacity, transport accessibility, population size, and urbanization level have relatively strong explanatory power. The extension of transport networks and population agglomeration alter land use patterns, and the expansion of built-up areas encroaches on ecological land, which may exacerbate grassland fragmentation along transport corridors, thereby weakening the integrity and stability of the ecosystem. Basic education coverage reflects that in areas with higher education levels, residents have stronger awareness of grassland protection, and overgrazing is effectively curbed, thus reducing disturbance to the grassland ecosystem. It is worth noting that industrial structure upgrading and cropping structure have very weak explanatory power for support capacity, indicating that in the Hulun Lake basin, the adjustment of agricultural industrial structure has not yet become a dominant factor affecting the spatial differentiation of the natural ecosystem; the core driving forces of support capacity remain concentrated on population distribution and infrastructure layout.
For human activity pressure, transport accessibility has high explanatory power, especially with regard to its spatial differentiation. In Manzhouli City and Jalainur District, where transport conditions are better, industrial activities are intensive, logistics transport is active, and population mobility is high; thus, human activity pressure is significantly higher than in pastoral areas with relatively poor transport access. In the hinterlands of New Barag Left Banner and Right Banner, transport accessibility is lower, and the disturbance intensity of human activities is naturally smaller. Population size and basic education coverage also have relatively high q-values; the former reflects the determining effect of total population on the pressure baseline, while the latter reveals the moderating effect of education level on pressure behavior. In areas with high education coverage, residents are more inclined to adopt low-disturbance production and lifestyle patterns. Irrigation security capacity reflects the important contribution of agricultural water demand to pressure differentiation; in areas with strong irrigation security capacity, the crowding-out effect of agricultural activities on water resources is more prominent, becoming an important component of human activity pressure.
For socio-economic response, areas with higher urbanization levels have higher economic output and resident income levels, but also face the dilemma of declining environmental quality and increasing social vulnerability. Their response capacity exhibits the dual characteristics of high output and high pressure. In contrast, although pastoral areas have limited economic output, the synergy between ecological protection and livelihood improvement is actually stronger.
3.5.3. Two-Factor Interaction Detection
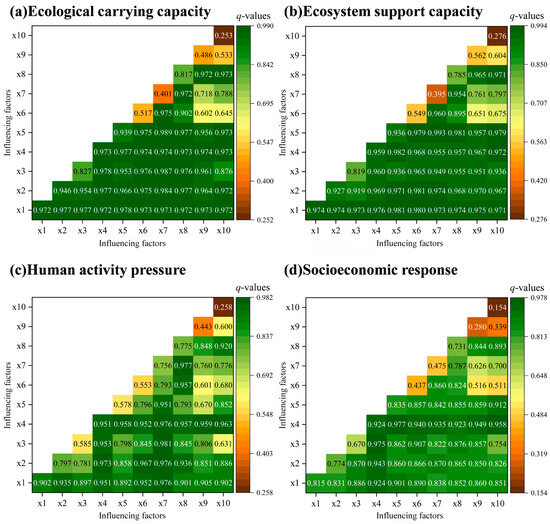
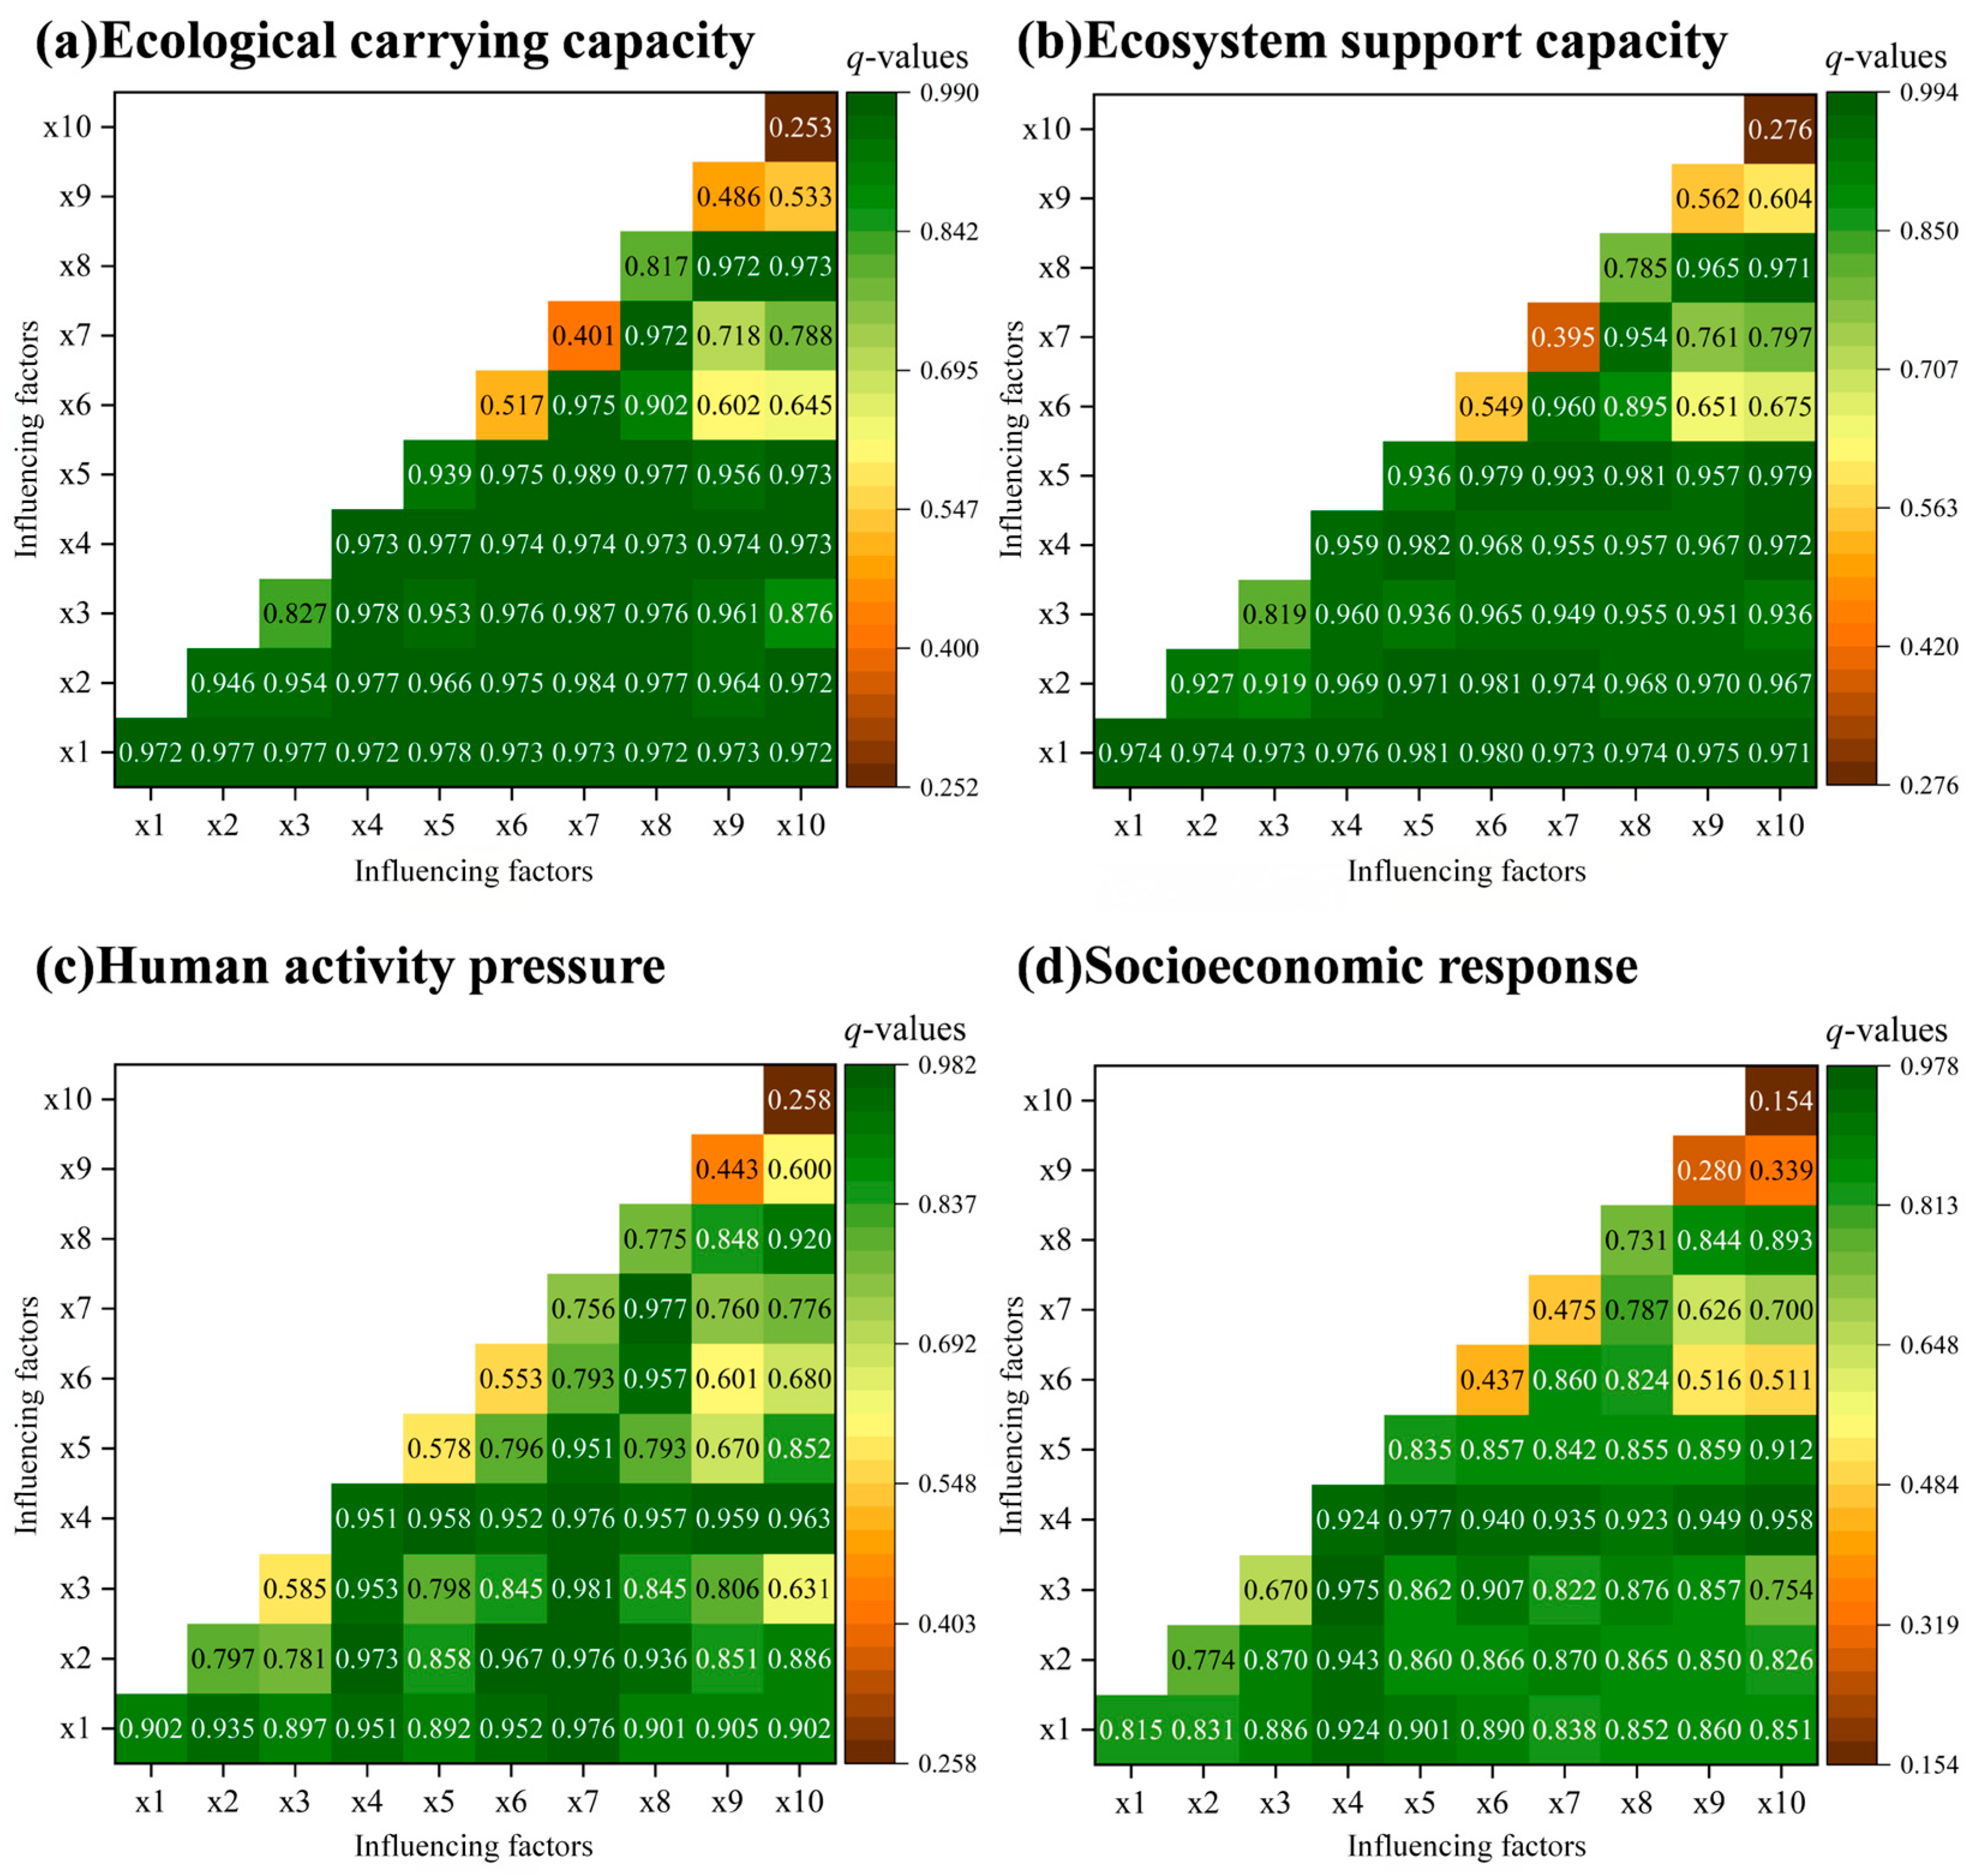
Based on single-factor detection, two-factor interaction detection is further used to analyze how the analyzed factors jointly affect the ecological carrying capacity of the Hulun Lake basin (Figure 6).
Figure 6.
Results of two-factor interaction detection of ecological carrying capacity and its subsystems from 2018 to 2024.
The spatial differentiation of ecological carrying capacity and its subsystems in the Hulun Lake basin is not the result of a single factor acting alone, but rather the outcome of multi-factor synergistic coupling. The joint explanatory power of the most influential factors is significantly higher than the explanatory power of each factor individually, suggesting two-factor enhancement and indicating that the development of the ecosystem is influenced by multiple factors acting together.
Among the factors affecting ecological carrying capacity, the interaction value between industrial structure upgrading and urbanization level is the highest, far exceeding their individual q-values, indicating that the synergistic advancement of industrial upgrading and urbanization plays an important driving role in the spatial differentiation of ecological carrying capacity. In Manzhouli City and Jalainur District, urbanization levels are high, but industrial structure upgrading lags, resulting in persistently low carrying capacities. In contrast, in New Barag Right Banner, although the urbanization level is relatively low, the transformation of animal husbandry has achieved remarkable results, leading to a steady increase in carrying capacity. When cropping structure interacts with core factors such as transport accessibility, urbanization level, and population size, the q-value also increases. This indicates that in areas with convenient transportation and concentrated populations, changes in cropping structure have substantial impacts on water and soil resource consumption and non-point source pollution. Therefore, agricultural production regulation policies must be implemented synergistically with infrastructure planning and population distribution optimization to achieve the expected effects.
Similarly, the interaction between the multiple cropping index of cultivated land and irrigation security capacity also reflects the synergistic interactions between agricultural land use intensity and water resource allocation. An increase in the multiple cropping index drives up irrigation demand, and the two together affect the balance between water supply and demand, thereby influencing ecological carrying capacity.
From the results of each subsystem, first, although industrial structure upgrading has weak explanatory power for ecosystem support capacity in single-factor detection, its interaction effects with other factors are relatively significant. Through synergy with urbanization, informatization, education, and other factors, industrial structure upgrading can significantly amplify the driving effect of other factors on support capacity. The reason why the green transformation of animal husbandry can promote support capacity improvement is precisely that it forms effective synergy with information dissemination and herder education.
Second, the interaction between transport accessibility and basic education coverage has the highest impact on human activity pressure, indicating that the synergy between transportation conditions and human capital plays a significant role in driving human activity pressure. In areas with convenient transportation, the intensity of human activities is naturally higher. However, if such areas also have high education levels, residents are more inclined to adopt environmentally friendly production and lifestyle patterns, thereby alleviating pressure. Conversely, if transportation is convenient but education lags, pressure tends to be amplified.
Finally, transport accessibility and information accessibility have a strong joint driving effect on socio-economic response. Areas with convenient transportation tend to have better information infrastructure, enabling residents to connect more efficiently with markets, access technology, and participate in ecological compensation programs, thereby transforming economic advantages into synergistic effects of ecological protection and livelihood improvement.
In summary, transport infrastructure holds a strong influential position in the driving mechanism of ecological carrying capacity in the Hulun Lake basin. It not only directly shapes the spatial pattern of local human activities but also indirectly affects ecosystem support capacity and socio-economic response through synergy with factors such as education, information, and industry.
4. Discussion
4.1. Contributions to Existing Research
The construction of research indicators considered the physical geographical characteristics and human–economic attributes of the Hulun Lake basin as a typical grassland-lake composite ecosystem, highlighting key factors such as water and wetland resources, livestock carrying pressure, and agricultural non-point source pollution, thereby avoiding the problem of regional characteristic blunting that may exist in universal indicator systems. This study extends the work of scholars such as Xiong, J. et al. [26], who conducted similar research on lake ecological carrying capacity, suggesting that indicator selection should consider both natural and human dimensions. Second, the ecological carrying capacity of the Hulun Lake basin exhibits a significant spatial differentiation pattern of “high in the east, low in the west; high in pastoral areas, low in urban areas.” The temporal evolution analysis further reveals distinct regional differentiation characteristics. The basic conclusions are consistent with the agglomeration level patterns found by Li, G. et al. [27] in the Dongting Lake economic zone, confirming that different regions have obvious heterogeneity due to different economic structures. Finally, road transportation, as an important infrastructure, holds a strong influential position in the driving mechanism of ecological carrying capacity in the Hulun Lake basin. Its interactive effects with other influencing factors are the most prominent and remain significant across all subsystems. This is consistent with the findings of Wei, X. et al. [28], indicating that under the spatial interaction medium constructed by transportation networks, ecological carrying capacity can be significantly promoted. Therefore, compared with other scholars exploring ecological security, the possible innovation of this study lies in its water resource perspective, the construction of a quantifiable comprehensive evaluation framework for grassland lake basins, and the selection of locally specific influencing factors for driving mechanism research, thereby filling some gaps in grassland lake research.
4.2. Policy Implications Obtained
Accordingly, in the future development of the Hulun Lake basin, policies should implement zoning and classification spatial management strategies. Based on the actual conditions of each county (banner), ecological restoration and green transformation should be carried out to transform ecological advantages into economic advantages. Investment in education in pastoral areas should be increased, ecological protection knowledge should be incorporated into local curricula, rational population distribution should be guided, moderately concentrated settlement of herders should be promoted, and information infrastructure should be accelerated to extend into pastoral areas to narrow the digital divide. In agricultural development, water resource allocation should be optimized, water-saving irrigation should be promoted, and ecological water use for rivers and lakes should be guaranteed to achieve synergy among policies for strengthening grassland ecological protection, rural revitalization, and new urbanization.
4.3. Limitations and Future Directions
Due to the fact that the official statistical yearbooks prior to 2018 were not publicly released, we encountered practical obstacles in obtaining data for the socio-economic response dimension and the human activity pressure dimension. Consequently, the time span of the data used in this study is limited to 2018–2024. Clearly, this is insufficient for revealing long-term evolutionary patterns. Moreover, the study does not include more core water environment indicators. In the future, if water quality monitoring data for each banner, district, or county become available, they will help to more comprehensively characterize the spatiotemporal evolution of the ecological carrying capacity of the Hulun Lake basin.
Likewise, the PSR-model-based ecological carrying capacity evaluation system and the geodetector analysis method constructed in this study have not only been validated in the Hulun Lake basin but also hold potential for application in other grassland lake basins worldwide, as well as in arid and semi-arid ecosystems. Future research could apply this framework to lakes such as Lake Uvs in the Mongolian Plateau, the grassland areas surrounding Lake Baikal in Russia, the prairie lakes of the North American Great Plains, and similar water bodies in Central Asia. Through cross-regional comparisons, the universality and sensitivity of the indicator system can be tested, and weights and thresholds can be adjusted according to the physical geography and socio-economic characteristics of different regions, thereby providing scientific support for regional sustainable development in the context of global change.
5. Conclusions
This study takes four county-level cities within the Hulun Lake Basin from 2018 to 2024 as its research objects. The Entropy Weight Method was employed to evaluate ecological carrying capacity and its subsystems. Furthermore, methods including spatial analysis and geodetecting were applied to investigate the spatiotemporal differentiation patterns and influencing factors. The main conclusions are as follows:
Firstly, the ecological carrying capacity of the Hulun Lake basin exhibits a significant spatial differentiation pattern, with New Barag Left Banner as the ecological core area, New Barag Right Banner as an ecological transition area, and Manzhouli City and Jalainur District as ecologically fragile areas, forming a gradient characteristic of “high in the east, low in the west; high in pastoral areas, low in urban areas.”
Secondly, the overall ecological carrying capacity of the Hulun Lake basin exhibits a slow increasing trend amid fluctuations, but the carrying capacity level remains relatively low. Among the subsystems, the ecosystem support capacity fluctuates sharply, human activity pressure continues to rise, and the socioeconomic response shows a steady improvement.
Thirdly, the core driving forces of ecological carrying capacity in the Hulun Lake basin come from the dimensions of population quality and infrastructure, while the direct influence of the agricultural production dimension is relatively limited. Ecosystem support capacity is dominated by the synergistic effect of urbanization and industrial upgrading; human activity pressure is dominated by the synergistic effect of transportation and education; and socio-economic response is dominated by the synergistic effect of transportation and information.
Finally, transportation infrastructure holds a strong influential position in the driving mechanism of ecological carrying capacity in the Hulun Lake basin. Its synergy with factors such as education, information, and industry significantly affects both the ecosystem support capacity and the socio-economic response of the basin.
Author Contributions
S.L.: Conceptualization, Writing—original draft. A.Z.: Methodology. All authors have read and agreed to the published version of the manuscript.
Funding
This research was funded by “Qinghai University’s 2025 Graduate Research and Practice Innovation Project”, grant number: 2025-GMKY-31; “Qinghai Kunlun Talents High-end Innovative Talents—Cultivating Outstanding Talents Project”, grant number: k9924063; “Major “Open Competition for Key Projects” Planning Project of Philosophy and Social Sciences in Qinghai Province”, grant number: 25JB002.
Data Availability Statement
The author will fully provide the original data from the article. Please contact the corresponding author to request it.
Conflicts of Interest
The authors declare no conflicts of interest.
References
- Gschwentner, D.; Blehm, L.; Brahney, J.; Wedin, D.; Corman, J.R. Nitrogen-limitation Overrides Impacts of Wildfire Ash on Primary Production in Naturally Eutrophic, Grassland Lakes. Ecosystems 2025, 28, 63. [Google Scholar] [CrossRef] [Scilit]
- Heino, J.; Alahuhta, J.; Bini, L.M.; Cai, Y.; Heiskanen, A.S.; Hellsten, S.; Kortelainen, P.; Kotamäki, N.; Tolonen, K.T.; Vihervaara, P.; et al. Lakes in the era of global change: Moving beyond single-lake thinking in maintaining biodiversity and ecosystem services. Biol. Rev. 2021, 96, 89–106. [Google Scholar] [CrossRef] [Scilit]
- Bole, Y.; Rina, S.; Guga, S.; Na, M.; Fan, S.; Zhang, J. Evaluation of resources, environment, and ecological carrying capacity from the perspective of “production-living-ecology” spaces: A case study of western Jilin Province, China. J. Clean. Prod. 2025, 491, 144770. [Google Scholar] [CrossRef] [Scilit]
- Sadri-Shojaei, S.; Momeni, M.; Kerachian, R. A novel methodology for assessing resources and environmental carrying capacity with emphasis on ecosystem services: A multi-disciplinary approach to sustainable urban planning. J. Environ. Manag. 2025, 373, 123507. [Google Scholar] [CrossRef] [Scilit] [PubMed]
- Alipbeki, O.; Grossul, P.; Rakhimov, D.; Kupidura, P.; Alipbekova, C.; Musaif, G.; Turekeldiyeva, R.; Augambaev, K.; Begaliyeva, M. Ecosystem Health Assessment of the Zerendy District, Kazakhstan. Sustainability 2025, 17, 277. [Google Scholar] [CrossRef] [Scilit]
- Yin, H.; Zhu, Z.; Pan, L.; Zhu, F.; Zhu, L. City-level assessment of green economy development and its driving factors: Empirical evidence from 14 prefecture-level cities in Guangxi, China based on DPSR-GTWR integrated model. Front. Sustain. Cities 2025, 7, 1622975. [Google Scholar] [CrossRef] [Scilit]
- Yussif, K.; Dompreh, E.B.; Gasparatos, A. Sustainability of urban expansion in Africa: A systematic literature review using the Drivers–Pressures–State–Impact–Responses (DPSIR) framework. Sustain. Sci. 2023, 18, 1459–1479. [Google Scholar] [CrossRef] [Scilit]
- Nketiah, E.; Song, H.; Adjei, M.; Obuobi, B.; Adu-Gyamfi, G. Assessing the influence of research and development, environmental policies, and green technology on ecological footprint for achieving environmental sustainability. Renew. Sustain. Energy Rev. 2024, 199, 114508. [Google Scholar] [CrossRef] [Scilit]
- Pata, S.K.; Pata, U.K. Comparative analysis of the impacts of solar, wind, biofuels and hydropower on load capacity factor and sustainable development index. Energy 2025, 319, 134991. [Google Scholar] [CrossRef] [Scilit]
- He, J.; Tang, Y.; Guo, X.; Chen, H.; Guo, W.; Sun, Y. Assessment of coupling coordination and spatial distribution characteristics between urbanization and ecosystem health in the Yellow River Basin. Land Use Policy 2025, 154, 107572. [Google Scholar] [CrossRef] [Scilit]
- Piipponen, J.; Jalava, M.; de Leeuw, J.; Rizayeva, A.; Godde, C.; Cramer, G.; Herrero, M.; Kummu, M. Global trends in grassland carrying capacity and relative stocking density of livestock. Glob. Change Biol. 2022, 28, 3902–3919. [Google Scholar] [CrossRef] [Scilit]
- Khorsandi, M.; Homayouni, S.; Van Oel, P. The edge of the petri dish for a nation: Water resources carrying capacity assessment for Iran. Sci. Total Environ. 2022, 817, 153038. [Google Scholar] [CrossRef] [Scilit]
- Seki, M.; Yang, S.I.; Duyar, A.; Raptis, D.I.; Atar, D.; Özkal, M.K.; Sakici, O.E.; von Gadow, K. Estimating stand carrying capacity for three common pine species across various regions of Türkiye. Forests 2025, 16, 374. [Google Scholar] [CrossRef] [Scilit]
- Çakmakçı, R.; Salık, M.A.; Çakmakçı, S. Assessment and principles of environmentally sustainable food and agriculture systems. Agriculture 2023, 13, 1073. [Google Scholar] [CrossRef] [Scilit]
- Wang, S.; Liping, Y.; Arif, M. Evolutionary analysis of ecological-production-living space-carrying capacity in tourism-centric traditional villages in Guangxi, China. J. Environ. Manag. 2025, 375, 124182. [Google Scholar] [CrossRef] [Scilit] [PubMed]
- Alam, T.; Gupta, R.; Ahamed, N.N.; Ullah, A.; Almaghthwi, A. Smart mobility adoption in sustainable smart cities to establish a growing ecosystem: Challenges and opportunities. MRS Energy Sustain. 2024, 11, 304–316. [Google Scholar] [CrossRef] [Scilit]
- Garau, G.; Carboni, D.; El Meligi, A.K. Economic and environmental impact of the tourism carrying capacity: A local-based approach. J. Hosp. Tour. Res. 2022, 46, 1257–1273. [Google Scholar] [CrossRef] [Scilit]
- Wu, R.; Zhang, S.; Liu, Y.; Shi, X.; Zhao, S.; Kang, X.; Quan, D.; Sun, B.; Arvola, L.; Li, G. Spatiotemporal variation in water quality and identification and quantification of areas sensitive to water quality in Hulun lake, China. Ecol. Indic. 2023, 149, 110176. [Google Scholar] [CrossRef] [Scilit]
- Dai, X.; A, Y.; Wang, L.; Xue, B.; Wang, Y.; Zhou, X.; Ma, G.; Li, H.; Chen, H.; Liao, T.; et al. Review on the collaborative research of water resources–water environment–water ecology in Hulun Lake. Water 2024, 16, 2508. [Google Scholar] [CrossRef] [Scilit]
- Jatav, S.S.; Naik, K. Measuring the agricultural sustainability of India: An application of Pressure-State-Response (PSR) model. Reg. Sustain. 2023, 4, 218–234. [Google Scholar] [CrossRef] [Scilit]
- Siddiqui, Z.A.; Tyagi, K. Study on service selection effort estimation in service oriented architecture-based applications powered by information entropy weight fuzzy comprehensive evaluation model. IET Softw. 2018, 12, 76–84. [Google Scholar] [CrossRef] [Scilit]
- Zhu, L.; Meng, J.; Zhu, L. Applying Geodetector to disentangle the contributions of natural and anthropogenic factors to NDVI variations in the middle reaches of the Heihe River Basin. Ecol. Indic. 2020, 117, 106545. [Google Scholar] [CrossRef] [Scilit]
- DuPuy, P.; Galaitsi, S.; Linkov, I. Carrying capacity in human-environment interactions: A systematic review. Integr. Environ. Assess. Manag. 2025, 21, 526–539. [Google Scholar] [CrossRef] [Scilit]
- Pourebrahim, S.; Hadipour, M.; Emlaei, Z.; Heidari, H.; Goh, C.T.; Lee, K.E. Analysis of environmental carrying capacity based on the ecological footprint for the sustainable development of Alborz, Iran. Sustainability 2023, 15, 7935. [Google Scholar] [CrossRef] [Scilit]
- Choudhary, K.; Boori, M.; Shi, W.; Valiev, A.; Kupriyanov, A. Agricultural land suitability assessment for sustainable development using remote sensing techniques with analytic hierarchy process. Remote Sens. Appl. Soc. Environ. 2023, 32, 101051. [Google Scholar] [CrossRef] [Scilit]
- Xiong, J.; Wang, X.; Zhao, D.; Zhao, Y. Spatiotemporal pattern and driving forces of ecological carrying capacity during urbanization process in the Dongting Lake area, China. Ecol. Indic. 2022, 144, 109486. [Google Scholar] [CrossRef] [Scilit]
- Li, G.; Chen, W.; Zhang, X.; Yang, Z.; Bi, P.; Wang, Z. Ecosystem service values in the dongting lake eco-economic zone and the synergistic impact of its driving factors. Int. J. Environ. Res. Public Health 2022, 19, 3121. [Google Scholar] [CrossRef] [Scilit] [PubMed]
- Wei, X.; Shen, L.; Li, J.; Du, X. An alternative method for assessing urban transportation carrying capacity. Ecol. Indic. 2022, 142, 109299. [Google Scholar] [CrossRef] [Scilit]

Disclaimer/Publisher’s Note: The statements, opinions and data contained in all publications are solely those of the individual author(s) and contributor(s) and not of MDPI and/or the editor(s). MDPI and/or the editor(s) disclaim responsibility for any injury to people or property resulting from any ideas, methods, instructions or products referred to in the content. |
© 2026 by the authors. Licensee MDPI, Basel, Switzerland. This article is an open access article distributed under the terms and conditions of the Creative Commons Attribution (CC BY) license.