


Abstract
As the most critical binding constraint in the Yellow River Basin, the endowment and allocation efficiency of water resources significantly influence the stability and sustainability of urban economic systems. However, the direction, intensity, and heterogeneity of the impacts of water resource abundance and water use efficiency on urban economic resilience remain unclear. Therefore, to explore the intrinsic relationship between water resources and urban economic resilience and to identify effective pathways for enhancing urban risk resistance, this paper employs a fixed-effects model to empirically examine the differential impacts based on panel data from 78 prefecture-level cities in the Yellow River Basin from 2011 to 2023. The results show that: (1) Water resource abundance exerts a significant inhibitory effect on urban economic resilience, while water use efficiency exhibits a significant promoting effect. (2) Market demand, government intervention and opening up exacerbate the negative impact of water resource abundance and also strengthen the positive impact of water use efficiency. (3) The negative impact of water resource abundance is significant only in resource-based cities, water-abundant cities, cities in the lower reaches, and cities with high economic development, high urbanization, and high technology input. In contrast, the positive impact of water use efficiency is significant in most cities, and it is more pronounced in resource-based cities, water-abundant cities, cities in the middle reaches, and cities with high economic development and high urbanization. These findings provide important insights for enhancing urban resilience and promoting sustainable development.
1. Introduction
As a strategic resource supporting economic and social development, water resources, with their endowment differences and allocation efficiency, profoundly shape urban development paths and risk resistance capabilities, constituting an indispensable cornerstone for achieving high-quality development. In January 2025, the Political Bureau of the Central Committee of the Communist Party of China (CPC) reviewed and adopted the Opinions on Comprehensively Promoting Ecological Protection and High-Quality Development of the Yellow River Basin, which clearly stipulates that water resources should be regarded as the largest rigid constraint, and the relationship between water and population, food, and energy should be properly balanced. As an important ecological barrier and economic corridor in China, the Yellow River Basin has long been confronted with the “water abundance paradox” in urban development [1]. According to the 2024 China Water Resources Bulletin, the total water resources in the Yellow River Basin are 8.271 billion cubic meters, accounting for only 2.65% of the national total, and per capita water availability is merely 27% of the national average. Meanwhile, water use efficiency in the basin is low, with the water resources development and utilization rate reaching 80%, far exceeding the ecological warning line of 40% [2]. Such dual contradictions of overall scarcity and extensive utilization have further exacerbated the vulnerability of the urban economic system under the combined shocks of climate change, industrial transformation, and public emergencies. Therefore, exploring the differentiated impacts of water resource abundance and water use efficiency on urban economic resilience is of great significance for solving water shortage problems, building a modern urban economic system, and promoting ecological protection and high-quality development of the Yellow River Basin.
With the increasingly prominent contradiction between water supply and demand, sustainable water resource management has become a research focus in academia. Water resource abundance and water use efficiency are two core dimensions for measuring the level of sustainable water resource utilization. Water resource abundance refers to the relative sufficiency of available water resources in a region [3]. Its measurement methods include not only single indicators such as per capita water resources and total water resources, but also comprehensive evaluation systems covering water supply, precipitation, and other factors [4,5]. Studies found that the spatial distribution of water resources in China generally presented a pattern of “more in the south and less in the north”, and provinces with relatively high water resource abundance were mainly concentrated south of the Qinling–Huaihe Line [6]. The shortage of natural water resources and population growth are the main causes of regional water scarcity, while global climate change, worsening water pollution, and other factors are important constraints on sustainable water resource utilization [7]. Water use efficiency refers to the effective output generated per unit of water resources [8]. In terms of measurement methods, it has gradually shifted from single indicators such as water consumption per unit gross domestic product (GDP) and water consumption per unit industrial added value to a total-factor perspective that comprehensively considers the coordinated allocation efficiency of capital, labor and water resources [9]. Economic development level, industrial structure, technological level, environmental regulation, water price and other factors exert significant impacts on water use efficiency, with heterogeneous effects across regions. Compared with underdeveloped regions, developed regions have a more rational industrial structure, better infrastructure, and higher technological innovation capacity, thus achieving higher water use efficiency [10]. In addition, regions with higher water use efficiency can produce positive spatial spillover effects on neighboring regions, thereby showing the phenomenon of spatial club convergence [11].
In recent years, urban economic resilience, as a key capability for measuring cities’ responses to external shocks and sustainable development, has become a research hotspot. In terms of theoretical connotation, it underwent an in-depth evolution from engineering resilience and ecological resilience to evolutionary resilience. Current research emphasizes that resilience is a composite capability of “resistance, recovery, adaptation, and transformation”. Most scholars defined it as the ability of a city to quickly return to its normal development level or even achieve a better development state after responding to external disturbances [12,13]. Regarding measurement methods, some studies measured urban economic resilience using single indicators such as GDP, employment, unemployment, and fixed-asset investment, while others constructed multi-dimensional comprehensive evaluation systems covering economic stability, industrial upgrading, and social development through coupling degree models, the entropy method, and other approaches [14,15]. In addition, some scholars applied complex network analysis, system dynamics models, and other methods to reveal the evolution trend of its internal structure, and introduced non-traditional data such as nighttime light data for measurement [16]. As for influencing factors, most studies focused on the impacts of industrial agglomeration, human capital, scientific and technological investment, policy intervention, and other factors [17,18]. Studies found that technological innovation enhanced urban economic resilience by optimizing resource allocation, promoting industrial structure upgrading, and improving human resource quality [19]. In terms of spatial characteristics, urban economic resilience showed significant regional heterogeneity and spatial spillover effects. Central cities tended to exhibit stronger resilience and exerted positive radiation effects on surrounding areas [20]. Research found that China’s urban economic resilience presented a pattern of “high in the east and low in the west”. Among them, the Yangtze River Delta, Pearl River Delta, Beijing–Tianjin–Hebei, and Chengdu–Chongqing urban agglomerations displayed the most prominent economic resilience and the strongest radiation-driven effects on surrounding cities [21].
Currently, research on the relationship between water resources and urban economic resilience remains relatively limited. However, studies on water resources and urban or regional economic development have laid an important foundation for exploring their connection. Early research was largely rooted in the resource curse hypothesis, arguing that while water abundance may yield short-term economic growth dividends, it tends to induce industrial structure rigidity, insufficient technological innovation, and institutional inertia in the long run, thereby inhibiting high-quality economic development [22]. Wang et al. identified the existence of a water resource curse phenomenon in the Yellow River Basin, characterized by significant spatial differentiation: the upper reaches fall into the severe resource curse zone, the middle reaches into the moderate zone, and the lower reaches into the mild zone [23]. An et al. found that despite the relative abundance of water resources in cities along the Yangtze River Economic Belt, there is a mismatch between water abundance and the level of urban economic development [24]. In recent years, research has increasingly focused on water use efficiency, viewing it as a critical pathway to break the resource curse. As a key indicator for measuring the quality of water resource utilization, water use efficiency can significantly enhance urban economic vitality and sustainability by boosting total factor productivity, promoting the diffusion of green technologies, and optimizing industrial water use structures. Yang et al. concluded that improvements in water resource utilization efficiency effectively reduce urban water constraints and facilitate urban economic expansion and urban sprawl [25].
Although existing studies have achieved fruitful results, the following issues still need to be further discussed. First, most previous studies have focused on the impact of water resources on economic growth or the level of economic development, while economic resilience emphasizes the composite capacity of cities to resist shocks, recover and adjust. There are essential differences between the two in theoretical connotation, measurement methods and mechanism of action. Directly applying research conclusions from the field of economic growth to economic resilience research may lead to theoretical dislocation and empirical bias. Second, most previous studies treated water resources as a single aggregate indicator, failed to distinguish the structural differences between water abundance and water use efficiency, and did not systematically identify their heterogeneous impacts on economic resilience. Third, most previous studies focused on the direct impact of water resources on the economic system, with insufficient discussion on how factors such as market demand, government intervention and opening up moderate this impact process.
In response to the above research gaps, this paper takes the Yellow River Basin as the study area and uses panel data of 78 prefecture-level cities from 2011 to 2023 to systematically investigate the relationship between water resources and urban economic resilience. The specific research objectives of this paper are as follows. First, to measure and analyze the spatiotemporal evolution characteristics of urban water resource abundance, water use efficiency and economic resilience in the Yellow River Basin. Second, to empirically examine the heterogeneous effects of water resource abundance and water use efficiency on economic resilience. Third, to reveal the moderating roles of market demand, government intervention and opening up in the process through which water resources affect economic resilience. Fourth, to explore the impacts of water resource abundance and water use efficiency on economic resilience under various heterogeneous conditions, including resource dependence heterogeneity, water endowment heterogeneity, regional heterogeneity, economic development heterogeneity, urbanization heterogeneity, and technological input heterogeneity.
The main innovative contributions of this paper are as follows. First, in terms of research topic, this paper focuses for the first time on the emerging relationship between water resources and economic resilience, breaking through the limitation of previous studies that mostly centered on the nexus between water resources and economic growth, and expanding the research scope of resource and environmental economics. Second, in terms of theoretical mechanism, this paper not only scientifically analyzes the heterogeneous impacts of water resource abundance and water use efficiency on economic resilience, but also innovatively and systematically examines the moderating roles of market demand, government intervention and opening up. It comprehensively reveals the complexity of the relationship between water resources and economic resilience and deepens the understanding of their complex interaction mechanism. Third, in terms of practical value, focusing on the Yellow River Basin, a typical region with prominent human-water conflicts and arduous development tasks, this paper fills the research gap on the linkage between water resources and economic resilience in this area. The relevant conclusions can provide a scientific basis for formulating differentiated and targeted policies for water resource management and resilience improvement in this region and similar areas.
2. Theoretical Analysis and Research Hypotheses
2.1. The Impact of Water Resources on Economic Resilience
As a crucial indicator for measuring water resource endowment, water resource abundance exerts complex impacts on urban economic resilience. From the perspective of resource-based theory, abundant water, as a key production factor, can provide stable support for economic activities such as agricultural irrigation and industrial production [26], enabling cities to have stronger buffering capacity when facing external shocks such as drought and water pollution. However, according to the “resource curse” theory, improperly managed advantages in resource endowment may hinder the cultivation of long-term development capacity, thereby imposing multiple constraints on urban economic resilience. Water resource abundance can reduce economic resilience through channels such as industrial structure lock-in effect, technological innovation inhibition effect, and institutional lock-in effect, forming the transmission logic of “resource advantage–path dependence–resilience weakening”. That is, initial water abundance tends to generate structural dependence in economic and social systems, which in the long run weakens the system’s adaptability and transformation capacity, ultimately resulting in higher vulnerability when facing shocks. First, the industrial structure lock-in effect. Water-abundant cities tend to fall into the resource dependence trap, prioritizing the development of water-intensive and low value-added resource-intensive industries, leading to a simplified and rigid industrial structure [27], which reduces the ability of the industrial system to adjust and transform in response to shocks such as market fluctuations and resource constraints [28]. Second, the technological innovation inhibition effect. The easy availability of water resources weakens cities’ motivation for water conservation and willingness for technological innovation, reducing research and development (R&D) investment in technologies such as water recycling and high-efficiency water conservation. Such inertia in technological innovation reduces the endogenous driving force for cities to cope with crises and restore growth [29]. Third, the institutional lock-in effect. Water abundance may lead to governance inertia and neglect the prevention and control of potential risks such as water shortage and water disasters, making it difficult for cities to quickly buffer shocks and restore stability when encountering extreme hydrological events. For example, Chen pointed out that in the practice of the water rights trading system in the Yellow River Basin, the government usually forces transactions between two parties but ignores the value of water resources, causing water rights prices to deviate from the market pricing mechanism [2].
As a key indicator measuring the quality of water resource utilization, water use efficiency exerts an efficiency-empowering logic on urban economic resilience, which is fundamentally different from the endowment-dependent pathway of water resource abundance. From the perspective of endogenous growth theory, improved water use efficiency means achieving greater economic output with less water input, reflecting the urban economic system’s optimization of resource allocation, adaptation to constraints, and cultivation of innovative capacity. Water use efficiency can enhance economic resilience through channels including the industrial structure optimization effect, technological innovation-driven effect, and institutional adaptation strengthening effect, forming the transmission logic of “water use pressure—system response—resilience enhancement”. That is to say, continuous demands for improved water use efficiency or water resource constraint pressures will force the economic system to generate positive adaptive responses, promoting industrial structure upgrading, sustained technological innovation, and continuous institutional improvement. In the long run, such responses will strengthen the system’s structural adjustment capacity, resource allocation efficiency, and risk response vitality, ultimately enabling the urban economic system to demonstrate stronger resilience and growth resilience when facing external shocks. First, the industrial structure optimization effect. High water use efficiency squeezes the living space of low-efficiency, water-intensive industries. Through an efficiency screening mechanism, industries are forced to transform toward technology-intensive, service-oriented, green, and low-carbon sectors, enhancing the diversity and flexibility of the urban industrial system. Second, the technological innovation-driven effect. The improvement of water use efficiency relies on continuous innovation in technologies such as water-saving irrigation, intelligent monitoring, and wastewater treatment. These technologies not only reduce water consumption costs and improve resource allocation efficiency but also strengthen the city’s response speed and adjustment capacity when facing water resource pressures or emergencies [30]. Third, the institutional adaptation strengthening effect. The improvement of water use efficiency is usually accompanied by the improvement of institutions such as clear water rights, tiered water prices, and performance evaluation. This can enhance the government’s ability in crisis prediction, resource allocation, and policy response, and promote the formation of a diversified water resource governance system featuring government–market–society collaboration. As a result, the city can rapidly allocate resources and ensure the operation of the economic system during sudden water crises. Relevant studies have shown that the water rights trading system plays a positive role in improving water use efficiency and expanding financing channels for water conservancy facilities [31].
In summary, this paper proposes the following hypotheses.
H1.
Water resource abundance has a negative impact on urban economic resilience.
H2.
Water use efficiency has a positive impact on urban economic resilience.
2.2. Moderating Effects of Water Resources on Economic Resilience
2.2.1. Analysis of the Moderating Effect of Market Demand
As the invisible hand of resource allocation, market demand moderates the impacts of water resource abundance and water use efficiency on urban economic resilience through price signals, changes in consumption structure, market competition, and other mechanisms. Regarding water resource abundance, strong market demand raises the prices and returns of water resources and related products and induces production factors to cluster in low value-added water-intensive industries, forming path dependence, which further hinders the diversification, transformation and upgrading of the urban economy. Meanwhile, strong market demand conceals extensive water use patterns and weakens the water-saving willingness and technological innovation motivation of governments and enterprises through short-term gains, hindering human capital accumulation and industrial upgrading. Consequently, abundant water resources become a “curse” rather than a “blessing” for the improvement of urban economic resilience. In contrast, water use efficiency shows differentiated impacts under the moderation of market demand. On the one hand, according to endogenous growth theory, strong market demand can improve the marginal return on investment in water-saving technologies and the space for “innovation compensation”. Cities with high water use efficiency can achieve faster economic recovery and value chain upgrading through the positive feedback cycle of “cost advantage–market share–capital accumulation–technological progress”, thereby enhancing economic resilience when facing external shocks. On the other hand, strong market demand triggers fierce market competition. Enterprises with high water use efficiency can gain market share and sustain operation under high demand intensity, while those with low water use efficiency face rising marginal costs and pressure of market clearing. In other words, fierce market competition forces enterprises to improve resource allocation efficiency, thereby enhancing the resilience of the entire economic system. Accordingly, this paper proposes the following hypotheses.
H3.
Market demand plays a moderating role in the effects of water resource abundance and water use efficiency on economic resilience.
2.2.2. Analysis of the Moderating Effect of Government Intervention
As the core actor in resource allocation and institutional supply, the intensity and mode of government intervention shape the relationship between water resources and urban resilience. With respect to water resource abundance, according to rent-seeking theory, when the government controls the initial allocation and pricing of water rights, it tends to subsidize water prices and prioritize water supply for water-intensive industries to sustain economic growth and social stability in water-abundant cities. However, such protective intervention prolongs the resource dividend period, strengthens the path dependence of “low water price–high water consumption–low-end industries”, and reduces the city’s adaptability to tightened water policies or climate change. Regarding water use efficiency, in line with the Porter Hypothesis, strict environmental regulation, water-saving standards, and R&D subsidies can force enterprises to reform water-saving technologies and optimize management, transforming the costs of compliance into innovation benefits and competitive advantages, thus forming an innovation compensation effect [32]. Meanwhile, by providing institutions such as water rights registration, the development of water rights trading markets, and cross-regional ecological compensation, the government can reduce uncertainty and transaction costs in water resource circulation, enabling efficient water users to gain additional institutional dividends. This converts water use efficiency advantages into the risk resistance and recovery capacity of the economic system. Accordingly, this paper proposes the following hypotheses.
H4.
Government intervention plays a moderating role in the effects of water resource abundance and water use efficiency on economic resilience.
2.2.3. Analysis of the Moderating Effect of Opening Up
As an important channel for regions to integrate into the global market and obtain technological and institutional spillovers, opening up moderates the impacts of water resource abundance and water use efficiency on urban economic resilience by reshaping factor allocation logic and the market competition environment. With regard to water resource abundance, according to the factor endowment theory, water-abundant cities tend to form comparative advantage lock-in based on water endowment in the process of integrating into the global value chain. Embedding into the global division of labor by exporting water-intensive products can bring short-term trade gains to cities but will solidify the water-intensive industrial structure in the long run, leaving cities lacking industrial flexibility when facing risk shocks. In addition, according to the pollution haven hypothesis, opening up may attract the international transfer of water-intensive and highly polluting industries [33]. Foreign-funded enterprises in water-abundant cities may adopt extensive production by taking advantage of local cheap water resources, which will crowd out R&D investment in water-saving technologies and intensify the vicious circle of “resource dependence—low-end lock-in—weak risk resistance”. As for water use efficiency, according to the technology spillover theory, opening up can bring advanced water-saving technologies, environmental management experience and green production standards, and force domestic enterprises to improve water use efficiency and production techniques, promoting enterprises to transform international competitive pressure into driving force for green technological innovation, thereby enhancing the risk resistance capacity of the economic system. For example, Zhang et al. pointed out that the positive technology spillover effect brought by opening up in central China is greater than the pollution haven effect [34]. Furthermore, according to the global value chain upgrading theory, cities with high water use efficiency are more likely to break through the constraints of low value-added links and obtain high-grade industrial resources by participating in high-end international division of labor, thus transforming water use efficiency advantages into resilience against external shocks. Accordingly, this paper proposes the following hypotheses.
H5.
Opening up plays a moderating role in the effects of water resource abundance and water use efficiency on economic resilience.
In summary, this paper constructs a research hypothesis model (Figure 1) with water resource abundance and water use efficiency as explanatory variables, economic resilience as the dependent variable, and market demand, government intervention, and opening up as moderating variables. This study aims to explore the differential impacts of water resource abundance and water use efficiency on urban economic resilience, and to further reveal the moderating roles of market demand, government intervention, and opening up in this process.
Figure 1.
Research hypothesis model.
3. Methods and Data
3.1. Study Area
The Yellow River Basin serves as a crucial ecological barrier and economic zone in China, holding a strategic position in the overall national development [35]. As the region with the strictest mandatory water resource constraints and the most acute human-water conflicts in China, the Yellow River Basin is characterized by a combination of severe water scarcity, uneven spatial and temporal distribution, and over-exploitation. Water resources are relatively abundant in the upper reaches, while the middle and lower reaches face acute resource-based water shortages and encroachment on ecological water use, providing a natural comparative field for exploring the impact of water resource abundance. As the cradle of Chinese civilization and a key national energy and agricultural base, the region comprises diverse types of cities, including resource-based cities, major agricultural production cities, and ecological function zone cities [36]. Significant differences in water use structure and efficiency across cities offer an ideal setting for identifying the effects of water use efficiency. At the same time, the agglomeration of water-intensive industries coexists with water-related challenges, making the improvement of water use efficiency crucial for regional sustainable development. Particularly, ecological conservation and high-quality development of the Yellow River Basin have been elevated to a major national strategic task in China. Seeking breakthroughs in economic development under strict mandatory water constraints entails both clear policy restrictions and urgent practical needs. Therefore, taking the Yellow River Basin as the study area to conduct an in-depth investigation into the differentiated impacts of water resource abundance and water use efficiency on urban economic resilience is not only of great strategic and practical significance for solving water resource constraints and enhancing economic resilience in the region, but also provides a Chinese model and theoretical reference for the sustainable development of similar regions worldwide.
Referring to previous studies [37], and considering the integrity of research units and data availability, this paper defines the study area as 78 prefecture-level and above cities in 8 provincial-level administrative units through which the Yellow River flows: Qinghai, Gansu, Ningxia, Inner Mongolia, Shaanxi, Shanxi, Henan, and Shandong (Figure 2), with the research scale at the prefecture-level city scale. Sichuan is excluded from the study area because it has been included in the Yangtze River Economic Belt. In addition, referring to previous studies [38], this paper divides the sample cities into upper, middle, and lower reaches. Specifically, 24 prefecture-level cities in Gansu, Qinghai, Ningxia, and Inner Mongolia constitute the upper reaches; 21 prefecture-level cities in Shaanxi and Shanxi constitute the middle reaches; and 33 prefecture-level cities in Henan and Shandong constitute the lower reaches.
Figure 2.
Location of the study area.
3.2. Model Specification
In the model specification process, the two core explanatory variables were first considered to be included in the same benchmark model to comprehensively test their joint impact on urban economic resilience. However, the variance inflation factor (VIF) test shows that the VIF values of both water resource abundance and water use efficiency are greater than 10, indicating a serious multicollinearity problem. Forcing both variables into the same model would lead to biased regression coefficient estimates, distorted significance tests, and undermine the reliability of the research conclusions. Therefore, to effectively avoid the interference of multicollinearity, this paper refers to existing studies [39,40,41] and constructs two benchmark regression models with water resource abundance and water use efficiency as the single core explanatory variable respectively. On this basis, the VIF test of variables in both models shows that all VIF values are less than 10, confirming the absence of multicollinearity.
In addition, the Hausman test was conducted to examine the applicability of the fixed-effects model versus the random-effects model. The test results show that in the model with water resource abundance as the explanatory variable, the chi-square statistic is 25.30 with a corresponding p-value of 0.003, which is less than 0.01. The null hypothesis is significantly rejected, indicating that individual effects are correlated with the explanatory variable (water resource abundance), and the fixed-effects model is superior to the random-effects model. In the model with water use efficiency as the explanatory variable, the chi-square statistic is 40.81 with a corresponding p-value of 0.000, also significantly rejecting the null hypothesis. This suggests that individual effects are correlated with the explanatory variable (water use efficiency), and the fixed-effects model is preferred. Accordingly, a two-way fixed-effects model is employed to investigate the effects of water resource abundance and water use efficiency on economic resilience, respectively. The econometric model are specified as follows.
In Equations (1) and (2), i denotes the prefecture-level cities in the Yellow River Basin, t denotes the year, ER represents economic resilience, WRA represents water resource abundance, WUE represents water use efficiency, C denotes the control variables, and is the random disturbance term.
3.3. Variable Selection
(1) Dependent variable: Economic resilience (ER). Urban economic resilience refers to the ability of an urban economic system to maintain stable core functions, recover rapidly, learn from shocks and achieve transformation, and ultimately realize sustainable development when facing sudden shocks or long-term pressures [42,43]. At present, scholars mainly measure urban economic resilience using the single-index method and the comprehensive-index method. The single-index method mainly focuses on the dynamic changes in a single key indicator and reflects urban economic resilience by the ratio of the actual change level to the expected change level of a certain indicator after a shock. The comprehensive-index method usually selects multiple indicators to construct an index system for measuring urban economic resilience, which is highly subjective and may lead to causal confounding [44]. To ensure the comparability and robustness of data, this paper refers to previous studies [45] and uses the relative change index of GDP to measure urban economic resilience. The specific formula is as follows.
In Equation (3), ERi,t represents the economic resilience of city i in year t, Yi,t is the gross regional product of city i in year t, and Yt is the average gross regional product of the Yellow River Basin in year t, and t − k denotes k years before year t. In this paper, k = 1. If ERi,t > 0, it indicates that the GDP of city i grew faster than that of the entire Yellow River Basin during the period from t − k to t, reflecting relatively strong resilience. If ERi,t < 0, it indicates that city i exhibits relatively weak resilience.
(2) Explanatory variables: Water resource abundance (WRA) and water use efficiency (WUE). Water resource abundance refers to the richness and sufficiency of water resources in a region, which directly determines the development potential and scale of local water resources and constitutes an important foundational condition for regional economic development. Referring to previous studies [46], water resource abundance is measured by per capita water availability. A higher per capita water availability indicates greater water resource abundance. Water use efficiency refers to the economic output generated per unit of water consumption, serving as a key indicator for evaluating the intensification level and economic transformation efficiency of water resource utilization. Referring to previous studies [47], water use efficiency is measured by the ratio of GDP to water consumption. This ratio reflects the economic output generated per unit of water consumed, and a larger value indicates higher water use efficiency.
(3) Moderating variables. ① Market demand (MD). Market demand reflects the vitality and scale of the regional consumer market and is a key driving force for boosting economic growth and influencing enterprises’ production and investment decisions. In this paper, market demand is measured by the total retail sales of consumer goods. ② Government intervention (GI). Government intervention refers to the extent to which the government regulates and influences economic activities through fiscal expenditure, policies, regulations and other instruments. In this paper, government intervention is measured by local general public fiscal expenditure. A larger scale of fiscal expenditure indicates stronger government regulation and intervention in economic and social activities. ③ Opening up (OU). Opening up reflects the depth and breadth of regional integration into the international market. A higher level of opening-up can provide cities with access to external technologies, capital, markets and other opportunities, while also making cities more susceptible to external shocks such as international demand fluctuations and trade frictions. In this paper, opening up is measured by the total volume of imports and exports.
(4) Control variables. Referring to previous studies [48,49], this paper selects the following control variables. ① Urbanization level (UL). Urbanization level reflects the degree of population concentration in urban areas and the scale of urban development. It is a crucial factor affecting economic structure, resource consumption, and water demand. This paper measures urbanization level by the urbanization rate. ② Financial development level (FDL). Financial development level reflects the degree of regional financial development and financial service capacity. Financial development provides financial support for economic stability, technological innovation, and industrial transformation. This paper measures financial development level by the loan balance of financial institutions. ③ Human capital (HC). Human capital reflects the knowledge reserve, skill level, and innovation potential of the regional labor force, which is a core element for enhancing economic resilience and water use efficiency. This paper measures human capital by the number of students enrolled in regular institutions of higher education. ④ Technological innovation (TI). Technological innovation reflects the regional R&D and innovation capacity, which is a key driving force for industrial upgrading and efficient water resource utilization. This paper measures technological innovation by the number of patent applications. ⑤ Informatization level (IL). Informatization level reflects the construction of information infrastructure and the development level of the digital economy. Informatization helps improve resource allocation efficiency and economic operation efficiency. This paper measures informatization level by the number of telephone users. ⑥ Economic vitality (EV). Economic vitality reflects the activity level of regional production and economic activities. Electricity consumption growth is usually positively correlated with economic expansion. This paper measures economic vitality by the annual electricity consumption. ⑦ Environmental condition (EC). Environmental condition reflects the regional ecological environment quality and pollution degree, which are usually related to health, production efficiency, and policy constraints. This paper measures environmental condition by the annual average concentration of fine particulate matter (PM2.5). ⑧ Household income level (HIL). Income level reflects regional household income and labor costs, which affect consumption capacity and the endogenous driving force of economic growth. This paper measures household income level by the average wage of on-the-job staff in urban non-private units.
The descriptive statistics of the main variables in this paper are shown in Table 1.
Table 1.
Definition and descriptive statistics of main variables.
3.4. Data Sources
Considering the continuity of policies and data availability, this study sets the research period from 2011 to 2023. The relevant data are mainly derived from statistical materials such as the China City Statistical Yearbook, China Urban Construction Statistical Yearbook, and Water Resources Bulletin. Missing data are primarily supplemented using the interpolation method. In addition, to eliminate the impact of price factors, monetary variables such as GDP, local general public fiscal expenditure, loan balance of financial institutions, total volume of imports and exports, total retail sales of consumer goods, average wage of on-the-job staff in urban non-private units, and fixed asset investment are deflated with 2011 as the base period. The deflation adopts the GDP deflator, consumer price index, fixed asset investment price index and other indices of corresponding provinces over the years. Relevant price indices are mainly derived from China Statistical Yearbook and statistical yearbooks of various provinces.
4. Results
4.1. Current Situation Analysis
The overall trends of economic resilience, water resource abundance, and water use efficiency in the Yellow River Basin from 2011 to 2023 are shown in Figure 3. As can be seen from Figure 3, economic resilience exhibits a trend of initial decline followed by fluctuating growth. Economic resilience continued to decline from 2011 to 2015 and reached its lowest level in 2015. This period coincided with China’s economy entering a phase of growth deceleration, structural adjustment pains, and digestion of previous stimulus policies. As a traditional base of energy and heavy industry, the Yellow River Basin was particularly affected by overcapacity and weak demand, which severely weakened the shock resistance of its economic system. After 2015, with the advancement of supply-side structural reform, accelerated transformation of old and new growth drivers, and the boost of the Belt and Road Initiative to the open economies of provinces along the Yellow River, economic resilience gradually rebounded. Although it briefly declined in 2020 due to the COVID-19 pandemic, it rebounded rapidly in 2021–2022, indicating that the regional economy has developed strong self-repair and structural adjustment capabilities, and the improvement of resilience has shifted from policy-driven to endogenously driven. As shown in Figure 3, water resource abundance generally declined first and then rose. Water resource abundance continued to drop before 2015, a period marked by frequent extreme drought events in the Yellow River Basin, where insufficient precipitation and sharp increases in evaporation led to inadequate natural water recharge. Meanwhile, rapid urbanization and industrialization drove a substantial rise in water demand from water-intensive industries and urban domestic use, pushing water resource development and utilization rates close to ecological red lines. The intensified contradiction between water supply and demand resulted in a continuous decline in water resource abundance. After 2015, the state strengthened ecological protection in the Yellow River Basin by implementing projects such as returning farmland to forest and soil and water conservation, which significantly improved water conservation capacity in the basin. Furthermore, since 2020, the enactment of the Yellow River Protection Law and the implementation of rigid constraint policies under the principle of “determining urban scale, population, industrial development and ecological protection by water resources” have strictly restricted disordered water use and promoted intensive water utilization. Coupled with periodic increases in regional precipitation, these factors jointly drove water resource abundance to bottom out and rebound, though slight fluctuations persisted due to uneven spatial and temporal distribution of annual precipitation. It can be observed from Figure 3 that water use efficiency fluctuated considerably but showed an overall upward trend. In 2012, concentrated investment in water-saving technology R&D and irrigation system upgrades pushed water use efficiency to a peak. It then declined due to uneven regional promotion of technologies and lagged regulation of water costs. Supported by long-term factors including the iteration of water-saving technologies, popularization of smart water management, and rising public awareness of water conservation, water use efficiency trended upward with fluctuations. Driven by the expansion of efficient water-saving agriculture under the dual carbon goals and improved industrial water recycling, it rose to a high level again in 2023.
Figure 3.
Overall trends of economic resilience, water resource abundance and water use efficiency in the Yellow River Basin.
The conditions of economic resilience, water resource abundance, and water use efficiency in each province of the Yellow River Basin during 2011–2023 are shown in Figure 4. In terms of economic resilience, provinces in the Yellow River Basin generally maintain relatively high economic resilience, with significant variations across years. Economic resilience in Ningxia is relatively high and changes steadily. Economic resilience in Shandong is generally stable but shows an obvious trough in 2019. After reaching its peak in 2019, economic resilience in Henan decreases noticeably. Economic resilience in Shanxi is relatively low during 2012–2016, then rebounds significantly and peaks in 2021. Economic resilience in Inner Mongolia and Qinghai is low during 2017–2018. Economic resilience in Gansu is low during 2013–2017, then rises markedly and peaks in 2019. In terms of water resource abundance, the overall level is relatively low and changes steadily across years in all provinces of the Yellow River Basin. Among the eight provinces, water resource abundance is relatively high in Shaanxi and Gansu, and relatively low in Ningxia. In 2021, water resource abundance increases prominently and reaches a peak in the middle and lower reaches of the Yellow River Basin, including Shaanxi, Shandong, and Henan. In terms of water use efficiency, provinces in the Yellow River Basin generally show low overall efficiency with relatively stable changes over time. Among the eight provincial regions, water use efficiency is relatively high in Inner Mongolia, Ningxia, and Gansu, and relatively low in Qinghai. Water use efficiency in Shaanxi, Shanxi, and Qinghai changes steadily over the years. Water use efficiency in Ningxia improves notably after 2019 and peaks in 2023. After peaking in 2012, water use efficiency in Gansu declines, and has increased significantly since 2020.
Figure 4.
Trends of economic resilience, water resource abundance and water use efficiency in various provinces of the Yellow River Basin. (a) Economic resilience; (b) Water resource abundance; (c) Water use efficiency.
4.1.1. Spatial Evolution of Economic Resilience
Using ArcGIS 10.7 software, this paper conducts a visual analysis of urban economic resilience in the Yellow River Basin for the years 2011, 2015, 2019, and 2023 (Figure 5). As shown in Figure 5, urban economic resilience in the Yellow River Basin exhibits significant spatial disparities and temporal variations. In 2011, urban economic resilience in the Yellow River Basin was generally high and was relatively high in most areas of the middle and upper reaches and some areas of the lower reaches (such as Zhengzhou and Xinxiang). In 2015, driven by national policy support and industrial restructuring, the spatial pattern of economic resilience changed substantially. Economic resilience in the lower reaches increased obviously and remained at a relatively high level, while some areas in the middle and upper reaches showed relatively low and diffusing economic resilience due to resource dependence and lagging transformation. In 2019, the distribution of economic resilience became more complex. Most cities in the middle reaches exhibited high economic resilience, and core cities and their surrounding cities such as Xi’an, Lanzhou, Xining and Zhengzhou still maintained relatively high economic resilience. In 2023, economic resilience of the Shandong Peninsula Urban Agglomeration in the lower reaches improved significantly, mainly driven by the marine economy and high-tech industries. Cities in the Lancangxi Urban Agglomeration, Hohhot-Baotou-Ordos-Yulin Urban Agglomeration and other urban agglomerations in the upper reaches achieved relatively high economic resilience, indicating that the ecological compensation mechanism and the transformation of resource-based cities had effectively improved urban economic resilience and sustainable development capacity.
Figure 5.
Spatial evolution of urban economic resilience in the Yellow River Basin.
4.1.2. Spatial Evolution of Water Resource Abundance
This paper presents a visual analysis of urban water resource abundance in the Yellow River Basin (Figure 6). As shown in Figure 6, from 2011 to 2023, water resource abundance in the Yellow River Basin is generally characterized by a small number of scattered high-abundance areas and widely distributed low-abundance areas. Among them, cities in the upper reaches such as Jiuquan, Zhangye and Ordos maintain a high level of water resource abundance all year round, while Lanzhou, Baiyin, Yinchuan and other cities remain at a low level. This is because Jiuquan, Zhangye and other cities are close to the Qilian Mountains, supported by natural water sources including glacial meltwater and inland river systems. In contrast, Lanzhou, Baiyin, Yinchuan and other cities are located in the arid section of the middle and upper reaches of the Yellow River mainstream, where precipitation is scarce, evaporation is intense, and water demand is large, resulting in low water resource abundance. In the middle and lower reaches, except for cities such as Hanzhong, Ankang and Shangluo, which maintain high water abundance all year round, most cities have long been at a low level. This is particularly true for core cities and their surrounding areas such as Taiyuan, Xi’an, Zhengzhou, Jinan, Hohhot and Yinchuan. The reason is that, compared with other cities, Hanzhong, Ankang and other cities rely on the superior natural ecological conditions of the Qinba Mountains, with abundant precipitation, high forest coverage and strong water conservation capacity.
Figure 6.
Spatial evolution of urban water resource abundance in the Yellow River Basin.
4.1.3. Spatial Evolution of Water Use Efficiency
This paper conducts a visual analysis of urban water use efficiency in the Yellow River Basin (Figure 7). As shown in Figure 7, urban water use efficiency in the Yellow River Basin shows an overall upward trend. The scope of low water use efficiency areas has gradually shrunk, while high-efficiency areas have increased significantly and expanded in distribution. Overall, water-scarce cities such as Jiayuguan, Lanzhou, Yinchuan, Wuhai, and Zhengzhou have maintained high levels of water use efficiency for years, whereas water-abundant cities like Jiuquan, Zhangye, Hanzhong, and Ankang have consistently exhibited low efficiency. This is because cities with inherent water shortages, such as Jiayuguan and Lanzhou, are forced to strictly control water consumption, promote water-saving technologies, and continuously optimize their water use structure. In contrast, relatively water-abundant cities like Jiuquan and Zhangye suffer from low water use efficiency due to extensive agricultural irrigation, unreasonable industrial layout, and weak water resource management. Over time, water use efficiency in core cities and their surrounding areas, including Lanzhou, Yinchuan, Taiyuan, Zhengzhou, Jinan, and Qingdao, has gradually improved. In related studies, scholars have also found that the water resource utilization level of provincial capital cities in the Yellow River Basin is significantly higher than the provincial average [50]. This is because policies such as the strictest water resource management system and ecological protection and high-quality development of the Yellow River Basin have forced these cities to strengthen water use control and reduce extensive water consumption through mechanisms such as water quotas and tiered water prices. Meanwhile, core cities take the lead in achieving industrial structure upgrading and breakthroughs in water-saving technologies by virtue of their advantages in capital, technology, and talent. They then extend advanced water resource management experience and recycled water systems to surrounding cities, forming a central demonstration, peripheral follow-up interactive pattern, thereby improving water use efficiency on a larger scale.
Figure 7.
Spatial evolution of urban water use efficiency in the Yellow River Basin.
4.2. Analysis of Benchmark Regression Results
To ensure the validity of regression results and avoid spurious regression, this paper conducts unit root tests using three methods: the Levin-Lin-Chu Unit Root Test (LLC test), the Im-Pesaran-Shin Unit Root Test (IPS test), and the Fisher-type Augmented Dickey–Fuller Test (Fisher-ADF test) (Table 2). As can be seen from Table 2, all variables pass the tests at the 1% significance level, indicating that the variables are stationary and eligible for regression analysis.
Table 2.
Results of panel unit root test.
Using the fixed-effects model, this paper examines the impacts of water resource abundance and water use efficiency on urban economic resilience. The regression results are presented in Table 3.
Table 3.
Benchmark regression results.
In terms of water resource abundance, the results in columns (1) and (2) of Table 3 show that water resource abundance has a significantly negative impact on urban economic resilience, verifying hypothesis H1. Specifically, without the inclusion of control variables, the coefficient of WRA is −0.018, significant at the 1% level. After adding control variables, the coefficient of WRA is −0.015, significant at the 5% level. Although the negative impact of water resource abundance on economic resilience weakens slightly, it remains robust. From an economic perspective, under the condition that other factors remain unchanged, for each unit increase in water resource abundance, urban economic resilience decreases by 0.015 units. In other words, cities with more abundant water resources tend to have weaker economic resilience, which also confirms the resource curse theory in economics. A possible explanation is that abundant water resources lead cities to rely excessively on water-intensive industries, resulting in a singular and undiversified industrial structure. Meanwhile, cities with abundant water resources may also lack incentives for water conservation, leading to low technological progress and management efficiency. When exposed to external shocks such as climate change and policy adjustment, such an economic structure dependent on a single resource lacks the ability to adjust and adapt, resulting in poor risk resistance.
In terms of water use efficiency, the results in columns (3) and (4) of Table 3 show that water use efficiency has a significantly positive impact on economic resilience, verifying hypothesis H2. Specifically, without control variables, the coefficient of WUE is 0.031, significant at the 1% level. After adding control variables, the coefficient of WUE is 0.030, still significant at the 1% level. This positive effect remains almost unchanged after the inclusion of control variables, indicating that the boosting effect of water use efficiency on economic resilience is relatively independent and robust. From an economic perspective, under the condition that other factors remain unchanged, for each unit increase in water use efficiency, urban economic resilience increases by 0.030 units. In other words, improving water use efficiency can significantly enhance the ability of the urban economy to resist and respond to shocks. This is because efficient water use is usually accompanied by technological progress, industrial upgrading, and improved resource management capacity. In the Yellow River Basin, where water resources are scarce, improving water use efficiency can not only alleviate the constraints of water scarcity on production but also promote green transformation and systemic stability, thereby strengthening overall economic resilience. In addition, by comparing the coefficients of water resource abundance and water use efficiency, it can be found that the magnitude of the positive impact of water use efficiency on urban economic resilience is greater than that of the negative impact of water resource abundance. That is to say, the quality of water resource utilization exerts a more prominent influence on urban economic resilience than the quantity of water resource endowment. Relevant studies have also found that water resource use efficiency can significantly improve urban economic performance and generate effects of industrial structure adjustment, production factor migration, and living space competition on urban economic development [25].
4.3. Endogeneity Test and Robustness Test
4.3.1. Instrumental Variable Method
To mitigate the potential endogeneity problem arising from the effects of water resource abundance and water use efficiency on urban economic resilience, this paper refers to existing studies [51] and selects river density (RD) and urban slope (US) as instrumental variables. As natural geographical characteristics, river density and slope are naturally exogenous and not reversely affected by urban economic resilience. River density can indirectly affect water resource abundance through influencing the initial endowment of regional water resources, and urban slope can affect water use efficiency by changing surface runoff velocity and water availability. Both satisfy the exogeneity requirement and are uncorrelated with the error term. Considering that the two instrumental variables are cross-sectional data and cannot be directly used in the econometric analysis of panel data, this paper further refers to previous studies [52] and constructs time-varying instrumental variables by interacting the two instrumental variables with the “mean value of water resource abundance of other cities in the same province and year (MWRA)” and the “mean value of water use efficiency of other cities in the same province and year (MWUE)”, respectively. This construction not only retains the exogeneity of geographical endowment variables but also endows the instrumental variables with time variation through regional contemporaneous characteristics, thus ensuring the rationality of the regression results.
This paper employs the two-stage least squares (2SLS) method to conduct instrumental variable regression. The choice of 2SLS over other robust estimation techniques such as fully modified ordinary least squares (FMOLS) is mainly based on the following considerations. On the one hand, 2SLS is the most classic and widely used method for addressing endogeneity in panel data, especially suitable for scenarios with clearly exogenous instrumental variables. The FMOLS method is mainly applied to deal with cointegration relationships in non-stationary time series data and obtain consistent estimators by correcting serial correlation and endogeneity bias. This study adopts balanced panel data, which includes multiple urban cross-sectional units and multiple time observations, and all variables have passed the stationarity test, so the data structure is more appropriate for the panel instrumental variable approach. On the other hand, the 2SLS method can effectively handle the correlation between endogenous explanatory variables and error terms in panel data, and has a mature system for testing the validity of instrumental variables (such as weak instrument tests and overidentification tests), which facilitates rigorous examinations of the exogeneity and relevance of the instrumental variables constructed in this study to ensure the reliability of the estimation results. The results of instrumental variable regression are shown in Table 4. Columns (1) and (2) present the first-stage and second-stage regression results, respectively, using river density as the instrumental variable for water resource abundance. The first-stage results show that the coefficient of RD × MWRA is −0.349, significant at the 1% level, which satisfies the relevance requirement of the instrumental variable. The Kleibergen-Paap rk LM statistic is 49.849 with a corresponding p-value of 0.000, rejecting the null hypothesis of underidentification of instrumental variables. The Cragg-Donald Wald F statistic is 226.590, and the Kleibergen-Paap rk Wald F statistic is 103.829, both greater than the Stock-Yogo critical value of 16.38 at the 10% level for weak identification, indicating no weak instrument problem. The second-stage results show that the coefficient of WRA is −0.022, significant at the 10% level, which is basically consistent with the baseline regression results. In addition, columns (3) and (4) report the first-stage and second-stage results using river density as the instrumental variable for water use efficiency. Columns (5) and (6) show the first-stage and second-stage results using urban slope as the instrumental variable for water resource abundance. Columns (7) and (8) present the first-stage and second-stage results using urban slope as the instrumental variable for water use efficiency. According to the relevant results, the selected instrumental variables are reasonably valid and strongly correlated with the endogenous variables. Water resource abundance exerts a significantly negative effect on urban economic resilience, whereas water use efficiency shows a significantly positive impact. In other words, after addressing the endogeneity issue using the instrumental variable method, the core conclusions of this paper remain robust.
Table 4.
Regression results of instrumental variables.
4.3.2. Adding Omitted Variables
To mitigate the interference of endogeneity caused by omitted variables on the regression results, referring to previous studies [53], this paper sequentially adds three control variables, namely medical level (ML), transportation conditions (TC), and industrial structure (IS), on the basis of the original control variables. Specifically, medical level is measured by the number of hospital beds, transportation conditions are measured by total highway mileage, and industrial structure is measured by the ratio of the added value of the tertiary industry to that of the secondary industry. The results in Table 5 show that after gradually including the omitted variables, the coefficients and significance levels of the core variables remain robust. This indicates that the relationships between water resource abundance, water use efficiency, and urban economic resilience are reliable, and there is likely no serious estimation bias caused by omitted variables.
Table 5.
Regression results with additional omitted variables.
4.3.3. Replacing the Dependent Variable
Referring to previous studies [54], the core variable used to measure economic resilience is replaced from GDP by fixed asset investment, and economic resilience is recalculated using the same method. The regression results are shown in columns (1) and (2) of Table 6. Meanwhile, referring to existing studies [55], the measurement method of economic resilience is replaced. Urban economic resilience is measured by the difference between the annual GDP growth rate of each city and the GDP growth rate of the Yellow River Basin. A larger difference indicates higher economic resilience. The regression results are presented in columns (3) and (4) of Table 6. The results in Table 6 show that the negative impact of water resource abundance and the positive impact of water use efficiency remain significant, indicating that the core conclusions do not depend on the measurement method of the economic resilience indicator and the results are robust.
Table 6.
Regression results by replacing the dependent variable.
4.3.4. Replacing Explanatory Variables
To test the robustness of the baseline regression results and address potential endogeneity issues, this paper refers to previous studies [56,57,58,59,60] and replaces the measurement methods of water resource abundance and water use efficiency. Specifically, water resource abundance is measured by total water resources, and water use efficiency is measured by water consumption per unit of industrial added value. The results in Table 7 show that the negative effect of water resource abundance and the positive effect of water use efficiency remain significant, indicating that the core conclusions do not depend on the measurement methods of explanatory variables and the results are robust.
Table 7.
Regression results by replacing explanatory variables.
4.3.5. Removing Partial Samples
Compared with other cities, provincial capital cities have access to more abundant policy and economic resources. Therefore, this paper excludes eight provincial capital cities, including Taiyuan and Xi’an, and re-estimates the regression model. The regression results are shown in columns (1) and (2) of Table 8. Since the 18th National Congress of the Communist Party of China, China has paid increasing attention to resource and environmental issues in the Yellow River Basin. Considering policy continuity, this paper excludes the sample data of 2011, and the regression results are presented in columns (3) and (4) of Table 8. In addition, considering the economic impact of the COVID-19 pandemic [61], this paper excludes the sample data of 2021, with the regression results shown in columns (5) and (6) of Table 8. The results in Table 8 show that after removing partial samples, the negative effect of water resource abundance on economic resilience and the positive effect of water use efficiency on economic resilience remain statistically significant. This indicates that the particularity of provincial capitals, policies in specific years, and the shock of the pandemic have not changed the main findings of this paper.
Table 8.
Regression results after removing partial samples.
4.4. Moderating Effect Test
To verify the roles of market demand, government intervention, and opening up in the process whereby water resource abundance and water use efficiency affect urban economic resilience, this paper introduces interaction terms between the two core variables and the three variables of market demand, government intervention, and opening up. The results are presented in Table 9.
Table 9.
Test results of moderating effects.
4.4.1. Moderating Effect of Market Demand
The regression results in column (1) of Table 9 show that the coefficient of WRA × MD is −0.012 and significant at the 1% level, indicating that market demand exacerbates the negative impact of water resource abundance on economic resilience. In other words, for cities in the Yellow River Basin with higher market demand, greater water resource abundance corresponds to weaker economic resilience. The underlying reason may be that high market demand stimulates the intensive development of water resources. Especially in the absence of effective regulation, abundant water resources tend to be allocated to low value-added and water-intensive traditional industries, which weakens cities’ ability to adjust to environmental or economic shocks. The regression results in column (2) of Table 9 show that the coefficient of WUE × MD is 0.005 and significant at the 10% level, indicating that market demand strengthens the positive impact of water use efficiency on economic resilience. That is to say, in cities with higher market demand, improving water use efficiency has a more pronounced effect on enhancing economic resilience. This is because high market demand usually implies more active economic activities and stronger competitive pressure, which incentivize enterprises to improve water use efficiency through technological innovation and management optimization, so as to reduce costs and enhance competitiveness. In summary, hypothesis H3 is verified.
4.4.2. Moderating Effect of Government Intervention
The regression results in column (3) of Table 9 show that the coefficient of WRA × GI is −0.015 and significant at the 1% level, indicating that government intervention exacerbates the negative impact of water resource abundance on economic resilience. This reflects the behavioral logic of some local governments in the Yellow River Basin under the advantage of resource endowment. When water resources are relatively abundant, governments may be more inclined to support water-intensive industries through administrative means to stabilize fiscal revenue and employment. Such a policy orientation tends to solidify the industrial structure, hinder the adoption of green technologies and institutional innovation, and result in a decline in economic resilience. The regression results in column (4) of Table 9 show that the coefficient of WUE × GI is 0.009 and significant at the 5% level, indicating that government intervention strengthens the positive effect of water use efficiency on economic resilience. This is because, as a key region for national ecological strategy, local governments in the Yellow River Basin can guide market entities to translate improved water use efficiency into actual green productivity through policy instruments such as formulating strict water resource management systems, providing water-saving subsidies or tax incentives, and promoting industrial water-saving retrofits. In summary, hypothesis H4 is verified.
4.4.3. Moderating Effect of Opening Up
The regression results in column (5) of Table 9 show that the coefficient of WRA × OU is −0.005 and significant at the 5% level, indicating that opening up exacerbates the negative impact of water resource abundance on economic resilience. Although opening up promotes the optimization of resource allocation, deep integration into the global division of labor may lead water-abundant cities to rely excessively on the export of water-intensive primary products. When the international market fluctuates, such cities have weak shock resistance due to their short industrial chains and low substitutability. The regression results in column (6) of Table 9 show that the coefficient of WUE × OU is 0.004 and significant at the 5% level, indicating that opening up strengthens the positive impact of water use efficiency on economic resilience. This is consistent with the logic that “opening up drives efficiency, and efficiency enhances resilience”. That is, cities with a higher degree of opening up have easier access to international advanced water-saving technologies, green production standards, and sustainable development concepts, which force domestic enterprises to improve water use efficiency. Meanwhile, integration into the global value chain also promotes the transformation of local industries toward high value-added and low water-consumption patterns, enabling the improvement of water use efficiency to be more effectively translated into the stability and adaptability of the economic system, thereby enhancing resilience. In summary, hypothesis H5 is verified.
4.5. Heterogeneity Analysis
4.5.1. Heterogeneity of Background Conditions
(1) Heterogeneity of Resource Dependence
The Yellow River Basin is rich in resources and serves as an important energy, chemical, raw material, and heavy industry base in China, with a large number of resource-based cities within the basin. Differences in urban resource endowments affect the local water consumption structure and industrial structure, thereby further influencing economic resilience [62]. Therefore, referring to relevant Chinese regulations, cities in the Yellow River Basin are classified into non-resource-based cities and resource-based cities [63], and the regression results are shown in Table 10. In column (1), the coefficient of WRA is −0.010 and statistically insignificant, while in column (2), the coefficient of WRA is −0.024 and significant at the 5% level. This indicates that water resource abundance has a significantly negative impact on urban economic resilience in resource-based cities, whereas the effect is insignificant in non-resource-based cities. In column (3), the coefficient of WUE is 0.018 and significant at the 1% level, and in column (4), the coefficient of WUE is 0.044 and significant at the 1% level. This indicates that water use efficiency has a significantly positive impact on urban economic resilience in both resource-based and non-resource-based cities, with a stronger positive effect in resource-based cities. These results show that, as resource-based cities in the Yellow River Basin rely heavily on resource extraction, the “curse effect” of water resource abundance is more prominent, while the “salvation effect” of water use efficiency is more critical. That is, it is necessary to alleviate the risk of water shortage for industries through efficient water use and simultaneously force industrial transformation.
Table 10.
Regression results of heterogeneity in resource dependence.
(2) Heterogeneity of Water Resource Endowment
Cities in the Yellow River Basin present significant differences in total water resources, which directly affect urban water supply security and industrial layout. Grouping samples by total water resources can reveal the heterogeneous impacts of water resources on economic resilience under conditions of water abundance and scarcity, identify the mechanism of resource constraints on the shock resistance of the economic system, and provide a basis for differentiated water resource management. Therefore, this paper takes the median of total water resources as the cutoff point and divides the sample into water-scarce cities and water-abundant cities. The regression results are shown in Table 11. In column (1), the coefficient of WRA is 0.003 and statistically insignificant, while in column (2), the coefficient of WRA is −0.039 and significant at the 1% level. This indicates that water resource abundance exerts an insignificant impact on urban economic resilience in water-scarce cities but a significantly negative impact in water-abundant cities. In column (3), the coefficient of WUE is 0.034 and significant at the 1% level, and in column (4), the coefficient of WUE is 0.046 and significant at the 1% level. This indicates that water use efficiency has a significantly positive impact on urban economic resilience in both water-scarce and water-abundant cities, with a stronger positive effect in water-abundant cities. These results indicate that relying solely on natural endowments of water resources is insufficient to improve urban economic resilience. Even in regions with relatively abundant water resources, urban ability to cope with shocks may be weakened due to the resource curse effect. In contrast, as a key indicator reflecting the technical level and management capacity of water resource utilization, water use efficiency can effectively enhance the adaptability and resilience of urban economies through mechanisms such as promoting the transformation of water-saving industries, optimizing resource allocation, and improving factor utilization efficiency, regardless of whether resource constraints are tight or loose. Particularly in water-abundant cities, improving water use efficiency can be more easily transformed into institutional advantages and development momentum, thus exerting a more significant positive effect on economic resilience. Therefore, policy formulation should shift from “prioritizing water quantity” to “prioritizing efficiency”, and promote an efficiency-oriented water resource governance model to effectively improve the sustainable development capacity and risk resistance level of cities in the Yellow River Basin.
Table 11.
Regression results of heterogeneity in water resource endowment.
(3) Regional Heterogeneity
The Yellow River Basin covers a vast territory, with significant differences in natural geographical characteristics, hydrological conditions, ecological functions, and economic and social development patterns across the basin. Therefore, this paper further examines the conditions of cities in the upper, middle, and lower reaches of the Yellow River Basin. The regression results are shown in Table 12. In column (1), the coefficient of WRA is 0.016 but insignificant. In column (3), the coefficient is −0.016 but insignificant. And in column (2), the coefficient is −0.016, significant at the 10% level. That is to say, the impact of water resource abundance on urban economic resilience is insignificant in cities of the upper and middle reaches but significantly negative in cities of the lower reaches. In column (4), the coefficient of WUE is 0.014 but insignificant. In column (5), the coefficient is 0.024, significant at the 1% level. And in column (6), the coefficient is 0.032, significant at the 5% level. This indicates that the impact of water use efficiency on urban economic resilience is insignificant in cities of the upper reaches but significantly positive in cities of the middle and lower reaches. These results are related to regional development stages and resource utilization models. The upper and middle reaches are mostly ecological function areas or resource-dependent economic regions. Although water resources are relatively abundant, their economic transformation capacity is limited, making it difficult to effectively convert them into resilience against external shocks. In contrast, the lower reaches feature a high level of industrialization and urbanization. Excessive reliance on water resource endowments tends to form a water-intensive and inefficient industrial structure, which inhibits innovation and diversified development, thereby weakening economic resilience and showing the resource curse effect. Meanwhile, the insignificant effect of water use efficiency in the upper reaches may be attributed to its weak technological foundation, insufficient investment in water conservation, and weak response of the economic structure to efficiency improvement. In the middle and lower reaches, the sound industrial system, strong policy implementation capacity, and advanced technological level enable the improvement of water use efficiency to effectively promote optimal resource allocation and green transformation.
Table 12.
Regression results of regional heterogeneity.
4.5.2. Heterogeneity of Development Level
(1) Heterogeneity of Economic Development
Cities with different levels of economic development have systematic differences in economic structure, capital accumulation, and risk resistance capacity [64]. Cities with a higher level of economic development usually have stronger infrastructure investment capacity and industrial adjustment flexibility, enabling them to better cope with shocks caused by water resource fluctuations. Therefore, this paper uses per capita GDP to measure the level of urban economic development and divides the sample into cities with high economic development and cities with low economic development based on the median value. The regression results are presented in Table 13. In column (1), the coefficient of WRA is −0.001 and statistically insignificant, whereas in column (2), the coefficient of WRA is −0.019 and significant at the 5% level. This indicates that water resource abundance has a significantly negative impact on urban economic resilience in cities with high economic development, while the effect is insignificant in cities with low economic development. In column (3), the coefficient of WUE is 0.017 and significant at the 5% level, and in column (4), the coefficient of WUE is 0.032 and significant at the 1% level. This indicates that the positive impact of water use efficiency on urban economic resilience is stronger in cities with high economic development. This is because cities with high economic development feature industrial agglomeration and tend to fall into extensive water use and path dependence due to abundant water resources, which restricts industrial upgrading and intensifies shocks from ecological constraints, thus resulting in a negative effect of water resource abundance. Meanwhile, their advanced technological and management systems enable improvements in water use efficiency to be more effectively translated into economic resilience. In cities with low economic development, the industrial scale is small and the degree of water resource development and utilization is low, so the marginal impact of changes in water abundance is limited. Although improving water use efficiency can alleviate basic water constraints and ensure industrial stability, its empowering effect is weaker than that in cities with high economic development due to limitations in technology and capital.
Table 13.
Regression results of heterogeneity in economic development.
(2) Heterogeneity of Urbanization
The level of urbanization comprehensively reflects differences among cities in population agglomeration, industrial structure upgrading, infrastructure improvement, and public service supply capacity [65]. Cities with high urbanization usually face higher water demand and greater system operation pressure, but often also have stronger water resource management capacity and economic adjustment flexibility. This paper divides the sample into cities with high urbanization and cities with low urbanization based on the median urbanization rate. The regression results are presented in Table 14. In column (1), the coefficient of WRA is −0.005 and statistically insignificant, whereas in column (2), the coefficient of WRA is −0.018 and significant at the 10% level. This indicates that the negative impact of water resource abundance on urban economic resilience is only significant in cities with high urbanization. In column (3), the coefficient of WUE is 0.019 and significant at the 5% level, and in column (4), the coefficient of WUE is 0.038 and significant at the 1% level. This indicates that the positive impact of water use efficiency on economic resilience is stronger in cities with high urbanization. This is because cities with high urbanization feature a high concentration of population and industries. Over-exploitation of water resources leads to excess ecological carrying capacity and rising water supply costs, triggering the resource curse effect. In the process of urbanization, improved infrastructure and accelerated technology diffusion provide greater potential for improving water use efficiency in cities with high urbanization. Moreover, stricter water-saving policies and market-oriented mechanisms can further amplify the positive impact of efficiency improvement on industrial upgrading and the risk resistance capacity of the economic system.
Table 14.
Regression results of heterogeneity in urbanization.
(3) Heterogeneity of Technology Input
Technology input serves as a key engine for breaking through the bottleneck of water resource constraints, improving utilization efficiency, and transforming it into the core driving force of economic resilience. It achieves a systematic upgrade in water conservation, consumption reduction, recycling, and risk resistance capacity through technological innovation [66]. This paper measures urban technology input by science and technology expenditure and divides the sample into cities with high technology input and cities with low technology input according to the median value. The regression results are shown in Table 15. In column (1), the coefficient of WRA is 0.006 and statistically insignificant, whereas in column (2), the coefficient of WRA is −0.019 and significant at the 5% level. This indicates that the impact of water resource abundance on urban economic resilience is significantly negative only in cities with high technology input. In column (3), the coefficient of WUE is 0.016 and insignificant, while in column (4), the coefficient of WUE is 0.029 and significant at the 1% level. This indicates that the positive impact of water use efficiency on urban economic resilience is significantly positive only in cities with high technology input. This is because cities with high technology input have a solid foundation for technological innovation and industrial upgrading. Abundant water resources may easily lead them to fall into path dependence on traditional water-intensive industries, restricting green transformation and intensifying shocks from ecological constraints. In contrast, high-tech-enabled water-saving technologies and recycling models can effectively translate improved water use efficiency into economic risk resistance capacity. Cities with low technology input lack sufficient technical support and are dominated by traditional industries, with a low level of water resource development and utilization and weak motivation for water-saving transformation. Therefore, marginal changes in water resource abundance and improvements in water use efficiency can hardly exert substantial impacts on economic resilience.
Table 15.
Regression results of heterogeneity in technological input.
5. Conclusions and Recommendations
5.1. Conclusions
Based on panel data of 78 prefecture-level cities in the Yellow River Basin from 2011 to 2023, this paper systematically examines the impacts of water resource abundance and water use efficiency on urban economic resilience. It further explores the moderating effects of market demand, government intervention, and opening up, as well as the heterogeneous characteristics under multiple scenarios such as resource dependence and water resource endowment. The main research conclusions are as follows.
(1) Conditions of economic resilience, water resource abundance and water use efficiency in the Yellow River Basin. From the overall perspective of the Yellow River Basin, from 2011 to 2023, economic resilience showed a trend of first declining and then rising with fluctuations, water resource abundance generally decreased first and then increased, and water use efficiency exhibited relatively obvious fluctuations with an overall fluctuating upward trend. At the provincial level, economic resilience was generally relatively high but varied significantly across years, among which Ningxia had a relatively high and stable level of economic resilience. Water resource abundance in all provinces was generally low and changed steadily over years, with Shaanxi and Gansu having relatively higher water resource abundance. Water use efficiency across provinces was generally low, among which Inner Mongolia, Ningxia and Gansu had relatively higher water use efficiency. At the city level, urban economic resilience displayed obvious regional disparities and significant temporal changes. Urban water resource abundance was characterized by “few and scattered high-abundance areas and widely distributed low-abundance areas”. Urban water use efficiency showed an overall upward trend: the scope of low water use efficiency areas gradually shrank, while high water use efficiency areas increased significantly and expanded in distribution.
(2) Water resource abundance and water use efficiency exert significant and opposite impacts on economic resilience. The benchmark regression results show that water resource abundance has a significant inhibitory effect on economic resilience regardless of whether control variables are included, indicating the presence of a “resource curse” phenomenon in the Yellow River Basin. That is, cities with more abundant water resources tend to have weaker resilience and transformation capacity of their economic systems when facing external shocks. In contrast, water use efficiency plays a significant positive role in promoting economic resilience, meaning that higher water use efficiency corresponds to stronger urban economic resilience. By comparison, the positive impact of water use efficiency is greater in magnitude than the negative impact of water resource abundance, suggesting that the quality of water resource utilization plays a more prominent role in shaping urban economic resilience than the quantity of water endowment.
(3) Market demand, government intervention, and opening up exert significant moderating effects. The results of the moderating effect test show that market demand, government intervention and opening up intensify the negative impact of water resource abundance on economic resilience. That is to say, in cities of the Yellow River Basin with higher market demand, greater water resource abundance is associated with weaker economic resilience. Meanwhile, market demand, government intervention and opening up also strengthen the positive impact of water use efficiency on economic resilience. These two sets of results indicate that external environmental factors such as market demand and government intervention further amplify the differentiated impacts of water resource abundance and water use efficiency on economic resilience. This is because, in an environment with higher market demand, stronger government intervention and higher opening up, the easy availability of water resources is more likely to breed development inertia and path dependence, thus magnifying the resource curse effect. In contrast, the competitive advantages and risk-resistance capacity brought by improved water use efficiency can be enhanced in such contexts.
(4) The impacts of water resource abundance and water use efficiency on economic resilience exhibit significant heterogeneity. The results of the heterogeneity analysis show that water resource abundance exerts a significantly negative effect on economic resilience in resource-based cities, water-abundant cities, cities in the lower reaches, cities with high economic development, cities with high urbanization, and cities with high technology input. However, this effect is insignificant in non-resource-based cities, water-scarce cities, cities in upper and middle reaches, cities with low economic development, cities with low urbanization cities, and cities with low technology input. In comparison, the positive impact of water use efficiency on economic resilience is significant in most cities except for cities in the upper reaches and cities with low technology investment, and this positive effect is more pronounced in resource-based cities, water-abundant cities, cities in the middle reaches, cities with high economic development, and cities with high urbanization. This finding reveals that the resource curse is not a universal phenomenon but only emerges under specific stages and conditions of urban development. Meanwhile, it indicates that cities with favorable resource endowments and high development levels possess greater potential and ability to break through development bottlenecks through efficiency improvement, yet they also need to be more vigilant against the resource curse effect.
5.2. Discussion
This study finds that water resource abundance in the Yellow River Basin shows an overall trend of first decreasing and then increasing, accompanied by a “resource curse” phenomenon. Similar conclusions have been reached in previous studies. For example, Zhang et al. found that the resource curse effect in resource-based cities of the Yellow River Basin exhibits a downward trend overall, and the curse effect differs across resource-based cities at different life-cycle stages [67]. In addition, Wei and Yang Chao noted that extensive water use patterns remain prominent in the northwest region of the middle and upper Yellow River Basin, and the resource curse phenomenon still exists in some areas [68]. However, compared with previous studies that directly estimated the resource curse coefficient [23] or explored the impact of water resource endowment on household income and economic development [69], this paper focuses on the impact of water resource abundance on urban economic resilience. Such an impact is insignificant in the upper and middle reaches of the Yellow River, but significantly negative in the lower reaches.
This study finds that water use efficiency in the Yellow River Basin shows an overall fluctuating upward trend. Similar conclusions have been reached in previous studies. For example, Xing et al. pointed out that water use efficiency in the Yellow River Basin presents an upward trend with a relatively small growth rate and exhibits a spatial distribution pattern of “high in the east and low in the west” [70]. However, some scholars hold different views. For instance, based on data from 45 cities in the Yellow River Basin during 2008–2018, Shao et al. found that water resource use efficiency in the region showed an overall downward trend, with gradually widening disparities among cities [71]. Such divergent research conclusions are mainly attributed to differences in sample size, research period, and measurement methods. In addition, scholars have further explored water use efficiency in the agricultural and industrial sectors of the Yellow River Basin. For example, Xue and Song noted that agricultural water use efficiency in the Yellow River Basin shows a W-shaped fluctuating upward trend over time, and a rising trend spatially from scattered points to contiguous areas and from the southwest to the northeast [72]. Sun et al. found that industrial water use efficiency in the Yellow River Basin fluctuated upward over time, spatially, intra-regional disparities were significant while inter-regional gaps were narrowing, and industrial water use efficiency in the middle and lower reaches was generally higher than that in the upper reaches [38]. It can be observed that the overall trend of total water use efficiency is consistent with that of agricultural and industrial water use efficiency in the Yellow River Basin. This further indicates that the treatment adopted in this paper, in which industrial water use efficiency is used to replace overall water use efficiency for re-regression analysis in the robustness test, can not only avoid the correlation between economic resilience and water use efficiency, but also has reliable data support and practical rationality.
This study finds that economic resilience in the Yellow River Basin shows an overall trend of declining first and then rising with fluctuations. However, some scholars have put forward different viewpoints in previous studies. For example, Li et al. found that economic resilience of 91 cities in the Yellow River Basin showed an overall downward trend from 2008 to 2018 [73]. Zhao and Zhou found that economic resilience of 76 cities in the Yellow River Basin showed an overall upward trend from 2010 to 2021, with significantly higher levels in the lower reaches than in the upper and middle reaches [74]. Such divergent conclusions are closely related to scholars’ research focuses and measurement methods. For instance, Li et al. mainly focused on the changing characteristics of economic resilience in the Yellow River Basin in response to the 2008 international financial crisis [73]. In addition, previous studies have also explored the influencing factors of urban economic resilience. Relevant research shows that human capital, urban innovation capacity, industrial structure optimization and urban income level exert significant positive impacts on urban economic resilience [74]. This paper incorporates such variables into the scope of control variables to effectively isolate the interference of these factors on urban economic resilience. In this study, however, the impacts of human capital, technological innovation, income level on urban economic resilience are found to be insignificant. This further indicates that, in the development stage with increasing resource and environmental pressure, the efficient utilization and allocation efficiency of urban water resources in the Yellow River Basin have a more direct and decisive impact on shaping cities’ ability to cope with external shocks, compared with traditional socioeconomic factors.
This study explores the relationship between water resources and economic resilience from the two perspectives of water resource abundance and water use efficiency. However, previous studies have mostly focused on the relationship between water resources and economic development and often used models such as the coupling coordination degree model and the decoupling model to examine the coupling relationship and decoupling state between them. For example, Li et al. found that the relationship between water footprint and economic growth in the Yellow River Basin was mainly characterized by weak decoupling [75]. Xing et al. pointed out that the coupling coordination degree between economic development and water use efficiency in the Yellow River Basin is in a state of moderate coordination and high coordination, with the level of economic development significantly lagging behind water use efficiency, and high-quality coordinated development has not yet been achieved [70]. Compared with previous studies, this paper mainly focuses on the unidirectional impact of water use efficiency on economic resilience and finds that water use efficiency imposes a positive impact on urban economic resilience. Some previous scholars have also drawn similar conclusions from the perspective of urban economic scale. For example, Yang et al. pointed out that the improvement of water use efficiency will promote urban economic scale and urban expansion by attracting water-intensive enterprises to settle in, accelerating the formation of a polycentric structure of cities, and intensifying the degree of inter-government competition [25].
5.3. Recommendations
Based on the above conclusions, we propose the following policy implications. On the one hand, differentiated water resource management policies should be implemented. For cities in the lower reaches, water-abundant cities, and cities with high economic development, stricter caps on water resource consumption should be imposed to promote the flow of water resources toward high value-added, high-resilience advanced manufacturing and modern service industries. For cities in the upper reaches and water-scarce cities, on the premise of guaranteeing basic water use, efforts should be made to develop water-saving characteristic agriculture and low water-consumption industries. In addition, the improvement of water use efficiency and the enhancement of economic resilience should be taken as core indicators to guide government intervention toward building a fair and efficient water-saving market environment. On the other hand, water use efficiency across all sectors should be comprehensively improved. In the industrial sector, efforts should be made to increase R&D and promotion of water-saving technologies, accelerate water conservation and efficiency improvement in energy, chemical, and other high water-consuming industries, and strictly restrict the development of high water-consuming projects. In the agricultural sector, the proportion of low water-consuming and highly drought-tolerant crops should be expanded, the application of integrated water-fertilizer technology and high-efficiency water-saving irrigation techniques should be promoted, and targeted subsidies and water-saving reward mechanisms for agricultural water use should be established. Furthermore, the construction of the Digital Twin Yellow River system should be accelerated to realize precise monitoring and optimal allocation of water resources through intelligent means, so as to provide technical support for improving water use efficiency in the Yellow River Basin.
5.4. Limitations and Future Prospects
This paper conducts an in-depth analysis of the relationship between water resources and economic resilience, yet certain limitations remain. On the one hand, this study employs single indicators to measure water resource abundance, water use efficiency, and economic resilience. While this ensures data availability and result comparability, it is difficult to reflect the complex connotations of the variables. In the future, a comprehensive evaluation system for water resource abundance can be constructed from multiple dimensions such as water resource stock and ecological flow. Water use efficiency can be measured using methods including the super-efficiency data envelopment analysis (DEA) model and super-efficiency slack-based measure (SBM) model, while economic resilience can be calculated from the dimensions of resistance, resilience, and adaptability. This will comprehensively characterize the connotation of variables and effectively improve measurement accuracy. On the other hand, this paper focuses on exploring the differential impacts of water resource abundance and water use efficiency on urban economic resilience but does not delve into the intrinsic relationship between water resource abundance and water use efficiency, nor their synergistic effects on economic resilience. In the future, methods such as interaction effect models, coupling coordination degree models, and structural equation models can be used to analyze the complex interaction mechanism between water resource abundance and water use efficiency, and clarify the internal transmission logic among variables.
Author Contributions
Conceptualization, J.C. and F.S.; methodology, J.C.; software, J.C.; validation, J.C.; formal analysis, J.C. and F.S.; investigation, J.C.; resources, J.C.; data curation, J.C.; writing—original draft preparation, J.C. and F.S.; writing—review and editing, J.C. and F.S.; visualization, J.C.; supervision, F.S.; project administration, J.C. and F.S.; funding acquisition, J.C. and F.S. All authors have read and agreed to the published version of the manuscript.
Funding
This research was funded by the National Natural Science Foundation of China, grant numbers 42171281 and 72034007; the Shaanxi Provincial Postdoctoral Science Foundation, grant number 2024BSHSDZZ013; and the Shaanxi Provincial Social Science Fund Project, grant number 2025QBD049; and the Shaanxi Provincial Philosophy and Social Sciences Research Special Project, grant number 2026HZ0887.
Data Availability Statement
The original contributions presented in this study are included in the article. Further inquiries can be directed to the corresponding author.
Conflicts of Interest
The authors declare no conflicts of interest.
References
- Wu, F.; Huang, D.; He, Z.; Liu, S. Water competition and drivers for energy-food production in the Yellow River Basin under rigid water resource constraints. Agric. Water Manag. 2025, 322, 109961. [Google Scholar] [CrossRef] [Scilit]
- Chen, Z.F. Conflict of interests and reconstruction path of the Yellow River water rights trading system. Resour. Sci. 2025, 47, 456–468. [Google Scholar] [CrossRef] [Scilit]
- Ma, H.L.; Xiang, H.L.; Pang, Q.H. The impact of new quality productivity development on water resource utilization efficiency in China. Resour. Sci. 2025, 47, 485–500. [Google Scholar] [CrossRef] [Scilit]
- Wu, X.; Wu, F. Combined evaluation model and application of water resources shortage in basin countries. Rev. Econ. Manag. 2024, 40, 45–58. [Google Scholar] [CrossRef]
- Poonia, V.; Mukherjee, A.; Singh, D.A.; Swarnkar, S. Clustering-based assessment of long-term surface water scarcity and per capita vulnerability in arid India. Earth Syst. Environ. 2025, 1–22. [Google Scholar] [CrossRef] [Scilit]
- Ma, N.; Chen, R.X. Spatial dislocation evolution of China’s water, energy, and food and its optimization pathways. China Popul. Resour. Environ. 2024, 34, 132–140. [Google Scholar]
- Huang, H.; Pang, Q.; Shi, C.; Zhi, J. Complex network analysis of water scarcity risk propagation in the Yellow River Basin under the quality–quantity–environmental flow requirement (QQE) framework. J. Clean. Prod. 2026, 538, 147238. [Google Scholar] [CrossRef] [Scilit]
- Du, P.; Du, J.; Liu, Q. Has the water rights trading policy improved water resource utilization efficiency? Water 2025, 17, 3459. [Google Scholar] [CrossRef] [Scilit]
- Xu, X.; He, Y.; Tan, Q.; Chen, X. Measurement and driving mechanisms of water use efficiency in the three major urban agglomerations in China from the perspective of green and sustainable development. Ecol. Indic. 2025, 178, 114094. [Google Scholar] [CrossRef] [Scilit]
- Tang, L.; Zhao, H.; Zhou, Z.; Qian, Z.; Hou, S.; Liu, B. Spatiotemporal distribution and driving factors of water use efficiency in the Yangtze River Delta urban agglomeration under the background of sustainability. Ecol. Indic. 2025, 179, 114159. [Google Scholar] [CrossRef] [Scilit]
- Zhou, D.; Zhou, F. Inspection, measurement and interpretation of club convergence of water resources utilization efficiency in China: 2003–2015. J. Nat. Resour. 2018, 33, 1103–1115. [Google Scholar] [CrossRef] [Scilit]
- Zhao, Y.; Liang, Y.; Feng, T.; Du, Y. How does business ecosystem drive urban economic resilience: A configuration analysis based on complex systems view. Manag. Rev. 2025, 37, 57–71. [Google Scholar] [CrossRef]
- Song, Z.; Lu, J.; Luo, C. The impact of new-type urbanization pilot policy on urban economic resilience: Evidence from China. Appl. Spat. Anal. Policy 2026, 19, 30. [Google Scholar] [CrossRef] [Scilit]
- Zhang, Y.; Xiang, B. The impact of digital economy development on urban economic resilience. Econ. Geogr. 2023, 43, 105–113. [Google Scholar] [CrossRef]
- Cai, Y.; Guo, J.; Shen, C. Green data center pilots and urban economic resilience: Causal inference based on double machine learning. Int. Rev. Econ. Financ. 2026, 106, 104927. [Google Scholar] [CrossRef] [Scilit]
- Lu, X.; Xu, C.; Zhang, F. Research on the impact of city-county merger on urban economic resilience. Public Financ. Res. 2023, 3, 63–77. [Google Scholar] [CrossRef]
- Chen, Y.; Guo, C. Industrial diversification, entrepreneurship, and urban economic resilience. Systems 2025, 13, 366. [Google Scholar] [CrossRef] [Scilit]
- Ge, Y.; Gong, X. Research on the impact and mechanism of green finance on urban economic resilience. Glob. Vis. Res. 2026, 3, 181–183. [Google Scholar] [CrossRef] [Scilit]
- Deng, Q.; Long, Y.; Ni, X.; Jiang, Y. How does technological innovation affect urban economic resilience? Evidence from 276 Chinese cities. Humanit. Soc. Sci. Commun. 2025, 12, 1897. [Google Scholar] [CrossRef] [Scilit]
- Yan, Z.; Xu, Z.; Zhang, J. The “Resilience Code” in the digital age: Virtual agglomeration and urban economic resilience. J. Financ. Econ. 2025, 51, 49–63. [Google Scholar] [CrossRef]
- Tuo, C.; Sun, H.; Yang, J.; Zhou, J. Institutional opening-up, production networks, and urban economic resilience. Econ. Perspect. 2025, 173–192. [Google Scholar]
- Liu, Y.; Xiao, X.; Shao, C. Dynamic transformation mechanism and spatial heterogeneity analysis to water and land resources constraints in the Yangtze River Economic Zone. China Popul. Resour. Environ. 2019, 29, 89–98. [Google Scholar]
- Wang, Y.; Wang, H.; Liu, G.; Huang, J. Spatial distribution analysis of resource curse based on ecological priority—A case study of the Yellow River Basin. Soft Sci. 2019, 33, 50–55. [Google Scholar] [CrossRef]
- An, H.; Wang, Y.; An, M.; Wang, L. Spatial-temporal evolution of water resources green efficiency and potential of water-saving and emission-abating in cities along Yangtze River Economic Belt. Resour. Environ. Yangtze Basin 2023, 32, 692–705. [Google Scholar]
- Yang, P.; Tang, F.; Liu, Z.; Mao, J. Influencing mechanisms and spatial effects of water resource utilization efficiency on urban economic development. China Popul. Resour. Environ. 2025, 35, 176–190. [Google Scholar]
- Yu, H.; Mei, Z.; Huang, Y. Decoupling analysis of water resource utilization and high-quality economic development in the Wei River Basin, Shaanxi Province. Environ. Resour. Ecol. J. 2025, 9, 89–103. [Google Scholar] [CrossRef] [Scilit]
- Rong, L.; Duan, Y.; Duan, S. The impact of water resource constraints on industrial linkages in the Yellow River basin. Front. Environ. Sci. 2024, 12, 1360451. [Google Scholar] [CrossRef] [Scilit]
- Hong, C.; Shen, D. Is industrial structure determined on water endowment in China? An empirical study of 31 provinces between 2011 and 2021. J. Clean. Prod. 2024, 479, 144075. [Google Scholar] [CrossRef] [Scilit]
- Zhou, J.; Xu, G. Is globalization a “curse” or a “gospel” for green economic growth? Analysis based on the perspective of factor market distortion. Financ. Trade Res. 2020, 31, 14–27. [Google Scholar] [CrossRef]
- Yang, G.; Gui, Q.; Liu, J.; Zhang, F.; Cheng, S. The relationship between water resources use efficiency and scientific and technological innovation level: Case study of Yangtze River Basin in China. J. Environ. Earth Sci. 2023, 5, 15–35. [Google Scholar] [CrossRef] [Scilit]
- Pan, J.; Peng, J.; Yang, X.; Xuan, S. Does water rights trading promote resources utilisation efficiency and green growth? Evidence from China’s resources trading policy. Resour. Policy 2023, 86, 104235. [Google Scholar] [CrossRef] [Scilit]
- Zhang, Y.; Liu, Y.; Xu, C. Spillover effects of environmental regulations on water use efficiency: A case study of the Yellow River Basin in China. Water Econ. Policy 2025, 11, 2540008. [Google Scholar] [CrossRef] [Scilit]
- Xiao, Q.; Deng, Z. Measurement, source decomposition and formation mechanism of eco-civilization development gap under the dual carbon goal: Based on the perspective of major national strategies region. Inq. Econ. Issues 2024, 172–190. [Google Scholar]
- Zhang, M.; Ren, Y.; Liu, Y. Coordination degree and driving factors of water resources utilization efficiency and ecological resilience in China. World Reg. Stud. 2025, 34, 168–180. [Google Scholar] [CrossRef]
- Niu, X.; He, Z.; Chen, Y.; Liu, Y. Decrypting water–energy–food nexus resilience in the Yellow River Basin: Spatiotemporal evolution, internal obstacles, and external drivers. J. Clean. Prod. 2026, 542, 147527. [Google Scholar] [CrossRef] [Scilit]
- Chen, Y.P.; Qian, S.Y.; Jiang, Q.Q.; Hou, L.Y. Spatial equilibrium diagnosis of water resources in Yellow River Basin based on two-stage diagnostic model. Resour. Sci. 2025, 47, 2537–2550. [Google Scholar] [CrossRef] [Scilit]
- Cai, C.; Tang, J.; Li, Z. The synergistic evolution of tourism development and ecological civilization construction in the Yellow River Basin. J. Nat. Resour. 2025, 40, 3048–3072. [Google Scholar] [CrossRef] [Scilit]
- Sun, C.Z.; Song, Q.M.; Hao, S. Correlation characteristics of spatial network and driving factors of industrial green water resource efficiency in the Yellow River Basin. Resour. Sci. 2025, 47, 587–603. [Google Scholar] [CrossRef] [Scilit]
- Li, J.J.; Li, S.Y. Impact of heterogeneous environmental regulations on the high-quality green development of transportation enterprises. China Popul. Resour. Environ. 2025, 35, 122–134. [Google Scholar]
- Yu, L.; Jiang, Q.J. The impact of heterogeneous environmental regulation on the green development of fisheries in China. Sci. Geogr. Sin. 2024, 44, 319–328. [Google Scholar] [CrossRef]
- Wang, S.H.; Yang, Z.W.; Zhang, W.; Zhang, S.L. The impact of heterogeneous environmental regulation on the economic resilience of carbon-neutral enterprises. Chin. J. Manag. 2023, 20, 1771–1780. [Google Scholar]
- Cheng, G.B.; Jin, Y. Can the improvement of innovation abliliy enhance the resilience of urban economy ? Mod. Econ. Res. 2022, 2, 1–11+32. [Google Scholar] [CrossRef]
- Hu, Y.; Chen, Y.Q.; Li, Y. The impact of digital economy on urban economic resilience in the Yangtze River Delta Region. J. East China Norm. Univ. (Humanit. Soc. Sci.) 2022, 54, 143–154+175–176. [Google Scholar] [CrossRef]
- Jiang, H.L.; Sun, S.L.; Jiang, P.C. Public data openness and urban economic resilience: Empirical evidence based on the launch of government public data platforms. Econ. Rev. J. 2025, 9, 94–106. [Google Scholar] [CrossRef]
- Chen, A. Agglomeration and urban economic resilience in China. J. World Econ. 2022, 45, 158–181. [Google Scholar] [CrossRef]
- Yao, S.; Han, J. Retesting of “resource curse” based on different perspectives of resource abundance and dependence—A case study of panel data of 10 cities in Shaanxi Province. Econ. Surv. 2017, 34, 14–19. [Google Scholar] [CrossRef]
- Yao, T.; Liu, S. Comparison of the variation characteristics of water resource use efficiency indicators in the Beijing-Tianjin-Hebei region. Prog. Geogr. 2021, 40, 1195–1207. [Google Scholar] [CrossRef] [Scilit]
- Chao, X.; Xue, Z. The impact of new information infrastructure on China’s economic resilience—Empirical evidence from Chinese cities. Econ. Perspect. 2023, 3, 44–62. [Google Scholar]
- Wu, H.; Li, H. Technological diversification and urban economic resilience enhancement. Urban Probl. 2025, 6, 28–39. [Google Scholar] [CrossRef]
- Zuo, Q.; Zhang, Z.; Ma, J. Relationship between water resource utilization level and socio-economic development in the Yellow River Basin. China Popul. Resour. Environ. 2021, 31, 29–38. [Google Scholar]
- Chen, X.; Qiu, B.; Zhang, Q.; Zhang, L. Financial spatial distribution and the embedding of companies in global production chain. Econ. Res. J. 2022, 57, 101–117. [Google Scholar]
- Wang, Y.; Guo, Y. Firm digital transformation and ESG performance: Evidence from China’s A-share listed firms. J. Financ. Econ. 2023, 49, 94–108. [Google Scholar] [CrossRef]
- Wang, L.; Shao, X. Local government debt expansion and urban economic resilience: Research based on the evidence of 275 cities in China. Inq. Econ. Issues 2025, 85, 173–190. [Google Scholar]
- Xu, Y.; Zhang, L. The economic resilience of Chinese cities and its origin: From the perspective of diversification of industrial structure. Financ. Trade Econ. 2019, 40, 110–126. [Google Scholar] [CrossRef]
- Zhang, Y.; Zhang, Y.; Deng, S. Technology, industrial structure and urban economic resilience: Experience investigation from 278 prefecture-level cities in China. Nankai Econ. Stud. 2022, 12, 150–168. [Google Scholar] [CrossRef]
- Sun, P. Spatio-temporal patterns and interactive effects of manufacturing carbon emissions and IFDI in the Yangtze River Economic Belt. Resour. Environ. Yangtze Basin 2025, 34, 252–267. [Google Scholar]
- Wang, S.G. Digital economy and high-quality agricultural development: Influence effects and action paths. Stat. Decis. 2024, 40, 21–26. [Google Scholar] [CrossRef]
- Yu, L.H.; Cheng, S.J. Can the ecological protection compensation system improve regional water use efficiency? An empirical study based on water right pilot. J. Financ. Econ. 2023, 49, 19–33. [Google Scholar] [CrossRef]
- Fang, T.T.; Wang, L.; Duan, X.J.; Zou, H.; Wang, Y.Z. Spatiotemporal change of green watershed development level of the Yangtze River Economic Belt from the perspective of human-water relationship. Resour. Sci. 2025, 47, 543–557. [Google Scholar]
- Wang, H.; Wei, L.; Cui, W. Spatiotemporal heterogeneity of water resource carrying capacity in Jiangxi Province. Resour. Environ. Yangtze Basin 2025, 34, 2740–2752. [Google Scholar]
- An, S.; Huang, Y. Impact mechanism of public health emergencies on regional economic resilience and its response: Evidence from the COVID-19 in China. China Soft Sci. 2024, 76–85. [Google Scholar]
- Mao, Q.; Zhou, W.; Wang, H. Entrepreneurship and natural resource curse on regional economic resilience: Evidence from China. J. Reg. Sci. 2025, 65, 1039–1057. [Google Scholar] [CrossRef] [Scilit]
- Chen, G.; Peng, J. Green effect of digital economy from a water-energy-food nexus perspective in China’s Yellow River Basin. J. Manag. 2025, 38, 146–158. [Google Scholar] [CrossRef]
- Yue, X.; Wu, Y.; Wang, Y.; Li, W.; Wang, Y.; Sun, G.; Zhang, H. Does urban economic development increase sewage discharge intensity? A case study of 288 cities in China. Water 2025, 17, 2251. [Google Scholar] [CrossRef] [Scilit]
- Tong, N.; Frazier, E.A.; Tong, L.; Hu, S. Synergistic pathways between urbanization and low-carbon development: Evidence from the Yangtze River Economic Belt. J. Environ. Manag. 2025, 392, 126740. [Google Scholar] [CrossRef] [Scilit]
- Dan, H.; Yahua, T.; Luyan, W.; Mohsin, M. Can increasing technological complexity help strengthen regional economic resilience? Econ. Change Restruct. 2023, 56, 4043–4070. [Google Scholar] [CrossRef] [Scilit]
- Zhang, Z.L.; Wang, B.; Long, Z.; Chen, Y.B. Fiscal decentralization, industrial upgrading, technological progress and “resource curse”—Empirical analysis of resource-based cities in the Yellow River Basin. Econ. Surv. 2021, 38, 133–141. [Google Scholar] [CrossRef]
- Wei, J.; Yang, C. Spatial-temporal features and driving factors of water resources utilization efficiency in the northwest China along the middle and upper reaches of the Yellow River. Ningxia Soc. Sci. 2022, 143–152. [Google Scholar]
- Liu, Z. Empirical study on the ecological governance performance of the Yellow River Basin and its influencing factors. China Soft Sci. 2022, 11–21. [Google Scholar]
- Xing, X.; Xiu, C.; Liu, Y. Research on coupling and coordination relationship between water resources utilization efficiency and economic development. Soft Sci. 2020, 34, 44–50. [Google Scholar] [CrossRef]
- Shao, H.H.; Luo, J.; Wang, Y. Spatiotemporal differentiation and dynamic evolution of urban water resource utilization efficiency in the Yellow River Basin. Stat. Decis. 2022, 38, 70–74. [Google Scholar] [CrossRef]
- Xue, X.D.; Song, P.Y. Spatiotemporal heterogeneity and driving factors of green efficiency of agricultural water resources under environmental regulation: A case study of nine provinces in China’s Yellow River Basin. Chin. J. Agric. Resour. Reg. Plan. 2026, 1–15. [Google Scholar]
- Li, L.G.; Zhang, P.Y.; Cheng, Y.; Wang, C.X. Spatio-temporal evolution and influencing factors of economic resilience in the Yellow River Basin. Sci. Geogr. Sin. 2022, 42, 557–567. [Google Scholar] [CrossRef]
- Zhao, L.; Zhou, X.Y. Spatiotemporal differentiation and influencing factors of urban economic resilience in the Yellow River Basin. J. Xi’an Univ. Financ. Econ. 2025, 38, 93–105. [Google Scholar] [CrossRef]
- Li, R.; Bai, Y.; Zhou, Y.; Huang, S.; Yan, Z.; Li, Y.; Zhao, H. Decoupling and decomposition of driving factors of water resources utilization and economic growth in the Yellow River Basin. Sci. Geogr. Sin. 2023, 43, 110–118. [Google Scholar] [CrossRef]
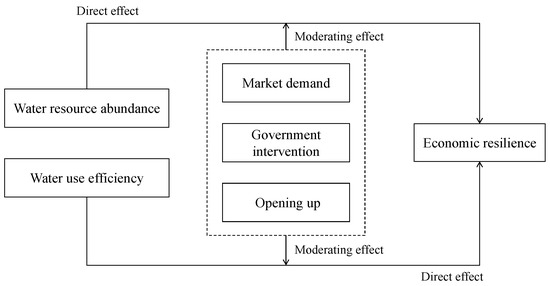
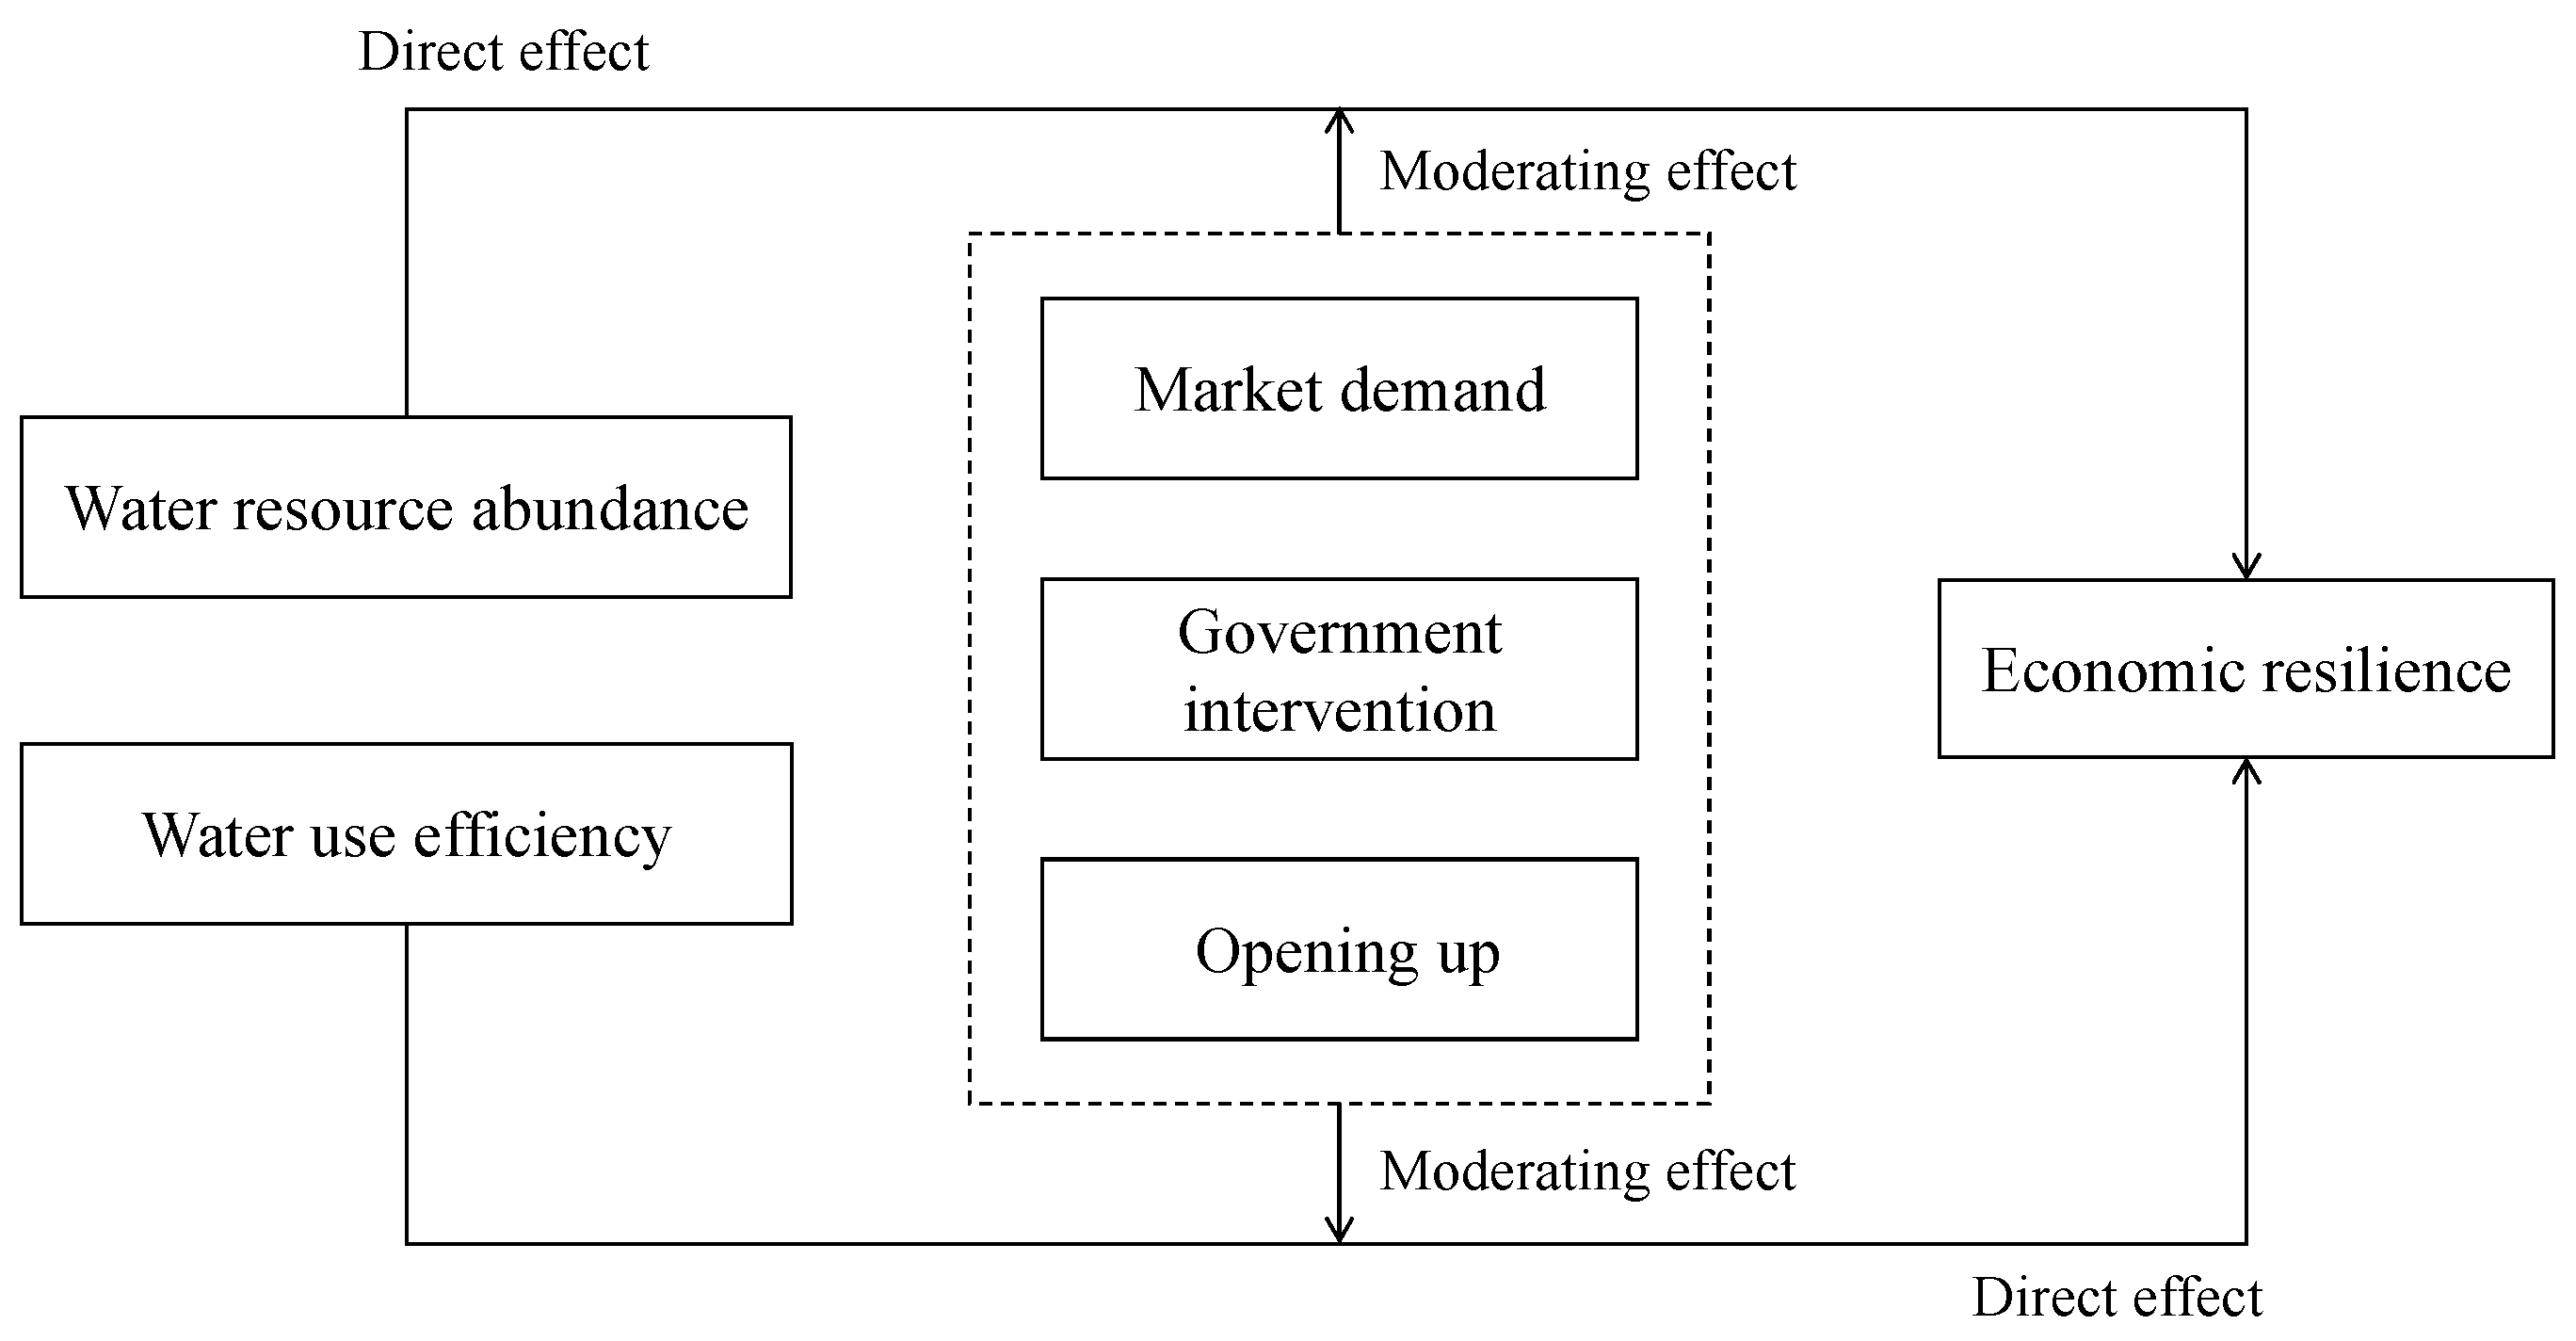
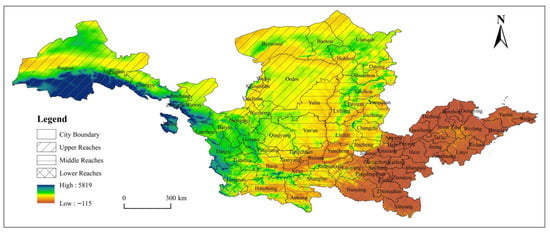
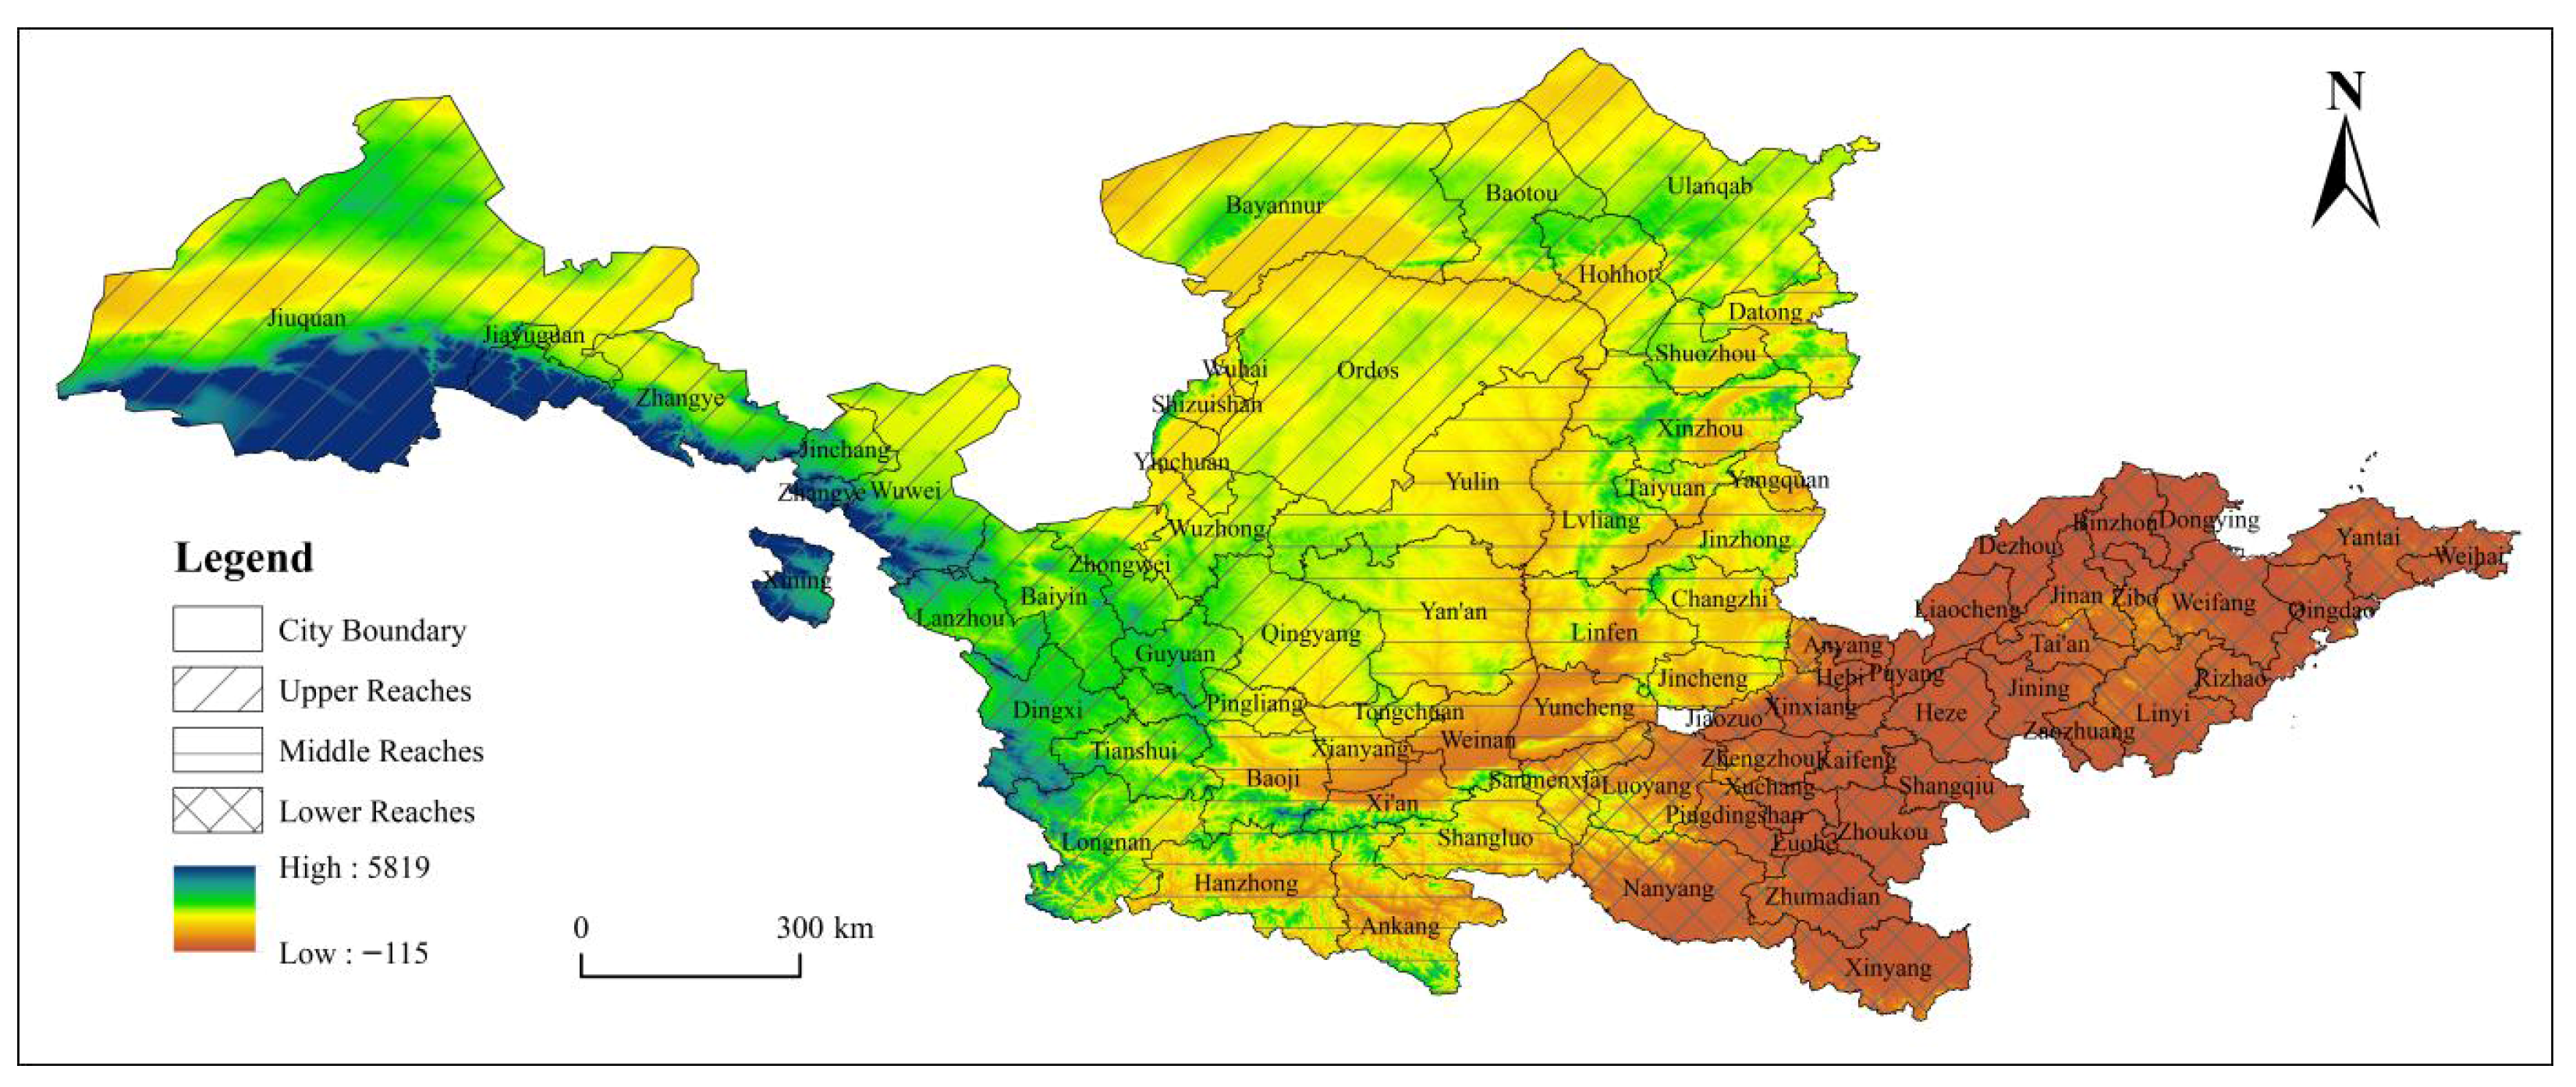
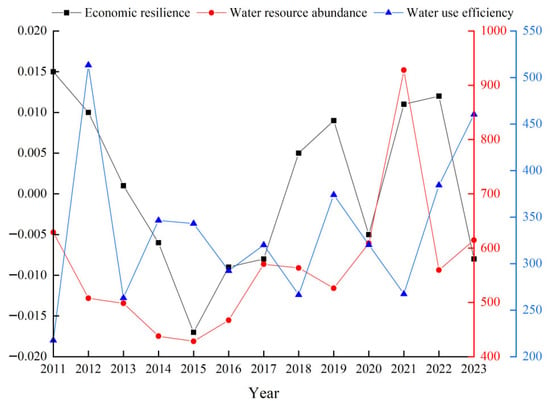
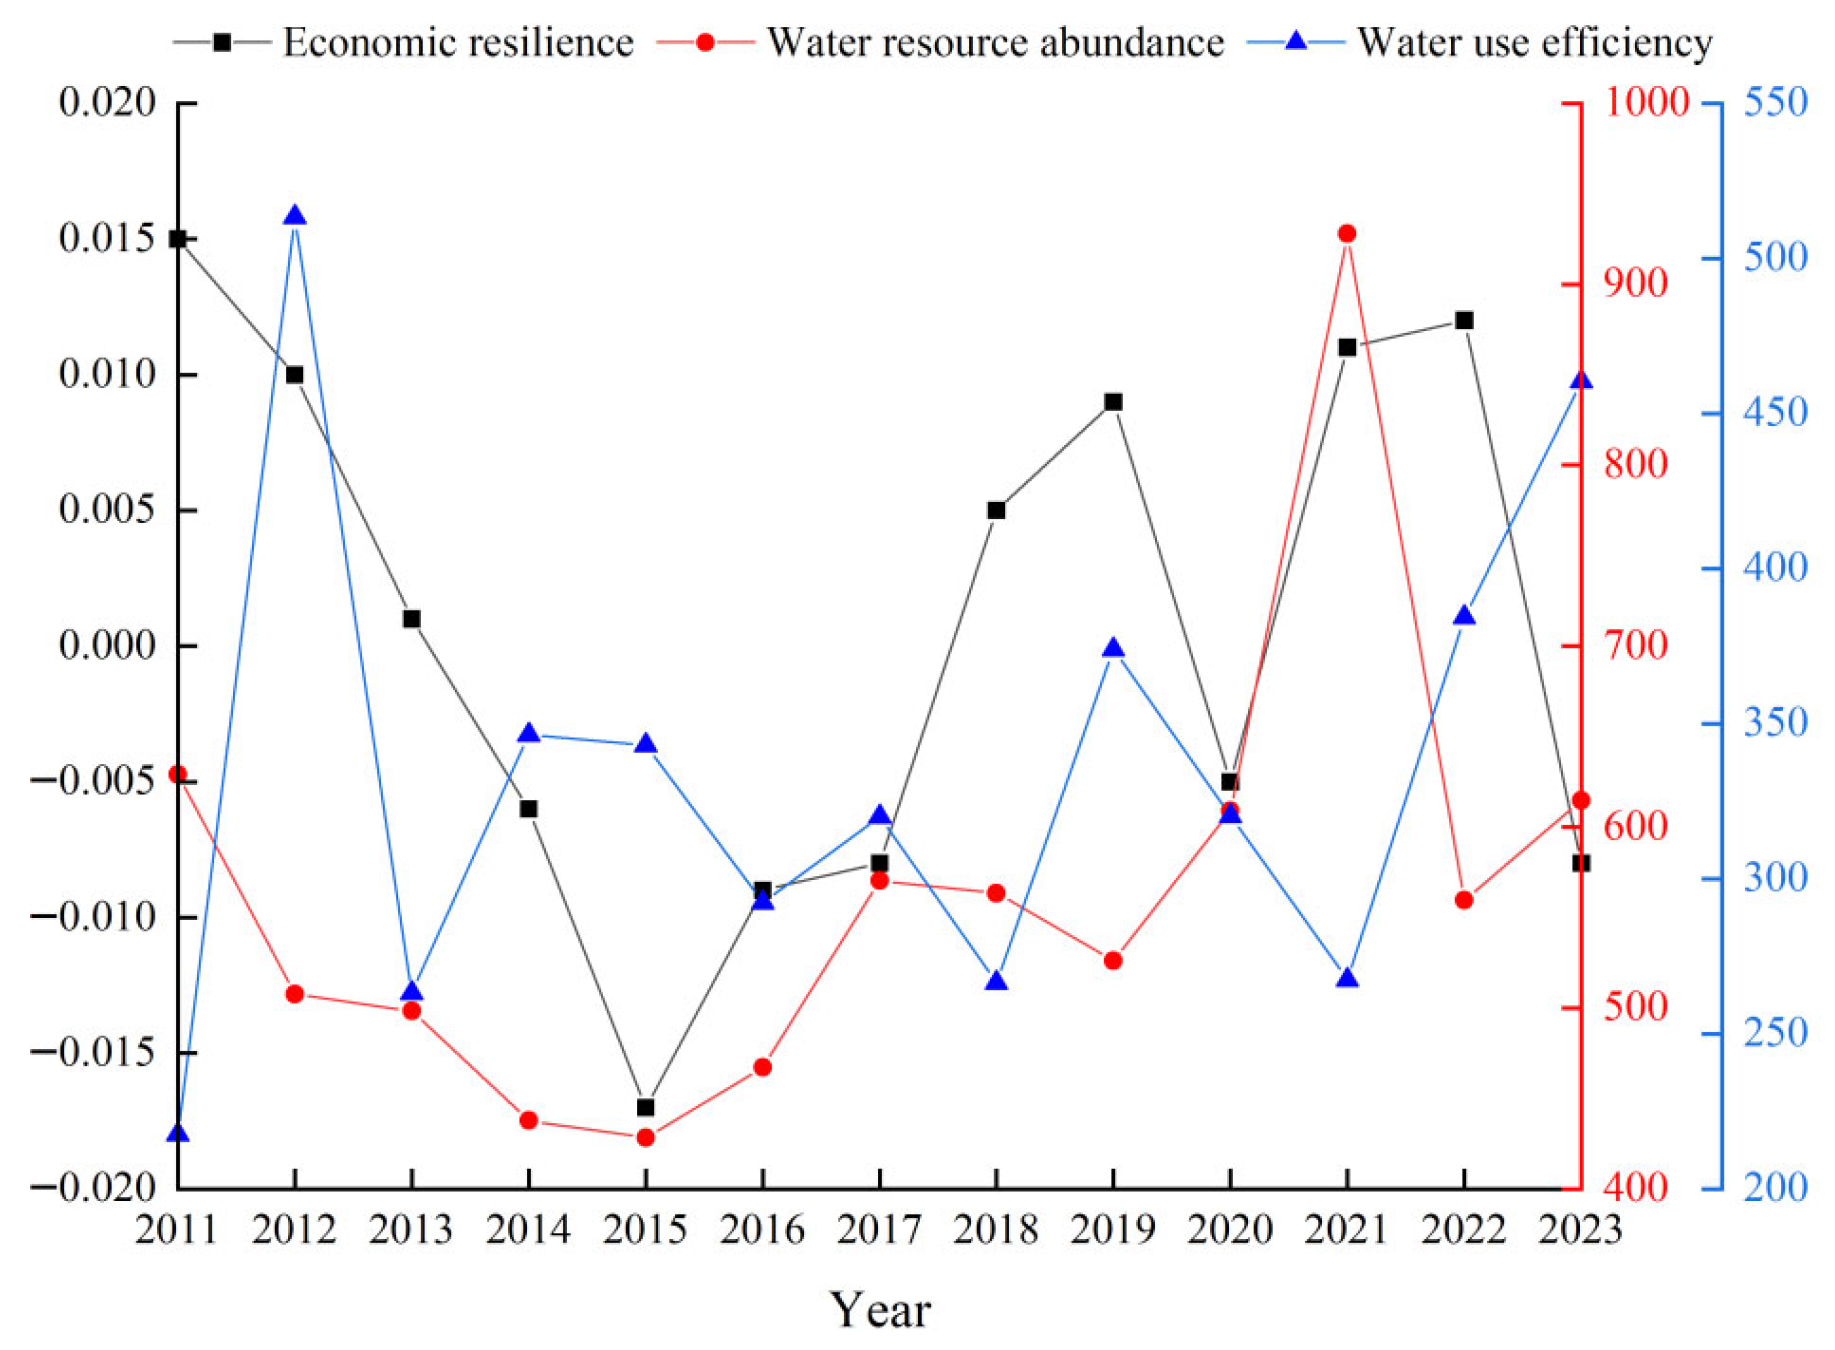
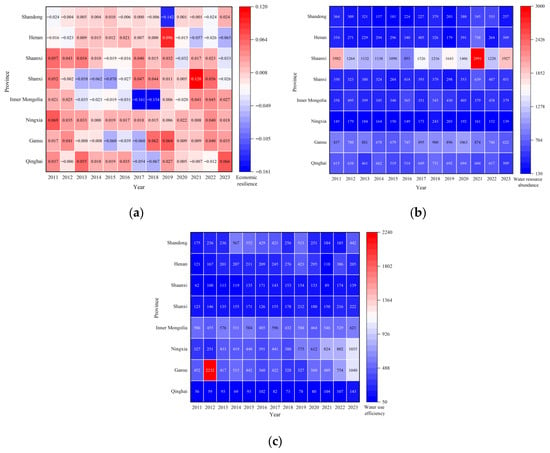
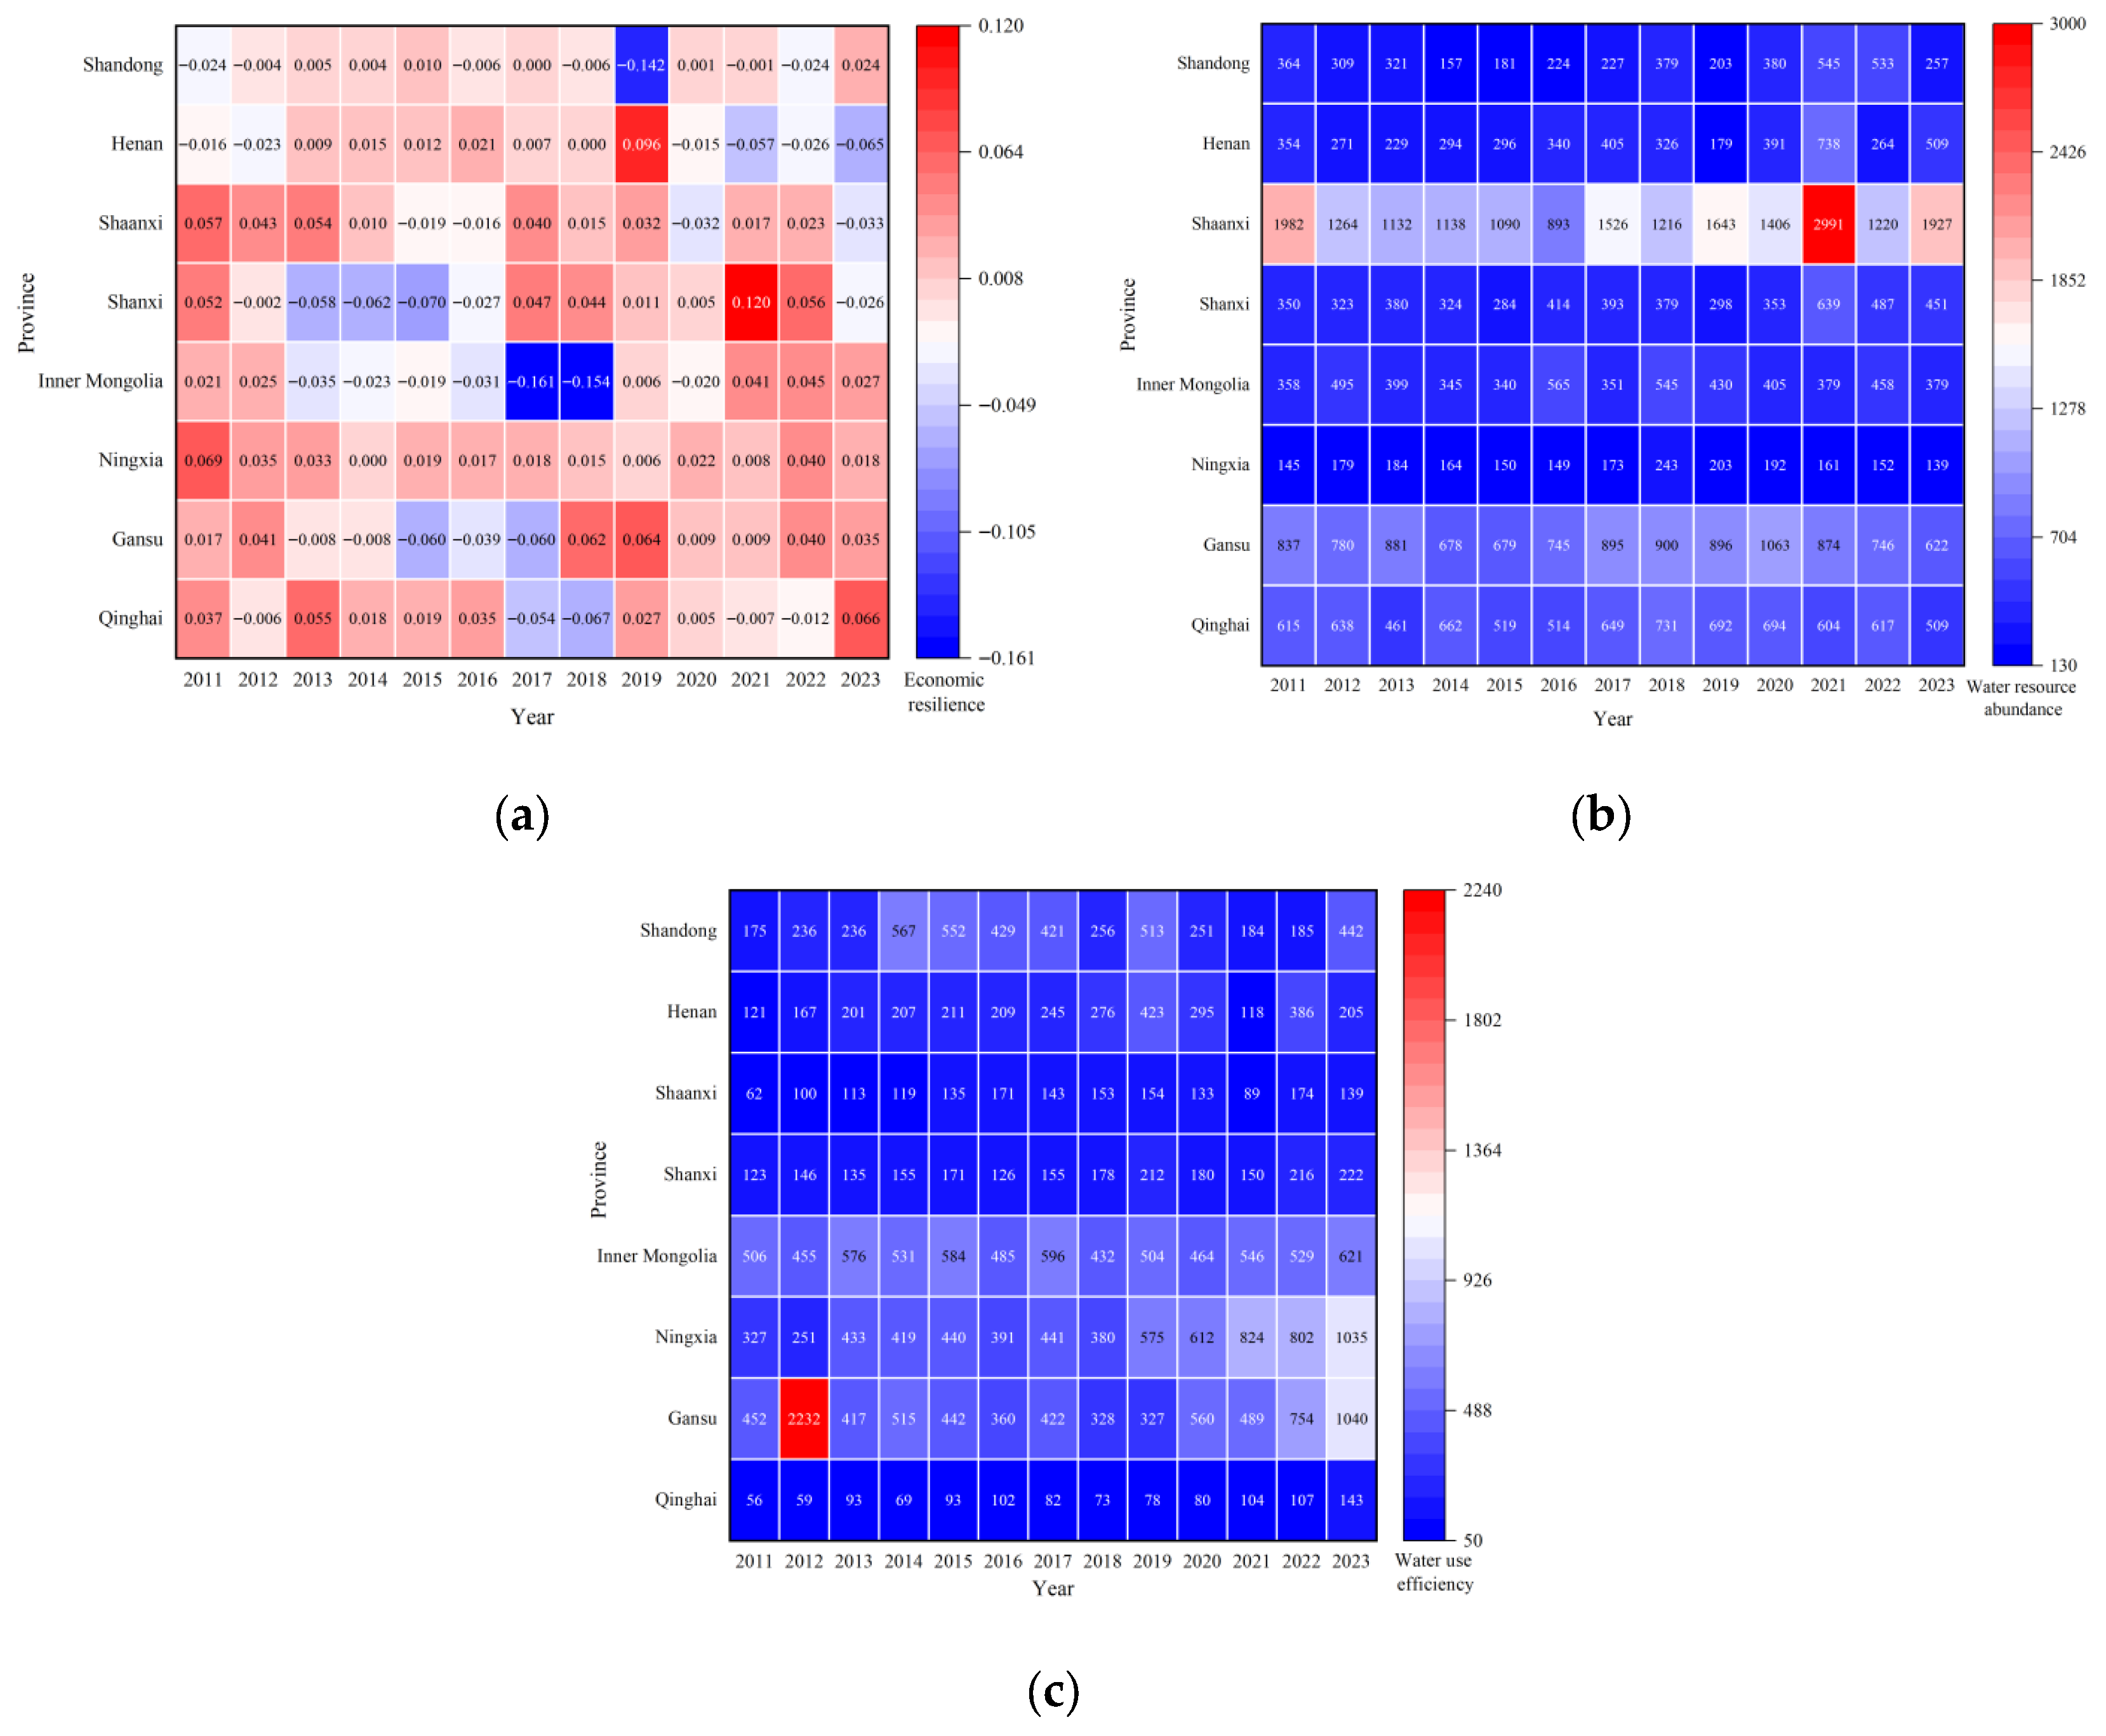
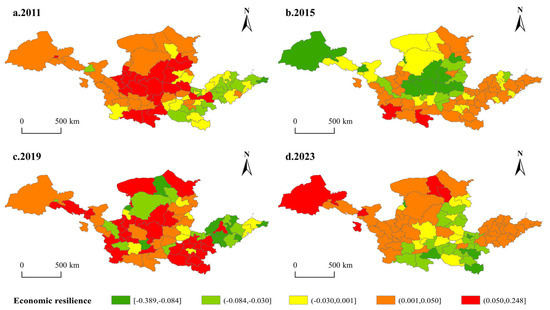
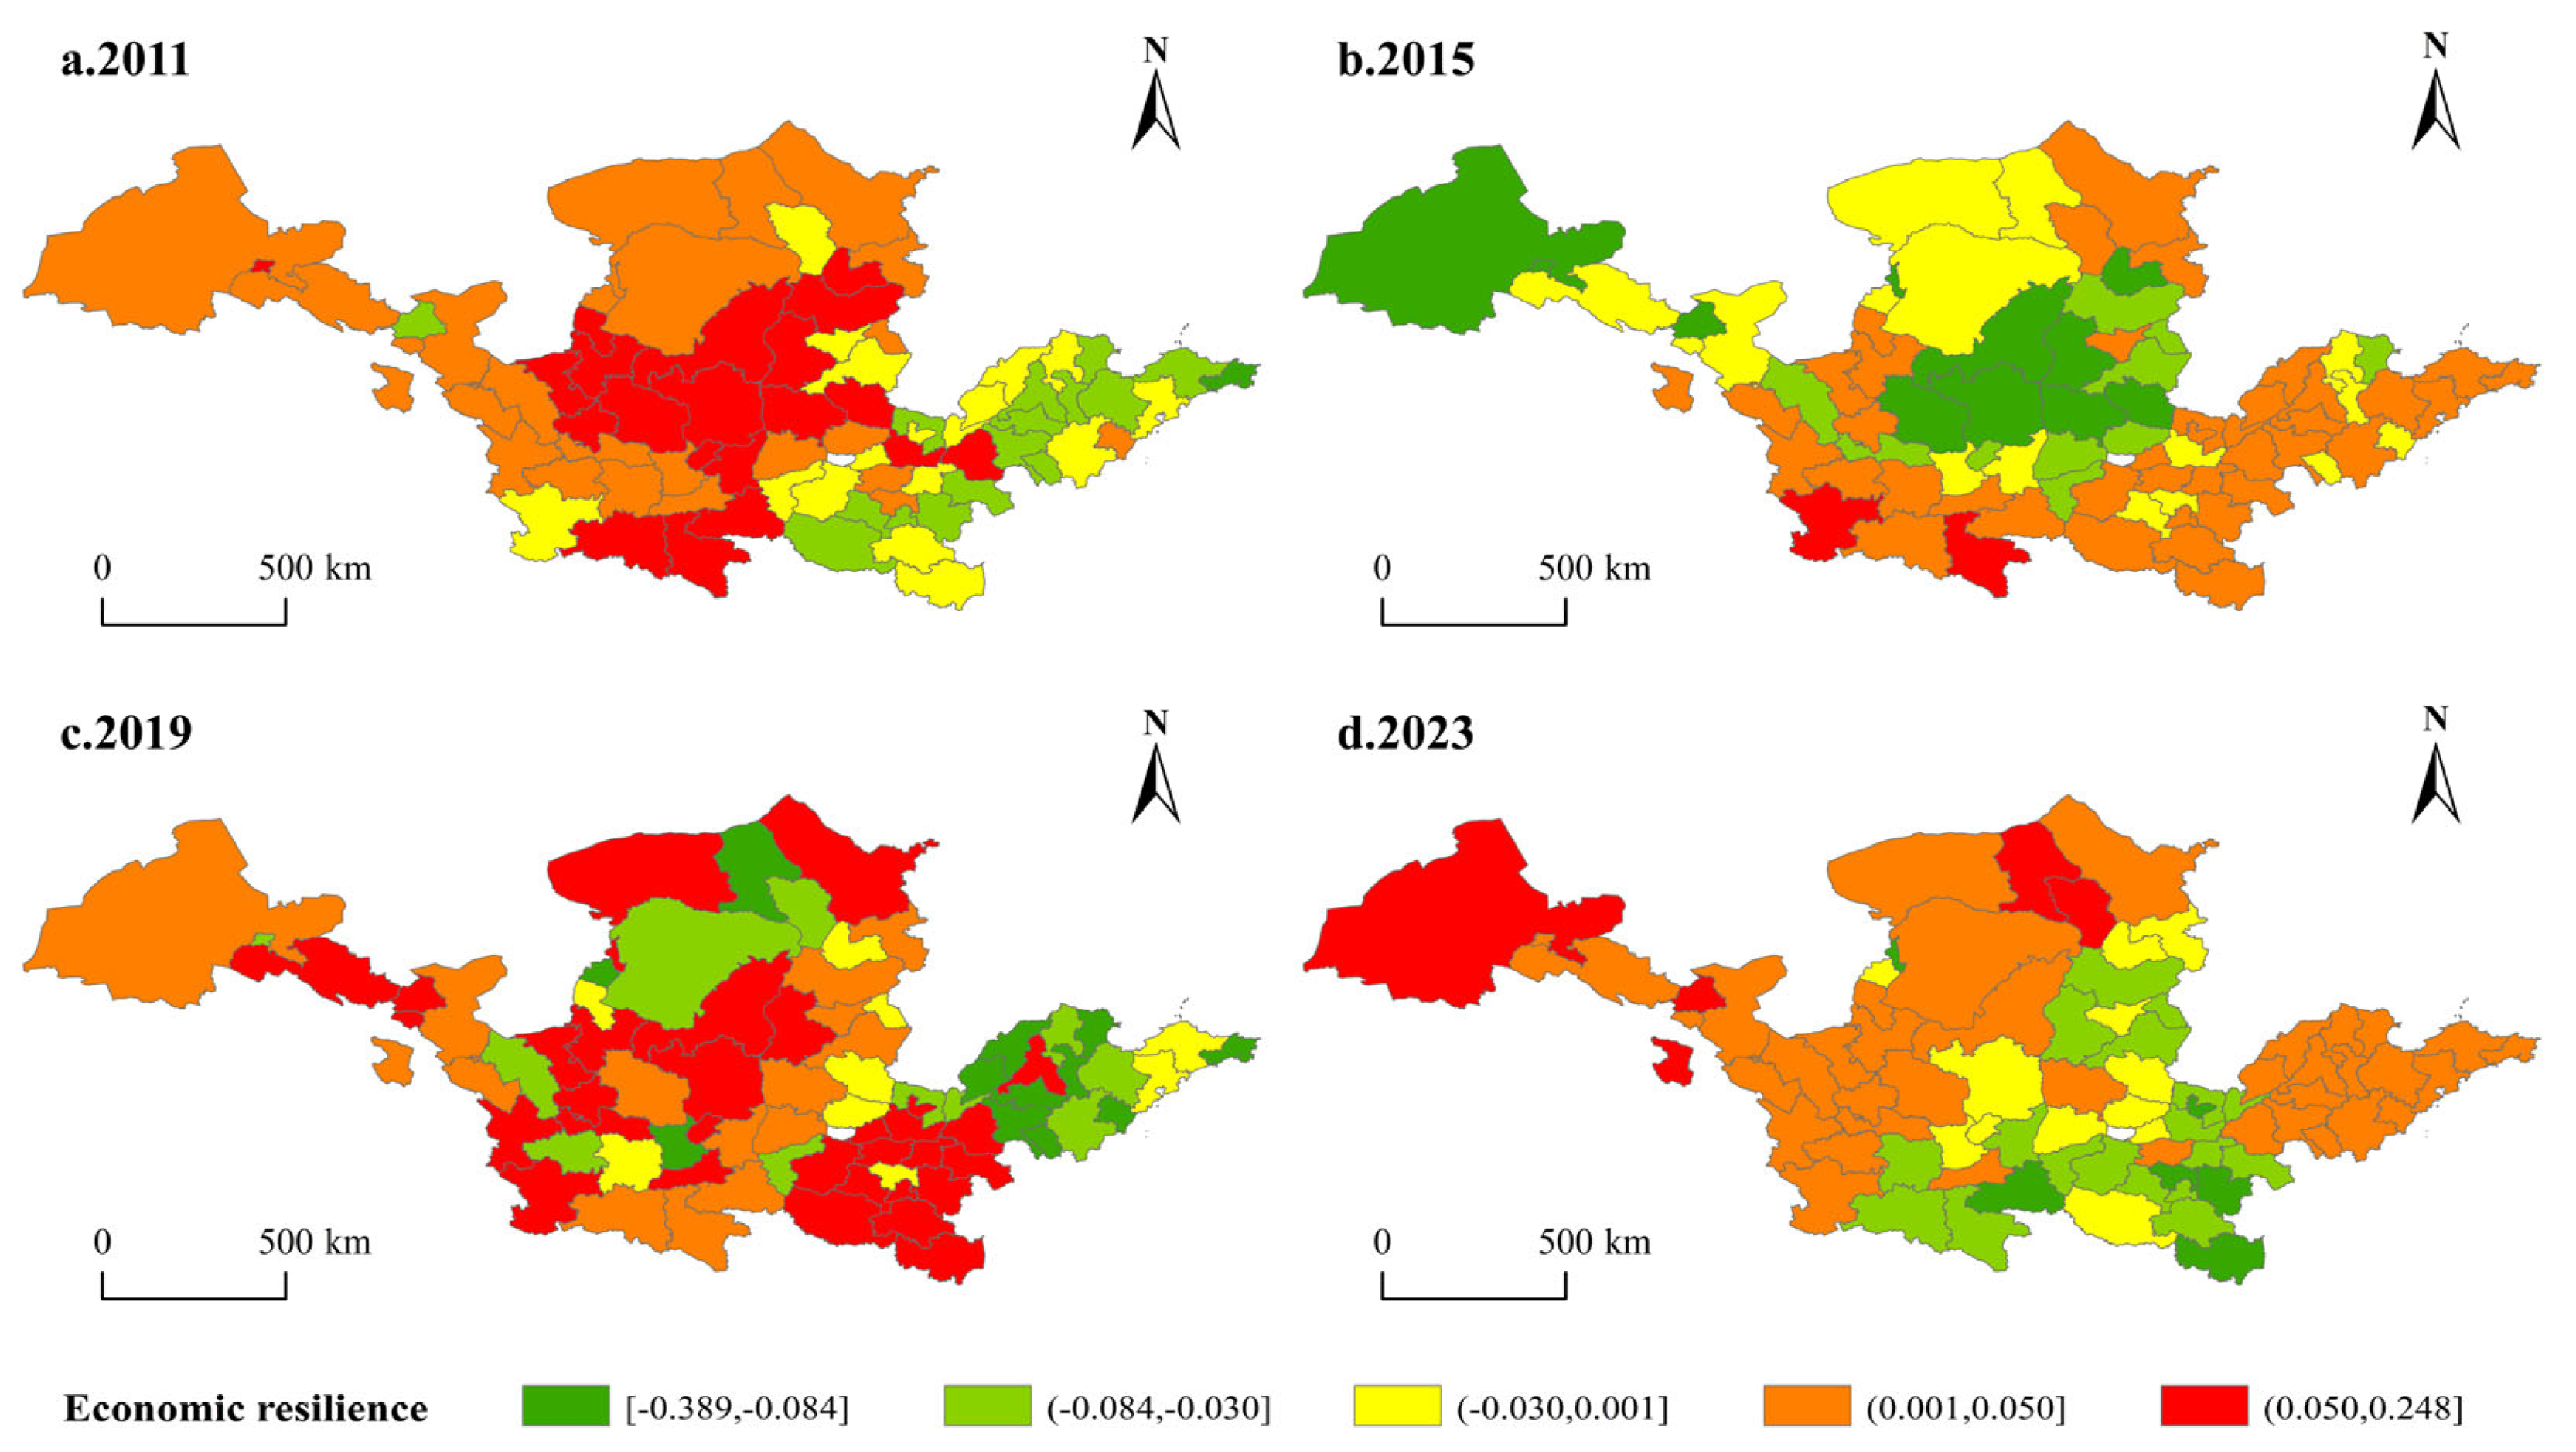
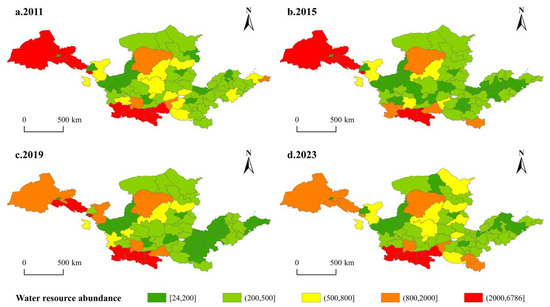
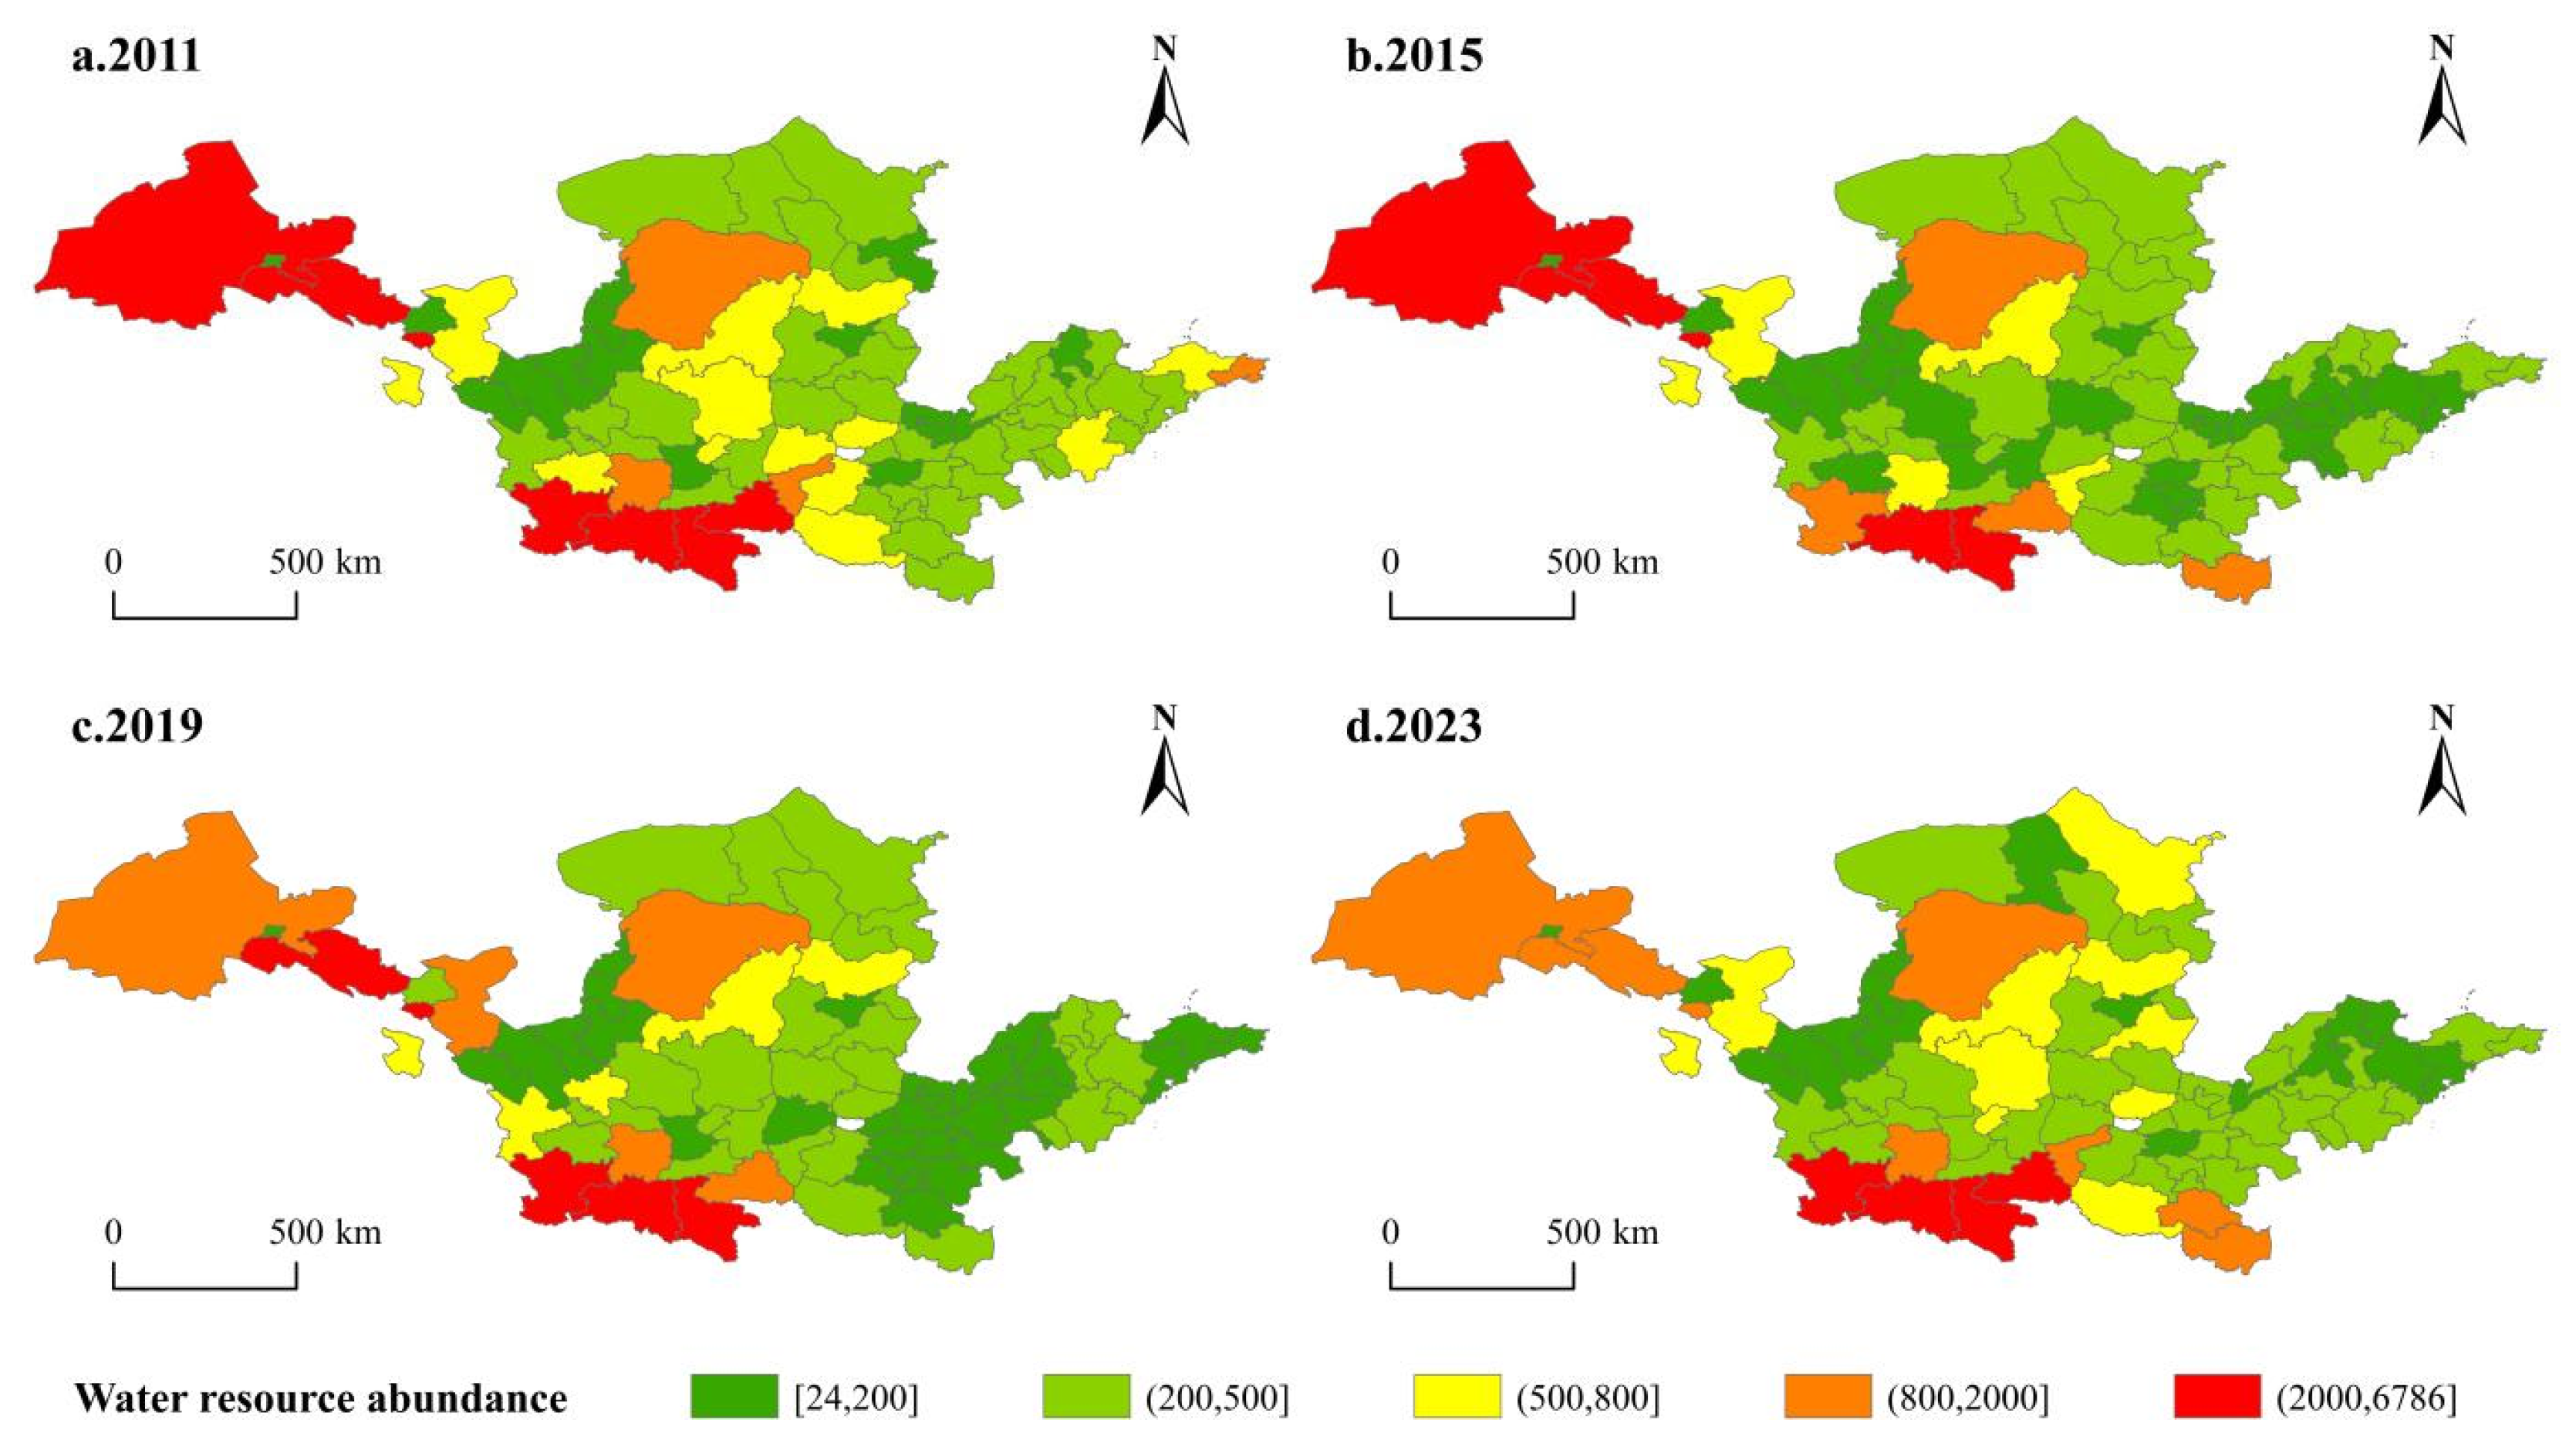
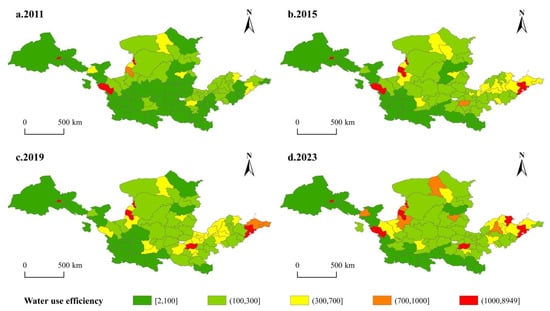
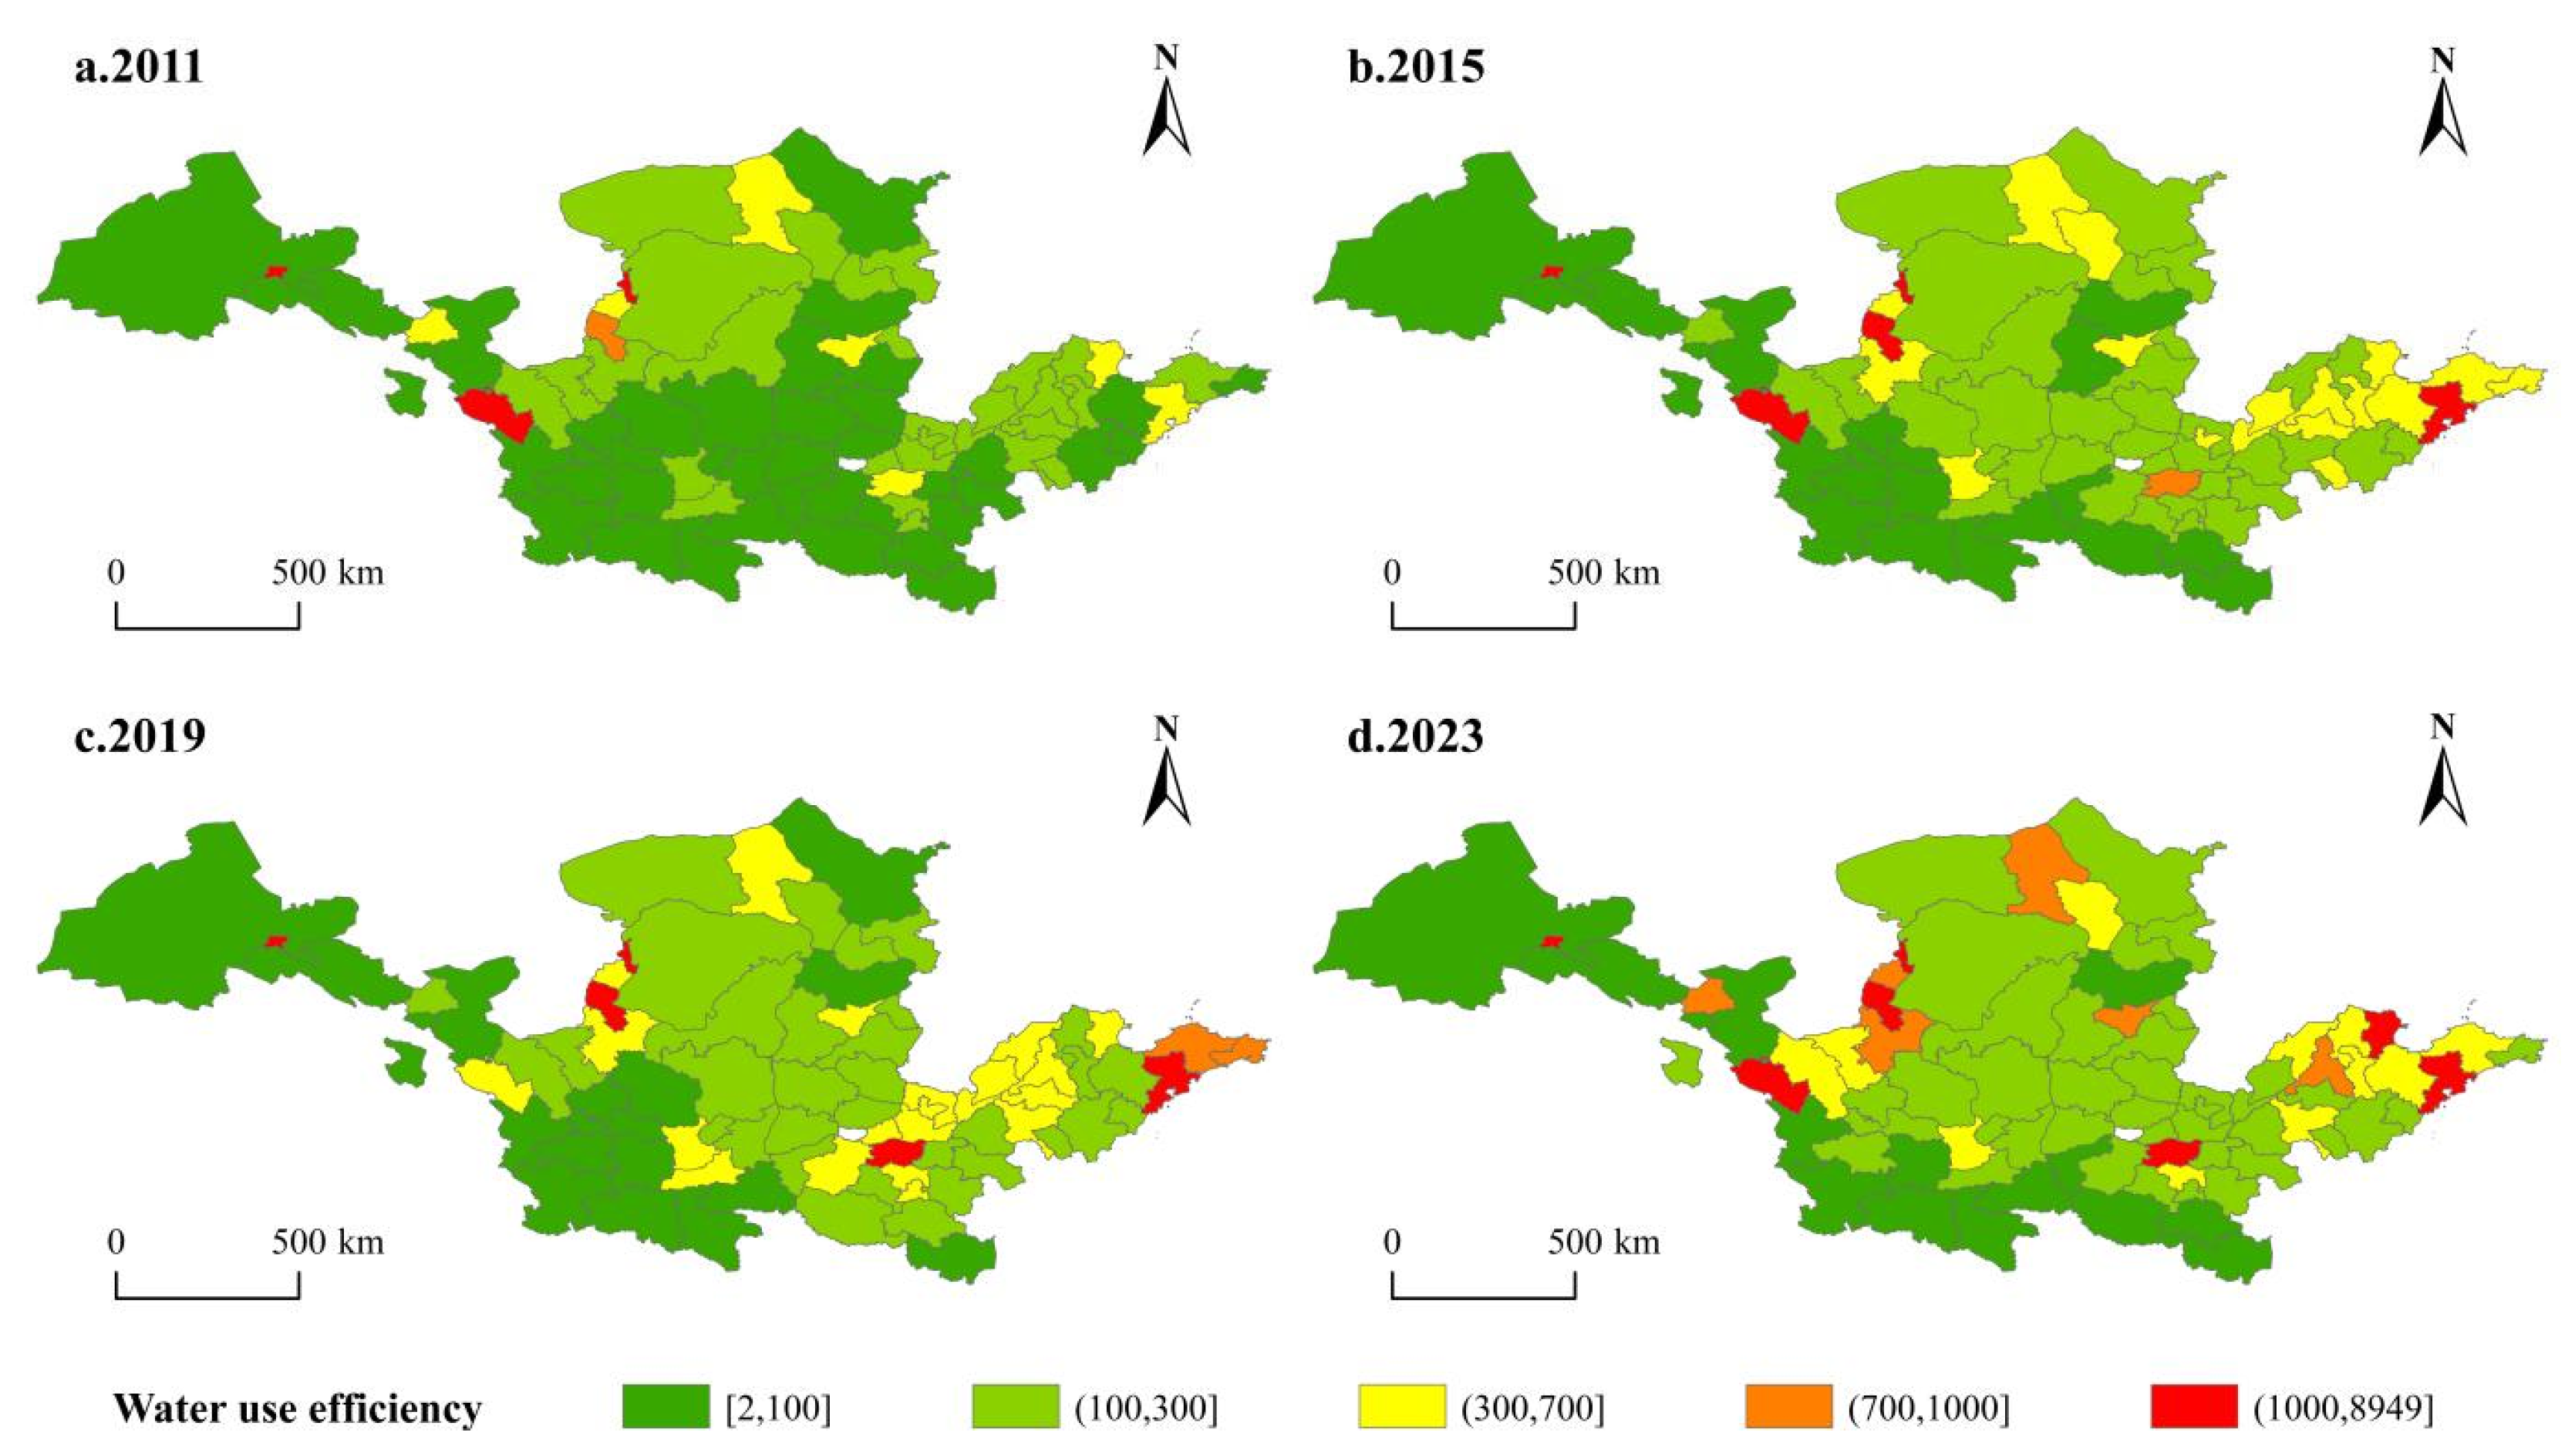

Disclaimer/Publisher’s Note: The statements, opinions and data contained in all publications are solely those of the individual author(s) and contributor(s) and not of MDPI and/or the editor(s). MDPI and/or the editor(s) disclaim responsibility for any injury to people or property resulting from any ideas, methods, instructions or products referred to in the content. |
© 2026 by the authors. Licensee MDPI, Basel, Switzerland. This article is an open access article distributed under the terms and conditions of the Creative Commons Attribution (CC BY) license.