


Abstract
Agricultural land transformation significantly affects ecosystem services (ES), yet its impacts across different topographic gradients remain unclear, hindering integrated land management in karst mountainous areas. Using Puding County, Guizhou Province, as a case study, this research employed the land-use transfer matrix, the InVEST model, and Spearman correlation analysis to examine the spatiotemporal patterns and relationships between agricultural land transformation and ES from 2004 to 2024. The findings indicate: (1) Agricultural land transformation shows distinct topographic differentiation: non-agricultural conversion and agricultural intensification dominate low-topographic positions; ecological land use conversion and agricultural intensification coexist in mid-topographic positions; and ecological land use conversion prevails in high-topographic positions. (2) ES vary consistently along topographic gradients: soil retention and carbon storage increase with elevation, food supply concentrates in low topographic positions, and water yield changes are most pronounced at low topographic positions. (3) Topography regulates the ecological effects of transformation pathways: ecological land use conversion enhances regulating services in high-topographic positions, while farmland abandonment increases erosion risk; composite transformation promotes a dynamic balance between services in mid-topographic positions; and agricultural intensification improves food supply but intensifies water competition in low-topographic positions, whereas non-agricultural conversion degrades multiple ecosystem services. This study provides a scientific basis for zoned land management and sustainable development in karst mountainous areas.
1. Introduction
Ecosystem services (ES) are generated by the structure, functions, and ecological processes of natural ecosystems. These services provide direct and indirect benefits to human well-being [1]. The stable supply of these services is essential for human survival and development and serves as a fundamental pillar for regional ecological security and sustainable development. Should their functions degrade or become imbalanced, they directly threaten food security and ecological security [2]. In recent years, with rapid socioeconomic development and accelerated urbanization, the intensity of human activities has increased significantly. This has triggered substantial land use changes [3], thereby affecting the supply capacity of ES. Among these, agricultural land serves as a critical land use type that connects food production with ecological regulation [4] and undergoes changes in its utilization patterns that exert a particularly profound impact on ES [5]. Therefore, systematically understanding the intrinsic links and mechanisms between agricultural land transformation and ES is of critical scientific significance for optimizing territorial spatial planning, balancing agricultural development and ecological protection, and developing differentiated sustainable land management strategies.
Driven by both natural and anthropogenic factors, agricultural land is undergoing significant changes globally [6]. These changes directly affect the heterogeneity, connectivity, and complexity of land use, thereby governing many ecological processes [7,8]. Specifically, changes in the quantity, quality, and spatial configuration of agricultural land are not only directly linked to national food security but also alter surface cover types and disrupt the cycles of ecological materials and energy flows [9,10]. These changes profoundly affect key ES such as soil and water conservation, carbon cycle balance, and biodiversity habitat and can even destabilize regional ecological security [11]. These changes can also lead to increased losses of certain ES and intensify trade-offs among different services [12,13]. In recent years, the mechanisms linking agricultural land transformation and ES have become a research hotspot in land science and ecological science, and considerable progress has been made in this field. In terms of transformation effects, most studies have shown that the uncontrolled conversion of agricultural land to construction land often leads to ecological degradation, including declines in carbon storage, weakening of water and soil conservation functions, and loss of biodiversity [14,15,16]. Conversely, the conversion of agricultural land to ecological land, such as woodland and grassland, generally helps enhance regulating services like water conservation and carbon storage [17,18]. Methodologically, models such as InVEST and SoLVES have been widely used to quantify the spatiotemporal patterns of ES [19,20]. The integrated application of spatial analysis techniques, such as spatial autocorrelation and geographical detector, has also provided robust support for identifying agricultural land transformation and ES changes [21,22]. However, despite the relatively rich body of existing research, there are still clear limitations in perspective and regional biases. Most studies have focused on topographically uniform ecosystems, such as plains and plateaus [23,24]. Limited research attention has been given to mountain ecosystems with fragmented terrain and high ecological vulnerability. As a result, the unique mechanisms linking agricultural land transformation and ES in such environments remain poorly understood. This hinders the provision of scientific support for optimizing land use patterns and protecting ecosystems.
In mountain ecosystems, topography is the most fundamental environmental factor. By regulating hydrothermal conditions, soil properties, and human activity intensity [25], it profoundly shapes the spatial differentiation patterns of agricultural land and ES. Therefore, adopting a multi-dimensional topographic perspective can promote more refined research. Gomes et al. took Brazil as the study area and assessed the spatiotemporal variation in land use change and ES along elevational gradients. They quantified how the relationships between the two varied across different elevations and slopes [26]. Ma and Zhang took Qinghai as the study area and found that land use distribution exhibited significant vertical zonality. This led to pronounced vertical variations in ecosystem service value across different elevations, slopes, aspects, and terrain relief [27]. Yang et al. focused on the rocky mountainous areas of northern China. Using the topographic distribution index and topographic position index, they systematically analyzed the vertical spatial differentiation of ecosystem service value under the influence of land use change [28]. Further, Li et al. compared plains with hilly and mountainous areas. They found that agricultural land transformation patterns differed significantly between the two regions. Moreover, the magnitude and direction of the impact of agricultural land conversion on ES also showed clear differences under varying topographic conditions [29]. These studies collectively indicate that topographic gradient is a key entry point for investigating the ecological effects of agricultural land transformation in mountainous areas. Overlooking the regulatory role of topographic gradients makes it difficult to accurately reveal the response mechanisms of ES to land use change in such environments. It should be noted that different types of mountain ecosystems exhibit significant differences in their natural characteristics, and the regulatory role of topographic gradients in these systems also shows distinct uniqueness.
The karst mountainous area (KMA) of Southwest China is located in the upper reaches of the Yangtze and Pearl Rivers and is a typical ecologically fragile area globally. Unlike other regions, this area is characterized by shallow soil layers, high rock exposure rates, and a significant dual-structure of rock and soil [30]. Meanwhile, as a key implementation area for major ecological projects such as the Grain for Green Program and comprehensive rocky desertification control, the conversion process between agricultural and ecological land in this region is particularly intense [31]. The unique natural environment, combined with intense human activity, makes the regional ecosystem more sensitive and complex in its response to agricultural land transformation. Therefore, targeted research is needed. A review of relevant research in this region reveals that existing studies have addressed dimensions such as topography, agricultural land change, and ES. However, they have not systematically analyzed the ecological impacts of agricultural land transformation across different topographic gradients in combination with the region’s unique topographic conditions. Specifically, existing studies have largely focused on a single perspective. For instance, some have examined changes in the quantity and structure of agricultural land in KMA [32], or have solely focused on the impacts of land use change on the trade-offs and synergies among ES [33], or have revealed the constraining effects of rocky desertification on ES [34]. Although some studies have adopted the perspective of topographic gradients—for instance, Li et al. analyzed the role of landscape patterns on ecological health based on topographic gradients [35]; Gou et al. investigated the trade-offs among ES across different topographic gradients [36]; Zhang et al. demonstrated the modulating effect of topography on ecosystem service values [37]. However, these studies have not deeply integrated topographic gradients with agricultural land transformation and ecosystem services. They fail to analyze how different agricultural land transformation pathways affect ecosystem services across various topographic gradients, nor do they clarify the underlying regulatory mechanisms of topographic factors. Ignoring this core modulating role of topographic gradients and adhering to traditional planar spatial analysis approaches will inevitably lead to research findings that lack specificity. This would fail to provide scientific support for differentiated ecological restoration and land management in KMA. Therefore, introducing a topographic gradient perspective to overcome the limitations of traditional planar spatial analysis is essential. Precisely revealing the spatial heterogeneity in the relationship between agricultural land transformation and ES in KMA, and elucidating the regulatory mechanisms of topographic gradients, are critical. Based on this, exploring zoning-based management pathways to achieve precise ecological restoration and sustainable management has become an urgent scientific priority.
In summary, conducting a systematic study on the impact of agricultural land transformation on ES in the KMA of Southwest China would not only fill the theoretical gap in ES regulation for this particularly vulnerable ecological zone but also hold significant practical implications for optimizing regional land use layout, improving ecological conservation policies, and achieving sustainable development. Therefore, this study selects Puding County in Guizhou Province as the study area. From a topographic gradient perspective, it integrates the InVEST model, land-use transfer matrix, and Spearman correlation analysis to systematically characterize the spatiotemporal evolution of agricultural land transformation and ES from 2004 to 2024, and further explores the relationships between different agricultural land transformation pathways and changes in ES. Aims to: (1) To clarify the spatiotemporal differentiation patterns of agricultural land and ES across different topographic gradients. (2) The associations between agricultural land transformation and ES across different topographic gradients. (3) Based on these findings, differentiated land regulation strategies are proposed to guide ecological restoration and optimize agricultural layout. This study can provide a theoretical basis for differentiated ecological restoration and sustainable land management.
2. Study Area and Data Sources
2.1. Study Area
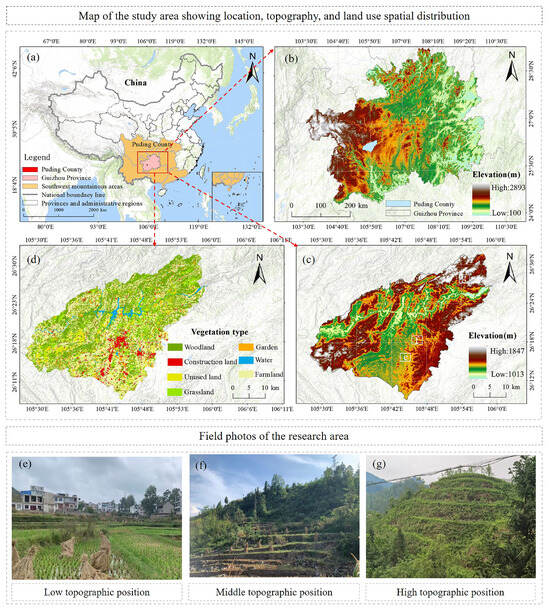
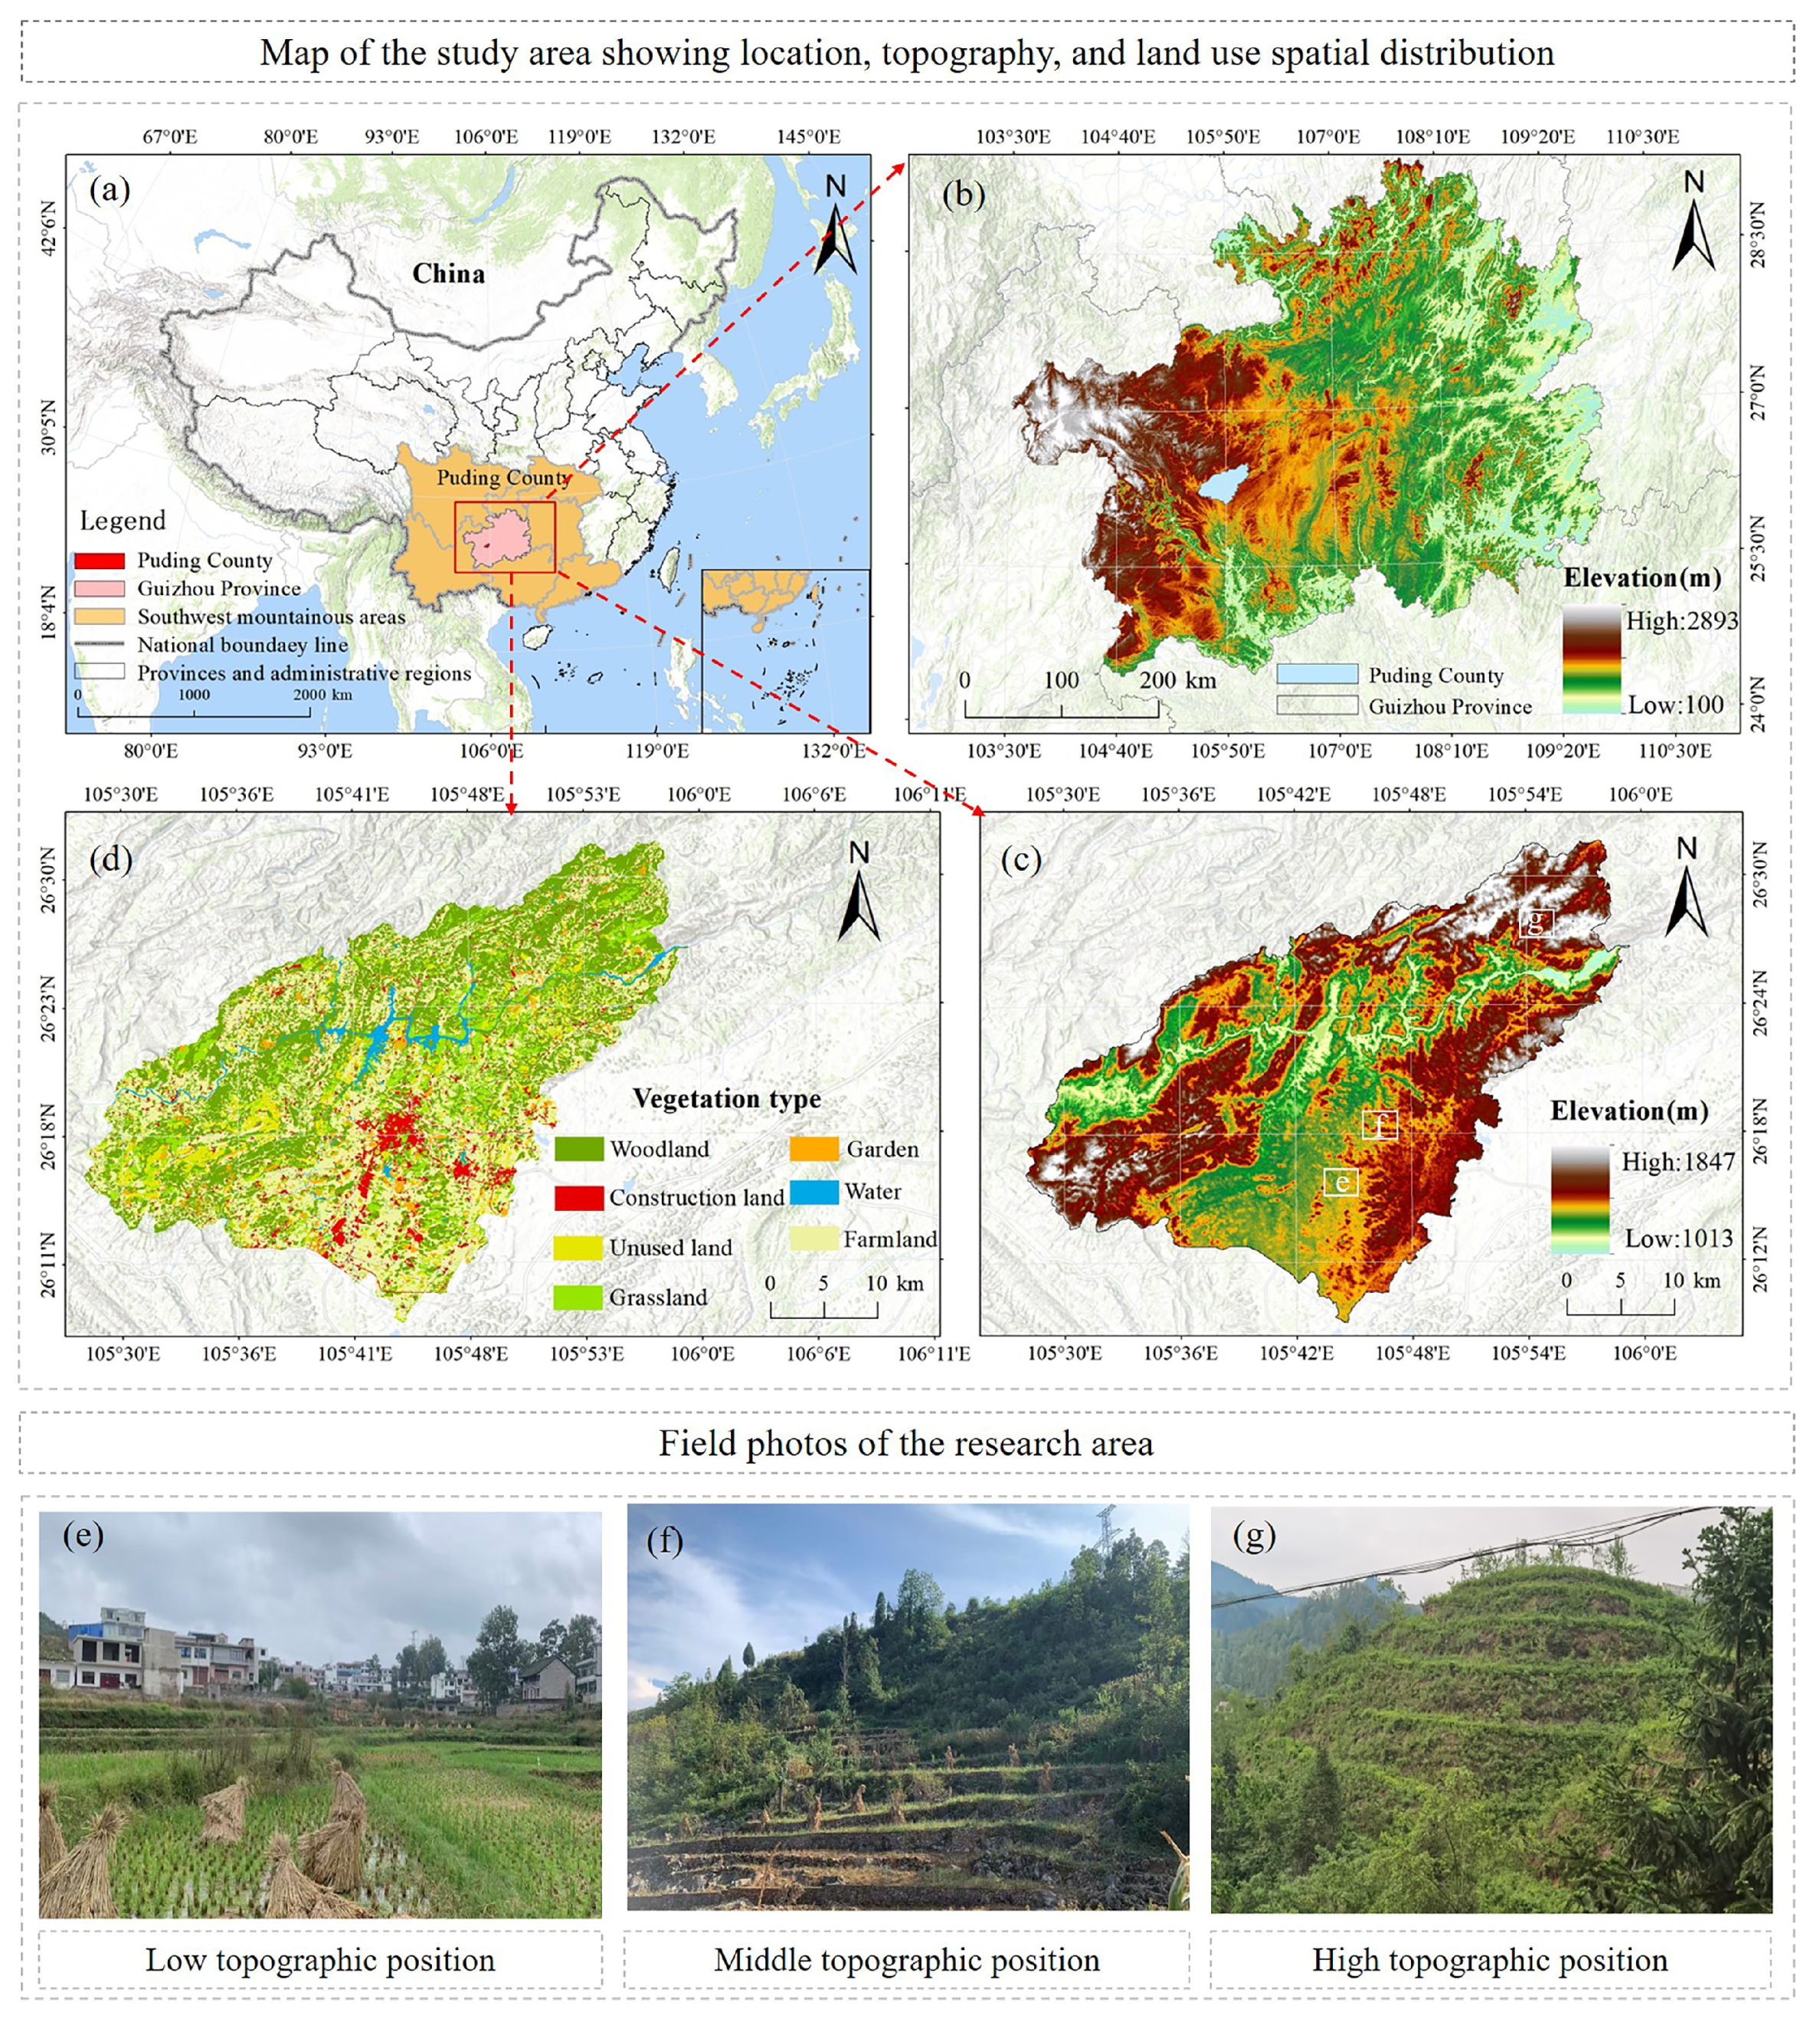
Puding County is situated in central Guizhou Province (105°27′–105°58′ E, 26°26′–26°59′ N). It is a typical karst landform region, covering a total area of approximately 1090 km2 [38] (Figure 1). The region has a subtropical humid monsoon climate, with a mean annual temperature of 15.1 °C and an average annual precipitation of approximately 1378.2 mm. Although the hydrothermal conditions are generally favorable, their uneven spatial and temporal distribution frequently leads to seasonal droughts and soil erosion. The local topography is highly fragmented and rugged, featuring higher elevations in the west and lower ones in the east. The soils are primarily limestone soils and yellow earth, which are shallow and have poor water and nutrient retention capacity. As a result, the ecological environment in this area is inherently fragile. As a critical component of the ecological barrier for the upper reaches of the Yangtze and Pearl Rivers and a national key area for rocky desertification control, Puding County has experienced a profound transformation in its land-use structure. This transformation has been driven by the dual impetus of ecological civilization construction and the rural revitalization strategy. Among these changes, the evolution of agricultural land has been particularly pronounced [39], significantly impacting the regional ecological environment. Due to its unique geographical setting and representative human-environment relationships, Puding County serves as an ideal sample for studying the interaction between land use and ecological processes in KMA.
Figure 1.
Map of the study area. (a) Geographical location; (b) Topographic relief of Guizhou Province; (c) Topographic relief of Puding County; (d) Land use types of Puding County; (e) Low topographic position; (f) Middle topographic position; (g) High topographic position.
2.2. Data Sources and Processing
The data used in this study primarily include ASTER imagery (15 m spatial resolution) and SPOT imagery (2.5 m spatial resolution) from 2004, as well as high-resolution Google Earth remote sensing images from 2010 (2.14 m), 2016 (0.54 m), and 2024 (0.54 m). After georeferencing and coordinate unification in ArcGIS 10.4, land-use vector data for 2004, 2016, and 2024 were generated manually in accordance with the national standard, Current Land Use Classification (GB/T 21010-2017) [40]. The land was categorized into seven types. To ensure data accuracy, the interpreted polygons were verified and revised through three field surveys conducted between 2024 and 2025. These three time points were selected because they correspond to key stages of regional ecological management and policy implementation, ensuring both representativeness and analytical value. Additionally, this study collected data from multiple sources. These data primarily included: a 12.5 m resolution Digital Elevation Model (DEM) from the Advanced Land Observing Satellite (ALOS); raster datasets of mean annual precipitation, annual evapotranspiration, and soil properties obtained from the Scientific Data Center for the Qinghai–Tibet Plateau; and statistical data sourced from the Anshun Statistical Yearbook and the Puding County Bureau of Statistics for validation and calibration.
Due to the varied data formats, this study applied targeted processing methods: non-spatial data were spatially digitized and linked to the township administrative boundary vector map, thereby converting them into spatial vector layers compatible with the study area. Meteorological raster data were optimized using Kriging interpolation to minimize spatial heterogeneity. This process ensured spatial continuity and compatibility with the study area’s scale. Carbon density data were obtained primarily from existing studies [33,34,41,42,43]. Data from central and southern China were prioritized to ensure spatiotemporal consistency and scientific accuracy (Table S1). To ensure spatial compatibility across multi-source data, all datasets were resampled to a 30 m × 30 m target spatial resolution. They were uniformly projected to the coordinate system CGCS_2000_3_Degree_GK_Zone_35.
3. Approach and Methodology
3.1. Research Approach
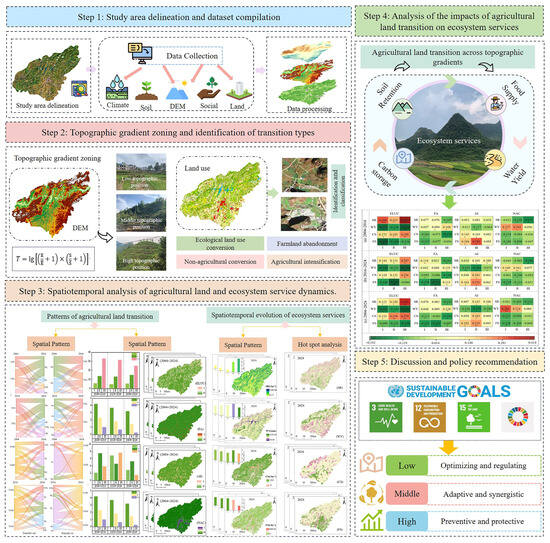
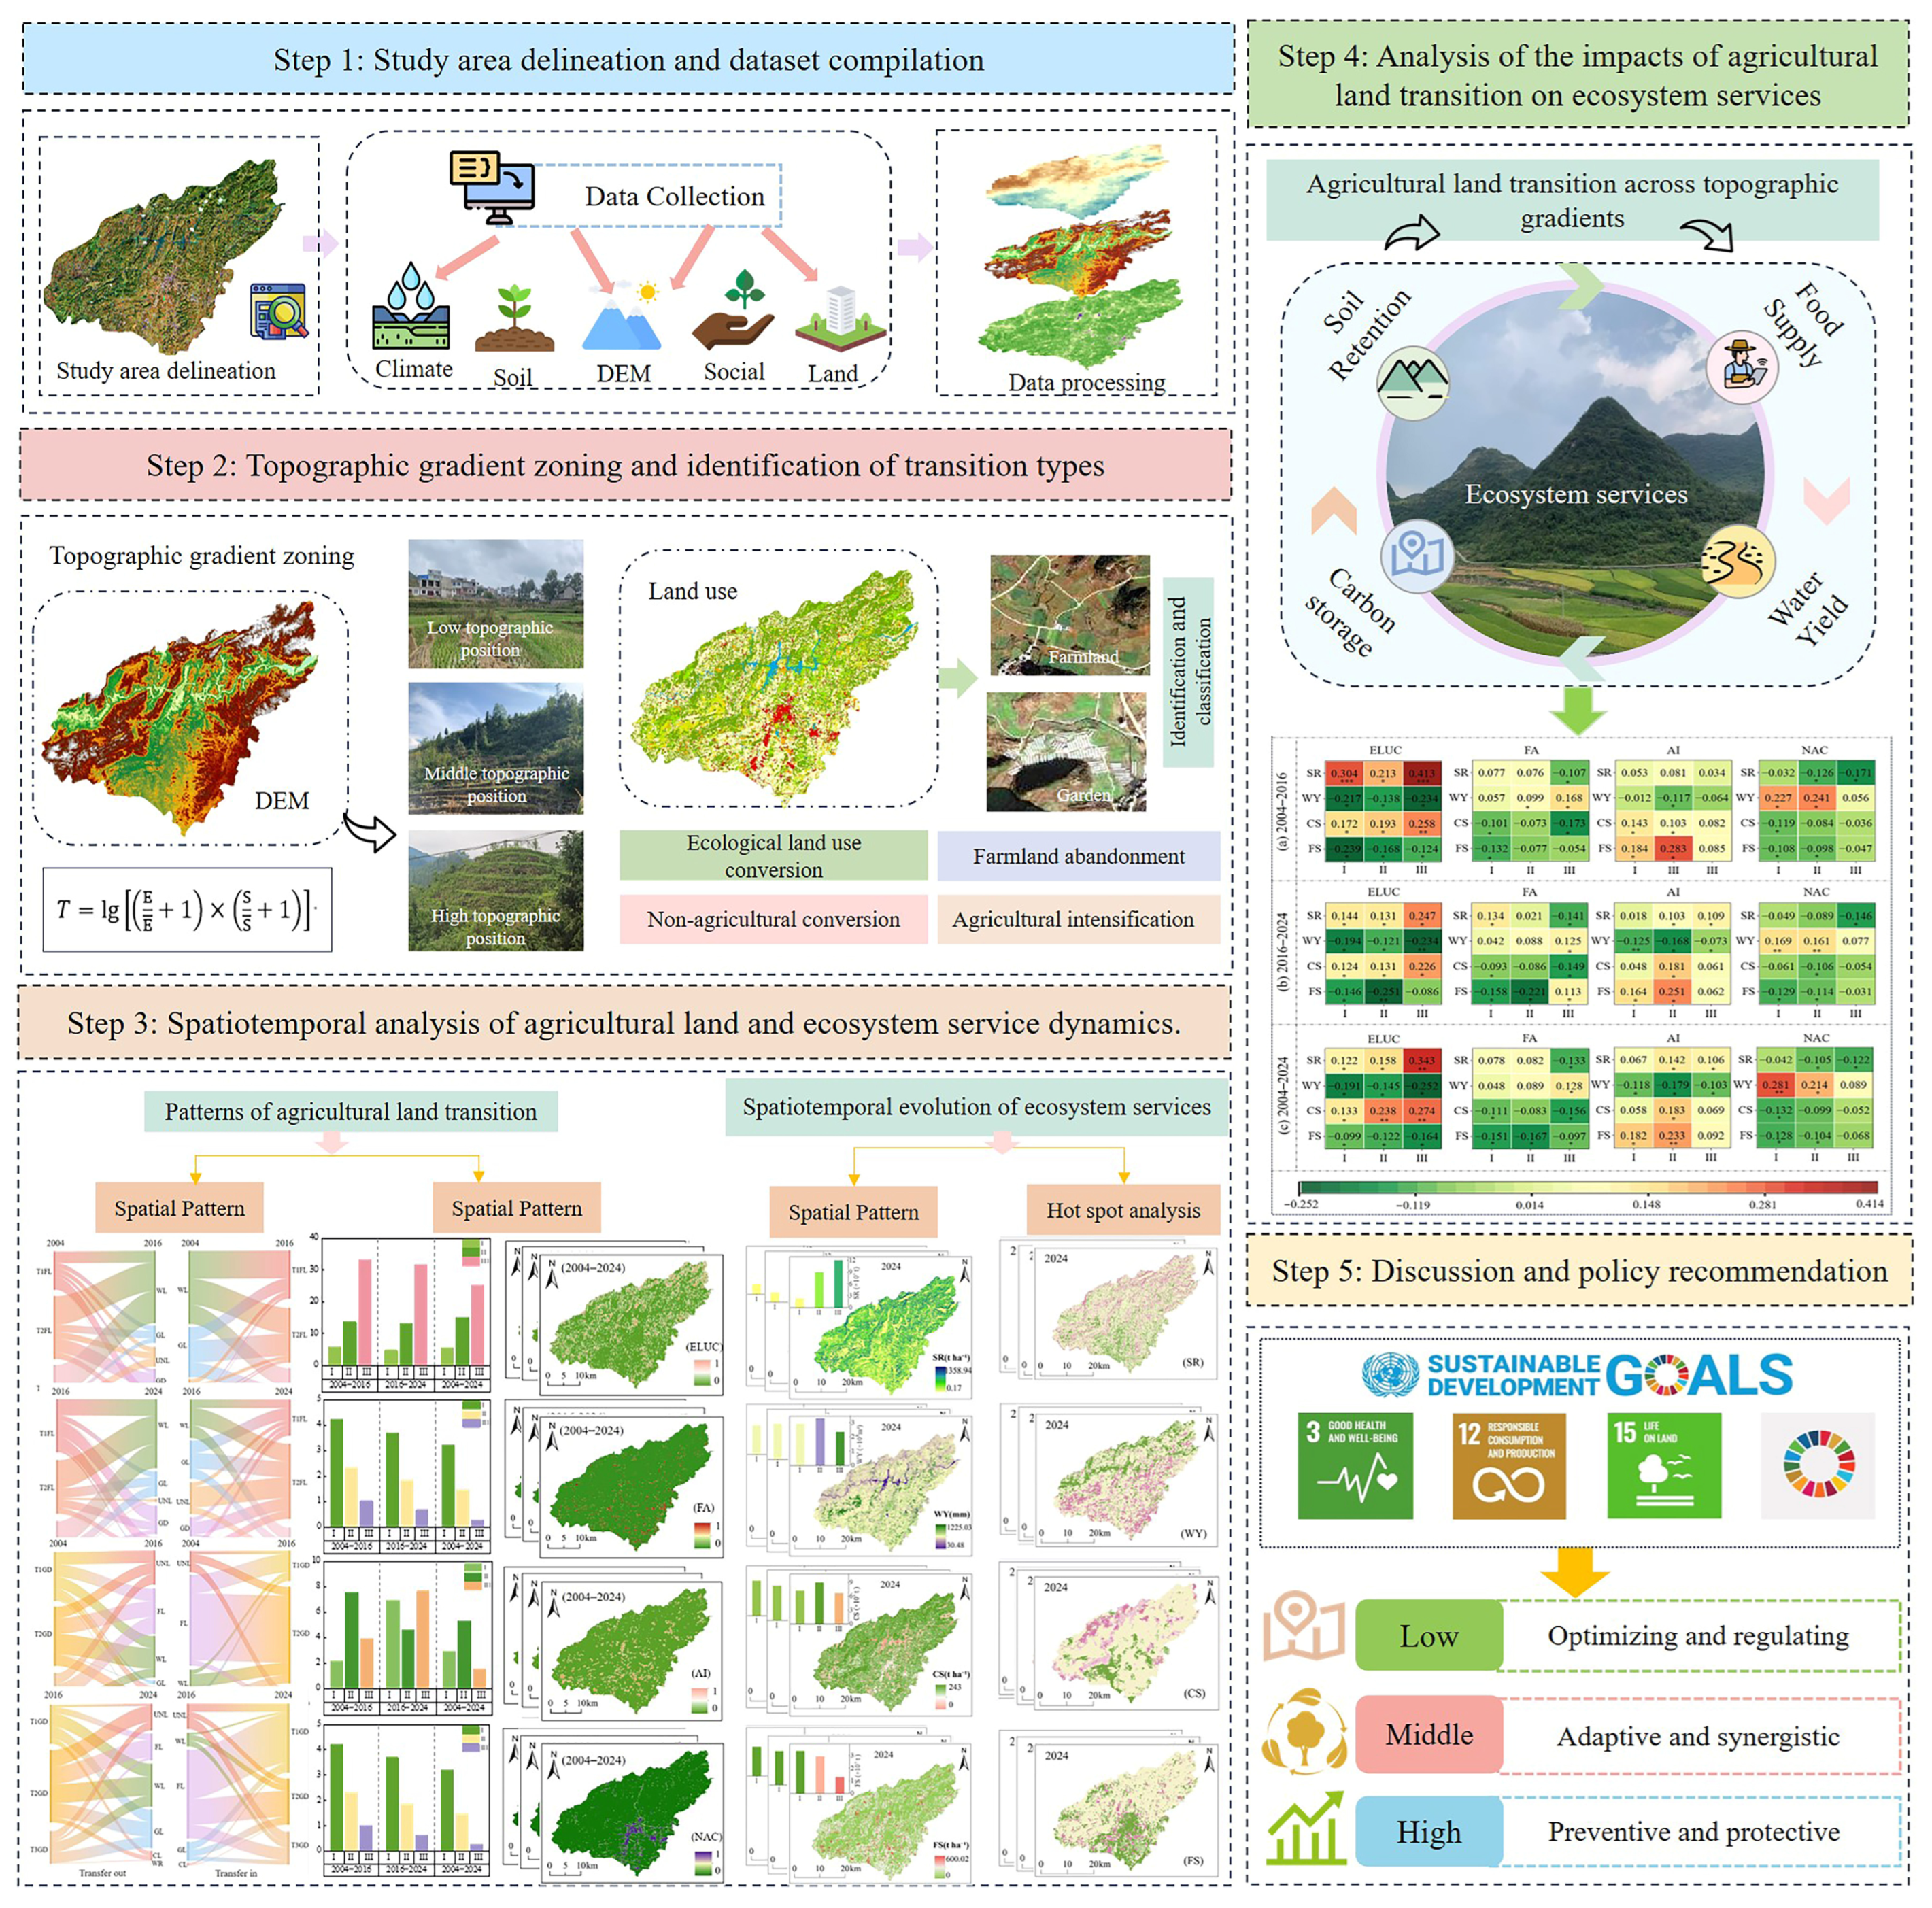
This study follows the process of data preparation, pattern characterization, relationship analysis, and strategy exploration. The specific research framework is illustrated in Figure 2. First, data collection and preprocessing were conducted. After defining the study area, we systematically collected remote sensing imagery, digital elevation models, and meteorological, soil, and socioeconomic statistical data. All spatial data were uniformly processed through projection transformation, clipping, and resampling to build a spatiotemporal analysis database. Next, topographic gradients were delineated, and transformation types were identified. Based on DEM data, the terrain niche index was calculated to classify areas into high-, medium-, and low-gradient positions. Simultaneously, land use data were obtained through remote sensing interpretation to identify the primary agricultural land types and their major transformation pathways. Then, quantitative analysis was conducted. The land use transfer matrix, land use transformation intensity model, and focal statistics were employed to analyze the conversion characteristics of agricultural land across different topographic positions. This analysis characterized the spatiotemporal differentiation of agricultural land transformation under varying topographic gradients. On the other hand, four key ES—soil retention (SR), water yield (WY), carbon storage (CS), and food supply (FS)—were selected and spatially evaluated using the InVEST model and the equivalent factor method. Then, the relationships between agricultural land transformation and ES were analyzed. Building on the previous analysis, methods such as correlation analysis were employed to reveal the effects of different agricultural land transformation pathways on key ES across topographic gradients. Finally, a comprehensive discussion and the optimization of ecological management strategies were conducted. By integrating the findings from the preceding analyses, the coupling mechanisms between human and natural systems and the evolutionary patterns of the ecosystem in the KMA were systematically elucidated. Systematic strategic suggestions were proposed, focusing on optimizing agricultural spatial layout, implementing differentiated ecological restoration, and enhancing sustainable land management capacity. These suggestions aim to support regional ecological security and sustainable development.
Figure 2.
Frameworks and ideas for research work. (* p < 0.05, ** p < 0.01, *** p < 0.001).
3.2. Topographic Position Index
The pronounced terrain fragmentation in KMA profoundly constrains the spatial distribution and transformation of agricultural land. To comprehensively quantify this complex topographic influence, this study introduces the topographic position index (TPI). This approach accurately characterizes the distribution and conversion characteristics of agricultural land across different terrain gradients [35,44]. The specific calculation formula is as follows:
T represents the topographic position index (TPI); E and Ē denote the elevation at any given point within the region and the average elevation of that point’s surrounding area, respectively; S and refer to the slope value at any given point and the average slope of its surrounding area, respectively.
Drawing on international standards, relevant research [45], and the actual conditions of the study area, elevation and slope were each divided into six classes (Table 1). Based on the topographic position index, the study area was divided into three classes: low, middle, and high topographic positions. The value of the topographic position index reflects the combined characteristics of terrain conditions. When a point has gentle slope and low elevation, its topographic position index is low; conversely, when slope is steep and elevation is high, the index is high.
Table 1.
Elevation, slope, and TPI grading standard.
3.3. Quantification of Agricultural Land Conversion
3.3.1. Land Use Transfer Matrix
The land use transfer matrix is commonly used to describe the changes in land use types within a study area over different periods [46]. This paper employs this matrix to illustrate the conversion between agricultural land and other land use types in the study area. The specific calculation formula is as follows:
where S represents the land use area (km2), n denotes the number of land use types, a refers to the land use type in the study area before the transition, and b refers to the land use type after the transition.
3.3.2. Identification of Agricultural Land Conversion Pathways
Based on field surveys and data verification in the study area, agricultural land is primarily composed of cropland and garden land, with cropland representing the largest proportion. To reveal the dynamic change characteristics of agricultural land systematically, this study focuses on analyzing the outward conversion pathways of cropland and garden, as well as their inward conversion characteristics to key land use types. To prevent the research focus from being obscured by the complex interconversion relationships among land use types, this study categorizes agricultural land conversions into the following types (Table 2), thereby establishing a foundation for subsequent quantitative analysis.
Table 2.
Identification of conversion pathways for agricultural land.
3.3.3. Quantification of Agricultural Land Conversion Intensity
The land use dynamic degree is a well-established model for measuring the rate of change in land use types [47]. To accurately quantify the transformation intensity of specific agricultural land conversion pathways within the study period across different terrain niches in the KMA, this study draws upon previous research [48,49] and adaptively refines the methodology to construct an agricultural land transformation intensity index. The calculation formula is as follows:
In the formula, Ti represents the transformation intensity (%) of a specific type of agricultural land conversion, ΔStotal denotes the total converted area of that transformation type during the study period, and Sa is the area of agricultural land (km2) at the beginning of the study period.
3.3.4. Focal Statistics
To quantify the spatial clustering characteristics of agricultural land transformation, this study employs focal statistics for spatial representation. This method is widely applied in landscape ecology and land use change research [50,51]. In this study, we calibrated the analysis scale and neighborhood shape of this method based on the topographic and ecological process characteristics of KMA. This calibration aims to more accurately extract the spatial clustering patterns of transformation that align with the actual conditions of the study area, thereby providing a basis for subsequent analysis of its ecological effects. The quantitative logic of this method can be explicitly expressed by the formula:
In the formula, S(i, j) represents the transformation clustering degree value (0–1) of the pixel at coordinates (i, j). A higher value indicates greater spatial contiguity and clustering intensity of agricultural land transformation in the area surrounding the pixel. N denotes the total number of valid pixels within the defined neighborhood. X(xk,yk) is the transformation attribute value of the k-th pixel within the neighborhood.
3.4. Quantification of Ecosystem Services
Building upon the karst geomorphological characteristics, data availability, and research objectives of Puding County, four key ES—soil retention, water yield, carbon storage, and food supply—were selected for assessment. These services were quantified using the InVEST model and statistical methods to ensure the spatial precision and ecological rationality of the evaluation results.
3.4.1. Soil Retention
Soil retention is a regulating ecosystem service. This study applied the Sediment Delivery Ratio (SDR) module within the InVEST model, which is based on the Revised Universal Soil Loss Equation (RUSLE), to assess SR capacity.
In the formula, SC represents the SR amount; R denotes rainfall erosivity; K indicates soil erodibility; L is the slope length-gradient factor; C represents the cover-management factor; and P signifies the support practice factor. The involved parameters were referenced from previous studies [52,53], with detailed settings provided in Table S2.
3.4.2. Water Yield
The annual water yield for each grid cell was calculated using the Water Yield module of the InVEST model. For more detailed information regarding this method and its parameter settings, please refer to the InVEST User’s Guide and related research [42], as provided in Table S3. The WY assessment module is primarily based on the principle of water balance. The water supply for each grid cell within the watershed is calculated as the difference between rainfall and actual evapotranspiration. The model equation is as follows:
Yxj represents the annual water yield for grid cell x of land use type j; AETxj is the annual average actual evapotranspiration for grid cell x of land use type j; and Px denotes the annual total precipitation at grid cell x.
3.4.3. Carbon Storage
Carbon storage is a climate-regulating service that mitigates global warming by capturing and storing greenhouse gases such as carbon dioxide. In terrestrial ecosystems, CS primarily originates from four core carbon pools: aboveground biomass, belowground biomass, soil carbon, and dead organic carbon. This study employed the Carbon Storage module of the InVEST model to calculate carbon storage for different land use types. The relevant parameter settings were referenced from Table S1.
In the formula, Ct represents the carbon stock of the i-th land use type; Ca denotes the CS in aboveground biomass; Cb refers to the CS in belowground biomass; Cd is the CS in dead organic matter; and Cs indicates the CS in soil.
3.4.4. Food Supply
Food supply represents a primary ES and is closely linked to human production and livelihood. Studies have shown a significant linear relationship between productivity in agriculture and livestock and the NDVI [54,55]. Building on this foundation, NDVI was adopted as a key parameter in this study to quantify the FS capacity of each pixel. The calculation formula is as follows:
In the formula, Gi denotes the grain yield and fruit yield allocated to the i-th grid cell; Gsum represents the total grain yield of the study area; NDVIi is the vegetation cover index for each grid; and NDVIsum is the sum of the vegetation cover index values corresponding to farmland and garden.
3.5. Hot Spot Analysis of Ecosystem Services
To accurately identify the spatial clustering characteristics of ES in the study area and reveal the distribution patterns of their high- and low-value zones, this study employed hotspot and coldspot analysis to quantify the spatial patterns of the four types of ES. This method quantifies the degree of spatial association between the ESV in a local area and the global value using the Getis-Ord Gi* index [56]. The calculation formula is as follows:
In the formula: Gi is the Getis-Ord Gi statistic for grid cell i; n is the total number of grid cells in the study area; Xj is the ESV of grid cell j; Wij is the spatial weight matrix between grid cells i and j; is the global mean of ES in the study area; S is the standard deviation of the ESV in the study area.
3.6. Correlation Analysis
To quantify the associations between different agricultural land transformations and various ES, and to reveal their variation characteristics across different terrain niches and periods. this study employed Spearman rank correlation analysis for quantitative investigation. This study used Spearman’s rank correlation analysis to calculate correlation coefficients between agricultural land conversion types and changes in ES for each topographic position across three periods: 2004–2016, 2016–2024, and 2004–2024. This method calculates the correlation coefficient based on the rank order of variables. It does not require strict assumptions about data distribution and is suitable for examining nonlinear monotonic relationships [57].
In the formula, r denotes the Spearman rank correlation coefficient, which ranges from −1 to 1. The closer the absolute value of r is to 1, the stronger the association between the two variables; conversely, the closer it is to 0, the weaker the association.
4. Results
4.1. Spatiotemporal Evolution and Transformation of Agricultural Land
4.1.1. Agricultural Land Transformation Characteristics Across Terrain Gradients
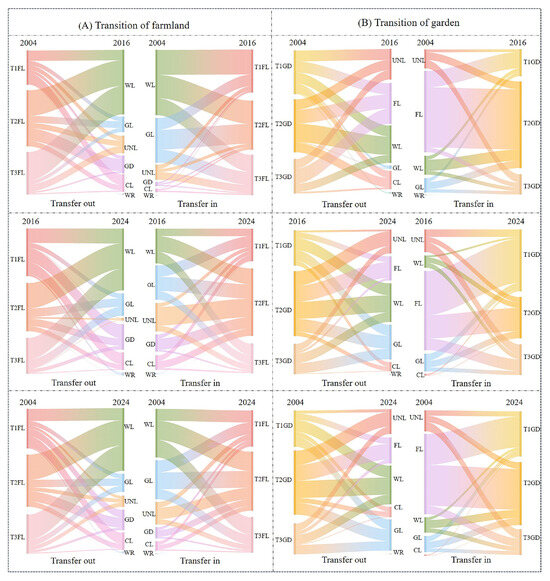
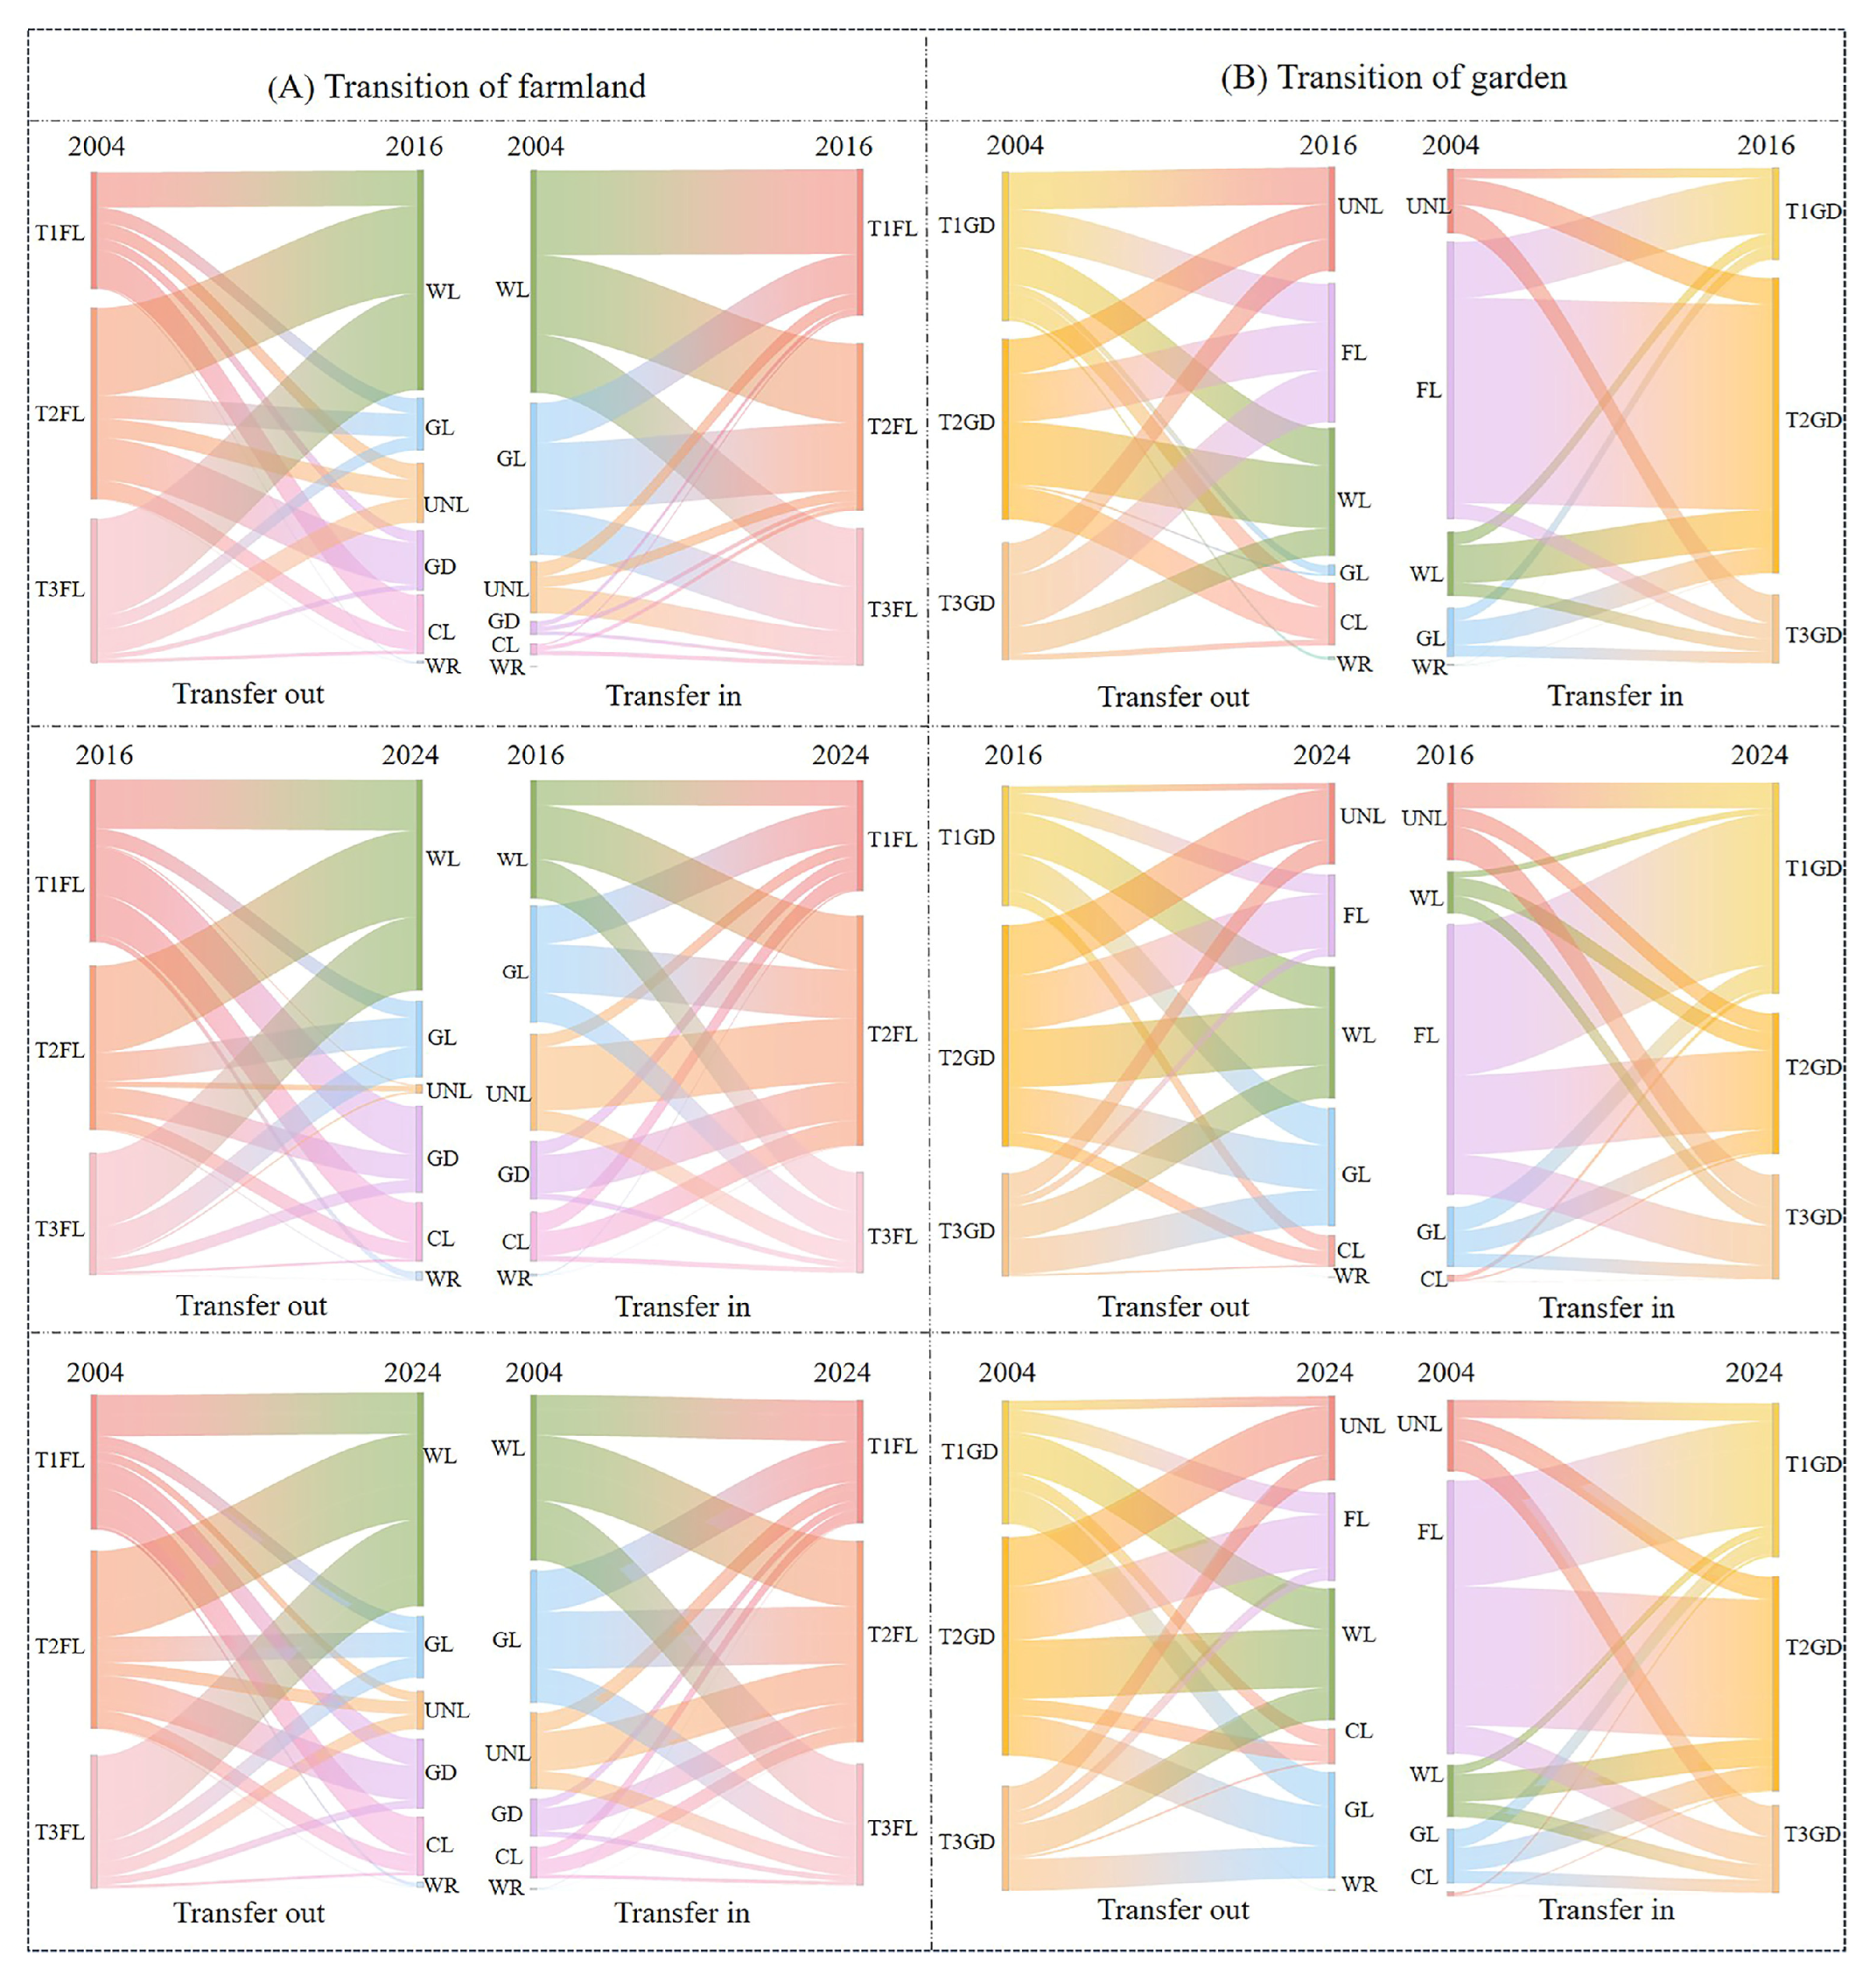
During 2004–2024, agricultural land transformation in the study area was intense (Figure 3). As the core land use type, farmland underwent the largest conversion scale with diversified directions, primarily shifting to woodland and grassland. The garden experienced substantial expansion, heavily reliant on transfers from farmland and woodland. Agricultural land transformation exhibited marked variations across different terrain gradients. During 2004–2016, agricultural land in low-topographic areas was predominantly characterized by the conversion of farmland, mainly to woodland (9.3 km2) and construction land (9.7 km2). The overall scale of the garden was relatively small, with changes primarily driven by land inflow. Farmland served as the primary source of this inflow, with a conversion area of 3.05 km2. In mid-topographic positions, a significant amount of farmland was converted to woodland (22.9 km2) and garden (11.14 km2). The expansion of the garden was achieved primarily through the conversion of farmland (11.14 km2). In high-topographic positions, farmland was primarily converted to woodland (25.36 km2) and unused land (6.36 km2), while the scale of conversion into garden remained relatively small. During 2016–2024, farmland in low-topographic positions was mainly converted to construction land (7.41 km2), woodland (9.47 km2), and gardens (8.92 km2). The total converted area of gardens reached 12.72 km2, including not only farmland but also grassland and unused land. In mid-topographic positions, farmland was primarily converted to woodland (16.11 km2), with a smaller area converted to gardens (4.68 km2). farmland continued to shift primarily to woodland (13.66 km2) and grassland (5.65 km2). In high-topographic positions, farmland continued to shift primarily to woodland (13.66 km2) and grassland (5.65 km2). Meanwhile, the garden remained largely driven by land inflow and showed a slight increase in area. From 2004 to 2024, the overall trend of agricultural land transformation was broadly consistent with the land conversion characteristics observed in the two sub-periods. In low-topographic positions, a large amount of farmland was converted to construction land (12.69 km2) and gardens (11.34 km2). In mid-topographic positions, transformation showed a pattern of diversification toward woodland, grassland, and gardens. In high-topographic positions, agricultural land transformation was relatively concentrated, with substantial areas of farmland and gardens converted to ecological land (42.38 km2).
Figure 3.
Transfer in and out of agricultural land conversion under different topographic positions from 2004 to 2020. (T1FL, Farmland in low topographic positions; T2FL, Farmland in middle topographic positions; T3FL, Farmland in high topographic positions. T1GD, Garden in low topographic positions; T2GD, Garden in middle topographic positions; T3GD, Garden in high topographic positions. WL, Woodland; GL, Grassland; WR, Water; GD, Garden; CL, Construction land; UNL, Unutilized land).
Overall, agricultural land transformation exhibited distinct topographic differentiation: high-topographic positions were dominated by ecological land use conversion; mid-topographic positions were characterized by a combination of ecological land use conversion and agricultural intensification; while low-topographic positions centered on Agricultural intensification and non-agricultural conservation.
4.1.2. Spatial Pattern and Intensity of Agricultural Land Transformation Across Terrain Gradients
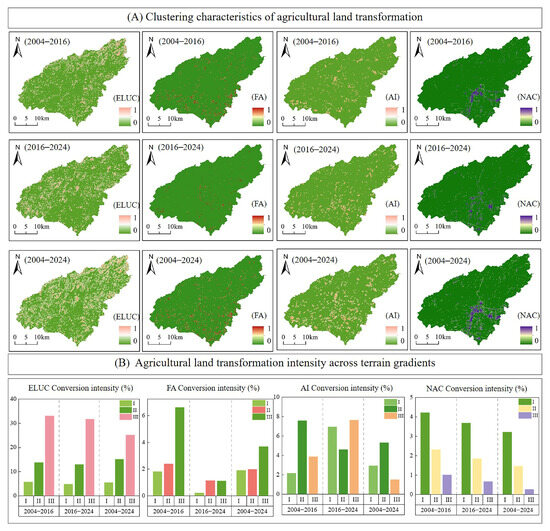
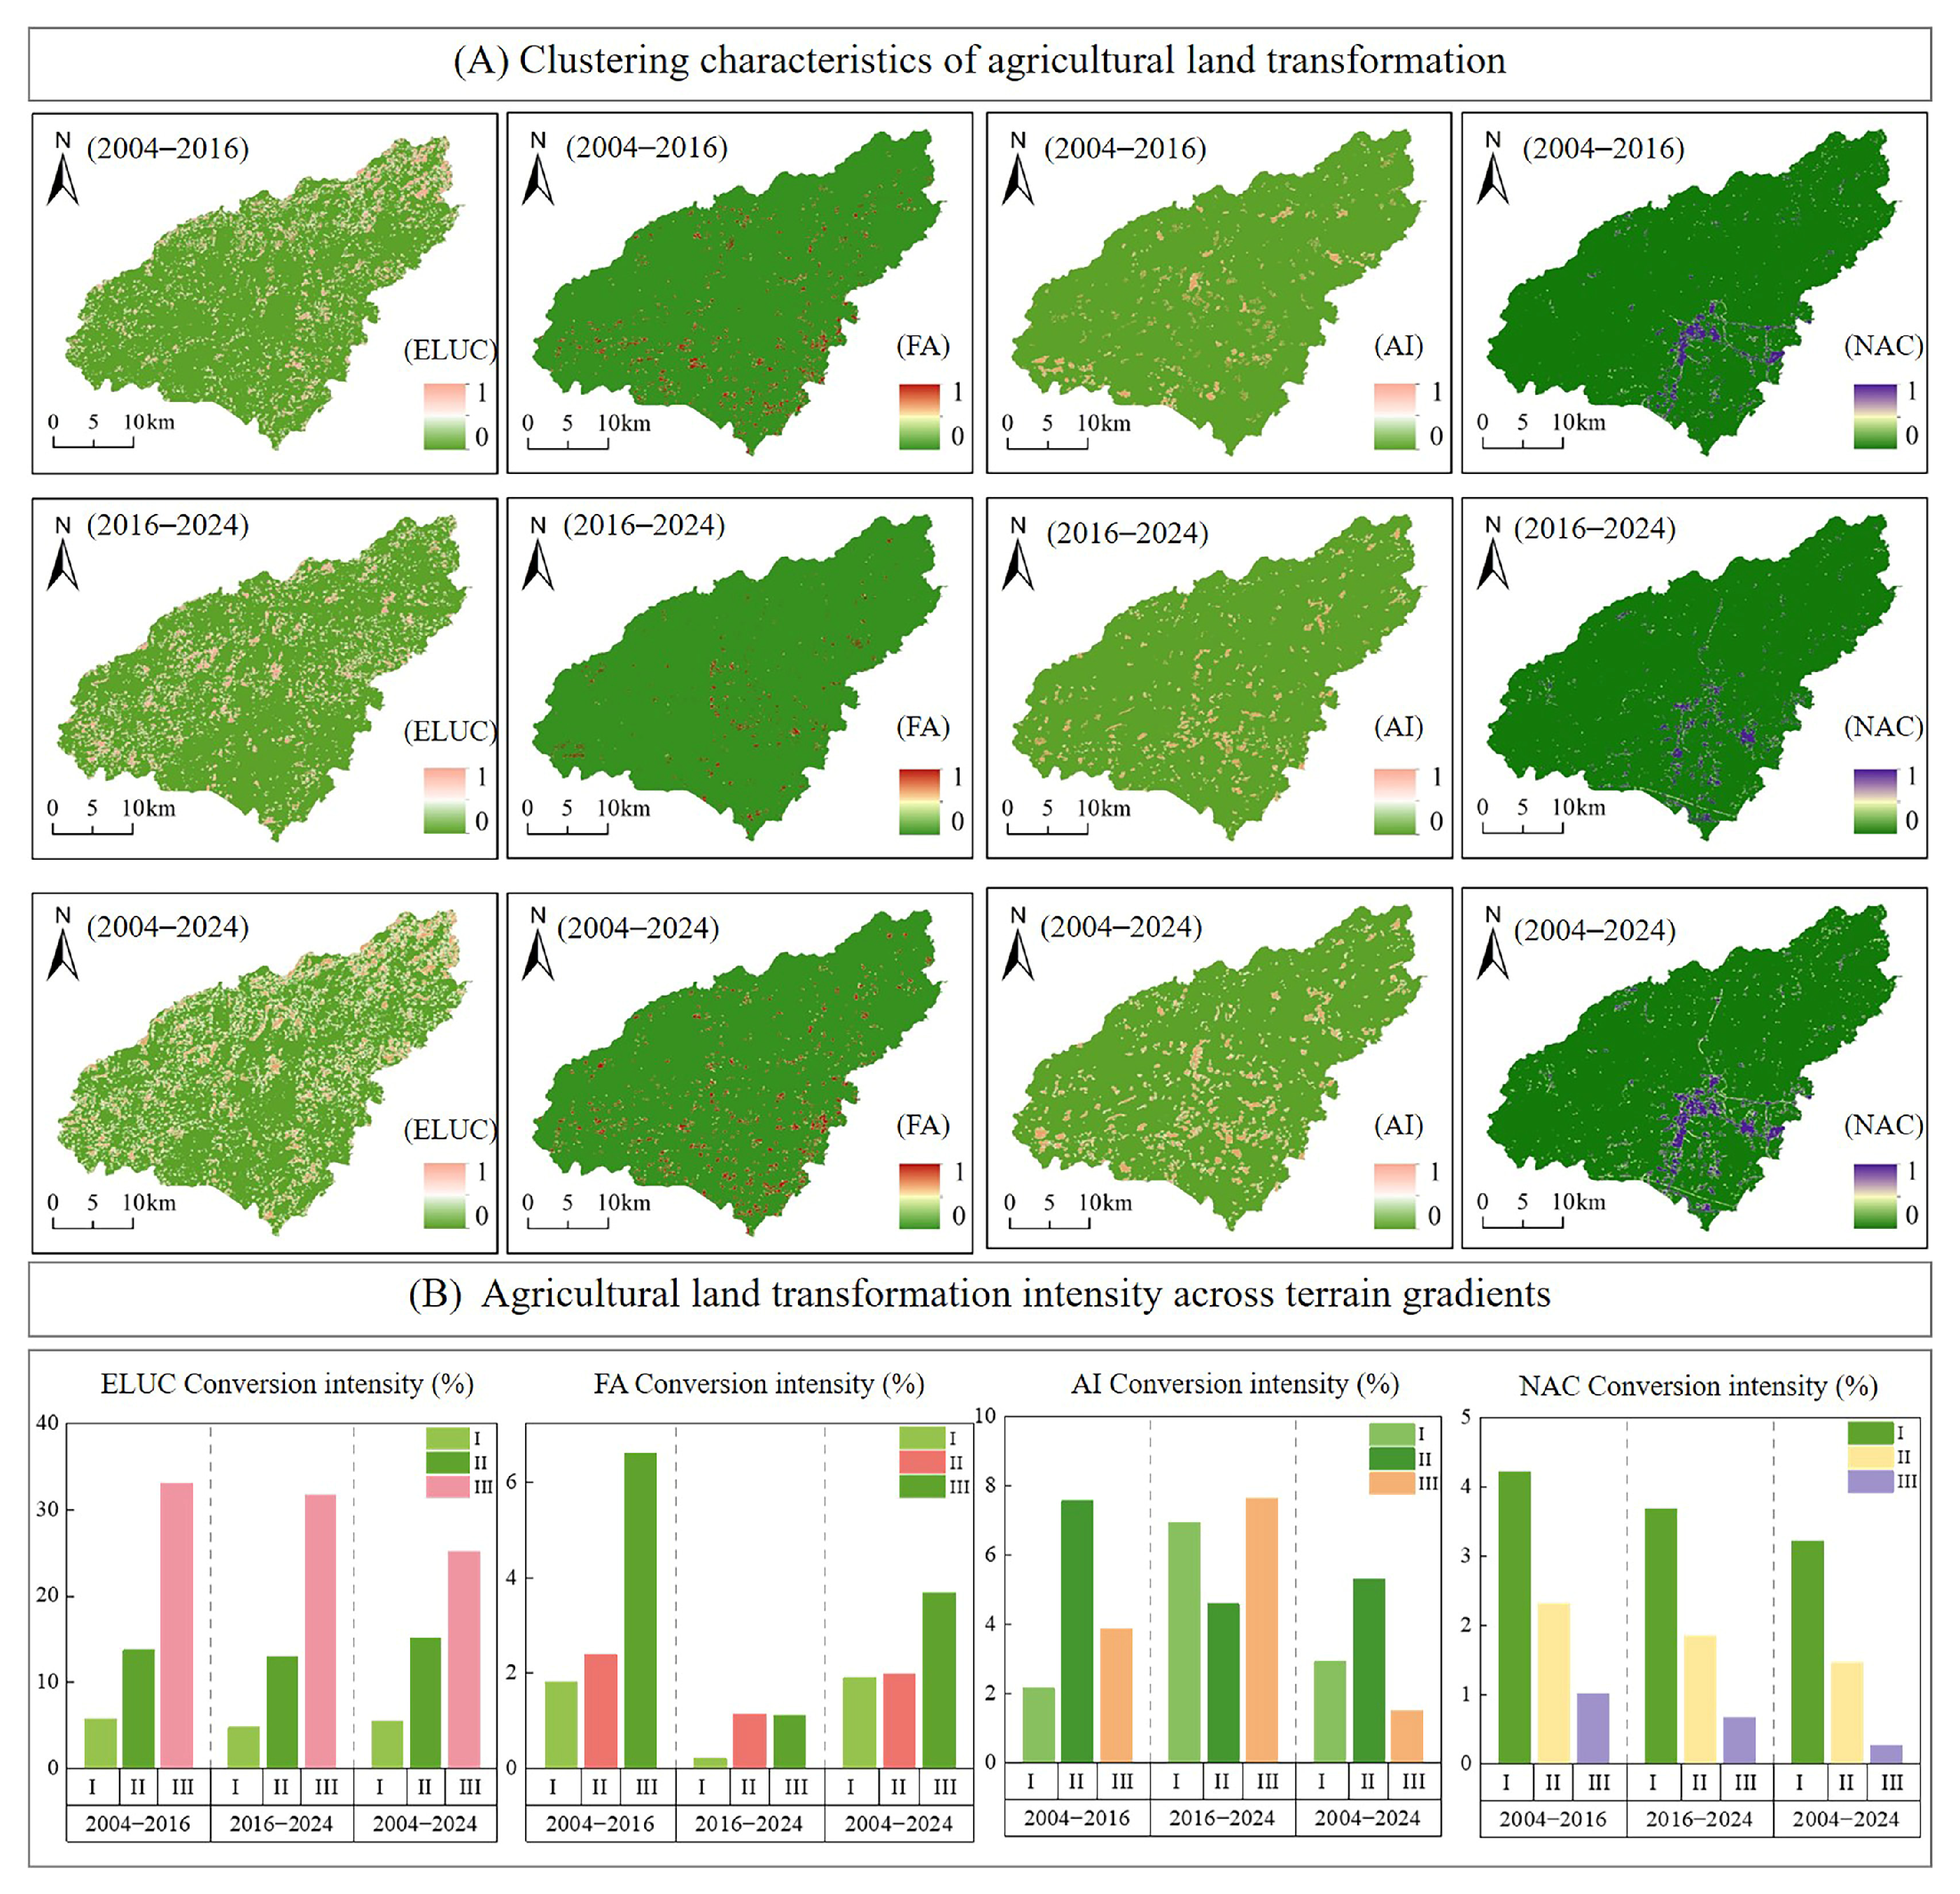
As shown in Figure 4, the spatiotemporal patterns and intensity of agricultural land transformation show significant differentiation. Ecological land use conversion was the dominant transformation type during the study period. It occurred across almost the entire region from 2004 to 2024, with a spatial evolution characterized by agglomeration in the northeast and expansion in the southwest. From 2004 to 2016, the transformation was mainly concentrated in the northeastern region in a patchy pattern. From 2016 to 2024, it expanded continuously toward the southwest. The transformation intensity increased with topographic position. High-topographic positions consistently had the highest intensity, with values of 33.8%, 31.73%, and 25.15% for the periods 2004–2016, 2016–2024, and 2004–2024, respectively. This reflects a strong response to ecological restoration policies. From 2004 to 2024, farmland abandonment was mainly distributed in the central and southeastern parts of the study area, with clear spatial differences across different periods. From 2004 to 2016, hotspot transformation areas were concentrated in the southwest and southeast regions. From 2016 to 2024, they shrank significantly and were only scattered in the central area. From 2004 to 2016, farmland abandonment was an active period, with transformation intensity remaining at a high level across all topographic positions (reaching 6.11% in high-topographic positions). From 2016 to 2024, the intensity dropped sharply overall, falling to 0.21% in low-topographic positions, directly reflecting the significant effectiveness of land revitalization and management policies during this period. From 2004 to 2024, agricultural intensification was consistently concentrated in low-altitude gentle slope areas in the south-central region, with hotspot areas gradually shifting southwestward during this period. Its transformation intensity remained consistently high (>7.5%), with the dominant topographic position shifting between periods: it peaked in mid-topographic positions during 2004–2016 (7.75%) and in high-topographic positions during 2016–2024 (7.63%). Over the entire study period, mid-topographic positions were the core area of transformation intensity, which is closely related to large-scale agricultural operations and adjustments in industrial structure layout. Hotspot areas of non-agricultural conversion were consistently concentrated in low-topographic positions in the southwest, expanding along towns and transportation lines, with little change in spatial evolution from 2004 to 2024. The transformation intensity showed a clear negative topographic gradient, with low-topographic positions being absolutely dominant, consistent with the pattern of human activities concentrating in low-lying areas.
Figure 4.
Spatial aggregation and intensity of agricultural land transformation. (From left to right: Ecological land use conversion (FLUC), Farmland abandonment (FA), Agricultural intensification (AI), and Non-Agricultural conversion (NAC). The Roman numerals I, II, and III represent low, medium, and high topographic positions, respectively.).
4.2. Spatiotemporal Heterogeneity of Ecosystem Services
4.2.1. Spatiotemporal Patterns of Ecosystem Services and Terrain Gradients Effects
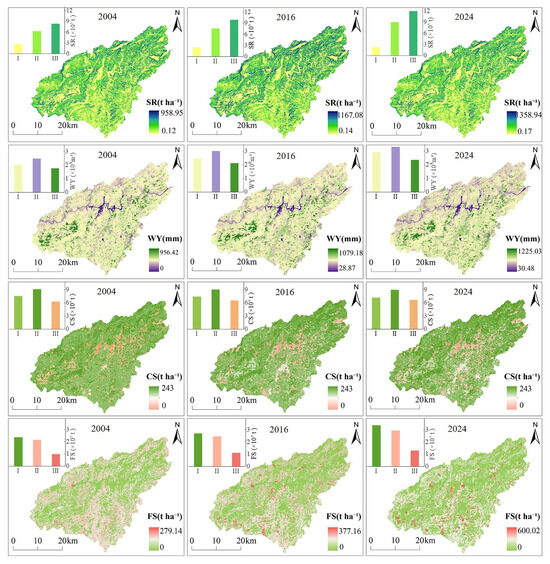
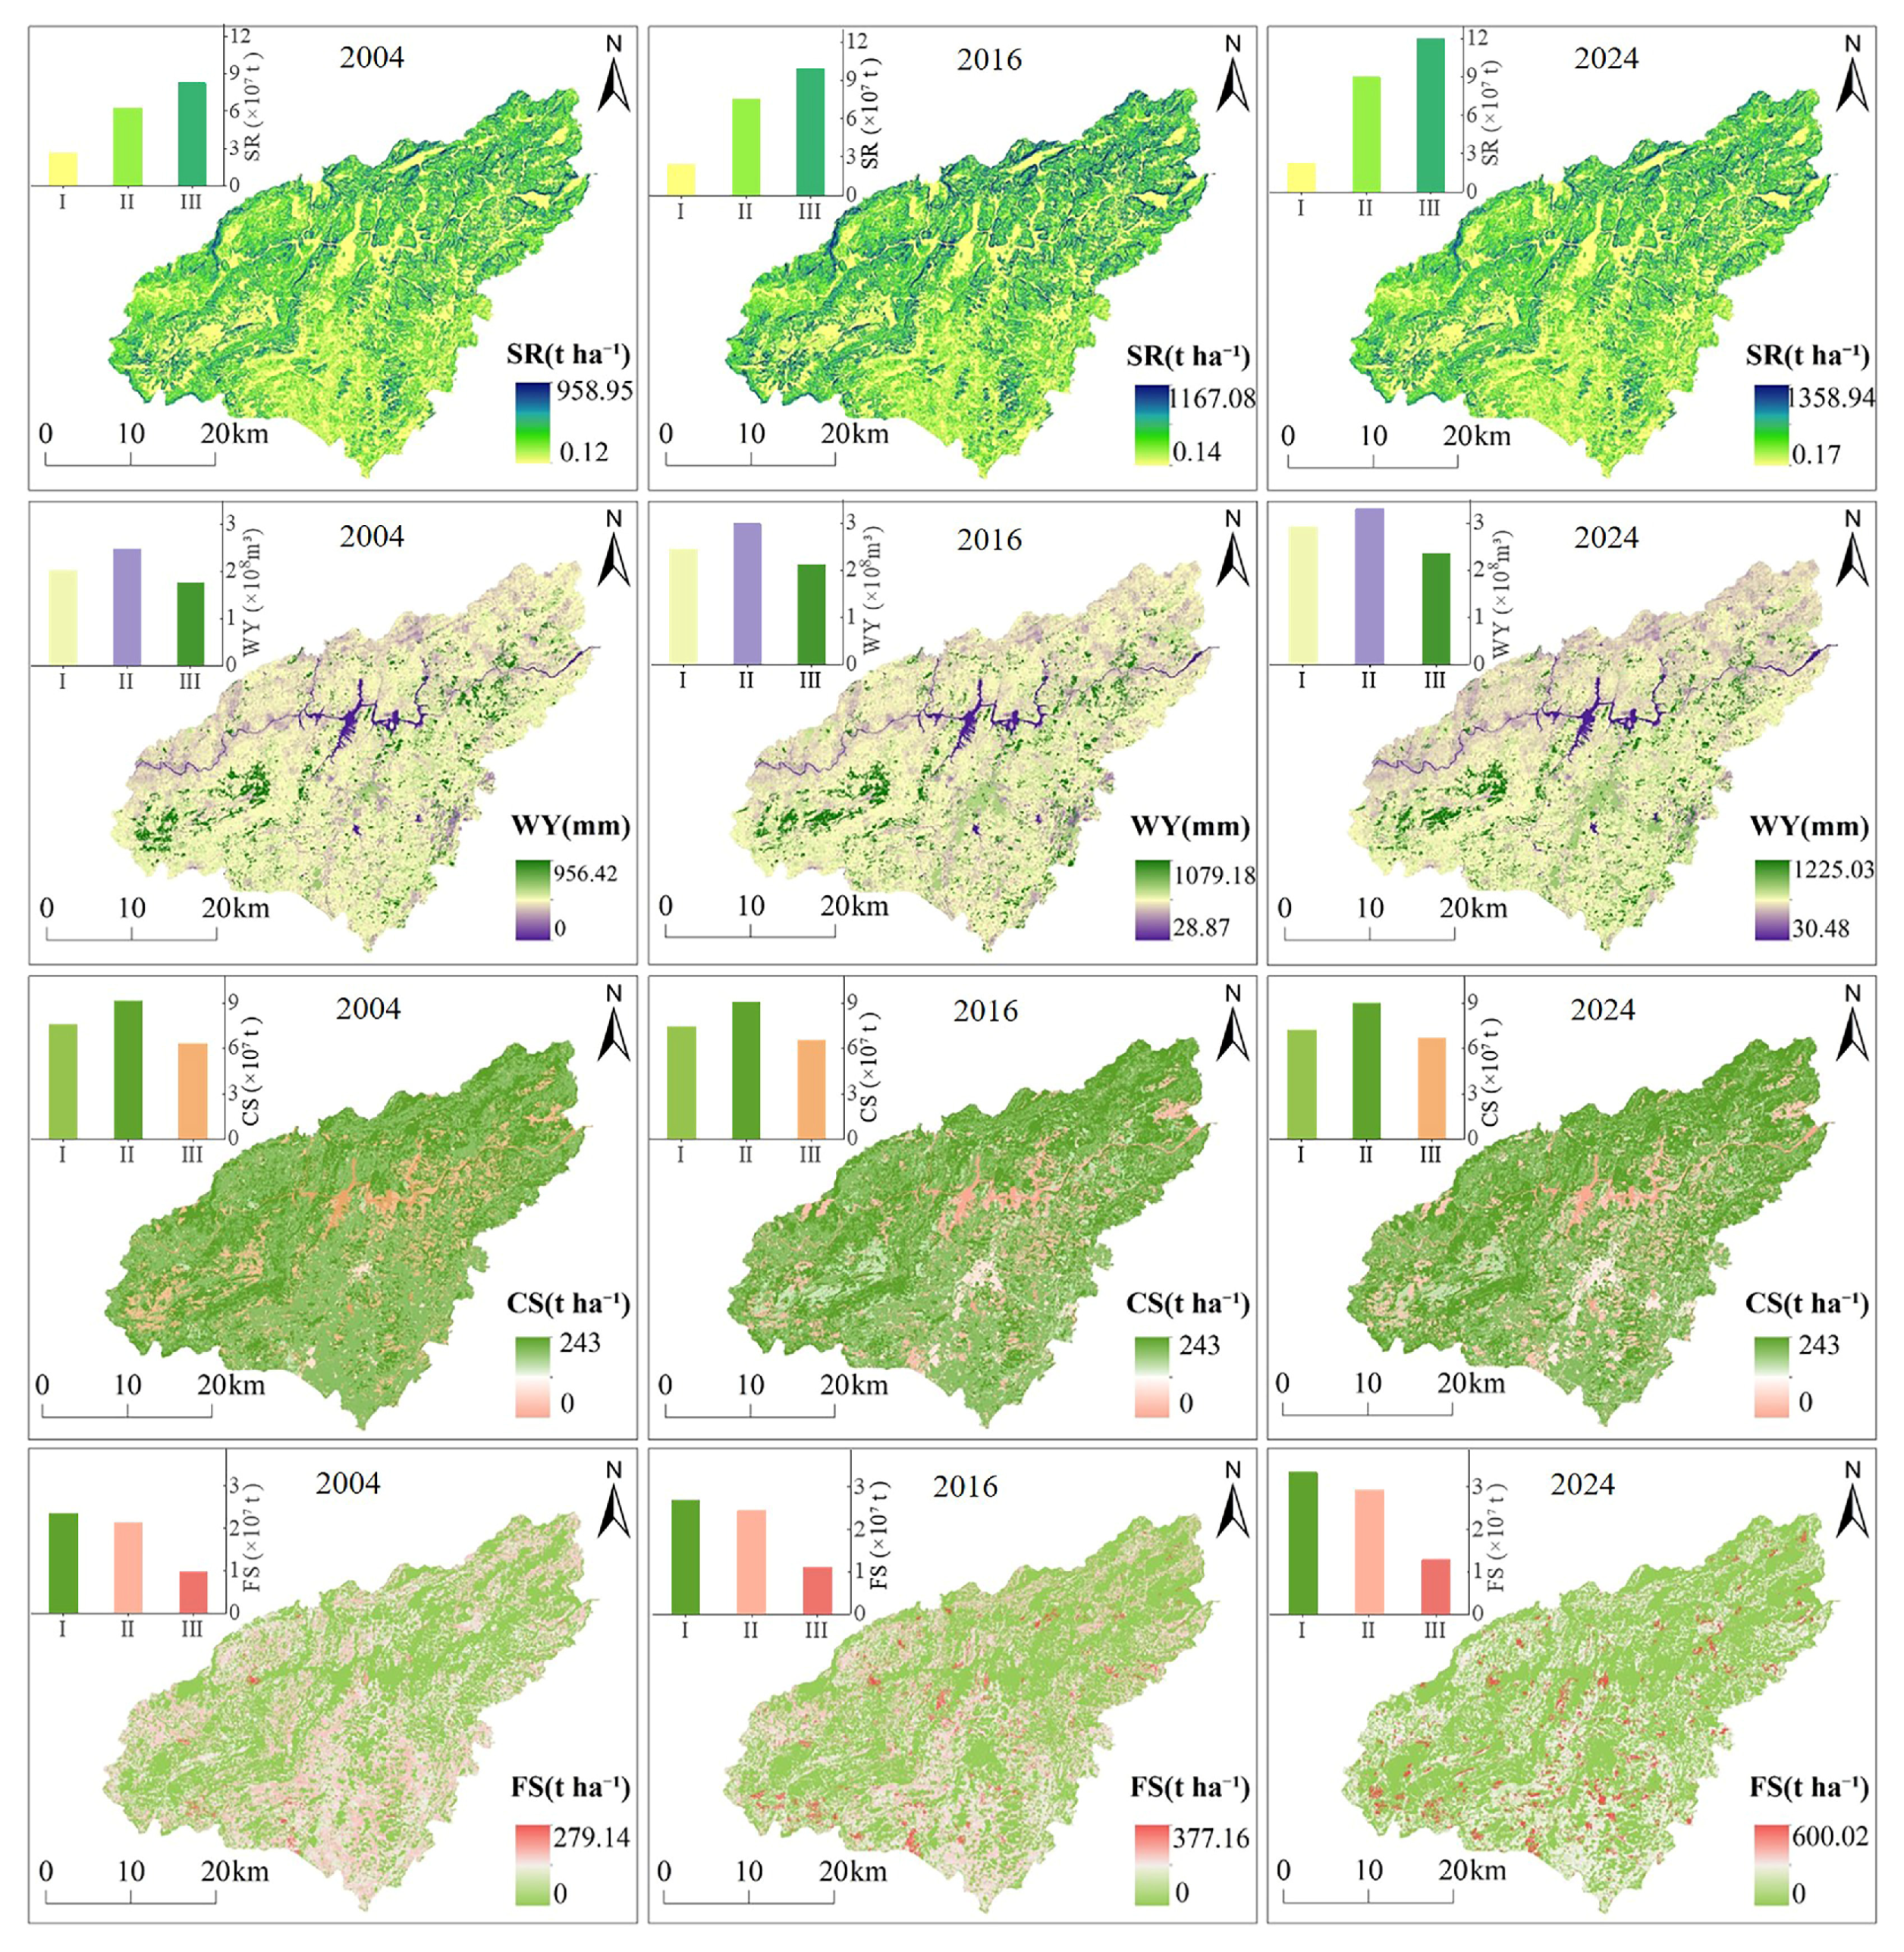
From 2004 to 2024, agricultural land transformation directly influenced ES in the study area. As shown in Figure 5, the four key services exhibited distinct spatiotemporal evolution patterns, each closely related to terrain conditions. SR showed high spatial stability, with high-value areas consistently clustered in the northeast and southwest regions with higher vegetation cover, while low-value areas persisted in the southeastern region. The total SR showed a significant increase, with contributions primarily from mid- and high-topographic positions, rising by 2.74 × 10⁷ t and 3.73 × 10⁷ t, respectively. This growth is associated with improvements in ecological conditions within these regions. In contrast, the spatial pattern of WY showed notable changes. It generally exhibited lower values in the northwest and higher values in the southeast, with the extent of high-value areas in the southeast expanding over time. Overall, WY in the study area showed an increasing trend. The increments decreased from low- to high-topographic positions, with values of 0.91 × 10⁸ m3, 0.82 × 10⁸ m3, and 0.59 × 10⁸ m3, respectively. Changes in WY were particularly pronounced in low-topographic positions, which are subject to more intensive human activities. The spatial distribution of CS shifted, with high-value areas concentrating toward the northeast and the low-value regions shifting toward the southeast. The total CS showed a decreasing trend compared to other services. Specifically, mid- and low-topographic positions decreased by 0.14 × 10⁷ t and 0.36 × 10⁷ t, respectively, while an increase only occurred in high-topographic positions (0.35 × 10⁷ t). Overall, CS became increasingly concentrated in high-topographic positions. FS underwent the most significant changes. Its spatial coverage contracted sharply, shifting from a widespread distribution across the entire study area to a scattered presence only in the southern region. The total amount of FS increased over time. This growth was heavily concentrated in low topographic positions (0.99 × 10⁷ t), with progressively smaller increments in mid- and high-topographic positions (0.79 × 10⁷ t and 0.31 × 10⁷ t, respectively). This pattern—spatial contraction coupled with production intensification—reflects a trend of highly intensified agricultural development focused on the most favorable natural areas, constrained by spatial limitations.
Figure 5.
Spatiotemporal dynamics of ecosystem services from 2004 to 2024 (F From top to bottom: soil conservation (SR), water yield (WY), carbon storage (CS), and food supply (FS). The bar charts in the upper left corner of each subfigure show the total values of the corresponding ecosystem services for low, medium, and high topographic positions (levels I, II, and III) in 2004, 2016, and 2024. The vertical axis represents the total service value).
4.2.2. Cold and Hot Spot Analysis of Ecosystem Services
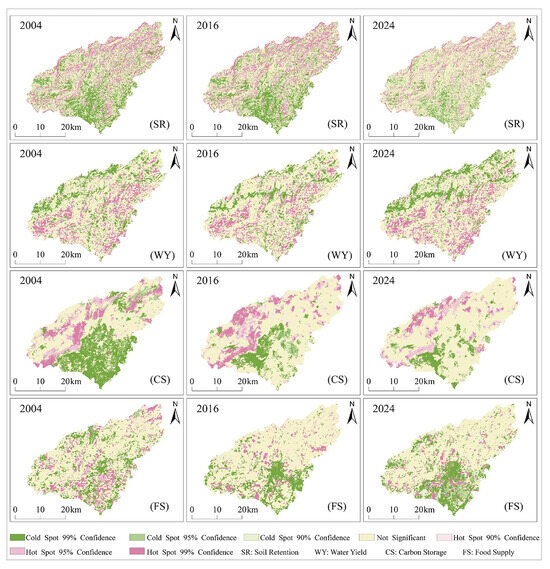
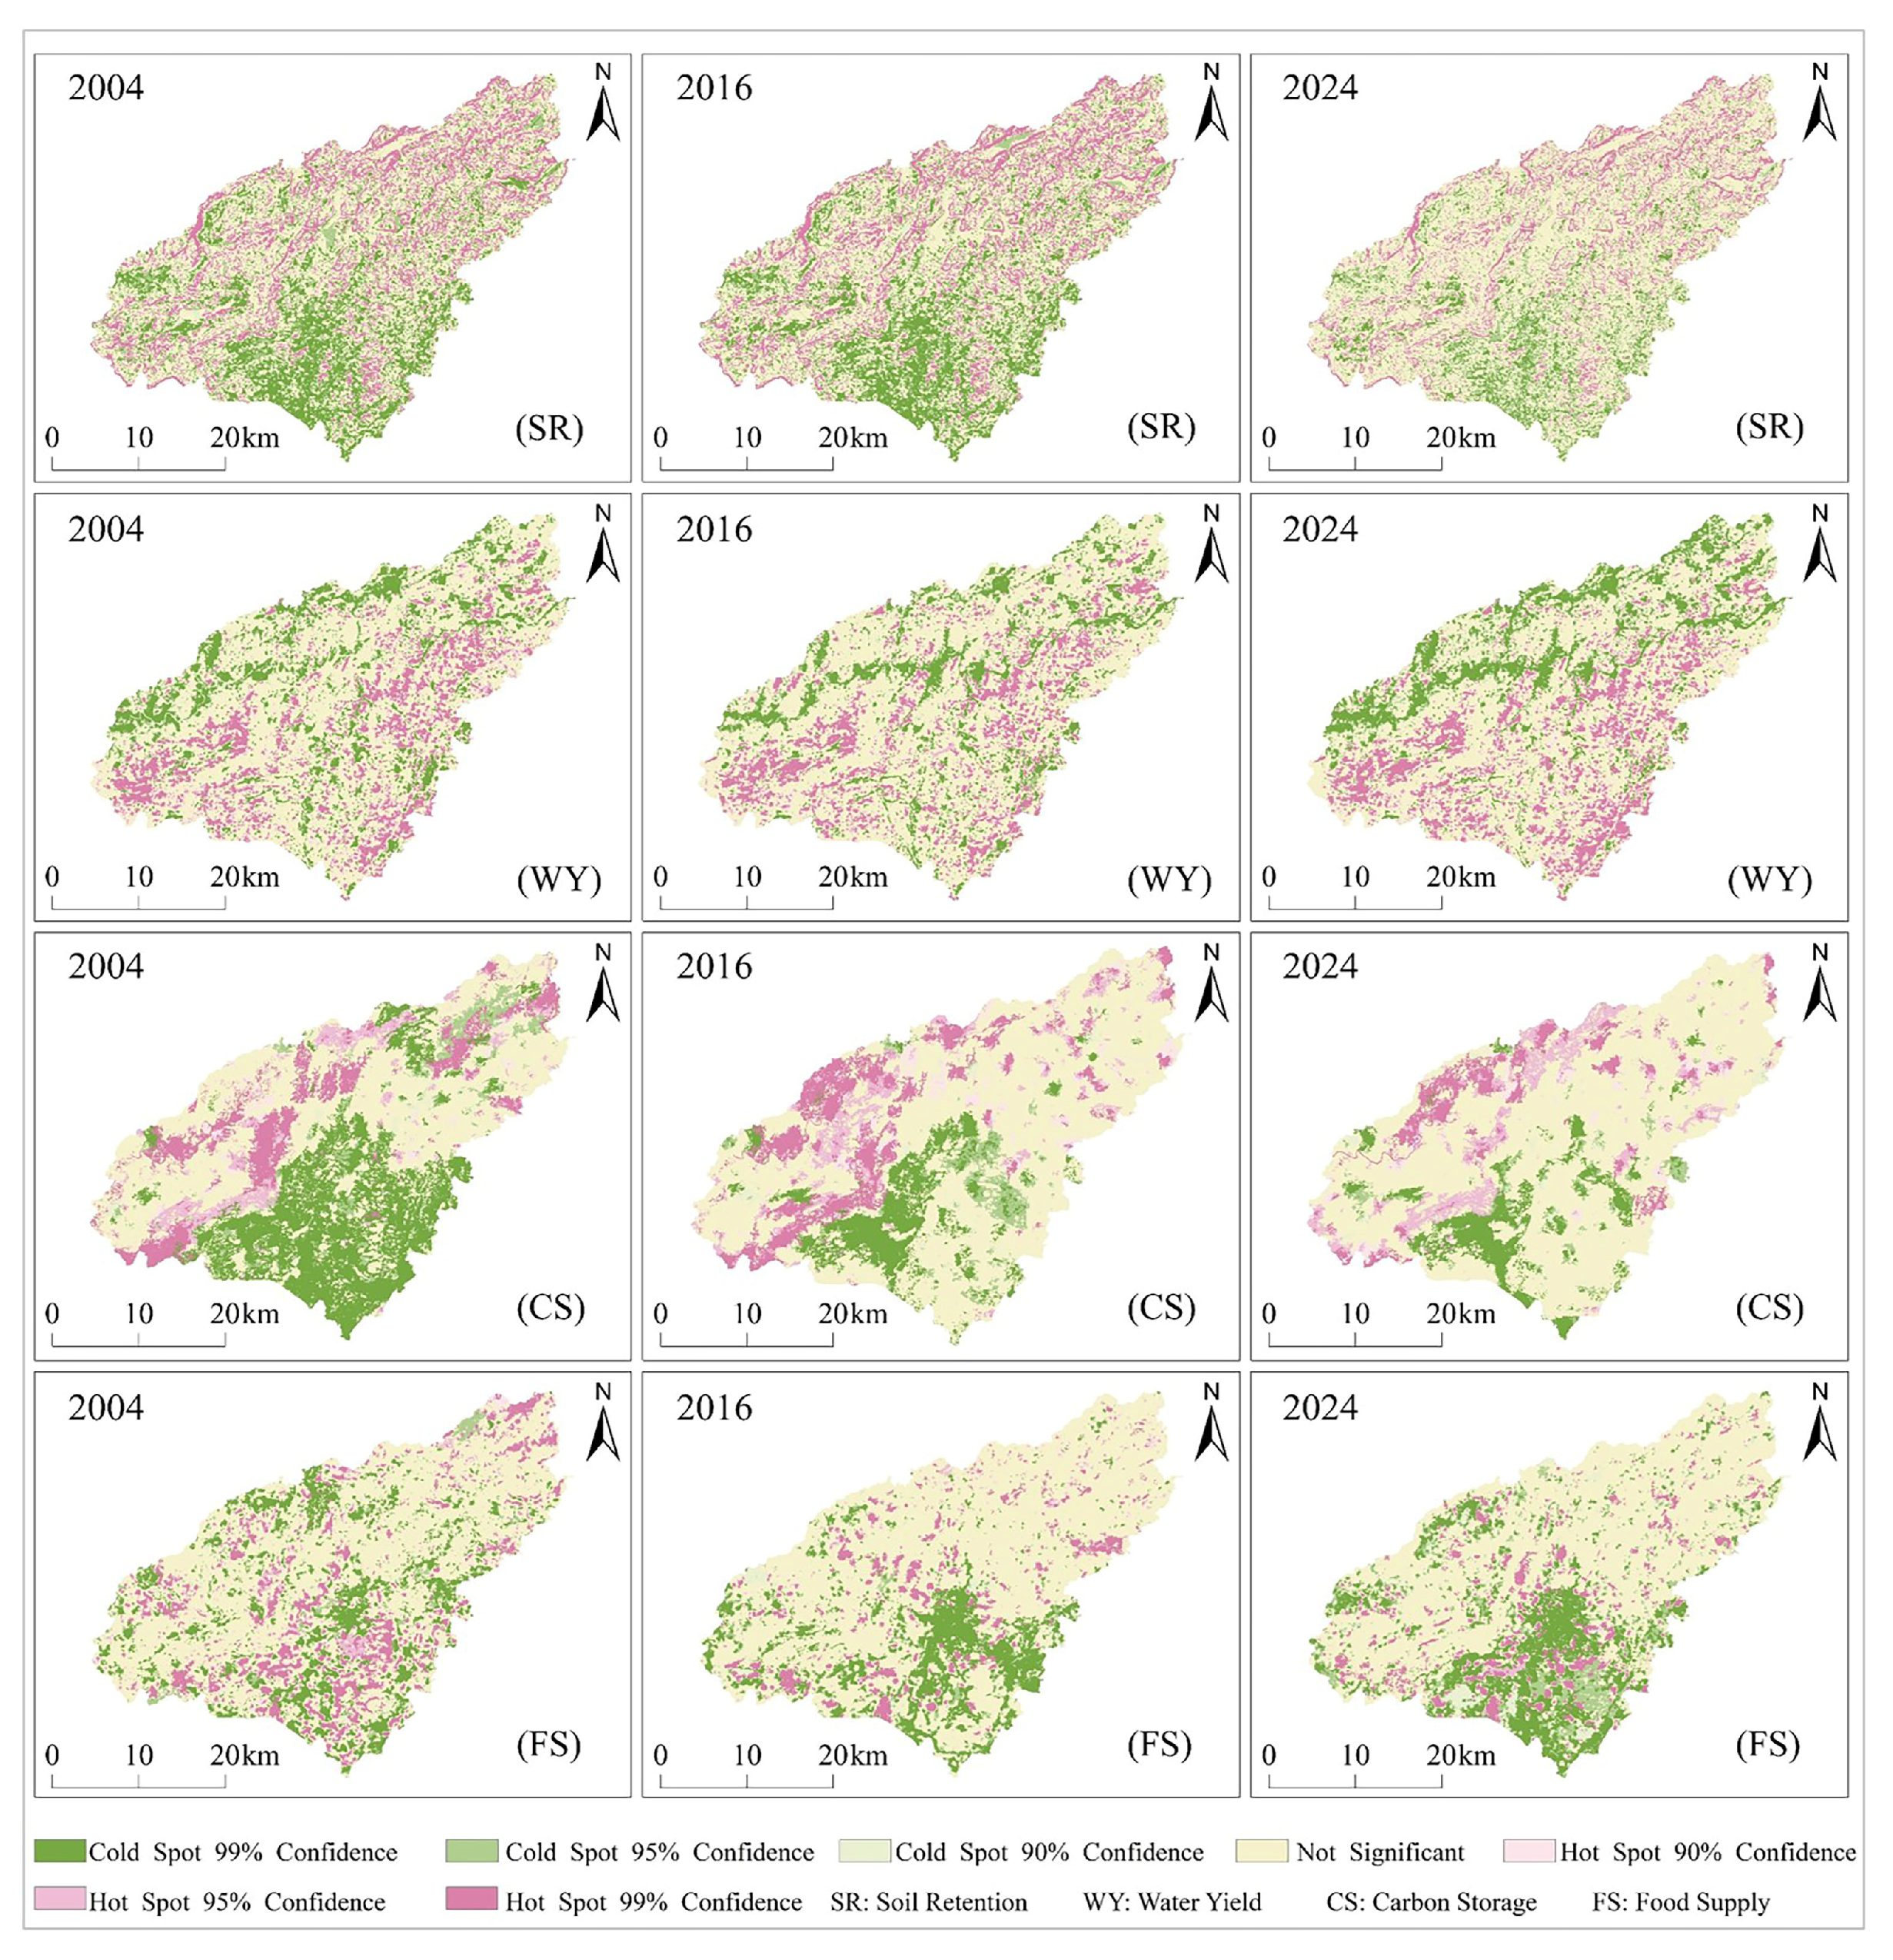
Analysis of the spatial distribution of ES hotspots and coldspots (Figure 6) shows distinct differentiation and dynamic evolution across the four services. During 2004–2024, the hotspots of CS and SR were consistently concentrated in the eastern and western parts of the study area; these regions are characterized by higher elevations and a concentrated distribution of ecological land use. Hotspots of SR were mainly distributed in the eastern region, while CS hotspots were predominantly located in the west. In contrast, the southwestern area, characterized by relatively gentle terrain and intensive human disturbance, has become a clustered coldspots zone for SR, CS, and FS. The pattern of hotspots and coldspots for WY differed from that of other services. Its hotspots were consistently clustered in the southeastern low-topographic positions, while coldspots were located in the eastern and western parts. From 2004 to 2024, the extent of non-significant areas in SR gradually expanded, while hotspot and coldspots areas correspondingly contracted. This indicates a reduction in the spatial heterogeneity of SR function across the region, which may be attributed to the fragmentation of ecological land at the edges of eastern hotspots and the effects of ecological restoration driving service values to converge toward the mean. The hotspots of WY gradually expanded in the southwest, while coldspots also increased in the east. These changes were closely associated with ecological restoration and the expansion of construction land. The spatial pattern of CS hotspots remained relatively stable, while coldspots contracted westward. Although construction land increased in the southeast, ecological restoration and the expansion of garden land in surrounding areas led to a gradual increase in non-significant zones in this region. The evolution of FS was the most pronounced, with its hotspots becoming increasingly fragmented. This shift is primarily attributed to the conversion of farmland to construction land and the intensification of agricultural practices.
Figure 6.
Spatial distribution of ecosystem service hotspots and coldspots. (From top to bottom: Soil Retention (SR), Water Yield (WY), Carbon Storage (CS), and Food Supply (FS)).
4.3. Impacts of Agricultural Land Transformation on Ecosystem Services Across Terrain Gradients
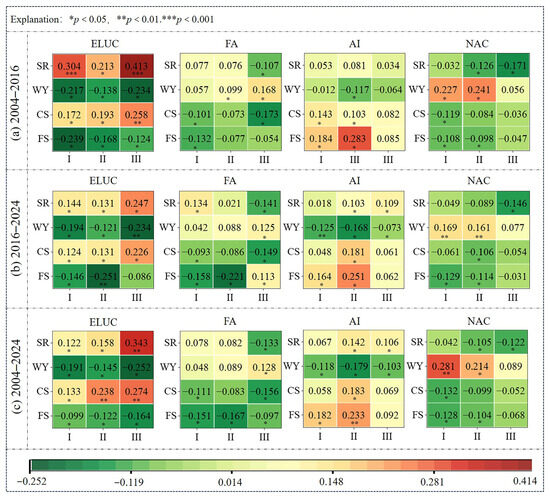
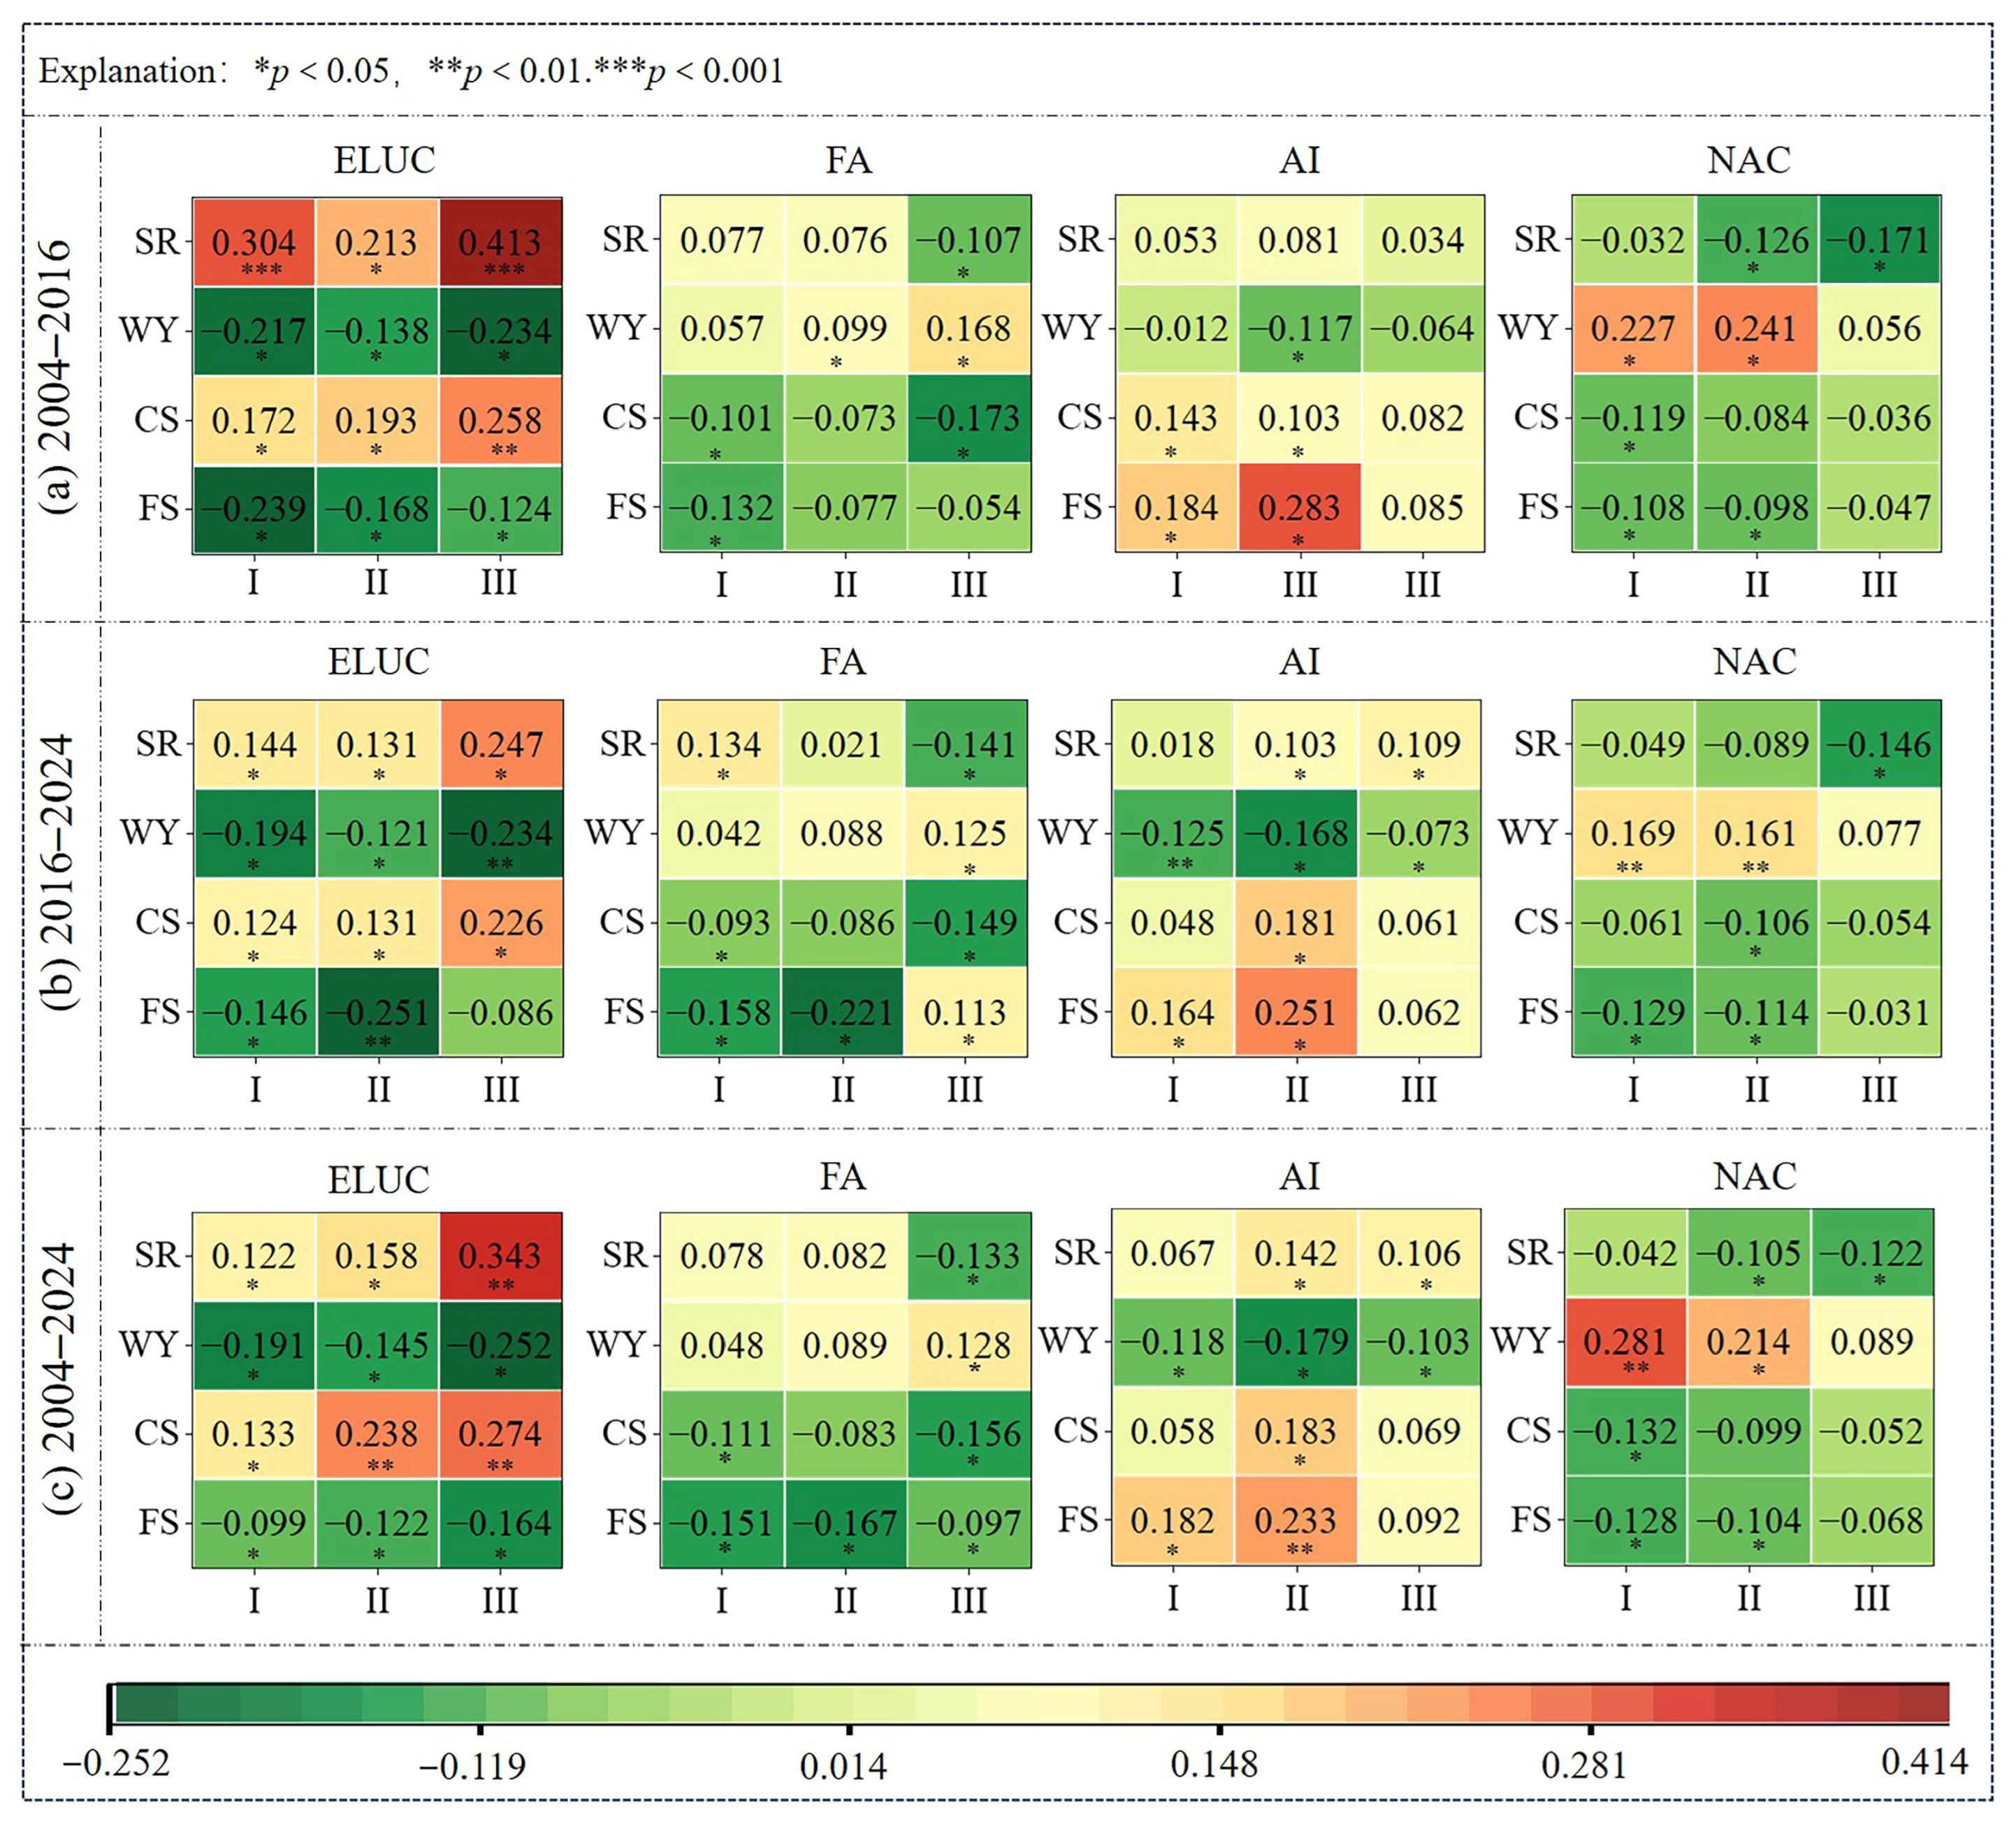
The transformation of agricultural land is associated with ecosystem services in complex and diverse ways. We calculated the correlations between transformation pathways and changes in ecosystem services for three periods: 2004–2016, 2016–2024, and 2004–2024 (Figure 7). The results showed that over 67% of the correlation coefficients were statistically significant (p < 0.05), and the ratio of positive to negative correlations was approximately 5:4, indicating that the transformation process involved both gains and losses in ecosystem services. Across all correlation types, regulating services showed stronger correlations with transformation pathways than provisioning services, indicating that agricultural land transformation has a more pronounced impact on ecological regulating functions.
Figure 7.
Correlations between different agricultural land transformation pathways and various ecosystem services. (I, II, and III represent low, medium, and high topographic positions, respectively; ELUC, FA, AI, and NAC represent Ecological land use conversion, Farmland abandonment, Agricultural Intensification, and Non-Agricultural conversion, respectively.).
Further analysis showed that the strength of these correlations varied significantly along topographical gradients and exhibited stage-specific patterns across different periods. From low to high topographic positions, human activity intensity gradually decreases, while ecosystem sensitivity progressively increases. As a result, the ecological effects of transformation pathways show regular variations. In mid-to-low topographic positions with intensive human activity, the effects of human-dominated transformations are significantly amplified. Non-agricultural conversion showed a relatively strong positive correlation with WY (r > 0.24), reflecting the sharp impact of increased impervious surfaces on surface runoff. Meanwhile, intensive transformation had a relatively prominent promoting effect on FS (r > 0.16), demonstrating the role of intensive agricultural management in enhancing provisioning services. In ecologically sensitive high-topographic positions, natural recovery effects dominate. The positive correlation between ecological land use conversion and SR peaked in 2004–2016 at r = 0.413, indicating high ecological benefits. Meanwhile, ecological land use conversion also showed a significant positive correlation with CS. Notably, farmland abandonment in high-topographic positions showed a negative correlation with SR (r < −0.107). In such ecologically sensitive areas, simply allowing land to lie fallow without artificial intervention may exacerbate soil erosion, which is not conducive to improving ecosystem services. In terms of temporal trends, the strength of most statistically significant correlations weakened during 2016–2024. This may imply that as agricultural land transformation progresses, its marginal ecological effects on ecosystem services tend to moderate, and the ecological impacts gradually enter a relatively stable stage.
In summary, the ecological impacts of agricultural land transformation are not homogeneous. Instead, they are determined by the direction of gains and losses associated with the transformation pathways and are significantly modulated by topographic gradients.
5. Discussion
5.1. Differences in Agricultural Land Transformation Under Topographic Constraints
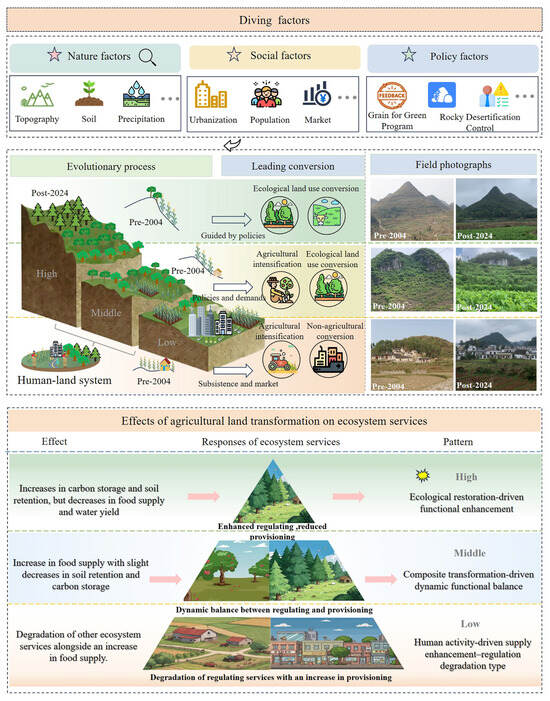
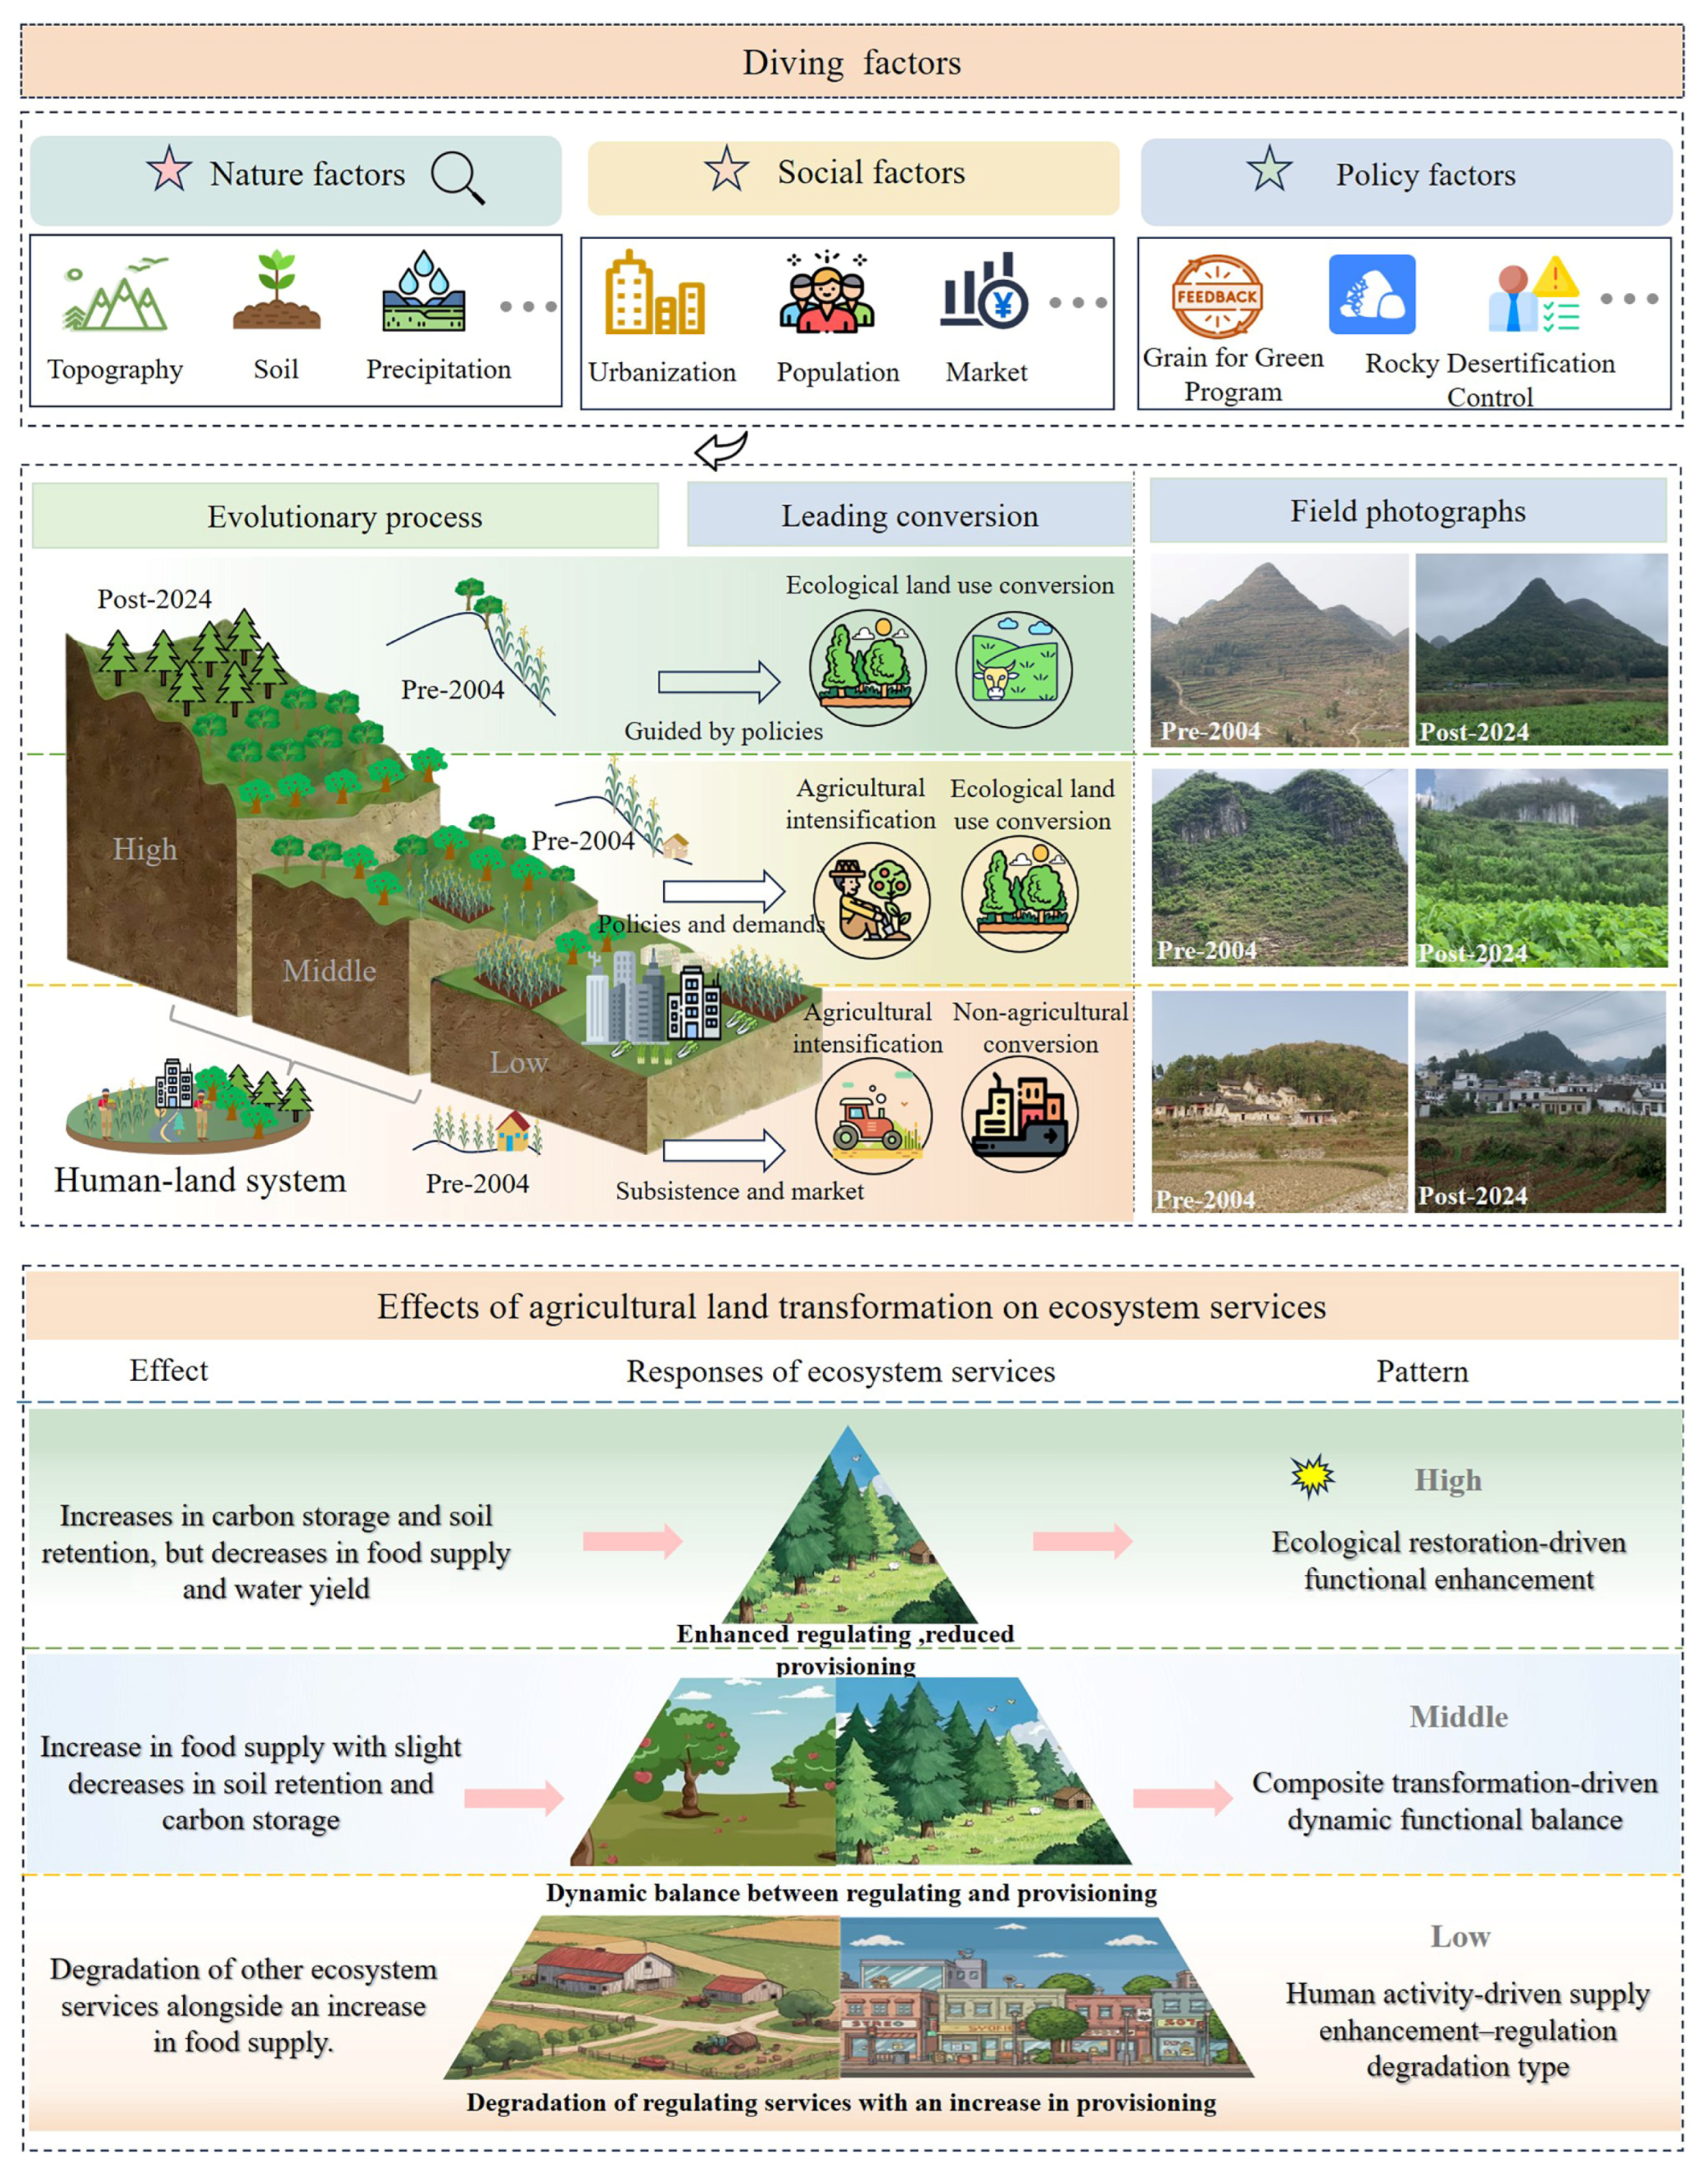
This study demonstrates that topography is a critical factor driving the spatial differentiation of agricultural land transformation in KMA, a finding consistent with the research of Lian et al. [58]. From 2004 to 2024, agricultural land transformation in Puding County exhibited a regular differentiation along topographic gradients, which essentially reflects the varied expressions of human-land interactions under topographic constraints. High-topographic position is dominated by ecological land use conversion; mid-topographic position showed combined ecological and intensive transformation; while low-topographic position focused on intensification and non-agricultural. This differentiated pattern was not determined solely by topography but resulted from the interactive coupling of natural, social, and policy factors (Figure 8). The ecological impacts of agricultural land transformation are heterogeneous. They are governed by the gain-loss directions of transformation pathways and are simultaneously modulated by topography.
Figure 8.
Agricultural land transformation and its impacts on ecosystem services.
Topography influences agricultural land transformation primarily by governing key agricultural conditions such as soil depth and fertility, thereby constraining the transformation orientation in different regions. Prior to the implementation of the Grain for Green program, severe desertification was in the KMA. Local residents engaged in disordered land reclamation to meet subsistence needs, resulting in a vicious cycle of human-land relationships [59]. Following policy implementation in 2004, high-topographic position, characterized by steep slopes, infertile soils, and low agricultural productivity potential, was prioritized for the Grain for Green program and rocky desertification control [60]. Thus, these regions exhibited a clear trend toward ecological land use conversion. In contrast, low-topographic position benefits from favorable natural conditions, which provide a foundation for supporting urban-rural construction and high-input agriculture. This has created more possibilities for agricultural land transformation, leading to a combined pattern of non-agriculturalization and intensification. The conversion in this region exhibited distinct temporal differentiation: non-agriculturalization dominated in the earlier stage, while agricultural intensification gradually strengthened in the later stage. This pattern is closely linked to Puding County’s “One County, One Industry” policy orientation and the development needs of local residents. Mid-topographic positions serve as transitional zones, characterized by moderate soil depth and relatively balanced hydrothermal conditions. They possess a sure foundation for agricultural production while not being subject to the strong ecological constraints of high-topographic position. Consequently, these areas have become hotspots for ecological land use conversion and agricultural intensification. During 2004–2016, the intensity of both conversion types was high. In 2016–2024, although the intensity of agricultural intensification slightly declined, it remained elevated—a result shaped by both market demand and policy constraints. Existing studies confirm that such dual-goal transformation models, which balance ecological and economic functions, hold practical value for achieving synergistic enhancement of ecological restoration and agricultural economy [61,62].
The results of this study are consistent with Yu et al. [32], but differ in that we place greater emphasis on revealing the differentiated transformation pathways of agricultural land under distinct topographic conditions.
5.2. Response Characteristics and Mechanisms of Ecosystem Services to Agricultural Land Transformation
The results of this study show that the response of ES to agricultural land transformation in KMA exhibits significant differentiation along topographic gradients. By regulating agricultural land transformation pathways and reshaping landscape patterns and ecological processes, topography directly drove the differentiated response patterns of ES across vertical space (Figure 8). Based on differences in transformation pathways across topographic positions, three distinct ecological response patterns can be identified.
In high-topographic positions, steep slopes, shallow soils, and high ecological sensitivity limit agricultural production potential [63]. Driven by ecological policies, these areas have undergone ecological land use conversion, primarily through farmland reversion to woodland and grassland. The ecological effects are characterized by a significant increase in regulating services and a moderate decrease in provisioning services. This reflects both the inherent ecological vulnerability of the region and underscores the key regulatory role of topography as an amplifier of ecological sensitivity. Ecological land use conversion effectively increases vegetation cover and community complexity, thereby effectively enhancing SR. Notably, farmland abandonment in such areas presents a specific ecological risk: its negative correlation with SR suggests that on ecologically fragile steep slopes, the lag in vegetation recovery during early natural succession may instead exacerbate soil erosion, consistent with the findings of Gao et al. [64]. The ecological conversion effect on hydrology is also amplified. While vegetation restoration enhances water conservation and carbon sequestration, its evapotranspiration process may exert pressure on local water yield [65]. Overall, although some agricultural land transformations have negative effects on certain ES, the overall ES capacity in the region has been significantly enhanced. This ecological response is characterized as a function-enhancing type dominated by ecological restoration.
The mid-topographic positions, as a transitional zone between high- and low-topographic areas, have relatively balanced natural conditions. They possess a certain foundation for agricultural production while not being subject to the strong ecological constraints of high-topographic areas. As a result, these areas exhibit a pattern where ecological land use conversion and agricultural intensification coexist, with an ecological response characterized by a functionally balanced pattern driven by combined transformations. From 2004 to 2016, large-scale agricultural intensification increased grain yield but slightly suppressed SR and CS. Meanwhile, local ecological conversion during the same period mitigated this negative effect to some extent. From 2016 to 2024, the overall intensity of agricultural land transformation slowed. The expansion of agricultural intensification weakened, while the coverage of ecological land use conversion gradually expanded. With reduced landscape fragmentation, SR gradually recovered and CS loss was alleviated. This suggests that under the combined effects of human intervention and natural restoration, the region is moving toward a new balance between ecological and production functions.
Low-topographic positions have favorable natural conditions and high human activity intensity. Agricultural land transformation is dominated by non-agricultural and agricultural intensification. ES show enhanced provisioning services but degraded regulating services. This ecological response is classified as a supply-enhancing and regulation-degrading type dominated by human activities. Agricultural intensification achieves strong growth in FS through high inputs. However, its significant negative correlation with WY reveals the pressure of agricultural expansion on water resource competition. Non-agricultural conversion fundamentally alters the properties of the underlying surface through surface sealing. Its positive correlation with water yield essentially reflects an increase in surface runoff, implying a risk of flooding [66]. In addition, this conversion leads to a decline in SR, CS, and other service functions, which clearly quantifies the ecological costs of urbanization.
The findings of this study are consistent with those of several scholars [67,68]. However, rather than treating mountainous areas as homogeneous entities, this research introduces a topographic gradient perspective, revealing the vertical spatial differentiation of ecological responses. The same transformation pathway may produce distinctly different ecological effects across different topographic positions, a finding that provides a scientific basis for differentiated land management in KMA.
5.3. Enlightenment and Suggestions
The findings indicate a pronounced differentiation in agricultural land transformation and its ecological effects along topographic gradients in the KMA. However, current regional management often adopts a uniform approach, which tends to create conflicts between ecological conservation and development. Therefore, land management in KMA should prioritize ecological considerations, implement zoning guidance based on topographic characteristics and transformation patterns, and promote the synergistic enhancement of land use and ecological functions.
In low-topographic positions, the focus should be on optimization and regulation. As primary zones for grain production and urban expansion, it is essential to strictly control disordered non-agricultural expansion, enforce the permanent basic farmland protection red line, and ensure a stable FS. Concurrently, agricultural intensification models should be optimized by promoting eco-friendly cultivation techniques to reduce negative impacts on soil and water environments. In middle topographic positions, emphasis should be placed on adaptation and synergy. This region serves as a transition zone between ecological restoration and agricultural intensification. It is necessary to progressively implement the conversion of steep-slope cropland, enhance and consolidate SR and CS, curb excessive expansion of garden land, and prevent ecosystem degradation. Encouraging the development of agroforestry and ecological agriculture can promote the synergistic enhancement of both regulating and provisioning services. In high topographic positions, the focus should be on prevention and protection. This area serves as a crucial ecological barrier, with the core objective of maintaining and enhancing regulating services. Construction and agricultural development must be strictly limited, while ecological restoration of abandoned land should be strengthened to improve vegetation coverage. The ecological protection red line should be strictly enforced, and mechanisms such as ecological compensation should be utilized to encourage local residents to participate in conservation efforts. This approach aims to integrate ecological protection with livelihood improvements. Therefore, establishing a zoning governance system adapted to topographic gradients provides a practical pathway for coordinating human-land relationships and promoting sustainable development in KMA.
5.4. Limitations and Prospects
This study selected Puding County in Guizhou Province as the research area, systematically analyzing the spatiotemporal evolution of agricultural land transformation and ES across different topographic gradients from 2004 to 2024, as well as the relationship between them. Based on the findings, differentiated spatial management recommendations were proposed, although certain limitations remain. First, the study period spans 2004–2024. Although it covers key policy phases, its capacity to reveal longer-term evolutionary trends remains limited. Future work should extend the time series and utilize models such as PLUS and CA-Markov to simulate the evolution of future land use and ES under various scenarios. This would support the development of more forward-looking adaptive planning strategies. Second, while the study focused on the relationship between agricultural land and ES across topographic gradients, it did not further quantify the moderating role of other key factors within specific terrain units. Future studies could introduce models such as a geographical detector and multiple regression to quantify the contributions of different factors and their interactions. This would help to reveal more precisely the complex mechanisms of human-land interactions in KMA.
6. Conclusions
This study focuses on Puding County, Guizhou Province, and adopts a topographic gradient perspective to investigate agricultural land transformation, the evolution of ES, and their interrelationships in the study area from 2004 to 2024. The main findings are as follows:
- (1)
- Agricultural land transformation in the study area was intense and exhibited marked spatial differentiation. In high-topographic positions, ecological land use conversion dominates; in mid-topographic positions, a combination of ecological land use conversion and agricultural intensification; while low-topographic positions are primarily characterized by agricultural intensification and non-agriculturalization conversion.
- (2)
- ES responded regularly along topographic gradients. Regulating services such as SR and CS increased with elevation, while total FS rose and became more concentrated toward low topographic positions. Overall, WY increased, but the magnitude of this increase diminished from low- to high-topographic positions.
- (3)
- The ecological effects of different Agricultural Land transformation pathways show distinct differences and are modulated by topographic gradients. Ecological land use conversion significantly enhanced regulating services while reducing provisioning services in high-topographic positions. Agricultural intensification enhanced FS in mid- to low-topographic positions but intensified competition for water resources. Non-agricultural conversion led to the degradation of multiple ES in low-topographic positions, while farmland abandonment had generally weaker impacts overall yet could exacerbate SR in high-topographic positions.
- (4)
- This study systematically reveals the vertical differentiation pattern of the ecological effects of agricultural land transformation in KMA. Accordingly, a zoning-based management strategy is proposed, thereby providing a scientific basis for balancing agricultural development and ecological conservation in KMA.
Supplementary Materials
The following supporting information can be downloaded at https://www.mdpi.com/article/10.3390/land15040582/s1, Table S1: Carbon storage density values for different land use types (unit: t/ha); Table S2: The C and P values of different Land use types; Table S3: Water yeild model of various parts of different land use types.
Author Contributions
X.W.; writing—original draft preparation, methodology, software, data curation. G.L.; writing—review and editing, project administration, funding acquisition. Y.L.; writing—review and editing, visualization, project administration, funding acquisition. L.Z.; investigation, methodology, software. X.R.; investigation, software. K.R.; investigation, software. All authors have read and agreed to the published version of the manuscript.
Funding
This research was supported by the National Natural Science Foundation of China (Grant No. 42061035), the National Natural Science Foundation of China (Grant No. U24A20579), and the Guizhou Provincial Science and Technology Program (No. KXJZ[2024]032).
Data Availability Statement
Data will be made available on request.
Acknowledgments
I am very grateful to the anonymous reviewers who helped to improve the clarity and relevance of our research presentation. Some illustrations, such as mountains, houses, etc., come from the Integration and Application Network, University of Maryland Center for Environmental Science (https://ian.umces.edu/media-library/ (accessed on 10 January 2026)).
Conflicts of Interest
The authors declare that they have no known competing financial interests or personal relationships that could have appeared to influence the work reported in this paper.
References
- Costanza, R.; d’Arge, R.; de Groot, R.; Farber, S.; Grasso, M.; Hannon, B.; Limburg, K.; Naeem, S.; O’Neill, R.V.; Paruelo, J.; et al. The Value of the World’s Ecosystem Services and Natural Capital. Nature 1997, 387, 253–260. [Google Scholar] [CrossRef] [Scilit]
- Reid, W.V.; Mooney, H.A.; Cropper, A.; Capistrano, D.; Carpenter, S.R.; Chopra, K.; Dasgupta, P.; Dietz, T.; Duraiappah, A.K.; Hassan, R.; et al. Millennium Ecosystem Assessment Ecosystems and Human Well-Being: A Framework for Assessment; Island Press: Washington, DC, USA, 2005; Available online: https://www.wri.org/research/millennium-ecosystem-assessment-ecosystems-and-human-well-being (accessed on 1 January 2026).
- Huang, Y.; Li, Y.; Li, T.; Sheng, M.; Shao, J. Response of Land System to Spatiotemporal Heterogeneity of Human-Land Interaction in Mountainous Areas: A Case Study of a Typical Watershed in the Three Gorges Reservoir Area, China. Environ. Dev. Sustain. 2025, 1–22. [Google Scholar] [CrossRef] [Scilit]
- Xiang, J.; Wu, H. Understanding the Transition Process and Dynamic Mechanism of Farmland Use Functions: A Comparative Analysis from Eastern and Western China. J. Rural Stud. 2025, 117, 103642. [Google Scholar] [CrossRef] [Scilit]
- Wang, Y.; Lopez-Carr, D.; Gong, J.; Gao, J. Editorial: Sustainable Cultivated Land Use and Management. Front. Environ. Sci. 2023, 11, 1162769. [Google Scholar] [CrossRef] [Scilit]
- Gao, P.; Gao, Y.; Ou, Y.; McJeon, H.; Iyer, G.; Ye, S.; Yang, X.; Song, C. Heterogeneous Pressure on Croplands from Land-Based Strategies to Meet the 1.5 °C Target. Nat. Clim. Change 2025, 15, 420–427. [Google Scholar] [CrossRef] [Scilit]
- Li, M.; Li, J.; Haq, S.U.; Nadeem, M. Agriculture Land Use Transformation: A Threat to Sustainable Food Production Systems, Rural Food Security, and Farmer Well-Being? PLoS ONE 2024, 19, e0296332. [Google Scholar] [CrossRef] [PubMed]
- Zhao, X.; Qin, X.; Li, T.; Cao, H.; Xie, Y. Effects of Planting Patterns Plastic Film Mulching on Soil Temperature, Moisture, Functional Bacteria and Yield of Winter Wheat in the Loess Plateau of China. J. Integr. Agric. 2023, 22, 1560–1573. [Google Scholar] [CrossRef] [Scilit]
- Kong, L.; Wu, T.; Xiao, Y.; Xu, W.; Zhang, X.; Daily, G.C.; Ouyang, Z. Natural Capital Investments in China Undermined by Reclamation for Cropland. Nat. Ecol. Evol. 2023, 7, 1771–1777. [Google Scholar] [CrossRef] [Scilit]
- Abdalla, M.; Hastings, A.; Cheng, K.; Yue, Q.; Chadwick, D.; Espenberg, M.; Truu, J.; Rees, R.M.; Smith, P. A Critical Review of the Impacts of Cover Crops on Nitrogen Leaching, Net Greenhouse Gas Balance and Crop Productivity. Glob. Change Biol. 2019, 25, 2530–2543. [Google Scholar] [CrossRef] [Scilit]
- Ren, Y.; Fang, G.; Sun, X.; He, Y.; Wang, C.; Gu, J.; Feng, Z. Agroecosystem Services and Disservices in Beijing-Tianjin-Hebei Region, China: Spatial Heterogeneity, Trade-off Relationships, and Driving Mechanisms. Appl. Geogr. 2025, 184, 103767. [Google Scholar] [CrossRef] [Scilit]
- Dai, X.; Meng, L.; Li, Y.; Yu, Y.; Zang, D.; Zhang, S.; Zhou, J.; Li, D.; Luo, C.; Wang, Y.; et al. Impact of Paddy Field Expansion on Ecosystem Services and Associated Trade-Offs and Synergies in Sanjiang Plain. Agriculture 2024, 14, 2063. [Google Scholar] [CrossRef] [Scilit]
- Fang, X.; Ghazali, S.; Azadi, H.; Skominas, R.; Scheffran, J. Agricultural Land Conversion and Ecosystem Services Loss: A Meta-Analysis. Environ. Dev. Sustain. 2024, 26, 23215–23243. [Google Scholar] [CrossRef] [Scilit]
- Liu, C.; Liu, D.; Li, P.; Li, X.; Liu, Z.; Zhao, Y. Assessment of Occupation of Natural Habitat by Urban Expansion and Its Impact on Crucial Ecosystem Services in China’s Coastal Zone. Ecol. Indic. 2023, 154, 110682. [Google Scholar] [CrossRef] [Scilit]
- Ma, Z.; Wu, J.; Yang, H.; Yang, J.; Zhang, J. Unraveling the Effects of Land Use Change on Carbon Balance: A Systematic Study in the Beijing-Tianjin-Hebei Region, China. Ecol. Indic. 2025, 179, 114109. [Google Scholar] [CrossRef] [Scilit]
- Rezapour, S.; Nouri, A.; Shokohi, M.; Alamdari, P. Urbanization Accelerates Soil Degradation in Peri-Urban Compared to Rural Farms. Sci. Rep. 2025, 16, 3878. [Google Scholar] [CrossRef] [Scilit] [PubMed]
- Richards, D.; Etherington, T.R.; Herzig, A.; Lavorel, S. The Importance of Spatial Configuration When Restoring Intensive Production Landscapes for Biodiversity and Ecosystem Service Multifunctionality. Land 2024, 13, 460. [Google Scholar] [CrossRef] [Scilit]
- Wang, M.; Huang, X.; Chen, Y.; Tang, Y. Multifunctional Farmland Use Transition and Its Impact on Synergistic Governance Efficiency for Pollution Reduction, Carbon Mitigation, and Production Increase: A Perspective of Major Function-Oriented Zoning. Habitat Int. 2024, 153, 103207. [Google Scholar] [CrossRef] [Scilit]
- Su, R.; Duan, C.; Chen, B. The Shift in the Spatiotemporal Relationship between Supply and Demand of Ecosystem Services and Its Drivers in China. J. Environ. Manag. 2024, 365, 121698. [Google Scholar] [CrossRef] [Scilit]
- Li, J.; Yao, L.; Liu, L.; Lian, J.; Li, X.; Gan, D. Evaluating the Social Value of Ecosystem Services for the Green Heart Area of the Changsha-Zhuzhou-Xiangtan Urban Agglomeration Using the SolVES Model. J. Ecol. Rural Environ. 2025, 41, 987–1001. [Google Scholar] [CrossRef]
- Li, Y.; Sun, K.; Zhang, G.; Ye, C. Spatiotemporal Dynamics of Land Use Transformation and Its Impact on Ecosystem Services in the Poyang Lake Urban Agglomeration. Environ. Earth Sci. 2025, 84, 423. [Google Scholar] [CrossRef] [Scilit]
- Zhao, X.; Li, J.; Ruan, F.; Zou, Z.; He, X.; Zhou, C. Spatiotemporal Dynamics and Multi-Scenario Projections of the Land Use and Habitat Quality in the Yellow River Basin: A GeoDetector-PLUS-InVEST Integrated Framework for a Coupled Human–Natural System Analysis. Remote Sens. 2025, 17, 2181. [Google Scholar] [CrossRef] [Scilit]
- Zhang, Z.; Pan, H.; Liu, Y.; Sheng, S. Ecosystem Services’ Response to Land Use Intensity: A Case Study of the Hilly and Gully Region in China’s Loess Plateau. Land 2024, 13, 2039. [Google Scholar] [CrossRef] [Scilit]
- Zhou, Y.; Zhang, Y.; Li, W.; Li, J. Exploring the Spatio-Temporal Variability, Interrelationships and Ecological Sustainability of Cropland Fragmentation and Habitat Quality: A Case Study of Northwest China. Land Degrad. Dev. 2026, 37, 760–778. [Google Scholar] [CrossRef] [Scilit]
- Huang, M.; Li, Y.; Xia, C.; Zeng, C.; Zhang, B. Coupling Responses of Landscape Pattern to Human Activity and Their Drivers in the Hinterland of Three Gorges Reservoir Area. Glob. Ecol. Conserv. 2022, 33, e01992. [Google Scholar] [CrossRef] [Scilit]
- Gomes, L.C.; Bianchi, F.J.J.A.; Cardoso, I.M.; Fernandes Filho, E.I.; Schulte, R.P.O. Land Use Change Drives the Spatio-Temporal Variation of Ecosystem Services and Their Interactions along an Altitudinal Gradient in Brazil. Landsc. Ecol. 2020, 35, 1571–1586. [Google Scholar] [CrossRef] [Scilit]
- Ma, X.; Zhang, H. Variations in the Value and Trade-Offs/Synergies of Ecosystem Services on Topographic Gradients in Qinghai Province, China. Sustainability 2022, 14, 15546. [Google Scholar] [CrossRef] [Scilit]
- Yang, S.; Lin, J.; Zheng, S.; Li, Z.; Qiao, X.; Liu, J.; Li, Y.; Zhao, N.; Zhao, M.; Zhou, M.; et al. Ecosystem Service Value under Changing Land Use in Rocky Mountainous Area of Northern China: Spatiotemporal Evolution and Driving Mechanism. Environ. Sustain. Indic. 2025, 28, 100884. [Google Scholar] [CrossRef] [Scilit]
- Li, S.; Pu, J.; Deng, X. Agricultural Land Use Transition under Multidimensional Topographical Gradients and Its Impact on Ecosystem Service Interactions. J. Integr. Agric. 2025, 24, 3222–3241. [Google Scholar] [CrossRef] [Scilit]
- Zhang, Y.; Xiong, K.; Chen, Y.; Bai, X. Spatiotemporal Changes and Driving Factors of Ecological Vulnerability in Karst World Heritage Sites Based on SRP and Geodetector: A Case Study of Shibing and Libo-Huanjiang Karst. Npj Herit. Sci. 2025, 13, 65. [Google Scholar] [CrossRef] [Scilit]
- Yu, L.; Pu, L. Landscape and Ecosystem Health Dynamics in Response to Terrain in Southwest China’s Karst Mountains: A Study with Evidence since 1980. Environ. Sustain. Indic. 2025, 28, 100923. [Google Scholar] [CrossRef] [Scilit]
- Yu, L.; Li, Y.; Luo, G.; Ge, G.; Zhang, H.; Tang, F.; Yu, M. Spatiotemporal Evolution and Driving Mechanism of Slope Cultivated Land in Karst Mountainous Areas of Southwest China—A Case Study of Puding County, Guizhou Province. Land Degrad. Dev. 2024, 35, 568–585. [Google Scholar] [CrossRef] [Scilit]
- Li, Y.; Luo, H. Trade-off/Synergistic Changes in Ecosystem Services and Geographical Detection of Its Driving Factors in Typical Karst Areas in Southern China. Ecol. Indic. 2023, 154, 110811. [Google Scholar] [CrossRef] [Scilit]
- Xiong, L.; Li, R.; Yu, B.; Xiong, K. The Constraining Effects of Rocky Desertification on Ecosystem Services in the South China Karst Region Have Diminished over Time. CATENA 2025, 260, 109437. [Google Scholar] [CrossRef] [Scilit]
- Li, M.; Luo, G.; Li, Y.; Qin, Y.; Huang, J.; Liao, J. Effects of Landscape Patterns and Their Changes on Ecosystem Health under Different Topographic Gradients: A Case Study of the Miaoling Mountains in Southern China. Ecol. Indic. 2023, 154, 110796. [Google Scholar] [CrossRef] [Scilit]
- Gou, R.; Su, W.C.; Dong, W.Z.; Huang, L. Topographic Gradient Analysis and Application of Machine Learning Models for Trade-offs and Synergies of Ecosystem Services in the Chishui River Basin. Acta Ecol. Sin. 2025, 45, 9980–9996. [Google Scholar] [CrossRef]
- Zhang, L.; Hu, B.; Hu, W. Response of ESV Topographic Gradient to LULC in Mountain-River-Sea Transitional Space Based on Markov-PLUS Modeling: A Case Study of the Southwest Guangxi Karst-Beibu Gulf, China. Land Degrad. Dev. 2025, 36, 3118–3133. [Google Scholar] [CrossRef] [Scilit]
- Li, Y.; Bai, X.; Wang, S.; Tian, Y. Integrating Mitigation Measures for Karst Rocky Desertification Land in the Southwest Mountains of China. Carbonates Evaporites 2019, 34, 1095–1106. [Google Scholar] [CrossRef] [Scilit]
- Yu, L.; Li, Y. Microagroecosystem Models and Their Landscape Ecological Risk Evolution in Karst Mountainous Areas. Ecol. Indic. 2024, 158, 111502. [Google Scholar] [CrossRef] [Scilit]
- GB/T 21010—2017; Current Land Use Classification. China Standard Press: Beijing, China, 2017.
- Du, S.; Zhou, Z.; Huang, D.; Zhang, F.; Deng, F.; Yang, Y. The Response of Carbon Stocks to Land Use/Cover Change and a Vulnerability Multi-Scenario Analysis of the Karst Region in Southern China Based on PLUS-InVEST. Forests 2023, 14, 2307. [Google Scholar] [CrossRef] [Scilit]
- Gu, Y.; Lin, N.; Ye, X.; Xu, M.; Qiu, J.; Zhang, K.; Zou, C.; Qiao, X.; Xu, D. Assessing the Impacts of Human Disturbance on Ecosystem Services under Multiple Scenarios in Karst Areas of China: Insight from Ecological Conservation Red Lines Effectiveness. Ecol. Indic. 2022, 142, 109202. [Google Scholar] [CrossRef] [Scilit]
- Li, Y.; Geng, H. Spatiotemporal Trends in Ecosystem Carbon Stock Evolution and Quantitative Attribution in a Karst Watershed in Southwest China. Ecol. Indic. 2023, 153, 110429. [Google Scholar] [CrossRef] [Scilit]
- De Reu, J.; Bourgeois, J.; Bats, M.; Zwertvaegher, A.; Gelorini, V.; De Smedt, P.; Chu, W.; Antrop, M.; De Maeyer, P.; Finke, P.; et al. Application of the Topographic Position Index to Heterogeneous Landscapes. Geomorphology 2013, 186, 39–49. [Google Scholar] [CrossRef] [Scilit]
- Ren, X.; Li, Y.; Zhang, Y.; Yang, L.; Wu, X.; Luo, G.; Huang, J. From Vulnerability to Sustainability: The Evolution of Rural Social-Ecological System in Karst Mountainous Areas of Southwest China. J. Clean. Prod. 2025, 516, 145712. [Google Scholar] [CrossRef] [Scilit]
- Braimoh, A.K. Random and Systematic Land-Cover Transitions in Northern Ghana. Agric. Ecosyst. Environ. 2006, 113, 254–263. [Google Scholar] [CrossRef] [Scilit]
- Aldwaik, S.Z.; Pontius, R.G. Intensity Analysis to Unify Measurements of Size and Stationarity of Land Changes by Interval, Category, and Transition. Landsc. Urban Plan. 2012, 106, 103–114. [Google Scholar] [CrossRef] [Scilit]
- Basu, T.; Das, A. Urbanization Induced Changes in Land Use Dynamics and Its Nexus to Ecosystem Service Values: A Spatiotemporal Investigation to Promote Sustainable Urban Growth. Land Use Policy 2024, 144, 107239. [Google Scholar] [CrossRef] [Scilit]
- Xiao, X.; Huang, X.; Jiang, L.; Jin, C. Empirical Study on Comparative Analysis of Dynamic Degree Differences of Land Use Based on the Optimization Model. Geocarto Int. 2022, 37, 9847–9864. [Google Scholar] [CrossRef] [Scilit]
- Barnes, K.W.; Niemuth, N.D.; Iovanna, R. Landscape-Scale Predictions of Future Grassland Conversion to Cropland or Development. Conserv. Biol. 2025, 39, e14346. [Google Scholar] [CrossRef] [Scilit] [PubMed]
- Dong, C.; Huang, H.; Qiao, R.; Luo, L.; Chang, X. Spatiotemporal Variations and Scale Dependence of Landscape Diversity in Oasis along the Yellow River in Ningxia. Arid Land Geogr. 2023, 46, 76–85. [Google Scholar] [CrossRef]
- Zeng, C.; Wang, S.; Bai, X.; Li, Y.; Tian, Y.; Li, Y.; Wu, L.; Luo, G. Soil Erosion Evolution and Spatial Correlation Analysis in a Typical Karst Geomorphology Using RUSLE with GIS. Solid Earth 2017, 8, 721–736. [Google Scholar] [CrossRef] [Scilit]
- Zhang, Y.; Li, R.; Jing, J. Soil Erosion Gradient and Quantitative Attribution in Southwest China Based on Karst Development Degree. Ecol. Indic. 2022, 144, 109496. [Google Scholar] [CrossRef] [Scilit]
- Fernández-Tizón, M.; Emmenegger, T.; Perner, J.; Hahn, S. Arthropod Biomass Increase in Spring Correlates with NDVI in Grassland Habitat. Sci. Nat. 2020, 107, 42. [Google Scholar] [CrossRef] [Scilit] [PubMed]
- Gao, X.Y.; Chen, T.T.; Wang, Q. Cross-scale Impact of Ecosystem Service on Households′ Well⁃being in Karst Regions: A Case Study of Huanjiang County. Acta Ecol. Sin. 2025, 45, 2225–2242. [Google Scholar] [CrossRef]
- Ord, J.K.; Getis, A. Local Spatial Autocorrelation Statistics: Distributional Issues and an Application. Geogr. Anal. 1995, 27, 286–306. [Google Scholar] [CrossRef] [Scilit]
- Gauthier, T.D. Detecting Trends Using Spearman’s Rank Correlation Coefficient. Environ. Forensics 2001, 2, 359–362. [Google Scholar] [CrossRef] [Scilit]
- Lian, S.; Lan, A.; Fan, Z. Spatiotemporal Evolution Trends and Topographic Gradient Effects of Cultivated Land Transformation in River Basins of Karst Mountainous Areas in Guizhou Province. Res. Soil Water Conserv. 2025, 32, 391–402. [Google Scholar] [CrossRef]
- Li, Y.; Shao, J.; Yang, H.; Bai, X. The Relations between Land Use and Karst Rocky Desertification in a Typical Karst Area, China. Environ. Geol. 2009, 57, 621–627. [Google Scholar] [CrossRef] [Scilit]
- Chen, T.; Peng, L.; Liu, S.; Wang, Q. Land Cover Change in Different Altitudes of Guizhou-Guangxi Karst Mountain Area, China: Patterns and Drivers. J. Mt. Sci. 2017, 14, 1873–1888. [Google Scholar] [CrossRef] [Scilit]
- Santos-Martín, F.; Zorrilla-Miras, P.; García-Llorente, M.; Quintas-Soriano, C.; Montes, C.; Benayas, J.; Sal, A.G.; Paracchini, M.L. Identifying Win–Win Situations in Agricultural Landscapes: An Integrated Ecosystem Services Assessment for Spain. Landsc. Ecol. 2019, 34, 1789–1805. [Google Scholar] [CrossRef] [Scilit]
- Subedi, Y.R.; Kristiansen, P.; Cacho, O. Drivers and Consequences of Agricultural Land Abandonment and Its Reutilisation Pathways: A Systematic Review. Environ. Dev. 2022, 42, 100681. [Google Scholar] [CrossRef] [Scilit]
- Wei, B.; Li, Z.; Duan, L.; Gu, Z.; Liu, X. Vegetation Types and Rainfall Regimes Impact on Surface Runoff and Soil Erosion over 10 Years in Karst Hillslopes. CATENA 2023, 232, 107443. [Google Scholar] [CrossRef] [Scilit]
- Gao, J.; Zhang, Y.; Zuo, L. The Optimal Explanatory Power of Soil Erosion and Water Yield in Karst Mountainous Areas. J. Geogr. Sci. 2023, 33, 2077–2093. [Google Scholar] [CrossRef] [Scilit]
- Li, Q.; Yue, Y.; Wang, L.; Wang, K. Regional Differences in Carbon-Water Dynamics of Various Plantation Forests in Southwest China. J. Hydrol. 2025, 661, 133809. [Google Scholar] [CrossRef] [Scilit]
- Blöschl, G. Three Hypotheses on Changing River Flood Hazards. Hydrol. Earth Syst. Sci. 2022, 26, 5015–5033. [Google Scholar] [CrossRef] [Scilit]
- Qu, S.; Jiang, Y.; Gao, J.; Cao, Q.; Wang, L.; Zhang, Y.; Huang, F. Spatial–Temporal Evolution and Driving Factors of Ecosystem Services Trade-offs and Synergies in Karst Areas from a Geospatial Perspective. Land Degrad. Dev. 2024, 35, 3448–3460. [Google Scholar] [CrossRef] [Scilit]
- Shi, X.; Xia, H.; Machimura, T.; Matsui, T.; Haga, C.; Wang, Q.; Pan, H.; Peng, L. Scenario-Based Land Use Simulation and Integrated Analysis of Karst Ecosystem Service Bundles. Glob. Ecol. Conserv. 2024, 54, e03096. [Google Scholar] [CrossRef] [Scilit]

Disclaimer/Publisher’s Note: The statements, opinions and data contained in all publications are solely those of the individual author(s) and contributor(s) and not of MDPI and/or the editor(s). MDPI and/or the editor(s) disclaim responsibility for any injury to people or property resulting from any ideas, methods, instructions or products referred to in the content. |
© 2026 by the authors. Licensee MDPI, Basel, Switzerland. This article is an open access article distributed under the terms and conditions of the Creative Commons Attribution (CC BY) license.