


Abstract
Extreme heat poses growing health risks in high-density cities, yet static assessments often fail to capture dynamic pedestrian exposure. This study quantifies the supply and demand disparity between urban shade provision and actual pedestrian demand in Fuzhou, China, during a specific extreme heat event. Integrating high-resolution mobile signaling data with dynamic urban shade simulations, we classified the road network into risk quadrants and analyzed behavioral drivers using XGBoost and SHAP algorithms. Results show a pronounced disparity: high-risk zones carry the highest pedestrian flows (a mean daily volume of 28.6 pedestrian trajectories per segment) but exhibit minimal shade coverage (3.14%), while comfort zones provide 5.5 times greater shading coverage for comparable activity levels. In contrast, surplus zones exhibit substantial shading capacity but limited pedestrian use, indicating inefficient spatial allocation of cooling resources. Further analysis shows that pedestrian accumulation in high-risk zones is primarily driven by functional necessity, whereas pedestrian flows in comfort zones are more sensitive to thermal conditions. These findings reveal structurally embedded thermal exposure risk and support a shift from static metrics toward dynamic urban planning to protect vulnerable pedestrian flows.
1. Introduction
The frequency and intensity of global heatwaves have emerged as a critical challenge to urban sustainability and public health in the twenty-first century [1,2]. Rapid urbanization and the expansion of impervious surfaces have exacerbated the Urban Heat Island (UHI) effect, leading to higher temperatures that greatly reduce the comfort of people living in cities [3]. As extreme heat events become more prolonged, the risk of heat-related morbidity and mortality rises, particularly in high-density urban centers [4]. Within the built environment, outdoor spaces such as sidewalks are important for economic activity and social communication [5]. However, high temperatures in these areas not only discourage walking and other active travel but also bring serious physical discomfort to unprotected pedestrians [6,7]. Consequently, mitigating outdoor thermal exposure has become a concern for urban planning, with a focus on optimizing shade provision as an effective cooling strategy [8,9,10,11].
To evaluate the health risks posed by extreme heat, researchers have proposed multiple exposure assessment frameworks that jointly consider heat hazard intensity and population vulnerability [12,13,14,15,16]. Most existing approaches rely on static datasets, characterizing thermal risks using satellite-derived land surface temperature or fixed meteorological station records [17,18,19], and representing population exposure through population data derived from census records [19,20,21,22]. A fundamental limitation of these methods is the assumption of a stationary population, which fails to capture the spatiotemporal dynamics of human mobility. Urban populations are highly mobile, and their daytime distribution differs significantly from residential patterns due to commuting, work, and social activities [23]. Assessing heat exposure based on static population data may lead to misestimation of the actual risks encountered by pedestrians moving through the city [24,25]. This is especially crucial because transient thermal comfort during pedestrian movement varies significantly across complex urban morphologies [26]. Therefore, a transition from static metrics toward dynamic assessment is required to more accurately characterize the interaction between urban heat and human activity [24,27].
Recent advancements in geospatial technologies and big data have provided new opportunities to address these limitations [28,29,30]. The widespread use of location-aware mobile devices allows the collection of large-scale, high-frequency signaling data, providing detailed information on real-time crowd dynamics [31]. This data stream allows researchers to move beyond theoretical simulations and directly observe how pedestrian flows vary in response to environmental conditions [30]. At the same time, improvements in three-dimensional urban model data allow shadows cast by buildings and trees to be simulated dynamically at fine temporal scales [32]. Although growing research links thermal environments with human mobility [27,28,29,30], studies rely on temporally aggregated mobility data [28] or focus on macroscopic functional zones [30], overlooking high-resolution temporal variations. Consequently, the micro-scale disparity between dynamic urban shade provision and street-level pedestrian demand during specific extreme heat events has not been fully quantified.
Understanding the relationship between shade provision and pedestrian distribution requires consideration of the complex, non-linear processes that shape human behavior in thermal environments. Pedestrian route choices are influenced by a composite of factors, including thermal comfort [33], destination attractiveness [34], and street connectivity [35]. Traditional linear regression models often have limited ability to capture threshold effects and heterogeneous responses [36]. Recent methodological advances have shown the potential of machine learning algorithms to capture these complex interactions [36,37,38]. For example, He et al. [39] employed the Extreme Gradient Boosting (XGBoost) model to investigate the scale effects of urban thermal environments, revealing that the impact of morphological features on local microclimates varies non-linearly across spatial scales. Similarly, Jia et al. [37] applied an Artificial Neural Network (ANN) framework to assess exposure inequality, effectively representing the non-linear decline that traditional metrics often oversimplify. In addition, deep learning approaches, such as the spatiotemporal residual networks developed by Zhang et al. [38], have demonstrated that modeling human mobility requires accounting for high-dimensional dependencies between pedestrian flows and environmental conditions. Collectively, these studies suggest that linear models are inadequate for characterizing the threshold-dependent relationships between thermal environments and social systems.
This study addresses these challenges by developing a dynamic assessment framework to quantify the supply and demand disparity between urban shade supply and pedestrian flows in Fuzhou, a typical city with a hot–humid climate [40]. ① Dynamic exposure assessment framework: We integrate high-resolution mobile signaling data with time-series solar shade simulations to construct a precise spatiotemporal profile of pedestrian thermal exposure. ② Shadow-flow quadrant classification: We propose a spatial evaluation method to identify and quantify the specific disparities between urban shading supply and pedestrian behavioral demand across the street network. ③ Interpreting non-linear behavioral patterns: Following the spatial quadrant classification, we employ the XGBoost machine learning model combined with Shapley Additive exPlanations (SHAP) for pattern interpretation. This step aims to interpret the underlying behavioral drivers of pedestrian accumulation, deconstructing the complex threshold effects of morphological and functional factors within the identified high-risk and comfort zones. By focusing on a specific extreme heatwave event as an exploratory case study, this research aims to uncover event-specific behavioral patterns, thereby moving beyond static risk mapping to provide evidence supporting targeted urban planning and climate-resilient design.
2. Study Area and Data Sources
2.1. Study Area
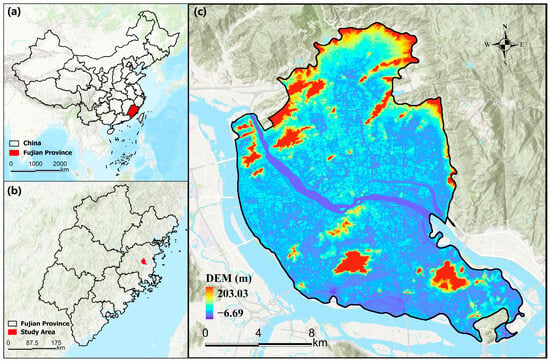
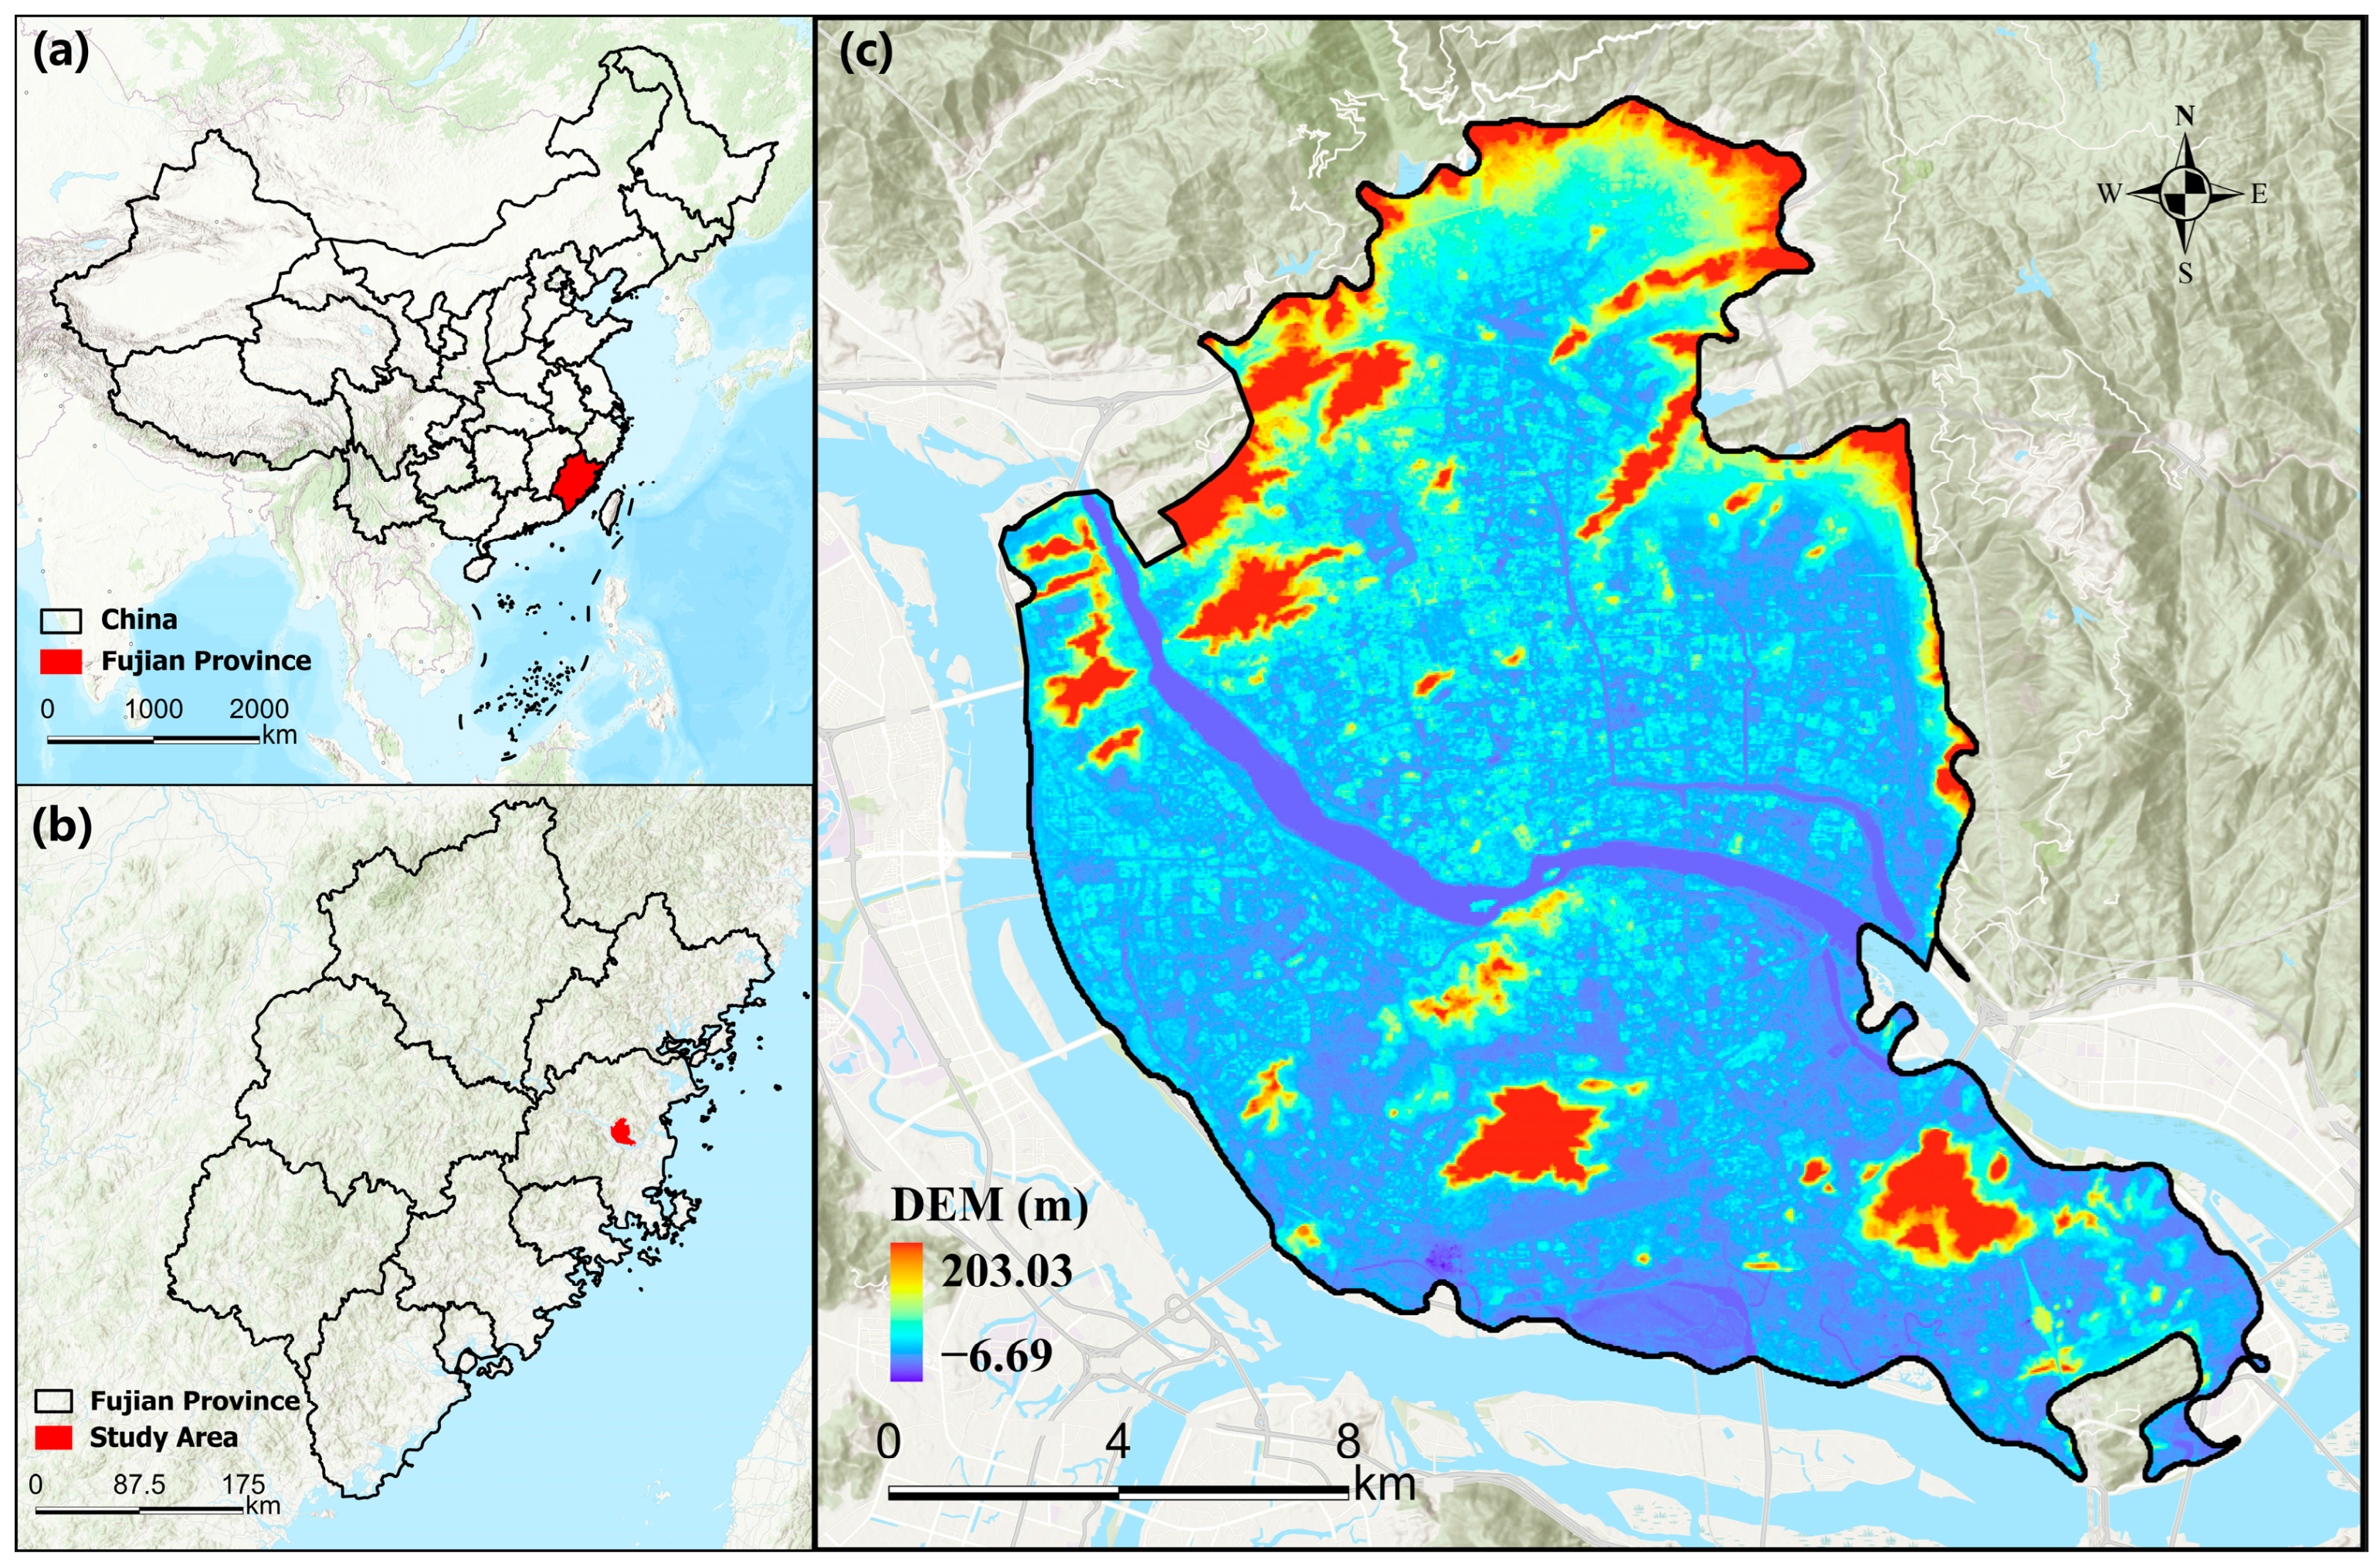
The study area is located in Fuzhou (26°05′ N–26°39′ N, 119°11′ E–119°36′ E), an important coastal city in southeast China (Figure 1). The region features a complex landscape transitioning from coastal plains to mountainous terrain, which contributes to unique local microclimates. Dominated by a subtropical humid monsoon climate, meteorological records indicate that during the summer of the study year (1 June to 31 August 2022), the daily maximum temperature exceeded 34.5 °C on 59 days. This research specifically targets the central urban districts of Gulou, Taijiang, Cangshan, and Jinan, which represent the most urbanized zones with dense road networks and high pedestrian activity [41]. The overlapping of extreme thermal conditions and intensive human flows makes this area an ideal testbed for assessing thermal exposure risks. The precise spatial extent, as shown in Figure 2, was determined based on administrative boundary.
Figure 1.
Location map of the study area. (a): Location of Fujian Province in China; (b): Location of study area in Fujian Province; (c): Copernicus Digital Elevation Model (DEM, GLO-30) of the study area.
Figure 2.
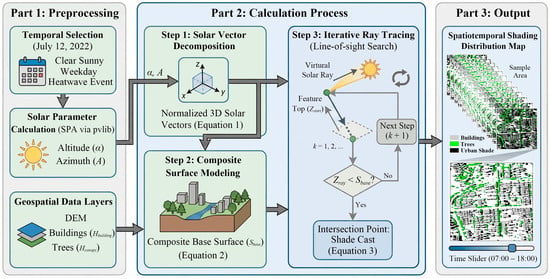
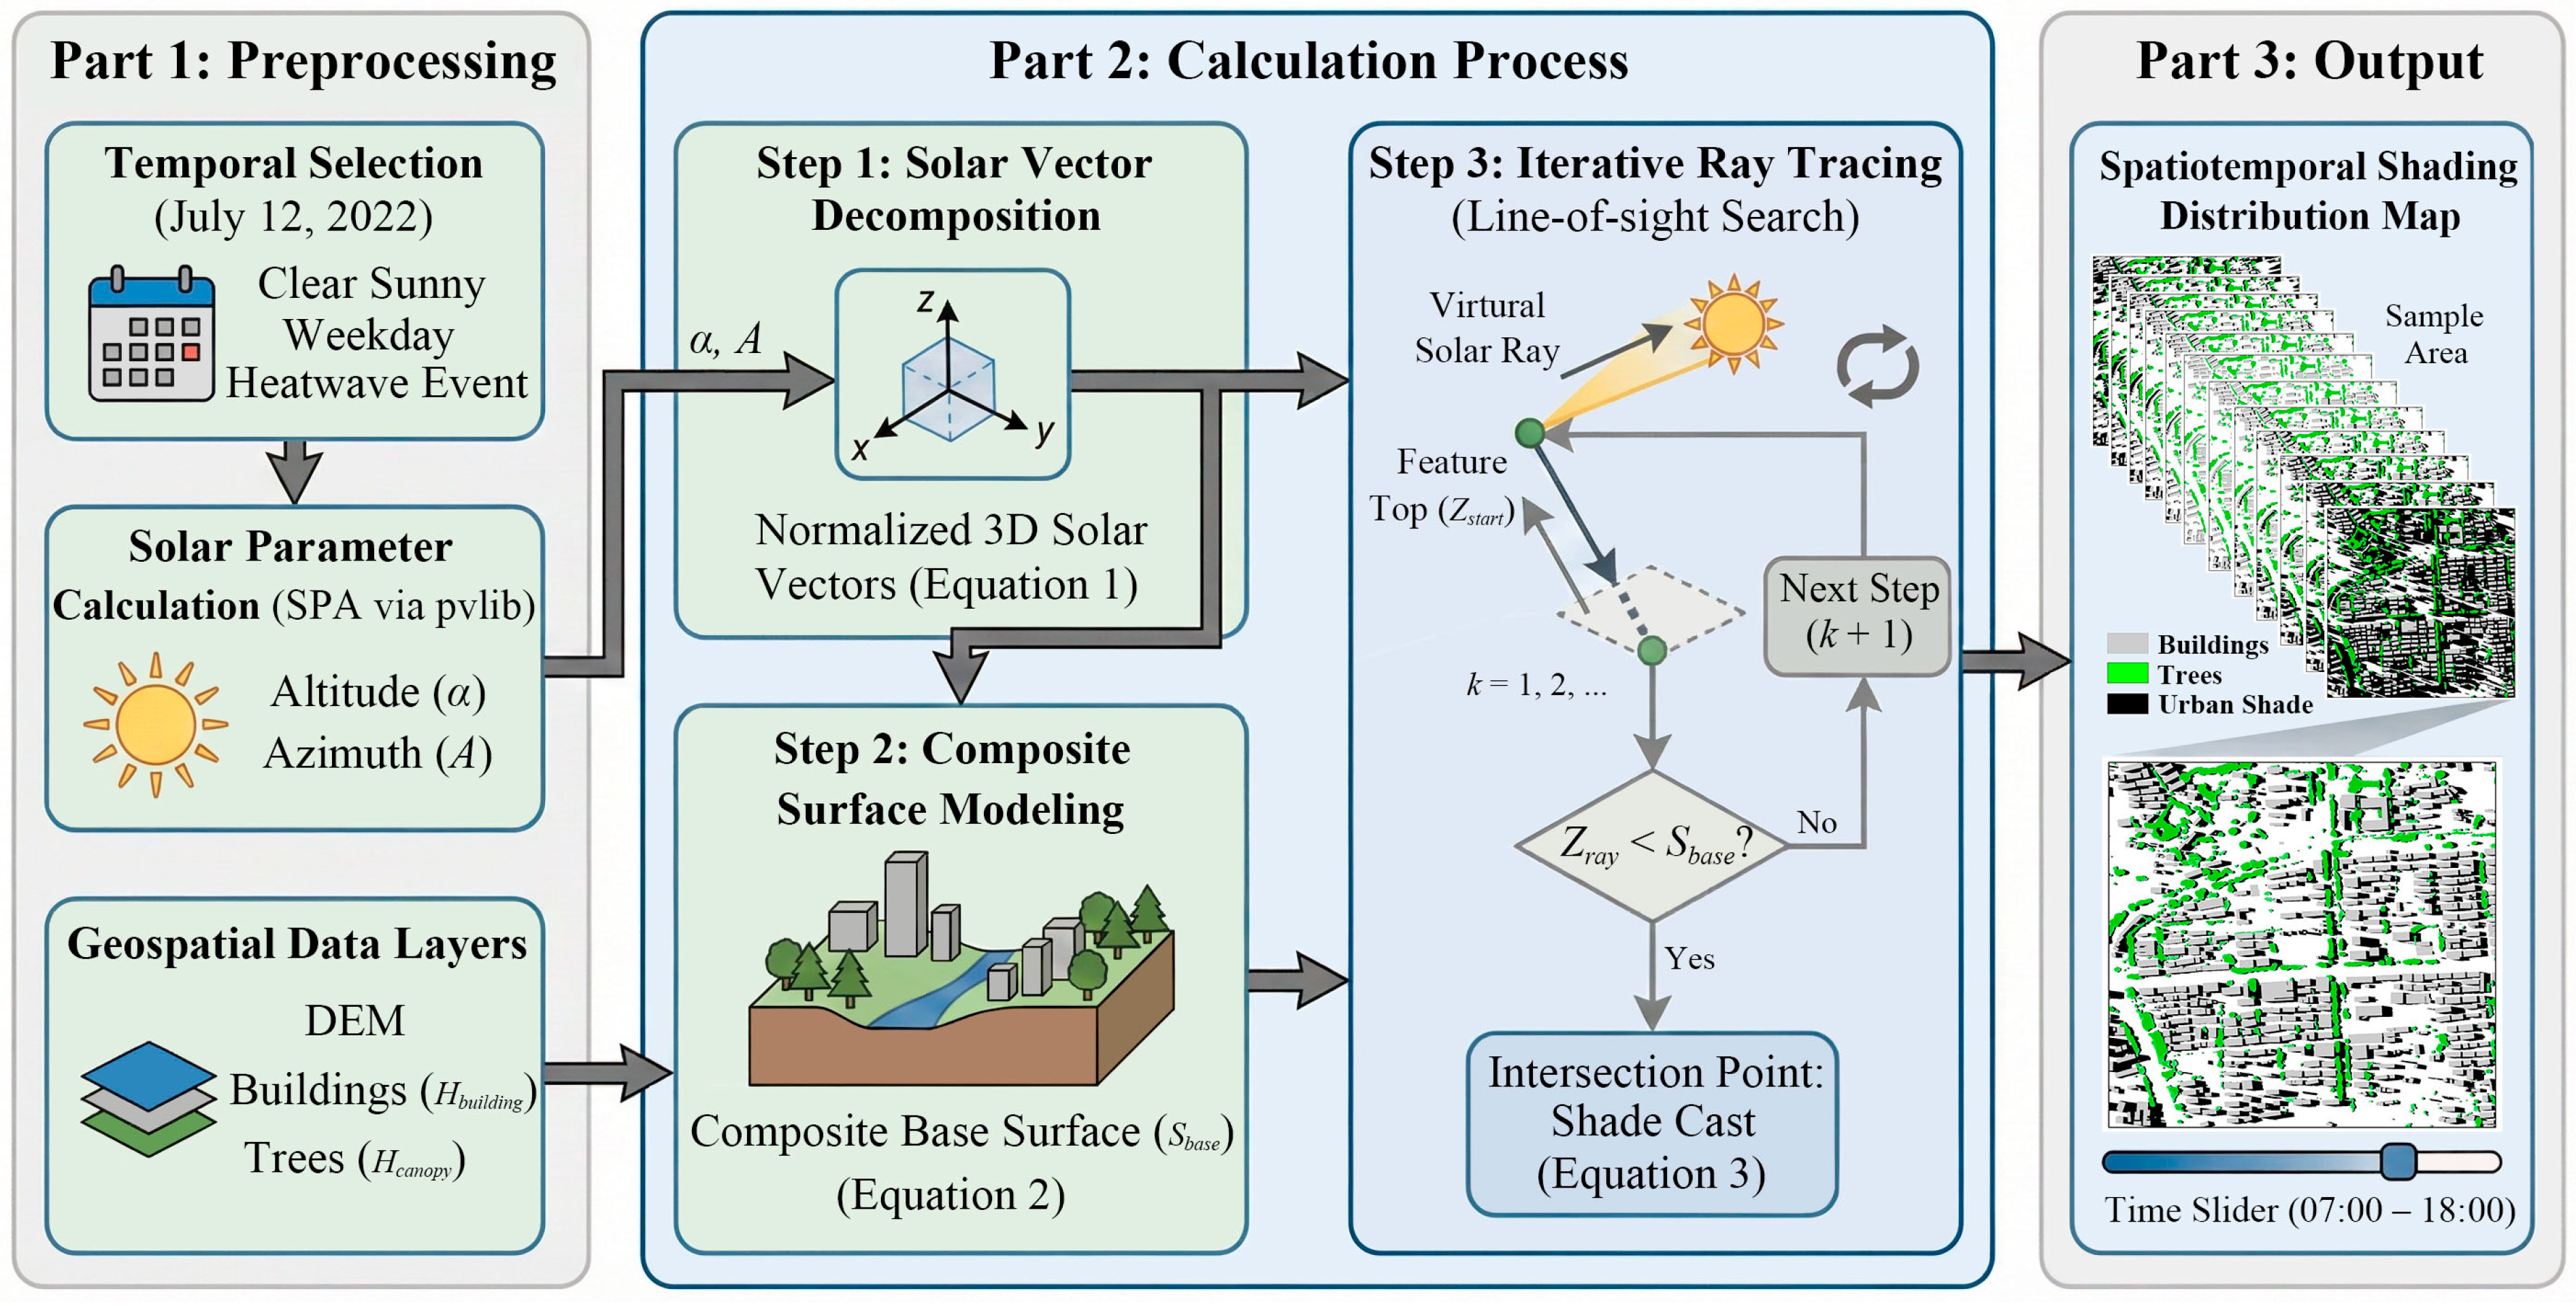
Schematic framework of the dynamic urban shading simulation model.
2.2. Data Sources
This study integrates datasets from multiple sources to facilitate a comprehensive assessment of thermal exposure risks. The datasets include 3D building models, the Copernicus Digital Elevation Model (DEM), tree canopy height data, ERA5 meteorological reanalysis data, road networks, Point of Interest (POI) records, and mobile phone signaling data.
To reconstruct the physical configuration of the urban environment, 3D building data were employed as the fundamental basis for shade simulation. This dataset provides footprints with precise height attributes [32], enabling the calculation of street canyon geometry. Concurrently, tree canopy height data were acquired to identify vegetative shading sources [42]. To further refine the shade model, the Copernicus DEM with a 30 m resolution was employed to account for terrain. To align the spatial scales, the 30 m DEM was resampled to a 1 m resolution using bilinear interpolation. The 1 m tree canopy heights were then added to this base surface to ensure a consistent resolution for the subsequent ray-tracing simulations. In terms of meteorological conditions, hourly data were retrieved from the ERA5 dataset to capture the temporal dynamics of the thermal environment. To establish the spatial framework for analysis, road networks were collected from OpenStreetMap (OSM). The dataset was topologically corrected and cleaned to serve for both shade projection and pedestrian flow matching.
To characterize urban vitality and human activity patterns, Point of Interest (POI) data were collected from Ali map. These data were classified into commercial, public service, and transportation categories to quantify the functional density and attractiveness of different street blocks. Furthermore, mobile phone signaling data were obtained to represent spatiotemporal crowd dynamics. This dataset contains anonymized user trajectories with high-frequency timestamps, which were rigorously filtered to extract outdoor pedestrian activities, serving as the metric for evaluating thermal exposure demand. Detailed specifications and sources for all datasets are summarized in Table 1.
Table 1.
Detailed specifications of datasets used in this study.
3. Methods
3.1. Dynamic Urban Shade Simulation Models
Urban shade cast by buildings and trees serves as an important regulator of the urban thermal environment. To capture the spatiotemporal evolution of shading effects, we developed a dynamic simulation model based on astronomical geometric principles. We utilized the Solar Position Algorithm (SPA) developed by the National Renewable Energy Laboratory, implemented via the pvlib Python (3.8) library, to determine precise solar parameters. The simulation was specifically set to 12 July 2022, a date selected through a multiple-filtering strategy. While Fuzhou experiences frequent high-temperature events in summer, it is also characterized by abundant precipitation, which significantly affects pedestrian mobility. Consequently, to ensure pedestrians are unaffected by rain and have shade available, a clear sunny day is essential. Furthermore, weekends were excluded to capture weekday commuting patterns. The selected date represents a typical heatwave event, defined as a period with daily maximum temperatures exceeding 35 °C for at least three consecutive days. Meteorological records confirm that July 12 registered a peak temperature of 41 °C and was preceded by five consecutive days of intense heat, making it an optimal candidate for this study.
The calculation process includes three parts:
- Solar Vector Decomposition;
The solar position defined by altitude () and azimuth () is decomposed into normalized 3D directional vectors (). These vectors guide the pixel-level search process as expressed in Equation (1):
- 2.
- Composite Surface Modeling;
To correct potential distortions caused by terrain relief, the model includes DEM. A composite base surface () is constructed by superimposing feature heights onto the DEM, as shown in Equation (2):
where represents the total elevation of the surface model at grid coordinates ; is the terrain elevation; and and represent the heights of tree canopies and buildings, respectively.
- 3.
- Iterative Ray Tracing.
The core shading detection utilizes a line-of-sight search algorithm. A virtual solar ray originates from the top of the feature and traverses along the inverse solar vector. The algorithm iterates through grid cells along the projected path until the ray height () falls below the base surface elevation (), identifying the intersection point where shade is cast (Equation (3)).
where is the height of the solar ray at the k-th step; represents the initial elevation of the casting feature; is the vertical component of the solar vector; is the iteration step index; and represents the spatial resolution of the grid search.
While conventional microclimate tools are capable of detailed simulations (e.g., UMEP Version 4.0.2, Sun Shadow Frequency tool in ArcGIS Pro Version 3.1.4), they often encounter severe computational bottlenecks when applied to city-scale domains with high-resolution data. To ensure computational efficiency, we developed a customized Python-code-based ray-tracing algorithm optimized for large-scale matrix operations. Tested on a standard consumer-grade computer (Intel Core i7, 16 GB RAM), this algorithm allows for rapid diurnal simulations across the entire core city network, completing the 12 h temporal analysis in under 20 min. This significantly reduces the computational resources required and ensures methodological transferability.
3.2. Pedestrian Flow Extraction
To extract outdoor walking activities from the raw mobile signaling data, a rigorous processing framework was implemented.
3.2.1. Temporal Filtering
The raw dataset consists of daily trajectories for each user. However, the sampling frequencies vary significantly across users. To ensure temporal continuity and the reliability of subsequent speed calculations, trajectory segments with a time interval exceeding 1 h between consecutive update points were identified as sparse records and discarded.
3.2.2. Path Construction
The filtered trajectory points (Origin–Destination pairs) were projected onto the OSM road network. Since raw signaling data provides discrete coordinates, the Dijkstra shortest-path algorithm was employed to construct the logical movement paths along the topological road network [43,44]. This algorithm is widely used in urban pedestrian network analysis to calculate the shortest path [45,46,47]. The reliance on the shortest path aligns with recent empirical studies. Heat stress significantly increases perceived walking distance [33], and the shortest distance is the preferred routing factor for general populations during heat events [48]. Therefore, reducing travel distance provides an objective baseline for the commuting of mobile urban pedestrians during extreme heat events. Through this process, the network distance () for each trajectory was calculated, serving as the fundamental metric for the subsequent behavioral filtering.
3.2.3. Network Distance Threshold
The path length should satisfy . This threshold excludes long-distance trips that exceed typical walking ranges in summer, effectively filtering out vehicular travel.
3.2.4. Velocity Threshold
The speed () was calculated based on the network distance rather than Euclidean distance ( = ). A valid walking speed was defined as . The lower bound excludes stationary activities, whereas the upper bound is determined based on average walking speeds for the Chinese population [49], excluding running, cycling, and motorized transport.
3.2.5. Tortuosity Threshold
To distinguish pedestrians from vehicles navigating complex road hierarchies (e.g., interchanges or one-way detours), the Non-linear Coefficient (Detour Index, DI) was applied [50]. It is defined as the ratio of network distance to Euclidean distance (). Trajectories with DI < 1.5 were retained [51,52].
3.3. Sidewalk Geometry Reconstruction
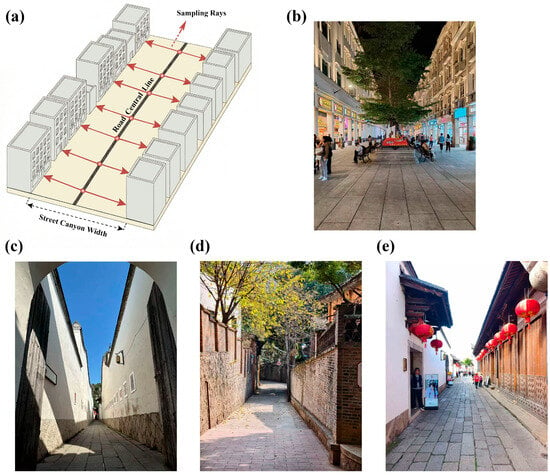
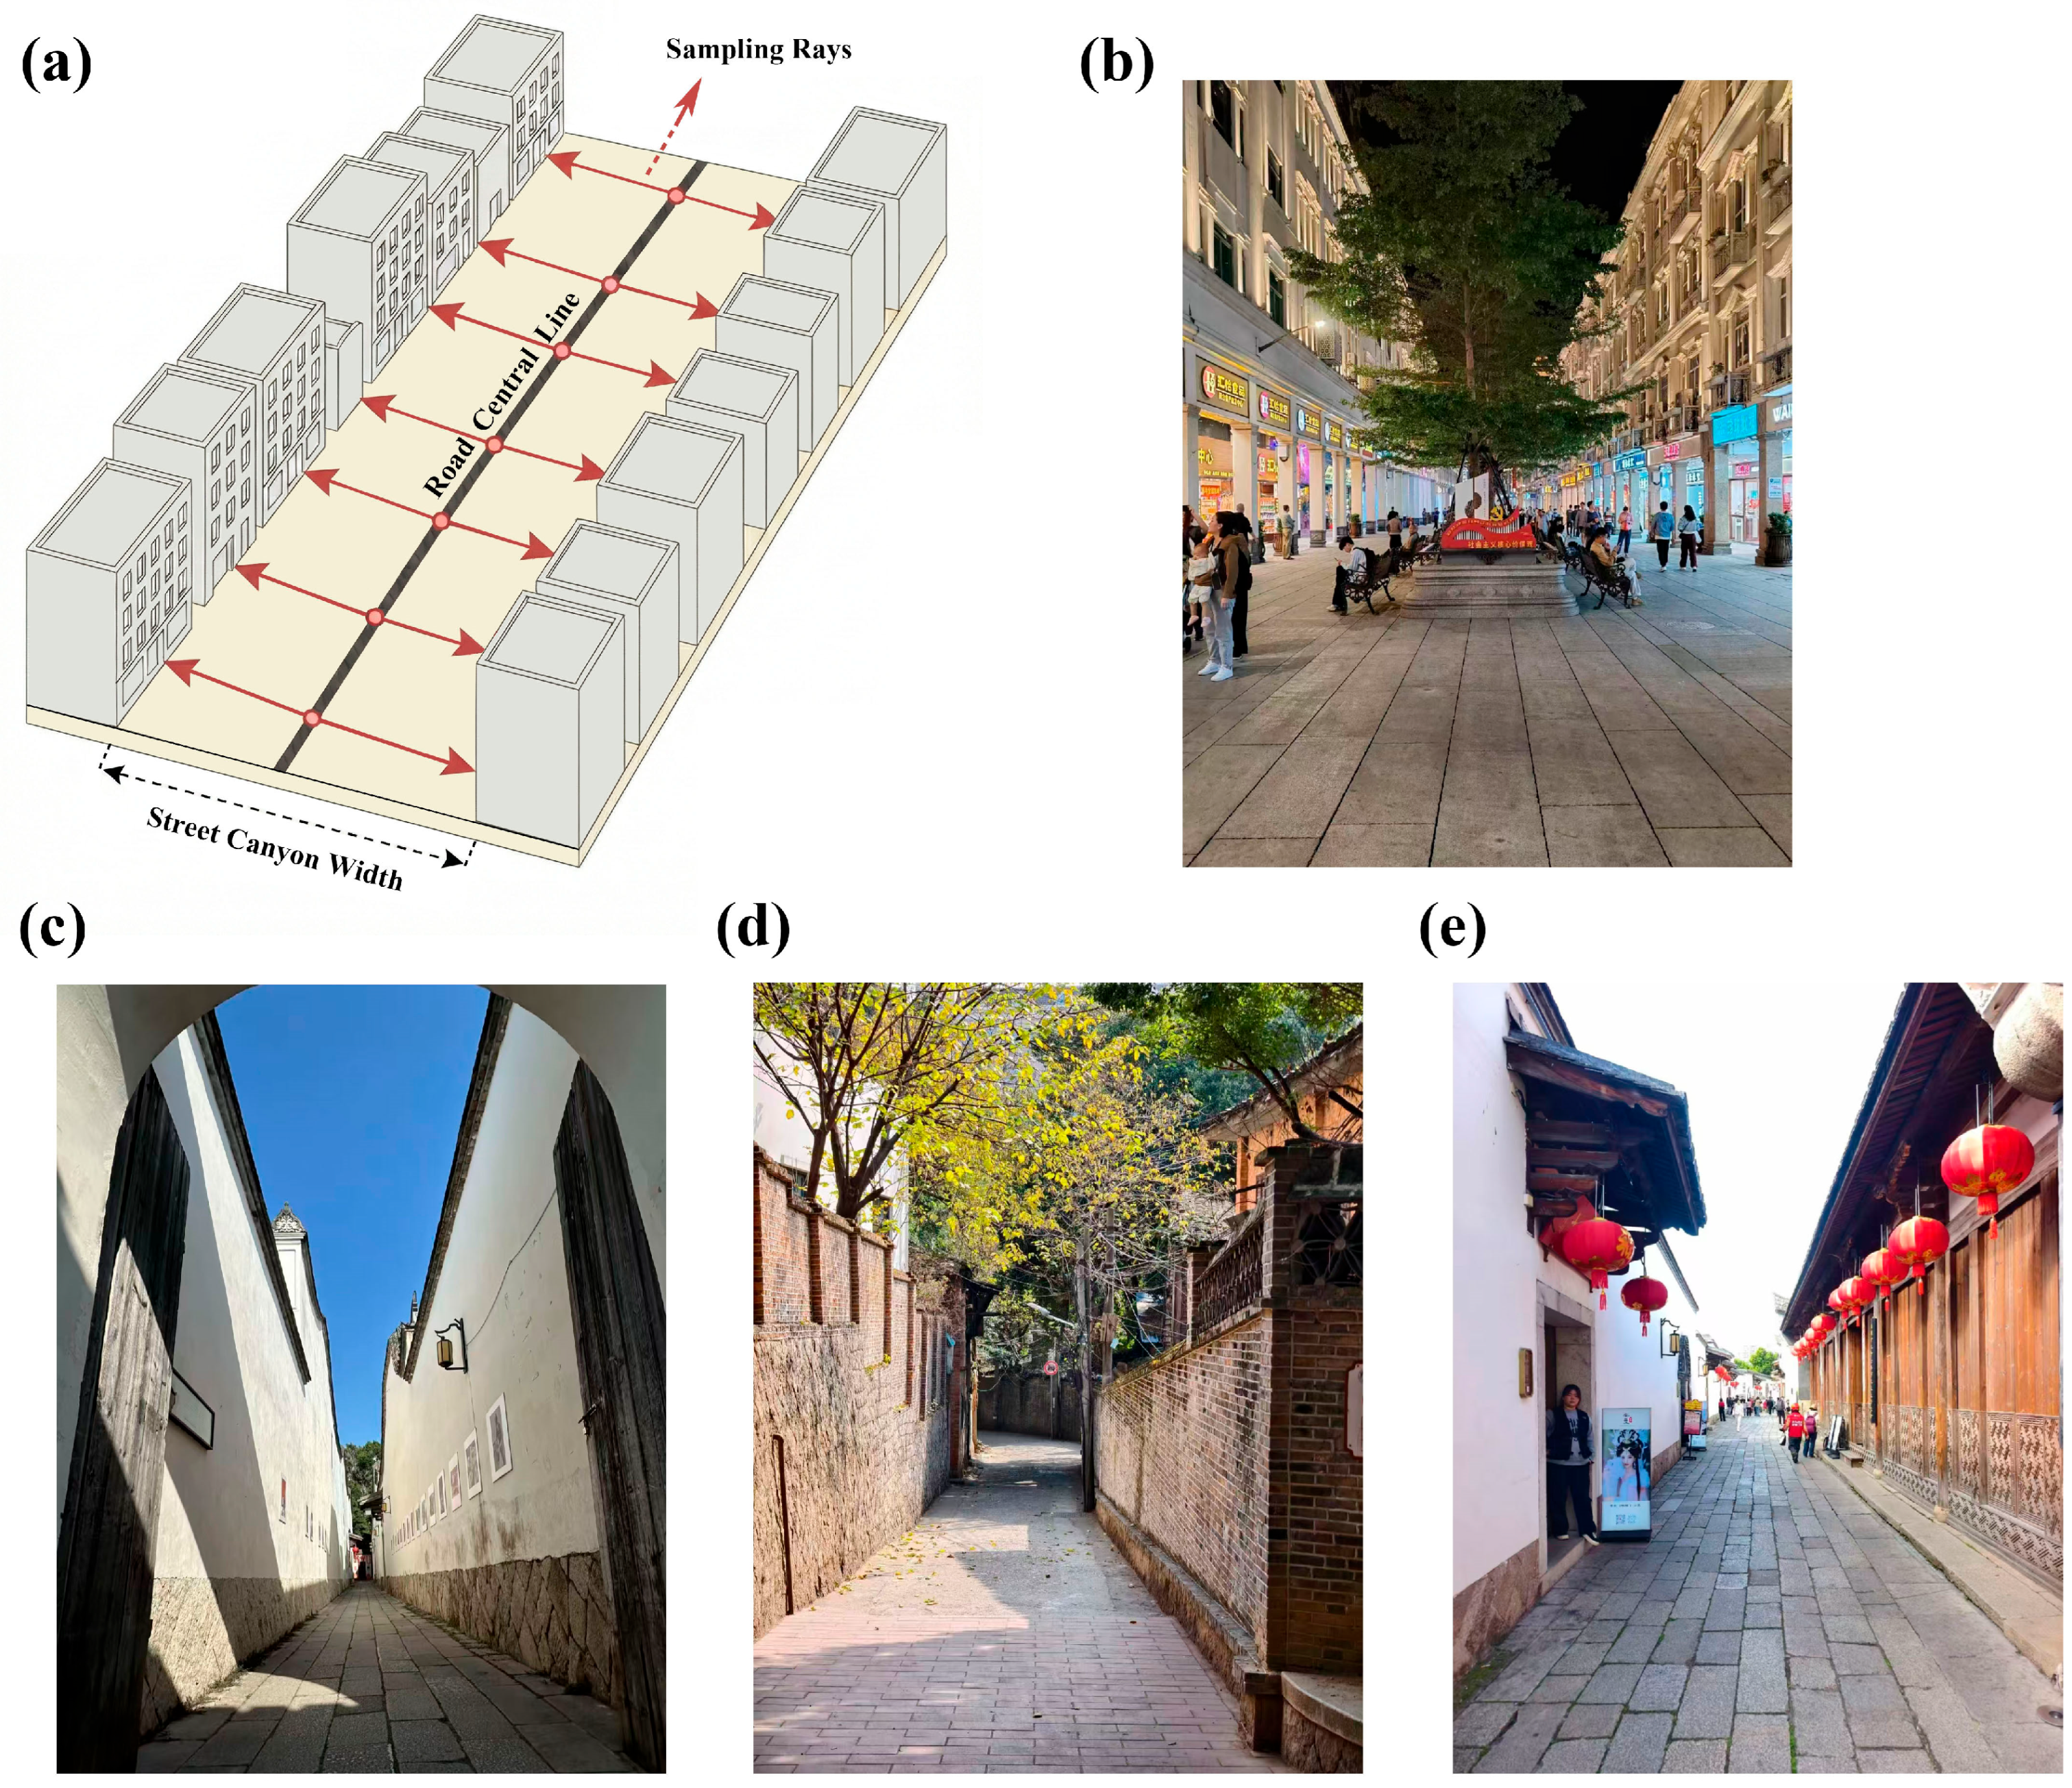
Accurate sidewalk geometry is essential for estimating pedestrian capacity and shade potential; however, sidewalk information is often unavailable in authoritative spatial datasets [53,54,55]. To address this limitation, we employed a morphology-based street canyon detection method to reconstruct effective sidewalk widths [55], as shown in Figure 3. The initial road network was obtained from OSM. Before geometric reconstruction, roads not accessible to pedestrians, such as highways, expressways, and overpasses, were removed so that the reconstructed network reflected the structure of walkable routes. We utilized a ray sampling algorithm to quantify the spatial interaction between road centerlines and adjacent building footprints, thereby deriving the boundaries of street canyons.
Figure 3.
(a): Schematic illustration of the sidewalk geometry reconstruction; (b–e): Representative urban sidewalk morphologies.
The reconstruction process first discretizes the topological road network into sampling points at 3.5 m intervals to ensure geometric precision [56]. At each point, rays are emitted perpendicular to the road tangent to measure the Euclidean distance to the nearest building. The minimum distance recorded for each road segment is ultimately adopted as the representative canyon width. This conservative strategy captures the physical width of streets as a constraint for pedestrian flow and shading capacity.
3.4. Variable Selection
We constructed a system comprising one dependent variable and a set of independent variables to quantify the driving forces of pedestrian distribution.
3.4.1. Dependent Variable
The hourly aggregated pedestrian flow on each road segment (derived in Section 3.2) served as the dependent variable. A logarithmic transformation () was applied to the raw counts to mitigate the skewness caused by the long-tail distribution of urban crowds, ensuring numerical stability during model training.
3.4.2. Independent Variables
- Shade Ratio.
Calculated hourly (07:00–18:00) using the dynamic simulation model (Section 3.1).
- Hour.
Included as a categorical variable to control the commuting rhythms of urban crowds.
- Street Canyon Geometry ( Ratio).
This variable is an important indicator of the trade-off between shading capacity and ventilation potential in the urban canopy layer [57]. A higher aspect ratio () generally creates a deep canyon that effectively reduces solar access and mean radiant temperature through shading [58]. Building heights () were derived from the 3D morphological dataset, while the effective street width () was reconstructed using the morphology-based detection method detailed in Section 3.3.
- Greenery Coverage (Tree Coverage Ratio).
Representing ecological shading potential, this is calculated by identifying tree canopy pixels within the sidewalk zone.
- Network Topology (Betweenness Centrality).
This variable quantifies the potential of a road segment to mediate traversing paths, mathematically defined as the cumulative frequency with which a segment appears on the shortest paths connecting pairs of network nodes [59,60]. Unlike global measures that assume uniform interaction across the entire city, we calculated Betweenness Centrality using a radius restricted to 3000 m. This spatial constraint distinguishes pedestrian mobility from long-distance vehicular travel, and it captures the local connectivity characteristic of walking behaviors. This threshold maintains consistency with the trajectory-filtering rule established in Section 3.2, ensuring that the topological factor operates on the same spatial scale as the pedestrian flow.
- POI Density.
To represent the destination attractiveness, POI data were classified into three categories: commercial, public service, and transportation. The density for each category was computed using Kernel Density Estimation (KDE) with a bandwidth of 800 m. This bandwidth aligns with the “15 min life circle” planning standard [61], effectively capturing the walkable service range accessible to pedestrians.
- Traffic Inertia (Lagged Flow).
To quantify the temporal dependence inherent in human mobility, we introduced the pedestrian flow of the preceding hour as an independent variable [38]. It was applied with the same logarithmic transformation as the dependent variable, serving as an indicator for the baseline traffic volume driven by the rhythms of commuting and social activities.
- Meteorological Conditions.
Hourly meteorological data, including air temperature (), relative humidity (), and direct normal irradiance (), were integrated to characterize the dynamic thermal environment. While the shade ratio quantifies the potential for solar protection, these meteorological variables define the background thermal stress level of the city.
3.5. Non-Linear Analytical Models
To deconstruct the non-linear interactions between urban thermal environments and pedestrian flows, we employed Extreme Gradient Boosting (XGBoost). Unlike traditional linear regression models, which assume uniform elasticity between environmental supply and behavioral demand, XGBoost uses an ensemble of decision trees to capture threshold effects and interaction heterogeneity [39].
The objective function consists of two components: a convex loss function quantifying the discrepancy between the estimated pedestrian flow and the actual mobile signaling data, and a regularization term to penalize model complexity. The objective function is expressed as follows:
where is the number of road segments in the training set, represents the actual logarithmic pedestrian flow on the -th road segment, and represents the estimated flow value.
The regularization term prevents overfitting to the noise inherent in mobile signaling data, defined as
where is the number of leaves in the tree, and represents the leaf weights. and are regularization parameters that control the complexity of the tree structure, ensuring that the model captures robust behavioral patterns rather than local noise.
The model employs an additive training strategy. At each iteration , a new function is added to minimize the residual errors from the previous step . This process effectively isolates the marginal contribution of specific environmental factors after controlling for traffic inertia. The iterative fitting process is formulated as
where represents the estimated logarithmic pedestrian flow for the -th road segment after iterations; is the estimate from the previous iteration; and represents the new decision tree added in the current step to correct the residual error.
3.6. Explanatory Models
To deconstruct the black box of XGBoost and identify the distinct drivers of pedestrian accumulation in high-risk versus comfort zones, we employed SHAP and Partial Dependence Plots (PDPs). These tools enable the visualization of non-linear behavioral responses to thermal environments.
SHAP provides a unified measure of global feature importance by calculating the marginal contribution of each variable across all possible feature coalitions. The Shapley value for a specific environmental or functional feature is defined as
where represents the complete set of factors, and represents a subset excluding feature .
SHAP interprets the complex XGBoost model as an additive linear combination of these contributions:
where is the baseline pedestrian flow, and quantifies the deviation attributed to the -th feature.
To further visualize the non-linear thresholds of thermal exposure, we employed PDPs. This method marginalizes the effects of confounding variables to isolate the functional relationship between a target feature and the estimated pedestrian flow:
where represents the target feature of interest, and represents the complement set of all other explanatory variables. The integration process marginalizes the distribution of , yielding the pure marginal effect of on the model outputs.
3.7. Data Validation and Model Evaluation Parameters
3.7.1. Sidewalk Accuracy Assessment
Before conducting XGBoost modeling, the reliability of the constructed sidewalk was systematically evaluated using a spatial point sampling approach. A total of 10,000 sampling points were randomly generated in proportion to the geometric characteristics of the extracted road network. Due to the absence of authoritative public datasets specifically for sidewalks, we validated our reconstructed sidewalk against a 0.5 m submeter-level urban land cover reference dataset [62]. Compared with existing global and regional products, such as ESA 10 m and SinoLC-1 m, this dataset provides finer spatial resolution and greater geometric detail. The sidewalk mapping accuracy was evaluated using the precision metric, calculated as follows:
where (True Positives) represents the number of sampled points correctly intersecting the reference road pixels, and (False Positives) represents points falling into the background.
Detailed procedures, spatial accuracy results, and reliability discussions regarding the reconstructed sidewalk network are provided in Appendix A.
3.7.2. Model Evaluation Parameters
To rigorously assess the performance of the stratified XGBoost models, the dataset was partitioned into a training set (80%) for model fitting and an independent testing set (20%) for final validation. We employed Root Mean Squared Error (RMSE) and the coefficient of determination (R2) as the primary metrics. Additionally, a 5-fold cross-validation strategy was integrated into the hyperparameter search to ensure the robustness of the results across different urban zones. The evaluation metrics were calculated as follows:
where represents the number of samples in the test set; and represent the actual and fitted logarithmic pedestrian flows, respectively; and is the mean of the observed values.
4. Result
4.1. Spatiotemporal Shading Distribution
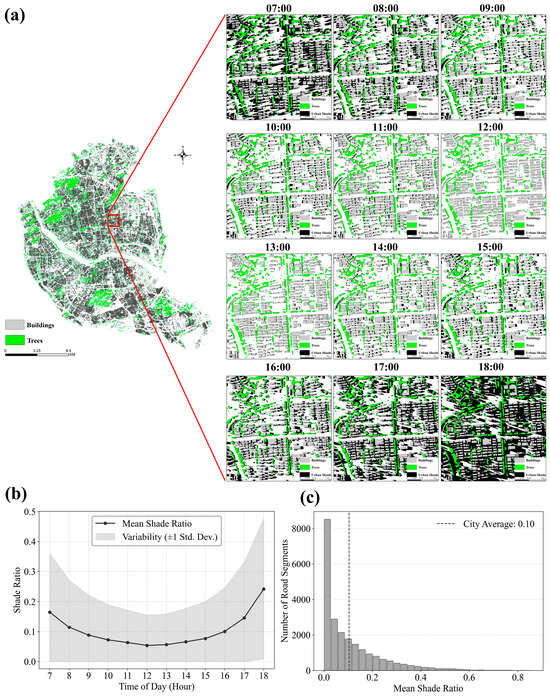
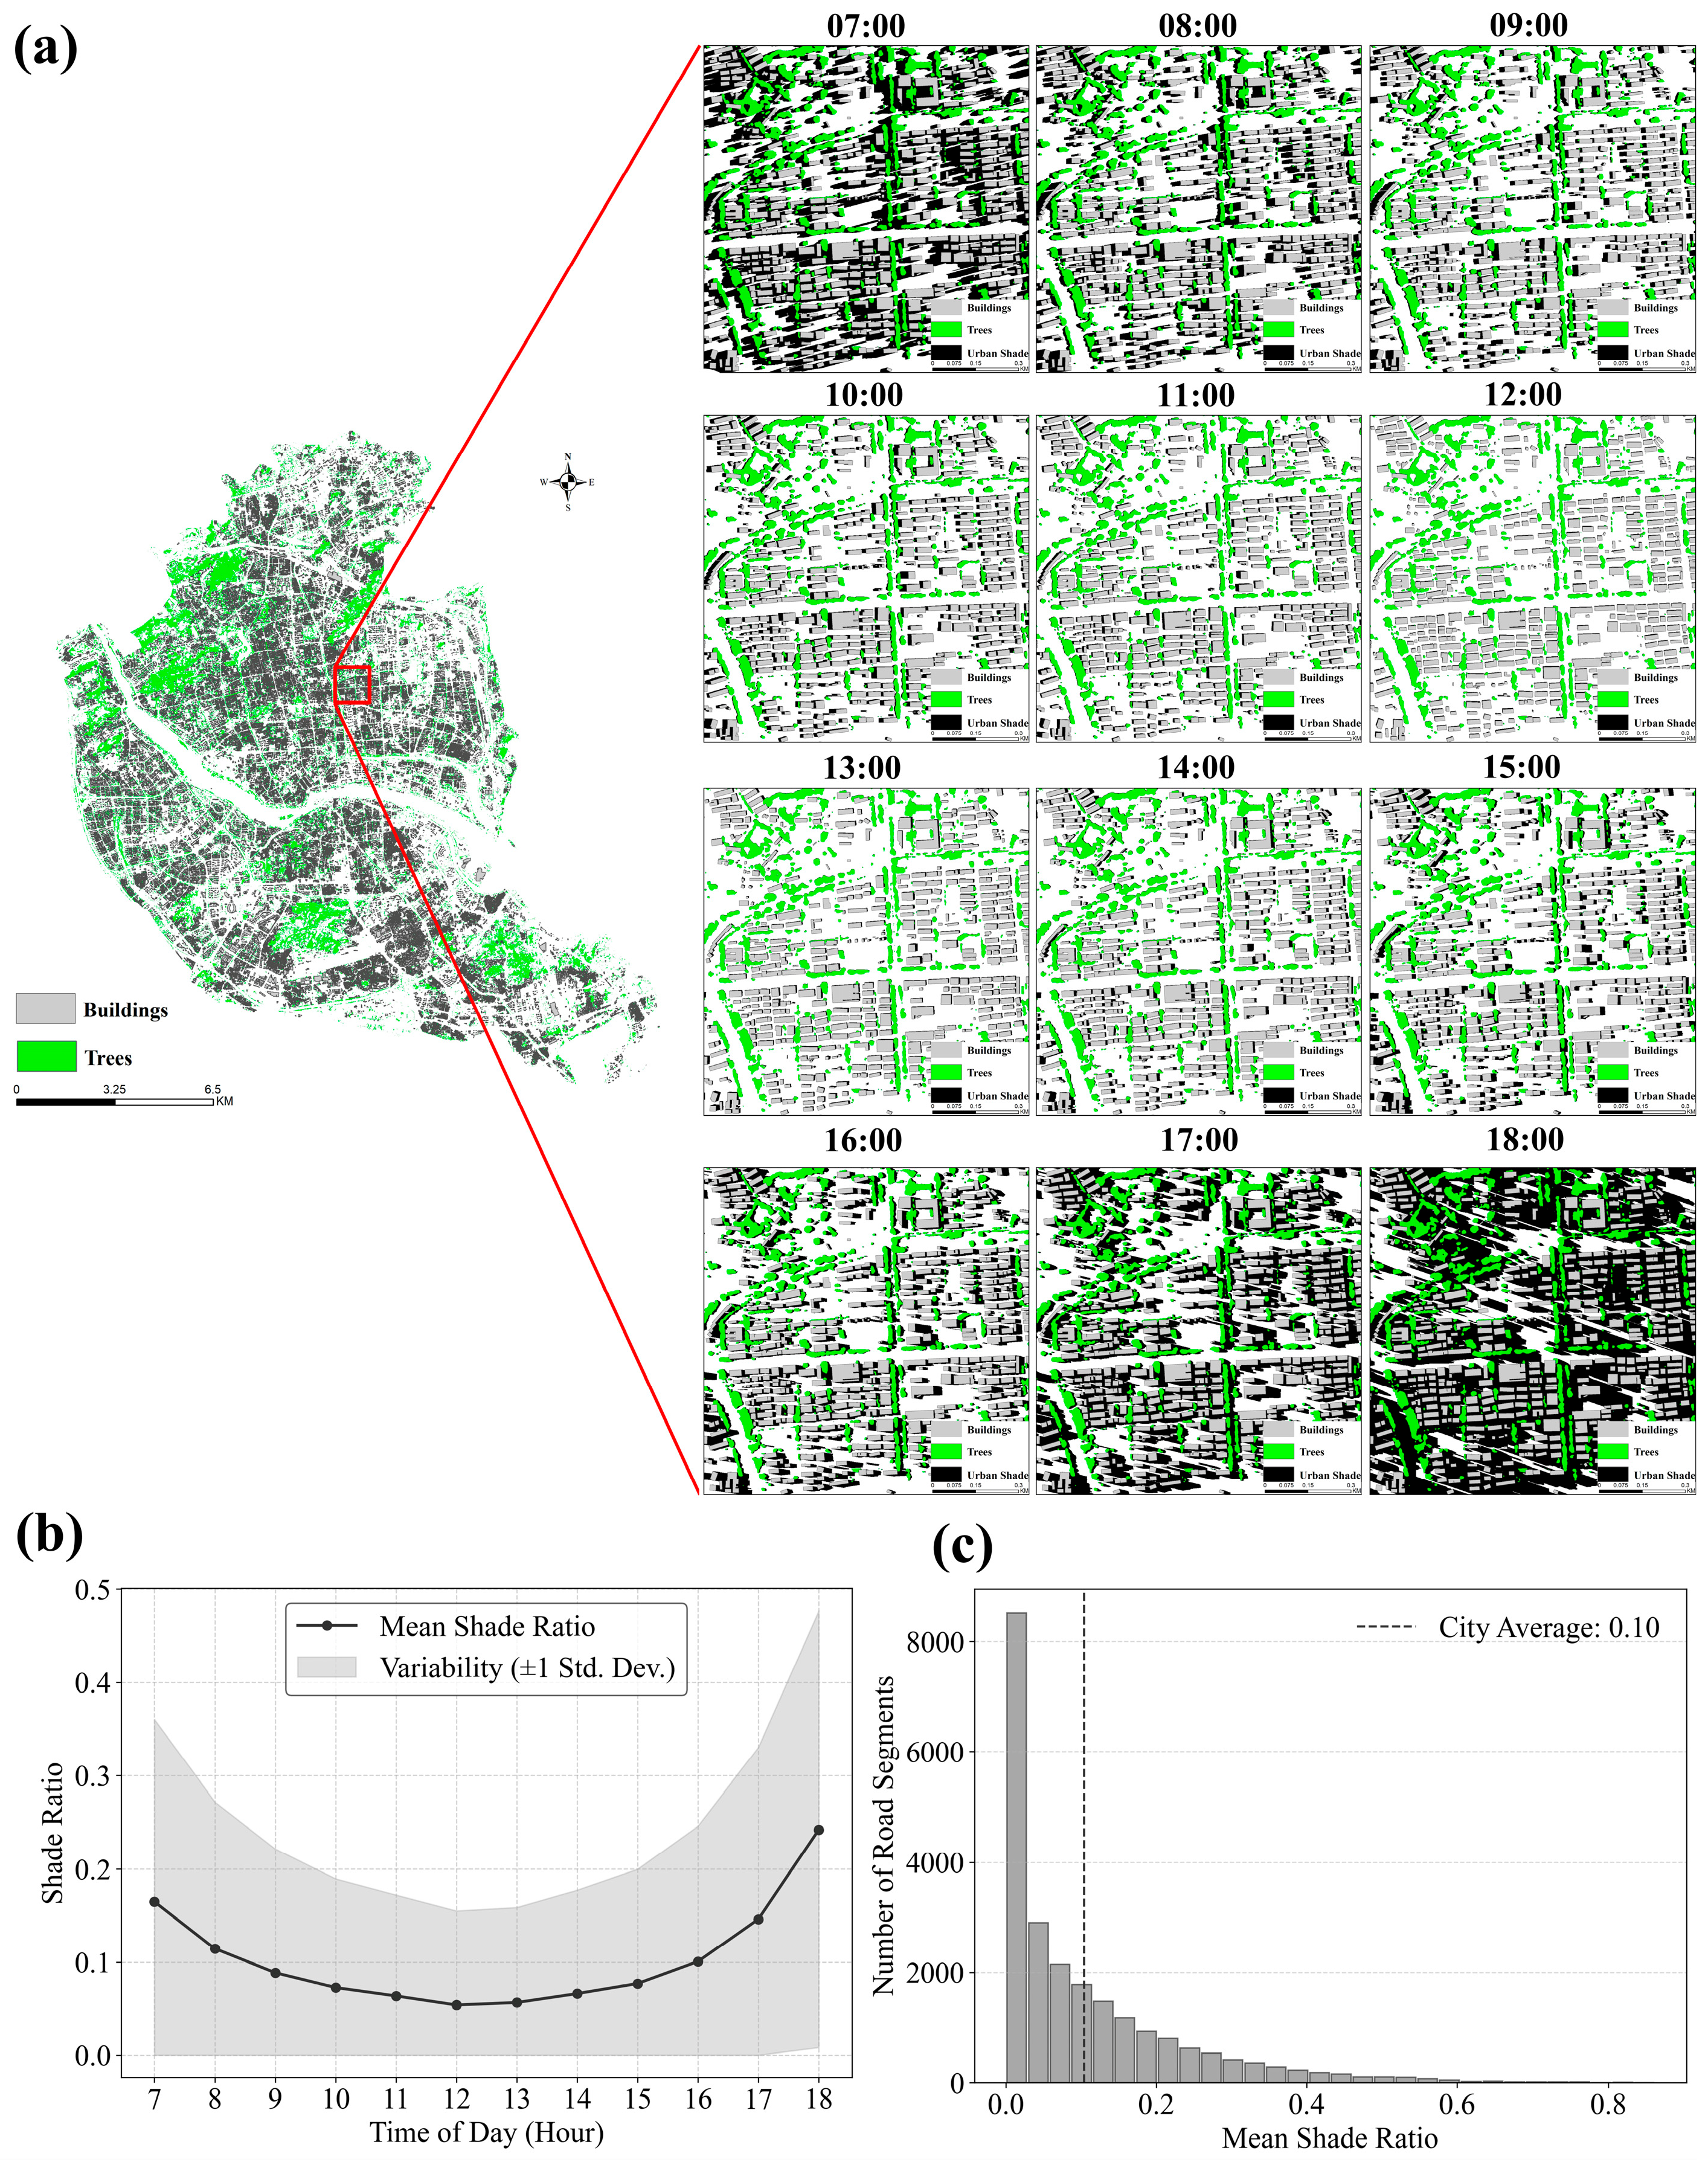
As visualized in the hourly spatial distribution maps (Figure 4a), shade coverage undergoes a contraction–expansion cycle: extensive shade in the early morning (07:00) rapidly retracts to the building footprints by noon, leaving the majority of street canyons fully exposed, before lengthening again in the late afternoon. This morphological evolution is quantified by the temporal variation curve (Figure 4b), which shows a “U-shaped” trajectory. The city-wide mean shade ratio starts at 16.51% at 07:00 and ends at 24.25% at 18:00, being merely 5.41% at 12:00. This asymmetric variation is driven by the difference in the solar altitude angle. On the study date, the solar altitude angle at 07:00 was 20.46°, while at 18:00 it was 11.44°. Given that the physical heights of urban buildings and trees remain constant, the lower solar altitude angle in the evening casts longer shadows, thereby generating a higher overall shadow coverage. The frequency distribution histogram (Figure 4c) shows a right-skewed pattern, where the majority (82.04%) of road segments have a daily mean ratio below 20%. In contrast, high-coverage shading (daily mean > 50%) covers only 1.65% of the road network. The city-wide median shade ratio (5.87%) is notably lower than the mean (10.40%), statistically confirming that high thermal exposure is the main condition for the city’s pedestrian network.
Figure 4.
Spatiotemporal patterns and statistical characteristics of urban shade. (a): Hourly spatial shade distribution across the road network (07:00–18:00); (b): Temporal variation in urban shade coverage; (c): Frequency distribution histogram of daily mean shade ratios.
4.2. Spatial Coupling and Divergence Between Urban Shade and Pedestrian Flows
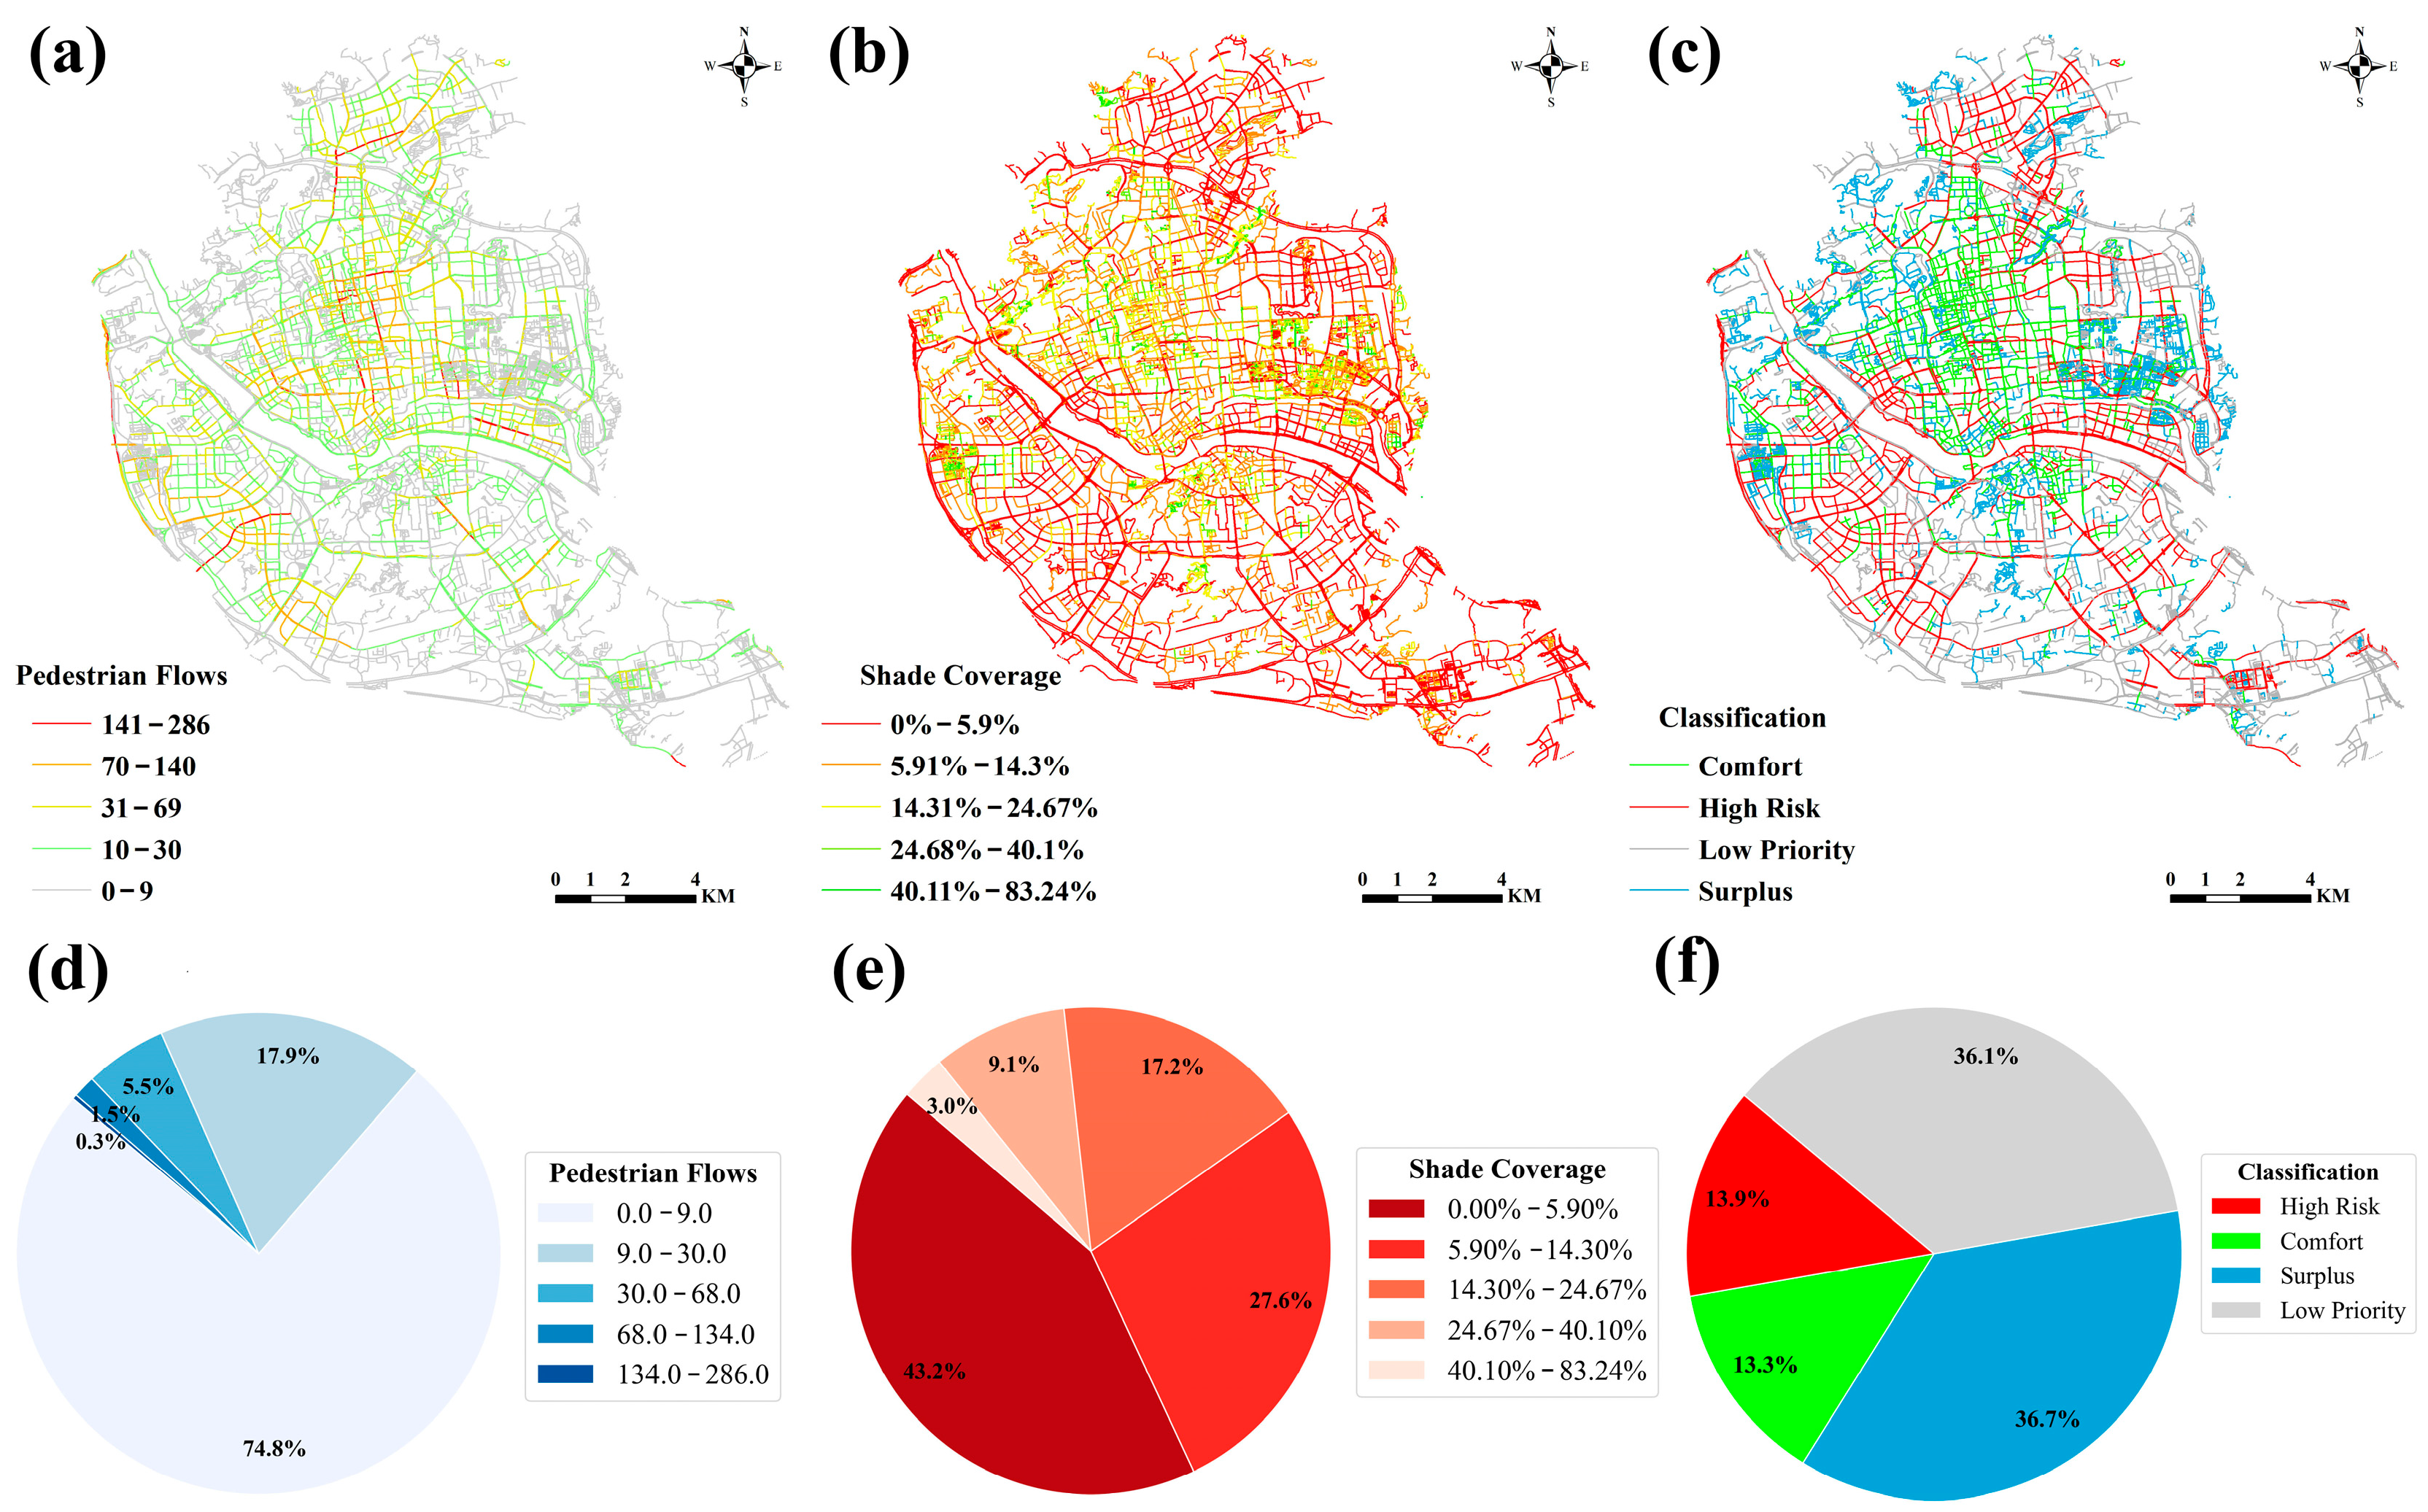
To identify and quantify the thermal exposure risks in the urban area, we established a quadrant classification framework [63,64] (Figure 5). The determination of thresholds was driven by the statistical social dynamics versus urban thermal environments. For pedestrian demand, the mean flow (8.88) was adopted to align with the Pareto principle of urban mobility [65]. This threshold effectively isolates the top 27.2% of active roads that carry the primary flow of the city, ensuring that risk identification targets the busiest roads. For urban shade supply, unlike the clustered nature of human activity, urban shading behaves as a morphological attribute with a relatively uniform distribution across the street canyon region. Consequently, the median shadow ratio (7.65%) was employed to ensure statistically fairness.
Figure 5.
Spatial patterns and statistical classification of urban shade and pedestrian flows. (a): Spatial distribution of daily median pedestrian flows; (b): Spatial distribution of daily urban shade coverage; (c): Quadrant risk classification map; (d): Graded proportions of daily median pedestrian flows; (e): Graded proportions of daily urban shade coverage; (f): Proportions of quadrant risk classification.
Based on these thresholds, the active road network shows a polarized thermal condition. High-risk zones account for 13.90% of the total network (1287 segments) and are mainly distributed linearly along wide arterial roads and commercial corridors. In these zones, the mean daily pedestrian flow reaches 28.6, yet the mean daily shadow coverage is merely 3.14%. In contrast, comfort zones account for 13.34% of the network (1235 segments) and appear as clustered patches in older districts or vegetated neighborhoods. While the flow in these areas (mean daily flow = 26.7) is comparable to that in high-risk zones, they provide 17.10% average shadow coverage.
The remaining 72.8% of the road network includes inactive segments. Surplus zones represent 36.7% of the total network, characterized by the highest mean shadow coverage of 20.35% but minimal pedestrian usage (mean daily flow = 1.9). These segments are typically located in low-density residential areas or parks, representing a large amount of thermal comfort resources that are currently underutilized. Low-priority zones account for 36.1% of the network, characterized by both low flow (mean daily flow = 1.8) and low shade (mean daily shade = 2.45%), contributing minimally to the total thermal exposure of the pedestrian flow.
4.3. Heterogeneous Driving Factors of Thermal Exposure Risks and Comfort Zones
4.3.1. Hyperparameters of XGBoost Models
Prior to model training, feature selection and a variable collinearity test were conducted. From the initial meteorological variables extracted from the ERA5 dataset, three core indicators (air temperature, relative humidity, and direct normal irradiance) were selected. A Variance Inflation Factor (VIF) test confirmed that all selected features yield VIF values strictly below 10, with a maximum value of 9.67 (air temperature), indicating the absence of severe multicollinearity (Table 2).
Table 2.
VIF values of selected features.
Subsequently, to ensure optimal performance and prevent overfitting, the hyperparameters for both the high-risk and comfort zone models used a Randomized Search CV approach with 5-fold cross-validation. As presented in Table 3, the optimization processes of the two models converge to the same optimal parameter combination. The high-risk zone model achieved a coefficient of determination () of 0.8568; the comfort zone model achieved an of 0.7662. The RMSE is 0.41 in the high-risk zone model; the comfort zone model’s RMSE is 0.4666. To demonstrate the analytical advantages of XGBoost over classical statistical methods, a baseline comparison was conducted using a Generalized Additive Model (GAM). Using the exact same explanatory variables, this semi-parametric baseline yielded an of 0.3280 and RMSE of 0.6420 for the high-risk zone, and of 0.2945 with RMSE of 0.6824 for the comfort zone. This discrepancy indicates that traditional models struggle to capture the complex variance of pedestrian flows. Analytically, while GAM effectively models single-variable non-linearities, XGBoost uniquely isolates high-dimensional synergistic interactions while providing quantifiable marginal contributions. Finally, the difference in explanatory capability between the high-risk and comfort zones suggests underlying variations in pedestrian behavioral patterns, which are further explored in Section 5.
Table 3.
XGBoost hyperparameter selection.
4.3.2. SHAP Model Interpretation and Feature Importance
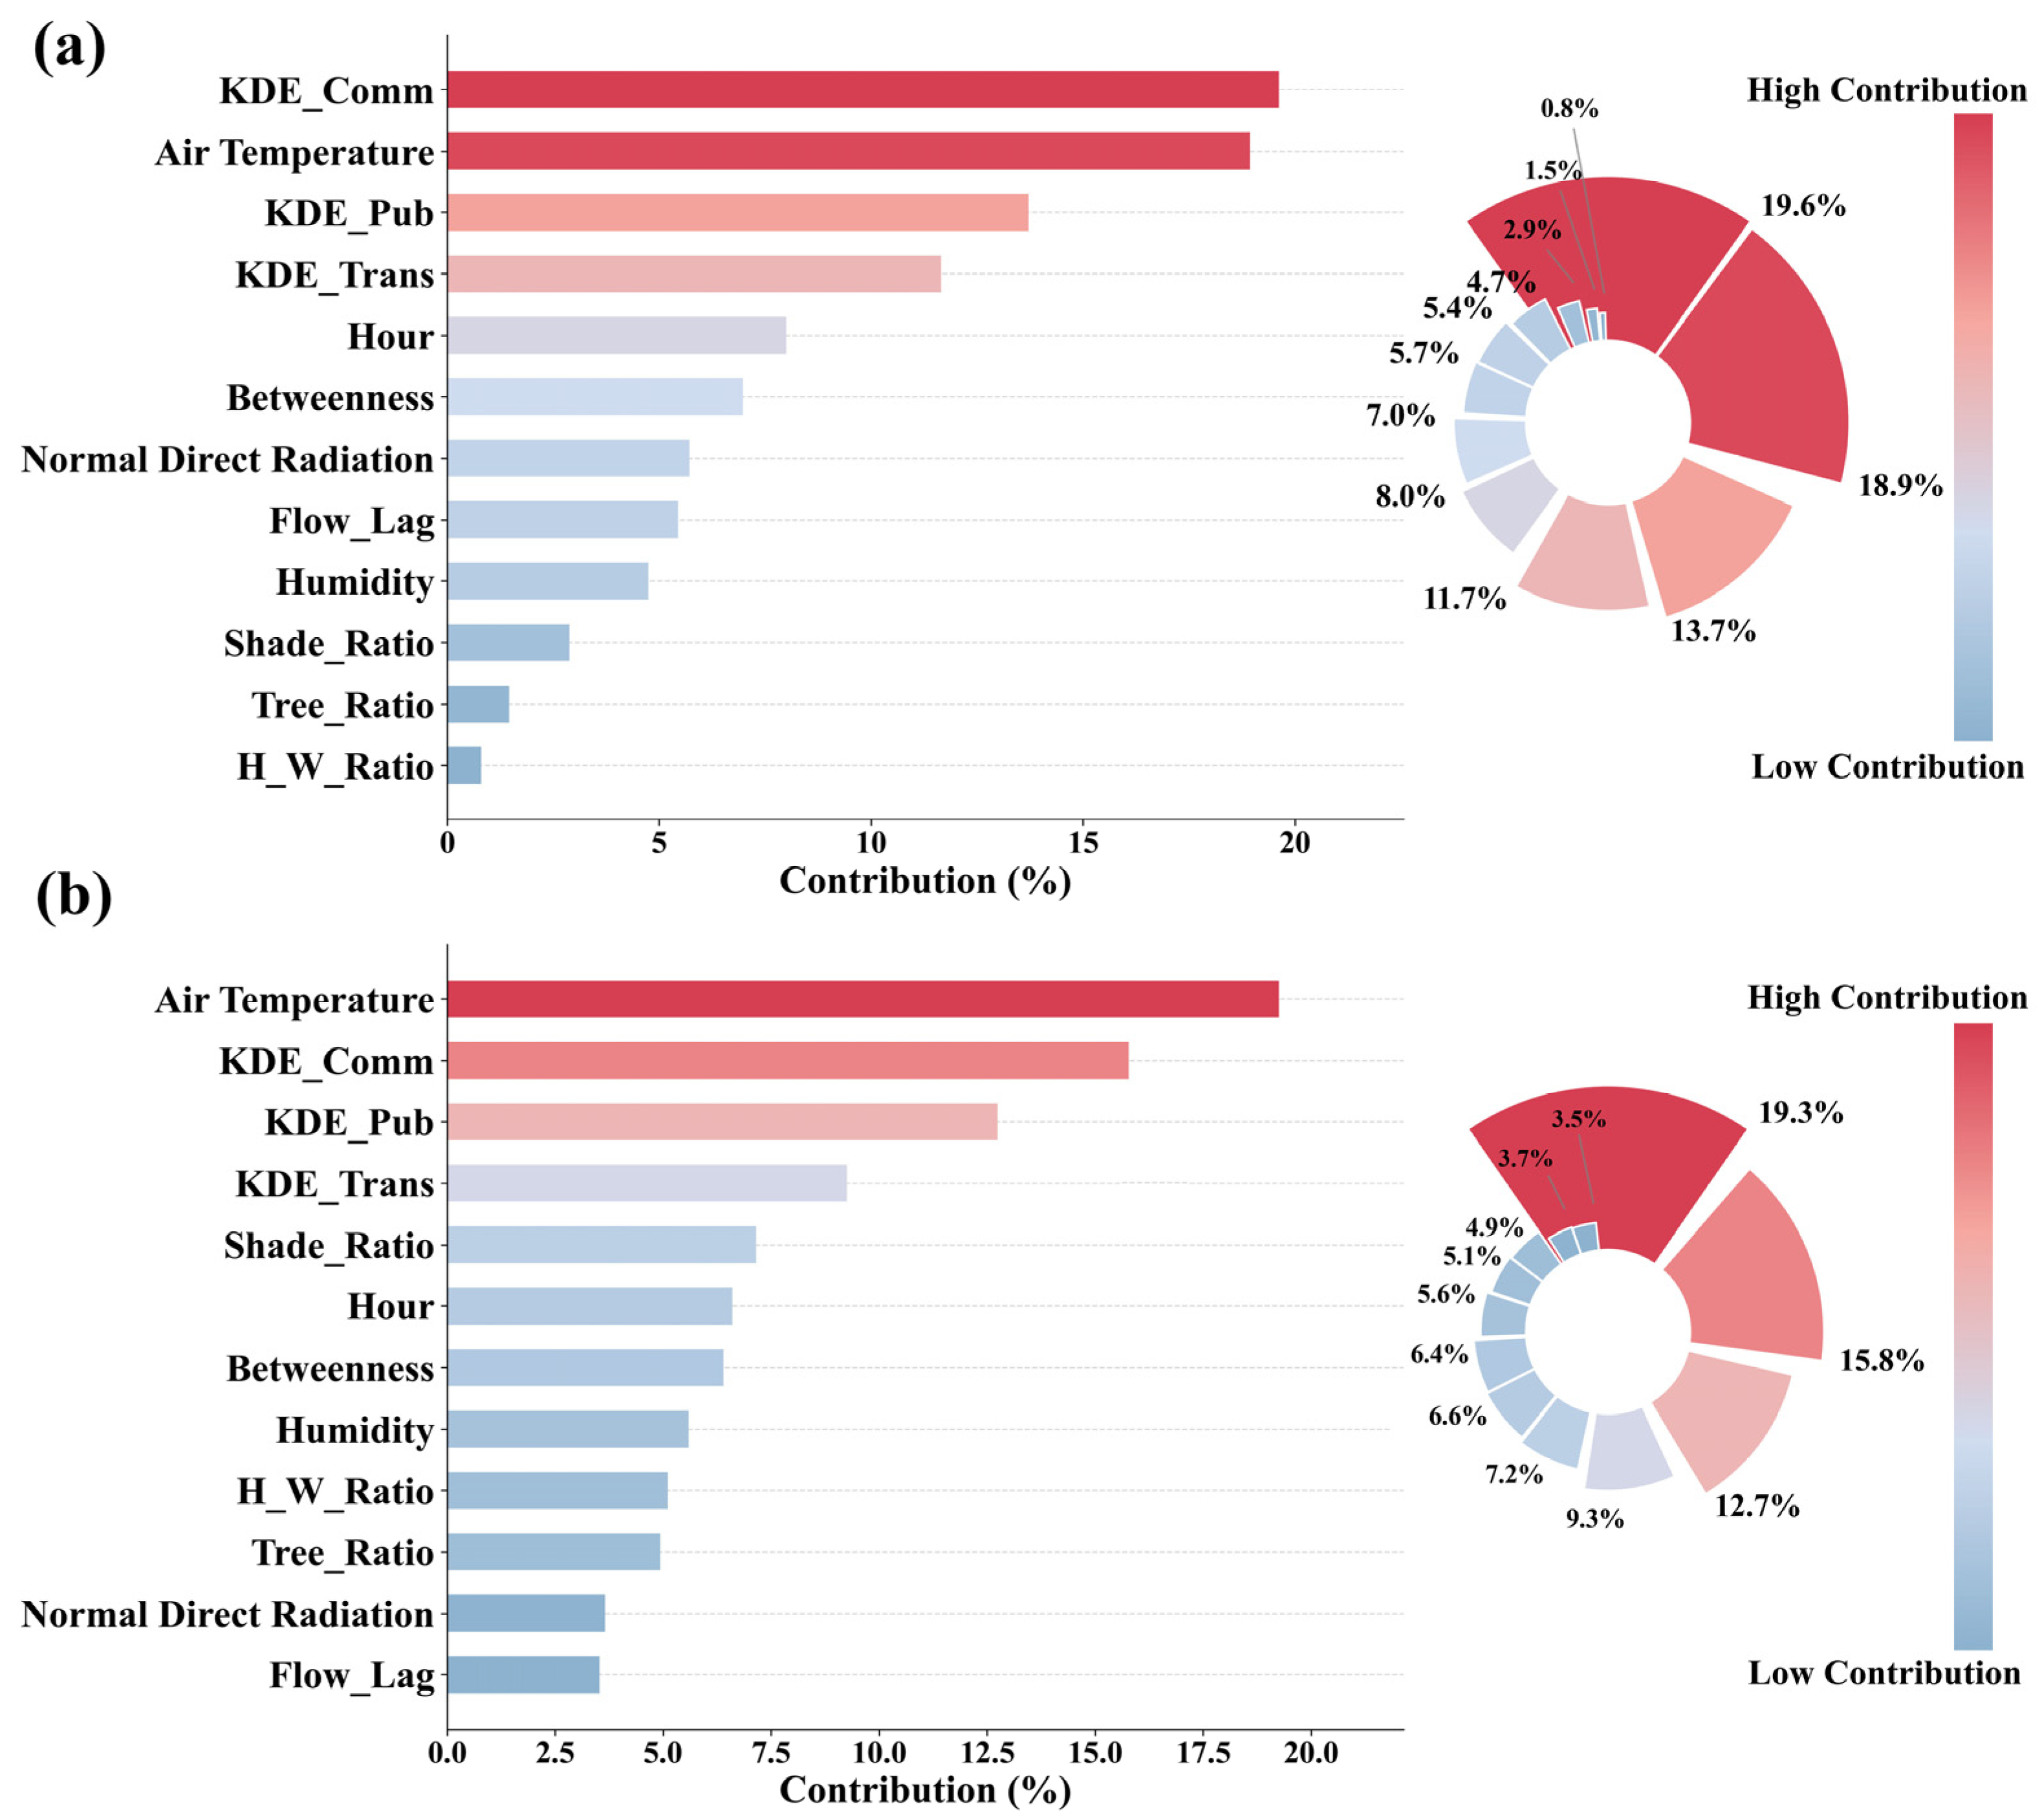
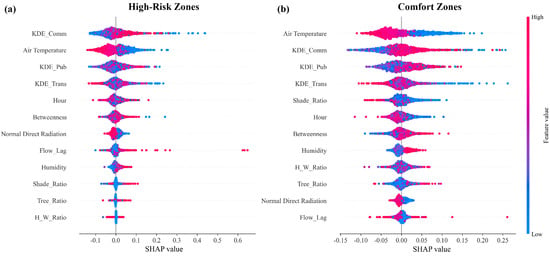
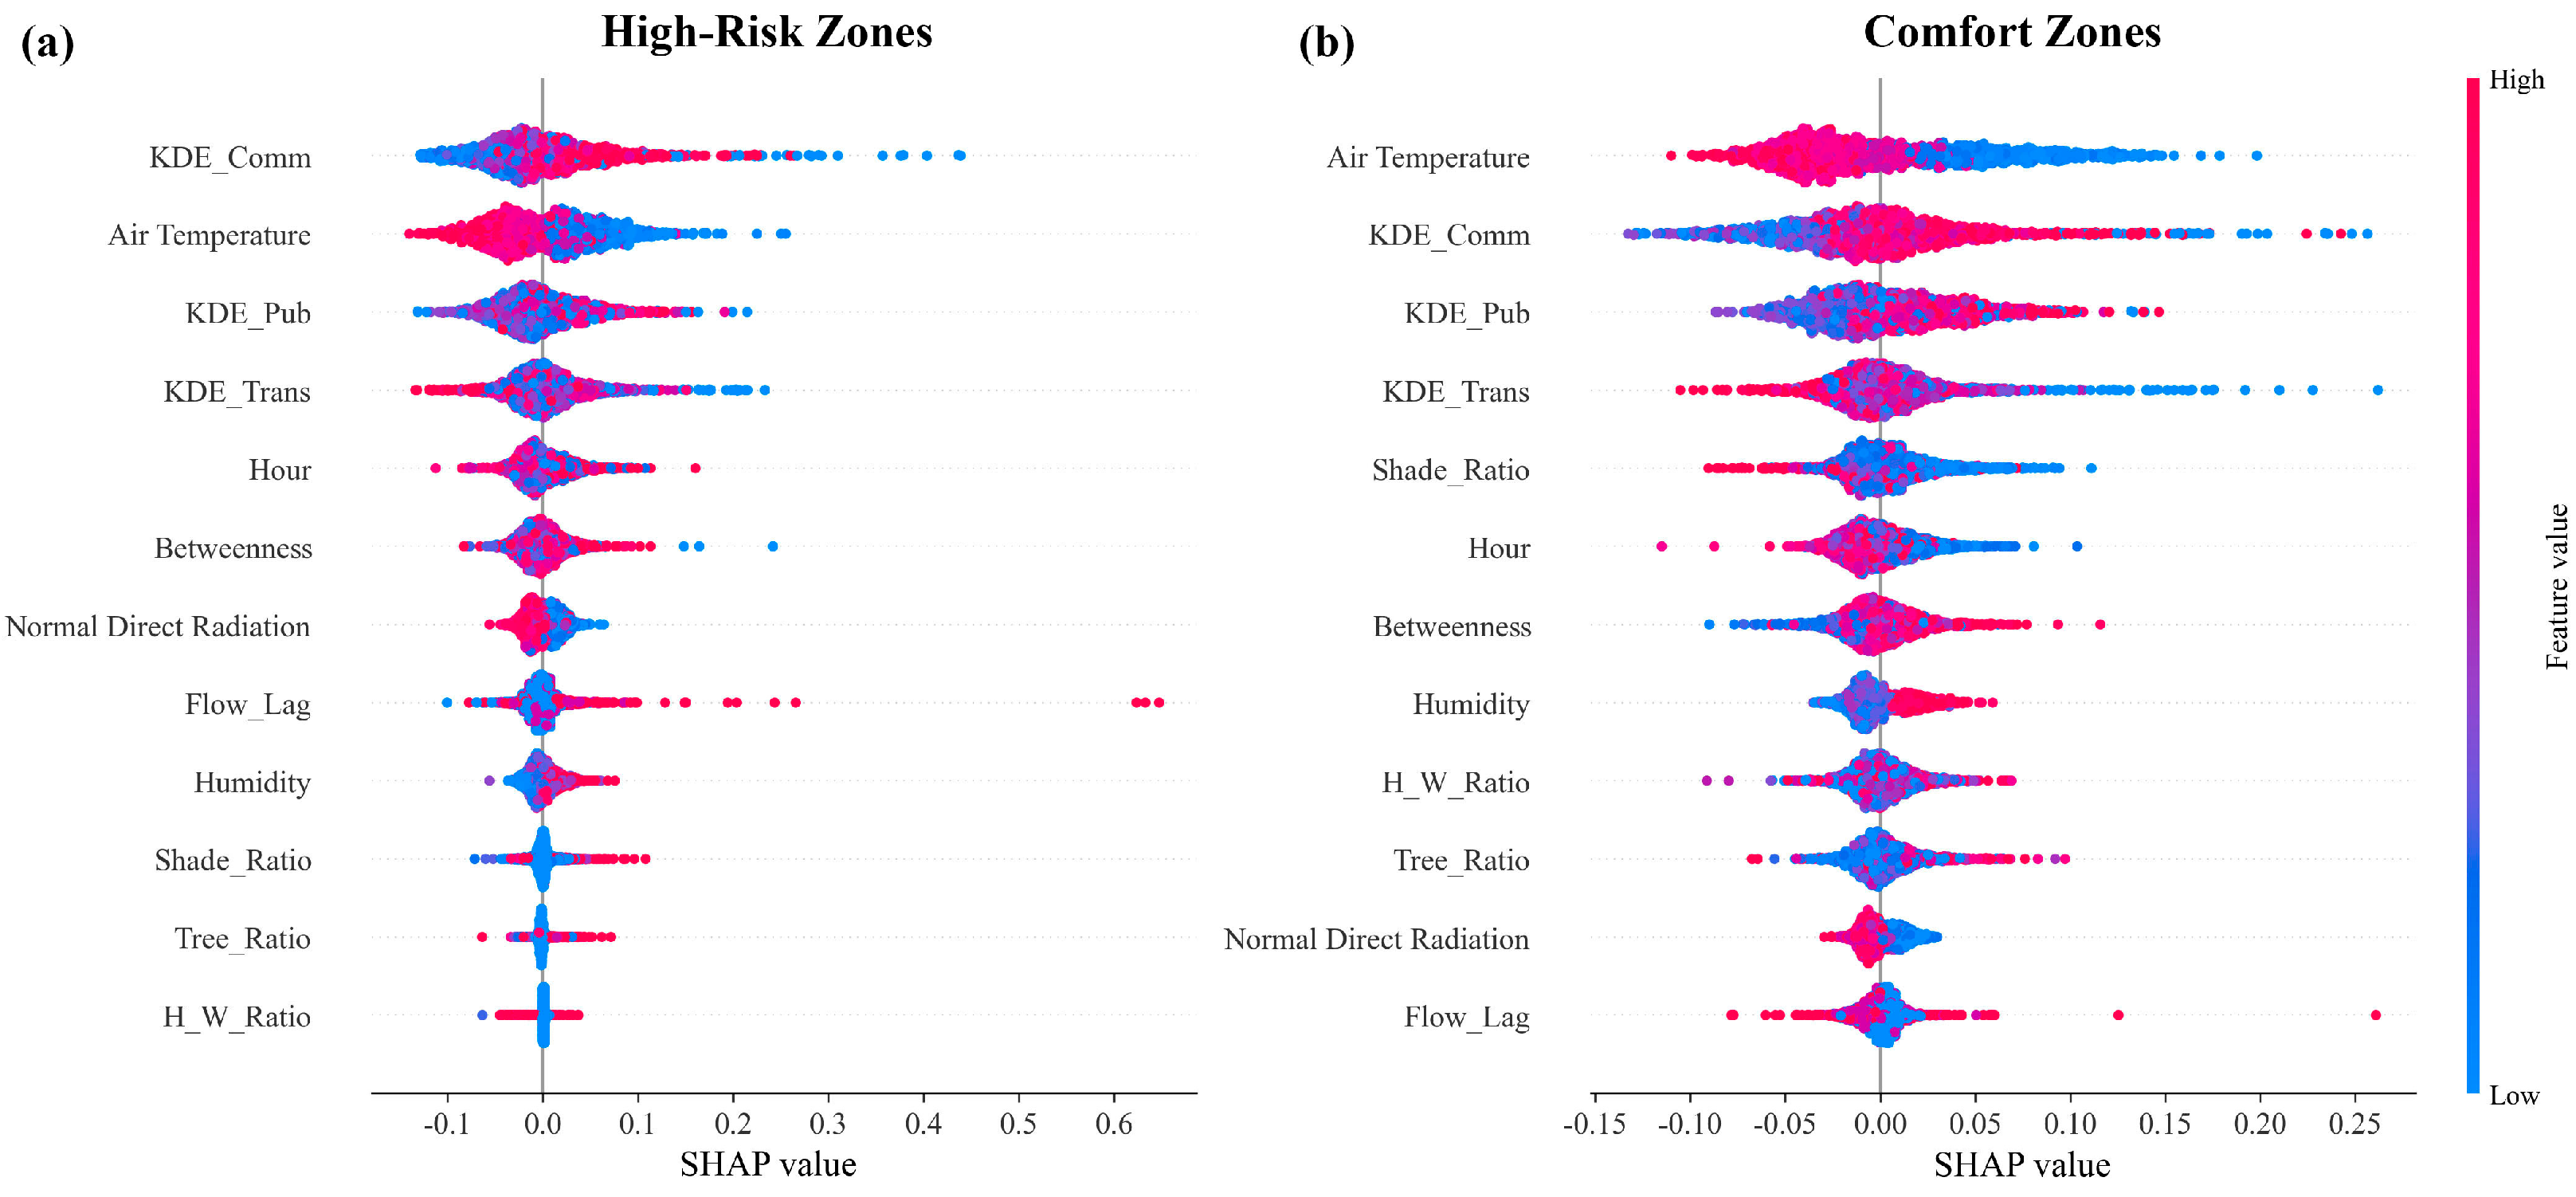
To quantitatively describe the non-linear contributions of individual urban environment features to the model outputs, the SHAP algorithm was employed. Figure 6 shows a global overview by ranking features based on their mean absolute SHAP values for both the high-risk and comfort zone models. To further explain the directional impact and distributional characteristics of these features, Figure 7 presents the SHAP summary plots (beeswarm plots). In these plots, each dot corresponds to a road segment sample, with color gradients indicating the feature value (red for high, blue for low), and the horizontal location along the x-axis signifying the magnitude and direction (positive or negative) of their influence on pedestrian flow.
Figure 6.
Feature importance percentage. (a): High-risk zones; (b): Comfort zones.
Figure 7.
SHAP summary plot. (a): High-risk zones; (b): Comfort zones.
For the high-risk zones, the feature importance ranking (Figure 6a) shows commercial density (KDE_Comm) as the most significant factor, contributing 19.6% to the overall explanatory power. The corresponding SHAP summary plot (Figure 7a) displays that it is a strong positive driver: road segments with high commercial density are densely clustered on the positive side of the x-axis, indicating that commercial activities are the main force drawing crowds into these high-risk areas. Air temperature ranks second (18.9%) in global importance, but unlike commercial density, its impact direction is negative (Figure 7a), implying that even in these busy zones, pedestrian flow is suppressed when thermal stress exceeds tolerance levels. Public service density (KDE_Pub) ranks third (13.7%) and also exhibits a positive correlation, reinforcing the finding that high-risk zones are fundamentally shaped by the aggregation of urban functions.
In the comfort zone model, the hierarchy of influencing factors shifts, showing a sensitivity to meteorological conditions and environmental quality. Air temperature is the main factor (19.3%, Figure 6b), with a negative impact pattern shown in the summary plot (Figure 7b), confirming that pedestrian flow in comfort zones is highly responsive to heat stress. While functional indicators such as KDE_Comm (15.8%) and KDE_Pub (12.7%) remain important, the relative contribution of morphological features increases. Notably, shade ratio (7.2%) and tree ratio (4.9%) demonstrate a more significant explanatory power in the comfort model compared to the high-risk zone model (where they contribute only 4.7% and 2.9%, respectively). In Figure 7, green infrastructure variables show that these ratios are less important in the function-driven road network.
4.3.3. Partial Dependency
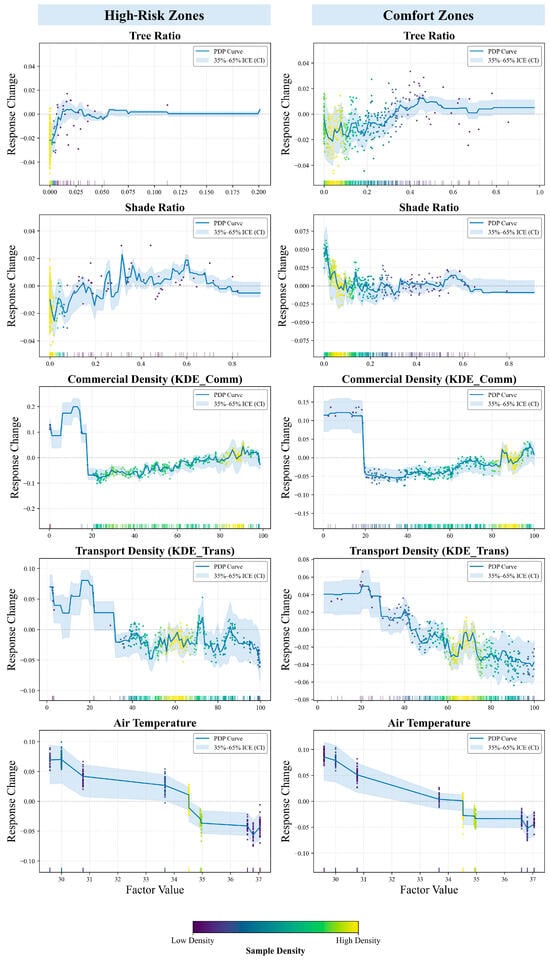
Partial Dependency Plots were employed to isolate the marginal effects of specific feature variables on pedestrian flow and to visualize the non-linear relationships within the model. The results reveal behavioral response patterns to environmental and functional factors between high-risk and comfort zones.
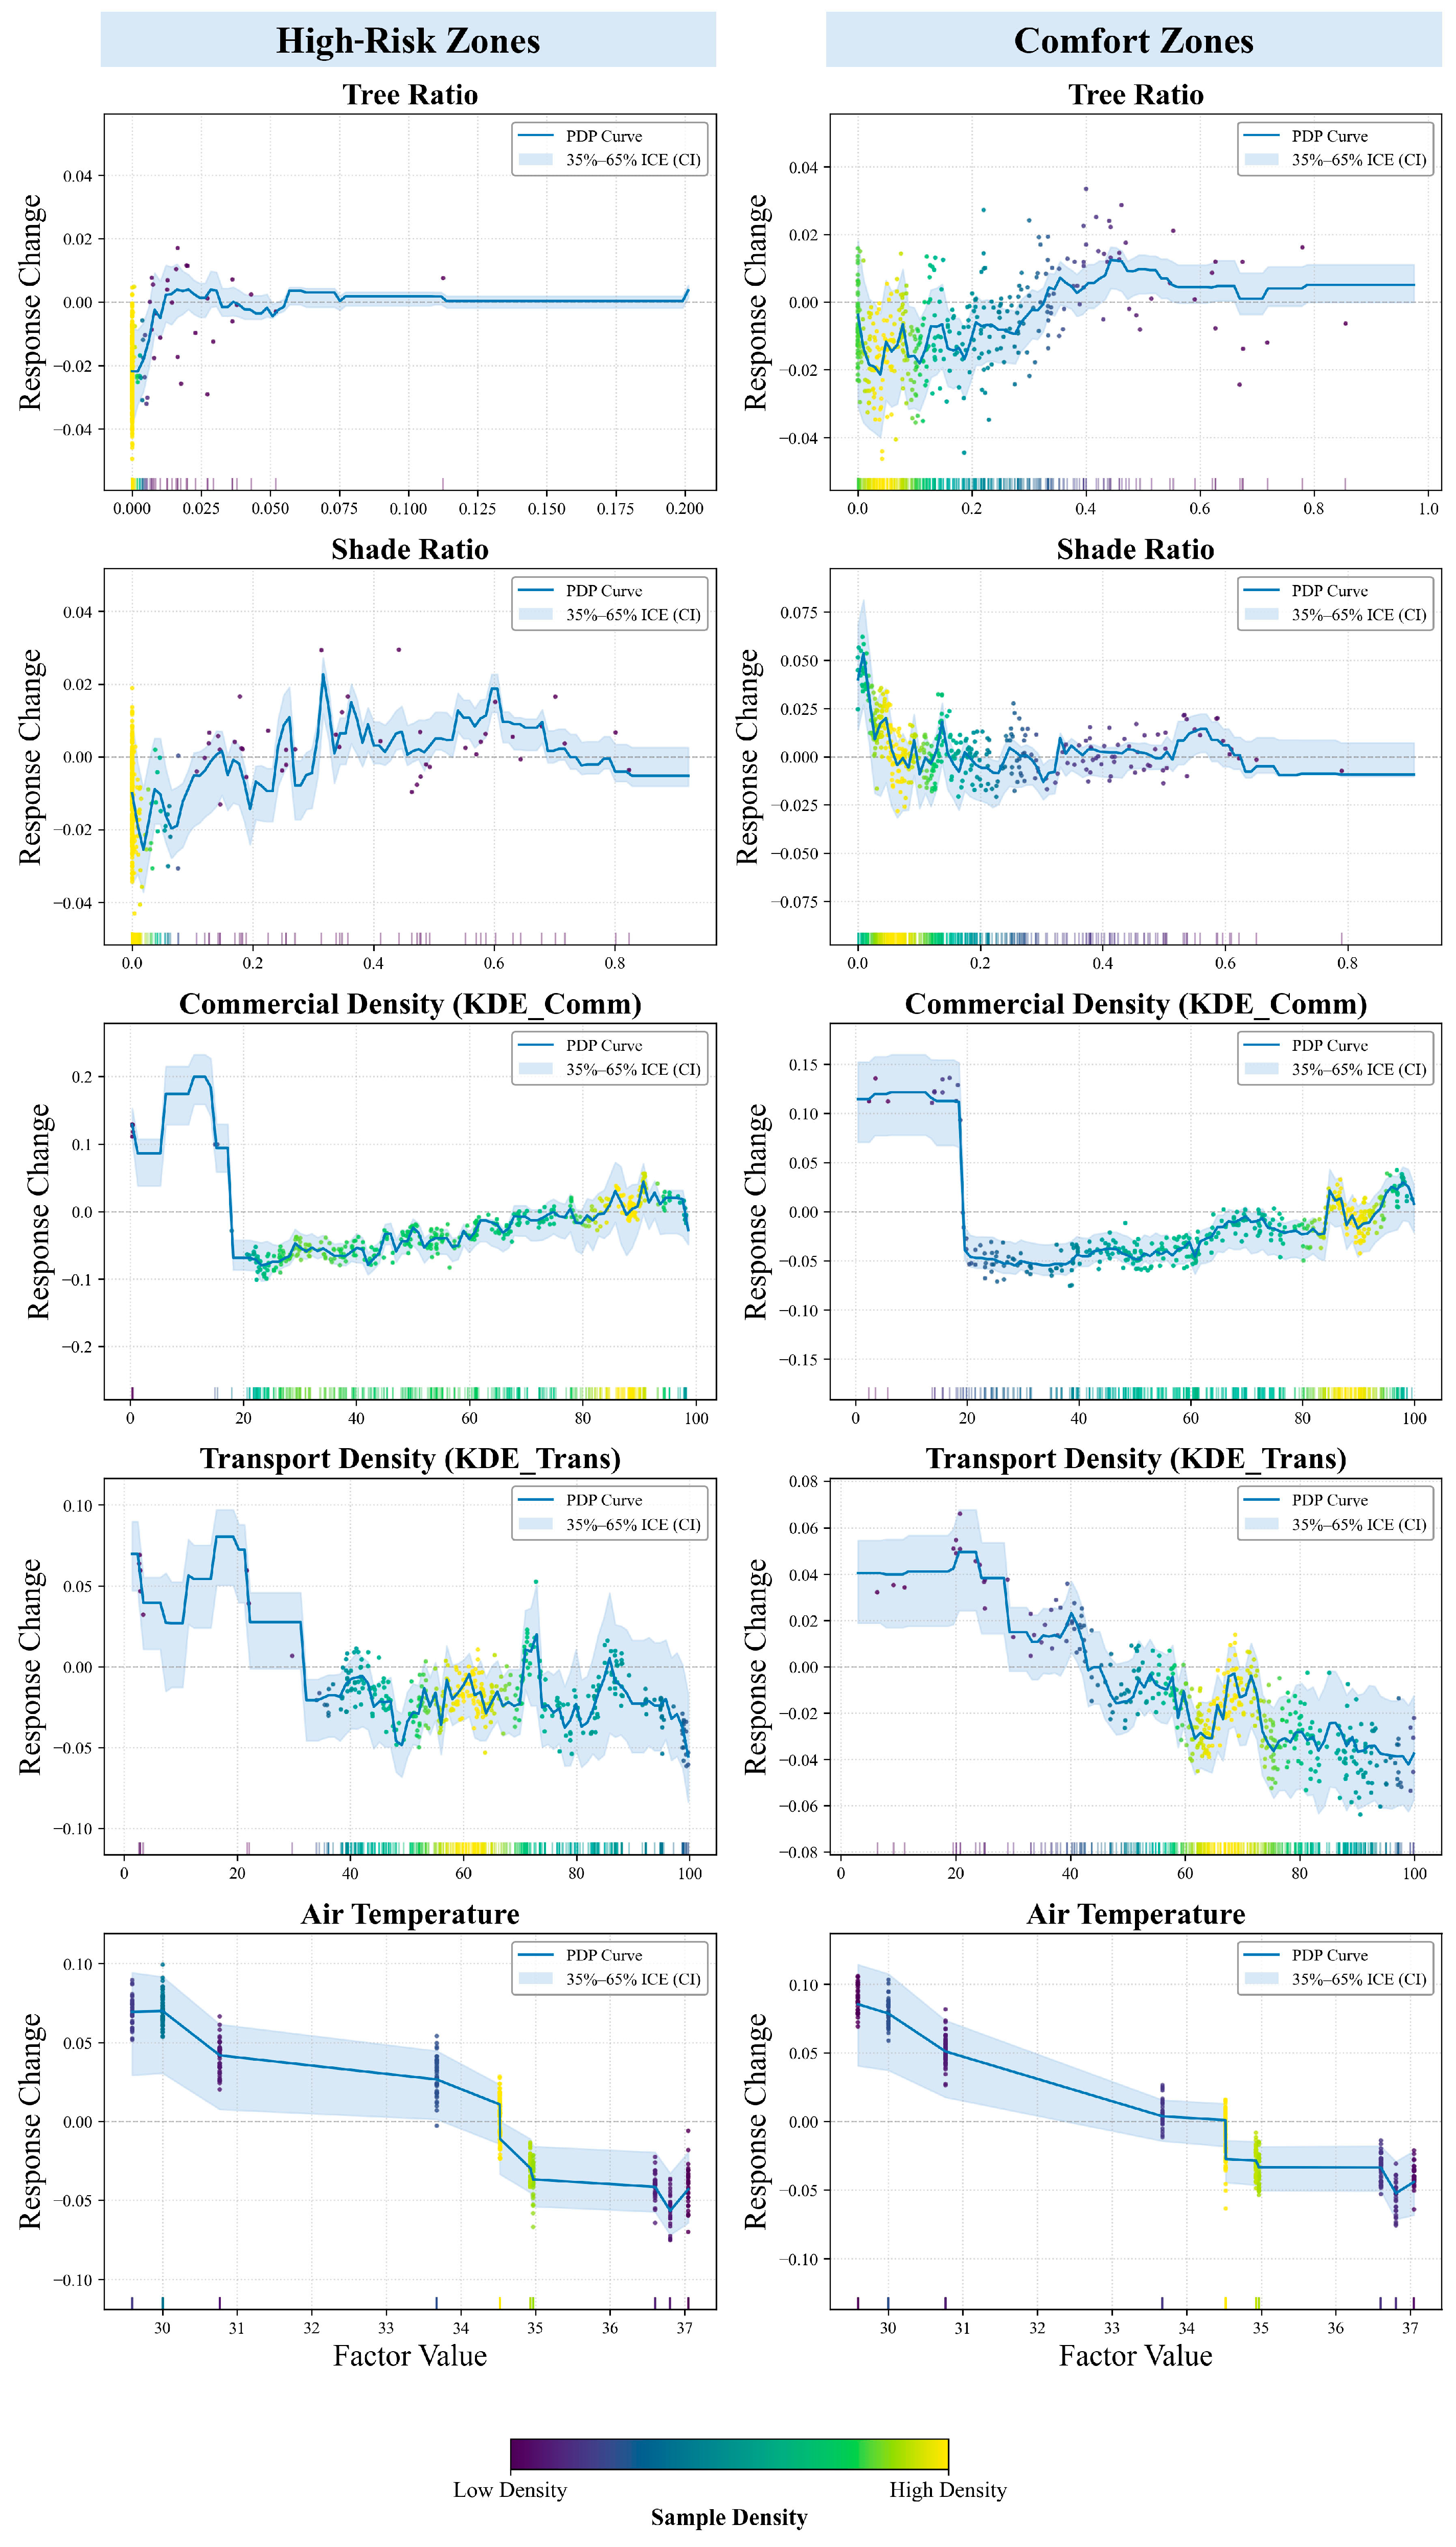
For green infrastructure variables, the response curves exhibit significant heterogeneity between the two zones. In high-risk zones, the tree ratio shows a sharp positive correlation within the limited range of 0 to 0.025, after which the curve flattens out and stabilizes near the zero axis. Conversely, the tree ratio in comfort zones demonstrates a sustained positive relationship, particularly when the ratio exceeds 0.20, indicating that higher greenery coverage in these areas actively promotes pedestrian flow. The shade ratio in high-risk zones displays a fluctuating upward trend until reaching a threshold of 0.60, whereas in comfort zones, the shade ratio exhibits a higher initial response value but declines rapidly as the ratio increases from 0 to 0.1, eventually stabilizing.
The functional variables demonstrate clear threshold effects across the urban network. Commercial density exhibits a similar pattern in both zones, characterized by a high positive response in the lower density range of 0 to 20 followed by a sharp decline. Beyond this threshold, in high-risk zones, the response curve exhibits frequent fluctuations as density increases, while comfort zones display a smoother and more continuous positive recovery trend. These fluctuations correspond to regions of sample sparsity. To clarify this data distribution, Figure 8 incorporates the 35%-to-65% Individual Conditional Expectation (ICE) range as a confidence interval, along with KDE gradients to illustrate sample density. Transport density demonstrates a positive impact in the 0-to-20 range for both zones, but beyond this threshold, the influence turns negative. In comfort zones, this negative correlation is more pronounced, with the response value continuously decreasing as transport density increases to 100.
Figure 8.
Partial dependency plot for key factors. The scattered dots represent the ICE values for individual samples, with their colors indicating the sample density (gradient from dark purple for low density to bright yellow for high density) as shown in the density scale bar.
The meteorological variable shows a consistent negative correlation with pedestrian flow across both spatial classifications. Air temperature shows a near-linear downward trend in the response curves. An empirical behavioral turning point is observable at approximately 34.5 °C. It is important to note that this value reflects local pedestrian response during this specific heatwave event. When the temperature exceeds this value, the negative impact on pedestrian flow intensifies significantly, indicated by a steeper downward slope in both high-risk and comfort zones.
5. Discussion
5.1. Supply and Demand Disparity Between Urban Shade Supply and Pedestrian Demand
This study reveals a significant disparity between the supply of urban shade and the demand for pedestrian thermal protection in Fuzhou’s central districts. Although the overall shade coverage in the city reaches an average of 16.51% during the early morning, and this protective layer contracts significantly during peak heat hours. More importantly, our quadrant classification identifies that high-risk zones, which accommodate the highest volume of pedestrian flow (mean daily flow = 28.6), suffer from a serious shortage of urban shade provision (mean daily coverage = 3.14%).
Despite supporting a similar level of pedestrian activity (mean daily flow = 26.7), comfort zones offer an average shade coverage of 17.10%, resulting in a 5.5-fold disparity in protective resources when compared with high-risk zones. This contrast highlights that the city’s thermal inequality is not a simple function of pedestrian density, but rather a consequence of the urban physical morphology. Furthermore, surplus zones reveal a clear disparity in street trees and shade resource allocation, as over 36% of the road network has the highest shade coverage (20.35%) but is rarely used by major transit flows (mean daily flow = 1.9). This indicates that although the city contains substantial thermal comfort resources, their spatial distribution does not coincide with areas of high pedestrian activity. The isolation of the top 27.2% of active roads, which mirrors the Pareto principle, confirms that serious thermal exposure risks are spatially localized within a specific 13.9% of the urban structure rather than uniformly distributed.
This finding is consistent with the thermal inequity phenomenon observed in other high-density Asian cities [14,37,66,67], as modern morphology characterized by impervious surfaces and sparse vegetation in urban centers intensifies thermal exposure risks. The concentration of thermal exposure in areas of frequent human activities indicates that the current urban form unintentionally exacerbates the public health burden caused by heatwaves, as the areas most important for economic and social vitality are also the most thermally extreme regions.
5.2. Pedestrian Flow Behavioral Drivers
The application of the XGBoost model and SHAP analysis provides new insights into the behavioral drivers within these disparate zones. The prominence of commercial density (KDE_Comm) as the primary factor behind pedestrian accumulation in high-risk zones (19.6% contribution) indicates that pedestrian movement in these areas is primarily associated with essential activity patterns. Pedestrians in these zones exhibit low sensitivity to thermal discomfort because their trips are functionally motivated by work, commuting, or essential services [68]. This pattern is further supported by public service density (KDE_Pub), which ranks third (13.7%) and shows a strong positive association.
However, the dominance of functional factors does not fully negate the impact of thermal stress on pedestrian activity. Air temperature remains the second most influential factor in high-risk zones (18.9%) and shows a consistent negative association with pedestrian activity. This indicates that although functional land use supports pedestrian presence, high temperatures still constrain pedestrian intensity and persistence. The comparable contributions of commercial density and air temperature suggest that pedestrian distribution in these areas is jointly shaped by functional demand and thermal conditions.
In contrast, the comfort zones are characterized by a higher sensitivity to environmental quality. Air temperature ascends to become the primary factor (19.3%), confirming that pedestrians in these areas are highly responsive to heat stress. Notably, morphological features like shade ratio (7.2%) and tree ratio (4.9%) demonstrate significantly higher explanatory power in comfort zones compared to high-risk zones (where they contribute 4.7% and 2.9%, respectively). This distinction supports the theory of adaptive thermal comfort in outdoor spaces: while people may tolerate heat stress for necessary tasks (high-risk zones), they actively seek cooler, greener environments for optional or recreational activities (comfort zones) [68,69]. This behavioral divergence is further evidenced by the model’s explanatory power (: 0.8568 vs. 0.7662). Statistical analysis reveals that comfort zones possess higher median densities of commercial (71.96) and public (48.94) POIs than high-risk zones (55.28 and 31.76). The higher spatial complexity in comfort zones accommodates diverse, optional activities, which increases data heterogeneity and reduces the overall explanatory power of the driving factors. Conversely, the lower POI density in high-risk zones dictates more targeted functional movements, generating a highly regular flow pattern. Consequently, high-risk areas maintain high pedestrian density during extreme heat, reflecting limited opportunities for exposure avoidance.
5.3. Non-Linear Thresholds and Thermal Environment Stress
Partial Dependence Plots (PDPs) reveal a local behavioral turning point at approximately 34.5 °C across both zone types for this specific heat event. Beyond this temperature, pedestrian flow declines sharply, indicating that severe thermal stress suppresses outdoor activity regardless of functional motivations. Pedestrian response to commercial density exhibits a threshold effect at a density of 20. Beyond this point, the response curve in high-risk zones fluctuates significantly, whereas comfort zones maintain a consistent positive trend. For transport density, a negative correlation emerges beyond a density of 20, which is significantly more pronounced in comfort zones than in high-risk zones. This indicates that pedestrian flow in comfort zones is more sensitive to traffic density, whereas functional needs in high-risk zones maintain activity despite denser conditions. Regarding green infrastructure, the positive effect of tree coverage flattens at a tree ratio of 0.025 in high-risk zones, indicating that small-scale greening is insufficient to stimulate pedestrian flow in thermally challenging street canyons. In comfort zones, a sustained positive response requires a tree ratio exceeding 0.20.
Analysis of the shade ratio demonstrates diminishing marginal effects. In high-risk zones, pedestrian flow increases steadily up to a shade ratio of 0.60. In comfort zones, the response stabilizes beyond a shade ratio of 0.1, showing that the behavioral benefit of additional shade is context-dependent. Furthermore, recent studies indicate a tendency toward behavioral thermal regulation in outdoor environments. Empirical and modeling investigations suggest that pedestrians actively detour to seek optimally shaded paths [70,71,72] and may increase their walking distances to avoid direct sun exposure [73]. However, our results show that such adaptive routing behavior is markedly constrained in Fuzhou’s high-risk zones. Despite a general preference for shade, functional necessities in these dense commercial corridors take precedence over thermal comfort, leading to unavoidable passive heat exposure.
5.4. Limitations and Future Works
While the integration of mobile signaling data and machine learning has effectively revealed the macroscopic patterns of thermal inequity, the interpretation of these results is subject to certain limitations. First, the pedestrian flow data is derived from mobile signaling records based on cellular base station positioning. Unlike high-precision GPS data, this method inevitably contains spatial offsets and signal drift [74]. Although the massive sample size helps capture macroscopic patterns at the city scale, these offsets may introduce uncertainties when matching individual trajectories to specific road segments. Second, our current dynamic shade simulation focuses on geometric accuracy through the use of a 1 m resolution canopy height model. This is currently the highest publicly available resolution data for calculating the physical height of urban trees. But this method involves a methodological compromise because it fails to account for characteristics like internal canopy density and tree species. In future evaluations, we should combine detailed urban tree inventories with canopy height models to address these uncertainties. Third, although we employed POI density to statistically infer the environmental drivers of flow distribution, the specific trip purpose for each individual trajectory remains indistinguishable. Additionally, our path reconstruction relies on the Dijkstra algorithm to determine the shortest topological distance. This approach does not incorporate alternative path selection or active shade preferences. So, it may not capture the adaptive detours of pedestrians who dynamically alter their routes to seek thermal comfort. Fourth, while the reconstructed sidewalk network showed a precision (85.14%) against the 0.5 m reference data, the remaining difference suggests a topological uncertainty. This discrepancy may be related to geometric inconsistencies introduced during the sidewalk reconstruction process, as well as to classification errors in the reference dataset. It should be noted that the reference data have a reported overall accuracy of 83.6% and therefore do not represent absolute ground truth. To further mitigate these spatial discrepancies, future works could integrate high-resolution remote sensing imagery or street visual data to assist in the precise reconstruction and direct verification of pedestrian sidewalks. Fifth, the methodological limitations regarding spatial dependence in our machine learning approach should be acknowledged. As a result, calculating the Global Moran’s I (using a K-Nearest Neighbors matrix, K = 4) on the model residuals revealed positive spatial autocorrelation in both the high-risk zones (Moran’s I = 0.6377, p = 0.001) and comfort zones (Moran’s I = 0.4653, p = 0.001). This indicates spatially embedded confounders. Additionally, the complex tree structure (max_depth = 12) used to capture non-linear behavioral thresholds carries a risk of local overfitting. Although we employed random cross-validation during the XGBoost hyperparameter tuning, our current framework does not strictly isolate spatial regions (e.g., spatial block cross-validation). Consequently, the reported R2 values and RMSEs are likely partially inflated by this underlying spatial dependence. Future research should integrate spatial lag variables into the machine learning framework or employ geographically weighted algorithms (e.g., Spatial Random Forest) to handle spatial autocorrelation and ensure robust predictive generalization across different urban contexts. Finally, this study focuses on a representative summer heatwave, when thermal exposure poses the greatest health risk. While urban shade can effectively reduce heat stress during extreme heat events, its effects may vary across seasons. In winter, excessive shading could potentially limit solar access and reduce thermal comfort. Future work could evaluate these seasonal effects to support more comprehensive urban climate adaptation.
6. Conclusions
This study develops a framework to examine the interactions between urban thermal environments and human mobility. By shifting the analytical focus from static thermal exposure to dynamic pedestrian flows, we identified a pronounced supply and demand disparity in Fuzhou’s central districts. The results show that thermal exposure risks are not randomly distributed but are concentrated in specific high-risk zones, where rigid functional demand coincides with insufficient shade provision.
Our findings provide three key implications for urban climate resilience. First, thermal inequity is amplified by mobility, which is largely constrained by functional necessity in commercial areas. In these contexts, pedestrians are compelled to tolerate high thermal stress, resulting in a form of passive exposure that cannot be alleviated through behavioral adaptation alone. Second, the identification of a behavioral tolerance threshold at about 34.5 °C, together with scale-related performance limits for green infrastructure, such as a tree ratio threshold of 0.20 in comfort zones, may provide quantifiable rules for targeted design. Third, the surplus zones identified through the quadrant analysis reveal inefficiencies in resource allocation, indicating that existing cooling capacity remains spatially disconnected from areas with high pedestrian activity.
In conclusion, mitigating urban thermal exposure risk requires a shift from simply increasing overall urban shade coverage toward optimizing the alignment between shade provision and pedestrian demand across space and time. This research provides a scalable approach to identify intervention priorities and supports the strategic deployment of limited cooling resources to protect vulnerable pedestrian flows.
Author Contributions
Conceptualization, F.Y. and W.C.; methodology, F.Y. and W.C.; software, W.C.; formal analysis, F.Y. and W.C.; resources, F.Y. and J.Y.; writing—original draft preparation, W.C.; writing—review and editing, F.Y. and W.C.; funding acquisition, F.Y. All authors have read and agreed to the published version of the manuscript.
Funding
This research was funded by the Natural Science Foundation of China (No. 42171079) and the Guangxi Science and Technology Major Project (No. GuangxiAA24263011).
Data Availability Statement
Data will be made available on request.
Acknowledgments
We sincerely thank the Google Earth Engine team and the European Centre for Medium-Range Weather Forecasts (ECMWF) for providing free and open-access datasets. We also sincerely thank internal and external reviewers for their insights, which helped improve the manuscript.
Conflicts of Interest
The authors declare no conflicts of interest.
Appendix A
Appendix A.1. Spatial Accuracy of the Reconstructed Sidewalk
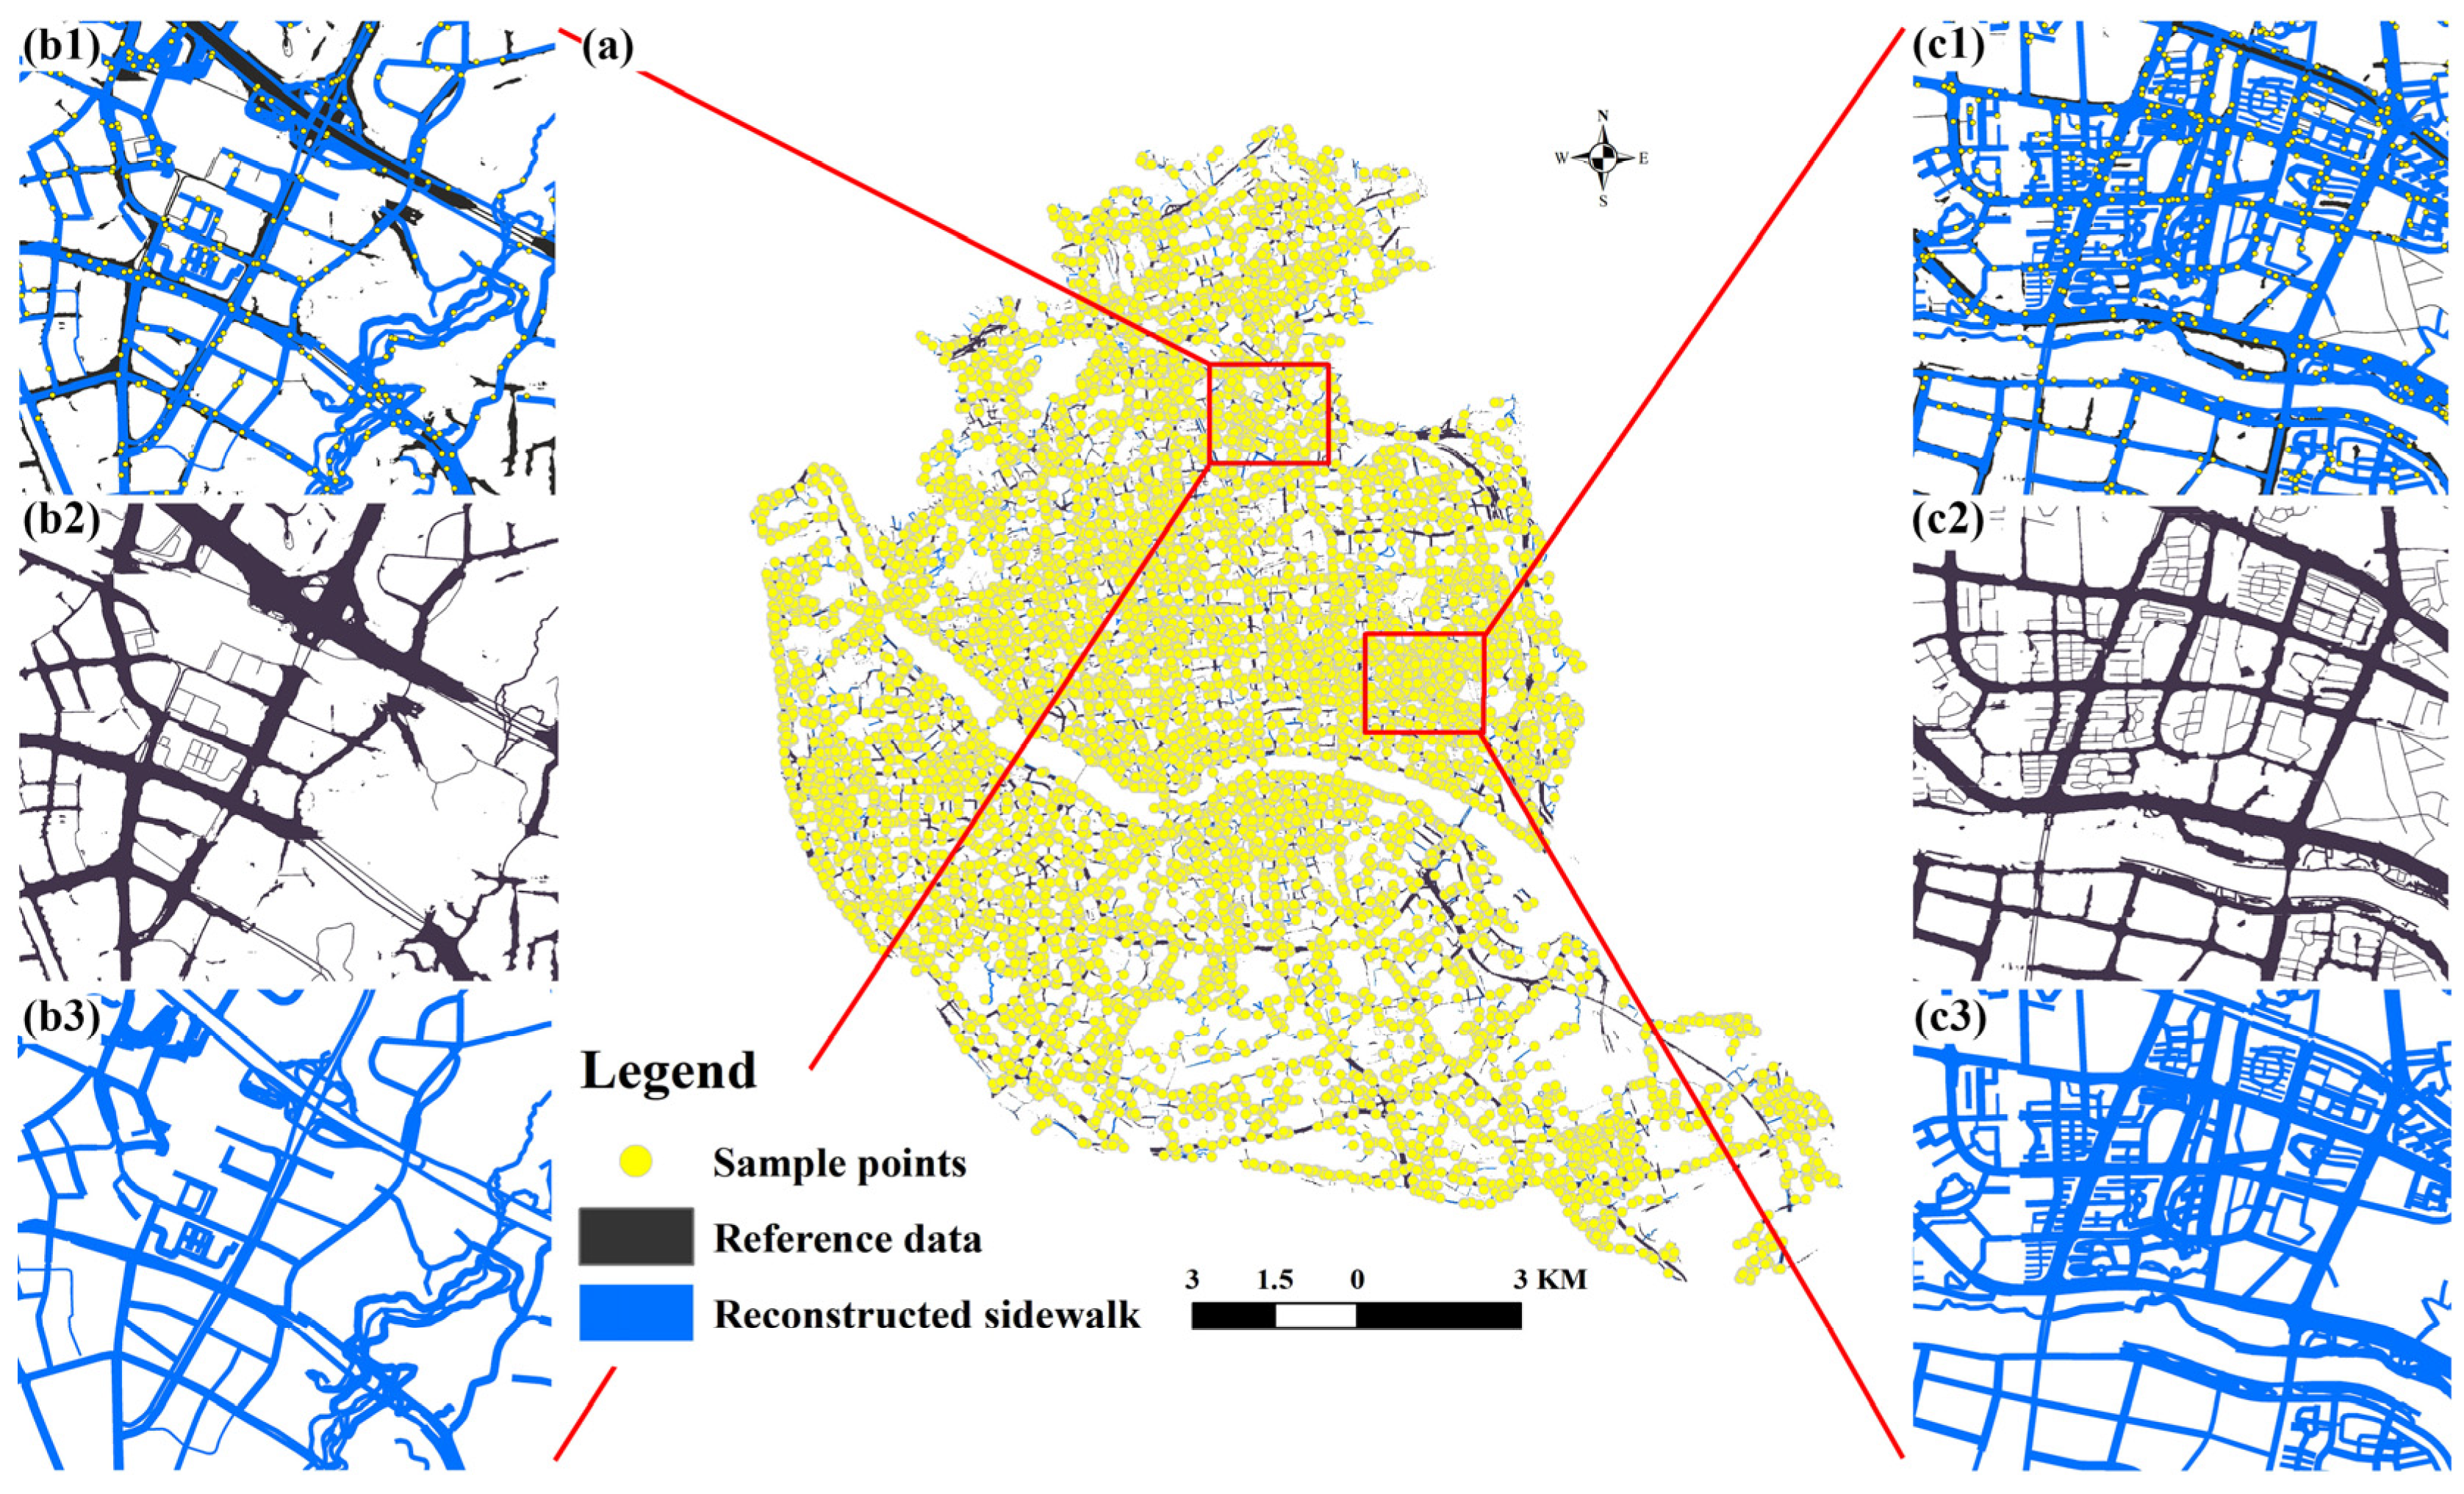
Before evaluating the performance of the XGBoost model, the spatial reliability of the reconstructed sidewalk network was assessed. The spatial point sampling analysis produced a mapping precision of 89.14%, corresponding to 8914 valid matches out of 10,000 samples. This level of accuracy suggests a reasonable correspondence between the reconstructed sidewalk and the reference dataset. Based on this, the reconstructed sidewalk network is considered suitable for subsequent modeling of pedestrian flows and urban thermal conditions.
Appendix A.2. Reliability of Sidewalk Reconstruction
The spatial validation of the reconstructed sidewalk network showed a precision of 89.14% (8914 valid matches). It should be noted that an approximate 11% discrepancy remains, even though the 0.5 m reference data was used as the baseline for validation. Visualization of the validation results (Figure A1) suggests that this difference should not be attributed solely to reconstruction errors. Parts of the mismatch appear to stem from the limitations of reference data derived from remote sensing imagery.
In dense urban areas, road extraction based on optical remote sensing is often affected by tree canopies and building shades. As a result, the reference sidewalk network appears fragmented and discontinuous in some areas (see Figure A1(b2,c2)). By contrast, the geometry reconstruction approach used in this study builds on the topological structure of OSM centerlines and incorporates a street canyon identification procedure, which helps maintain network continuity.
Compared with the reference dataset, the reconstructed network maintains better topological continuity (Figure A1(b3,c3)), which supports the simulation of continuous shade effects during extreme heat events. In addition, the vector-based sampling strategy adopted in this study avoids the pixel-level extraction procedures commonly used in deep learning approaches. This reduces computational demands and facilitates application across different urban areas.
Figure A1.
Spatial validation and comparison of the reconstructed sidewalk. (a): Distribution of the 10,000 random sampling points across the study area; (b1–b3,c1–c3): Detailed spatial comparisons between the reconstructed sidewalk and the 0.5 m reference data.
References
- Yang, Z.; Zhang, W.; Gao, W.; Li, R. Improving thermal comfort using personalized local conditioning: A large-scale retrospective questionnaire survey conducted during a heatwave in China. Sustain. Cities Soc. 2024, 117, 105972. [Google Scholar] [CrossRef] [Scilit]
- Martinez-Villalobos, C.; Fu, D.; Loikith, P.C.; Neelin, J.D. Accelerating increase in the duration of heatwaves under global warming. Nat. Geosci. 2025, 18, 716–723. [Google Scholar] [CrossRef] [Scilit]
- He, M.; Liu, H.; Xiong, F.; Fang, Z.; Feng, X.; Li, B.; Kosonen, R. On the assessment of dynamic thermal comfort and pedestrian psychophysiological responses during heatwaves: A focused analysis. Build. Environ. 2025, 277, 112943. [Google Scholar] [CrossRef] [Scilit]
- Wu, X.; Wang, J.; Ge, Y.; Lai, S.; Zhang, D.; Ren, Z.; Wang, J. Future heat-related mortality in Europe driven by compound day-night heatwaves and demographic shifts. Nat. Commun. 2025, 16, 7420. [Google Scholar] [CrossRef] [Scilit]
- Qi, J.; Mazumdar, S.; Vasconcelos, A.C. Understanding the Relationship between Urban Public Space and Social Cohesion: A Systematic Review. Int. J. Community Well-Being 2024, 7, 155–212. [Google Scholar] [CrossRef] [Scilit]
- Sharifi, E.; Boland, J. Heat Resilience in Public Space and Its Applications in Healthy and Low Carbon Cities. Procedia Eng. 2017, 180, 944–954. [Google Scholar] [CrossRef] [Scilit]
- Abuwaer, N.; Ullah, S.; Vinodhkumar, B.; Al-Ghamdi, S.G. Walkability under the influence of extreme temperatures: The impact of climate change on outdoor thermal discomfort in Saudi Arabia. City Environ. Interact. 2025, 28, 100241. [Google Scholar] [CrossRef] [Scilit]
- Kumar, P.; Debele, S.E.; Khalili, S.; Halios, C.H.; Sahani, J.; Aghamohammadi, N.; Andrade, M.d.F.; Athanassiadou, M.; Bhui, K.; Calvillo, N.; et al. Urban heat mitigation by green and blue infrastructure: Drivers, effectiveness, and future needs. Innovation 2024, 5, 100588. [Google Scholar] [CrossRef] [Scilit]
- Yin, Y.; Li, S.; Xing, X.; Zhou, X.; Kang, Y.; Hu, Q.; Li, Y. Cooling Benefits of Urban Tree Canopy: A Systematic Review. Sustainability 2024, 16, 4955. [Google Scholar] [CrossRef] [Scilit]
- Paroni, K.-A.; Sykiotis, S.; Bakalos, N.; Temenos, A.; Kyriakidis, C.; Doulamis, A.; Doulamis, N. Explainable AI Toward Data-Driven Policymaking for Urban Heat Island Climate Adaptation. Land 2026, 15, 62. [Google Scholar] [CrossRef] [Scilit]
- Park, Y.; Zhao, Q.; Guldmann, J.-M.; Wentz, E.A. Quantifying the cumulative cooling effects of 3D building and tree shade with high resolution thermal imagery in a hot arid urban climate. Landsc. Urban Plan. 2023, 240, 104874. [Google Scholar] [CrossRef] [Scilit]
- Zhang, C.; Yang, Y.; Yu, L. Assessing urban surface thermal environment and heat health risk in Chinese cities: A twenty-year study. Urban Clim. 2025, 59, 102304. [Google Scholar] [CrossRef] [Scilit]
- Hu, K.; Yang, X.; Zhong, J.; Fei, F.; Qi, J. Spatially Explicit Mapping of Heat Health Risk Utilizing Environmental and Socioeconomic Data. Environ. Sci. Technol. 2017, 51, 1498–1507. [Google Scholar] [CrossRef] [Scilit] [PubMed]
- Ngarambe, J.; Santamouris, M.; Yun, G.Y. The impact of urban warming on the mortality of vulnerable populations in Seoul. Sustainability 2022, 14, 13452. [Google Scholar] [CrossRef] [Scilit]
- Lo, Y.E.; Vosper, E.; Higgins, J.P.; Howard, G. Heat impacts on human health in the Western Pacific Region: An umbrella review. Lancet Reg. Health West. Pac. 2024, 42, 100952. [Google Scholar] [CrossRef] [Scilit]
- Park, C.Y.; Thorne, J.H.; Hashimoto, S.; Lee, D.K.; Takahashi, K. Differing spatial patterns of the urban heat exposure of elderly populations in two megacities identifies alternate adaptation strategies. Sci. Total Environ. 2021, 781, 146455. [Google Scholar] [CrossRef] [Scilit]
- Lee, J.; Dessler, A.E. Improved surface urban heat impact assessment using GOES satellite data: A comparative study with ERA-5. Geophys. Res. Lett. 2024, 51, e2023GL107364. [Google Scholar] [CrossRef] [Scilit]
- Pereira, E.B.; Gonçalves, A.R.; Costa, R.S.; Bezerra, F.G.S. An explicitly spatial approach to identify heat vulnerable urban areas and landscape patterns. Urban Clim. 2021, 40, 101021. [Google Scholar] [CrossRef] [Scilit]
- Sun, Y.; Li, Y.; Ma, R.; Gao, C.; Wu, Y. Mapping urban socio-economic vulnerability related to heat risk: A grid-based assessment framework by combing the geospatial big data. Urban Clim. 2022, 43, 101169. [Google Scholar] [CrossRef] [Scilit]
- Manware, M.; Dubrow, R.; Carrión, D.; Ma, Y.; Chen, K. Residential and race/ethnicity disparities in heat vulnerability in the United States. GeoHealth 2022, 6, e2022GH000695. [Google Scholar] [CrossRef] [Scilit]
- Clark, A.; Grineski, S.; Curtis, D.S.; Cheung, E.S.L. Identifying groups at-risk to extreme heat: Intersections of age, race/ethnicity, and socioeconomic status. Environ. Int. 2024, 191, 108988. [Google Scholar] [CrossRef] [Scilit]
- D’Ambrosio, V.; Di Martino, F.; Miraglia, V. A GIS-based framework to assess heatwave vulnerability and impact scenarios in urban systems. Sci. Rep. 2023, 13, 13073. [Google Scholar] [CrossRef] [Scilit]
- Stein, M.; Nitschke, L.; Trost, L.; Dirschauer, A.; Deffner, J. Impacts of commuting practices on social sustainability and sustainable mobility. Sustainability 2022, 14, 4469. [Google Scholar] [CrossRef] [Scilit]
- Zou, Y.; Chen, J.; Li, H. Dynamic Heat Exposure Risk Assessment of Urban Residents Based on SOLWEIG Model: A Case Study of Chengdu Central City. Trop. Geogr. 2025, 45, 1799–1814. [Google Scholar] [CrossRef]
- Sun, Z.; Zhang, X.; Li, Z.; Liang, Y.; An, X.; Zhao, Y.; Miao, S.; Han, L.; Li, D. Heat exposure assessment based on high-resolution spatio-temporal data of population dynamics and temperature variations. J. Environ. Manag. 2024, 349, 119576. [Google Scholar]
- Vasilikou, C.; Nikolopoulou, M. Outdoor thermal comfort for pedestrians in movement: Thermal walks in complex urban morphology. Int. J. Biometeorol. 2020, 64, 277–291. [Google Scholar] [CrossRef] [Scilit] [PubMed]
- Zhang, J.; Yao, X.; Chen, Y.; Lin, M.; Lin, T.; Zheng, Y.; Geng, H.; Zheng, Y.; Wu, X.; Zhang, G. Spatiotemporal dynamic mapping of heat exposure risk for different populations in city based on hourly multi-source data. Sustain. Cities Soc. 2024, 107, 105454. [Google Scholar] [CrossRef] [Scilit]
- Foroutan, E.; Hu, T.; Zhang, F.; Yu, H. Assessing heat vulnerability in Philadelphia using geographically weighted principal component analysis (GWPCA): A geospatial big data-driven approach. Int. J. Appl. Earth Obs. Geoinf. 2024, 127, 103653. [Google Scholar] [CrossRef] [Scilit]
- Zhang, Y.; Xia, X.; Zhang, Y.; Jian, L. Mobilities in the heat: Identifying travel-related urban heat exposure and its built environment drivers using remote sensing and mobility data in Chengdu, China. ISPRS Int. J. Geo-Inf. 2025, 14, 372. [Google Scholar]
- Wang, T.; Xu, T.; Wang, H.; Kang, J.; Qiu, L.; Wang, Z.; Xue, S.; Fang, Z. Depicting human mobility across functional zones to elevate urban heat exposure management—A case study of Shenzhen, China. Cities 2026, 171, 106729. [Google Scholar] [CrossRef] [Scilit]
- Wei, B.; Su, G.; Liu, F. Dynamic assessment of spatiotemporal population distribution based on mobile phone data: A Case Study in Xining City, China. Int. J. Disaster Risk Sci. 2023, 14, 649–665. [Google Scholar] [CrossRef] [Scilit]
- Che, Y.; Li, X.; Liu, X.; Wang, Y.; Liao, W.; Zheng, X.; Zhang, X.; Xu, X.; Shi, Q.; Zhu, J.; et al. 3D-GloBFP: The first global three-dimensional building footprint dataset. Earth Syst. Sci. Data 2024, 16, 5357–5374. [Google Scholar] [CrossRef] [Scilit]
- Basu, R.; Colaninno, N.; Alhassan, A.; Sevtsuk, A. Hot and bothered: Exploring the effect of heat on pedestrian route choice behavior and accessibility. Cities 2024, 155, 105435. [Google Scholar] [CrossRef] [Scilit]
- Yang, X.; Sun, H.; Huang, Y.; Fang, K. A framework of community pedestrian network design based on urban network analysis. Buildings 2022, 12, 819. [Google Scholar] [CrossRef] [Scilit]
- Cao, Q.; Tourre, V.; Leduc, T.; Servières, M. Integrating functional accessibility and pedestrian environmental comfort: A spatially explicit framework for urban walkability evaluation. Environ. Plan. B Urban Anal. City Sci. 2026, 23998083251413000. [Google Scholar] [CrossRef] [Scilit]
- Oukawa, G.Y.; Krecl, P.; Targino, A.C. Fine-scale modeling of the urban heat island: A comparison of multiple linear regression and random forest approaches. Sci. Total Environ. 2022, 815, 152836. [Google Scholar] [CrossRef] [Scilit] [PubMed]
- Jia, S.; Wei, D.; Zhang, R.; Kong, F.; Wang, Y. An ANN-based framework for mapping urban tree cooling and exposure inequality in a high-density city: A case study of Hong Kong. Urban For. Urban Green. 2026, 116, 129227. [Google Scholar] [CrossRef] [Scilit]
- Zhang, J.; Zheng, Y.; Qi, D.; Li, R.; Yi, X.; Li, T. Predicting citywide crowd flows using deep spatio-temporal residual networks. Artif. Intell. 2018, 259, 147–166. [Google Scholar] [CrossRef] [Scilit]
- He, J.; Shi, Y.; Xu, L.; Lu, Z.; Feng, M.; Tang, J.; Guo, X. Exploring the scale effect of urban thermal environment through XGBoost model. Sustain. Cities Soc. 2024, 114, 105763. [Google Scholar] [CrossRef] [Scilit]
- Ma, Z.; Guo, Q.; Yang, F.; Chen, H.; Li, W.; Lin, L.; Zheng, C. Recent Changes in Temperature and Precipitation of the Summer and Autumn Seasons over Fujian Province, China. Water 2021, 13, 1900. [Google Scholar] [CrossRef] [Scilit]
- Rui, Q.; Cheng, H. Quantifying the spatial quality of urban streets with open street view images: A case study of the main urban area of Fuzhou. Ecol. Indic. 2023, 156, 111204. [Google Scholar] [CrossRef] [Scilit]
- Tolan, J.; Yang, H.-I.; Nosarzewski, B.; Couairon, G.; Vo, H.V.; Brandt, J.; Spore, J.; Majumdar, S.; Haziza, D.; Vamaraju, J.; et al. Very high resolution canopy height maps from RGB imagery using self-supervised vision transformer and convolutional decoder trained on aerial lidar. Remote Sens. Environ. 2024, 300, 113888. [Google Scholar] [CrossRef] [Scilit]
- Dijkstra, E.W. A note on two problems in connexion with graphs. Numer. Math. 1959, 1, 269–271. [Google Scholar] [CrossRef] [Scilit]
- Huang, Y.; Yang, X.; Yue, J. Urban street bicycle flow analysis based on multi-scale geographically weighted regression model. J. Tsinghua Univ. (Sci. Technol.) 2022, 62, 1132–1141. [Google Scholar] [CrossRef]
- Wolf, H.; Vierø, A.R.; Szell, M. CoolWalks for active mobility in urban street networks. Sci. Rep. 2025, 15, 14911. [Google Scholar] [CrossRef] [Scilit] [PubMed]
- Kolaxidis, N.; Ludwig, C.; Knoblauch, S.; Fürle, J.; Foshag, K.; Fendrich, S.; Lautenbach, S.; Zipf, A. Mitigating Heat Stress by Reducing Solar Exposure in Pedestrian Routing. Trans. GIS 2025, 29, e70110. [Google Scholar] [CrossRef] [Scilit]
- Da, L.; Chhibba, R.; Jaiswal, R.; Middel, A.; Wei, H. Shaded Route Planning Using Active Segmentation and Identification of Satellite Images. In Proceedings of the 33rd ACM International Conference on Information and Knowledge Management, Boise, ID, USA, 21–25 October 2024; pp. 5205–5209. [Google Scholar]
- Foshag, K.; Fürle, J.; Ludwig, C.; Fallmann, J.; Lautenbach, S.; Rupp, S.; Burst, P.; Betsch, M.; Zipf, A.; Aeschbach, N. How to assess the needs of vulnerable population groups towards heat-sensitive routing? An evidence-based and practical approach to reducing urban heat stress. Erdkunde 2024, 78, 1–33. [Google Scholar] [CrossRef] [Scilit]
- Wang, H.; Zhang, Y.F.; Xu, L.L.; Jiang, C.M. Step rate-determined walking intensity and walking recommendation in Chinese young adults: A cross-sectional study. BMJ Open 2013, 3, e001801. [Google Scholar] [CrossRef] [Scilit]
- Schlosser, I.; Maureira, V.; Milton, R.; Arcaute, E.; Batty, M. Active-travel modelling: A methodological approach to networks for walking and cycling commuting analysis. J. Phys. Complex. 2025, 6, 025013. [Google Scholar] [CrossRef] [Scilit]
- Daghash, F.; Anabtawi, R.; Byon, Y.-J.; Alawadi, K. Exploring the Limitations of Pedestrian Route Directness: A Correlation between Sensitivity and Radius Variability. Buildings 2023, 13, 2612. [Google Scholar] [CrossRef] [Scilit]
- Loo, B.P.Y.; Lian, T.; Frank, L.D. Walking (In)Convenience: An In-Depth Study of Pedestrian Detours to Daily Facilities. J. Am. Plan. Assoc. 2024, 90, 742–757. [Google Scholar] [CrossRef] [Scilit]
- Rhoads, D.; Rames, C.; Solé-Ribalta, A.; González, M.C.; Szell, M.; Borge-Holthoefer, J. Sidewalk networks: Review and outlook. Comput. Environ. Urban Syst. 2023, 106, 102031. [Google Scholar] [CrossRef] [Scilit]
- de Moraes Vestena, K.; Philippi Camboim, S.; Rodrigues dos Santos, D. OSM Sidewalkreator: A QGIS plugin for an automated drawing of sidewalk networks for OpenStreetMap. Eur. J. Geogr. 2023, 14, 66–84. [Google Scholar] [CrossRef] [Scilit]
- Hosseini, M.; Sevtsuk, A.; Miranda, F.; Cesar, R.M.; Silva, C.T. Mapping the walk: A scalable computer vision approach for generating sidewalk network datasets from aerial imagery. Comput. Environ. Urban Syst. 2023, 101, 101950. [Google Scholar] [CrossRef] [Scilit]
- GB 55011-2021; Project Code for Urban Road and Transportation Engineering. MOHURD: Beijing, China, 2021.
- Chatzidimitriou, A.; Yannas, S. Street canyon design and improvement potential for urban open spaces; the influence of canyon aspect ratio and orientation on microclimate and outdoor comfort. Sustain. Cities Soc. 2017, 33, 85–101. [Google Scholar] [CrossRef] [Scilit]
- Chen, X.; Han, M.; He, J.; Ma, H.; Han, M.; Liu, Y.; Wu, X. Integrated effect of aspect ratio and tree spacing on pedestrian thermal comfort of street canyon. Int. J. Biometeorol. 2024, 68, 2115–2131. [Google Scholar] [CrossRef] [Scilit] [PubMed]
- Yang, L.; Ren, J.; Yang, Y.; Pan, J. Multi-Flow Network Characteristics of Cities in China under the Rescaling Perspective. Econ. Geogr. 2021, 41, 48–58. [Google Scholar] [CrossRef]
- Xu, A.; Shi, J.; Feng, H.; Meng, X. Connection of cold-wet islands to mitigate urban thermal risk. Sustain. Cities Soc. 2026, 137, 107143. [Google Scholar] [CrossRef] [Scilit]
- Qian, Z.; Liu, Q.; Huang, D. Three Scales and Planning Trends of 15-Minute Life Circle. Urban Plan. Int. 2022, 37, 63–70. [Google Scholar] [CrossRef]
- Zhang, E.; Huang, X.; Li, J.; Zhou, J. EcoVision: Submeter Land Cover Map over China’s 42 Major Cities Derived by an Innovative Artificial Data Annotation Engine. J. Remote Sens. 2025, 5, 811. [Google Scholar] [CrossRef] [Scilit]
- Jeon, G.; Park, Y.; Guldmann, J.-M. Impacts of Urban Morphology on Seasonal Land Surface Temperatures: Comparing Grid- and Block-Based Approaches. ISPRS Int. J. Geo-Inf. 2023, 12, 482. [Google Scholar] [CrossRef] [Scilit]
- Wang, J.; Meng, F.; Fu, P.; Jin, F. Investigating the Coupling of Supply and Demand for Urban Blue and Green Spaces’ Cooling Effects in Shandong, China. Atmosphere 2023, 14, 404. [Google Scholar] [CrossRef] [Scilit]
- Pareto, V. Cours D’économie Politique; Librairie Droz: Carouge, Switzerland, 1896. [Google Scholar]
- Lou, S.; Feng, C.; Zhang, D.; Zou, Y.; Huang, Y. Heat exposure inequalities in Hong Kong from 1981 to 2021. Urban Clim. 2024, 56, 102087. [Google Scholar] [CrossRef] [Scilit]
- Liu, F.; Hou, H.; Murayama, Y. Spatial interconnections of land surface temperatures with land cover/use: A case study of Tokyo. Remote Sens. 2021, 13, 610. [Google Scholar] [CrossRef] [Scilit]
- Lee, S.; Yoo, C.; Seo, K.W. Determinant Factors of Pedestrian Volume in Different Land-Use Zones: Combining Space Syntax Metrics with GIS-Based Built-Environment Measures. Sustainability 2020, 12, 8647. [Google Scholar] [CrossRef] [Scilit]
- Jia, S.; Wang, Y.; Wong, N.H.; Chen, W.; Ding, X. Influences of the thermal environment on pedestrians’ thermal perception and travel behavior in hot weather. Build. Environ. 2022, 226, 109687. [Google Scholar] [CrossRef] [Scilit]
- Bolívar-Anillo, H.J.; Vega Benites, S.; Reyes Almeida, G.; Ortega Llanos, S.d.J.; Taba-Charris, V.; Acuña-Ruiz, K.A.; Reales Vargas, B.S.; Chapuel Aguillón, P.F.; Sánchez Moreno, H.; Iglesias-Navas, M.A.; et al. Addressing Increased Temperatures in Cities: Determination of Pedestrian Routes with Thermal Comfort in Barranquilla, Colombia. Sustainability 2025, 17, 5211. [Google Scholar] [CrossRef] [Scilit]
- Vartholomaios, A. Follow the shade: Detection of optimally shaded pedestrian paths within the historic city center of Thessaloniki. IOP Conf. Ser. Earth Environ. Sci. 2023, 1196, 012070. [Google Scholar] [CrossRef] [Scilit]
- Peng, F.; Xiong, Y.; Zou, B. Identifying the optimal travel path based on shading effect at pedestrian level in cool and hot climates. Urban Clim. 2021, 40, 100988. [Google Scholar] [CrossRef] [Scilit]
- Melnikov, V.R.; Christopoulos, G.I.; Krzhizhanovskaya, V.V.; Lees, M.H.; Sloot, P.M.A. Behavioural thermal regulation explains pedestrian path choices in hot urban environments. Sci. Rep. 2022, 12, 2441. [Google Scholar] [CrossRef] [Scilit]
- Tian, H.; Cai, H.; Hu, L.; Qiang, Y.; Zhou, B.; Yang, M.; Lin, B. Unveiling community adaptations to extreme heat events using mobile phone location data. J. Environ. Manag. 2024, 366, 121665. [Google Scholar] [CrossRef] [Scilit] [PubMed]

Disclaimer/Publisher’s Note: The statements, opinions and data contained in all publications are solely those of the individual author(s) and contributor(s) and not of MDPI and/or the editor(s). MDPI and/or the editor(s) disclaim responsibility for any injury to people or property resulting from any ideas, methods, instructions or products referred to in the content. |
© 2026 by the authors. Licensee MDPI, Basel, Switzerland. This article is an open access article distributed under the terms and conditions of the Creative Commons Attribution (CC BY) license.