


Abstract
Rapid coastal urbanization increases exposure to multiple hazards while intensifying competition for land essential for safe emergency refuge. This paper proposes a reproducible decision-support framework for planning Disaster Prevention and Relief Accessible Green Spaces (DPRAGS). The framework integrates four components that are usually treated separately: GIS-based multi-hazard risk assessment, tiered green-space suitability screening, phase-specific refuge supply and demand, and accessibility- and capacity-aware location assessment using a Gaussian two-step floating catchment area (Ga2SFCA) model and a capacity-constrained maximal-coverage formulation. The contribution lies in this integration rather than in any individual method. The framework specifies the data architecture, a restrictive multi-hazard eligibility rule, the accessibility and allocation equations, a single tier-specific demand-coverage metric applied to four nested models (M1–M4), and the expert and local inputs that an application must document. Its application is illustrated conceptually using Nantong, China; no empirical hazard, accessibility, allocation, or coverage results for Nantong are reported. Generating and validating these outputs with the identified public datasets and locally elicited expert inputs is the next applied step. What transfers to other cities is the decision architecture and analytical sequence; parameters, thresholds, and demand estimates must be specified locally.
1. Introduction
1.1. Background and Planning Context
Rapid urbanization concentrates people and infrastructure in coastal and riverine corridors—precisely the areas most exposed to flooding, seismic shaking, urban fire, and geological instability. As these areas grow denser, land becomes scarcer, more valuable, and more contested—and the open space needed to absorb a disaster’s effects becomes harder to secure. That space is essential for evacuation, temporary shelter, emergency staging, on-site relief operations, and, eventually, longer-term recovery. Urban green spaces hold a unique place here: beyond their recreational and environmental benefits, parks, squares, and other open spaces can provide the unobstructed, comparatively safe area that emergency refuge requires—linking disaster-risk reduction directly to sustainable land use and green-infrastructure planning [1,2,3,4,5]. A recurring difficulty is that the spatial distribution of refuge-capable green space seldom coincides with the spatial pattern of risk and population need. Planning practice has often treated refuge demand as spatially homogeneous, relied on static population totals, or assessed green-space provision independently of hazard exposure and of the transport network over which people must travel. Under these assumptions, a city can report an adequate aggregate quantity of open space while particular districts—typically dense, older, or physically constrained ones—remain critically underserved in the first hours and days after an event [6,7]. Aggregate provision is therefore a weak proxy for resilience; what matters is whether usable refuge capacity is reachable from where people are, under the hazards each site is itself exposed to.
1.2. Research Problem and Need for an Integrated Framework
Geographic information systems have advanced the individual components of this problem. Multi-criteria suitability analysis combining the Analytic Hierarchy Process (AHP), TOPSIS, and weighted overlay has been used to rank candidate refuge sites; floating catchment area methods have improved the measurement of spatial accessibility; and facility-location models have optimized the siting of shelters and emergency resources [8,9,10,11,12]. These strands are frequently applied in isolation; however, suitability studies may not test reachability, accessibility studies may not constrain supply by capacity, and optimization studies may not screen candidates against multi-hazard exposure. A framework that connects all four—where risk concentrates, which green spaces stay usable, how demand differs across response phases, and whether the resulting network is reachable over the real network—remains uncommon, and reproducible, openly sourced implementations are rarer still [13,14].
1.3. Research Questions, Contribution, and Sustainability Relevance
This paper addresses three questions. (RQ1) How can multi-hazard exposure, green-infrastructure suitability, network accessibility, and capacity constraints be combined in a single, reproducible planning workflow? (RQ2) How should refuge demand and supply be represented across immediate, short-to-medium-term, and long-term response phases rather than by one city-wide value? (RQ3) How can the marginal contribution of hazard screening, accessibility, and capacity constraints be evaluated relative to a conventional area-based planning approach?
1.4. What This Paper Contributes and Why It Matters
The contribution is methodological and threefold. C1: An integrated, tiered framework coupling multi-hazard exposure, suitability, accessibility, and capacity-constrained allocation for long-term (LTRGS), short-to-medium-term (SMTRGS), and emergency (ERGS) refuge green spaces. C2: A phase-specific representation of demand and supply, with distinct spatial thresholds, service radii, and per capita requirements by tier. C3: A reproducible specification—built on a publicly accessible data architecture, documented expert inputs and parameters, a common tier-specific demand-coverage outcome across M1–M4, and a nested model comparison—so that the effect of each added component can be assessed transparently and independently reproduced.
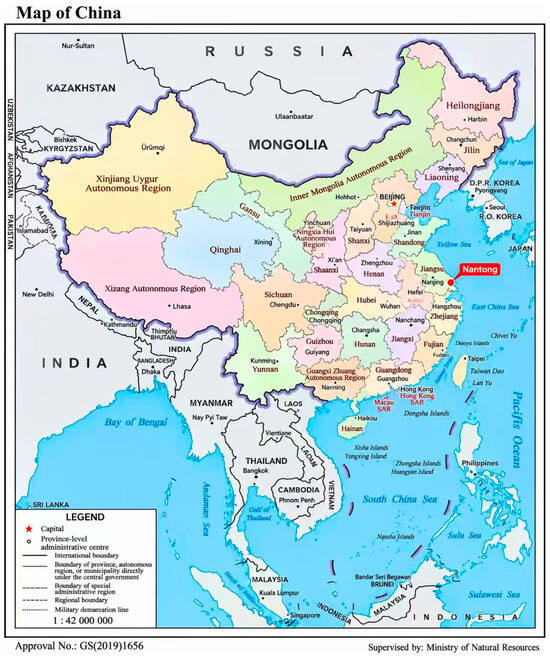
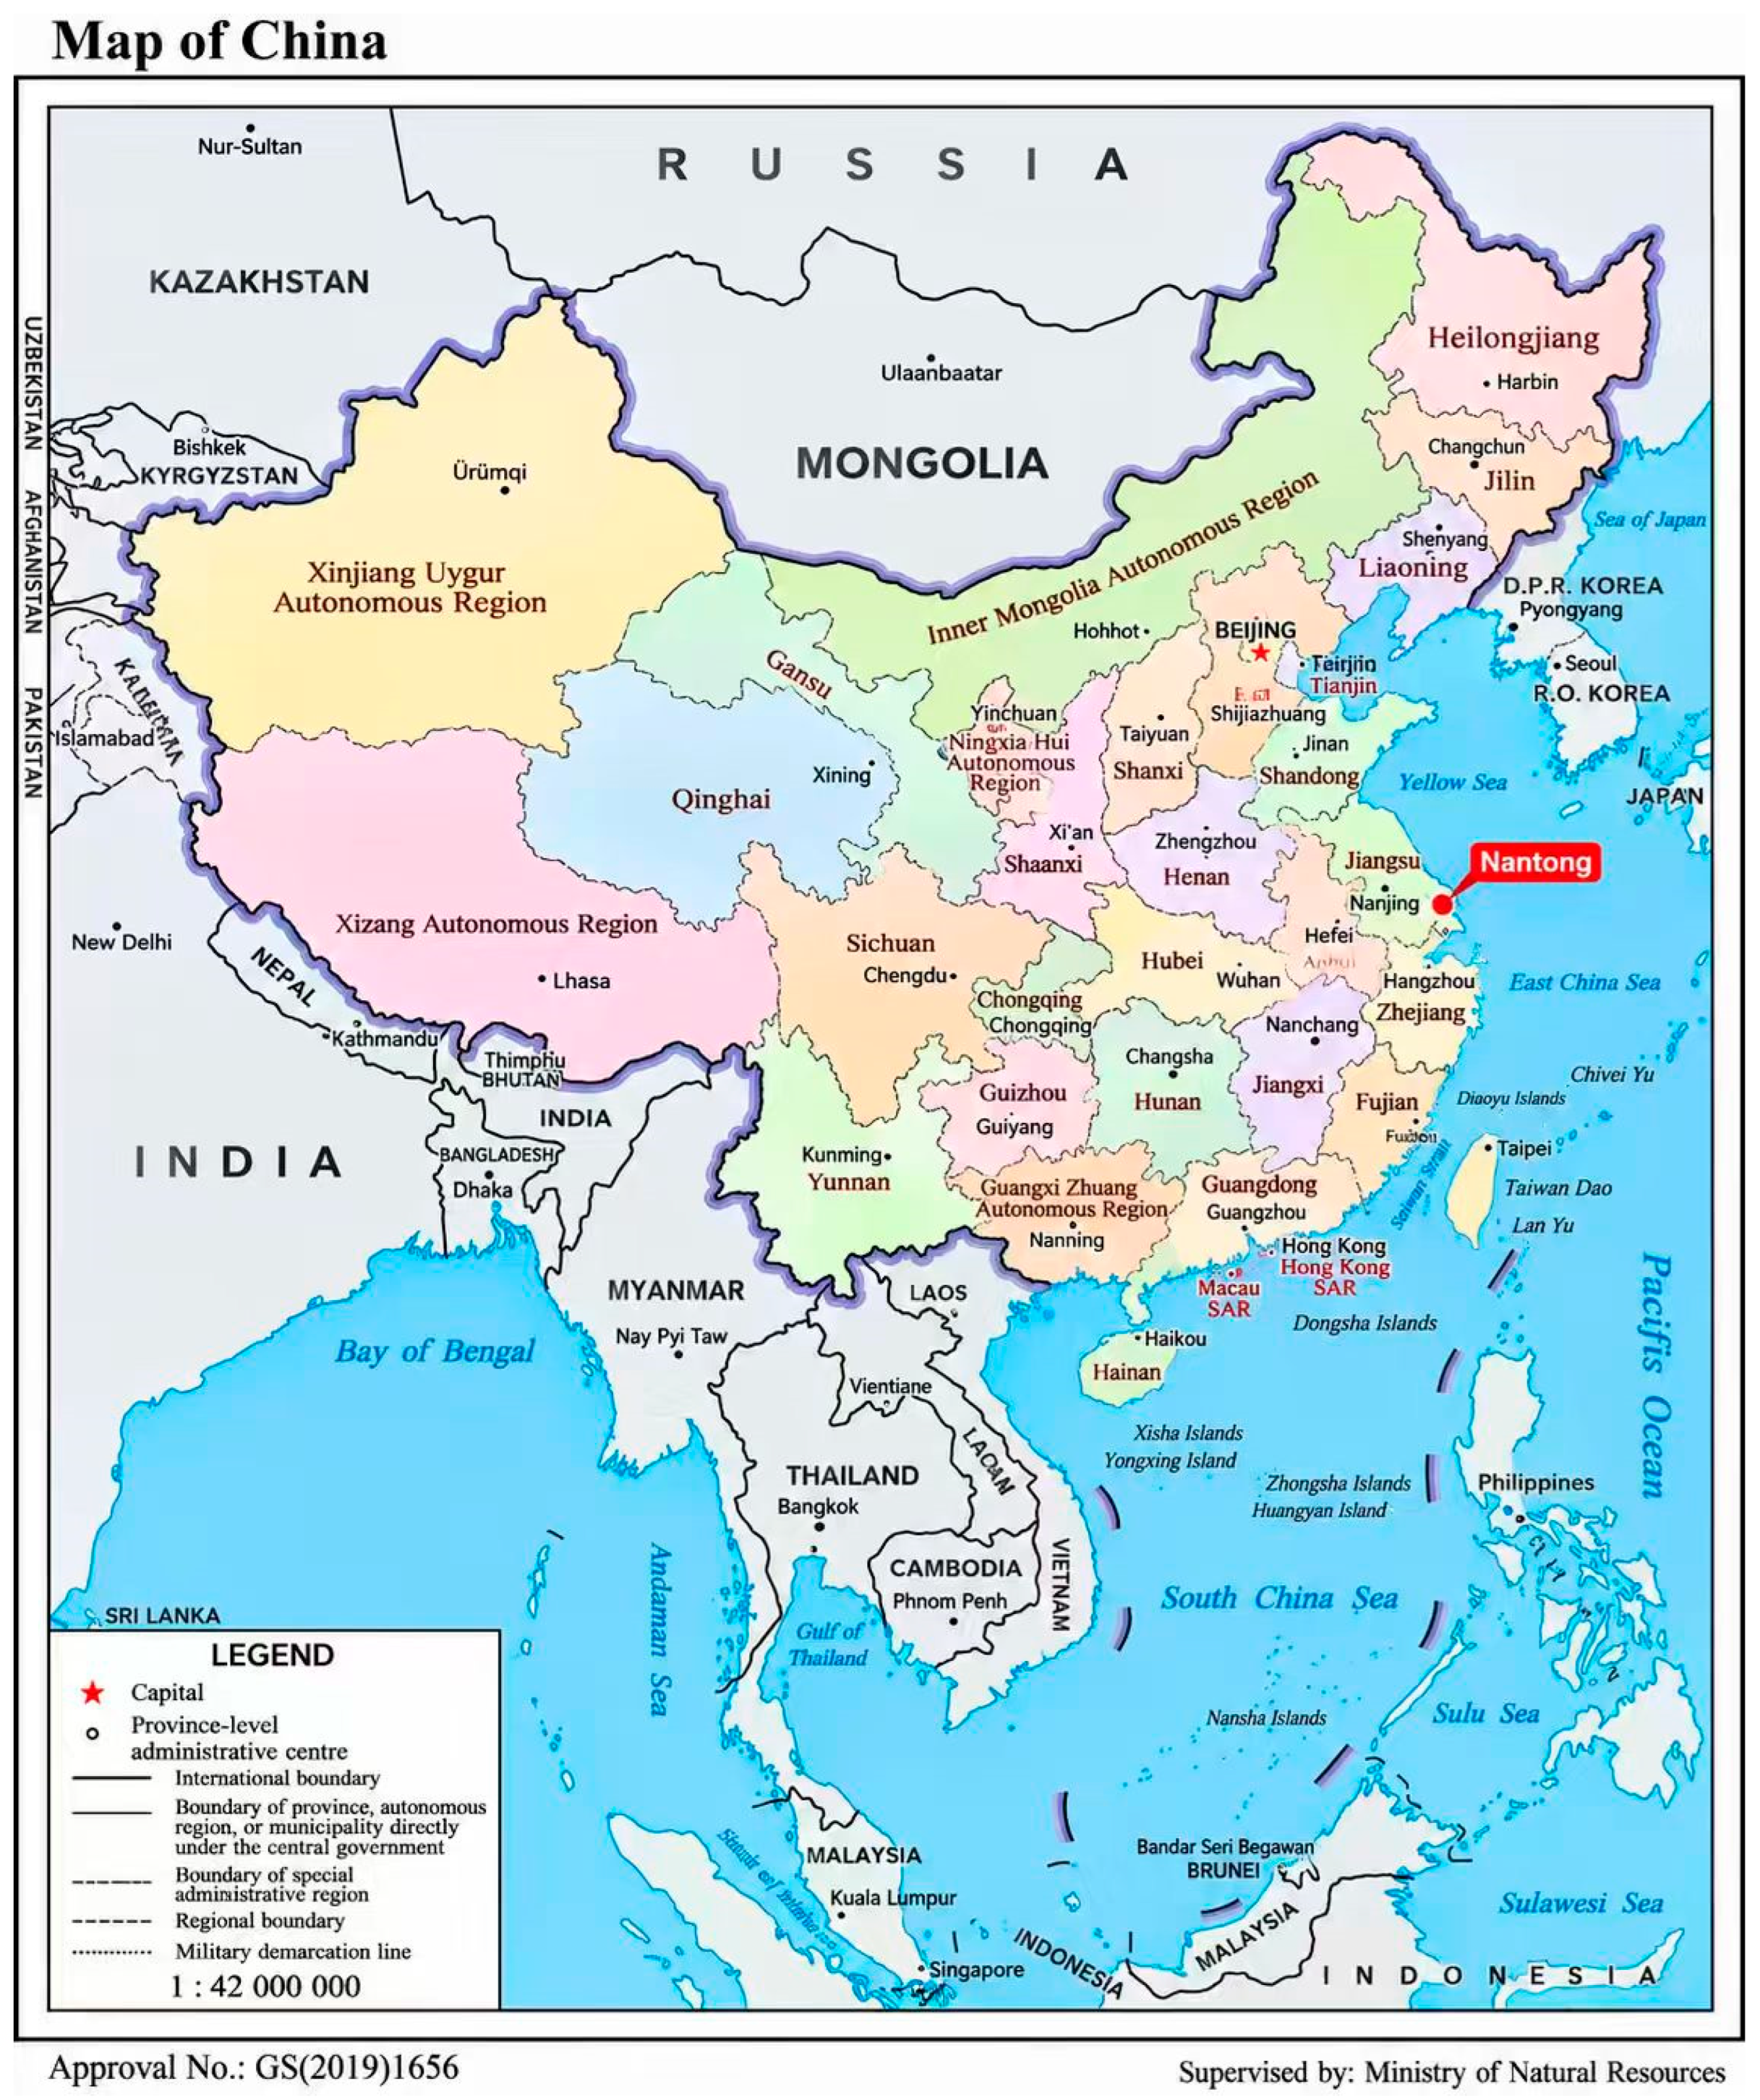
The framework is explicitly aligned with the Sustainable Development Goals: SDG 11.5 (reduce disaster losses), SDG 11.7 (safe, inclusive, and accessible green and public spaces), SDG 11.b (integrated disaster-risk reduction consistent with the Sendai Framework), and SDG 13.1 (resilience and adaptive capacity). It treats refuge green space as multifunctional infrastructure whose value depends on a combination of spatial equity, risk sensitivity, and cost-efficient use of scarce urban land [2,14,15]. The location of Nantong within China is shown in Figure 1.
Figure 1.
Location of Nantong, Jiangsu Province, China. Base map source: Ministry of Natural Resources of China standard map (Approval No. GS(2019)1656); Nantong location marker added by the authors.
2. Related Work and Research Positioning
2.1. Reproducibility Challenges in Refuge and Shelter Planning
Uneven reproducibility is an additional challenge that cuts across all three lines of work. Many refuge and shelter studies depend on proprietary datasets, undocumented parameter choices, or bespoke processing steps that hinder independent reproduction; results often cannot be compared across cities or used to verify claims of transferability [8,13]. A framework explicitly built on open data, documented parameters, and archived analysis scripts addresses this problem directly, because each analytical step can be re-run, audited, and adapted by other researchers.
2.2. Multi-Criteria Suitability and Site Selection
Studies of planning for refuge and shelter have developed along three largely independent lines; a major premise of this paper is that their separation represents a limitation. The first line concerns site suitability and selection, typically through multi-criteria decision analysis. Weighted overlay, the Analytic Hierarchy Process (AHP), and similar approaches have been widely used to rank potential shelter or refuge sites based on area, slope, hazard exposure, and proximity to services [8]. Recent applications have refined these methods for emergency shelters and refuge green spaces in different urban contexts, combining suitability scoring with layout optimization, while fuzzy or multi-criteria variants have been used for similar facilities such as fire stations [11,16,17,18]. These studies lay out rigorous rules for testing whether a site is fundamentally appropriate, but they often stop short of testing whether the populations that would rely on such sites can actually reach them, or whether their total capacity meets demand.
2.3. Spatial Accessibility Assessment
The second line concerns spatial accessibility. The two-step floating catchment area (2SFCA) family of methods and its distance-decay refinements have become standard tools for measuring how easily populations can reach services over a network [19]. Recent applications of Gaussian-weighted variants (Ga2SFCA) include analyses of how flooding degrades shelter accessibility and how access to refuge green space varies within a city [10,20]. This literature convincingly demonstrates that provision and access are not the same thing, but accessibility studies often treat supply capacity as fixed or unconstrained, so they can identify where access is poor without determining how a limited number of new or upgraded sites should be allocated to improve it most.
2.4. Facility-Location and Allocation Optimization
The third line concerns facility-location optimization. The maximal covering location problem and its capacity-constrained descendants provide a formal basis for selecting a limited set of sites to maximize the demand served [12], and multi-objective and resource-constrained formulations have been applied to shelter siting, including for specific populations and under demand uncertainty [21,22,23]. Hierarchical and system-based planning frameworks have also been proposed to organize shelters across administrative levels [24,25,26]. This body of work provides the allocation logic that suitability and accessibility studies lack, yet optimization models frequently treat candidate sets and demand surfaces as given, without screening candidates against multi-hazard exposure or grounding demand in phase-specific refuge requirements.
2.5. Integrated Approaches and Research Gap
A smaller but growing set of studies has begun to bridge these lines by coupling suitability with optimization or accessibility with equity analysis [7,27,28]. The treatment of green space as multifunctional resilience infrastructure has been advanced in the green-infrastructure literature [1,2,3,4]. What remains uncommon is a single, reproducible workflow that connects all four elements—multi-hazard screening, phase-specific supply and demand, network accessibility, and capacity-constrained allocation—and that is specified transparently enough to be re-run on open data by other researchers. The present framework is positioned in that gap. It does not claim to improve any individual component over the specialized literature; its contribution is the reproducible integration of components that are ordinarily used in isolation, and the explicit, testable specification for evaluating what that integration adds relative to conventional area-based planning [15,29].
Table 1 summarizes how these lines of work typically treat the four components that the present framework combines. The comparison is indicative rather than exhaustive, and individual studies may go beyond the typical pattern of their line of work. It shows that each component is well developed somewhere in the literature, but that multi-hazard screening, phase-specific demand, network accessibility, and capacity-constrained allocation are rarely evaluated together in one workflow, and that the separate effect of each is rarely isolated. The nested M1–M4 comparison (Section 3.10) is designed to make these effects explicit.
Table 1.
Typical treatment of the four framework components in the main lines of prior work and in the present framework.
3. Materials and Methods
3.1. Framework Overview
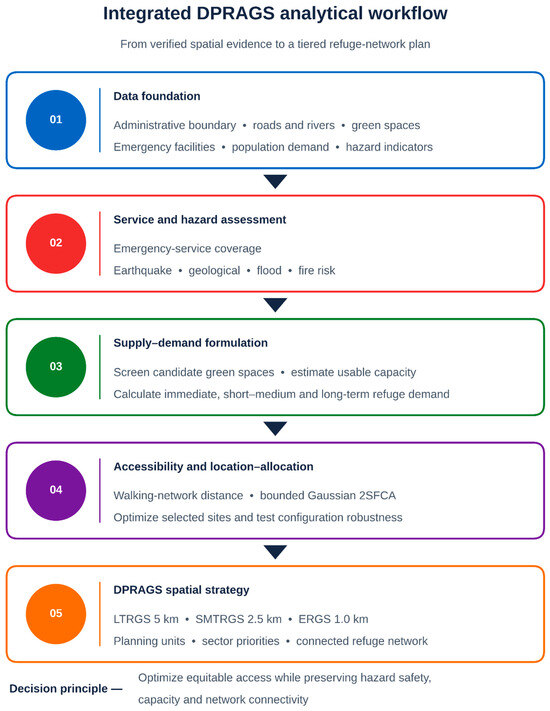
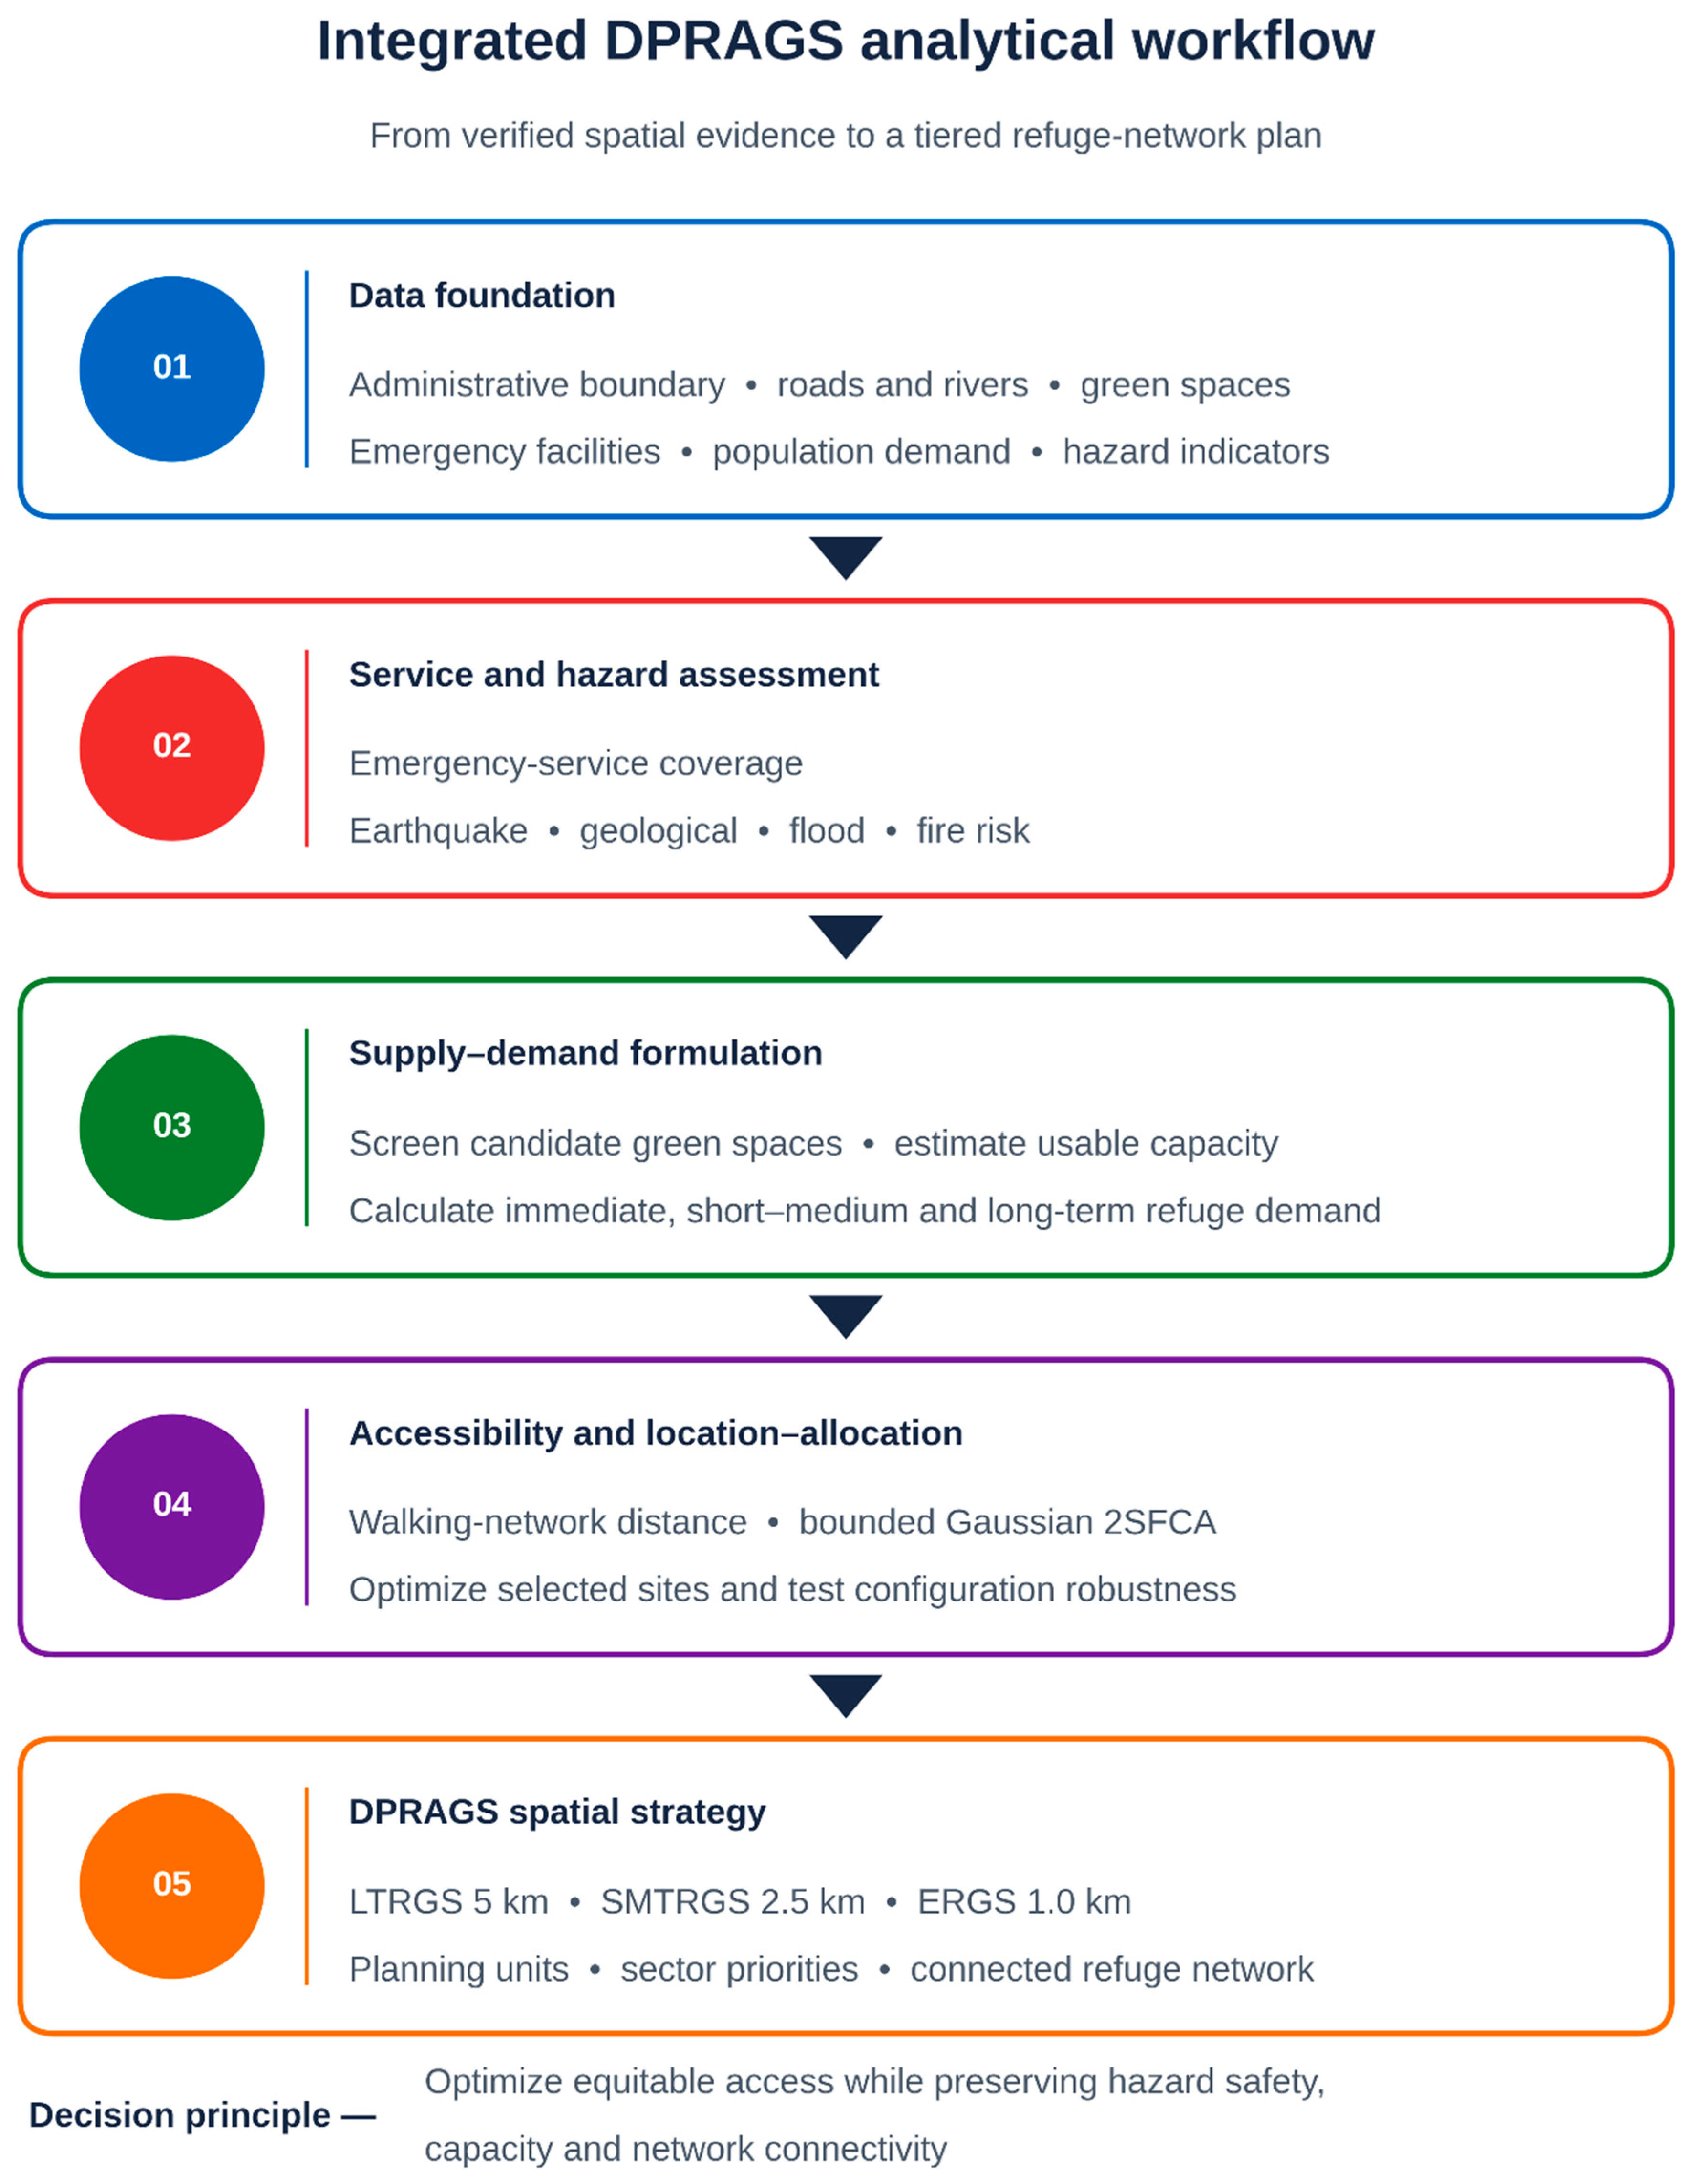
DPRAGS are conceived as a tiered refuge system—LTRGS, SMTRGS, and ERGS—serving progressively longer refuge durations over progressively larger service areas. The workflow proceeds in five stages: a public-data foundation; multi-hazard risk and service-coverage assessment; tiered supply and phase-specific demand; network accessibility and capacity-constrained allocation; and translation into a tiered spatial strategy. Each stage is specified so that it can support reproducible implementation when the required inputs, parameters, software environment, and validation procedures are supplied. The integrated analytical workflow is summarized in Figure 2.
Figure 2.
Integrated analytical workflow for the DPRAGS framework, from public-data foundation to tiered spatial strategy.
3.2. Rationale for the Analytical Choices
A design choice that deserves particular emphasis is the use of one common primary outcome across the nested M1–M4 comparison. For tier t, all four models report the fraction of tier-specific demand served, ΣiDityi/ΣiDit, where Dit is measured in people and yi is the covered fraction of demand unit i. This prevents the comparison from changing both the model and the numerator at the same time. Raw Ga2SFCA accessibility, population reach, and capacity utilization are reported separately as diagnostics rather than substituted for the common coverage measure. Because the framework integrates several established methods, it is also important to make the underlying choices reproducible. Multi-hazard indicators are directionally harmonized and normalized; within-hazard weights are derived from AHP pairwise-comparison matrices, and only matrices with a consistency ratio below 0.10 are accepted. The empirical matrices, weights, and consistency records must therefore be reported for any applied implementation rather than inferred or adjusted post hoc [8,18].
Accessibility is captured by a Gaussian two-step floating catchment area (Ga2SFCA) model, rather than by simple buffer or nearest-facility measures. Buffer methods treat all locations within a fixed distance as equally served and ignore competition for capacity, whereas the Ga2SFCA formulation captures graded distance decay and reflects potential competition for shared supply; it is a relative accessibility diagnostic and does not itself enforce site capacity, which is imposed explicitly only in the M4 allocation model [10,19]. The impedance is based on network distance rather than Euclidean distance, because evacuation and refuge-seeking occur over the physical network; network-based measures have been shown to differ substantially from straight-line approximations in dense urban settings [20].
Site configuration is determined by a capacity-constrained maximal-coverage formulation rather than by ranking or by unconstrained coverage. Ranking approaches select the best sites individually but do not guarantee that the selected set collectively maximizes the demand served; unconstrained coverage models can assign more demand to a site than it can physically hold. The capacitated maximal-coverage model addresses both by maximizing covered population subject to explicit per-site capacity limits [12,21]. Solving the model for a range of facility counts produces a non-decreasing coverage–facility curve, from which the marginal gain in population coverage per additional facility can be evaluated and transparent trade-off decisions can be supported [22,23]. Finally, demand and capacity are represented across three phase-specific tiers rather than by a single city-wide standard, reflecting that emergency, short-to-medium-term, and long-term refuge differ in duration, per capita area, and acceptable service distance [24,26].
3.3. Study Area and Illustrative Scope
Nantong, on the northern bank of the Yangtze River estuary in Jiangsu Province, China, is used to illustrate the framework. Its dense urban core, low-lying deltaic terrain, and proximity to major watercourses produce compound exposure to flooding, seismic, fire, and geological hazards. The illustrative domain is the central urban area (approximately 223 km2). Consistent with the methodological aim of this paper, Nantong is used to illustrate the framework’s data requirements, computational sequence, and the kinds of planning insight it is designed to produce, rather than to report validated empirical coverage results.
3.4. Data Architecture
The framework is designed to run on public, redistributable datasets (Table 2), so that any application can be independently reproduced; provenance for each layer—source, version, access date, licence, and processing—is documented with the analysis scripts.
Table 2.
Data architecture: inputs, sources, and functions.
All layers are reprojected to a projected coordinate reference system (WGS 84/UTM zone 51N (EPSG:32651)) so that areas are computed in square metres and network distances in metres. The projected spatial layers then support GIS-based green-space accessibility and broader urban green-infrastructure assessment [31].
3.5. Multi-Hazard Risk Model
In the proposed framework, earthquake, geological, flood, and fire hazards are represented as separate indicator groups and then integrated using the procedure defined below.
The framework prescribes a weighted procedure in which indicator weights are derived from expert-informed pairwise-comparison matrices using the Analytic Hierarchy Process (AHP). AHP is used here as the GIS-MCDA weighting mechanism within a planning problem that also explicitly considers spatial accessibility and equity [8,32]. This paper presents AHP as part of the proposed implementation protocol; no empirically elicited expert matrix or Nantong-specific AHP weight is reported in this conceptual study. A practical implementation must report the pairwise-comparison matrices, calculated weights, and consistency statistics.
In an applied implementation, pairwise judgements are elicited from a panel of experts covering disaster management, urban planning, hydrology or geotechnical engineering, and landscape planning, using Saaty’s 1–9 scale. Individual matrices are aggregated by the geometric mean of the individual judgements, and the aggregated matrix must satisfy CR < 0.10; an individual matrix that fails this criterion is returned to the expert for revision. The hazard-group weights αh in Equation (3) are elicited in the same way or, as a neutral baseline, set equal and varied in sensitivity analysis. The panel composition, the individual and aggregated matrices, the resulting weights, and the consistency ratios are reported, and the stability of the eligible-site set is tested by perturbing the weights (for example, by ±20%) [8,11].
AHP consistency is evaluated using:
A pairwise-comparison matrix is accepted when CR < 0.10. Matrices with CR ≥ 0.10 must be revised or excluded.
The per-hazard surface is
and the integrated surface is
The indicators proposed for each hazard group are drawn from the layers in Table 2. Flood: Ground elevation and relative elevation, topographic wetness or local depressions derived from the DEM, distance to rivers and water bodies, the share of impervious (built-up) land cover, and rainfall intensity, with recorded waterlogging locations added where available. Earthquake: The seismic-zoning peak ground acceleration (GB 18306-2015 [30]) and the density of surrounding built-up land, used as a proxy for exposure to falling debris and building collapse near the site. Geological: Slope and, where available, ground-subsidence or soft-soil mapping from local geological surveys. Fire: Proximity to dense built-up and industrial land and to fuel stations or other hazardous facilities, and vegetation type as a fuel proxy, with distance to the nearest fire station treated as a mitigating indicator and reverse-coded.
Several of these inputs vary little across a study area of about 223 km2. The central urban area of Nantong is expected to fall within one or very few seismic-zoning classes, and CHIRPS rainfall has a resolution of about 5 km, so these layers contain only a few distinct values within the study area. Before weighting, the spatial variation in every indicator is therefore checked, for example by the number of distinct values and the coefficient of variation within the study area. Indicators that do not discriminate between candidate sites are not used for site-level screening or ranking. They are instead treated as city-level context that informs the design level of the hazard and its weight αh, and the remaining indicator weights are renormalized. Where finer local data exist, such as recorded waterlogging points or municipal flood-risk maps, they replace the coarse layers. These decisions are reported so that coarse inputs are not interpreted as fine local evidence.
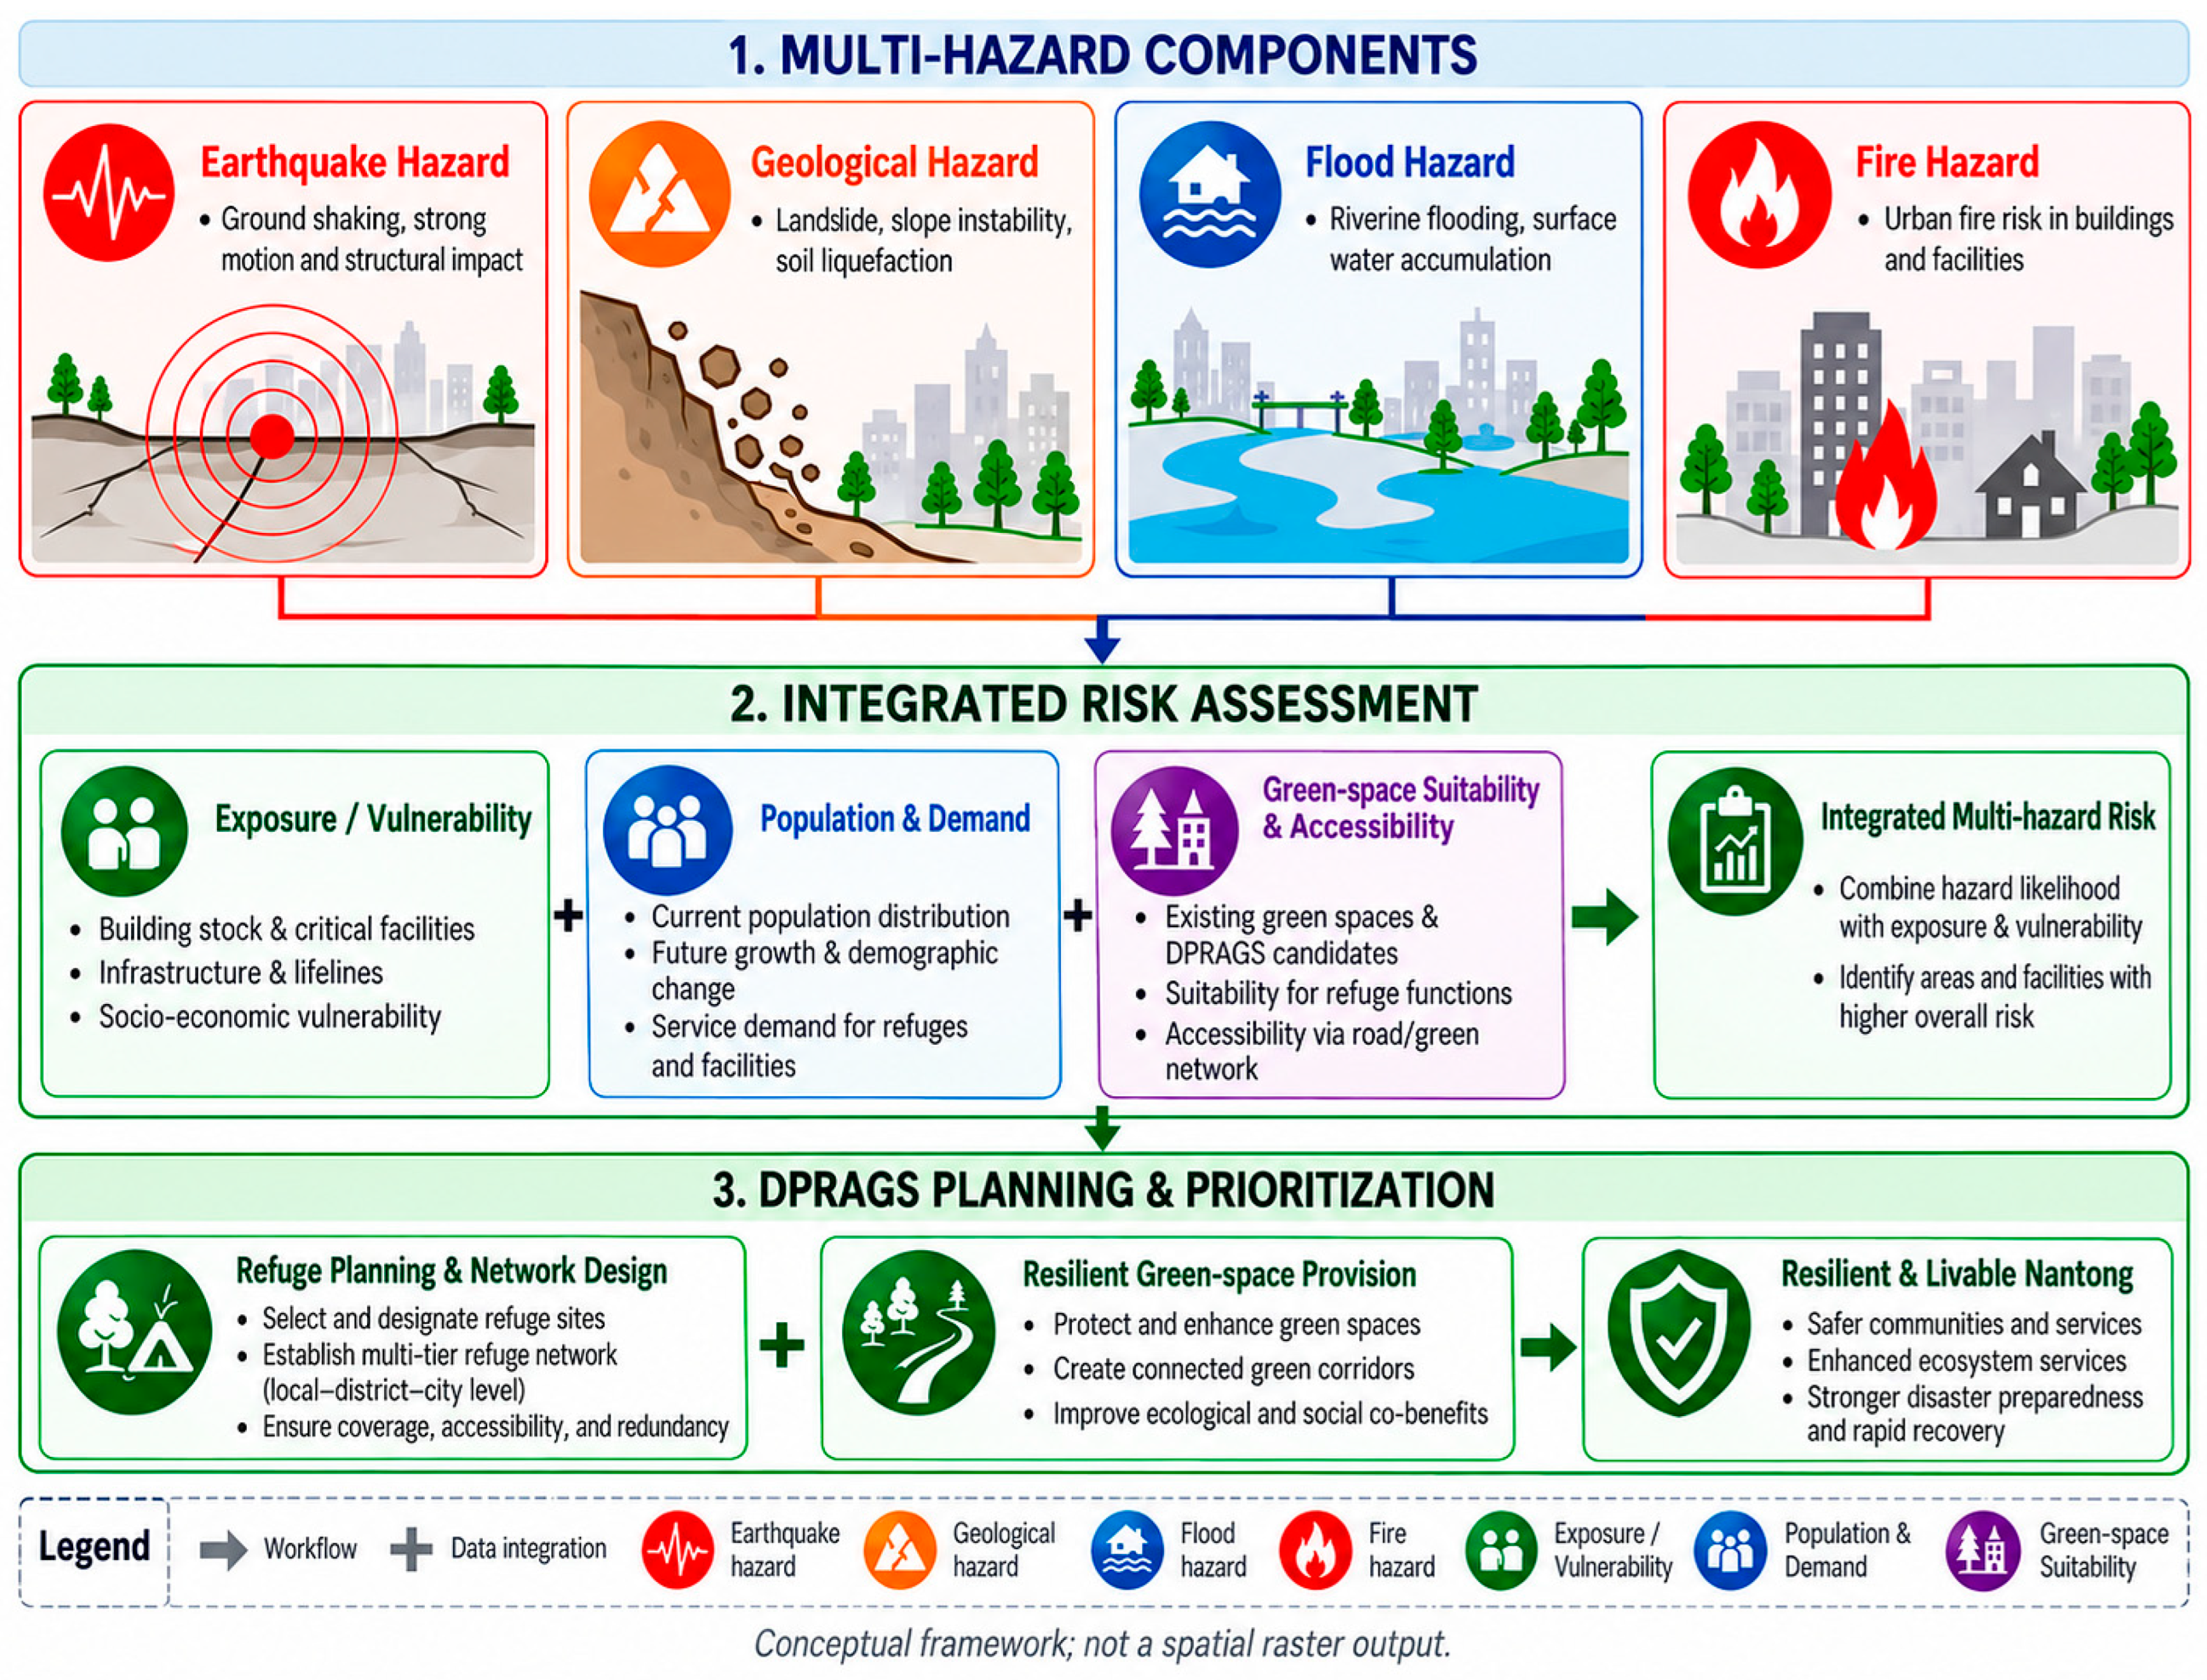
For site eligibility, the primary multi-hazard rule is restrictive rather than compensatory. A candidate site is excluded if its exposure to any single hazard exceeds the applicable threshold, that is, if Rmax(x) = maxh [Rh(x)/τh] > 1, where τh is the exclusion threshold for hazard h. Exclusion thresholds are taken from regulatory or engineering criteria where these exist, such as designated flood-storage, inundation, or geological-hazard zones. Where they do not exist, τh is set at an upper quantile of the per-hazard surface (for example, the 80th or 90th percentile) and varied in sensitivity analysis. The weighted integrated surface of Equation (3) is retained for ranking eligible sites, for description, and for sensitivity analysis; it does not override the restrictive eligibility screen. The conceptual multi-hazard assessment structure is summarized in Figure 3.
Figure 3.
Conceptual multi-hazard assessment structure linking hazard, exposure, and vulnerability components (conceptual schematic; not georeferenced). Site eligibility is determined by the restrictive per-hazard (maximum) rule; the integrated weighted surface is used only to rank eligible sites.
3.6. Suitability Screening, Tiers, Demand, and Capacity
Candidate green spaces are screened against site-eligibility criteria (minimum effective area, usable safety-zone fraction, restrictive multi-hazard eligibility, and access connections) and classified into nested tiers. The screening stage is informed by literature on emergency-facility suitability, green-space accessibility and equity, ecological-service value, and climate-resilience planning [7,11,33,34]. The regulatory tier thresholds themselves are taken from the national standards adopted for this framework: GB 51143-2015 and GB/T 44013-2024 [35,36]. Tier qualification is nested rather than exclusive: a site meeting the LTRGS area threshold also remains eligible to provide SMTRGS and ERGS service, and a site meeting the SMTRGS threshold remains eligible for ERGS. Capacity is calculated separately for each phase using the applicable per capita area. Because the tiers represent different response phases, the primary analyses do not treat these capacities as simultaneous claims on the same physical area. If concurrent multi-tier occupation is modelled as a stress test, the combined assigned area across tiers is constrained by the site’s single usable physical area. Adopted parameters are given in Table 3. The long-term 3.0 m2/person value is treated as a modelling assumption rather than a direct clause value.
Table 3.
DPRAGS tier definitions and adopted planning parameters.
In the primary analysis, selections are coordinated across tiers by solving the tiers in sequence, from the longest to the shortest refuge duration. The LTRGS model is solved first. The selected LTRGS sites then enter the SMTRGS model as already-open sites (xj fixed at 1 and not counted against that tier’s facility budget p), and the selected LTRGS and SMTRGS sites enter the ERGS model in the same way. This reflects planning practice, in which large long-term sites also serve as emergency assembly points, and it avoids selecting an additional small site where an already-selected large site can serve the same demand. Independent per-tier solutions are reported for comparison, so that the effect of coordination is visible. In the concurrent-use stress test, the per-tier capacity constraint of Equation (8) is replaced by one physical-area constraint per site, Σt at Σi Dit zijt ≤ AjU xj, so that the same usable area cannot be counted for more than one tier at a time.
Formally, let Ot be the set of sites already opened by the longer-duration tier or tiers. The facility-count constraint of Equation (8) for tier t then becomes Σj ∉ Ot xjt = pt, with xjt = 1 for all j ∈ Ot, where xjt is the tier-t counterpart of xj in Equation (8), so that pt counts only the newly selected sites; for the LTRGS tier, Ot is empty.
3.7. Justification and Provenance of Tier Thresholds and Standards
A recurring and legitimate concern in shelter and refuge studies is that classification thresholds and per capita standards are derived from a single case and then asserted as general, without independent grounding. The framework avoids this by anchoring its tier definitions in published national standards rather than in values calibrated to the illustrative study area. The minimum effective areas and service radii for the emergency, short-term, and long-term tiers follow the outdoor-shelter provisions of the national disaster-shelter design and classification standards, and the emergency and short-term per capita effective areas are taken directly from those provisions. The single point at which the framework departs from the minimum is the long-term per capita area, which is set above the outdoor minimum to reflect the larger effective area required for extended accommodation and support functions; this is stated explicitly as a bounded modelling assumption rather than as a standard value, so that a reader can substitute the strict minimum if preferred. Because the thresholds are external to the case, the same specification can be re-run in other jurisdictions by substituting the locally applicable standard without altering the framework structure [17,26]. The framework proposes a sensitivity analysis over the usable-area fraction and the service radii, so that in an applied implementation, their effect can be quantified rather than assumed [37,38].
A single per capita standard set is used for both capacity and demand, avoiding dual-coefficient ambiguity. The usable people-capacity of candidate site j for tier t is Cjt = AjU/at, where Aj is the site area in square metres, U is the usable safety-zone fraction (proposed baseline 0.60; 0.50 and 0.70 as proposed sensitivity conditions), and at is the tier-specific area requirement in square metres per person. Thus, Cjt is measured in persons, not area.
Phase-specific demand at unit i is formulated as:
where vit is the phase-specific refuge-demand fraction defined below.
Dit = Pi vit
The refuge-demand fraction vit is the expected share of the represented population at unit i that needs public refuge space during phase t; it is dimensionless and lies between 0 and 1. It is a scenario input rather than a universal coefficient: its value depends on the hazard event assumed, the local building stock, and the population, so no single value can be transferred between cities or events. For the emergency tier, the framework adopts vi, ERGS = 1 as a conservative baseline, because immediately after a major event the whole resident population may need temporary outdoor space. For the short-to-medium-term and long-term tiers, the fraction is derived from a damage scenario in two steps, following the displaced-household and short-term shelter methodology of the Hazus loss-estimation model [39]. First, the share of dwellings rendered uninhabitable is estimated from the probability of each building damage state, using building age and structural type where available; dwellings expected to be unusable for 2–14 days contribute to the SMTRGS fraction and those unusable for 15 days or more to the LTRGS fraction. Second, this displaced share is multiplied by the share of displaced residents expected to seek public refuge rather than private accommodation, which is adjusted for household characteristics such as age, income, and tenure using census data. Where shelter-use records from comparable past events exist, they are used to check the resulting values. Because the fractions determine all downstream demand figures, an applied study must report the scenario, the resulting values and their sources, and their effect in sensitivity analysis; no Nantong-specific values are asserted in this study.
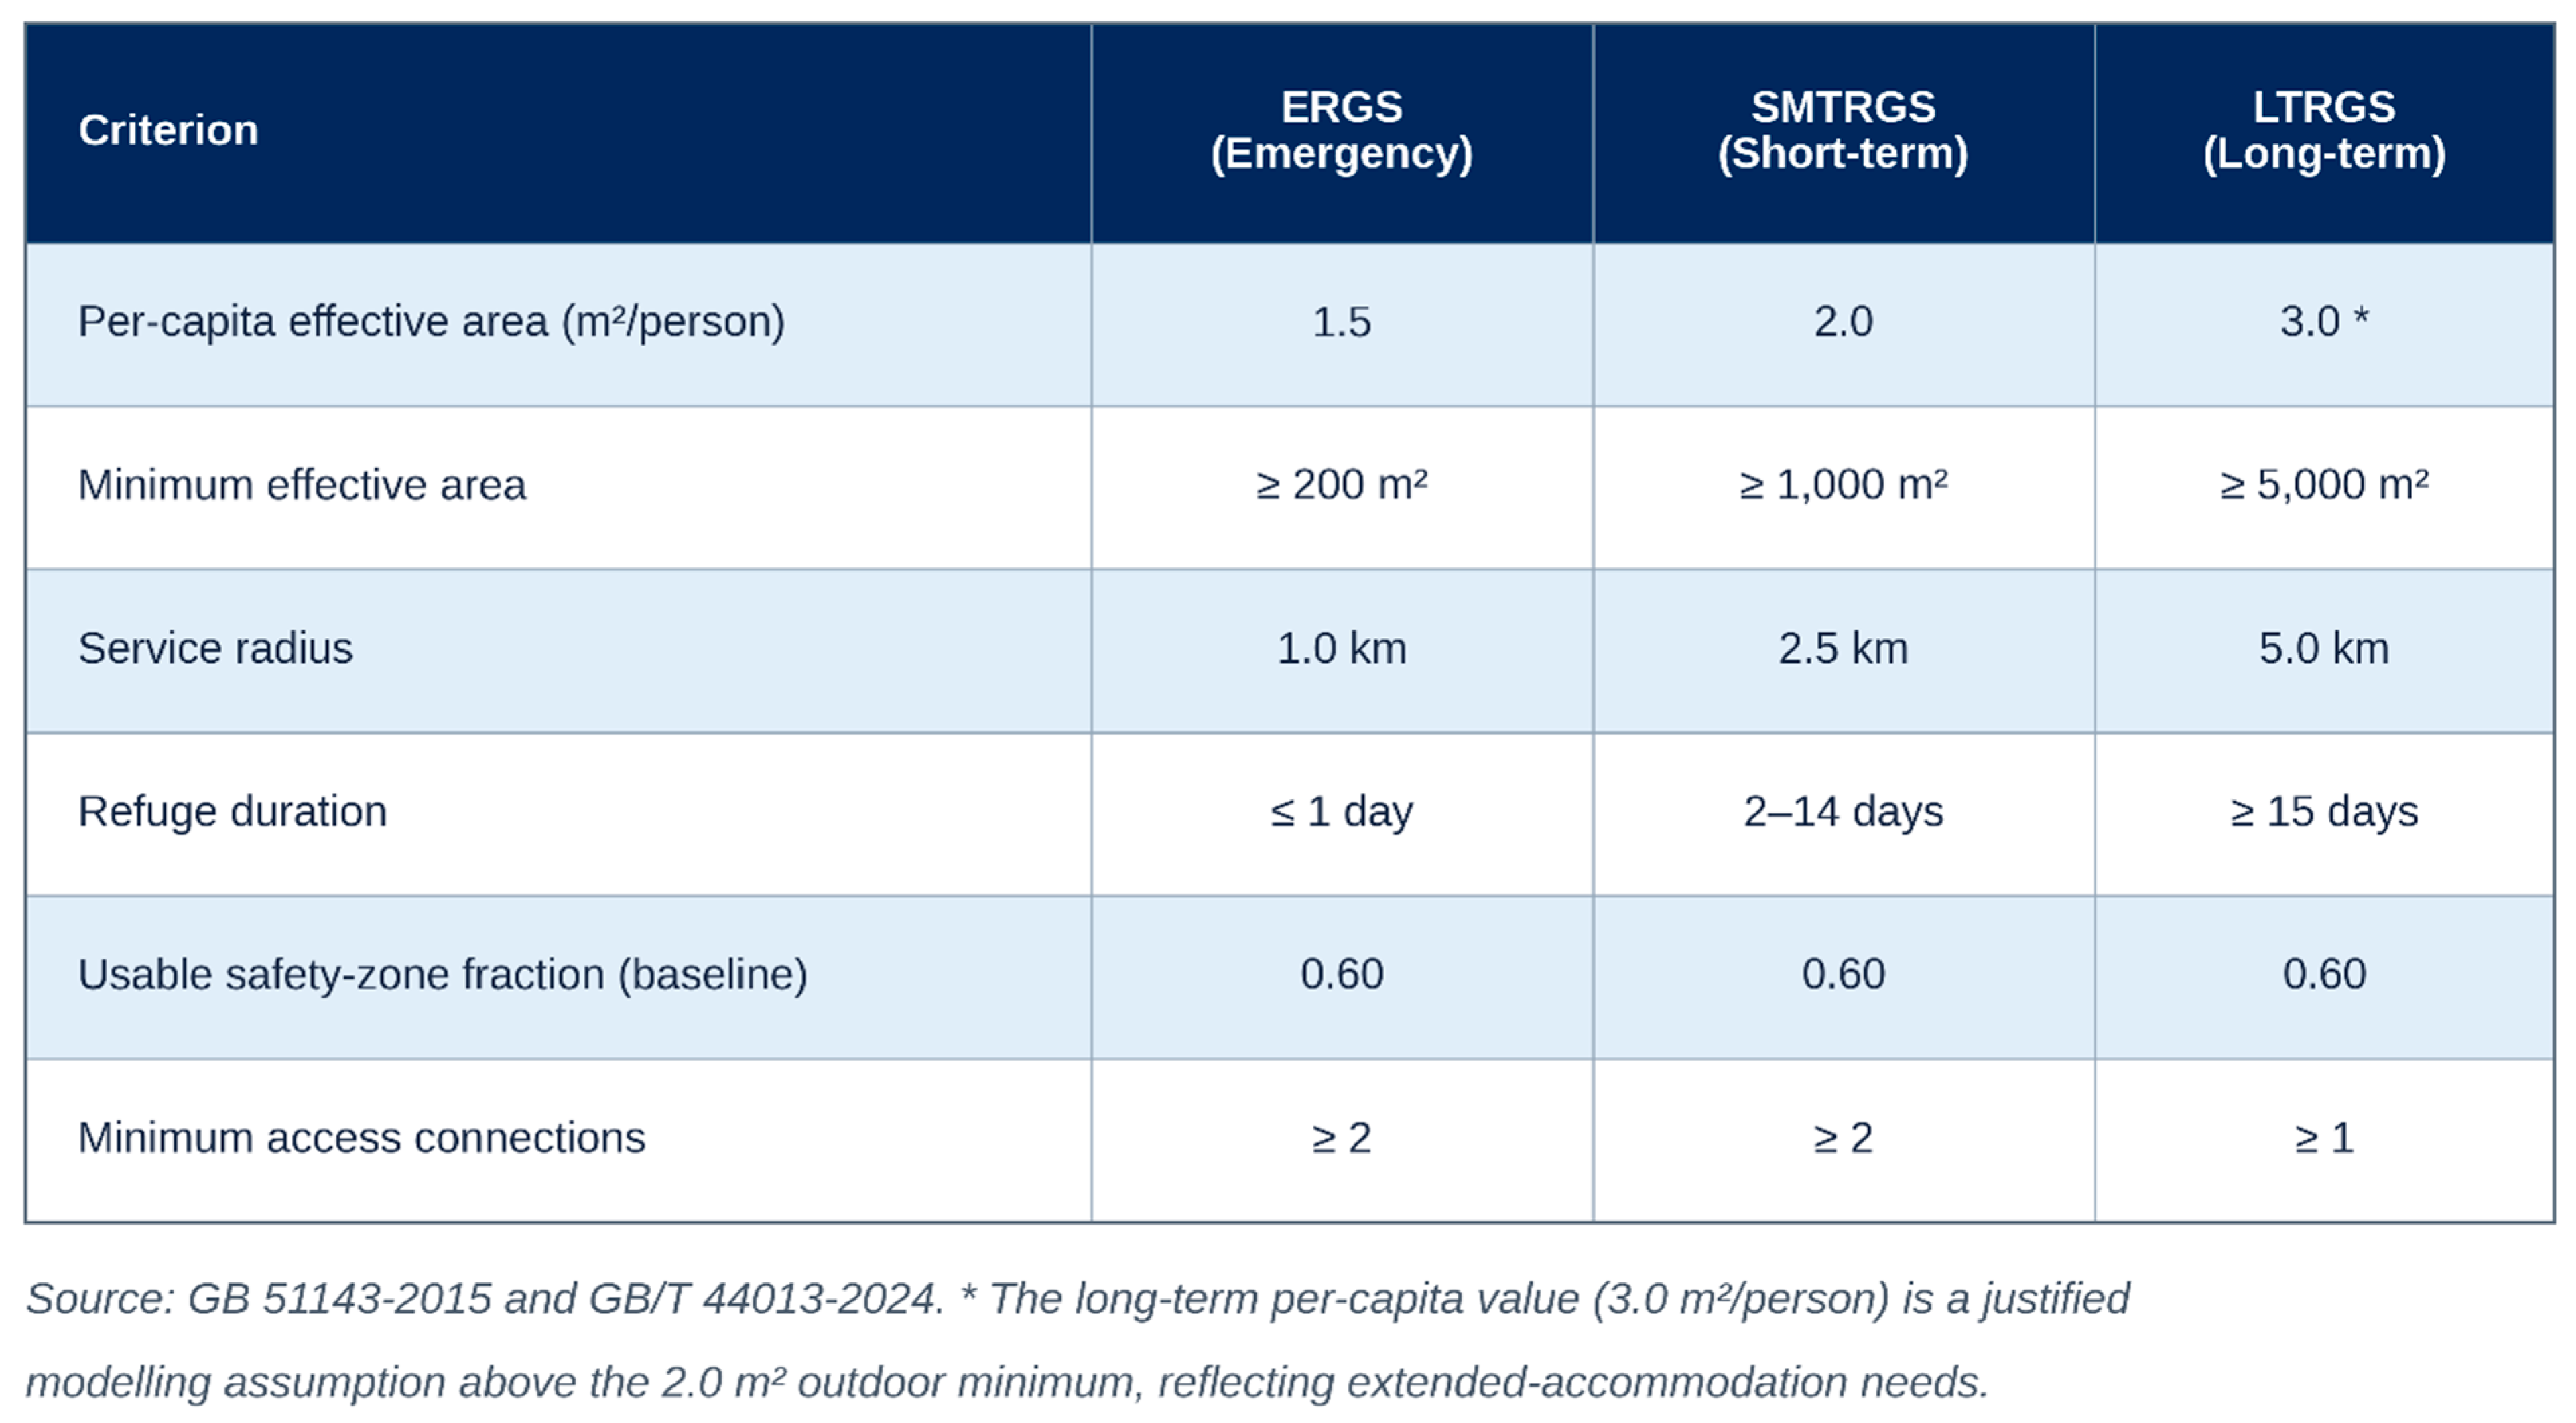
Accordingly, Dit is measured in persons. The tier-specific area requirement at is used only in Cjt = AjU/at to convert usable site area to people-capacity and is not multiplied into demand. The tier-specific screening criteria and modelled service ranges are summarized in Figure 4.
Figure 4.
Screening criteria and modelled service ranges for the three refuge tiers [35,36].
3.8. Gaussian Two-Step Floating Catchment Area
The Ga2SFCA stage uses a represented population Pi and a supply measure Sj to describe relative accessibility, whereas the allocation stage uses tier-specific demand Dit and usable capacity Cjt to enforce phase-specific capacity constraints. These measures are intentionally related but not interchangeable [19,20].
For tier t,dij denotes the shortest-path pedestrian network distance from the demand unit i to the candidate site j, and d0t is the tier-specific search radius in Table 3 (ERGS 1.0 km, SMTRGS 2.5 km, and LTRGS 5.0 km). Euclidean distance is not used. The bounded Gaussian distance-decay weight is:
Here σt controls the rate of distance decay independently of the tier-specific service-radius cutoff d0t, which is fixed by the planning standard. Because the bounded form of Equation (4) already reduces the weight to zero at d0t, σt governs only how quickly the weight declines within the catchment. The framework proposes σt = d0t/2 as the baseline, with σt = d0t/3 (steeper decay, stronger preference for nearby sites) and σt = d0t (gentler decay) as sensitivity conditions. Where observed travel or shelter-use data are available, σt should be calibrated against them. No city-specific σt is claimed in this study. The first Ga2SFCA step is:
The second step is:
For accessibility, Sjt is the usable people-capacity Cjt rather than raw green-space area. Rjt is the capacity-to-population ratio and Ait is the resulting raw Ga2SFCA accessibility score. The score is intentionally retained on its unnormalized scale in the nested comparison so that adding or removing sites does not mechanically rescale all demand units.
In M3 and M4, raw Ga2SFCA is reported as a descriptive accessibility indicator rather than as the tie-breaker. Among solutions that achieve the same maximum common demand coverage, the lexicographic tie-breaker is decay-weighted reachable population. Operationally, each model is first solved for maximum coverage; a second solve then maximizes Σj Qjtxj, where Qjt = Σi PiGt(dij) is the decay-weighted population within reach of site j, subject to coverage remaining at that maximum. It does not replace the covered-demand outcome and it does not replace the assignment or capacity constraints used in M4. The common outcome used to compare all four models is:
where yi is the fraction of tier-specific demand served at demand unit i under the model being evaluated. Ga2SFCA accessibility and capacity utilization are reported separately. This keeps the numerator and denominator of the M1–M4 comparison fixed while allowing accessibility and capacity to alter feasible or preferred site configurations.
Pedestrian network impedance is used for all tiers as a baseline representation of access within the service radii of the national standards (Table 3). This does not imply that pedestrian links remain usable under every hazard: debris, inundation, fire, bridge closure, and crowding can block or lengthen routes, and applied implementations should test hazard-disrupted network scenarios. The 5 km LTRGS radius, however, implies a walk of more than an hour at typical walking speeds, which is demanding for households carrying belongings and for older residents. It is retained because long-term relocation is not a time-critical evacuation: it normally takes place after the emergency phase, can be organized and assisted, and is planned at the city scale. Because this assumption affects which LTRGS sites appear reachable, an applied study should test shorter LTRGS cutoffs (for example, 2.5 and 3.5 km) and an alternative impedance scenario that includes vehicle or shuttle access over the road network.
3.9. Capacity-Constrained Location–Allocation and Coverage
- Configuration is represented as a capacitated maximal-coverage location-allocation model. Let xj ∈ {0,1} indicate whether the candidate site j is selected; zij ∈ [0,1] denote the fraction of demand at unit i assigned to the site j; and yi ∈ [0,1] denote the fraction of demand at unit i covered. Let Dit denote demand at unit i for tier t, Cjt denote the usable people-capacity of the site j for tier t, and aij = 1 if site j lies within the applicable network service radius of the demand unit i, and 0 otherwise. The applied model maximizes covered demand:
Because Σjzij = yi and 0 ≤ yi ≤ 1, no demand unit can receive more than 100% coverage. Demand at one population unit may be split across multiple selected sites when capacity constraints require it. In an applied implementation, the formulation is solved with a mixed-integer linear programming solver, and the solver name and version, run time, solution status, and optimality gap are recorded. No Nantong allocation result is reported in this study [12,40,41]. In an applied implementation, the model is solved for a documented range of facility counts p. Outputs include tier-specific demand served, the common coverage percentage, selected sites, positive assignments, capacity utilization, raw Ga2SFCA diagnostics, solver status, and the optimality gap. Solving over a range of p values produces a non-decreasing coverage–facility curve from which marginal gains can be evaluated.
For the nested comparison, all headline M1–M4 coverage values use the common tier-specific demand denominator defined in Equation (7). Unweighted represented-population reach, raw Ga2SFCA accessibility, and capacity utilization are secondary diagnostics and are not mixed into that numerator.
Accessibility and capacity diagnostics are reported separately from the common demand-coverage metric [13,22,41,42,43,44].
3.10. Nested Model Comparison and Reproducibility
The M1–M4 hierarchy is designed to isolate the effect of area eligibility, hazard screening, network accessibility, and finite capacity while keeping the reported outcome fixed. The same tier-specific demand-coverage measure is applied to all four models. No empirical Nantong performance differences among M1–M4 are reported in this study.
The nested comparison is defined explicitly as follows:
M1: Nested area eligibility + simple Euclidean/radius coverage; no hazard screen and no capacity constraint.
M2 = M1 + restrictive maximum/per-hazard eligibility screening.
M3 = M2 + walking-network impedance; raw Ga2SFCA is reported as an accessibility diagnostic, while decay-weighted reachable population is used only as a lexicographic tie-breaker among maximum-coverage solutions.
M4 = M3 + explicit splittable demand assignment and site-capacity constraints.
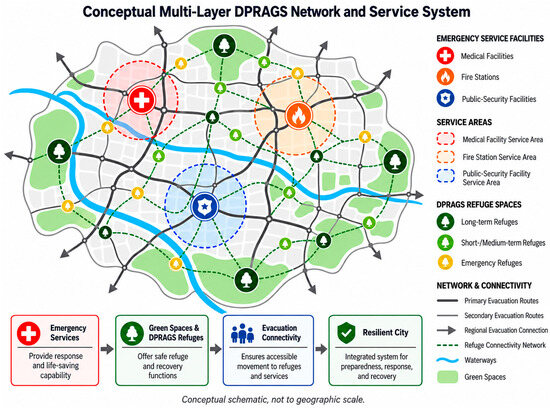
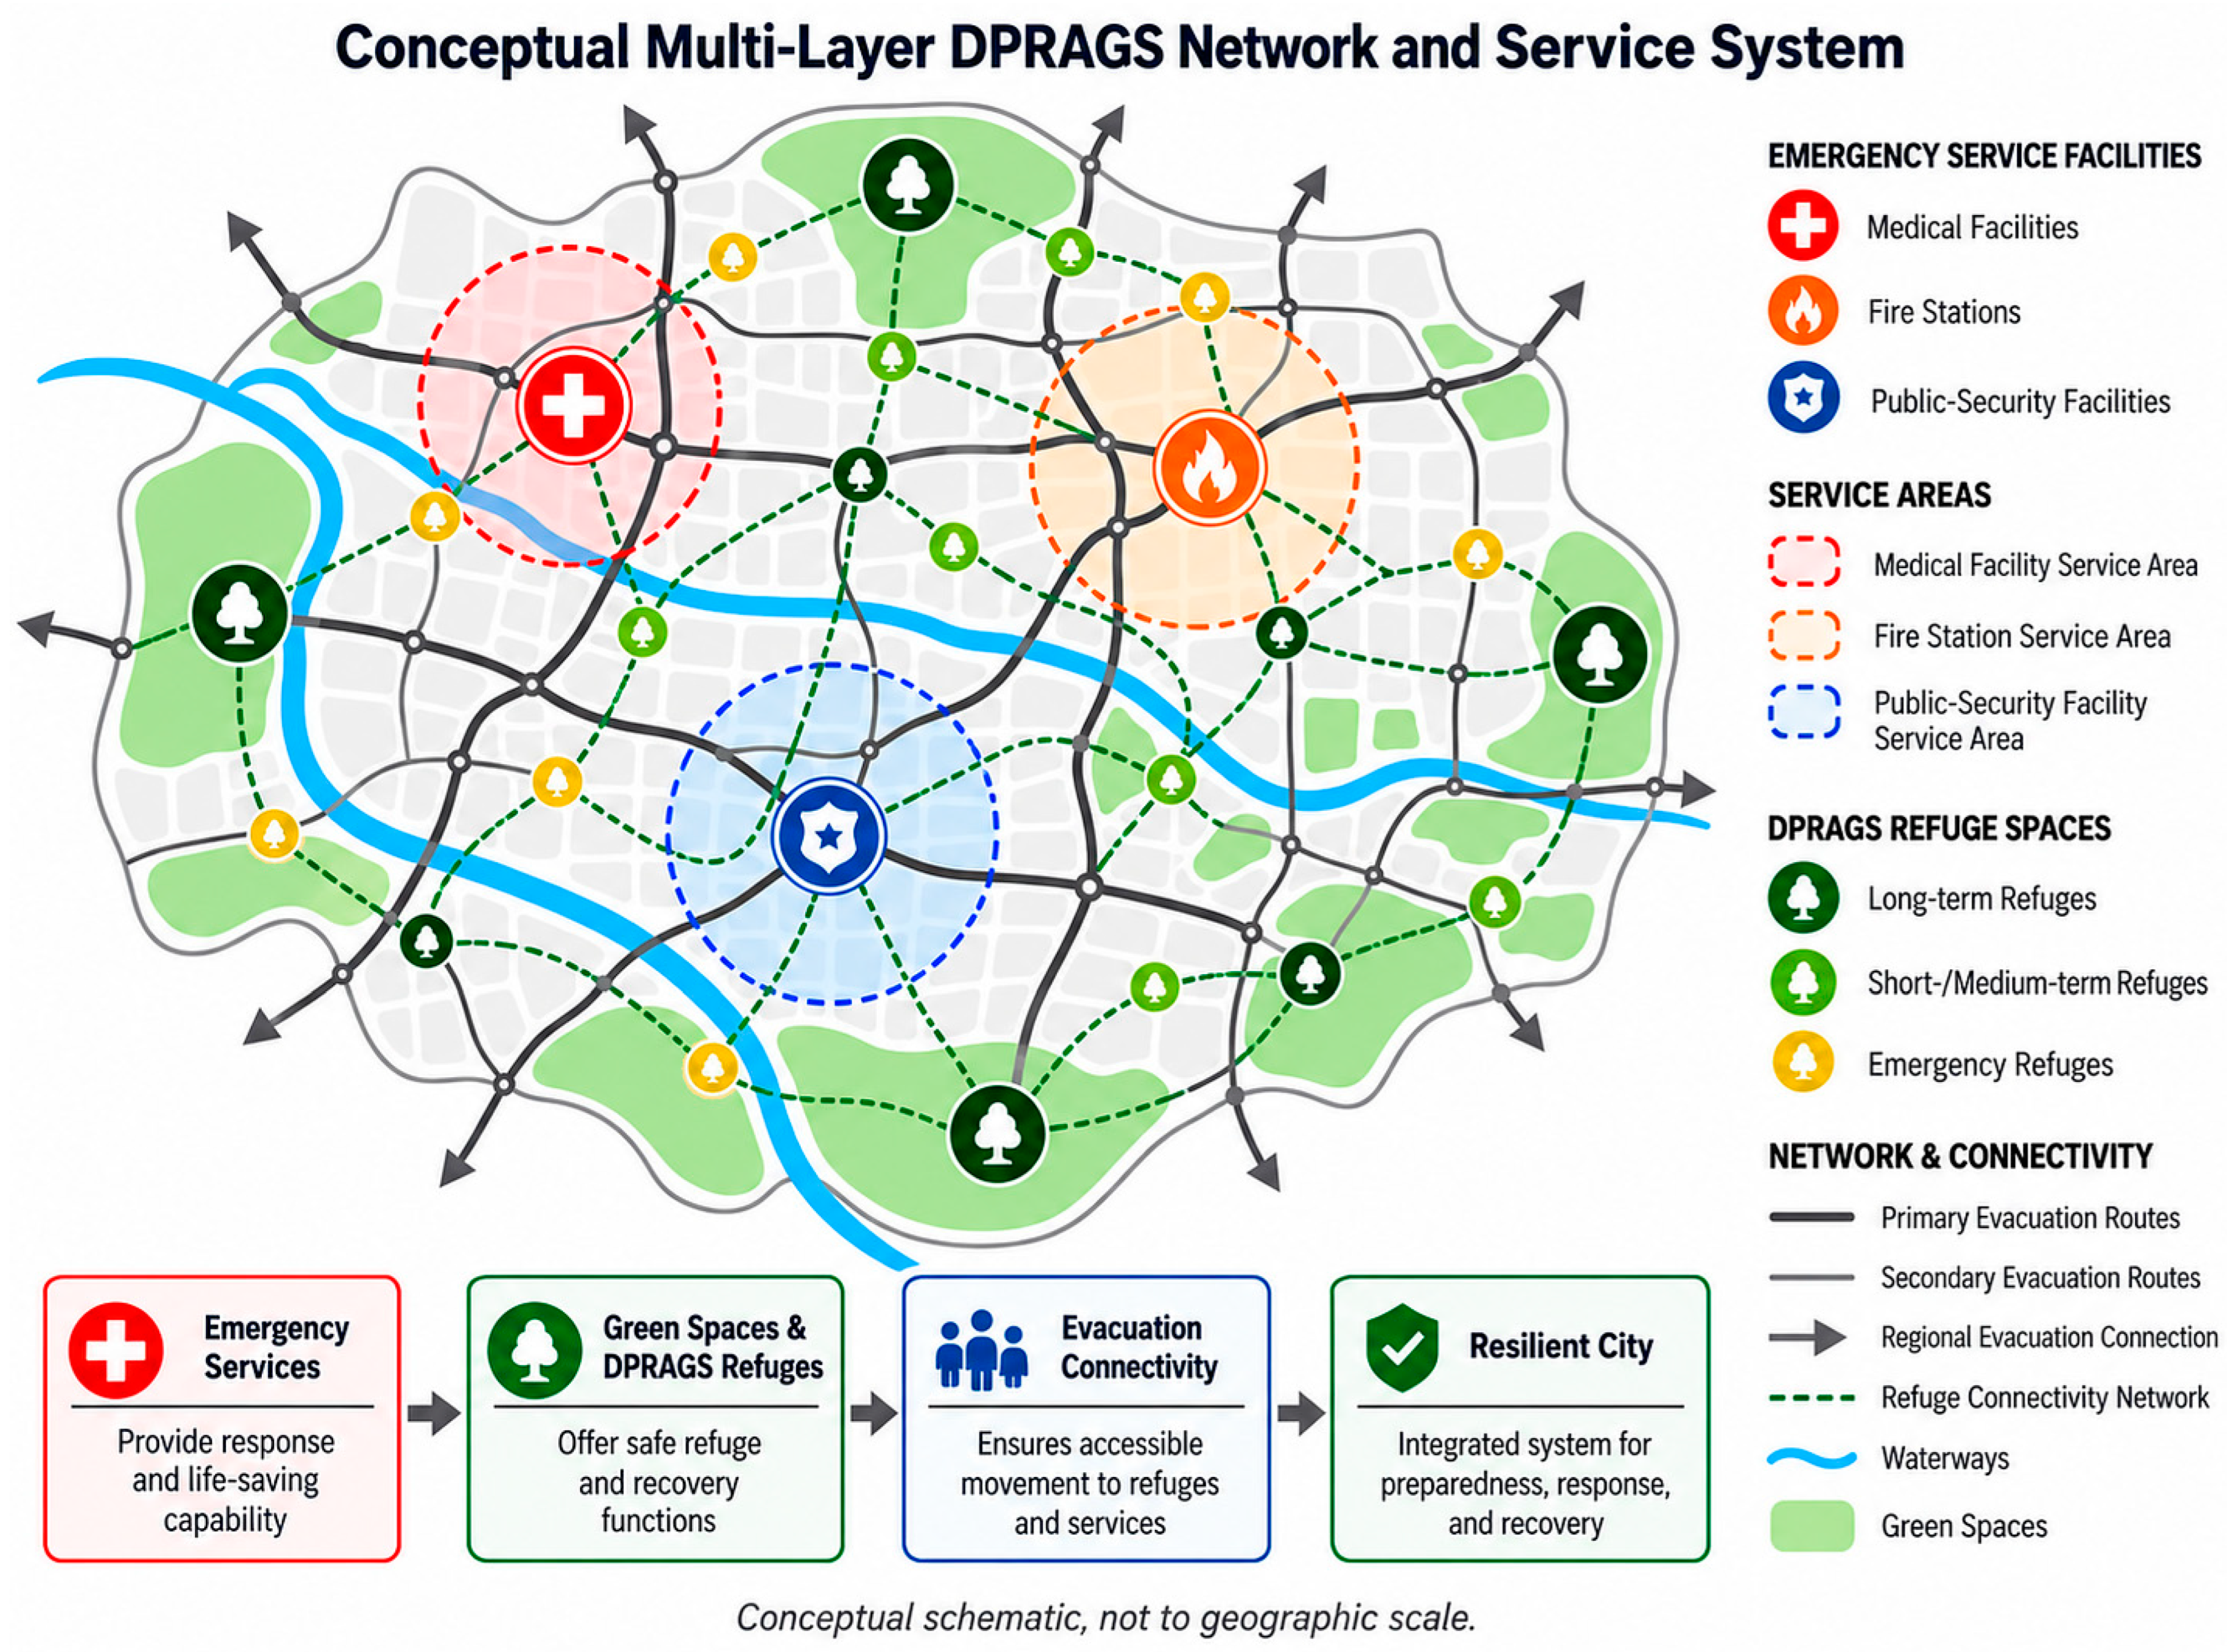
M2 and M3 are intermediate stages in the nested specification. M3 replaces simple Euclidean reach with walking-network impedance and reports raw, unnormalized Ga2SFCA as an accessibility diagnostic and uses decay-weighted reachable population as the tie-breaker among coverage-equivalent solutions; M4 then adds explicit assignment and capacity constraints. Because every model is evaluated with the same demand-coverage metric, differences between models do not mix changes in method with changes in the reported numerator. Table 4 summarizes the nested structure, Table 5 states the question each model addresses and what the difference from the preceding model shows, and Figure 5 illustrates the conceptual relationship among emergency-service facilities, refuge green spaces, and evacuation connectivity.
Table 4.
Nested model structure. The table specifies the planned comparison; no empirical M1–M4 performance results are reported in this study.
Table 5.
Analytical purpose of the nested models.
Figure 5.
Conceptual relationship among emergency-service facilities, refuge green spaces, and evacuation connectivity (conceptual schematic; not georeferenced).
4. Illustrative Use Cases and Expected Planning Insights
This section qualitatively illustrates the outputs and planning insights that an applied implementation could generate for Nantong’s central urban area. The figures are conceptual schematics rather than georeferenced spatial evidence.
4.1. Multi-Hazard Layer
Applying the hazard procedure to Nantong would produce four per-hazard surfaces plus weighted and maximum integrated surfaces. Candidate refuge sites would be screened primarily using the maximum/per-hazard rule so that severe exposure to one hazard cannot be offset by low scores on the others. The weighted surface would remain available for ranking and sensitivity analysis. This is intended to prevent the common error of retaining a refuge site that is itself highly exposed to a single critical hazard.
4.2. Supply, Demand, and Accessibility
Tiered screening of the green-space inventory would yield nested ERGS, SMTRGS, and LTRGS candidate pools, with a large site able to contribute to shorter-duration tiers in the relevant phase. Applying the Ga2SFCA model over the walking network would then distinguish areas of high and low relative accessibility by tier. Raw accessibility is reported separately from the common M1–M4 demand-coverage outcome. In an applied implementation, areas with limited nearby qualifying green space could therefore be identified as potential accessibility deficits, subject to input quality and validation, even when aggregate city-wide provision appears adequate [20,40,45,46].
4.3. Allocation Design
Solving the nested models for a range of p values would produce comparable demand-coverage curves and corresponding selected-site configurations for each tier. Because M1–M4 use the same primary outcome, differences can be interpreted as the effect of adding restrictive hazard screening, network accessibility, and finite capacity in turn, rather than as a change in measurement scale. The planning implications remain conditional until the workflow is executed on validated Nantong inputs.
4.4. Sector-Level Priorities
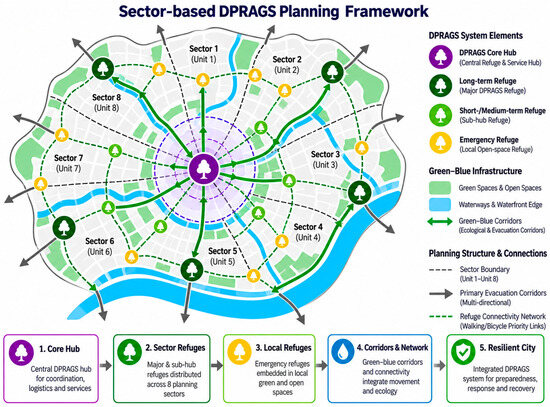
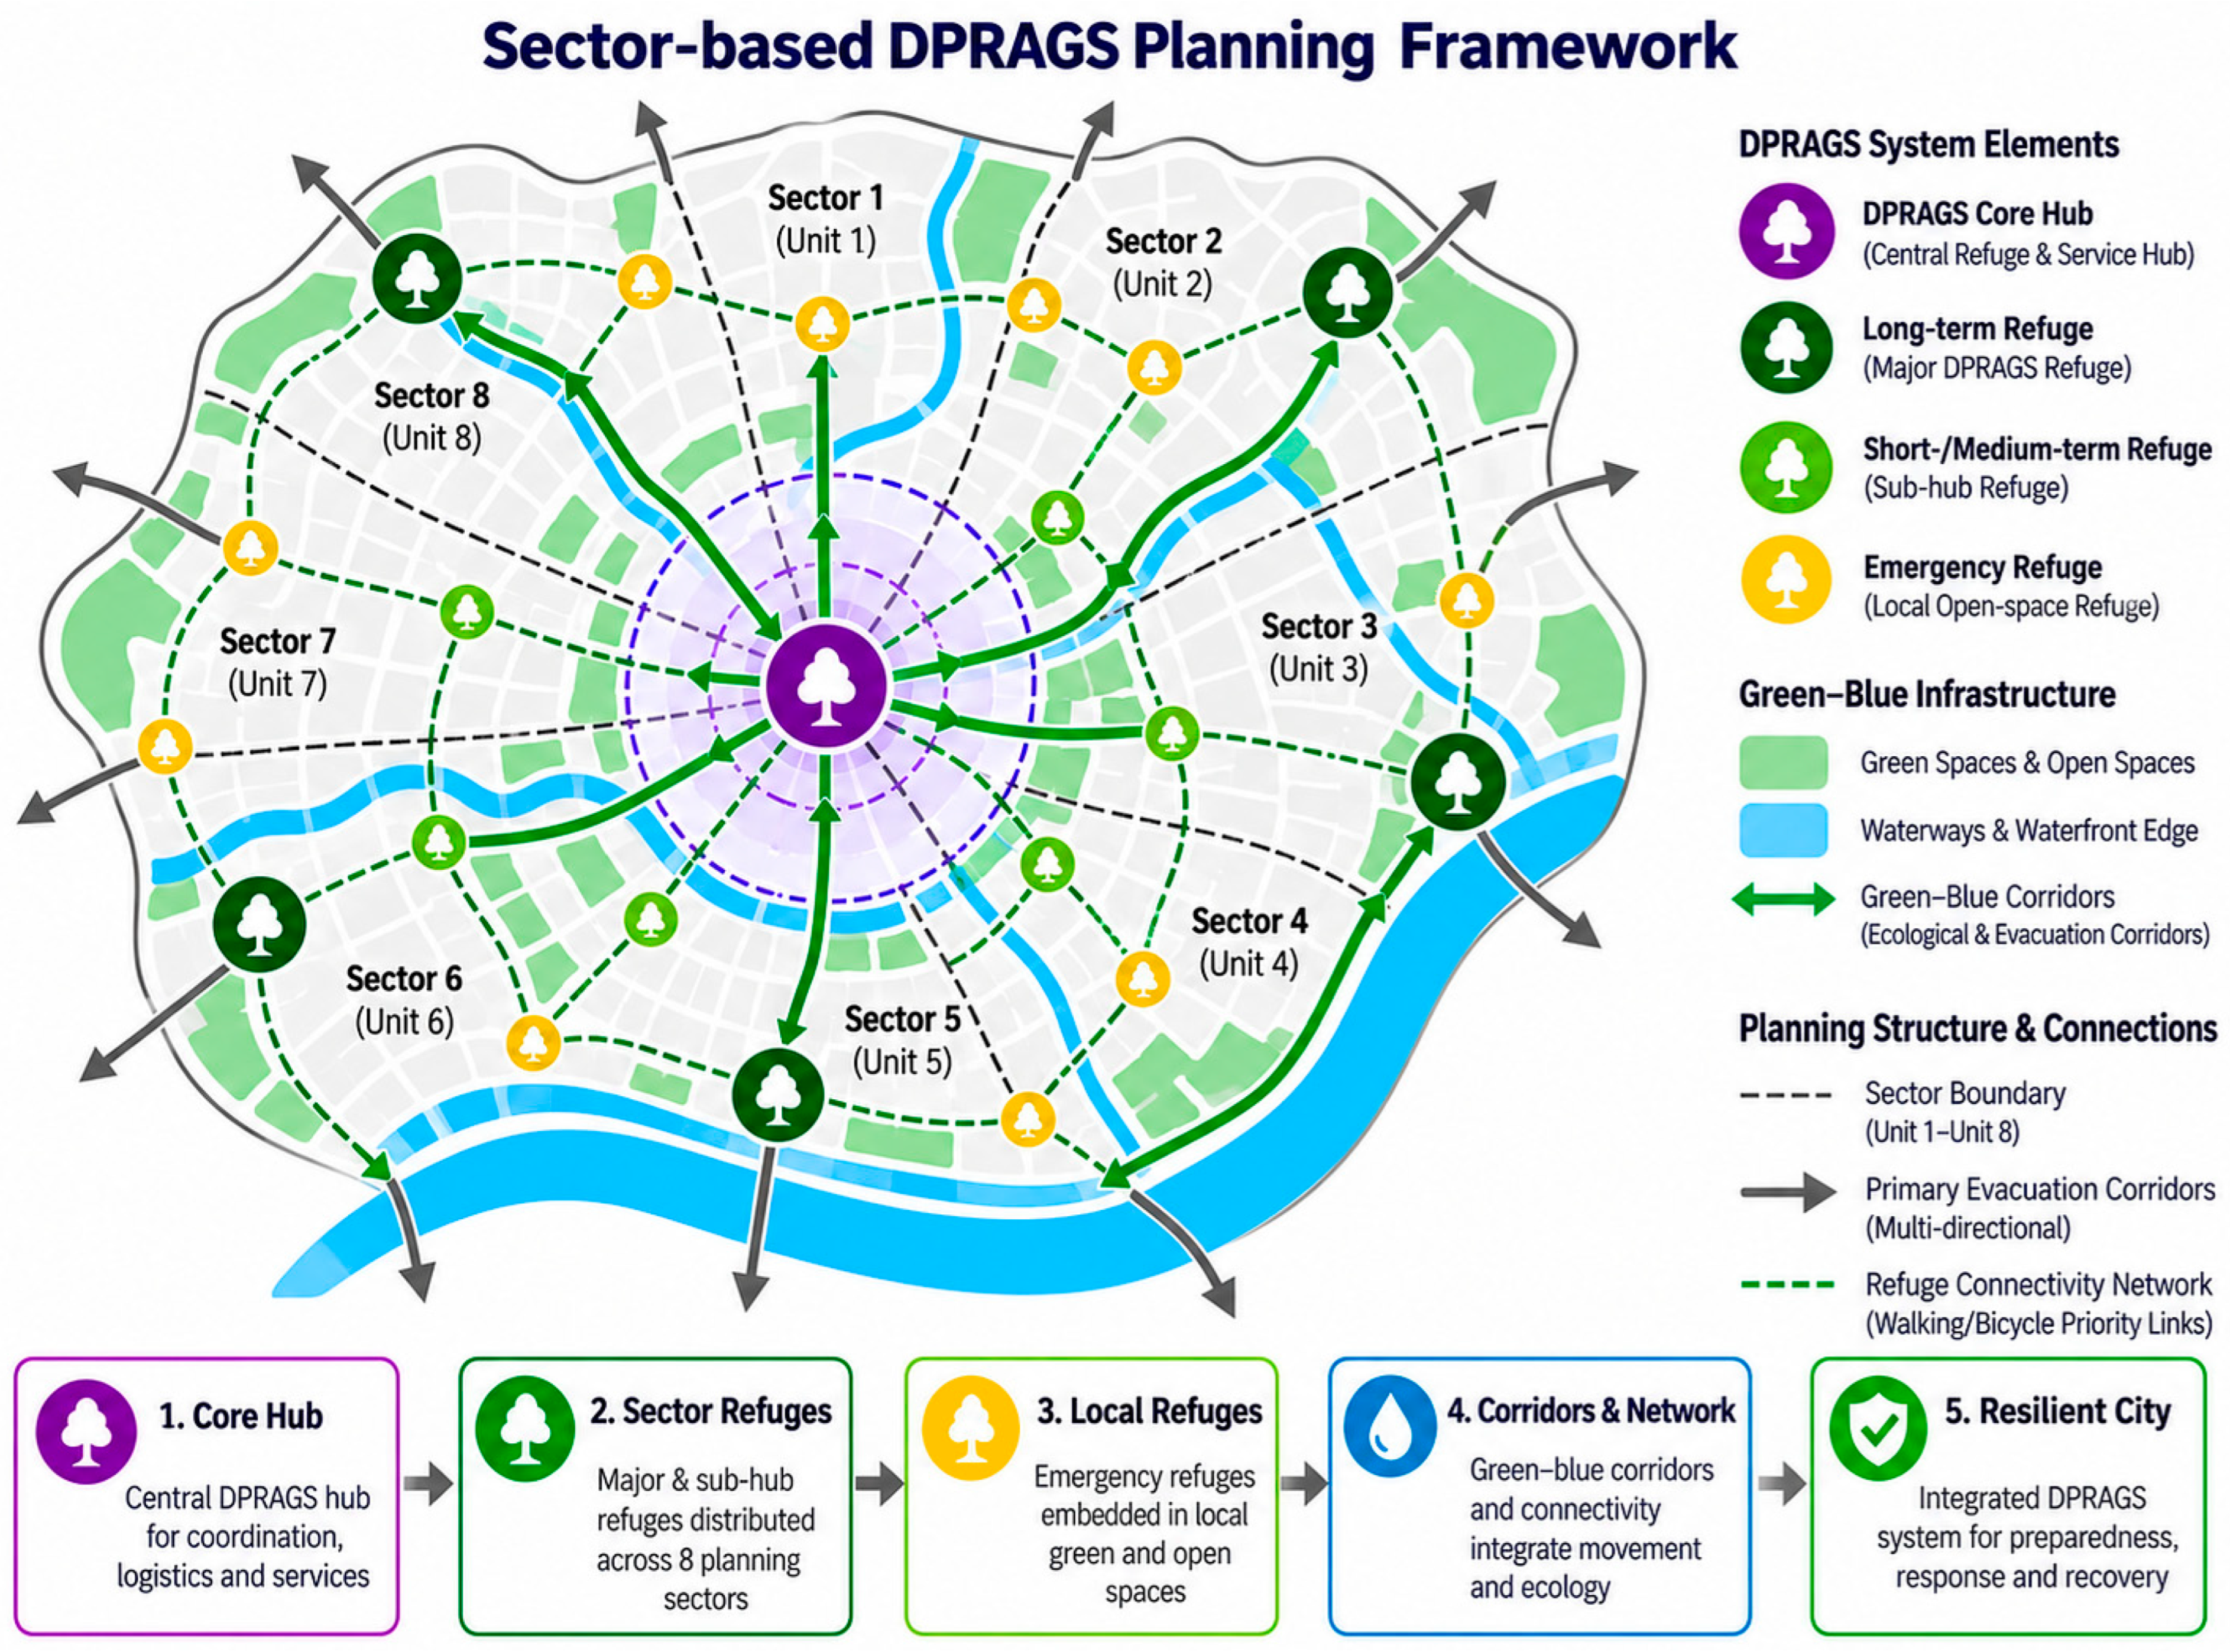
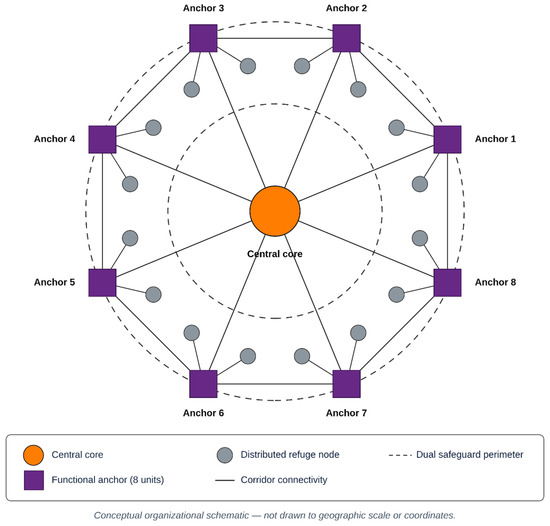
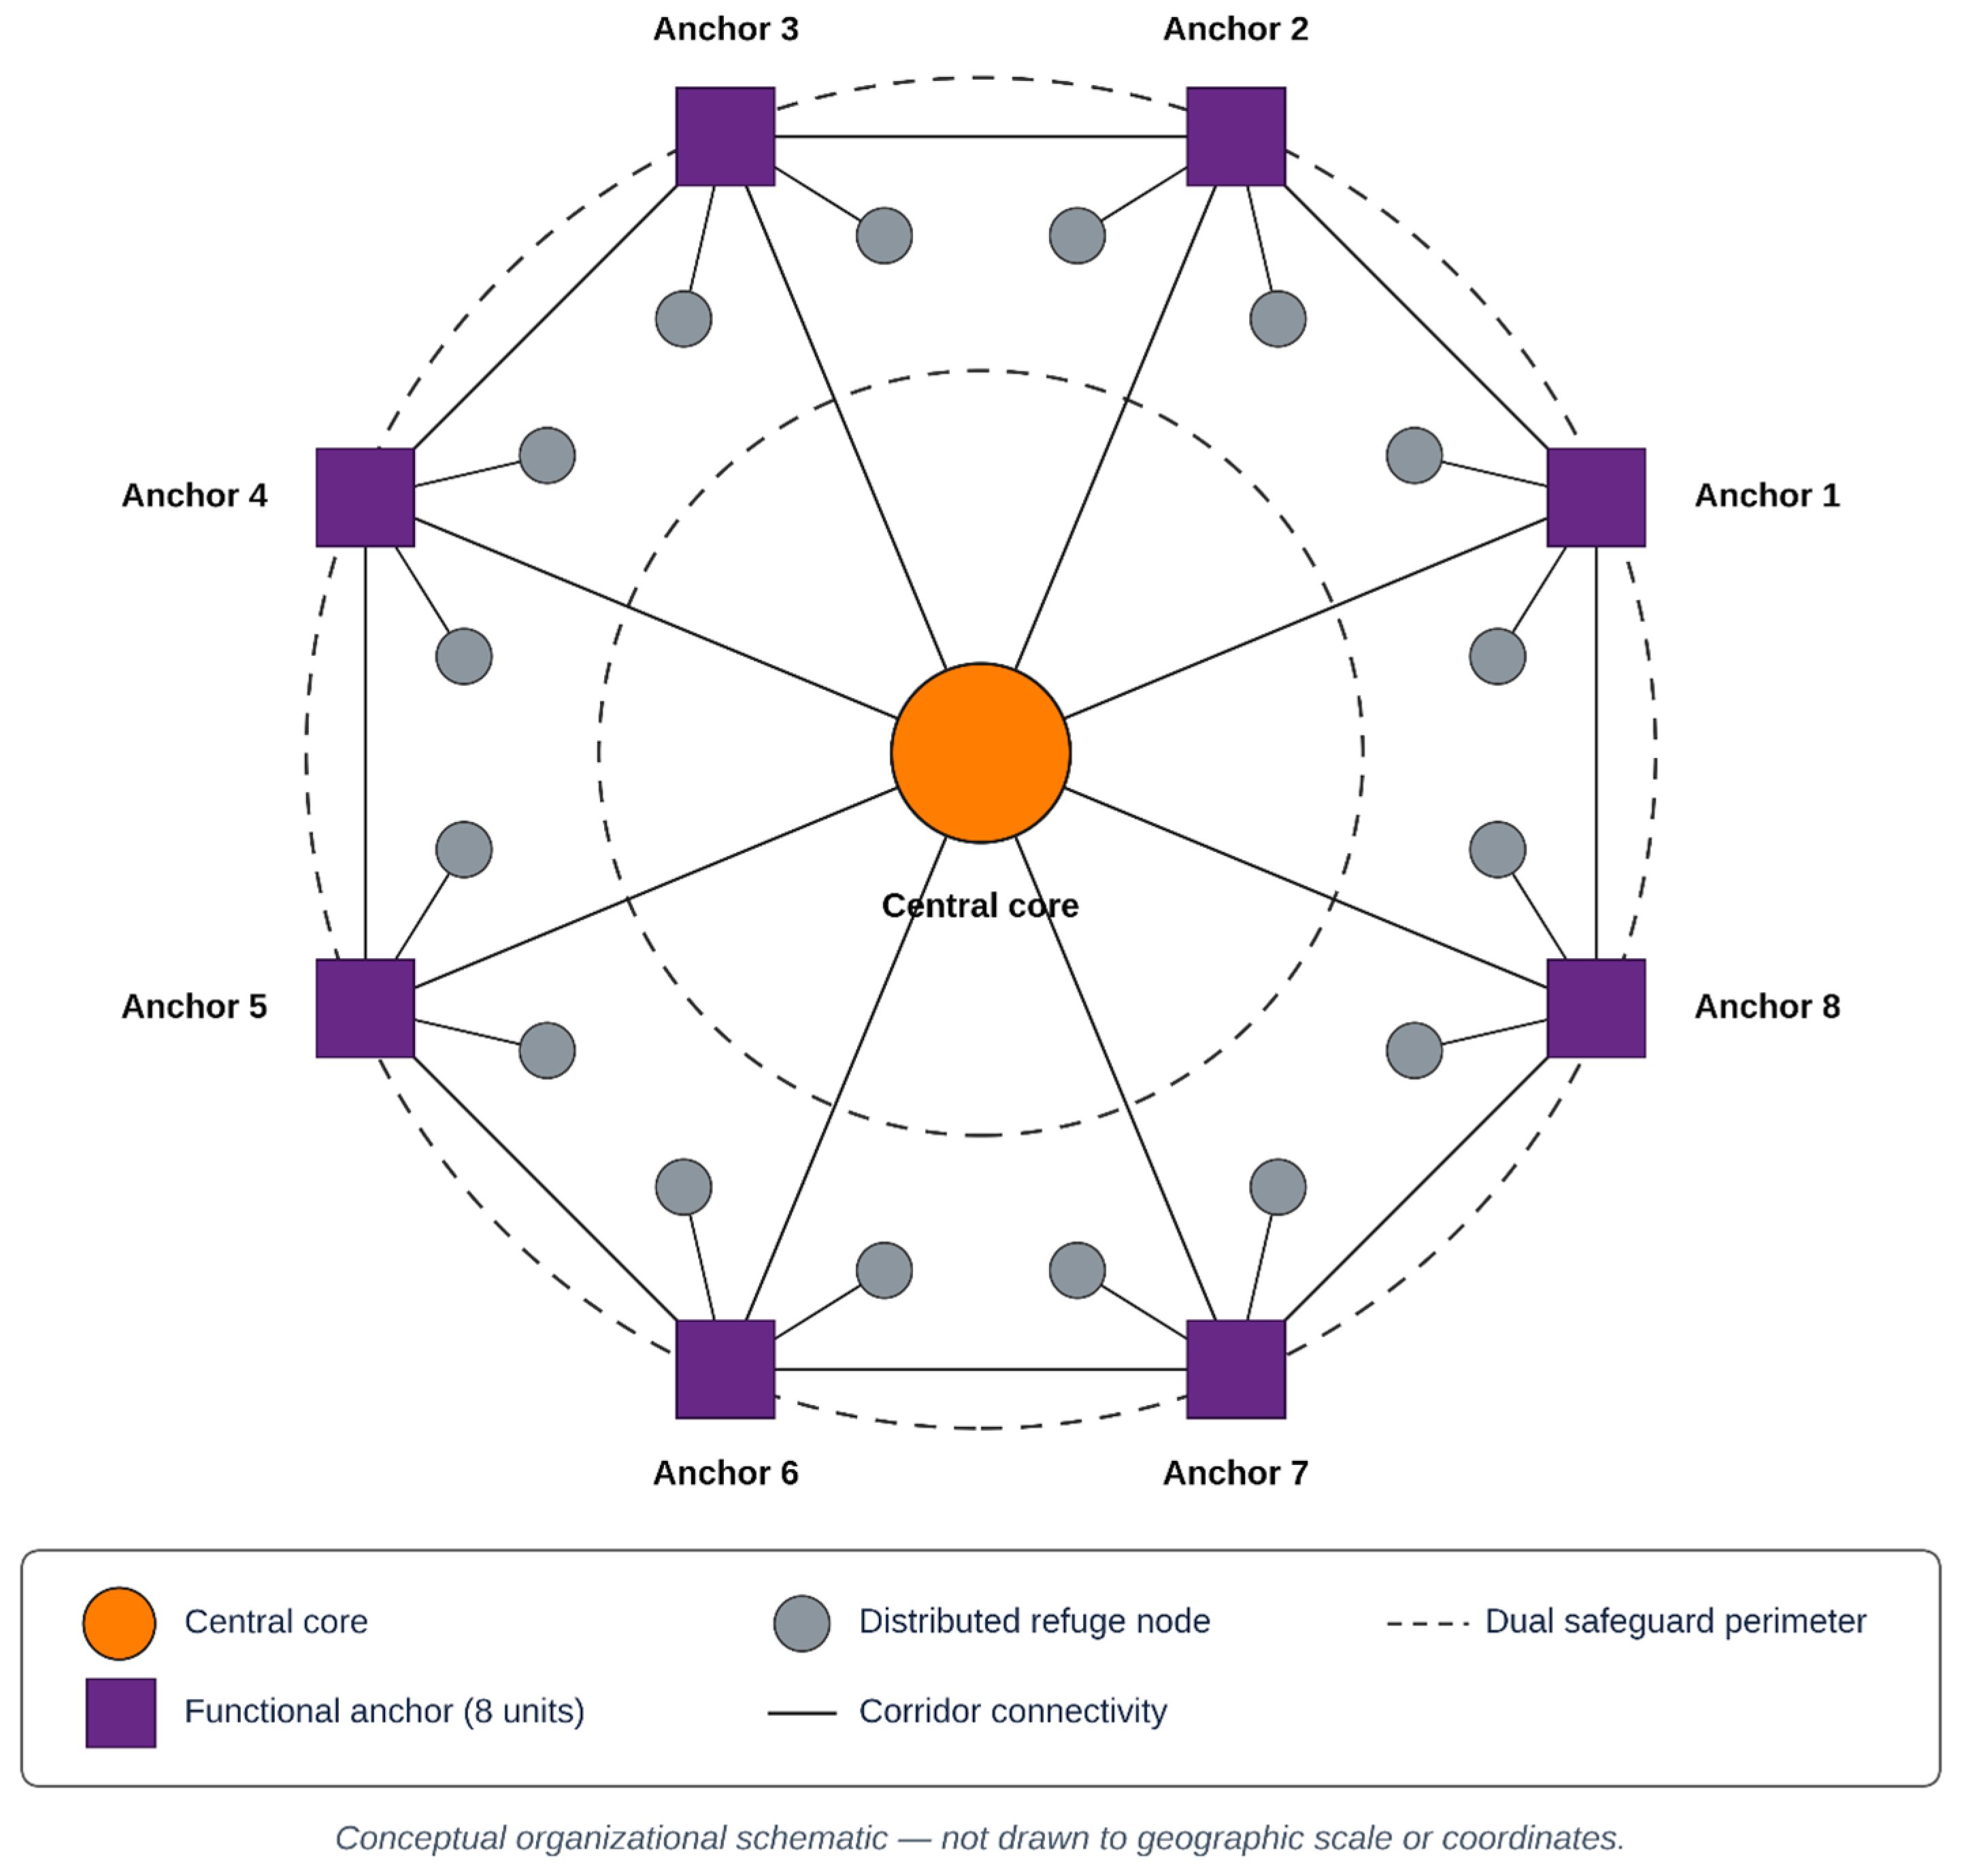
Aggregated by planning sectors, the framework’s outputs would translate into differentiated priorities—identifying sectors whose principal gap is short-range emergency access, those needing additional transitional (short-to-medium-term) capacity, and those requiring cross-sector coordination for long-term refuge. This sector view is the form in which the framework’s outputs would be most directly usable by planners. Figure 6 illustrates the conceptual sector-based DPRAGS planning structure.
Figure 6.
Conceptual DPRAGS spatial organization and sector-based planning structure (conceptual schematic; not to geographic scale). The sectors, hub, anchors, nodes, and corridors shown are hypothetical and do not represent locations derived from, or proposed for, Nantong.
Figure 7 summarizes the conceptual node–corridor–matrix structure of the proposed refuge network.
Figure 7.
Conceptual node–corridor–matrix structure of the proposed refuge network (conceptual schematic; not to geographic scale). The sectors, hub, anchors, nodes, and corridors shown are hypothetical and do not represent locations derived from, or proposed for, Nantong.
5. Discussion
5.1. Aggregate Provision and Resilience
The framework formalizes a point that aggregate open-space statistics obscure: refuge value is a function of hazard safety, spatial distribution, accessibility, and phase-specific capacity. Because each of these is represented explicitly, the framework is designed to identify potential local deficits masked by city-wide surpluses, which is the central planning implication of the approach [6,7].
5.2. Methodological Contribution
The principal contribution is the reproducible integration of four commonly separated components, with a common tier-specific demand-coverage outcome and a nested comparison that makes the effect of each component testable rather than assumed. The framework is designed for public spatial data, while expert inputs such as AHP matrices, refuge-demand fractions, hazard thresholds, and Gaussian decay parameters must be disclosed explicitly. Its value lies in making the integration explicit and auditable rather than in claiming improved performance for any individual component [9,14].
5.3. Transferability and Sustainability
The decision sequence transfers to other rapidly urbanizing coastal cities, subject to locally validated hazard data, population dynamics, refuge standards, and transport assumptions. By linking disaster-loss reduction with equitable access to multifunctional green space and efficient land use, the framework operationalizes SDG 11.5, 11.7, 11.b, and 13.1 at the level of concrete siting decisions [15,28,34,47,48].
5.4. Limitations and Next Steps
As a framework contribution, the paper does not present validated empirical results for Nantong. The reliance on a single pedestrian network representation, static phase-specific demand coefficients, and modelled rather than observed hazard surfaces remains a recognized simplification. The next applied step is to apply the workflow to Table 2 datasets and to validate the outputs primarily against historical disaster impacts, observed shelter or refuge use, and field or municipal evidence where available. Agreement with officially designated shelters should be treated as a descriptive comparison rather than as a gold standard, because the framework is intended to identify potential improvements to current provision.
5.5. Boundary Conditions and Validation Requirements
The conditional view of transferability also has practical implications for data. Because the framework is specified for widely available open datasets—administrative boundaries, open road networks, gridded population, remotely sensed land cover, and elevation—the barrier to applying it in a new city is lower than for approaches that depend on proprietary or locally bespoke inputs [1,4]. Conversely, open datasets differ in quality and recency across regions, which is itself a condition of transferability that an applied study must assess rather than assume. Stating this openly is preferable to a blanket claim of generalizability, and it points to a concrete validation step: comparing open-data-based inputs against authoritative local sources before the framework’s outputs are used to inform real decisions [49,50].
Frameworks of this kind are frequently criticized for asserting transferability without demonstrating it, or for treating heterogeneous settings as if a single analytical structure applied uniformly. The position taken here is deliberately conditional. What transfers is the decision sequence—screen candidates against restrictive multi-hazard criteria, classify them into nested duration-based tiers, evaluate network accessibility, and allocate a limited set of sites under finite capacity while reporting one explicit tier-specific demand-coverage outcome. What does not transfer automatically are the inputs to that sequence: hazard indicators and weights, population and refuge-demand fractions, applicable refuge standards, hazard thresholds, Gaussian decay parameters, and transport assumptions all require local specification and validation. A city with different dominant hazards, standards, or network topology should obtain different site configurations. Transferability is therefore a property of the method rather than a claim of outcome equivalence [15,51,52].
This conditional framing prevents conflating transferability with outcome equivalence: identical site configurations are neither expected nor required across cities. The transferable element is the decision sequence; locally specific hazards, demand, standards, and network assumptions determine the resulting configuration.
Three limitations follow directly and are acknowledged rather than minimized. First, the figures accompanying the illustrative application are conceptual schematics, not georeferenced analytical maps; georeferenced Nantong hazard, accessibility, allocation, and M1–M4 outputs remain an applied next step. Second, the framework uses a single conservative pedestrian-network representation and static demand; multimodal networks, network disruption, evacuation behaviour, and time-varying mobility should be tested in future applications [50]. Third, hazard surfaces depend on the spatial resolution and discriminating power of their indicators; coarse or nearly invariant inputs should not be interpreted as fine local evidence. Applied validation should prioritize historical event evidence and observed use where available, with current designated shelters used descriptively rather than as a target the model must reproduce [6,49].
These assumptions can be relaxed without changing the structure of Equations (4)–(8), because each enters the framework as an input. Time-varying demand can be represented by replacing Pi with daytime and night-time population estimates (for example, from mobile-phone or points-of-interest data) and solving the models for each time period. Evacuation behaviour that differs from ordinary walking can be represented by lower walking speeds or shorter maximum distances for groups with reduced mobility, applied to the corresponding share of Dit. Network disruption can be represented by removing or penalizing network links that intersect hazard footprints before shortest-path distances are computed, and multiple transport modes can be represented by adding the road network with mode-specific impedance for the longer-duration tiers.
5.6. Governance Relevance and Implementation Pathway
For a decision-support framework to be useful, it must connect to the levels at which planning decisions are actually made. The tiered structure maps naturally onto a multi-level governance arrangement. Emergency refuge green spaces, with short service radii and short occupancy periods, are primarily a community- and district-level concern, where relevant decisions focus on local siting, connectivity, and the removal of short-range access barriers. Short-to-medium-term refuge sits at the district scale, where transitional capacity and the coordination of several neighbourhoods become the operative questions. Long-term refuge, with the largest service radius and the most demanding capacity requirements, is a city-scale concern requiring cross-district coordination and the reservation of substantial sites. Presenting the framework’s outputs at these matching scales allows each level of government to act on the part of the analysis it controls, rather than receiving a single undifferentiated map [24,25,26].
An implementation pathway follows from this structure. A first phase assembles the public data architecture and validates it against local records; a second phase runs the multi-hazard screening and suitability classification to establish the candidate pool; a third evaluates accessibility and solves the allocation across the relevant range of facility counts, producing the coverage–facility curve used to evaluate budget-constrained decisions; and a fourth translates the selected configuration into tier- and sector-specific priorities for the responsible administrative levels. Because each phase consists of documented computational steps with specified parameters, the pathway is auditable and can be repeated as data, standards, or urban form change, which is essential if refuge planning is to remain current rather than fixed at a single point in time [53,54]. This staged, reproducible pathway also enables the framework to support the Sustainable Development Goals in an operational rather than rhetorical way, connecting disaster-loss reduction and equitable access to green space to concrete, reversible siting decisions [2,15].
5.7. Future Research Directions
The most immediate research extension is an applied validation study that applies the workflow to the datasets of Table 2 to produce georeferenced hazard, accessibility, allocation, and M1–M4 comparison outputs for Nantong. Validation should prioritize historical disaster impacts, observed shelter or refuge use, and other independent evidence where available; designated shelters are useful as a descriptive benchmark but should not be treated as a gold standard that the framework must reproduce. Because the computational steps and the required expert and local inputs are explicitly specified, such a study can provide a direct empirical test of the framework.
Adding to this initial application, three methodological directions would strengthen the approach. First, replacing static demand with time-varying, mobility-aware population estimates would capture how refuge needs change between day and night and during an evacuation, improving the realism of the accessibility outputs [34]. Second, extending the single pedestrian network to a multimodal representation would let longer-range tiers reflect vehicular as well as walking access, which matters most for long-term refuge over larger service areas. Third, incorporating cascading and compound-hazard scenarios—such as earthquake-induced fire or a flood that blocks evacuation routes—would test the robustness of a proposed network under correlated rather than independent hazards.
Finally, applying the framework across several contrasting cities would move it from a single illustration toward a comparative evidence base, clarifying which planning conclusions are general and which depend on locally specific hazards, standards, or urban form. Such a cross-city application, combined with sensitivity analysis over its key parameters, would establish both the robustness and the boundary conditions of the approach and connect outputs generated from the reproducible specification to the operational pursuit of the Sustainable Development Goals [15,55].
6. Conclusions
The present study proposes a reproducible decision-support framework that integrates multi-hazard risk assessment, nested tiered suitability screening, phase-specific supply and demand, network accessibility, and splittable capacity-constrained allocation within a single analytical specification for disaster-prevention and relief-accessible green spaces. Nantong is used as an illustrative case rather than as a completed empirical demonstration. The specification sets out how each component is computed and how its contribution can be tested, but the effectiveness of the framework in Nantong remains to be established with real local inputs and validation evidence.
The framework addresses the three research questions by: (1) specifying a reproducible workflow that integrates the four components; (2) representing refuge demand and supply across emergency, short-to-medium-term, and long-term response phases with nested site eligibility; and (3) specifying an M1–M4 comparison in which every model is evaluated by the same tier-specific demand-coverage metric, while raw Ga2SFCA accessibility and capacity utilization remain separate diagnostics. The principal methodological contribution is therefore the transparent integration of components commonly treated separately, not the invention of the individual methods. Transferability applies to the decision architecture; locally specific hazards, expert judgements, demand coefficients, standards, and network assumptions must be replaced and validated for each city.
The study does not report validated empirical coverage, accessibility, or allocation results for Nantong. The immediate next step is to assemble the Nantong spatial layers, elicit the AHP matrices and refuge-demand fractions, specify locally justified hazard thresholds and decay parameters, execute the workflow, and validate the resulting georeferenced outputs against independent historical and observed evidence.
Author Contributions
Conceptualization, F.D.C.; methodology, F.D.C.; software, F.D.C.; investigation, F.D.C.; resources, S.Z.; writing—original draft, F.D.C.; writing—review and editing, F.D.C. and S.Z.; visualization, F.D.C.; supervision, S.Z.; funding acquisition, S.Z. All authors have read and agreed to the published version of the manuscript.
Funding
This research was funded by the Natural Science Foundation of Jiangsu Province (grant number BK20230618).
Data Availability Statement
The analytical protocol, model specification, parameters, software environment, and executable implementation scripts supporting the DPRAGS framework are archived at Figshare (DOI: 10.6084/m9.figshare.33338466) under a CC BY 4.0 licence. The current archive contains the DPRAGS v2.0 executable implementation, including demand-grid construction, network snapping, restrictive multi-hazard eligibility, raw Ga2SFCA calculation, splittable capacity-constrained allocation, sensitivity analysis, and a synthetic end-to-end smoke test (tests/run_smoke_test.py, 23 checks), which the package passes in the specified software environment. City-specific input layers, expert-elicited AHP matrices, refuge-demand fractions, and executed Nantong outputs are not included; public input datasets are identified by source, version, and licence and are not redistributed.
Acknowledgments
During preparation and revision of this manuscript, the authors used Grammarly Pro (online version, accessed 2026; Grammarly Inc., San Francisco, CA, USA) for language editing to assist with drafting and editing revised text, preparing the response to reviewers, and developing and testing the v2.0 software implementation and its documentation. AI-assisted tools were also used to prepare the conceptual schematic figures. The authors reviewed, verified, and revised all AI-assisted text, code, and figures. The figures are illustrative conceptual schematics and are not presented as empirical, georeferenced, or model-generated spatial results. The authors take full responsibility for the scientific content, interpretation, and final presentation of the paper.
Conflicts of Interest
The authors declare no conflicts of interest.
References
- Hansen, R.; Pauleit, S. From multifunctionality to multiple ecosystem services? A conceptual framework for multifunctionality in green infrastructure planning for urban areas. Ambio 2014, 43, 516–529. [Google Scholar] [CrossRef] [Scilit] [PubMed]
- Mukherjee, M.; Takara, K. Urban green space as a countermeasure to increasing urban risk and the UGS-3CC resilience framework. Int. J. Disaster Risk Reduct. 2018, 28, 854–861. [Google Scholar] [CrossRef] [Scilit]
- Meerow, S.; Newell, J.P. Spatial planning for multifunctional green infrastructure: Growing resilience in Detroit. Landsc. Urban Plan. 2017, 159, 62–75. [Google Scholar] [CrossRef] [Scilit]
- Li, Z.; Yan, W. Service flow changes in multilayer networks: A framework for measuring urban disaster resilience based on availability to critical facilities. Landsc. Urban Plan. 2024, 244, 104996. [Google Scholar] [CrossRef] [Scilit]
- Liang, H.; Yan, Q.; Yan, Y.; Zhang, Q. Exploring the provision, efficiency and improvements of urban green spaces on accessibility at the metropolitan scale. J. Environ. Manag. 2024, 352, 120118. [Google Scholar] [CrossRef] [Scilit] [PubMed]
- Huang, B.-X.; Li, W.-Y.; Ma, W.-J.; Xiao, H. Space Accessibility and Equity of Urban Green Space. Land 2023, 12, 766. [Google Scholar] [CrossRef] [Scilit]
- Zhou, Y.; Xie, H.; Liu, X.; Wang, X.; Wang, Z. From service capacity to spatial equity: Accurately and comprehensively evaluating urban park green space distribution under multi-trips mode. PLoS ONE 2024, 19, e0296629. [Google Scholar] [CrossRef] [PubMed]
- Malczewski, J. GIS-based multicriteria decision analysis: A survey of the literature. Int. J. Geogr. Inf. Sci. 2006, 20, 703–726. [Google Scholar] [CrossRef] [Scilit]
- Zhang, L.; Chen, P.F.; Hui, F.M. Refining the accessibility evaluation of urban green spaces with multiple sources of mobility data: A case study in Shenzhen, China. Urban For. Urban Green. 2022, 70, 127550. [Google Scholar] [CrossRef] [Scilit]
- Hu, S.J.; Song, W.; Li, C.G.; Lu, J. A multi-mode Gaussian-based two-step floating catchment area method for measuring accessibility of urban parks. Cities 2020, 105, 102815. [Google Scholar] [CrossRef] [Scilit]
- Nyimbili, P.H.; Erden, T. A Hybrid Approach Integrating Entropy-AHP and GIS for Suitability Assessment of Urban Emergency Facilities. Isprs Int. J. Geo-Inf. 2020, 9, 419. [Google Scholar] [CrossRef] [Scilit]
- Church, R.; ReVelle, C. The maximal covering location problem. In Papers of the Regional Science Association; Springer: Berlin/Heidelberg, Germany, 1974; Volume 32, pp. 101–118. [Google Scholar] [CrossRef] [Scilit]
- Chen, Y.; La Rosa, D.; Yue, W.; Xu, Z.; Zhuo, Y. Do larger cities enjoy better green space accessibility? Evidence from China. Environ. Impact Assess. Rev. 2024, 107, 107544. [Google Scholar] [CrossRef] [Scilit]
- Battiston, A.; Schifanella, R. On the need for a multi-dimensional framework to measure accessibility to urban green. npj Urban Sustain. 2024, 4, 10. [Google Scholar] [CrossRef] [Scilit]
- Meerow, S.; Newell, J.P.; Stults, M. Defining urban resilience: A review. Landsc. Urban Plan. 2016, 147, 38–49. [Google Scholar] [CrossRef] [Scilit]
- Ma, Y.J.; Liu, B.Y.; Zhang, K.W.; Yang, Y.M. Incorporating multi-criteria suitability evaluation into multi-objective location-allocation optimization comparison for earthquake emergency shelters. Geomat. Nat. Hazards Risk 2022, 13, 2333–2355. [Google Scholar] [CrossRef] [Scilit]
- Cao, Y.L.; Guo, Y.H.; Wang, C.; Li, Y.Y. Evaluation and Optimization of Refuge Green Space in the Central Area of Tianjin for Geological Disasters. Sustainability 2022, 14, 15507. [Google Scholar] [CrossRef] [Scilit]
- Jiang, Y.C.; Lv, A.F.; Yan, Z.G.; Yang, Z. A GIS-Based Multi-Criterion Decision-Making Method to Select City Fire Brigade: A Case Study of Wuhan, China. Isprs Int. J. Geo-Inf. 2021, 10, 777. [Google Scholar] [CrossRef] [Scilit]
- Luo, W.; Qi, Y. An enhanced two-step floating catchment area (E2SFCA) method for measuring spatial accessibility to primary care physicians. Health Place 2009, 15, 1100–1107, Erratum in Health Place 2011, 17, 394. https://doi.org/10.1016/j.healthplace.2010.10.006. [Google Scholar] [CrossRef] [Scilit] [PubMed]
- Liang, H.L.; Yan, Q.; Yan, Y.J.; Zhang, Q.P. Using an improved 3SFCA method to assess inequities associated with multimodal accessibility to green spaces based on mismatches between supply and demand in the metropolitan of Shanghai, China. Sustain. Cities Soc. 2023, 91, 104456. [Google Scholar] [CrossRef] [Scilit]
- Ma, Y.J.; Xu, W.; Qin, L.J.; Zhao, X.J.; Du, J. Emergency shelters location-allocation problem concerning uncertainty and limited resources: A multi-objective optimization with a case study in the Central area of Beijing, China. Geomat. Nat. Hazards Risk 2019, 10, 1242–1266. [Google Scholar] [CrossRef] [Scilit]
- Tun, K.Z.; Pramanik, M.; Chakrabortty, R.; Chowdhury, K.; Halder, B.; Pande, C.B.; Mukhopadhyay, A.; Zhran, M. Mainstreaming Nature-Based Solutions for Climate Adaptation in Southeast Asia: A Systematic Review. Earth Syst. Environ. 2024, 9, 1333–1351. [Google Scholar] [CrossRef] [Scilit]
- Li, W.J.; Zhai, G.F.; Chen, W. Location-allocation of fixed shelters for the elderly from the perspective of needs for refuge: A case of Hefei, China. Int. J. Disaster Risk Reduct. 2023, 92, 103717. [Google Scholar] [CrossRef] [Scilit]
- Chen, W.; Zhai, G.F.; Fan, C.J.; Jin, W.B.; Xie, Y. A planning framework based on system theory and GIS for urban emergency shelter system: A case of Guangzhou, China. Hum. Ecol. Risk Assess. 2017, 23, 441–456. [Google Scholar] [CrossRef] [Scilit]
- Jiang, X.; Song, J.S.; Lin, Y.Y.; Gong, Y.X. A practical approach to constructing hierarchical networks for urban hazard mitigation planning using GIS: The case of Futian, Shenzhen. Int. J. Disaster Risk Reduct. 2018, 28, 629–639. [Google Scholar] [CrossRef] [Scilit]
- Li, H.Y.; Zhao, L.J.; Huang, R.B.; Hu, Q.M. Hierarchical earthquake shelter planning in urban areas: A case for Shanghai in China. Int. J. Disaster Risk Reduct. 2017, 22, 431–446. [Google Scholar] [CrossRef] [Scilit]
- Chen, Z.; Liu, Q.; Li, M.; Xu, D. A New Strategy for Planning Urban Park Green Spaces by Considering Their Spatial Accessibility and Distributional Equity. Forests 2024, 15, 570. [Google Scholar] [CrossRef] [Scilit]
- Feng, L.M.; Mi, X.Y.; Yuan, D.C. Optimal planning of urban greening system in response to urban microenvironments in a high-density city using genetic algorithm: A case study of Tianjin. Sustain. Cities Soc. 2022, 87, 104244. [Google Scholar] [CrossRef] [Scilit]
- Fei, W.J.; Lu, D.X.; Li, Z.X. Research on the layout of urban disaster-prevention and risk-avoidance green space under the improvement of supply and demand match: The case study of the main urban area of Nanjing, China. Ecol. Indic. 2023, 154, 110657. [Google Scholar] [CrossRef] [Scilit]
- GB 18306-2015; Seismic Ground Motion Parameters Zonation Map of China. General Administration of Quality Supervision, Inspection and Quarantine of the People’s Republic of China and Standardization Administration of China: Beijing, China, 2015.
- Zuo, Y.; Ding, X.; Wei, Y.; Wang, W.; Wang, M. GIS-based accessibility analysis of urban park green space landscape. Sci. Rep. 2025, 15, 28498. [Google Scholar] [CrossRef] [Scilit] [PubMed]
- Wu, L.F.; Kim, S.K. Exploring the equality of accessing urban green spaces: A comparative study of 341 Chinese cities. Ecol. Indic. 2021, 121, 107080. [Google Scholar] [CrossRef] [Scilit]
- He, H.K.; Lu, Y.C.; Wang, L.G. Assessment of Urban Green Space Ecological Service Value and Sustainable Development in China: A National-Scale Analysis (1996–2024). Sustainability 2026, 18, 8450. [Google Scholar] [CrossRef] [Scilit]
- Zhang, Y.P.; Zhang, J.J.; Shi, X.L.; Dai, Y.X. Accessibility analysis and optimization strategies of green spaces for enhancing climate resilience: Equity-oriented insights from megacities. Environ. Sci. Policy 2025, 173, 104234. [Google Scholar] [CrossRef] [Scilit]
- GB 51143-2015; Code for Design of Disasters Mitigation Emergency Congregate Shelter. Ministry of Housing and Urban-Rural Development of the People’s Republic of China: Beijing, China, 2015.
- GB/T 44013-2024; Emergency Shelter—Grading and Classification. State Administration for Market Regulation and Standardization Administration of China: Beijing, China, 2024.
- Xu, Y.; Wang, W.; Chen, H.; Qu, M. Multicriteria assessment of the response capability of urban emergency shelters: A case study in Beijing. Nat. Hazards Res. 2024, 4, 324–335. [Google Scholar] [CrossRef] [Scilit]
- Kızılkan, Y.; Birinci, S. Integration of GIS and MCDM for temporary shelter site selection in earthquake-risk zone: A case study with sensitivity analysis. Nat. Hazards 2026, 122, 469. [Google Scholar] [CrossRef] [Scilit]
- Federal Emergency Management Agency. Hazus Earthquake Model Technical Manual: Hazus 6.1; Federal Emergency Management Agency: Washington, DC, USA, 2024. Available online: https://www.fema.gov/sites/default/files/documents/fema_hazus-earthquake-model-technical-manual-6-1.pdf (accessed on 10 October 2026).
- Zhang, J.M.; Yue, W.Z.; Fan, P.L.; Gao, J.B. Measuring the accessibility of public green spaces in urban areas using web map services. Appl. Geogr. 2021, 126, 102381. [Google Scholar] [CrossRef] [Scilit]
- Li, Z.; Bai, X.; Xu, Z.; Ma, H.; Xu, Y.; Wang, N.; Yue, X. The optimal spatial delineation method for the service level of urban park green space from the perspective of opportunity equity. Environ. Sci. Pollut. Res. Int. 2023, 30, 85520–85533. [Google Scholar] [CrossRef] [Scilit] [PubMed]
- Teixeira, J.C.V. Public Facility Planning Models with Single and Multiple Services: Models, Solution Methods and Applications; Universidade de Coimbra: Coimbra, Portugal, 2012. [Google Scholar]
- Berman, O.; Krass, D. The generalized maximal covering location problem. Comput. Oper. Res. 2002, 29, 563–581. [Google Scholar] [CrossRef] [Scilit]
- Gao, S.; Zhai, W.; Fu, X. Green space justice amid COVID-19: Unequal access to public green space across American neighborhoods. Front. Public Health 2023, 11, 1055720. [Google Scholar] [CrossRef] [Scilit] [PubMed]
- Li, Y.; Du, C.; Li, B. Optimizing two-step floating catchment area for green space accessibility and equity: Is mountainous green space more age friendly? Ann. N. Y. Acad. Sci. 2025, 1551, 280–293. [Google Scholar] [CrossRef] [Scilit] [PubMed]
- Lu, Y.; Chen, R.; Chen, B.; Wu, J. Inclusive green environment for all? An investigation of spatial access equity of urban green space and associated socioeconomic drivers in China. Landsc. Urban Plan. 2024, 241, 104926. [Google Scholar] [CrossRef] [Scilit]
- Miller, J.D.; Vesuviano, G.; Wallbank, J.R.; Fletcher, D.H.; Jones, L. Hydrological assessment of urban Nature-Based Solutions for urban planning using Ecosystem Service toolkit applications. Landsc. Urban Plan. 2023, 234, 104737. [Google Scholar] [CrossRef] [Scilit]
- Clement, F.D.; Zhou, S.; Mehdipour, A. Healthy Buildings and Climate-Resilient Cities: The Case of Nantong City as Community-Level Interventions. In Designing Healthy Buildings and Communities; Urban Sustainability; Springer: Singapore, 2025; Chapter 9; pp. 167–188. [Google Scholar]
- Bin, L.; Xu, K.; Pan, H.; Zhuang, Y.; Shen, R. Urban flood risk assessment characterizing the relationship among hazard, exposure, and vulnerability. Environ. Sci. Pollut. Res. Int. 2023, 30, 86463–86477. [Google Scholar] [CrossRef] [Scilit] [PubMed]
- Zhang, X.; Yu, J.; Chen, Y.; Wen, J.; Chen, J.; Yin, Z. Supply–Demand Analysis of Urban Emergency Shelters Based on Spatiotemporal Population Estimation. Int. J. Disaster Risk Sci. 2020, 11, 519–537. [Google Scholar] [CrossRef] [Scilit]
- Jiao, H.; Feng, S. Towards resilient cities: Optimizing shelter site selection and disaster prevention life circle construction using GIS and supply-demand considerations. Sustainability 2024, 16, 2345. [Google Scholar] [CrossRef] [Scilit]
- Zhao, G.; Hui, X.; Zhao, F.; Feng, L.; Lu, Y.; Zhang, Y. How does social capital facilitate community disaster resilience? A systematic review. Front. Environ. Sci. 2025, 12, 1496813. [Google Scholar] [CrossRef] [Scilit]
- Zhang, Z.; Yan, Y.; Qiu, J.; Song, Y.; Wang, D.; Tang, B. Research on the Emergency Shelter Accessibility in Urban Communities. J. Risk Anal. Crisis Response 2017, 7, 230–237. [Google Scholar] [CrossRef] [Scilit]
- Li, Q.P.; Ba, Y.F.; Huang, H.B.; Shi, C.Y. Geospatial analysis of emergency shelter accessibility under flood-induced road disruptions: A case study of central Guangzhou, China. Geo-Spat. Inf. Sci. 2026, 29, 2910–2928. [Google Scholar] [CrossRef] [Scilit]
- Ge, Y.; Jia, W.; Zhao, H.; Xiang, P. A framework for urban resilience measurement and enhancement strategies: A case study in Qingdao, China. J. Environ. Manag. 2024, 367, 122047. [Google Scholar] [CrossRef] [Scilit] [PubMed]

Disclaimer/Publisher’s Note: The statements, opinions and data contained in all publications are solely those of the individual author(s) and contributor(s) and not of MDPI and/or the editor(s). MDPI and/or the editor(s) disclaim responsibility for any injury to people or property resulting from any ideas, methods, instructions or products referred to in the content. |
© 2026 by the authors. Licensee MDPI, Basel, Switzerland. This article is an open access article distributed under the terms and conditions of the Creative Commons Attribution (CC BY) license.