


Abstract
Heritage spaces are gradually transforming from traditional conservation objects into dynamic resources that promote urban regeneration and regional development. However, their long-term vitality changes and associated influencing factors remain insufficiently understood. This study investigates national-level heritage spaces in the Yangtze River Delta, including national-level historic and cultural blocks, historic and cultural towns, and tourism and leisure blocks. An analytical framework integrating nighttime light remote sensing data, economic development indicators, population characteristics, and spatial location conditions was established to examined long-term locational vitality changes (as reflected by nighttime light intensity), spatial differentiation, and associated influencing factors of heritage spaces. The results show that (1) from 2000 to 2022, national-level heritage spaces in the Yangtze River Delta exhibited an overall significant increase in nighttime light intensity, indicating positive locational dynamism during the study period, although substantial differences existed among individual sites; (2) different types of heritage spaces demonstrated significantly different nighttime light change patterns, with spatial distributions showing clustering characteristics mainly concentrated in core urban areas; and (3) the evolution of locational vitality of heritage spaces was jointly influenced by economic conditions and population characteristics. A stronger service-oriented economic structure was associated with greater vitality enhancement, while population-related factors exhibited scale-dependent associations. County-level population density showed a negative relationship with vitality growth, whereas local population density around heritage spaces was not statistically significant, suggesting that population concentration alone does not necessarily guarantee vitality improvement. This study reveals the locational vitality transformation of national-level heritage spaces from conservation toward adaptive development, as reflected by nighttime light changes, from a long-term dynamic perspective and establishes a multi-scale influencing factor analysis framework, providing theoretical support and empirical references for the classification, adaptive utilization, and sustainable development of heritage spaces.
1. Introduction
In the context of global urban regeneration and sustainable development transformation, cultural heritage has gradually shifted from a traditional static conservation object to a dynamic resource that promotes spatial transformation and local development [1,2]. In recent years, heritage spaces such as historic and cultural blocks, historic and cultural towns, and tourism and leisure blocks have no longer been regarded merely as physical carriers of historical memory and cultural values, but have increasingly been recognized as complex systems integrating cultural resources, spatial structures, social activities, and economic processes [3,4,5]. Based on the concept of Historic Urban Landscape, heritage conservation and urban development are no longer considered conflicting objectives; instead, they can achieve synergy through conservation, utilization, and adaptive transformation, allowing cultural heritage to become an important resource for promoting urban regeneration, enhancing spatial resilience, and supporting regional sustainable development [6,7].
This perspective aligns with the broader international discourse on heritage-led urban regeneration, which has emphasized that cultural heritage is not merely a passive remnant of the past, but an active agent in shaping contemporary urban development [8]. Scholars have increasingly called for moving beyond preservation-only approaches toward adaptive reuse strategies that integrate heritage assets into urban economic and social systems [9]. As Ranjbar et al. [8] demonstrated through a comprehensive study of 170 culture-led regeneration projects in Iran, cultural interventions have significantly strengthened local identity and revitalized public spaces in historic urban areas, providing evidence from the Global South that parallels experiences documented in Western cities [10].
In China, this transformation has been accompanied by the gradual improvement of the national historic and cultural heritage conservation system [11,12]. Different types of heritage spaces, including historic and cultural blocks, historic and cultural towns, and tourism and leisure blocks, have been incorporated into a hierarchical and phased national recognition system [13]. Institutional recognition not only reflects the transition of China’s heritage governance from a single emphasis on conservation toward a balanced approach integrating conservation and utilization, but also creates differences among heritage spaces in terms of policy implementation timing, resource allocation conditions, and development trajectories [14]. However, whether institutionalized conservation is associated with different levels of long-term change in surrounding economic activity intensity, whether different types of heritage spaces exhibit differentiated development trajectories, and how regional socioeconomic conditions are associated with heritage space transformation remain insufficiently verified.
Existing studies on historic and cultural space development have mainly focused on heritage conservation strategies, spatial regeneration approaches, and typical case practices, providing important foundations for understanding the relationship between cultural heritage conservation and urban development [15,16,17]. The international literature on heritage locational vitality has increasingly employed quantitative methods to assess the dynamism of historic spaces. Recent studies have utilized multi-source spatial data—including mobile phone signaling, GPS trajectories, social media check-ins, and point-of-interest (POI) distributions—to capture human activity intensity and spatial vitality at fine resolutions [18,19]. In the specific context of historic districts, Hu and Li [20] used SDGSAT-1 nighttime light imagery and historical GIS to assess the economic vitality of historical towns in suburban Shanghai, demonstrating the utility of nighttime light as a proxy for heritage vitality assessment. Similarly, Zhang et al. [18] developed a multi-dimensional vitality assessment framework for historic districts, integrating spatial configuration analysis with socio-economic indicators to reveal differentiated regeneration strategies. However, several research gaps remain.
First, insufficient attention has been paid to the long-term evolutionary processes of heritage spaces. Spatial vitality is not a short-term outcome, but a dynamic process continuously shaped by the accumulation of economic activities, population agglomeration, and policy interventions [21]. Existing studies have often evaluated heritage values or regeneration outcomes based on single time points, making it difficult to reveal long-term development trajectories [17,22,23]. Particularly under institutionalized conservation, whether differences in recognition timing lead to variations in vitality growth remains insufficiently examined through long-term empirical analysis [24].
Second, different types of heritage spaces have distinct functional orientations and development models; however, existing studies have mostly focused on individual cases, lacking cross-type comparisons based on a unified evaluation framework [25,26]. Historic and cultural blocks are typically embedded in high-density urban environments, where their development is strongly influenced by urban regeneration and functional restructuring. Historic and cultural towns often achieve value transformation through traditional spatial resources and tourism development, while tourism and leisure blocks represent the integration of cultural consumption and commercial activities [27,28,29]. Therefore, whether different heritage types exhibit significant differences in development outcomes and whether their long-term locational vitality evolution follows type-specific patterns require further quantitative investigation.
Third, heritage space transformation is influenced by multi-scale factors. Location conditions, regional economic development levels, and population agglomeration environments jointly shape the development potential of heritage spaces [30,31]. However, few studies have established an integrated multi-scale analytical framework to systematically identify the mechanisms through which different factors influence long-term vitality evolution.
Based on these research gaps, this study focuses on national-level heritage spaces in the Yangtze River Delta (YRD), including national-level historic and cultural blocks, national-level historic and cultural towns, and national-level tourism and leisure blocks. The YRD was selected as the empirical context because it represents one of the most urbanized and economically dynamic regions in China, with a dense concentration of national-level heritage spaces and substantial socioeconomic transformation over recent decades. These characteristics provide an appropriate setting for examining how heritage locational vitality evolves under the interaction of conservation policies, economic development, and population dynamics. An analytical framework integrating nighttime light remote sensing data, economic development indicators, population characteristics, and spatial location conditions is established to investigate the long-term transformation process of heritage spaces from three perspectives: temporal evolution, type differences, and influencing factors.
The main contributions of this study are as follows: (1) It reveals the long-term nighttime light-based locational vitality change process of heritage spaces. By using nighttime light remote sensing data from 2000 to 2022, this study characterizes long-term development changes in heritage spaces and combines statistical tests to analyze vitality growth differences among samples with different recognition stages, revealing different vitality change patterns under institutionalized conservation contexts. (2) It identifies differentiated development pathways among different heritage types. Based on a unified sample framework, this study compares historic and cultural blocks, historic and cultural towns, and tourism and leisure blocks to reveal heterogeneity in nighttime light growth levels and development patterns. (3) It establishes a multi-scale influencing factor framework based on hierarchical regression models for heritage space locational vitality evolution. By incorporating spatial location, regional economic development, and population agglomeration factors, this study applies multi-factor regression models to identify the effects of factors operating at different scales on heritage space vitality evolution. Specifically, county-level indicators were used to represent the regional socioeconomic context, including economic development and population density, while population density within a 1.5 km buffer was adopted to characterize the local surrounding environment of heritage spaces. In addition, distance to upper-tier cities was included to capture broader regional accessibility and urban spillover effects. This multi-scale framework provides empirical evidence for understanding the relationship between cultural heritage conservation and regional development.
2. Materials and Methods
2.1. Study Area
The YRD was selected as the study area (Figure 1); it is located in the lower reaches of the Yangtze River (27°02′–35°08′ N, 114°54′–123°10′ E). The YRD is defined at the provincial level, encompassing the administrative territories of Shanghai, Jiangsu, Zhejiang, and Anhui, following the Outline of the Integrated Regional Development of the Yangtze River Delta [32]. This administrative definition was adopted for three reasons: (1) policy alignment—it represents the official regional boundary used for integrated development planning; (2) data consistency—county-level economic and demographic statistics, which form the basis of our explanatory variables, are systematically compiled and reported within this provincial framework; and (3) heritage coverage—it encompasses the full range of national-level heritage spaces in the region, from highly urbanized historic blocks to peripheral traditional settlements. As one of the most urbanized and economically dynamic regions in China, the YRD covers approximately 358,000 km2, accounting for only 3.7% of China’s land area. It was home to approximately 16.8% of the national population and contributed 24.1% of China’s Gross Domestic Product (GDP) in 2022, making it one of the major economic regions in China [33,34].
Figure 1.
Study area (source: adapted from [34]): (a) the location in China; (b) administrative division of the YRD. Basemap obtained from the Standard Map Service System of the Ministry of Natural Resources of China (Map approval number: GS (2024) 0650).
The region is also characterized by a high concentration of historical and cultural resources. It includes historic and cultural blocks located within highly urbanized areas such as Shanghai, Nanjing, and Hangzhou, as well as numerous traditional historic and cultural towns and tourism-oriented historic spaces, forming diverse types of heritage spaces ranging from highly urbanized areas to peripheral historic settlements [18]. The YRD was therefore selected for three reasons: (1) it provides a representative context of strong socioeconomic development for examining the relationship between regional economic conditions and heritage vitality; (2) it contains a high concentration and diversity of national-level heritage spaces, offering sufficient sample size and type variation for comparative analysis; and (3) it exhibits significant internal heterogeneity, ranging from highly urbanized core areas to peripheral traditional settlements, enabling an examination of how different spatial contexts influence heritage vitality evolution. Within this provincial boundary, national-level heritage spaces were identified as analytical units. The provincial boundary serves as the spatial frame for data collection and variable measurement, while the heritage spaces themselves constitute the units of analysis.
2.2. Data Sources and Preprocessing
The basic data used in this study were obtained from a dataset published by researchers from Zhejiang University of Technology [35]. The research objects are national-level historic areas represented by three types of heritage spaces: national-level historic and cultural blocks, historic and cultural towns, and tourism and leisure blocks. These three categories were selected based on three criteria: institutional representativeness (all are formally recognized within China’s national heritage conservation system), functional differentiation (historic and cultural blocks are embedded in urban built environments; historic and cultural towns preserve traditional settlement structures; and tourism and leisure blocks emphasize heritage resources integrated with tourism consumption and service activities), and comparative analytical value (their inclusion enables a systematic comparison of differentiated locational vitality evolution across heritage types).
The selected samples cover a diverse range of heritage spaces across the four provincial-level regions. Historic and cultural blocks are primarily located in major urban centers such as Shanghai, Nanjing, and Hangzhou; historic and cultural towns are predominantly distributed across Suzhou, Jiaxing, and Huangshan; and tourism and leisure blocks are mainly concentrated in Shanghai, Hangzhou, and Ningbo. These three types also exhibit distinct characteristics across economic, social, and physical dimensions: economically, historic and cultural blocks are embedded in urban commercial areas, historic and cultural towns rely more on tourism and traditional industries, and tourism and leisure blocks are oriented toward cultural consumption; socially, historic and cultural blocks face gentrification pressures, historic and cultural towns maintain stronger community cohesion, and tourism and leisure blocks primarily serve transient visitors; and physically, historic and cultural blocks have limited expansion capacity, historic and cultural towns preserve traditional settlement patterns, and tourism and leisure blocks are optimized for visitor flows. This distribution illustrates that the three heritage types are embedded in distinct spatial and socioeconomic contexts, enabling a comparative analysis of their differentiated vitality evolution pathways.
The dataset contains samples of national-level historic and cultural blocks, historic and cultural towns, and tourism and leisure blocks in the YRD, integrating multi-dimensional information including basic attributes, nighttime light data, economic indicators, population characteristics, and spatial location conditions. Based on this dataset, further processing was conducted according to the research objectives, including sample classification, variable selection, spatial scale harmonization, and outlier treatment. Finally, a comprehensive database was constructed to analyze the vitality evolution of national-level heritage spaces and their influencing factors.
The basic attribute data include information such as sample names, heritage types, and recognition batches. These data were derived from the original dataset, which was compiled based on the lists of national-level historic and cultural blocks, tourism and leisure blocks, and historic and cultural towns released by the Ministry of Culture and Tourism of the People’s Republic of China and the Ministry of Housing and Urban-Rural Development. During data processing, the attributes were standardized, and manual verification and duplicate removal were conducted to ensure data accuracy and consistency. The recognition batch was regarded as a temporal indicator of the institutionalized conservation process and was used to examine the influence of different recognition stages on the vitality evolution of heritage spaces.
Nighttime light data were used as the primary proxy indicator for measuring the intensity of spatial economic activities and regional development levels. The original dataset adopted nighttime light remote sensing data from the Defense Meteorological Satellite Program’s Operational Linescan System (DMSP/OLS) and the Visible Infrared Imaging Radiometer Suite (VIIRS) released by the National Oceanic and Atmospheric Administration (NOAA). Average nighttime light values were extracted using ArcGIS 3.5.4.
It should be noted that DMSP/OLS and VIIRS nighttime light products are derived from different satellite sensors and therefore differ in spatial resolution, radiometric characteristics, and data acquisition mechanisms. Although cross-sensor intercalibration, saturation correction, and radiometric harmonization are commonly applied in long-term nighttime light studies, the present study uses publicly available annual composite products for which detailed calibration parameters are unavailable. Therefore, the potential influence of inter-sensor inconsistencies is acknowledged as a limitation. To ensure spatial consistency, nighttime light values were extracted within the same spatial units for both periods. Furthermore, this study uses absolute nighttime light change between 2000 and 2022 rather than ratio-based growth indicators, focusing on temporal variation within individual heritage spaces rather than direct comparison of raw sensor measurements.
Nighttime light intensity has been widely validated as an effective measure of urban vitality, economic activity agglomeration, and human settlement intensity [36,37]. In the specific context of heritage spaces, recent studies have demonstrated that nighttime light data can effectively capture the intensity of socioeconomic activities and visitor flows in and around historic areas. For example, Hu and Li [20] used SDGSAT-1 nighttime light imagery to assess the economic vitality of historical towns in suburban Shanghai, demonstrating that nighttime light intensity is significantly associated with commercial activity and local economic dynamism in heritage contexts. Similarly, Zhang et al. [18] integrated nighttime light data with spatial configuration analysis to evaluate vitality patterns in historic districts. These studies provide empirical support for using nighttime light as a proxy for the locational vitality of heritage spaces—that is, the intensity of socioeconomic activities and interactions in the spatial environment where heritage sites are embedded. Therefore, we interpret nighttime light intensity as an indicator of locational vitality and economic dynamism, rather than as a direct measure of cultural authenticity or heritage value.
In the context of heritage spaces, nighttime light captures the intensity of socioeconomic activities in and around heritage areas, reflecting the degree to which these spaces have been integrated into broader urban economic systems. For each heritage site, we extracted average nighttime light values within 1 km buffer zones extending outward from the geometric center. The 1 km buffer was selected because (1) it captures the immediate spatial context where heritage-led regeneration and visitor activities predominantly occur; (2) it avoids the edge effects and boundary misalignments associated with administrative or protection boundaries; and (3) it aligns with the walkable catchment radius commonly used in vitality and urban tourism studies [29].
It is important to emphasize that nighttime light intensity does not measure heritage-specific cultural values, social cohesion, or historical authenticity. Rather, it captures the locational vitality—the intensity of socioeconomic activities in the spatial environment where heritage sites are embedded. Therefore, throughout this manuscript, we use the term “locational vitality” to refer specifically to this indicator, and we avoid equating it with the broader concept of heritage value or sustainability.
We acknowledge that nighttime light data reflect ambient luminosity from multiple sources, including commercial signage, street lighting, and traffic flows. This indicator does not measure heritage-specific cultural values or social interactions; rather, it captures the locational vitality and economic dynamism of the spatial environment in which heritage sites are embedded. This conceptualization is appropriate for our research objective, which is to examine the transformation of heritage spaces from static conservation objects into dynamic socioeconomic resources—a process inherently reflected by changes in nighttime luminosity. Therefore, we interpret the increase in nighttime light intensity as evidence of heritage spaces’ integration into regional economic development networks, rather than as a direct measure of cultural authenticity or heritage value.
In this study, nighttime light data from 2000 and 2022 were further used to calculate long-term change characteristics. The selection of 2000 and 2022 as the two observation points was based on three considerations. First, this period aligns with the major phases of China’s national heritage recognition system, which was gradually established and expanded after 2000, allowing us to capture the long-term effects of institutionalized conservation. Second, the 22-year interval spans a period of rapid urbanization, economic restructuring, and heritage conservation policy implementation in the Yangtze River Delta, providing sufficient temporal depth for observing locational vitality transformation. Third, nighttime light data from both DMSP/OLS and VIIRS are available for these two years, enabling a consistent comparison of nighttime light intensity within the same spatial units.
where V represents the change of nighttime light, and NL represents the average nighttime light value. Specifically, the nighttime light change value was calculated by subtracting the average nighttime light intensity in 2000 from that in 2022 for each heritage space. A positive value indicates an increase in nighttime light intensity, representing an enhancement of surrounding socioeconomic vitality, whereas a negative value indicates a decline.
The economic data mainly include county-level tertiary industry GDP, the proportion of tertiary industry GDP, per capita GDP, and urban residents’ per capita disposable income in 2022. These data were obtained from local statistical yearbooks and county-level statistical bulletins on national economic and social development integrated in the original dataset and were uniformly compiled for the year 2022. These indicators were used as regional economic environment variables to explain the external economic drivers of heritage space vitality evolution.
The population data include county-level population density, population density within a 1.5 km buffer zone, and population density within a 5 km buffer zone. The original data were derived from national population census data (2000, 2010, and 2020) and local demographic statistics. Spatial interpolation and population density calculations were conducted using GIS-based spatial analysis methods. The 1.5 km and 5 km buffer zones were selected to represent population characteristics in different spatial contexts. The 1.5 km buffer was used to capture the immediate surrounding environment of heritage spaces, reflecting short-distance accessibility, pedestrian activity, and local population interactions.
The spatial location data include sample geographic coordinates and the distance to the surrounding areas of upper-tier cities. The sample coordinates were obtained using the Baidu Map coordinate picking tool V1.0, and the distance between each heritage space and the upper-tier cities was calculated using the spatial analysis tools in ArcGIS. This indicator was used to characterize the influence of urban radiation effects and locational advantages on heritage space development.
2.3. Analytical Methods
The analytical framework consists of three sequential components with progressive logic. Temporal evolution analysis examines the direction and significance of nighttime light changes over the study period, establishing the existence of vitality transformation. Spatial distribution analysis then investigates whether these changes exhibit geographic and inter-type heterogeneity, revealing where and which types show differentiated patterns. Finally, influencing factor analysis identifies the socioeconomic and locational conditions associated with the observed heterogeneity, addressing what contextual factors are related to vitality outcomes. This progression—from describing change, to revealing heterogeneity, to explaining correlates—ensures that each analytical step builds upon the previous one.
To reveal the long-term evolution characteristics, spatial heterogeneity, and influencing factors of national-level heritage spaces in the YRD, this study establishes an integrated analytical framework consisting of temporal evolution, spatial distribution, and influencing factors (Figure 2). First, nighttime light data are used to characterize the vitality change process and examine its long-term growth trends. Second, spatial statistical methods are applied to identify the spatial differentiation characteristics among different types of heritage spaces. Finally, multi-scale regression models are employed to investigate the influence mechanisms of economic, demographic, and locational factors on the evolution of spatial vitality.
Figure 2.
Analytical workflow (source: drawn by the authors).
2.3.1. Temporal Evolution Analysis
Heritage spaces are not static historical remnants preserved unchanged over time, but dynamic systems continuously evolving under the influence of conservation policies, socioeconomic development, and regional spatial restructuring. To characterize the long-term changes in heritage space vitality, this study uses nighttime light intensity as a proxy indicator of spatial vitality and employs changes in nighttime light data between 2000 and 2022 to reflect the long-term evolution of socioeconomic activities and spatial development levels within the sample areas.
To examine whether the difference in nighttime light intensity between 2000 and 2022 was statistically significant, a paired-sample test was applied. Since the paired-sample t-test requires the differences to follow a normal distribution, the Shapiro–Wilk test was first performed on the differences between the two periods for each heritage sample. When the differences satisfied the normality assumption, a paired-sample t-test was conducted; otherwise, the Wilcoxon signed-rank test was applied as a non-parametric alternative.
Considering the phased characteristics of the national recognition process, this study further grouped samples within each heritage type according to their recognition batches to examine the relationship between the timing of institutional recognition and the growth of heritage space vitality. The nighttime light changes among different recognition batches were tested using the Shapiro–Wilk test for normality and the Levene test for homogeneity of variance. When the data met the assumptions of normality and variance homogeneity, one-way analysis of variance (one-way ANOVA) was performed to examine whether significant differences existed among batches. If the parametric test assumptions were not satisfied, the Kruskal–Wallis H test was employed for non-parametric analysis.
To further investigate whether different heritage categories exhibited distinct vitality evolution patterns, a Kruskal–Wallis H test was conducted among the three heritage types, including national-level historic and cultural towns, national-level tourism and leisure blocks, and national-level historic and cultural blocks. Considering the unbalanced sample sizes among heritage categories, descriptive statistics including sample size, median, quartiles, and interquartile range (IQR) were reported. When significant overall differences were identified, Dunn’s post hoc test with Bonferroni correction was conducted for pairwise comparisons. The effect size of group differences was evaluated using epsilon squared.
2.3.2. Spatial Distribution Analysis
Due to differences in historical formation processes, functional orientations, and development patterns among different types of heritage spaces, their spatial distribution patterns and vitality evolution trajectories may exhibit significant heterogeneity. This study combines kernel density analysis, spatial statistical tests, and comparative analysis among different heritage types to reveal the spatial heterogeneity of heritage spaces from two perspectives: the spatial clustering characteristics of heritage resources and the differentiation of vitality evolution among heritage types.
The Kernel Density Estimation (KDE) method was applied to analyze the spatial clustering characteristics of the 85 heritage space samples, which has been widely used in related studies [38,39]. KDE calculates the spatial distribution density of samples within the study area based on a distance-decay function, thereby identifying the concentration areas of heritage resources at the regional scale. Based on the GIS spatial analysis platform, kernel density maps were generated to characterize the spatial agglomeration patterns of cultural heritage resources in the YRD and compare distribution differences among different regions.
The kernel density function is expressed as follows:
where is the density calculation function at the spatial position ; is the spatial weight function; is the interval attenuation threshold; is the number of sample points; and is the spatial distance from the sample point to the sample point In this study, KDE was applied to the geographic coordinates of heritage spaces to identify regional clustering patterns. The density value at each location was calculated based on the distance-weighted contribution of surrounding heritage samples.
Furthermore, to examine whether different types of heritage spaces exhibited differentiated vitality evolution characteristics, this study applied statistical tests based on nighttime light growth among the three categories of nationally recognized heritage spaces. The Shapiro–Wilk test for normality and Levene’s test for homogeneity of variance were first conducted for each heritage type group. When the data satisfied the assumptions of parametric tests, ANOVA was applied to examine the overall differences among different heritage types. When the data did not meet the requirements of normality or homogeneity of variance, the Kruskal–Wallis non-parametric test was adopted for further validation.
2.3.3. Influencing Factor Analysis
We used correlation analysis to determine the relationships among the variables in order to conduct a more in-depth analysis. To further investigate the factors influencing the evolution of heritage-space vitality, this study established a hierarchical ordinary least squares (OLS) regression framework incorporating spatial location, economic development, and population agglomeration factors. Since the objective of this study was to identify the overall effects of potential influencing factors on nighttime light change rather than explore spatially varying relationships, and considering the relatively limited sample size (n = 85), OLS regression was adopted. Compared with geographically weighted regression, OLS provides more robust global parameter estimates when the primary research objective is to evaluate the average contribution of explanatory variables across all samples.
The dependent variable was defined as nighttime light change, calculated as the difference between the average nighttime light intensity in 2022 and 2000. All continuous explanatory variables were standardized using the Z-score method before regression to improve coefficient comparability. The OLS model can be expressed as
where represents the spatial vitality change level of the i-th sample, represents the explanatory variables, represents the estimated coefficient of each variable, and represents the random error term. A positive standardized coefficient indicates that heritage spaces located in areas with higher values of the corresponding variable tend to experience greater nighttime light growth.
A three-layer hierarchical modeling strategy was developed to gradually evaluate the contribution of different groups of influencing factors. The variable entry order was determined according to the theoretical framework that heritage-space locational vitality transformation is jointly affected by external accessibility conditions, socioeconomic development, and population concentration.
Model 1 included only spatial location conditions and was constructed as the baseline model. The distance to nearest upper-tier city was selected as the explanatory variable. This variable represents the influence of regional accessibility and urban hierarchy on heritage-space vitality transformation.
Model 2 further incorporated economic development variables into Model 1 to examine whether economic foundations provide additional explanatory power beyond spatial location conditions. The candidate economic variables included tertiary industry development level, industrial structure, economic prosperity, and residents’ consumption capacity: (1) Tertiary Industry GDP; (2) Tertiary Industry Share of GDP; (3) Per Capita GDP; and (4) Per Capita Disposable Income. Considering the potential multicollinearity among economic indicators, variance inflation factor (VIF) screening was conducted using a hierarchical procedure. Location variables were retained as theoretically important control variables, while only newly introduced economic variables with VIF values exceeding 5 were iteratively removed.
Model 3 introduced population-related indicators based on the retained variables from Model 2 to further evaluate the association between population concentration and nighttime light change. Three population density indicators representing different spatial contexts were initially considered: (1) county-level population density; (2) population density within a 1.5 km buffer zone; and (3) population density within a 5 km buffer zone. Similar to the economic layer, VIF-based hierarchical screening was applied to the newly introduced population variables. The 5 km buffer population density variable was excluded during the multicollinearity screening prior to the final estimation of Model 3. The final model therefore retained county-level population density and population density within the 1.5 km buffer zone as the population-related explanatory variables.
The explanatory improvements among the three models were evaluated by comparing R2 and standardized regression coefficients. The final model was further examined through multicollinearity diagnostics, heteroscedasticity tests, HC3 robust standard errors, influential observation analysis, and residual spatial autocorrelation testing. It should be noted that the explanatory variables used in this study are measured at the end of the observation period (2022), while the dependent variable captures changes in nighttime light intensity from 2000 to 2022. We acknowledge that the 2022 economic and demographic conditions may themselves be outcomes of long-term urban development processes rather than strictly antecedent drivers of nighttime light change. Therefore, we interpret these variables as contemporary contextual conditions that are associated with locational vitality evolution, rather than as causal drivers. Our analysis identifies correlational patterns that reveal how heritage spaces embedded in different socioeconomic contexts exhibit differentiated vitality trajectories.
3. Results
3.1. Data Overview
Figure 3 presents the geographical distribution of the study samples. A total of 85 national-level heritage spaces were selected, including 47 national-level historic and cultural towns, 28 national-level tourism and leisure blocks, and 10 national-level historic and cultural blocks. These sites were distributed across Anhui, Jiangsu, Shanghai, and Zhejiang provinces.
Figure 3.
Geographic distribution of samples (source: drawn by the authors).
The distribution of heritage spaces across the four provincial-level administrative regions is uneven. Jiangsu has the largest share of samples, followed by Zhejiang, Shanghai, and Anhui. Within each province, the composition of heritage types also varies considerably. In Shanghai, historic and cultural towns constitute the majority, while historic and cultural blocks are relatively rare. In Jiangsu, historic and cultural towns are the dominant type, followed by tourism and leisure blocks and a small number of historic and cultural blocks. In Zhejiang, historic and cultural towns and tourism and leisure blocks are more evenly distributed, with historic and cultural blocks also present in several cities. In Anhui, tourism and leisure blocks and historic and cultural towns are the primary types, while historic and cultural blocks are represented by only one site. Across provinces, historic and cultural towns are predominantly concentrated in Jiangsu and Zhejiang, particularly along the Jiangsu–Zhejiang border; tourism and leisure blocks are more evenly distributed but show a relatively higher concentration in Zhejiang and Shanghai; and historic and cultural blocks are primarily located in major urban centers such as Shanghai, Nanjing, Hangzhou, and Yangzhou. This uneven distribution reflects differences in historical formation, institutional recognition processes, and regional development patterns across the four provinces.
Table 1 presents the descriptive statistics of the continuous variables for the research samples. Overall, the nighttime light intensity of the samples increased significantly from 2000 to 2022, with the average nighttime light value rising from 6.58 to 18.90, indicating continuous improvements in regional economic development and spatial vitality. However, substantial differences existed among different heritage spaces. The maximum nighttime light value reached 51.78 in 2022, demonstrating significant spatial heterogeneity in the development levels of heritage spaces. Regarding the explanatory variables, considerable variations were also observed in terms of location conditions, economic development levels, and population agglomeration intensity among the samples. The descriptive statistics indicate substantial differences in socioeconomic conditions and nighttime light development among heritage spaces, providing the basis for further analysis of temporal evolution, spatial differentiation, and influencing factors.
Table 1.
Descriptive statistics of continuous variables (source: compiled by the authors).
3.2. Temporal Evolution
To examine whether heritage spaces exhibit significant long-term changes in nighttime light intensity, this study conducted a paired comparison of nighttime light intensity between 2000 and 2022. Since the differences between the two periods did not satisfy the assumption of normal distribution (Shapiro–Wilk test, p = 0.035), the Wilcoxon signed-rank test was applied for non-parametric analysis. The results showed a significant difference in nighttime light intensity between 2000 and 2022 (W = 154, p < 0.001), indicating that national-level heritage spaces in the YRD experienced significant growth in surrounding nighttime light intensity, reflecting increased locational economic dynamism over the past two decades.
Table 2 presents the sample composition and descriptive statistics of nighttime light growth among the selected national-level heritage spaces. Among the 85 samples, national-level historic and cultural towns represent the largest proportion (47 sites), followed by national-level tourism and leisure blocks (28 sites) and national-level historic and cultural blocks (10 sites). The three heritage categories show substantially different sample sizes, with historic and cultural blocks representing a relatively small subgroup. Therefore, median values, quartiles, and interquartile ranges (IQRs) were additionally reported to characterize the distributional differences among heritage categories. In terms of recognition batches, historic and cultural towns include five batches, tourism and leisure blocks include three batches, while all selected historic and cultural blocks belong to the first recognition batch.
Table 2.
Sample composition and descriptive statistics of nighttime light change among national-level heritage spaces (source: compiled by the authors).
To investigate whether differences in recognition timing influenced the evolutionary pathways of heritage space vitality, this study further conducted recognition batch comparisons within each heritage type. Since all national-level historic and cultural blocks belonged to the first recognition batch, they were excluded from the batch difference analysis due to the lack of inter-batch comparison. For national-level historic and cultural towns, the normality assumption was not satisfied for all recognition batches (Table 3), and therefore the Kruskal–Wallis test was applied. The results showed no significant differences among different recognition batches (H = 6.179, p = 0.186). For national-level tourism and leisure blocks, all recognition batches satisfied the assumptions of normality and variance homogeneity (Shapiro–Wilk p > 0.05; Levene p = 0.860). Therefore, one-way ANOVA was applied, and the results indicated no significant differences among recognition batches (F = 1.123, p = 0.341). These findings suggest that, within the same heritage category, the timing of national recognition did not significantly influence the long-term vitality growth trajectory. This may be because recognition timing mainly reflects the institutional designation process, while vitality evolution is more strongly affected by local socioeconomic conditions, accessibility, and adaptive utilization capacity.
Table 3.
Differences in nighttime light change across recognition batches (source: compiled by the authors).
3.3. Spatial Distribution
Figure 4 presents the results of the kernel density estimation analysis. The overall distribution of heritage resources shows a highly concentrated spatial pattern, with a single high-density cluster located around the boundary between Shanghai and Jiangsu, mainly composed of samples from Suzhou and Shanghai. In contrast, peripheral areas of Jiangsu, Zhejiang, and Anhui exhibit only scattered low-density clusters. The kernel density distribution of historic and cultural towns resources demonstrates a highly polarized monocentric pattern, with the dominant cluster concentrated in the Shanghai–Jiangsu border area and no obvious secondary clusters identified in other regions. Tourism and leisure blocks exhibit a dual-core spatial structure. One high-density cluster overlaps with the concentration area observed in the overall sample and historic and cultural town distributions, while another cluster emerges near the Jiangsu–Zhejiang border, associated with the influence of Hangzhou. Several small-scale low-density clusters are also distributed across the region. Historic and cultural blocks show a distinct polycentric pattern, with Shanghai, Nanjing, and Hangzhou forming three primary concentration centers. In addition, several smaller secondary clusters are observed in southern Zhejiang and southern Anhui. These results indicate differentiated spatial clustering patterns of heritage resources among different heritage categories, reflecting variations in their historical formation and regional distribution characteristics.
Figure 4.
Kernel density estimation results of heritage spaces (source: drawn by the authors): (a) all samples; (b) historic and cultural towns; (c) tourism and leisure blocks; (d) historic and cultural blocks.
Furthermore, to examine whether different heritage categories exhibited distinct vitality evolution patterns, a Kruskal–Wallis H test was conducted among the three heritage types. Considering the unbalanced sample sizes, a non-parametric approach was adopted. The results revealed significant differences in nighttime light growth among heritage categories (H = 13.646, p = 0.001), with an epsilon squared effect size of 0.142. Dunn’s post hoc test with Bonferroni correction showed that tourism and leisure blocks exhibited significantly higher nighttime light growth than historic and cultural towns (p = 0.001), whereas other pairwise comparisons were not significant.
Figure 5 illustrates the spatial patterns of nighttime light intensity across national-level heritage spaces in the YRD in 2000 and 2022 and the changes over the intervening period. In 2000, high-intensity values were predominantly concentrated in Shanghai, whereas heritage spaces in other provinces exhibited relatively low and comparable light levels. By 2022, a substantial increase in nighttime light intensity was observed across all provinces, with a markedly greater number of heritage spaces showing elevated values. Regarding the magnitude of change, nearly all heritage spaces exhibited an upward trend, with the exception of a few sites that showed declining values—all of which were located in Shanghai.
Figure 5.
Spatial distribution of nighttime light intensity and change across national-level heritage spaces in the YRD: (a) 2000, (b) 2022, and (c) change (source: drawn by the authors).
3.4. Influencing Factors
Figure 6 shows pairwise correlation coefficients among the dependent variable (nighttime light change) and eight explanatory variables. Nighttime light change exhibits significant correlations with several external factors: it is negatively correlated with distance to upper-tier city (r = –0.39, p < 0.001) and positively correlated with tertiary industry share of GDP (r = 0.27, p < 0.05) and per capita disposable income (r = 0.27, p < 0.05), suggesting that heritage spaces closer to regional development centers and located in more service-oriented economies tend to experience greater vitality growth. Some socioeconomic and population indicators exhibit strong inter-correlations (e.g., tertiary industry GDP with county-level population density at r = 0.88, and population density within 1.5 km and 5 km buffers at r = 0.93), reflecting their shared association with regional development levels; this justified the use of VIF diagnostics prior to regression modeling to detect and mitigate potential multicollinearity.
Figure 6.
Correlation matrix of explanatory variables and heritage-space vitality change (source: drawn by the authors).
To identify the factors influencing nighttime light change in heritage spaces, three progressive standardized OLS regression models were constructed (Table 4). Model 1 included only location conditions, represented by distance to upper-tier cities. Model 2 incorporated economic development characteristics, including tertiary industry share of GDP, per capita GDP, and per capita disposable income. Model 3 further introduced population agglomeration indicators, including county-level population density and population density within a 1.5 km buffer zone. The explanatory power of the models gradually increased with the inclusion of additional factor dimensions. The R2 values increased from 0.154 in Model 1 to 0.286 in Model 2 and further to 0.579 in Model 3, while the adjusted R2 increased from 0.143 to 0.250 and 0.546, respectively. This indicates that economic and population-related factors substantially improved the explanation of nighttime light change in heritage spaces.
Table 4.
Results of regression models explaining nighttime light change (source: compiled by the authors). Standard errors are reported in parentheses; *** p < 0.001, ** p < 0.01.
Regarding location factors, distance to upper-tier cities consistently showed a significant negative relationship with nighttime light growth across all three models (Model 1: β = −4.446, p < 0.001; Model 2: β = −5.503, p < 0.001; Model 3: β = −4.209, p < 0.001). This suggests that heritage spaces located farther from regional development centers experienced slower nighttime light growth, indicating the continuing influence of regional accessibility and urban spillover effects.
For economic factors, the tertiary industry share of GDP showed a significant positive association with nighttime light change after controlling for location conditions (Model 2: β = 3.326, p < 0.01; Model 3: β = 7.311, p < 0.001). This indicates that regions with a stronger service-oriented economic structure tend to achieve greater vitality enhancement in heritage spaces. In contrast, per capita GDP showed a significant negative coefficient in Model 2 (β = −5.600, p < 0.001) but became insignificant after population factors were introduced in Model 3, suggesting that the effect of general economic development may overlap with population distribution characteristics. Per capita disposable income did not show a statistically significant effect in any model.
After introducing population-related variables, Model 3 achieved the highest explanatory power. County-level population density showed a significant negative association with nighttime light growth (β = −11.701, p < 0.001), whereas population density within the 1.5 km buffer zone showed no statistically significant relationship (β = 2.825, p > 0.05). These differentiated results suggest that population density indicators measured at different spatial contexts capture different aspects of population distribution and urban activity patterns. Therefore, the observed differences should not be interpreted as direct evidence of a scale effect, but rather as spatial-context-dependent associations after controlling for accessibility and socioeconomic factors. The negative coefficient of county-level population density may indicate that highly populated counties do not necessarily experience greater nighttime vitality growth in heritage spaces, while local population density around heritage spaces alone is insufficient to explain vitality transformation.
Several diagnostic tests were conducted to evaluate the reliability of the regression models. The VIF values of the final models ranged from 1.422 to 4.266, indicating that all retained explanatory variables were below the commonly accepted threshold. Residual diagnostics showed that the residuals approximately followed a normal distribution. The Jarque–Bera test (statistic = 0.144, p = 0.931) and Shapiro–Wilk test (statistic = 0.992, p = 0.894) both indicated no significant deviation from normality. However, heteroscedasticity tests revealed variance instability in the residuals. The Breusch–Pagan test (p = 0.002) and White test (p = 0.018) indicated significant heteroscedasticity. Therefore, HC3 heteroscedasticity-consistent standard errors were applied in Model 3, and the main conclusions remained unchanged. Influential observation analysis identified 10 potentially influential samples based on Cook’s distance and leverage criteria. After removing these observations, the robustness regression produced similar coefficient directions for the major explanatory variables. Specifically, distance to upper-tier cities remained significantly negative, tertiary industry share remained significantly positive, and county-level population density remained significantly negative. The consistency between the baseline and robustness models confirms the reliability of the regression results. Finally, Moran’s I analysis was conducted to test spatial dependence in regression residuals. The result showed that Moran’s I was −0.015 with a permutation p-value of 0.740, indicating no significant spatial autocorrelation. Therefore, spatial dependence did not significantly bias the OLS regression estimates.
To facilitate a more intuitive comparison of the regression results, Figure 7 visualizes the regression coefficients and their 95% confidence intervals across the three models. The figure provides a clearer graphical representation of the direction, magnitude, and statistical significance of the estimated effects, complementing the detailed results reported in Table 4.
Figure 7.
Regression coefficients and 95% confidence intervals across Models 1–3 (source: drawn by the authors).
4. Discussion
4.1. Heritage Spaces as Dynamic Socioeconomic Systems
Our finding that heritage spaces exhibit significant long-term locational vitality improvement is consistent with the growing body of international research demonstrating that historic urban areas can serve as engines of economic dynamism rather than passive conservation objects [5,16]. This transformation reflects what the Historic Urban Landscape approach advocates—that heritage conservation and urban development can achieve synergy through adaptive management and sustainable utilization [40]. Recent empirical studies have offered quantitative evidence consistent with this perspective. For instance, Hu and Li [20] found that suburban historical towns in Shanghai exhibit marked variations in nighttime light intensity, with larger settlements generally exhibiting higher economic activity, which is similar to our observation that heritage spaces embedded in more economically dynamic regions tend to exhibit greater locational vitality improvement.
The significant increase in nighttime light intensity between 2000 and 2022 indicates that national-level heritage spaces in the YRD have experienced substantial changes in surrounding socioeconomic activity intensity rather than remaining as static preservation objects. However, this observation should not be conflated with improvements in heritage cultural value or authenticity, which require alternative measurement approaches. This finding is consistent with the emerging perspective that heritage areas can function as dynamic elements within regional economic systems, at least in terms of their surrounding economic activity intensity, embedded within broader processes of urbanization, economic restructuring, and regional development.
Previous studies based on the Historic Urban Landscape approach have argued that heritage conservation should move beyond the traditional preservation-oriented paradigm toward adaptive management and sustainable utilization. By examining a regional sample of national-level heritage spaces rather than relying on individual case studies, this study provides empirical evidence that heritage spaces can experience long-term vitality enhancement during the process of conservation and adaptive transformation.
However, the insignificant differences among recognition batches suggest that earlier institutional designation alone does not necessarily guarantee stronger nighttime light growth. The results of the recognition-batch comparison showed that no significant differences in nighttime light change existed among different recognition batches within the same heritage categories, suggesting that the timing of designation itself was not a direct determinant of locational vitality improvement. This suggests that heritage designation functions primarily as a governance framework rather than a direct development mechanism. The transformation of heritage spaces depends on how institutional recognition interacts with local economic conditions, population dynamics, and spatial contexts. Therefore, heritage policies should not only focus on initial designation and protection, but also consider continuous mechanisms for adaptive reuse, economic integration, and community participation to facilitate long-term locational vitality enhancement.
4.2. Development Pathways Among Different Heritage Spaces
The significant differences in nighttime light growth among the three heritage types highlight the importance of typological differentiation in heritage policy. This finding is similar to international studies that have documented how the functional positioning of historic areas—whether as urban commercial districts, tourism destinations, or residential communities—is associated with their regeneration trajectories [8,41]. Our results contribute to this literature by offering quantitative evidence of long-term vitality divergence across these types.
Historic and cultural blocks are generally located within highly urbanized areas and are closely connected with existing urban functions. Their locational vitality evolution is therefore likely associated with urban regeneration, commercial transformation, and integration into metropolitan development networks. In contrast, historic and cultural towns often rely on traditional spatial resources, cultural tourism, and local identity construction, exhibiting in a development pathway more dependent on tourism-oriented utilization and regional attractiveness. Tourism and leisure blocks, as a heritage category emphasizing cultural consumption and experiential activities, exhibited significantly higher nighttime light growth than historic and cultural towns in the comparative analysis (Dunn’s post hoc test with Bonferroni correction, p = 0.001). This difference suggests that their functional orientation and utilization patterns may be related to differentiated development trajectories, including variations in commercialization and functional restructuring.
These findings build upon previous case-based studies by showing that heritage spaces should not be treated as a homogeneous category. Different heritage types require differentiated conservation and development strategies. Urban heritage areas may benefit from integration with surrounding urban renewal processes, whereas traditional towns require balancing tourism development with local community sustainability. For emerging tourism-oriented heritage spaces, attention should be paid to avoiding excessive commercialization and maintaining cultural authenticity.
The differentiation among heritage types also provides a basis for understanding how different heritage resources are embedded in the identity and authenticity of place. Historic and cultural blocks are closely associated with historic buildings, streetscapes, and urban spatial structures, while their sense of place may also be sustained through the continuity of everyday cultural activities. Historic and cultural towns generally preserve more integrated traditional settlement landscapes, where vernacular buildings, spatial configurations, local customs, and community life jointly contribute to place identity. Tourism and leisure blocks, by contrast, tend to connect heritage resources more explicitly with cultural consumption, tourism services, and visitor experiences, thereby creating greater opportunities for the activation and interpretation of both tangible and intangible heritage. However, the significantly higher nighttime-light growth observed in tourism and leisure blocks should not be interpreted as evidence of greater heritage authenticity. Rather, it indicates stronger locational socioeconomic dynamism associated with their contemporary functional orientation. Whether such socioeconomic activation contributes to or undermines authenticity depends on the preservation of tangible heritage, continuity of intangible cultural practices, and the relationship between heritage use and local community life, which cannot be directly assessed using nighttime light data.
4.3. Effects of Multi-Scale Factors on Heritage Locational Vitality Evolution
The regression results show that the growth of surrounding nighttime light intensity around heritage spaces is jointly associated with spatial location conditions, economic structures, and population characteristics rather than with a single development factor. These factors characterize the external environment in which heritage spaces undergo long-term transformation.
The consistently negative effect of distance to upper-tier cities suggests that spatial accessibility and metropolitan spillover effects remain important factors associated with locational vitality evolution of heritage spaces. Heritage spaces located closer to regional development centers tend to exhibit stronger locational vitality growth, which may be related to stronger economic networks, tourism flows, infrastructure investment, and service-sector expansion. This finding suggests that the locational economic dynamism of heritage spaces is not only related to internal cultural resources, but is also associated with broader regional development systems.
Among the economic indicators, the share of tertiary industry showed the most robust positive association with nighttime light change. This suggests that heritage spaces located in regions with stronger service-oriented economic structures tend to exhibit greater locational vitality improvement. A developed tertiary industry may offer favorable conditions for heritage transformation through tourism development, cultural consumption, commercial services, and improved urban amenities.
The changing significance of per capita GDP across models suggests that the association between overall economic development and vitality change is not independent from population distribution characteristics. Although per capita GDP showed a significant negative relationship in Model 2, this effect disappeared after population variables were introduced, suggesting that economic prosperity alone does not necessarily predict the growth potential of heritage spaces.
The scale-dependent effects of population agglomeration observed in our study add to the ongoing scholarly debate on the optimal spatial scale for urban vitality interventions [42]. Our finding that county-level population density showed a significant negative association with vitality change, while local population density within the 1.5 km buffer was not significant. The differentiated effects of population indicators measured at different spatial contexts inform the discussion of how population concentration relates to urban vitality [43,44].
The regression results should be interpreted with the understanding that the 2022 variables represent contemporary contextual conditions rather than strict antecedent drivers. While we observe significant associations between these variables and nighttime light change, we do not claim causality. This is consistent with the analytical approach adopted in similar studies examining the relationship between urban vitality and socioeconomic conditions, where cross-sectional variables are used to characterize the contextual environment rather than to establish causal mechanisms. Future research with panel data spanning multiple time points would be better positioned to disentangle causal directions.
4.4. Policy Implications for Heritage Transformation
The findings provide several implications for heritage governance and sustainable urban development. First, heritage designation should be regarded as the starting point rather than the final objective of conservation. Long-term vitality requires continuous policy support beyond initial recognition, including adaptive reuse strategies, local economic integration, and community-oriented development. Second, differentiated strategies should be developed for different heritage space types. Urban historic districts should be coordinated with metropolitan regeneration, while historic towns should balance tourism development with cultural continuity and local livelihoods. Third, heritage revitalization policies should account for multi-scale socioeconomic conditions. Rather than relying solely on external urban radiation or population concentration, planners should take into account local economic capacity, appropriate population scales, and spatial relationships with surrounding areas.
Our findings have implications for the growing international literature on heritage-led regeneration and sustainable urban development [45,46]. The differentiated vitality trajectories observed across heritage types suggest that heritage policy should move beyond a one-size-fits-all approach toward context-sensitive strategies that account for each heritage space’s functional orientation, spatial embedding, and socioeconomic environment. This is consistent with the recommendation of the United Nations Sustainable Development Goal 11.4, which calls for strengthening efforts to protect and safeguard the world’s cultural and natural heritage [47].
Overall, this study suggests that heritage conservation and spatial transformation should not be understood as contradictory processes. Instead, sustainable heritage development requires balancing preservation objectives with adaptive transformation, allowing heritage spaces to remain culturally meaningful while participating in contemporary socioeconomic systems. Our empirical evidence specifically supports this argument in terms of locational economic activity intensity, as measured by nighttime light data. Other dimensions of heritage sustainability, including cultural continuity and community well-being, remain important subjects for future research.
5. Conclusions
This study focused on national-level heritage spaces in the YRD and developed an analytical framework integrating nighttime light remote sensing data, socioeconomic indicators, population characteristics, and spatial location factors. The framework examined the vitality evolution of national-level heritage spaces and its influencing factors from three perspectives: temporal evolution, spatial differences, and influencing factors. The main conclusions are as follows:
- (1)
- Heritage spaces should be understood as dynamic socioeconomic systems rather than static conservation objects.
National-level heritage spaces in the YRD generally experienced long-term growth in surrounding nighttime light intensity between 2000 and 2022, indicating that institutional protection and socioeconomic development are not necessarily contradictory processes. This interpretation is bounded by the nighttime-light-based measurement and does not imply that all dimensions of heritage value (cultural, social, or historical) follow the same trajectory. Differences in recognition timing did not generate significant variations in vitality growth, suggesting that designation itself does not directly determine development outcomes. Instead, the long-term locational vitality of heritage spaces depends more on subsequent adaptive utilization, local economic integration, and continuous governance mechanisms after recognition.
- (2)
- Heritage spaces exhibit differentiated development trajectories according to their functional positioning and spatial contexts.
The significant differences among historic and cultural blocks, historic and cultural towns, and tourism and leisure blocks demonstrate that heritage spaces cannot be treated as a homogeneous category. Urban-oriented heritage areas may benefit from integration with metropolitan regeneration processes, whereas tourism-oriented and traditional settlement-based heritage spaces require strategies that balance economic utilization, cultural continuity, and local sustainability. These findings highlight the necessity of developing context-sensitive conservation and regeneration approaches.
- (3)
- The locational vitality evolution of heritage spaces, as captured by nighttime light changes, is shaped by the interaction between regional development conditions and multi-scale socioeconomic environments.
The results demonstrate that the locational economic dynamism of heritage spaces is embedded within broader urban and regional systems rather than determined solely by internal heritage attributes. Economic structure, spatial accessibility, and population distribution jointly influence the transformation capacity of heritage spaces, while their effects vary across spatial contexts. This suggests that sustainable heritage development requires coordinated consideration of regional economic networks, local population conditions, and adaptive development capacity.
Overall, this study reveals the long-term transformation process of national-level heritage spaces from protected objects toward economically integrated urban elements, as reflected by nighttime light changes. It expands the analytical perspective for understanding the locational vitality dynamics of heritage spaces and provides empirical evidence for differentiated conservation, adaptive utilization, and sustainable development of various heritage spaces.
This study also has several limitations. First, nighttime light data mainly reflect economic activities and spatial vitality levels, while cultural values, social interactions, and micro-environmental factors, such as the physical environment and spatial characteristics of heritage areas, are difficult to capture comprehensively. Future studies could integrate multi-source data to establish more comprehensive evaluation systems. Second, due to sample limitations, this study employed OLS models to examine overall influencing factors; future research could introduce spatial econometric models to explore regionally differentiated effects. Third, the samples were concentrated in the YRD, and the applicability of the findings to heritage spaces in other regions requires further validation. In addition, the present study does not directly measure the contribution of tangible and intangible heritage resources to place authenticity, as such assessment requires heritage-specific information on heritage integrity, cultural continuity, community practices, and perceived authenticity.
Author Contributions
Conceptualization, K.C.; methodology, Z.S.; software, Z.S.; validation, Z.S. and K.C.; formal analysis, Z.S.; investigation, Z.S.; resources, K.C.; data curation, Z.S.; writing—original draft preparation, Z.S.; writing—review and editing, K.C.; visualization, Z.S.; supervision, K.C.; project administration, K.C.; funding acquisition, Z.S. and K.C. All authors have read and agreed to the published version of the manuscript.
Funding
This research received no external funding.
Data Availability Statement
The data presented in this study are openly available from the dataset cited in Reference [35].
Acknowledgments
During the preparation of this manuscript, the authors used ChatGPT (OpenAI, GPT-5.5) for the purposes of language polishing. The authors have reviewed and edited the output and take full responsibility for the content of this publication.
Conflicts of Interest
The authors declare that this research was conducted in the absence of any commercial or financial relationships that could be construed as a potential conflict of interest.
References
- Elsayyad, N.A.; Hasan, A.S.; Akl, M.H. Reframing Heritage-Based Urban Branding in Lived Historic Contexts: A Domain-Based Analytical Framework from Cairo’s City of the Dead. Architecture 2026, 6, 108. [Google Scholar] [CrossRef] [Scilit]
- Ugong, N.A. Sustainable cultural heritage management: A case study in Sarawak, Malaysia. J. Cult. Herit. Manag. Sustain. Dev. 2026, 16, 988–1007. [Google Scholar] [CrossRef] [Scilit]
- De Gregorio, S.; De Vita, M.; De Berardinis, P.; Palmero, L.; Risdonne, A. Designing the sustainable adaptive reuse of industrial heritage to enhance the local context. Sustainability 2020, 12, 9059. [Google Scholar] [CrossRef] [Scilit]
- Song, J.; Chen, J.; Yang, X.; Zhu, Y. Research on Adaptive Reuse Strategy of Industrial Heritage Based on the Method of Social Network. Land 2024, 13, 383. [Google Scholar] [CrossRef] [Scilit]
- Nyseth, T.; Sognnæs, J. Preservation of old towns in Norway: Heritage discourses, community processes and the new cultural economy. Cities 2013, 31, 69–75. [Google Scholar] [CrossRef] [Scilit]
- UNESCO, W. Recommendation on the historic urban landscape. In Proceedings of the Records of the General Conference 36th Session, Paris, France, 10 November 2011. [Google Scholar]
- Wang, S.; Gu, K. Pingyao: The historic urban landscape and planning for heritage-led urban changes. Cities 2020, 97, 102489. [Google Scholar] [CrossRef] [Scilit]
- Ranjbar, E.; Ebrahimighorbani, F.; Motalaei, N. New evidence of contribution of culture to urban regeneration in the Global South, a comprehensive research on 170 projects in 34 cities of Iran. Cities 2026, 175, 107181. [Google Scholar] [CrossRef] [Scilit]
- López-Jiménez, J.; Martínez-Puche, A. Promoting Cultural Heritage in the South of the Valencia Region (Spain): Protection, Conservation and Integrated Management to Maximise Its Socio-Economic Benefits. Sustainability 2026, 18, 5047. [Google Scholar] [CrossRef] [Scilit]
- Falanga, R.; Nunes, M.C. Tackling urban disparities through participatory culture-led urban regeneration. Insights from Lisbon. Land Use Policy 2021, 108, 105478. [Google Scholar] [CrossRef] [Scilit]
- Zhang, D.; Xu, S. Humanistic needs and satisfaction study of multi-users in historic districts based on cognitive psychology. Psychiatr. Danub. 2021, 33, 681–693. [Google Scholar]
- Zhao, L.; Kim, E. Urban Revitalization of World Heritage Cities Through Cultural and Creative Industries: A Case Study of Pingyao Under the Cities, Culture, and Creativity Framework. Sustainability 2025, 17, 4292. [Google Scholar] [CrossRef] [Scilit]
- Liu, R.; Yan, H.; Zhang, Z. Does historic preservation affect firms’ output? Evidence from the awarding of the Historic City title in China. China Econ. Rev. 2024, 85, 102156. [Google Scholar] [CrossRef] [Scilit]
- Sun, J.; Shao, L. Interpretation of Historic Urban Landscape Genes: A Case Study of Harbin, China. Land 2024, 13, 1988. [Google Scholar] [CrossRef] [Scilit]
- Wang, G.; Liu, S. Adaptability evaluation of historic buildings as an approach to propose adaptive reuse strategies based on complex adaptive system theory. J. Cult. Herit. 2021, 52, 134–145. [Google Scholar] [CrossRef] [Scilit]
- Kim, H.; Kim, H.; Woosnam, K.M. Collaborative governance and conflict management in cultural heritage-led regeneration projects: The case of urban Korea. Habitat Int. 2023, 134, 102767. [Google Scholar] [CrossRef] [Scilit]
- Gravagnuolo, A.; Angrisano, M.; Bosone, M.; Buglione, F.; De Toro, P.; Fusco Girard, L. Participatory evaluation of cultural heritage adaptive reuse interventions in the circular economy perspective: A case study of historic buildings in Salerno (Italy). J. Urban Manag. 2024, 13, 107–139. [Google Scholar] [CrossRef] [Scilit]
- Zhang, X.; Leng, T.; Liu, Y.; Zhao, X. What makes historic districts thrive? Spatial configurations and differentiated strategies for heritage regeneration. Front. Archit. Res. 2026. [Google Scholar] [CrossRef] [Scilit]
- Gao, F.; Deng, X.; Liao, S.; Liu, Y.; Li, H.; Li, G.; Chen, W. Portraying business district vibrancy with mobile phone data and optimal parameters-based geographical detector model. Sustain. Cities Soc. 2023, 96, 104635. [Google Scholar] [CrossRef] [Scilit]
- Hu, Q.; Li, S. Spatial Reconstruction and Economic Vitality Assessment of Historical Towns Using SDGSAT-1 Nighttime Light Imagery and Historical GIS: A Case Study of Suburban Shanghai. Remote Sens. 2025, 17, 2123. [Google Scholar] [CrossRef] [Scilit]
- Reggiani, M. Urban regeneration strategies and place development in contemporary Tokyo: The case of Shibuya Station area. J. Place Manag. Dev. 2021, 15, 40–54. [Google Scholar] [CrossRef] [Scilit]
- Xiang, L.; Feng, C.; Liu, Y.; Wang, Y. Space and culture acculturation: Exploring urban regeneration in historic conservation areas, Yangmeizhu Street in Beijing, China. Front. Archit. Res. 2025, 14, 1274–1290. [Google Scholar] [CrossRef] [Scilit]
- Han, Y.; Dong, Y.; You, F.; Ji, T.; Qiu, Z. A methodological framework for adaptive reuse integrating structural and spatial coordination: Evidence from the Xiaoxihu Historic Block, Nanjing, China. Front. Archit. Res. 2026. [Google Scholar] [CrossRef] [Scilit]
- Patrick, C. The value of historic district status. Reg. Sci. Urban Econ. 2025, 115, 104157. [Google Scholar] [CrossRef] [Scilit]
- Huang, J.; Wang, R.; Shen, B. Assessing the paradox between development and preservation: A study on the coupling and coordination degree of morphology, function, and behavior in historic districts. J. Urban Manag. 2026, 15, 1254–1272. [Google Scholar] [CrossRef] [Scilit]
- Wang, Y.; Jin, C.; Wang, T.; Xu, D. The Interpretation of Historical Layer Evolution Laws in Historic Districts from the Perspective of the Historic Urban Landscape: A Case Study in Shenyang, China. Land 2025, 14, 1029. [Google Scholar] [CrossRef] [Scilit]
- He, D.; Zhang, Y.; Wu, L. Towards Character-Based Zoning: Managing Historic Urban Landscapes and Integrating a Dynamic Integrity Framework in Jingdezhen, China. Land 2026, 15, 615. [Google Scholar] [CrossRef] [Scilit]
- Du, J.; Yu, Z.; Cheng, S.; Li, L.; Miao, C. Exploring the role of government-driven culture-led micro-regeneration in shaping the sense of place within urban historic districts in China. Cities 2026, 169, 106575. [Google Scholar] [CrossRef] [Scilit]
- Li, F.; Sun, T.; Yang, K.; Shao, Y.; Huo, Y.; Liu, Y. Walkable Access to Cultural Tourism Opportunities in Historic Urban Cores: Spatial Mismatch and Interpretable Evidence from Suzhou, China. Sustainability 2026, 18, 5462. [Google Scholar] [CrossRef] [Scilit]
- Fung, I.W.H.; Tsang, Y.T.; Tam, V.W.Y.; Xu, Y.T.; Mok, E.C.K. A review on historic building conservation: A comparison between Hong Kong and Macau systems. Renew. Sustain. Energy Rev. 2017, 71, 927–942. [Google Scholar] [CrossRef] [Scilit]
- Zhang, K.; Boarin, P.; Aitken-Rose, E. Whoever uses it, pays for it. A land value approach to sustainable historic district conservation in China. J. Urban Manag. 2026, 15, 1336–1347. [Google Scholar] [CrossRef] [Scilit]
- Yang, Q.; Wang, L.; Qin, X.; Fan, Y.; Wang, Y.; Ding, L. Urban land use efficiency and contributing factors in the Yangtze River Delta under increasing environmental restrictions in China. Chin. Geogr. Sci. 2022, 32, 883–895. [Google Scholar] [CrossRef] [Scilit]
- National Bureau of Statistics of China. Economic and Social Development Statistical Chart: Major Economic Indicators of the Beijing-Tianjin-Hebei Region, the Yangtze Economic Belt, and the Yangtze River Delta in 2022. Available online: http://qstheory.cn/dukan/qs/2023-06/16/c_1129695713.htm (accessed on 25 August 2026).
- Zhang, K.; Li, X.; Chen, J.; Geng, Y. Spatiotemporal Evolution and Influencing Factors of Multifunctional Territorial Spatial Utilization Efficiency: Evidence from the Yangtze River Delta, China. Land 2026, 15, 2. [Google Scholar] [CrossRef] [Scilit]
- Wang, Z. Economic, Demographic, Nighttime Light and Location Data of National-Level Historic (Tourism) Settlements in the Yangtze River Delta Region. Mendeley Data 2026. [Google Scholar] [CrossRef]
- Elvidge, C.D.; Baugh, K.E.; Kihn, E.A.; Kroehl, H.W.; Davis, E.R.; Davis, C.W. Relation between satellite observed visible-near infrared emissions, population, economic activity and electric power consumption. Int. J. Remote Sens. 1997, 18, 1373–1379. [Google Scholar] [CrossRef] [Scilit]
- Li, X.; Li, D.; Xu, H.; Wu, C. Intercalibration between DMSP/OLS and VIIRS night-time light images to evaluate city light dynamics of Syria’s major human settlement during Syrian Civil War. Int. J. Remote Sens. 2017, 38, 5934–5951. [Google Scholar] [CrossRef] [Scilit]
- Cai, S.; Gou, Z. Are Green Spaces More Available and Accessible to Green Building Users? A Comparative Study in Texas. Land 2023, 12, 226. [Google Scholar] [CrossRef] [Scilit]
- Kabisch, N.; Strohbach, M.; Haase, D.; Kronenberg, J. Urban green space availability in European cities. Ecol. Indic. 2016, 70, 586–596. [Google Scholar] [CrossRef] [Scilit]
- Hidalgo-Sánchez, F.M.; Carrascal-Pérez, M.F.; Rey-Pérez, J.; Plaza, C.; Mascort-Albea, E.J. Cultural heritage, sustainability, conservation, and social welfare. A management plan for the historic municipal buildings of Seville (Andalusia, Spain). Hist. Environ. Policy Pract. 2022, 13, 426–458. [Google Scholar] [CrossRef] [Scilit]
- Chiu, Y.-H.; Lee, M.-S.; Wang, J.-W. Culture-led urban regeneration strategy: An evaluation of the management strategies and performance of urban regeneration stations in Taipei City. Habitat Int. 2019, 86, 1–9. [Google Scholar] [CrossRef] [Scilit]
- Gan, X.; Huang, L.; Wang, H.; Mou, Y.; Wang, D.; Hu, A. Optimal block size for improving urban vitality: An exploratory analysis with multiple vitality indicators. J. Urban Plan. Dev. 2021, 147, 04021027. [Google Scholar] [CrossRef] [Scilit]
- Gao, F.; Liu, Y.; Liao, S.; Zhang, J.; Jiao, Z.; Hu, X.; Wu, J.; Chen, W.; Li, G. Lively Guangzhou: Deciphering the divergent intra-urban vibrancy across historic districts and CBD using interpretable machine learning. Cities 2025, 167, 106345. [Google Scholar] [CrossRef] [Scilit]
- Li, D.; Han, H.; Wang, J.; Xiao, X. Explaining Urban Vitality Through Interpretable Machine Learning: A Big Data Approach Using Street View Images and Environmental Factors. Sustainability 2025, 17, 4926. [Google Scholar] [CrossRef] [Scilit]
- Labadi, S.; Logan, W. Urban Heritage, Development and Sustainability: International Frameworks, National and Local Governance; Routledge: London, UK, 2015. [Google Scholar]
- Avrami, E.; Macdonald, S.; Mason, R.; Myers, D. Values in Heritage Management: Emerging Approaches and Research Directions; Getty Publications: Los Angeles, CA, USA, 2019. [Google Scholar]
- Wang, X.; Ren, H.; Wang, P.; Yang, R.; Luo, L.; Cheng, F. A preliminary study on Target 11.4 for UN sustainable development goals. Int. J. Geoherit. Parks 2018, 6, 18–24. [Google Scholar] [CrossRef] [Scilit]
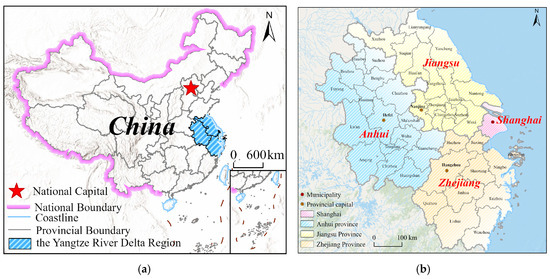
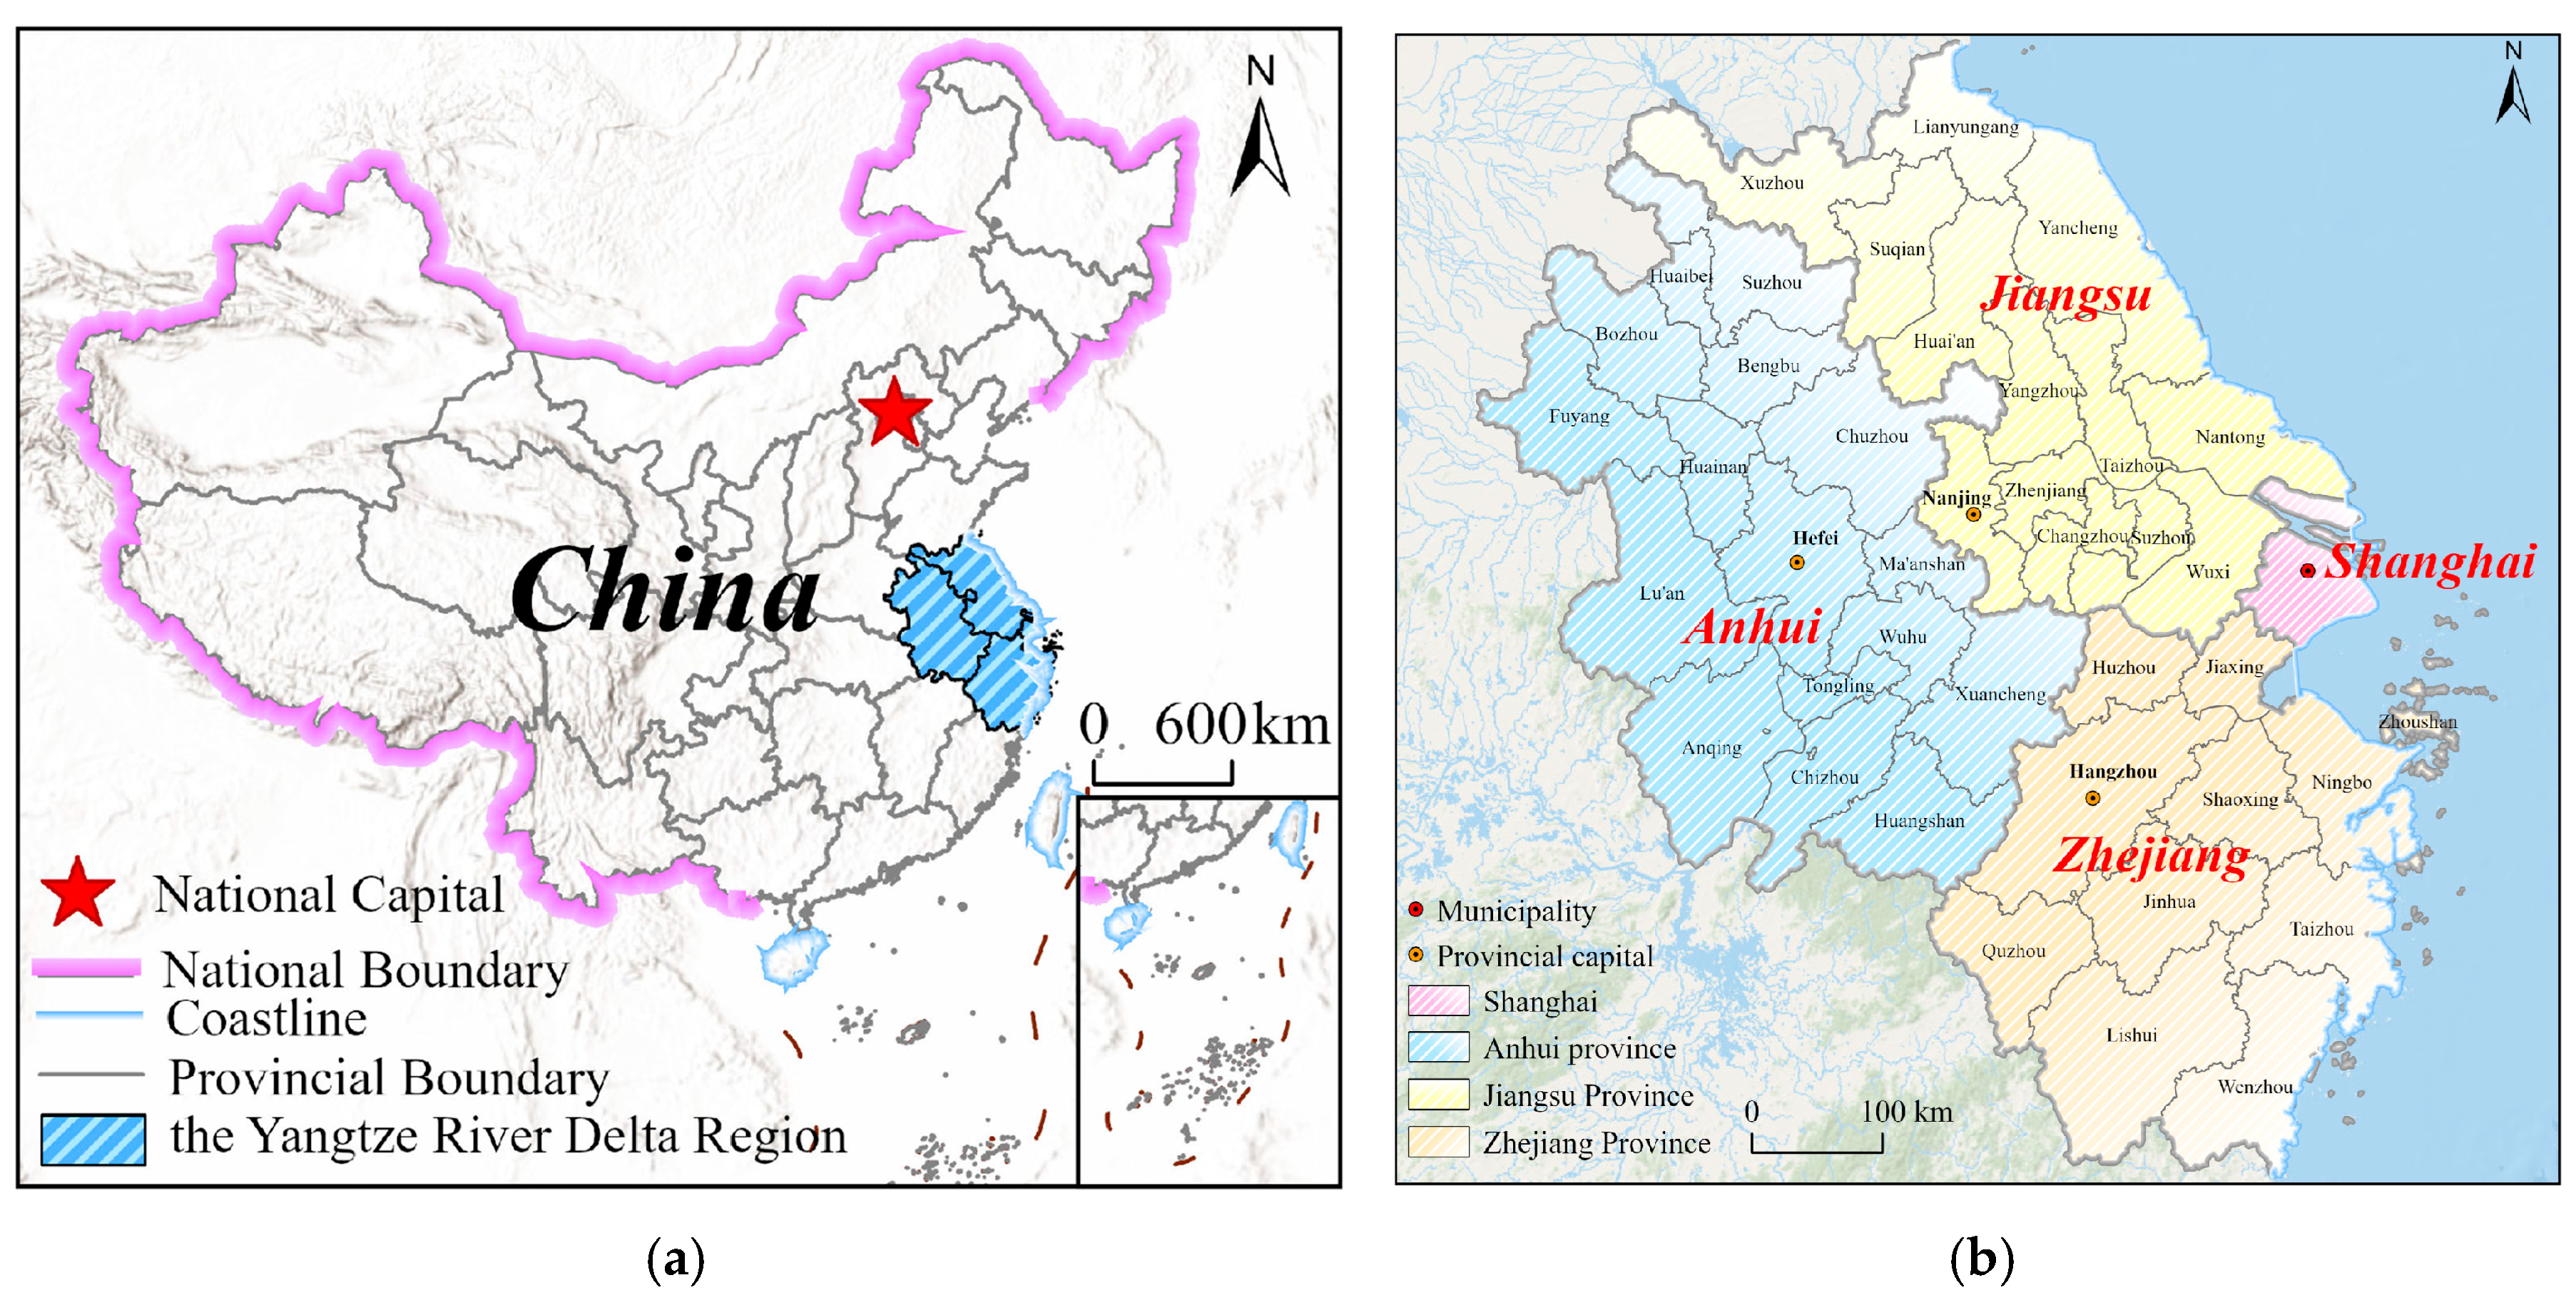
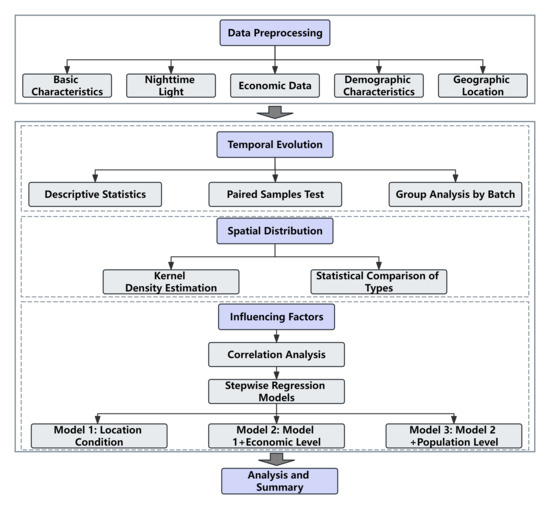
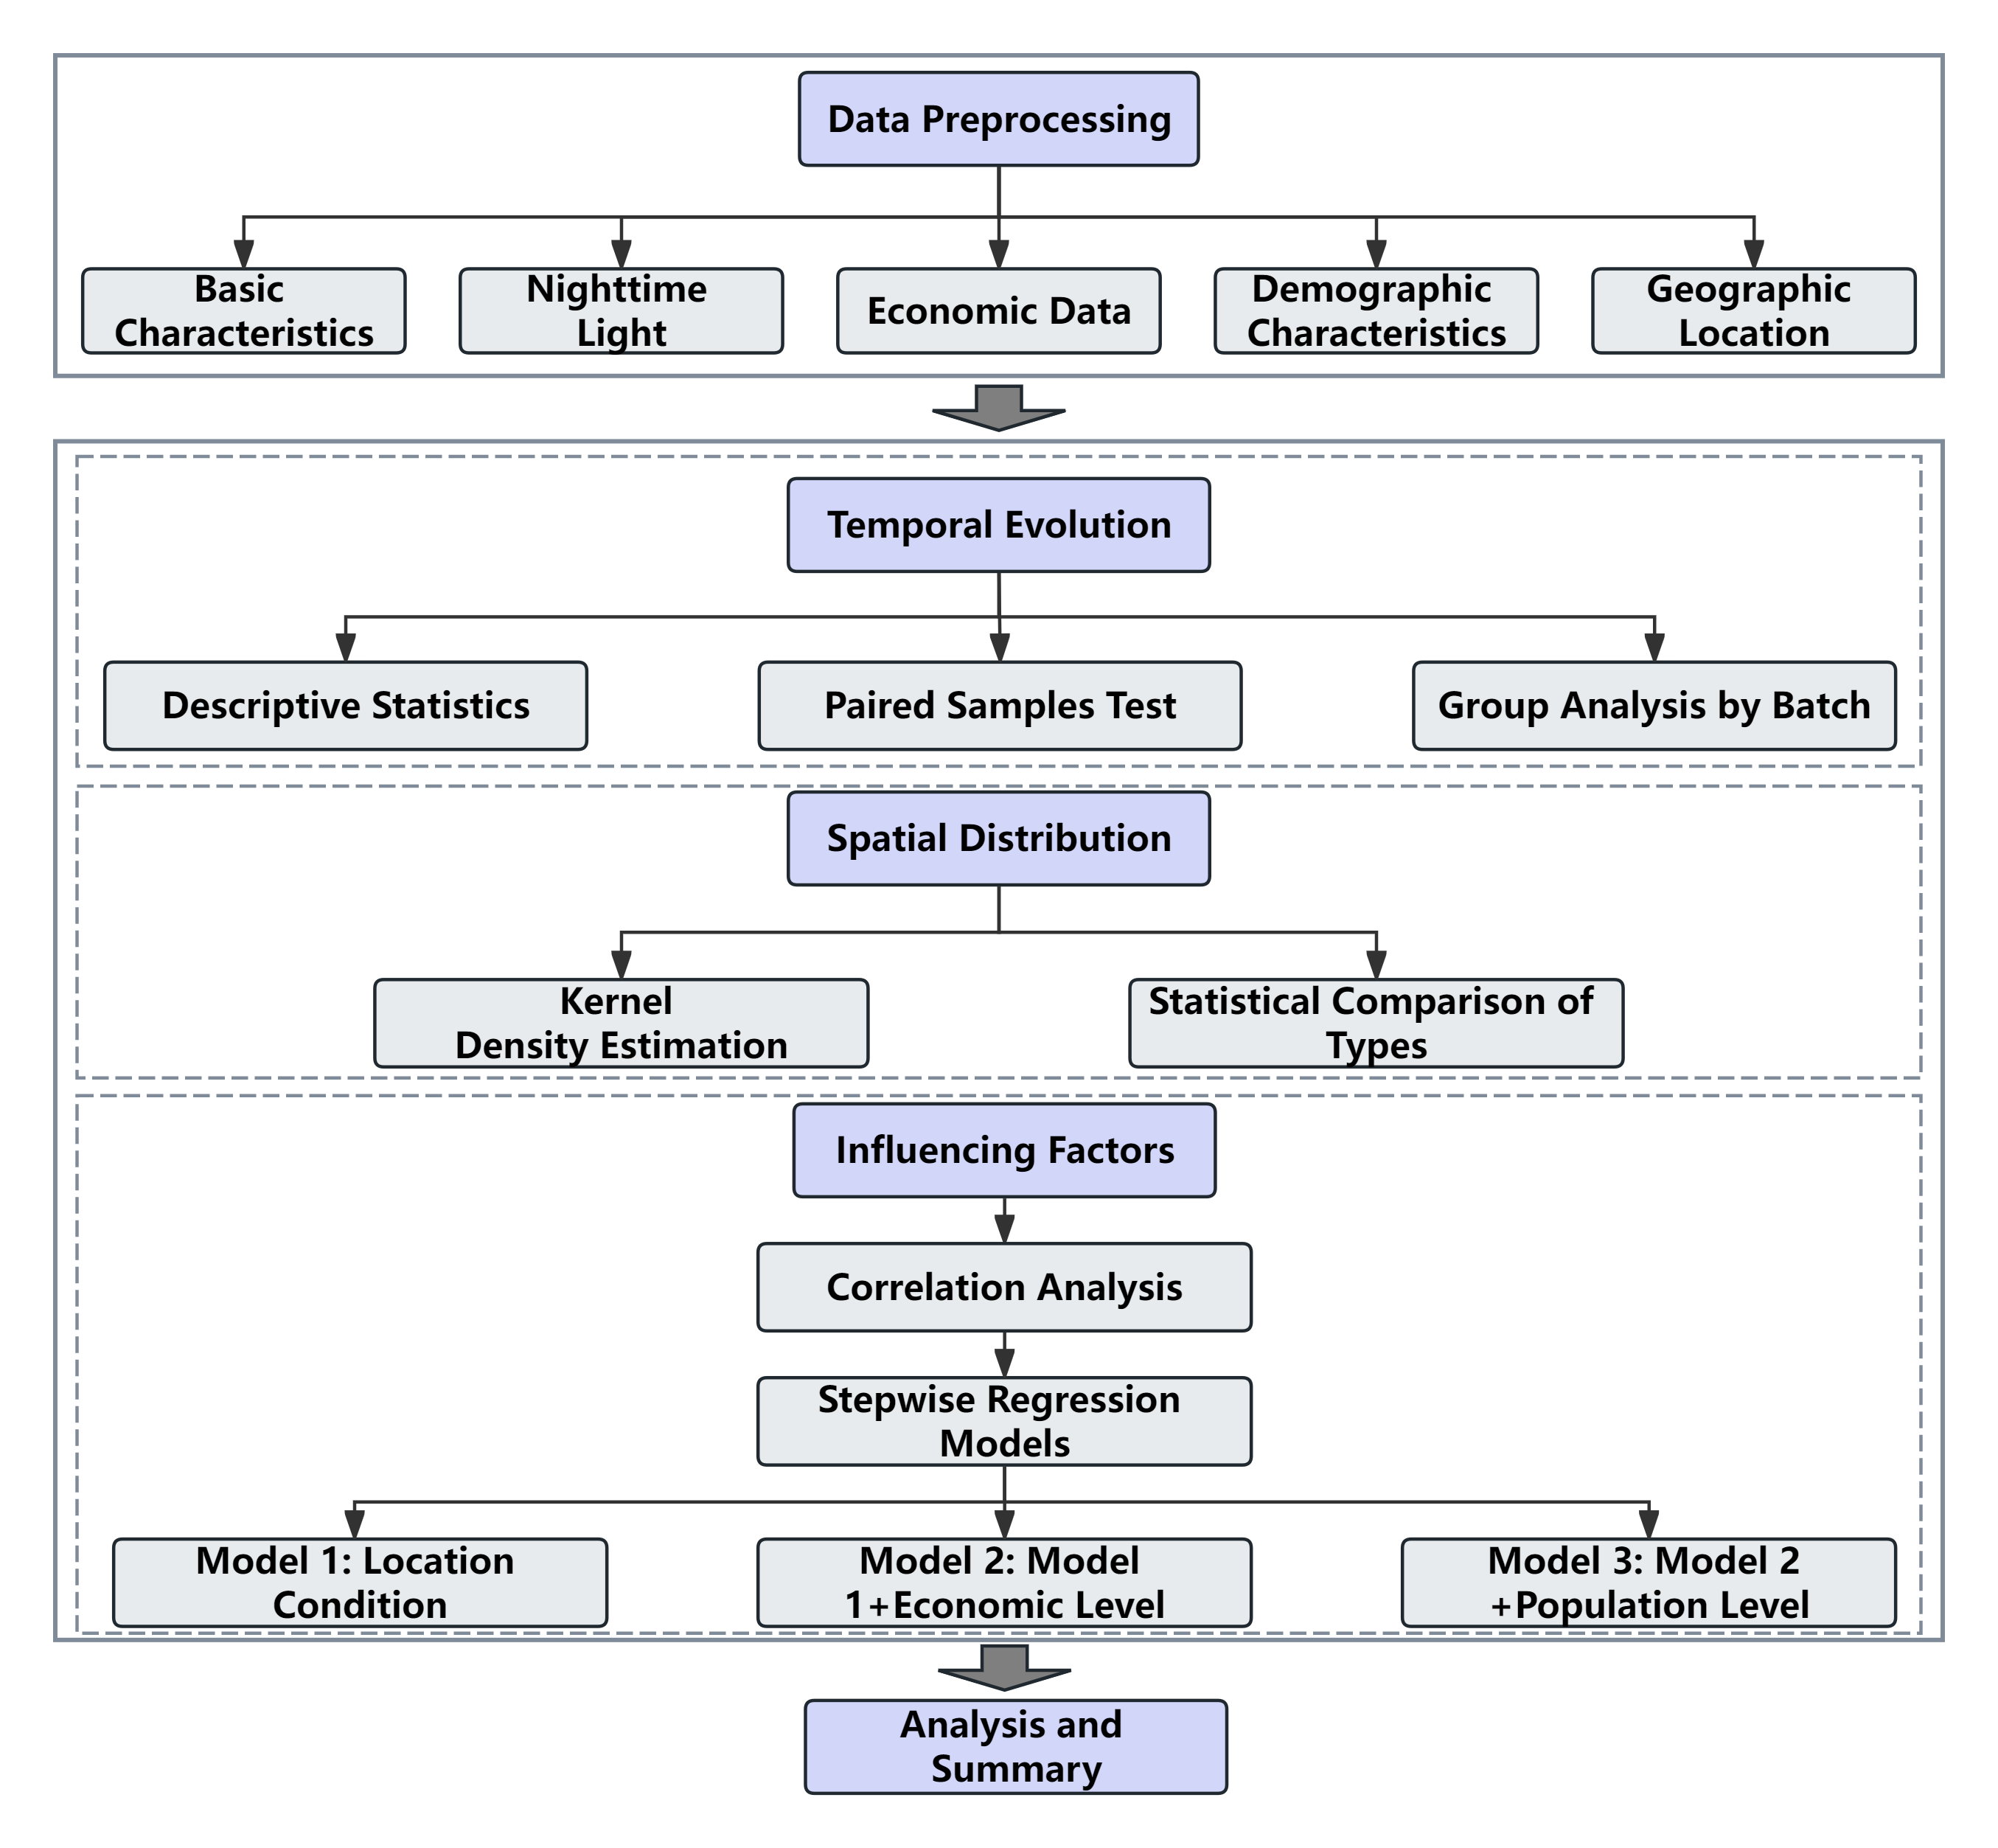
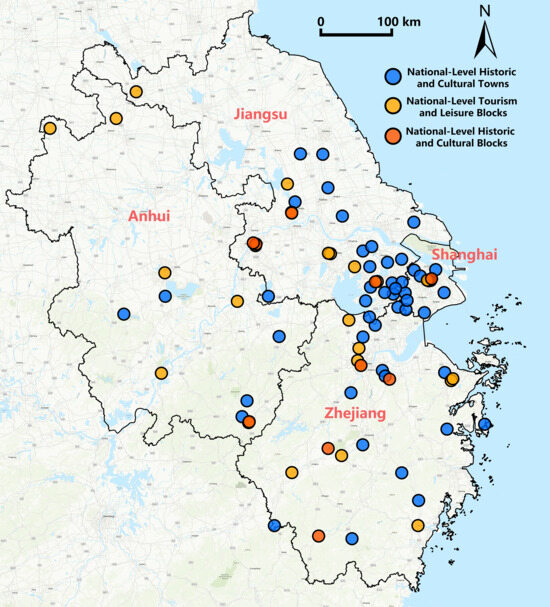
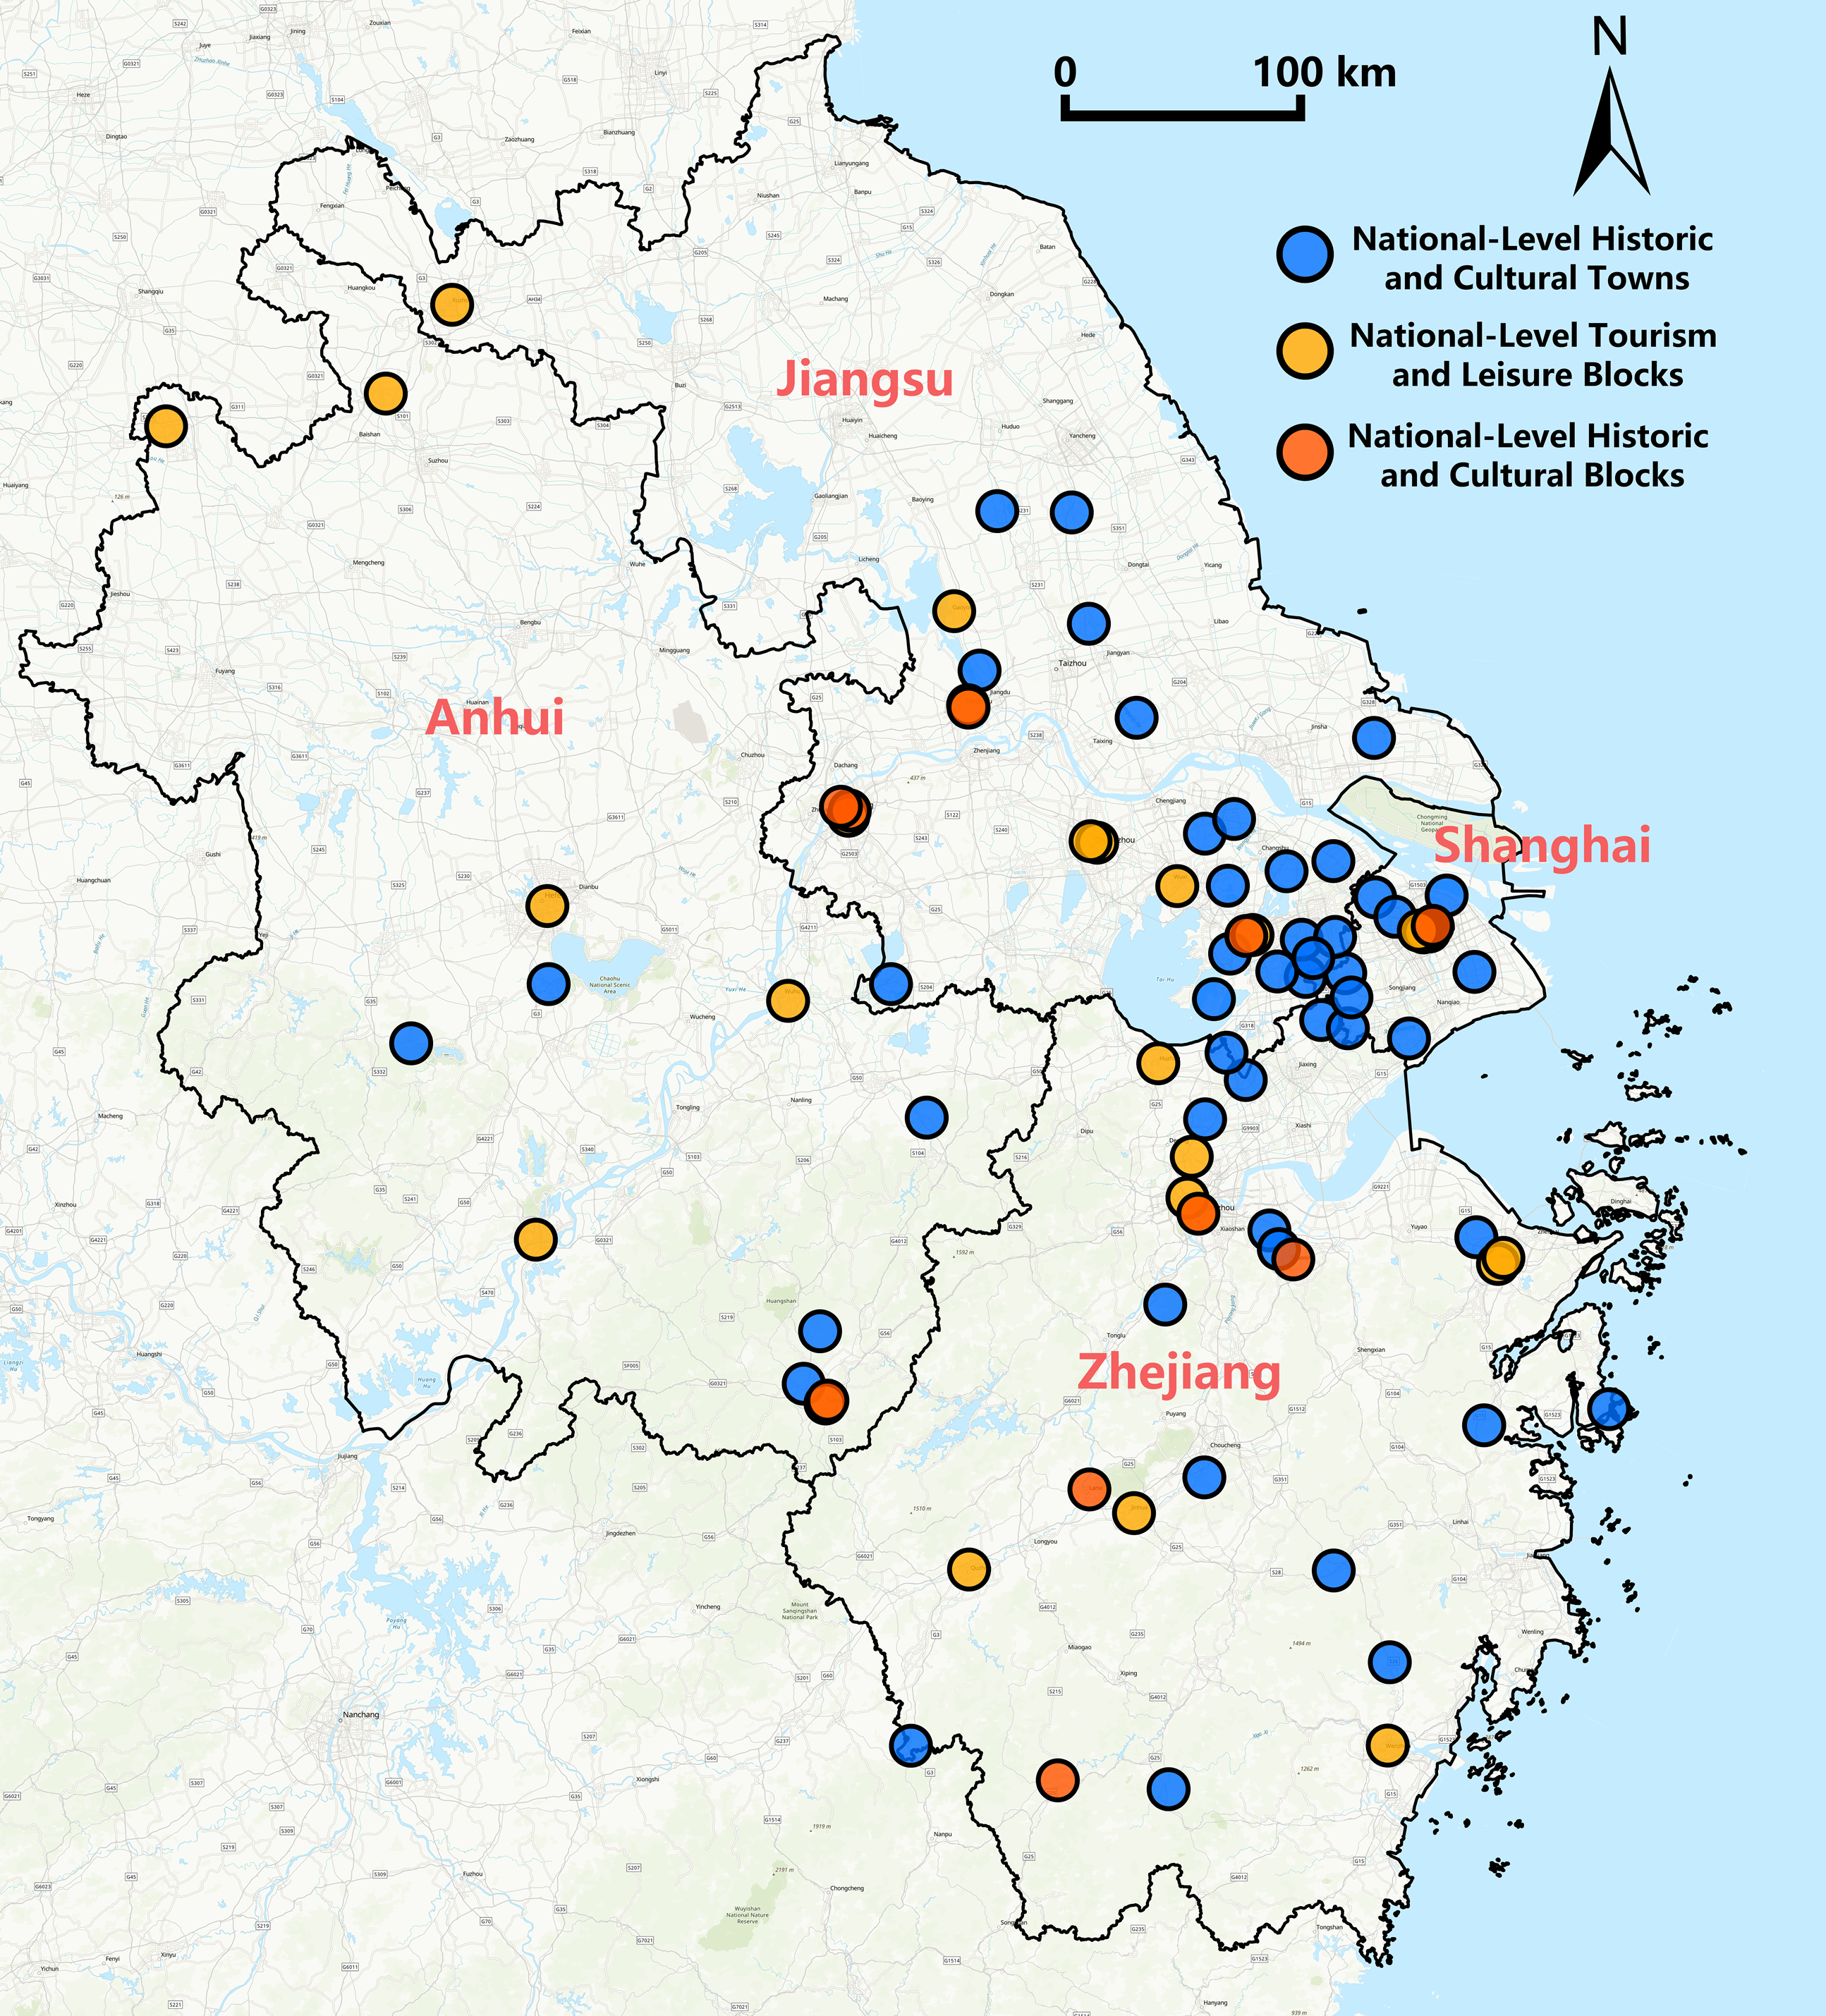
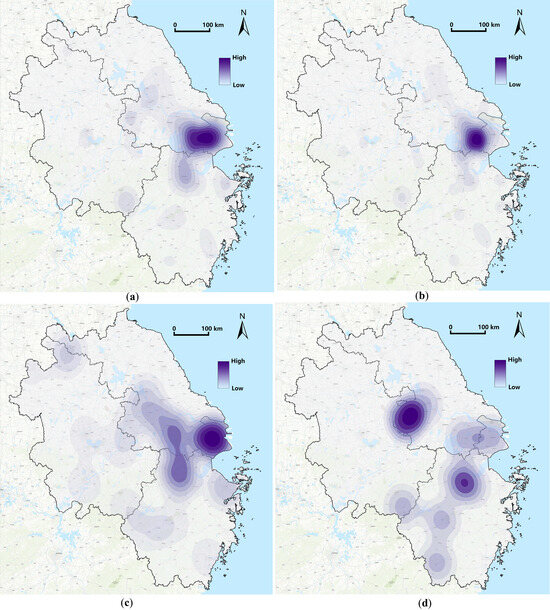
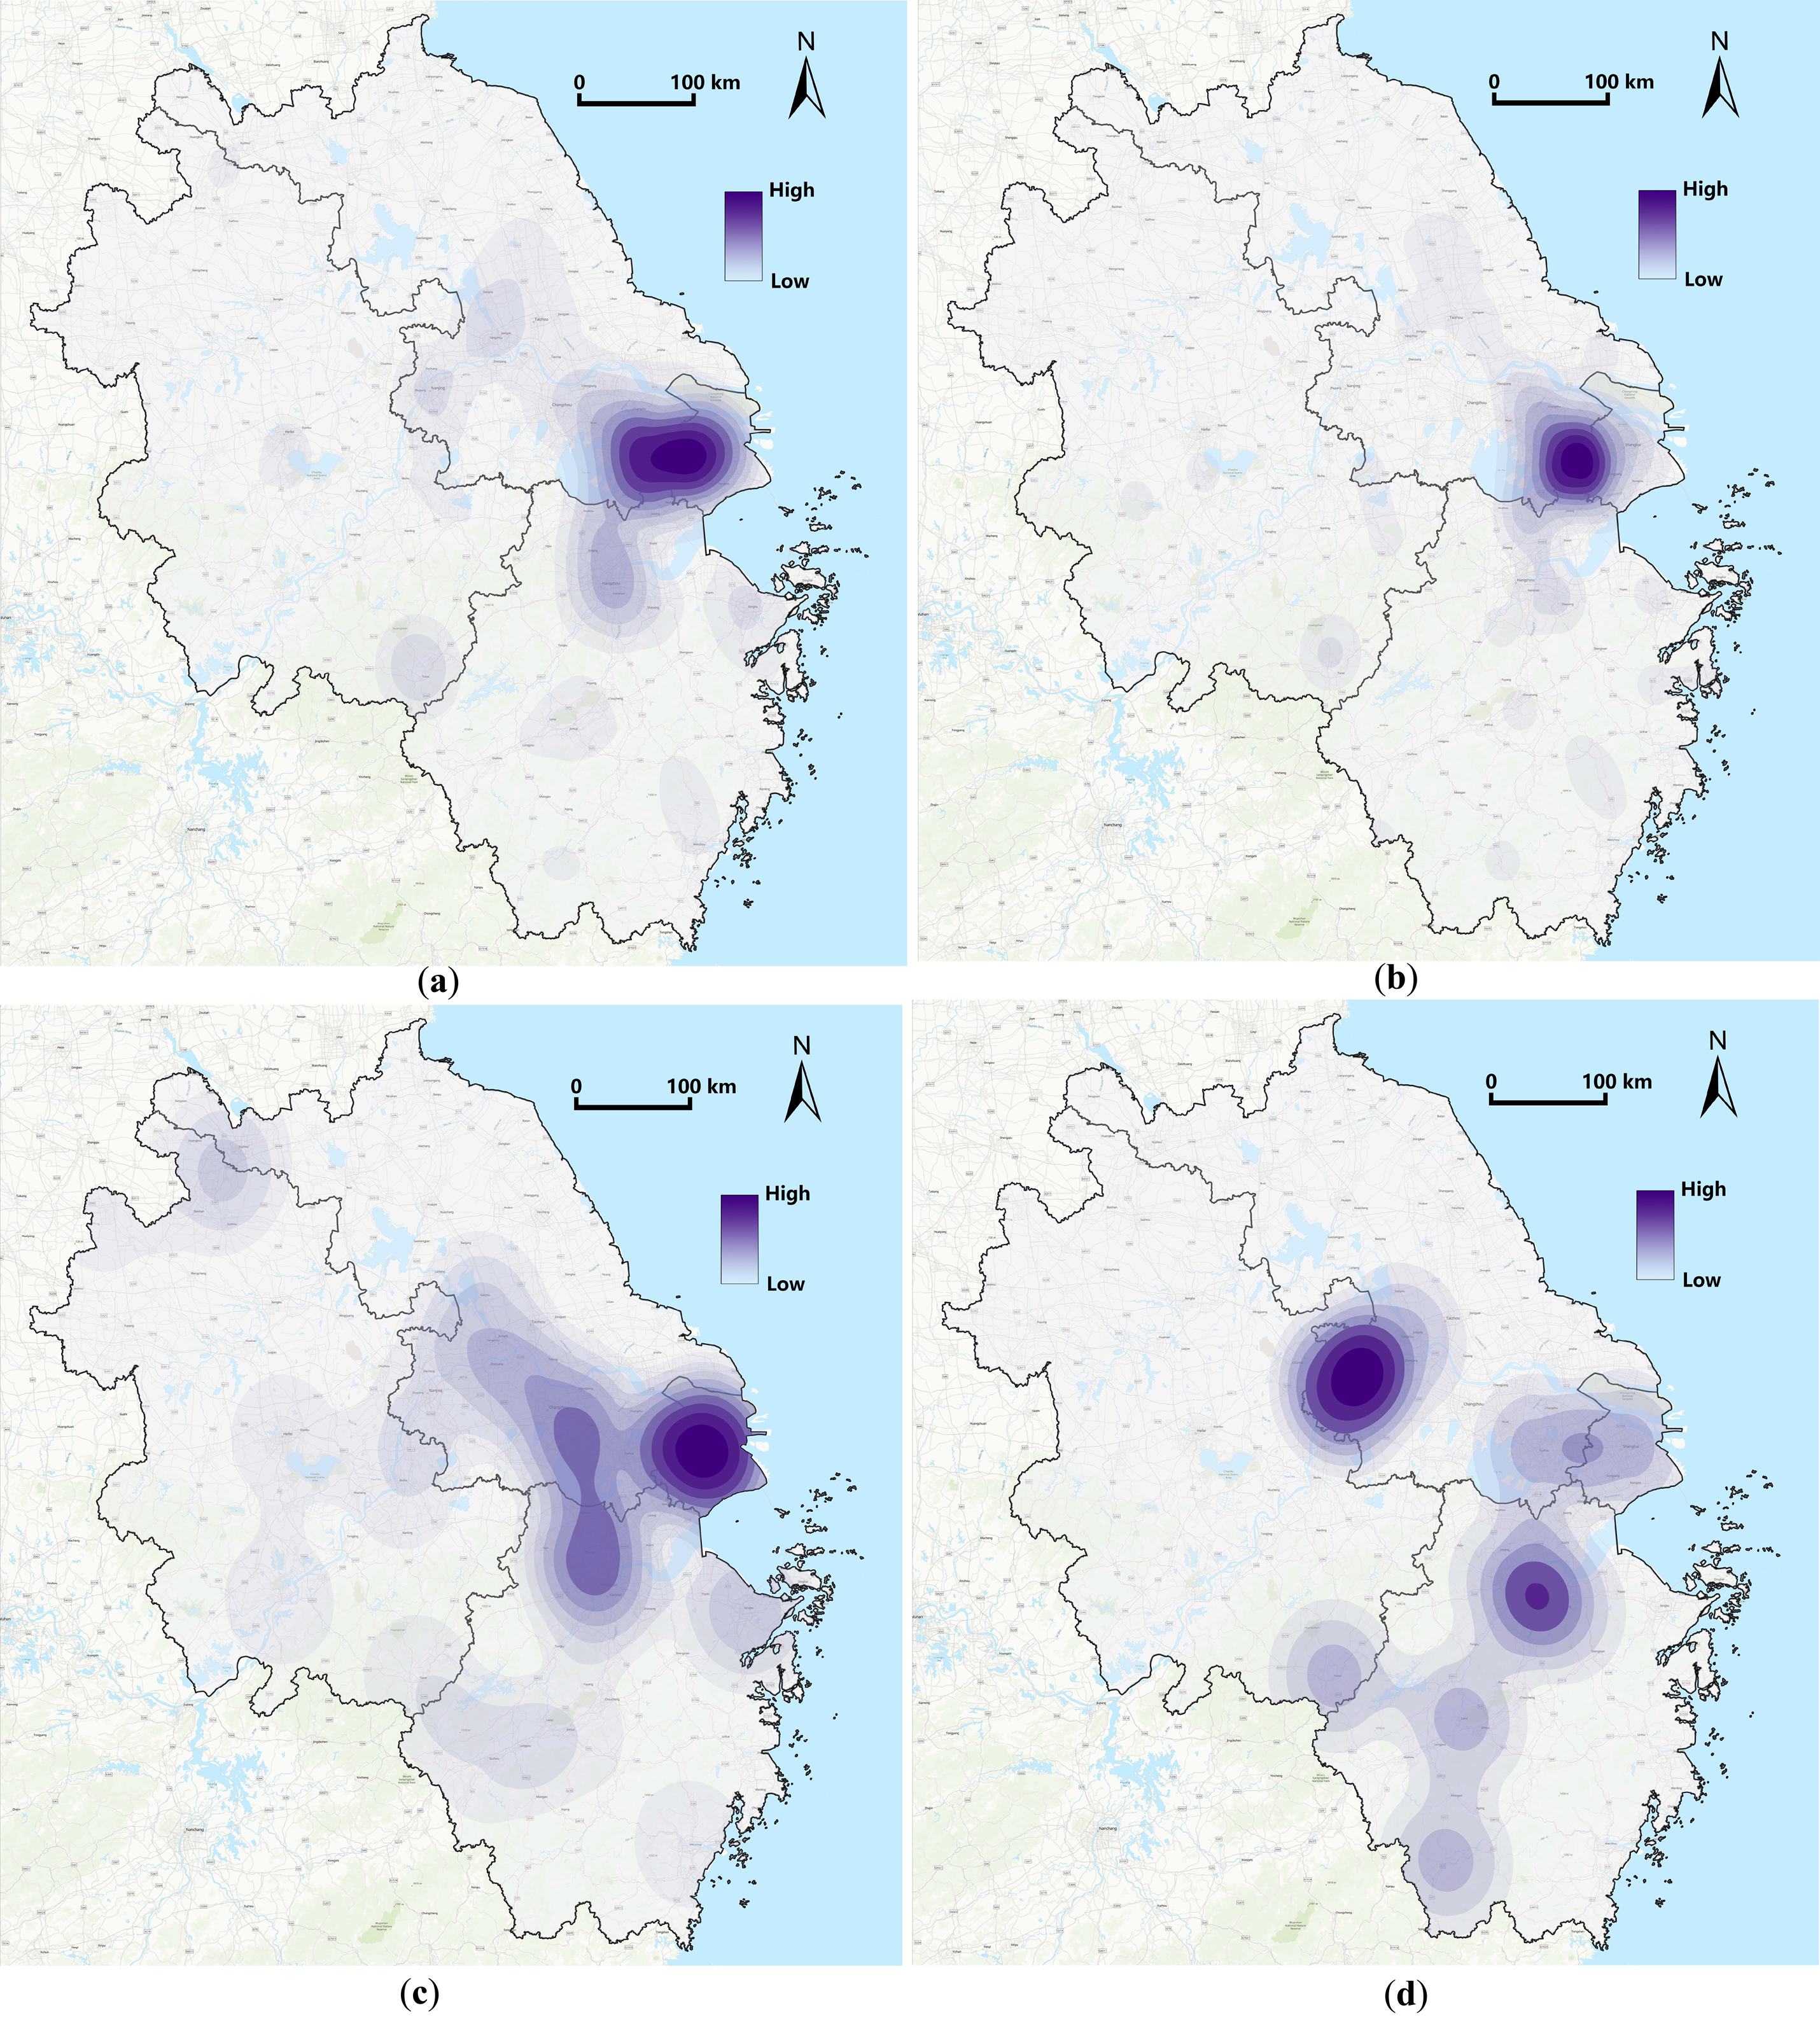
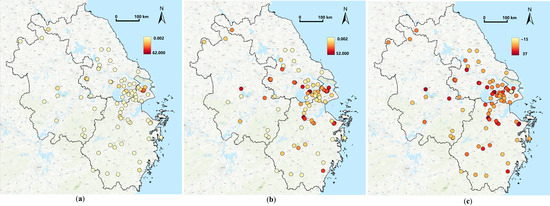
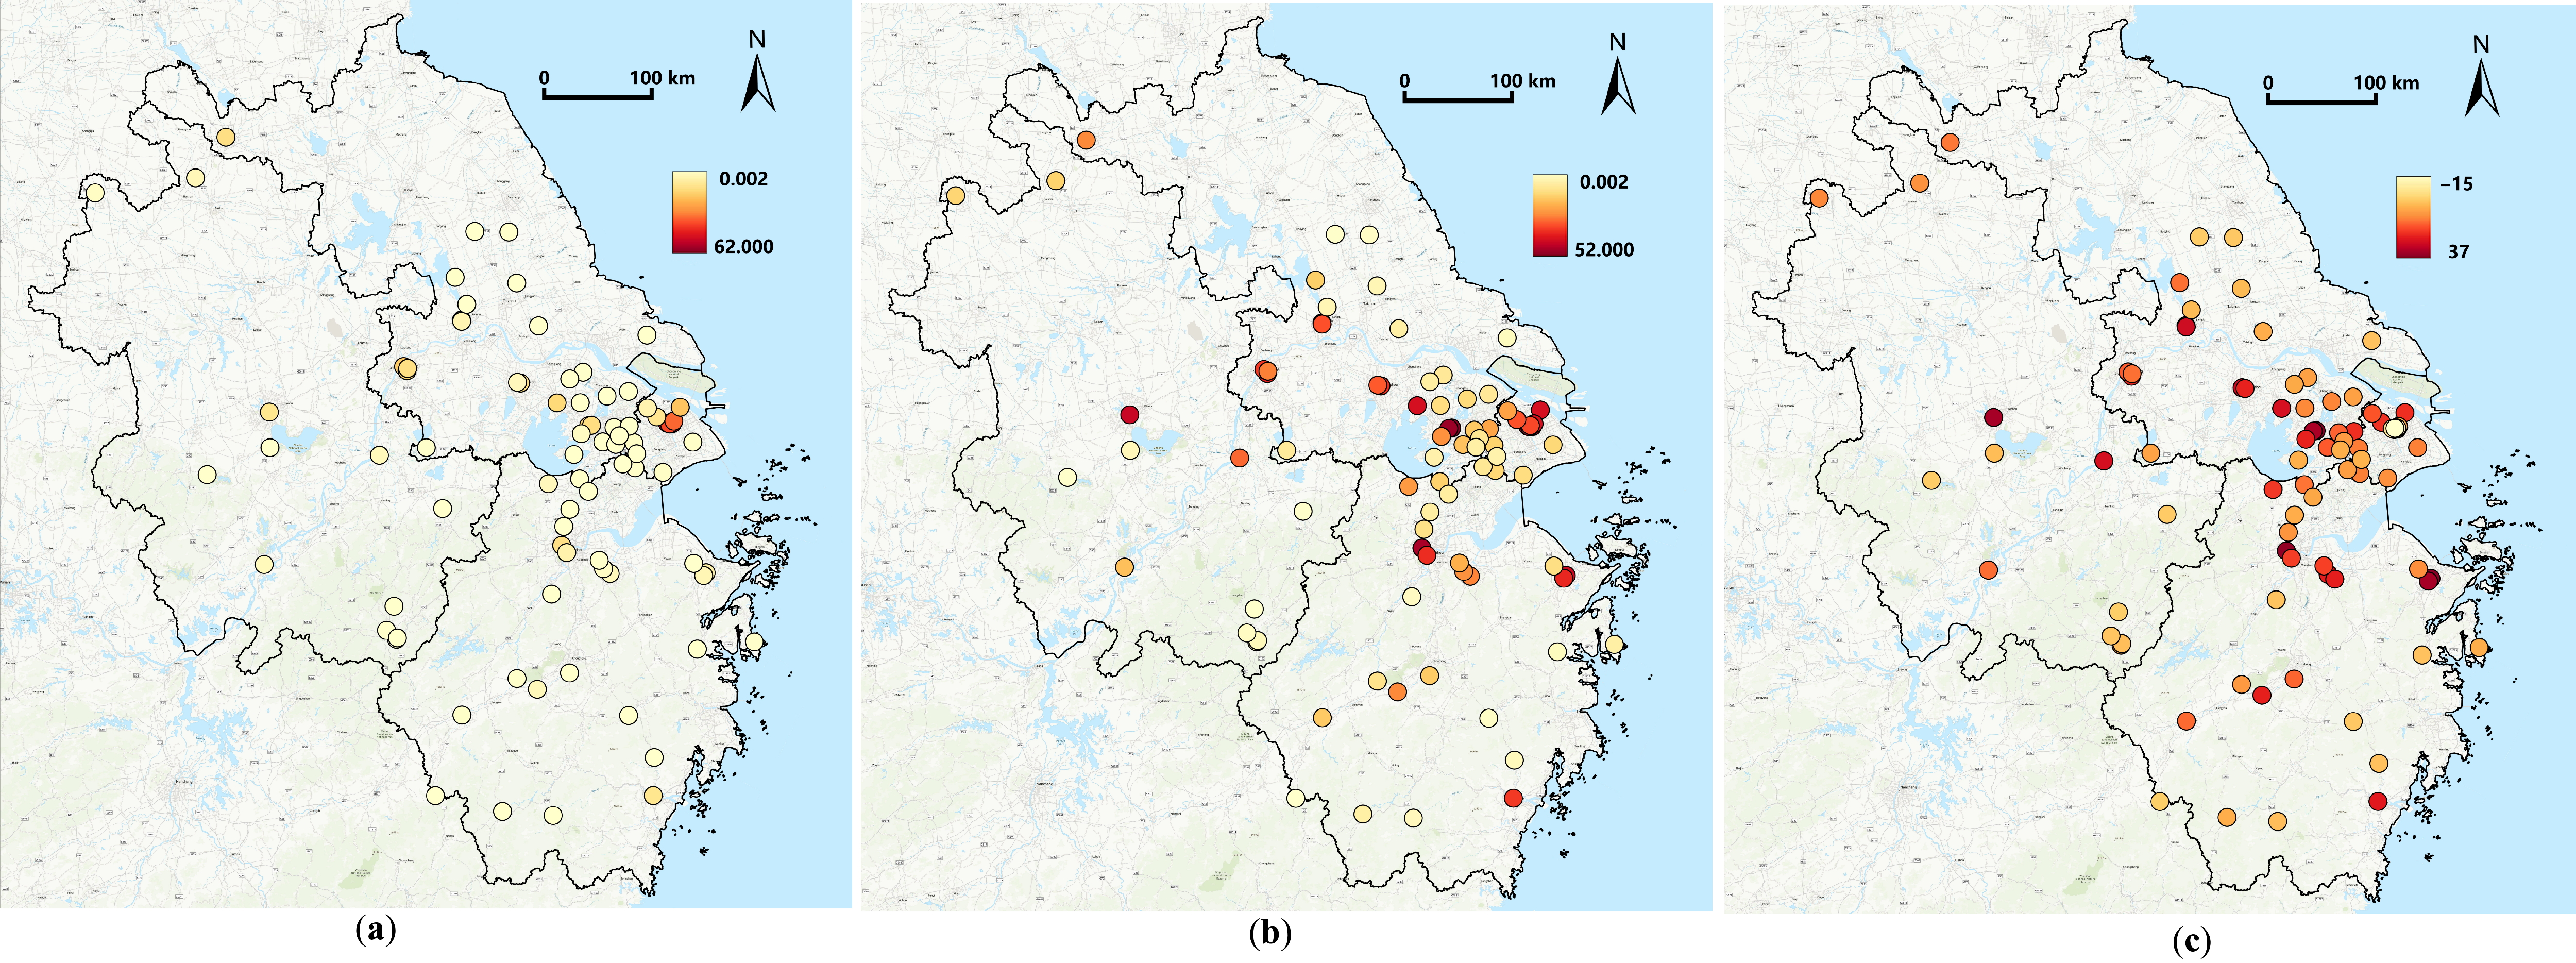
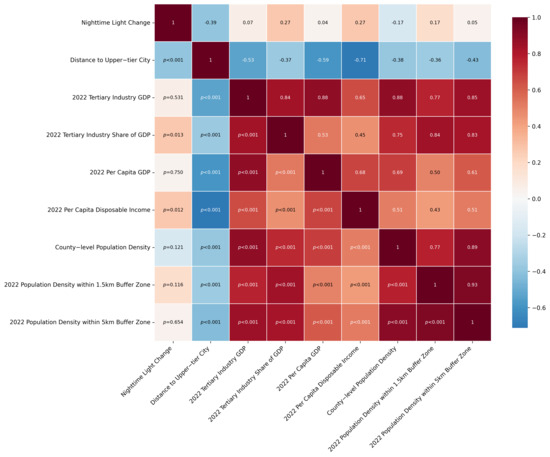
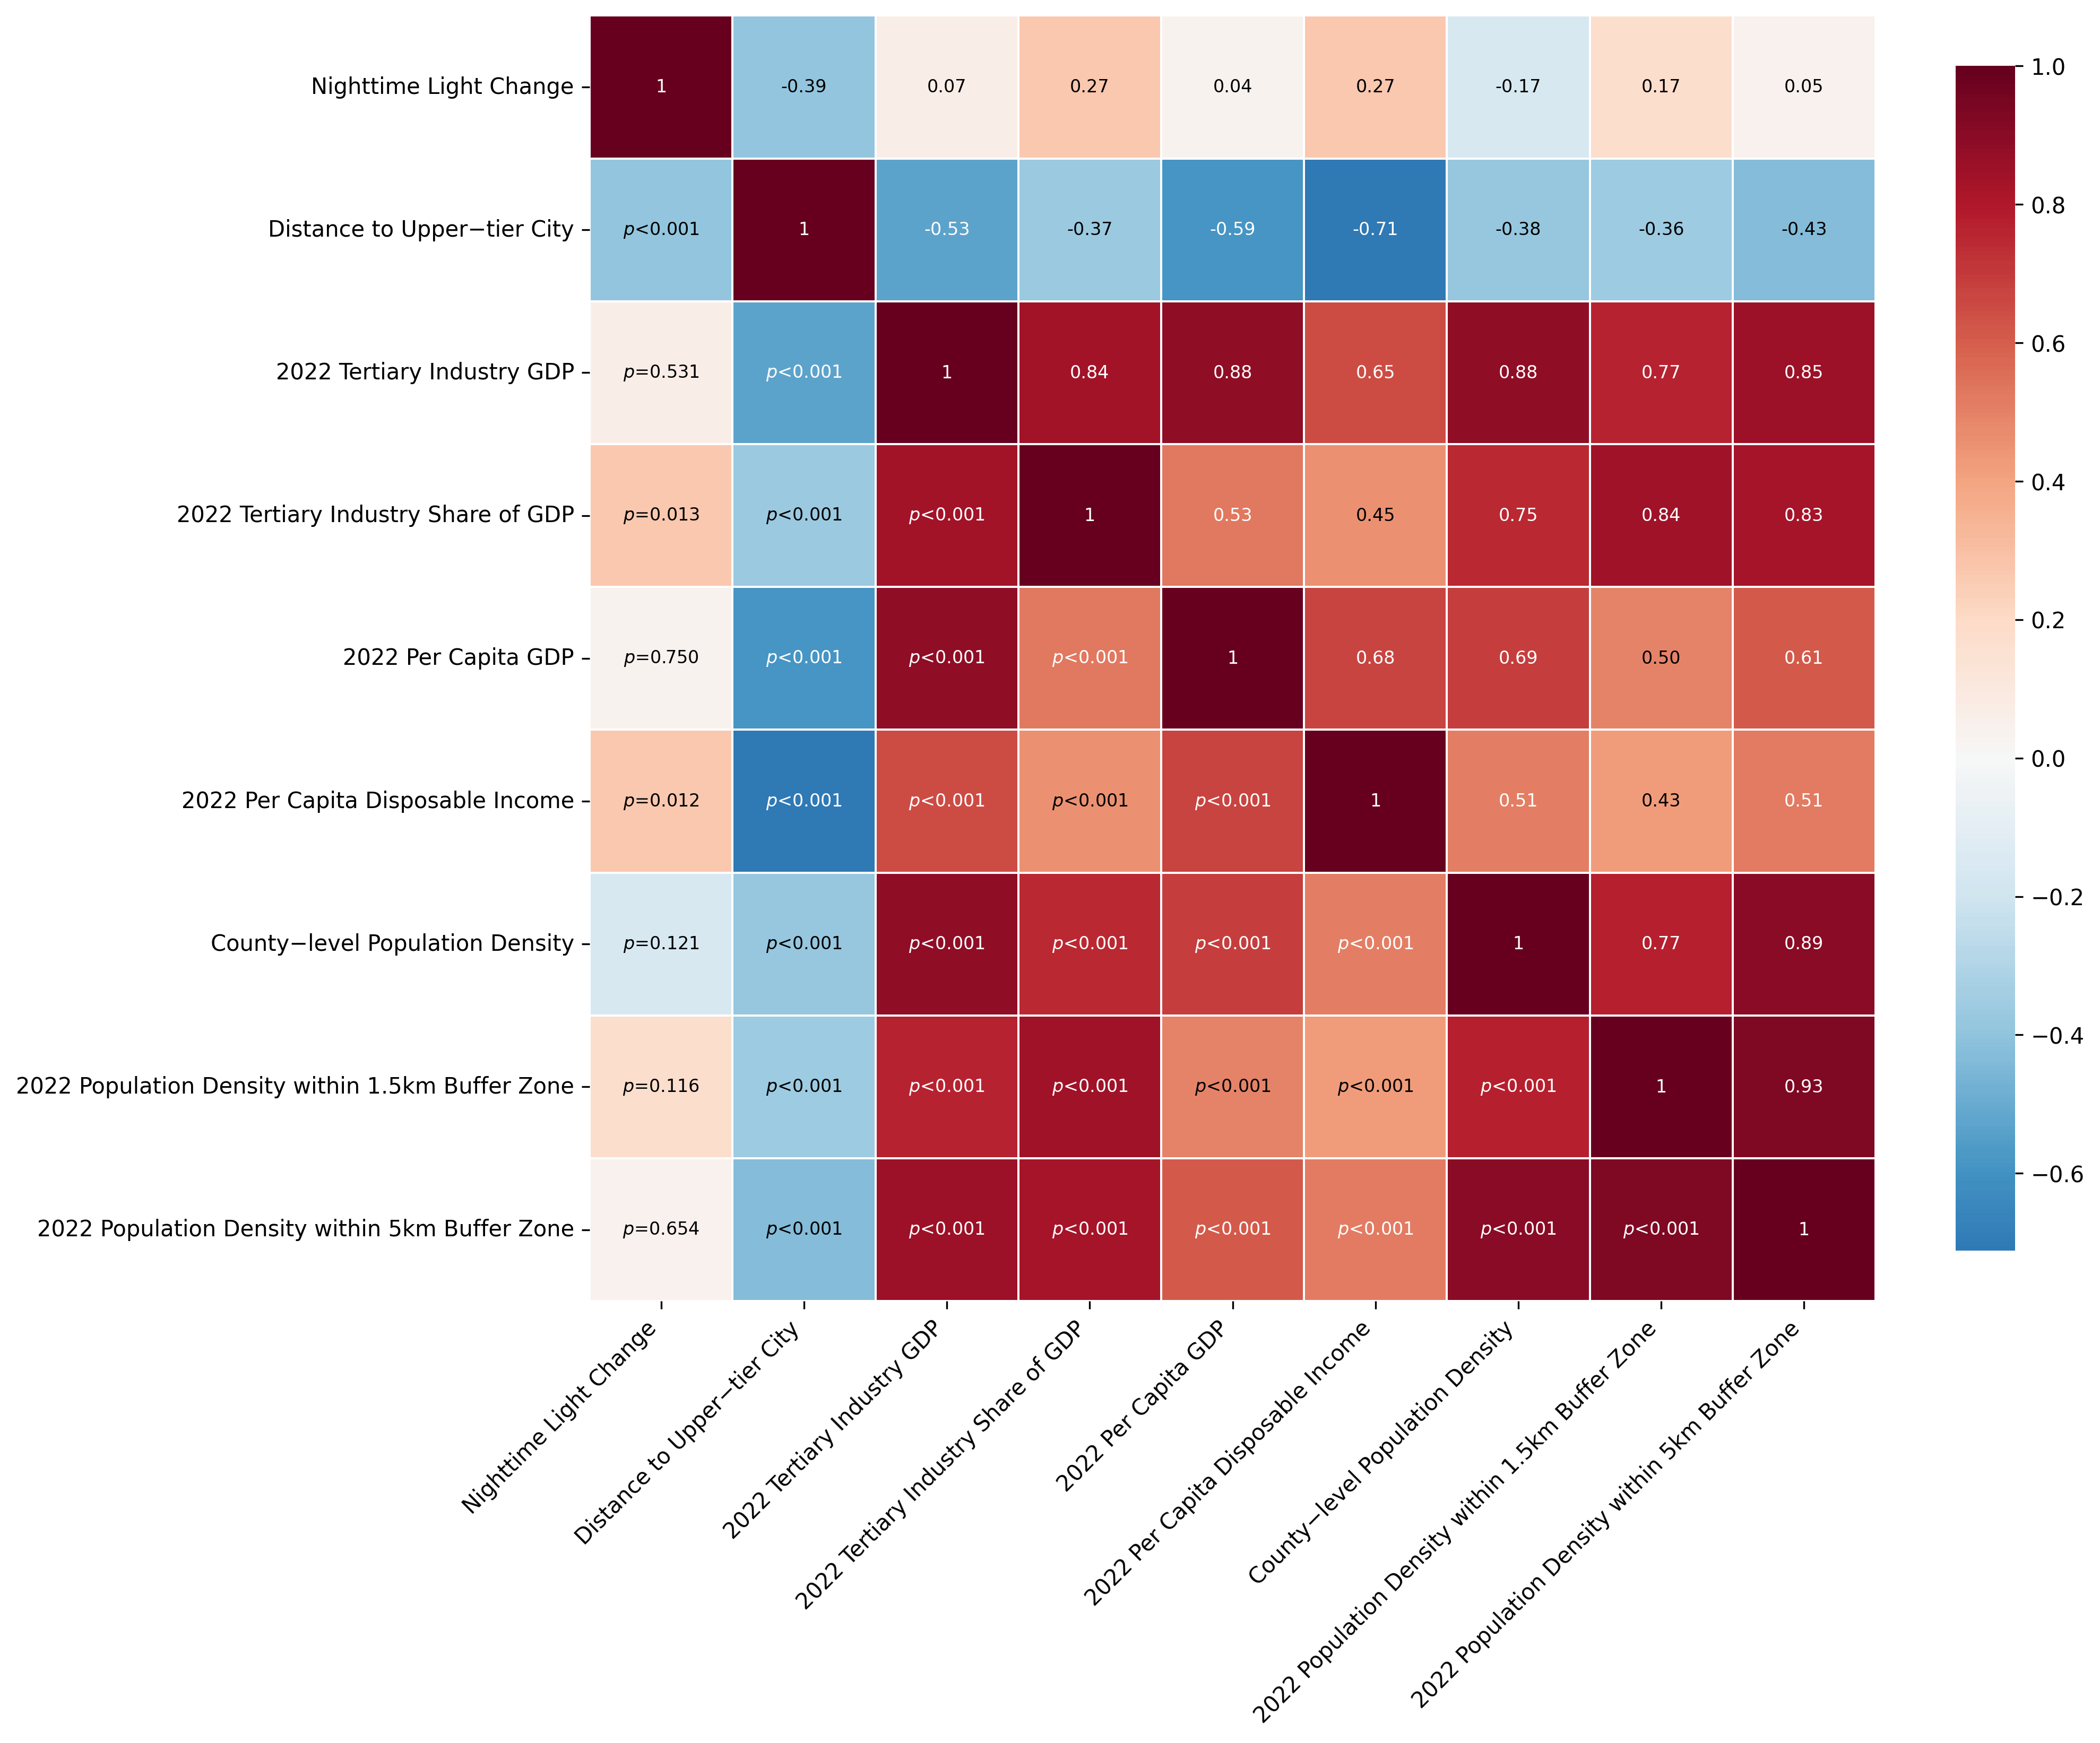
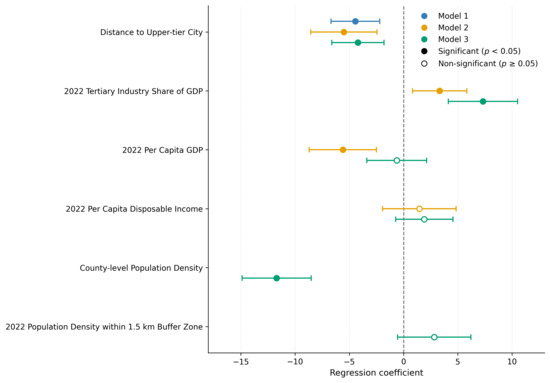
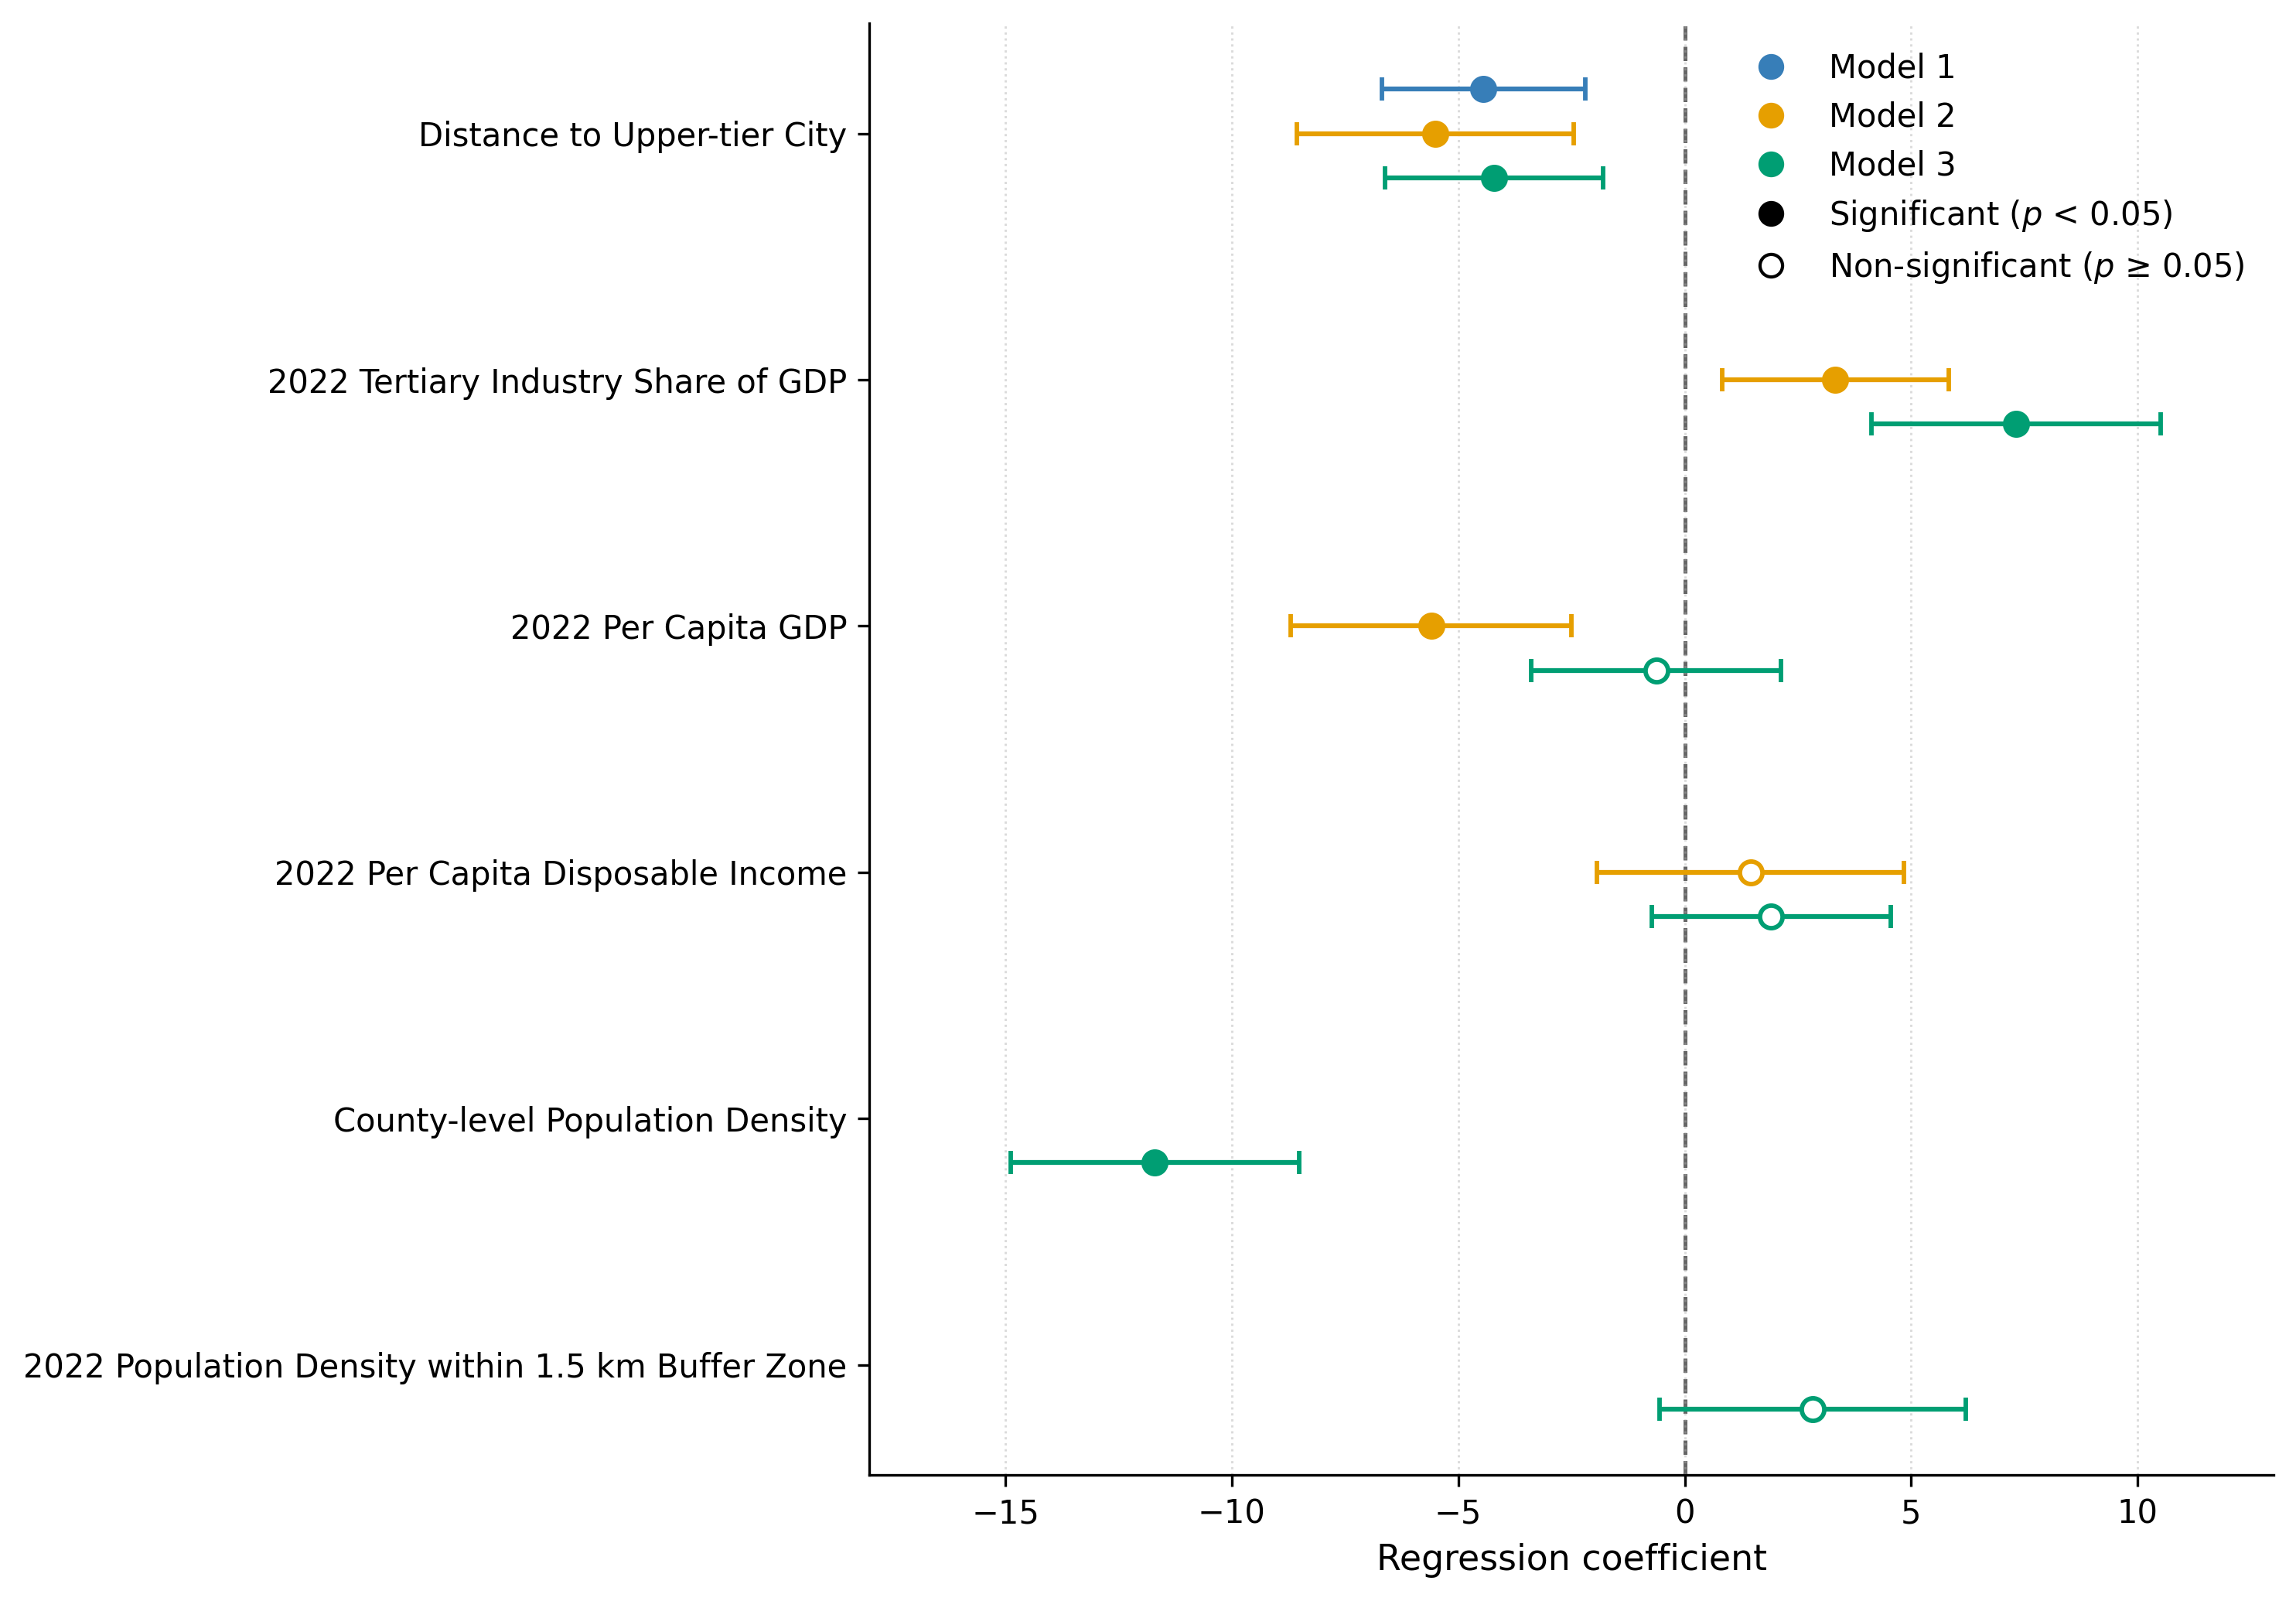

Disclaimer/Publisher’s Note: The statements, opinions and data contained in all publications are solely those of the individual author(s) and contributor(s) and not of MDPI and/or the editor(s). MDPI and/or the editor(s) disclaim responsibility for any injury to people or property resulting from any ideas, methods, instructions or products referred to in the content. |
© 2026 by the authors. Licensee MDPI, Basel, Switzerland. This article is an open access article distributed under the terms and conditions of the Creative Commons Attribution (CC BY) license.