


Abstract
Rapid urbanization in the Huaihe River Basin has reshaped land use and intensified the tension between ecological protection and food security. A key gap is that most basin-scale ecosystem service value (ESV) assessments describe changes in land-cover composition but do not identify how landscape configuration–ESV associations vary across space. Using land use remote sensing images from 2000 to 2020, we quantitatively characterized the spatiotemporal evolution of land use via transfer matrices and landscape pattern indices. By integrating the equivalent value factor method, contribution analysis, spatial correlation analysis, and the geographically weighted regression (GWR) model, we examined the spatiotemporal dynamics and driving mechanisms of ecosystem service value (ESV). Key findings are as follows: (1) From 2000 to 2020, cropland area steadily decreased, while construction and forest land expanded markedly, with a synthetic land-use dynamic degree reaching 9.66%. (2) ESV first rose then fell, showing an overall decline. Forest land (18.882 billion CNY) and water areas (20.331 billion CNY) were the primary contributors. The ESV response to land use change manifested as a trade-off between short-term gains and long-term degradation. (3) Landscape patterns exhibited significant spatial heterogeneity, and ESV correlated strongly with patch number (NP) and landscape shape index (LSI). Class area (CA) emerged as the dominant factor, with CA of forest land, cropland, and water areas exerting the most pronounced effects. Based on the differential driving effects of landscape patterns and identified land use change hotspots, we propose enhancing ecosystem service values and mitigating conflicts between ecological conservation and food security through differentiated ecological engineering and ecological compensation strategies.
1. Introduction
Land use patterns directly modulate ecosystem service (ES) supply by altering surface cover types. However, the mechanisms through which landscape patterns influence ESs remain poorly understood, hampering the formulation of targeted land use policies for ecological enhancement [1]. Accurately assessing the dynamic response of ecosystem service value (ESV) to land use changes is critical for diagnosing regional ES problems, improving land use efficiency, and fostering coordinated sustainable development. The Huaihe River Basin, situated in China’s north–south climatic transition zone, harbors fragile and complex ecosystems and has a population density 4.8 times the national average. Rapid urbanization and intensified human activities have reshaped its land use configuration, triggering drastic shifts in landscape patterns and ESs. In particular, excessive agricultural reclamation and unregulated urban expansion have continuously encroached upon natural ecological spaces, leading to marked degradation of ES functions [2]. In the context of China’s ongoing ecological civilization construction and territorial spatial governance reform, exploring the spatial disparities in landscape pattern driving effects on ESs within this basin is both a prerequisite for optimizing land use and maximizing ecological benefits [3] and a pressing priority for global sustainability strategies [4].
Ecosystem services, the benefits that humans derive from natural ecosystems [5,6], serve as a crucial link between ecosystems and human activities [7], underpinning the Earth’s life support system and human well-being [8]. Quantifying ESV allows for a deeper understanding of ecosystem structure and dynamics across spatiotemporal scales, thereby providing a scientific basis for sustainable land resource utilization. Land use, as the primary carrier of human activities, directly affects ecosystem structure and functions, and thus determines ESV. While rational land allocation is essential for maintaining and enhancing ESV [9], how to effectively leverage the driving mechanisms of landscape patterns to inform land use optimization remains a major unresolved challenge. Existing studies have largely concentrated on ESV quantification and spatiotemporal distribution [10]; systematic investigations into how specific landscape pattern indices are associated with ESV dynamics and how spatially heterogeneous relationships can be translated into actionable land-use guidance remain scarce [11]. Notably, at the watershed scale, the direction and intensity of these driving effects exhibit significant spatial heterogeneity, which represents a key breakthrough for future land use optimization strategies [12].
Landscape pattern dominates the spatial differentiation of ecosystem service value in watersheds. Existing studies have mostly focused on different ecological regions and have gradually developed the analytical framework of landscape pattern–ecological process–ecosystem services [13,14]. Compared with ecological regions with relatively single functions, complex watersheds in major grain-producing areas serve both agricultural production and ecological conservation functions. Land use adjustment in such areas is often accompanied by trade-offs between agricultural production space and ecological space. Relevant studies have been conducted in typical agricultural regions [15,16]. Landscape spatial configuration can significantly affect the supply capacity of ecosystem services. However, systematic understanding is still lacking regarding the differences in landscape pattern response mechanisms among different types of watersheds [17]. For complex watersheds in major grain-producing areas such as the Huaihe River Basin, empirical studies on landscape pattern-driven spatial differences in ecosystem services and their integration with land use planning optimization remain relatively insufficient [18]. The Huaihe River Basin is an important grain-producing region in China. It is characterized by a high proportion of cultivated land, high intensity of human activities, and prominent land use competition. There is an urgent need for targeted research to provide scientific evidence for regional territorial spatial optimization and ecological conservation practices [19].
Land use change, resulting from human–environment interactions [20], is closely linked to ESs, affecting services from biodiversity conservation to climate regulation [21]. In the Huaihe River Basin, rapid urban expansion and dramatic land use shifts have exacerbated ESV fluctuations, making it crucial to clarify these impacts [22]. Since the implementation of the “Central China Development Plan” in 2004, land use types have diversified, accompanied by substantial changes in landscape patterns [23]. Landscape patterns, as spatial manifestations of land use, reflect the driving effects of different patch types on ESs, but these effects are spatially heterogeneous. For instance, where forest land exerts a significant positive effect, the Grain-for-Green program should be prioritized; where water areas (e.g., wetlands) show positive effects, conversion from cropland to wetlands should be encouraged. Identifying and leveraging this heterogeneity is essential for basin scale land use optimization and ecological security [24]. Several key questions remain: Do land use changes drive ESV increases or decreases? Which landscape pattern indices have more significant driving effects on ESV? How can spatial heterogeneity be translated into targeted optimization strategies? Answering these questions is theoretically valuable for understanding the disruptive impacts of human activities on ecosystems and deepening insights into human–nature interaction mechanisms.
To address these gaps, this study analyzes the spatiotemporal changes in land use and landscape patterns in the Huaihe River Basin from 2000 to 2020, evaluates provisioning, regulating, supporting, and cultural ecosystem service values, and examines their relationships with landscape structure. Rather than proposing a new ESV valuation or GWR algorithm, the study integrates established methods to: (1) characterize land use transitions and landscape structure; (2) quantify total and service-specific ESV dynamics, contributions, and sensitivity; and (3) identify class-level landscape variables whose associations with ESV vary across space. This integration enables spatially heterogeneous evidence to inform differentiated land-use planning, ecological engineering, and ecological-compensation recommendations.
2. Study Area and Data Sources
2.1. Study Area
The Huaihe River Basin (111°55′ E–121°25′ E, 30°5′ N–36°36′ N) is situated in east–central China, bordering the Funiu and Tongbai Mountains to the west, the Yellow Sea to the east, the Dabie Mountains, the Jianghuai Hills, and the Tongyang Canal to the south (separating it from the Yangtze River Economic Zone), and the Yellow River’s southern levee and Mount Taishan to the north (adjacent to the Yellow River Economic Zone). Covering 262,100 km2, the basin spans 39 prefecture level cities and 204 counties across five provinces—Hubei (0.24%), Henan (31.48%), Anhui (26.08%), Jiangsu (24.08%), and Shandong (17.93%) (Figure 1). The region experiences a mean annual precipitation of 992.88 mm and an average temperature of 13.7 °C, offering favorable hydrothermal conditions, abundant mineral resources, convenient water transport, and a strategic location. As one of China’s most densely populated areas, with a population density 4.8 times the national average, the basin is a traditional national grain-producing base, characterized by strong urbanization, industrial activity, and agriculture. Its proximity to the economically developed Yangtze River Delta provides substantial advantages for industrial transfer, while its rich human resources and large consumer market underpin significant urbanization potential. However, rapid urban expansion, socio-economic development and intensive resource exploitation have precipitated severe ecological challenges, including excessive agricultural reclamation, unregulated construction land encroachment, and continuous shrinkage of natural ecological spaces. These pressures have markedly degraded ecosystem services and heightened conflicts between food production and environmental protection. In 2018, the Huaihe River Ecological Economic Belt was elevated to a national development strategy, presenting both a critical opportunity for high-quality regional growth and an urgent need to reconcile economic progress with ecological sustainability [1,25].
Figure 1.
Location map of the Huaihe River Basin. (a) Location of the Huaihe River Basin in China; (b) administrative scope of the Huaihe River Basin; (c) digital elevation model (DEM) of the Huaihe River Basin.
2.2. Data Sources
Land use data were obtained from the Resource and Environmental Science and Data Center (RESDC) of the Chinese Academy of Sciences (https://www.resdc.cn/), including five periods (2000, 2005, 2010, 2015, and 2020) with a spatial resolution of 30 m × 30 m. Grain price data (annual average prices of rice, wheat, and maize from 2000 to 2020) were obtained from the China Statistical Yearbook (http://www.stats.gov.cn/), and administrative boundaries and urban location data were obtained from the 1:4,000,000 database of the National Geomatics Center of China (https://www.ngcc.cn/). All spatial data were uniformly projected into the WGS_1984_Albers coordinate system and spatial scale conversion was conducted using ArcGIS. Considering that land use data are categorical variables, the nearest neighbor method was applied to resample the 30 m land use data to a spatial resolution of 1 km, thereby preserving the integrity of land use categories. Subsequently, the Huaihe River Basin boundary was extracted, and the processed data were used for ecosystem service value calculation and landscape pattern metric analysis. Details of the data are shown in Table 1.
Table 1.
Data sources and description.
3. Research Methods
The study integrates land use change analysis, ecosystem service value assessment, and spatial driving mechanism analysis to examine landscape–ESV relationships and derive differentiated ecological management strategies for the Huaihe River Basin (Figure 2). It follows a conceptual chain in which land use change alters landscape composition and configuration; these changes influence the spatial pattern of ecosystem service supply and its monetary proxy, ESV; spatial analyses then identify where landscape–ESV associations are stronger or weaker; and the resulting evidence supports differentiated land-use planning. The framework is an analytical integration of established methods, rather than a new valuation or regression algorithm [26,27]. The theoretical framework is presented in Appendix A (Figure A2, theoretical framework).
Figure 2.
Technical flowchart.
3.1. Analysis of Land Use Change
3.1.1. Land Use Transfer Matrix
The land use transfer matrix, derived from spatial overlay analysis in ArcGIS 10.3, reveals the transition structure and directional shifts of land use types between the beginning and end of the study period. The general form of this matrix is expressed as follows [28,29]:
where Sij denotes the area converted from land use type i at the initial time to type j at the final time, and n is the total number of land use types. In the matrix, each row corresponds to the initial type i.
3.1.2. Land Use Dynamic Degree
The land use dynamic degree comprises both the single dynamic degree and the synthetic dynamic degree. The single dynamic degree quantifies the change in area of a specific land use type over a given period [30,31]:
where K denotes the single dynamic degree; Aa and Ab are the areas of a given land use type at the beginning and end of the study period, respectively; and T is the study duration in years.
The synthetic dynamic degree quantifies the annual rate of land use change across the study area, and is calculated as follows:
where LC is the synthetic dynamic degree; ΔLUi−j is the area converted from land use type i to type j over the study period; and LUi is the initial area of type i.
3.1.3. Landscape Pattern of Land Use Types
A landscape is a complex mosaic of different land use types. Landscape pattern change refers to spatial variations in patch size, shape, and aggregation, reflecting spatial heterogeneity. Land use change influences landscape patterns and ecological quality, thereby affecting ESV [32]. Landscape indices are quantitative metrics that summarize landscape pattern information, reflecting structural composition and spatial configuration. They link landscape structure to ecological processes and functions, facilitating interpretation of landscape functions.
For this study, we selected class-level indices, including class area (CA), percent of landscape (PLAND), number of patches (NP), patch density (PD), landscape shape index (LSI), and clumpiness index (CLUMPY), and landscape-level indices, including NP, PD, LSI, contagion (CONTAG), Shannon’s diversity index (SHDI), and Shannon’s evenness index (SHEI). The calculation formulas for these indices are provided in Table 2 [33,34,35]. CA, as a landscape composition metric, reflects the direct contribution of land use area changes to ecosystem service values through its significant correlation with ESV. Since ESV estimation itself is based on land use area, this relationship involves a certain degree of mathematical association. Landscape structural metrics, including NP, PD, LSI, CONTAG, SHDI, and SHEI, further reflect the effects of land use spatial configuration, fragmentation degree, and landscape heterogeneity on the spatial distribution of ESV. The complete selection logic and scientific rationale for the landscape metrics are provided in Appendix A.
Table 2.
Descriptions of landscape indices.
3.2. Ecosystem Service Value Assessment Method
3.2.1. Ecosystem Service Value Assessment
Provisioning services refer to the material products provided by ecosystems for human beings, including food, water resources, and raw materials. In the Huaihe River Basin, these services are mainly represented by grain production from cultivated land and water resource supply from aquatic ecosystems. Regulating services represent the capacity of ecosystems to regulate regional environmental conditions, including water conservation, climate regulation, carbon sequestration and oxygen release, and water purification [36,37]. These functions play critical roles in reducing non-point source pollution and mitigating flood risks in the basin. Supporting services refer to the fundamental ecological functions that maintain ecosystem operation, including soil conservation, habitat maintenance, and nutrient cycling, which support the structural stability of the watershed ecosystem. Cultural services refer to the non-material benefits provided by ecosystems, such as aesthetic values and recreational opportunities, which mainly originate from landscape units including forest land, rivers, lakes, and wetlands [38,39]. Ecosystem service value (ESV) comprises provisioning, regulating, supporting, and cultural services, representing the total benefits that ecosystems provide to human well-being. This study employed the ecosystem service value theory and China’s equivalent factor table to develop an ESV assessment model for the Huaihe River Basin [40,41]. One equivalent factor is defined as 1/7 of the average grain economic value per unit area of cropland in the same year, which can be calculated as follows [42,43]:
where E is the equivalent factor (CNY/(km2·a)); Q is the average grain yield per unit area of cropland (kg/km2); and P is the average grain market price (CNY/kg). Based on the average basin’s grain yield per unit area and average grain price in the Huaihe River Basin during 2000–2020, the equivalent factor was determined to be 633,827.08 CNY/(km2·a).
Following the equivalent factor method [44], construction land was assigned an ESV coefficient of zero, reflecting its negligible direct ecosystem service provision (Table A2). This parameter is subsequently used to estimate the values of provisioning, regulating, supporting, and cultural services, and to calculate the total ESV of the basin. The formulas are as follows:
where E is the equivalent factor of ecosystem service value (CNY/km2); eik is the equivalent coefficient of service type k for land use type i; VCik is the value per unit area of land use type i for service type k (CNY/km2); Ai is the area of land use type i; ESVi is the total ecosystem service value of land use type i; and ESV is the total ecosystem service value of the study area.
3.2.2. Calculation of Ecosystem Service Contribution Rate
The ecosystem service contribution rate was used to assess the effect of land use conversion on ecosystem service dynamics, with the formula as follows [45]:
where EI is the ecological contribution rate of a given land use conversion to the change in ESV; VCj and VCi are the ecosystem service values per unit area of land use types j and i, respectively; and LUCij is the area converted from type i to type j.
3.2.3. Sensitivity Analysis of Ecosystem Services
We introduced the economic elasticity theory to quantify the sensitivity of ESV to land use changes, defined as the ratio of the ESV change rate to the synthetic dynamic degree of land use.
where CS is the sensitivity of ESV to land use changes; ESVb and ESVa are the ESV at the beginning and end of the study period, respectively; LC is the synthetic dynamic degree of land use; and T is the study duration in years. If CS ≥ 1, ESV is elastic with respect to land use change, and the assessment reliability should be further examined in light of local conditions. If CS < 1, the ESV response is inelastic, indicating robust assessment results [46].
3.3. Analysis of Influencing Factors of Ecosystem Service Value
We used Moran’s I index to assess the spatial autocorrelation of ESV dynamics in the Huaihe River Basin. Combined with geographically weighted regression (GWR), we estimated the spatially varying relationships between ESV and landscape pattern indices, thereby capturing local effects that global regression models tend to mask [47,48]. All analyses were implemented using ArcGIS 10.3 and Fragstats 4.3. The GWR model can identify the spatial non-stationarity of driving factors [49]. Within the analytical framework of land use evolution–landscape pattern metrics–ESV response, the model outputs represent only the spatially differentiated driving effects associated with these factors rather than causal relationships [50,51].
3.3.1. Pearson Correlation Analysis
Pearson correlation analysis measures the strength of linear relationship between two variables. The correlation coefficient R ranges from −1 to 1; positive and negative values indicate positive and negative correlations, respectively, while zero indicates no linear relationship.
where xi and yi are the values of variables x and y in year i, respectively; and are their corresponding annual means; and n is the number of years. A significance of R was assessed using a t-test, with p < 0.05 indicating a statistically significant correlation.
3.3.2. Global Moran’s I Index
Given n spatial units with observed values xi at unit i, the global Moran’s I is defined as follows:
where Wij denotes the spatial weight between units i and j. Moran’s I ranges from −1 to 1; positive and negative values indicate positive and negative spatial autocorrelation, respectively, while zero implies no spatial autocorrelation. Values approaching 1 reflect stronger clustering of the attribute, whereas values approaching −1 reflect stronger heterogeneity.
3.3.3. Geographically Weighted Regression Model
We employed the geographically weighted regression (GWR) model to assess the spatial driving mechanisms of ESV determinants and to explore the spatially varying relationships between dependent and independent variables. To evaluate the fitting performance and reliability of the GWR model, the corrected Akaike information criterion (AIC) and adjusted coefficient of determination (adjusted R2) were used as model diagnostic indicators in this study (Table A3).
where βo(u) is the intercept; βk(u) is the regression coefficient for the k-th covariate; Xk(u) is the value of the k-th covariate at location u; p is the number of covariates; and ε(u) is the error term at location u.
4. Results
4.1. Land Use Changes in the Huaihe River Basin
4.1.1. Spatiotemporal Dynamics of Land Use Changes
The Huaihe River Basin exhibits spatially heterogeneous land use patterns, with cropland and construction land dominating the landscape and other types scattered (Figure 3). Throughout the study period, cropland remained the predominant type, accounting for over 73.81% of the basin area, albeit with a continuous declining trend. Construction land (>11.03%), forest land (>5.45%), and grassland (>3.49%) were the secondary types, among which construction land showed the most pronounced expansion. Spatially, cropland was concentrated in the basin’s plains, while construction land was distributed across county and municipal districts. Water areas were mainly located around Nansi, Luoma, Hongze, and Gaoyou lakes, whereas forest land and grassland were clustered in the Funiu, Tongbai, Dabie, and Yimeng mountain ranges in the west, southwest, south, and northeast, respectively.
Figure 3.
Land use patterns and transfer matrix of the Huaihe River Basin from 2000 to 2020. (a) Land use patterns of the Huaihe River Basin from 2000 to 2020; (b) land use transfer matrix of the Huaihe River Basin from 2000 to 2020.
During the study period, land use in the Huaihe River Basin exhibited a general trend of rapid construction land expansion, substantial cropland loss, and increasing pressure on ecological land, with marked inter stage variations. Construction land continuously expanded, increasing from 28,899.39 km2 in 2000 to 42,244.76 km2 in 2020. From 2000 to 2020, land use changes in the Huaihe River Basin were mainly characterized by the outward expansion of construction land. Continuous urban development occupied surrounding cultivated land areas, resulting in the fragmentation and isolation of numerous cultivated land patches. Consequently, the problem of cultivated land landscape fragmentation became increasingly prominent. Conversely, cropland, as the primary outflow type, shrank from 208,700 km2 to 190,900 km2, a net reduction of over 17,000 km2. Notably, from 2000 to 2015, 2498.06 km2, 3438.77 km2, and 4665.95 km2 of cropland were converted to construction land across the three successive stages, serving as the main land source for urbanization. Ecological land underwent substantial structural changes. Although forest land increased from 13,300 km2 to 14,700 km2, 1041.48 km2 of it was converted to cropland during 2015–2020, intensifying conservation pressure. Grassland decreased sharply from 1816.15 km2 to 975.50 km2, and unused land dwindled from 25.18 km2 to 1.41 km2, indicating severe ecological space compression. Temporally, cropland declined rapidly by 4118.49 km2 during 2000–2005, while construction land, forest land, and water areas all increased with construction land exhibiting the largest gain. In 2005–2010, construction land expanded by 3409.44 km2 and forest land by 239.10 km2, whereas all other types decreased. The most dramatic changes occurred in 2010–2015, with construction land increasing by 4866.15 km2 (~1.4 times the previous period) and cropland reduction peaking. During 2015–2020, changes slowed markedly for all types: cropland loss decelerated substantially and construction land expansion sharply declined.
From 2000 to 2020, land use in the Huaihe River Basin underwent drastic changes, with a synthetic dynamic degree of 9.66%, indicating that nearly one-tenth of the total area experienced type conversion (Table 3). Change rates varied markedly across land use types. Construction land expanded rapidly and persistently, with consistently positive dynamic degrees far exceeding those of other types; its peak growth rate (2.81%) occurred during 2010–2015. In contrast, cropland and grassland declined continuously over the two decades, with dynamic degrees of −1.37% and −8.35%, respectively; grassland degradation was particularly severe during 2015–2020, shrinking at an annual rate of 4.89%. Forest land and water areas exhibited pronounced fluctuations: forest land increased steadily in the early period (2000–2015) but experienced its first negative growth (−0.47%) in 2015–2020, while water areas grew rapidly (3.22%) during 2000–2005 before entering a slow decline. Unused land underwent the most dramatic reduction, with an annual dynamic degree of −17.90%.
Table 3.
Land use dynamic degree of the Huaihe River Basin from 2000 to 2020.
4.1.2. Landscape Pattern Characteristics of Land Use Types
The landscape pattern of the Huaihe River Basin exhibited significant spatial heterogeneity from 2000 to 2020, closely linked to landscape-level characteristics (Figure 4). Given the temporal stability of landscape indices across years, we analyzed the mean variation of 12 key metrics. At the landscape level (Figure 4a–f), NP, PD, and LSI displayed similar spatial distributions, with low values in the north and medium-to-high values in the south, an area of intensive human activity, indicating greater fragmentation. High CONTAG values occurred in the agricultural counties of the upper and middle reaches, where cropland dominance enhanced contagion. Conversely, low CONTAG values in marginal and peri urban areas reflected greater landscape diversity. SHDI and SHEI were high in the topographically diverse marginal mountains and low in the core plains of the middle reaches, where extensive cropland coverage constrained landscape diversity.
Figure 4.
Landscape pattern characteristics of the Huaihe River Basin from 2000 to 2020: (a–f) represent six landscape-level indices; (g–l) represent six landscape class indices of cropland.
Given its dominance, cropland was further analyzed at the class level (Figure 4g–l). Cropland patch indices exhibited pronounced spatial differentiation between the middle reaches and peripheral areas. High CA and PLAND values in the central plains underscored strong cropland connectivity, whereas low values occurred in the marginal mountains and hills, where cropland proportion was limited. NP and LSI peaked in the hilly interlaced zones of the western and southern basin, indicating irregularly shaped and fragmented cropland patches, while low values prevailed in the north. The distribution of PD resembled that of SHEI at the landscape level. CLUMPY values were high in the north, indicating strong agglomeration, and low in urban rural ecotones, where aggregation weakened.
4.2. Ecosystem Service Value Dynamics in the Huaihe River Basin
4.2.1. Spatiotemporal Changes in Ecosystem Service Value
From 2000 to 2020, the total ESV of the Huaihe River Basin exhibited an initial increase followed by a decline, with an overall net loss of 38.422 billion CNY over the two decades (Figure 5). ESV contributions varied considerably across land use types. Cropland ESV decreased continuously from 1039.504 billion CNY in 2000 to 968.214 billion CNY in 2020, with a net loss of 71.289 billion CNY, emerging as the primary driver of the overall ESV decline. In contrast, forest land and water areas contributed positive increments of 18.882 billion CNY and 20.331 billion CNY, respectively. Forest land ESV rose from 254.667 billion CNY in 2000 to 273.549 billion CNY in 2020, with only a slight decrease during 2015–2020. Water area ESV increased during 2000–2005 but then declined to 283.170 billion CNY by 2020, with the rate of decrease accelerating after 2010. These two land use types thus became key pillars supporting the basin’s ESV.
Figure 5.
Spatiotemporal changes in ESV of the Huaihe River Basin from 2000 to 2020.
Temporally, ESV increased by 30.947 billion CNY during 2000–2005, largely driven by a substantial rise in water area ESV (+42.318 billion CNY). Thereafter, it declined continuously, with a sharp drop of 31.209 billion CNY during 2015–2020—the peak period of ESV loss. In this final stage, forest land ESV recorded its first negative change (−6.651 billion CNY), which, together with accelerated declines in grassland and water area ESV, marked the most severe ESV contraction in the basin.
4.2.2. Contribution of Land Use Changes to ESVs
Land use changes drove ESV variations in the Huaihe River Basin from 2000 to 2020, with distinct stage-specific mechanisms (Table 4). During 2000–2005, ecological improvement dominated, yielding a total ESV increase of 26.571 billion CNY. The conversion from cropland to water areas contributed the most (37.136 billion CNY, contribution rate 40.87%), and improvement-oriented conversions collectively accounted for 64.42% of the total increase. The period 2005–2010 marked a turning point toward degradation, as degradation-oriented conversions surpassed improvement-oriented ones for the first time (57.97% vs. the remainder). Among adverse pathways, conversions from water areas to cropland (20.00%) and from cropland to unused land (21.86%) were the primary negative contributors. Degradation intensified further from 2010 to 2020, with degradation-oriented contribution rates rising to 61.68–67.57%. During this period, the negative contribution of water to cropland conversion continued to grow (23.92–29.40%), while that of forest to cropland conversion surged to 15.16% in 2015–2020.
Table 4.
Contribution rates of land use changes to ESV changes.
4.2.3. Sensitivity of ESV to Land Use Change
The response of ESV to land use and ecosystem service changes exhibited pronounced spatiotemporal heterogeneity, while the overall assessment model demonstrated high robustness and reliability (Figure 6). From 2000 to 2015, sensitivity coefficients for total ESV and all four service categories (provisioning, regulating, supporting, and cultural) remained below 1, indicating low sensitivity to the equivalent value coefficient. During 2015–2020, however, the sensitivity indices for all services except provisioning exceeded 1, reflecting increased sensitivity to land use changes. Overall, the ESV coefficients throughout the study period remained relatively insensitive, which aligns with the actual conditions of the basin and corroborates the credibility of our accounting results.
Figure 6.
Sensitivity of ESV changes to land use changes in the Huaihe River Basin from 2000 to 2020.
Temporally, the sensitivity index for provisioning services rose steadily from 2000 to 2020, coinciding with the continuous expansion of construction land and substantial loss of cropland—the primary carrier of provisioning services. This replacement heightened the sensitivity of provisioning services to land use change. The sensitivity index for regulating services exhibited a fluctuating upward trend, peaking at 1.66 in 2015–2020, concurrent with the sharp reduction in forest land and water areas, with key supporting land types for regulating services, during the same period. The sensitivity index for supporting services gradually increased from 0.01 (2000–2005) to 0.96 (2000–2020), as grassland, an important foundation for supporting services, declined continuously across all stages, progressively amplifying sensitivity. The cultural services sensitivity index reached 2.34 in 2015–2020 and fluctuated throughout the study period, showing no clear direct correlation with any single land use type; rather, its variation reflected the integrated effects of comprehensive land use changes on perception and response patterns.
4.3. Landscape Pattern Drivers of ESV
4.3.1. Correlation Between Ecosystem Service Value and Landscape-Level Indices
From 2000 to 2020, ESV showed statistically significant and ecologically meaningful correlations with landscape-level indices in the Huaihe River Basin (Figure 7). Over the study period, NP and LSI exhibited extremely significant positive correlations with total ESV and all four service categories (provisioning, regulating, supporting, and cultural), with correlation coefficients exceeding 0.44. This indicates that higher patch number and more irregular patch shapes positively influenced ESV improvements. PD showed a significant but weak negative correlation only with provisioning service value in 2000. CONTAG was significantly positively correlated with provisioning (0.23) and supporting (0.16) service values. SHDI displayed an extremely significant positive correlation with cultural services and significant positive correlations with total ESV, regulating, and supporting services at the 0.05 level, suggesting that greater landscape diversity enhanced the values of these services. SHEI was significantly negatively correlated with provisioning service value, while its correlations with total ESV and regulating, supporting, and cultural services were not significant, indicating differential effects of landscape evenness on distinct service categories.
Figure 7.
Correlations between ESV and landscape-level indices in the Huaihe River Basin. Note: TVES: total value of ecosystem services; SYSV: supply service value; RSV: regulating service value; STSV: support service value; CSV: cultural service value; * p < 0.05; ** p < 0.01; *** p < 0.001.
4.3.2. Correlation Between ESV and Landscape Class-Level Indices
As shown in Figure 8, the correlations between ESV and landscape indices exhibited minor temporal fluctuations. To further explore these relationships, we calculated the mean values of ESV and class-level landscape indices for each land use type and analyzed their correlations (Table 5). The results showed that correlation coefficients between ESV and CA exceeded 0.9 for all land use types. Specifically, cropland ESV was significantly positively correlated with CA (coefficient: 0.996), PLAND, NP, and LSI, but significantly negatively correlated with PD. For forest land, water areas, and grassland, ESV was significantly positively correlated with PLAND, NP, LSI, and CLUMPY, with CA again showing the strongest correlation among these types. In contrast, CLUMPY exhibited weak correlations with ESV for cropland and unused land, indicating that landscape shape complexity and fragmentation had only limited effects on the ecosystem service functions of these two types.
Figure 8.
Spatial correlation between CA of cropland, forest land, water areas and ESV in the Huaihe River Basin.
Table 5.
Correlation coefficients between ESV and landscape class indices for different land use types.
4.3.3. Regression of ESV on Landscape Class-Level Indices
To address multicollinearity, we calculated variance inflation factors (VIFs) for all 36 landscape class indices. After excluding NP, PLAND, LSI, and CLUMPY for construction land, the VIF values of the remaining 17 indices were all below 10, meeting the acceptable threshold. The stepwise regression results showed that the CA of all six land use types and the PD of unused land were the key determinants (R2 = 0.991, p < 0.001). Among these seven significant indices, CA for cropland, forest land, and water areas had the largest positive coefficients, confirming CA as the dominant factor influencing ESV (Table 6).
Table 6.
Correlation between ecosystem service value and landscape indices.
To further examine the effect of class area (CA) on ESV, we conducted a linear regression using CA of forest land, cropland, and water areas as predictors and ESV as the response variable (Table 7). The model was statistically significant (R2 = 0.978, p < 0.001), yielding coefficients of 0.922, 0.396, and 0.289 for forest land, cropland, and water areas, respectively. These results indicate significant positive effects of CA on ESV, with forest land exerting the most pronounced influence, underscoring the importance and heterogeneity of area changes across different land use types in shaping ESV.
Table 7.
Regression analysis of landscape indices and ecosystem service value.
4.3.4. Landscape Drivers of Spatial Heterogeneity in Land Use ESV
To assess the spatial autocorrelation of ESV in the Huaihe River Basin, verify the precondition of spatial heterogeneity, and justify the use of the GWR model, we examined the temporal variation of Moran’s I index from 2000 to 2020. The results showed that ESV exhibited significant spatial autocorrelation throughout the study period, with a highly significant agglomeration pattern.
Using 2000 as the baseline, the GWR model revealed a generally significant positive correlation between ESV and the CA of forest land, cropland, and water areas across most counties and cities, although negative correlations gradually emerged over time (Figure 8). For forest land CA, positive correlations were widely distributed across the basin, while negative values were mainly concentrated around the Ying River and Xinyi River, with low positive outliers surrounding these areas. Negative coefficients for cropland CA were sparse, occurring only in Lianshui County and the municipal districts of Huai’an City; low positive outliers were concentrated in the middle reaches and parts of the lower reaches, whereas the remaining positive values formed a contiguous belt covering peripheral regions, including the Dabie Tongbai Mountains, the mountainous and hilly areas of southwestern Henan, the Jianghuai Hills, the lower reach plains, and the southern Yimeng Mountains. For water area CA, high positive outliers were concentrated in the lower reaches of the basin, while negative values were mainly distributed in Zhumadian City, Lianyungang City, and their surroundings.
Throughout the study period, the negative effects of forest, cropland, and water area CA on ESV exhibited both spatial similarity and heterogeneity (Figure 9). The significant negative effects of all three types converged in Lianshui County. The negative effects of forest land and water areas overlapped across eight contiguous county-level units, including Guanyun County, Xiangshui County, and Taihe County, forming a spatially continuous distribution, whereas cropland and water areas shared only one overlapping unit, namely the urban districts of Huai’an City. Spatial heterogeneity was primarily reflected in the distributions of negative effects for forest and water areas, with water areas showing the most prominent heterogeneity: water areas accounted for 16 non-overlapping county-level units, such as Cao County, Qi County, and Taikang County, whereas forest land involved only five county-level units, including Xinyi County, Ganyu County, and Donghai County.
Figure 9.
Spatial negative correlation between CA of cropland, forest land, water areas and ESV in the Huaihe River Basin: CA_2 denotes forest land; CA_4 denotes water areas; CA_14 denotes the overlapping units of cropland and water areas; CA_24 denotes the overlapping units of forest land and water areas; CA_124 denotes the overlapping units of the three.
5. Discussion
5.1. ESV Responses to Land Use Dynamics
The responses of ESV to land use change in the Huaihe River Basin exhibit pronounced phase-dependent characteristics, marked by alternating periods of ecological improvement and degradation (Figure 5; Table 4), a pattern typical of land use transitions in major grain-producing basins [52,53]. Early ecological initiatives, including river regulation and cropland-to-lake restoration, temporarily elevated ESV, with expanded water areas driving much of the gain (+42.318 billion CNY during 2000–2005; Figure 5), consistent with restoration outcomes observed in other Chinese plain river lake basins [4]. Unlike basins under sustained restoration programs, however, the Huaihe River Basin has not maintained long-term ecological gains. Intensified agricultural encroachment and urban expansion have driven reverse conversions among ecological land, cropland, and construction land, with degradation-oriented contribution rates rising from 35.18% (2000–2005) to 67.57% (2015–2020) (Table 4), undermining the benefits of early restoration efforts. This conflict echoes findings from the Huang Huai region, where basins balancing grain production and urban growth struggle to sustain ecological improvement [54].
A critical but underexplored issue is the temporal mismatch between land use transition intensity and ecological sensitivity underlying ESV responses. The basin’s ecosystem has shifted from a stable buffering state to abrupt destabilization, exhibiting cumulative lag effects and threshold behavior [55]. From the perspective of ecosystem evolution mechanisms, persistent land use disturbance fragments ecological land and erodes ecosystem resilience. Once cumulative losses exceed the carrying capacity threshold, ecological sensitivity rises sharply, as evidenced by the sensitivity indices for regulating and cultural services exceeding 1 during 2015–2020 (Figure 6), such that even minor disturbances can trigger drastic ESV declines, a threshold shift consistent with theoretical and empirical findings on watershed ecosystem degradation [56]. Notably, fluctuations in cultural service values are decoupled from changes in individual land use types, suggesting a shift from localized land type alteration to systemic functional deterioration. The spatial heterogeneity of the impacts of landscape patterns on ESV is not solely caused by land use changes but results from the combined regulation of regional natural conditions and human activities [57]. The Huaihe River Basin exhibits significant spatial variations in hydrological, topographic, and soil conditions. Differences in ecological background conditions and ecosystem service provision capacity between the southwestern hilly region and the middle–lower reaches of the plain region enhance the regional differences in ESV responses to landscape pattern changes [1,18]. Meanwhile, regional differences in urbanization intensity, agricultural intensification level, and land management practices alter the degree of landscape fragmentation and ecological spatial configuration, thereby further regulating the relationship between landscape patterns and ESV and resulting in the spatially non-stationary characteristics of GWR model coefficients [58].
While short-term artificial interventions can raise local ESV, they fail to resolve structural land use conflicts [59]. Therefore, watershed ecological management should move beyond standalone projects toward spatial optimization that explicitly addresses trade-offs among ecological conservation, agricultural cultivation, and urban construction. Rationalizing the ecological–agricultural–urban spatial configuration is essential for securing the long-term stability of basin ecosystem services.
5.2. Landscape Pattern Exerts Dominant Control over ESV Changes in the Huaihe River Basin
At the landscape level, patch number (NP) and landscape shape index (LSI) exhibited highly significant positive correlations with total ESV and its four subcategories throughout the study period (correlation coefficients > 0.44; Figure 7), indicating that moderate landscape heterogeneity and land use type combinations may have positive effects on certain ecosystem services; however, these effects depend on land use types, spatial scales, and the intensity of human disturbances. When fragmentation is primarily driven by anthropogenic activities, such as construction land expansion, it may weaken ecosystem functions by reducing ecological connectivity and increasing edge effects [60,61]. Moderate fragmentation expands landscape boundaries and facilitates material and energy exchange. This contrasts with Xiong et al., who reported that severe fragmentation reduces water yield, carbon sequestration, and soil conservation, suggesting that fragmentation in the Huaihe Basin has not yet exceeded critical ecological thresholds [62,63]. The dominance of cropland and forest in the regional matrix likely buffers the adverse effects of fragmentation.
At the class level, class area (CA) emerged as the primary driver of ESV variation (correlation coefficients > 0.9 for all land use types; Table 5). CA of cropland, forest, and water areas showed significant positive correlations with ESV, with forest land exerting the strongest effect—consistent with the multifunctional value theory of forest ecosystems [44]. Regional comparisons reveal divergent contributions of landscape types due to differing natural backgrounds. In the densely river-networked Yangtze River Delta, water area dominates ESV growth [64], whereas in the Huaihe Basin, mountainous terrain makes forest the leading driver. Studies on Poyang Lake riparian zones further confirm that shrinking water areas commonly trigger service declines in freshwater basins [59]. Thus, while patch area exerts positive control over ESV across watersheds, the magnitude of its contribution depends heavily on local natural conditions.
The driving effects of land use CA on ESV exhibited pronounced spatial heterogeneity. Positive cropland CA–ESV coupling concentrated in the Dabie–Tongbai Mountains and the rolling hills of southwestern Henan, where mountain terraces retain water and soil via field ridges, enhancing regulating services, and large-scale croplands distant from urban disturbances sustain food production. In contrast, in urban cores such as Huai’an, unregulated construction land encroaches on high-quality cropland, and fragmented patches with weakened connectivity reduce ESV despite expanded cropland area. Positive forest CA–ESV correlations covered most of the basin, supporting the view that forest expansion improves ecosystem services [59]. However, local negative correlations along the Ying and Xinyi rivers (Figure 8) indicate that intense human activities have fragmented native forests into isolated patches, where marginal carbon sink gains fail to offset the losses in water conservation and habitat maintenance—corroborating the regional consensus that fragmentation elevates ecological risks [65].
Contiguous negative waterbody CA–ESV correlations occurred around Hongze Lake, Gaoyou Lake, coastal zones, and scattered ponds in Zhumadian. Mismanagement and pollution in large lakes disrupt the inherent positive service trends of natural waters, contrasting with the positive synergy reported for undisturbed aquatic systems [58]. Coastal wetland degradation, reclamation, and seawater intrusion further impair coastal functions, while disconnected small ponds in Zhumadian fail to deliver full ecological benefits. Notably, Lianshui County was the only area where CA of cropland, forest, and water areas all correlated negatively with ESV—a pattern attributable to imbalanced landscape configuration, excessive human disturbance, and fragile natural ecosystems. Targeted landscape regulation should aim to curb cropland fragmentation, enhance forest connectivity, and link scattered small water areas. These measures would improve local ecological conditions and provide empirical support for differentiated ecological restoration and territorial spatial governance in the Huaihe River Basin.
5.3. Policy Implications for Land-Use-Change-Sensitive Zones
In this study, ecological engineering refers to spatially targeted ecological-restoration and landscape-management measures, including riparian buffer establishment, wetland and water-corridor restoration, enhancement of forest connectivity, and retention or reconfiguration of ecological cropland buffers. Large-scale contiguous expansion of any single land type—whether forest, cropland, or water body—compresses heterogeneous ecological spaces, reduces landscape interspersion, and weakens multiple synergistic ecosystem services, including water retention, soil conservation, and agricultural non-point pollution interception. This creates trade-offs between land aggregation and ecosystem service provision [62,66]. Therefore, hierarchical, differentiated restoration strategies should be formulated according to the intrinsic structure of landscape patches.
In forest-dominated counties such as Xinyi, Ganyu, and Donghai, excessive forest land aggregation has compressed cultivated land. Management should focus on curbing further forest sprawl, retaining fragmented ecological croplands, and prohibiting large continuous artificial forest stands. In water-dominated counties such as Cao County, Qi County, and Taikang County, riparian forest grass buffer zones are lacking; comprehensive conversion of riparian croplands to forests is required, with scattered small cropland patches interspersed to form aquatic–terrestrial ecotones [67]. In the Huai’an urban district, where mixed cropland–water patches occur without forest coverage, the risk of non-point source pollution is the highest in the basin. Continuous croplands along rivers and lakes should be cleared, and shelterbelts planted along water corridors [68]. In counties co-dominated by forests and water areas, such as Guanyun, Xiangshui, and Taihe, grain productivity is insufficient; large-scale cropland conversion is inappropriate, and moderate ecological buffer croplands should be arranged to balance conservation and food security. Lianshui County exhibits highly interwoven distributions and strong aggregation of three major land-use types, with prominent conflicts between human activities and land resources. For this region, continuous expansion of a single land use type should be avoided to prevent restrictions on ecological spaces. Instead, dynamic optimization should be implemented based on different patch combination characteristics to improve the coordination between production spaces and ecological spaces [69]. Uniform cropland-to-forest conversion plans cannot satisfy watershed ecological restoration demands; instead, precise management zones should be delineated based on patch composition to mitigate the decline of ESV driven by rising land aggregation [56,69].
From a watershed-geographic perspective, forest patches are mainly distributed in upstream mountainous areas (Figure 8), which serve as core providers of water retention services. However, local implementation of cropland-to-forest conversion faces practical barriers, including restricted household livelihoods and suppressed regional industries. In midstream alluvial plains, abundant water areas and mixed cropland–water patches form key grain production zones, where riparian cropland conversion may destabilize regional grain output [54]. Downstream counties such as Lianshui feature interlaced three-type land patches, where conflicting goals of wetland restoration, cropland protection, and forest management cannot be reconciled through standalone administrative regulation. A severe spatial mismatch exists between basin-wide ecological protection costs and ecological benefits: upstream regions bear restrictive conservation costs, while midstream and downstream areas continuously obtain ecological dividends. Vertical fiscal transfers alone cannot resolve long-term zonal governance dilemmas.
Establishing a cross regional two-way ecological compensation system based on patch differentiation is the core solution [55], as proposed in Table 8. Forest-dominated upstream counties implementing cropland-to-forest conversion—such as Xinyi, Ganyu, and Donghai—should serve as ecological supply zones, regularly receiving horizontal ecological compensation fees from midstream and downstream urban and grain-producing regions. These funds can offset economic losses caused by ecological restrictions and reduce farmers’ willingness to reclaim restored forest lands. Midstream cropland–water-dominant regions, including Cao County and the Huai’an urban district, should be defined as ecological loss zones, obligated to pay ecological compensation alongside green cropland subsidies to incentivize voluntary riparian cropland conversion among farmers [70]. Downstream conflict intensive counties such as Lianshui should coordinate basin-wide compensation funds for integrated wetland restoration, with revenues from ecological planting breeding and carbon sink industries supporting forest maintenance in upstream zones and ecological cropland renovation in midstream zones [58]. This closed-loop benefit distribution system—upstream regions gain compensation for conservation, midstream regions pay for pollution control, and downstream regions coordinate comprehensive restoration—alleviates barriers to land conversion and jointly achieves long-term optimization of watershed landscape patterns and food security [63].
Table 8.
Differentiated regulation and two-way ecological compensation of forest–cropland–water patches with negative CA-ESV correlation in the Huaihe River Basin.
5.4. Limitations and Uncertainties
This study elucidates the mechanisms linking land use changes to ESV dynamics in the Huaihe River Basin and reveals core evolutionary patterns. However, four limitations require attention in future research: (1) Expansion of influencing factors. The current analysis primarily addresses the direct effects of land use and landscape patterns on ESV, without systematically incorporating multidimensional human drivers including policy interventions, economic incentives, and social demands, which hinders a comprehensive understanding of the underlying causes of ESV variation. Future work should develop a multi-factor coupling framework and quantify the relative contribution weights of diverse driving forces. (2) Data constraints and temporal coverage. The land use dataset spans only 2000–2020, insufficient to capture landscape evolution over a longer (e.g., >30 year) timescale. Moreover, auxiliary data from field monitoring, such as soil carbon sequestration and water purification, have not been fully integrated, and the heavy reliance on remote sensing inversion and model estimation may reduce the micro-scale accuracy of ESV assessments. Integration of multi-source observational data is thus needed to improve robustness. (3) Methodological adaptability and regional generalizability. The ESV assessment framework emphasizes static value accounting, with limited exploration of dynamic service trade-offs. Furthermore, the absence of comparative analyses with similar basins, particularly given the Huaihe River Basin’s transitional climate position between northern and southern China, limits the verification of the universality and regional heterogeneity of our findings. Future research should therefore expand the scope of influencing factors, enhance data support, and deepen methodological applications alongside cross regional comparisons, thereby providing more broadly applicable references for ecological conservation and sustainable development in analogous regions. (4) The GWR model only identifies the spatial correlation between landscape metrics and ecosystem service values and does not represent strict causal relationships. Future studies should further explore the underlying causal mechanisms by integrating controlled experiments and process-based mechanistic models. Construction land was assigned a zero ESV coefficient in this study, reflecting its negligible direct ecosystem service provision rather than active ecological harm. Consequently, the negative externalities of construction land expansion—such as habitat fragmentation, pollution emissions, and heat island effects—were not incorporated into the ESV assessment. Future research should integrate these ecological costs to more comprehensively evaluate the environmental impacts of urbanization.
6. Conclusions
Amid rapid urbanization, coordinating economic growth with ecological conservation is critical for the Huaihe River Basin, in line with the “lucid waters and lush mountains” philosophy. This study addresses the gap between basin-scale ESV accounting and the spatially explicit interpretation of landscape configuration. The integrated framework developed in this study, linking land use change, landscape patterns, and the spatial differentiation of ecosystem service value (ESV), provides an application-oriented analytical pathway for watershed-scale ecosystem service assessment and spatial planning. By integrating land use transition analysis, landscape pattern evaluation, ESV assessment, and spatial heterogeneity analysis, this framework can identify spatial associations between landscape structure changes and ecosystem service responses, providing a reference for similar regions experiencing rapid land-use changes and ecological management challenges. In the future, this framework can be further extended to multi-scale ecological planning and sustainable land management by incorporating regional ecological characteristics and management objectives.
Our results confirm that land use patterns were characterized by rapid expansion of construction land (+13,345.37 km2), substantial cropland loss (−14,237.30 km2), and escalating ecological pressure. Nearly 10% of the basin’s area underwent type conversion, with landscape patterns exhibiting marked spatial heterogeneity. Total ESV first increased and then decreased, showing an overall net decline, with forest land and water areas as primary contributors. ESV was significantly correlated with landscape-level indices, while class-level indices—particularly class area (CA)—demonstrated stronger explanatory power. Notably, CA of forest land, cropland, and water areas exhibited significant spatial heterogeneity in their correlations with ESV. Considering the differences in landscape patterns and ecosystem service responses among different counties, refined zoning management strategies should be implemented. For forest areas with significant negative associations between CA and ESV (e.g., Xinyi County, Ganyu County, and Donghai County), ecological space protection should be strengthened to prevent further forest fragmentation. For areas where negative responses of water areas are concentrated (e.g., Cao County, Qi County, and Taikang County), river and lake spatial management and aquatic ecosystem restoration should be enhanced. For areas with combined impacts of forest land, water areas, and cultivated land (e.g., Huai’an urban districts, Guanyun County, Xiangshui County, and Lianshui County), ecological restoration, cultivated land protection, and land use optimization should be coordinated. Meanwhile, differentiated ecological compensation mechanisms should be explored to achieve coordinated development between ecological conservation and grain production. Here, ecological engineering denotes targeted restoration and landscape-management measures tailored to patch structure, rather than uniform cropland conversion.
These findings highlight an imbalance between short-term ecological improvement and long-term degradation in ESV responses. Once cumulative ecological losses exceed the ecosystem’s buffering capacity, ESV sensitivity rises sharply. Landscape pattern emerged as the core driver of ESV changes, indicating that optimizing land use patterns and improving landscape quality can maximize ecological benefits. Encompassing both key ecological functional zones and cropland-dominated areas, the basin faces conflicting demands for ecological protection, economic development, and livelihood security. By implementing zoned cropland-to-forest conversion—targeting upstream functional zones, midstream grain-producing areas, and downstream conflict zones—coupled with a two-way ecological compensation mechanism, these conflicts can be reconciled. Overall, coordinating economic development and ecological conservation is the core objective of land use planning and ecosystem management in the Huaihe River Basin. This approach provides scientific support for integrated governance of ecological conservation and food security in the Huaihe River Basin and analogous agricultural watersheds.
Author Contributions
Y.Y.: writing—original draft, visualization, methodology, formal analysis, data curation, project administration. L.L.: writing—review, validation, methodology, investigation, conceptualization. Q.Z.: validation, supervision, writing—review, formal analysis. X.Q.: writing—review and editing, validation, supervision, project administration. H.Z.: validation, methodology. Y.G.: data curation, supervision. All authors have read and agreed to the published version of the manuscript.
Funding
The research was funded by Henan Provincial Soft Science Research Program Project (Grant No. 252400411153), Observation and Research Station of Land Ecology and Land Use in the Grain-Producing Area of Central China, Ministry of Natural Resources (No. ORS202606), and the National Key Natural Science Foundation of China (Grant No. 41971274).
Data Availability Statement
The original contributions presented in the study are included in the article. Further inquiries can be directed to the corresponding author.
Acknowledgments
The authors appreciate the editor and reviewers for their careful and insightful feedback.
Conflicts of Interest
The authors declare no conflicts of interest.
Appendix A
Landscape metrics can quantitatively characterize landscape composition, spatial configuration, and ecological process characteristics, and they are important tools for revealing the relationship between land use changes and ecosystem services. Based on the theoretical framework of pattern–process–service [32,33], and referring to relevant studies in landscape ecology worldwide, this study established a landscape pattern evaluation system at both the landscape type level and landscape level. The selection followed the principles of clear ecological significance, strong indicator representativeness, and low information redundancy. In addition, the landscape characteristics of the Huaihe River Basin, including concentrated distribution of cultivated land and the interweaving of agricultural landscapes and urban–rural construction land, were considered [19].
At the landscape type level, patch class area (CA), percentage of landscape (PLAND), number of patches (NP), patch density (PD), and landscape shape index (LSI) were selected to characterize the area composition, fragmentation degree, and patch shape characteristics of different land use types [71]. At the landscape level, number of patches (NP), patch density (PD), landscape shape index (LSI), contagion index (CONTAG), Shannon’s diversity index (SHDI), and Shannon’s evenness index (SHEI) were selected to reflect the overall landscape structure, aggregation characteristics, and landscape heterogeneity [72]. Considering that some landscape metrics may contain redundant information, the perimeter-area fractal dimension (PAFRAC) and aggregation index (AI) were not selected in this study.
The final landscape metric system ensures indicator independence while comprehensively characterizing the landscape pattern characteristics of the Huaihe River Basin. It provides a scientific basis for analyzing the impacts of landscape patterns on the spatial differentiation of ecosystem service values [73].
Table A1.
Moran’s I parameters of ecosystem service value in the Huaihe River Basin from 2000 to 2020.
Figure A1.
Spatial distribution of individual ecosystem service values (ESVs).
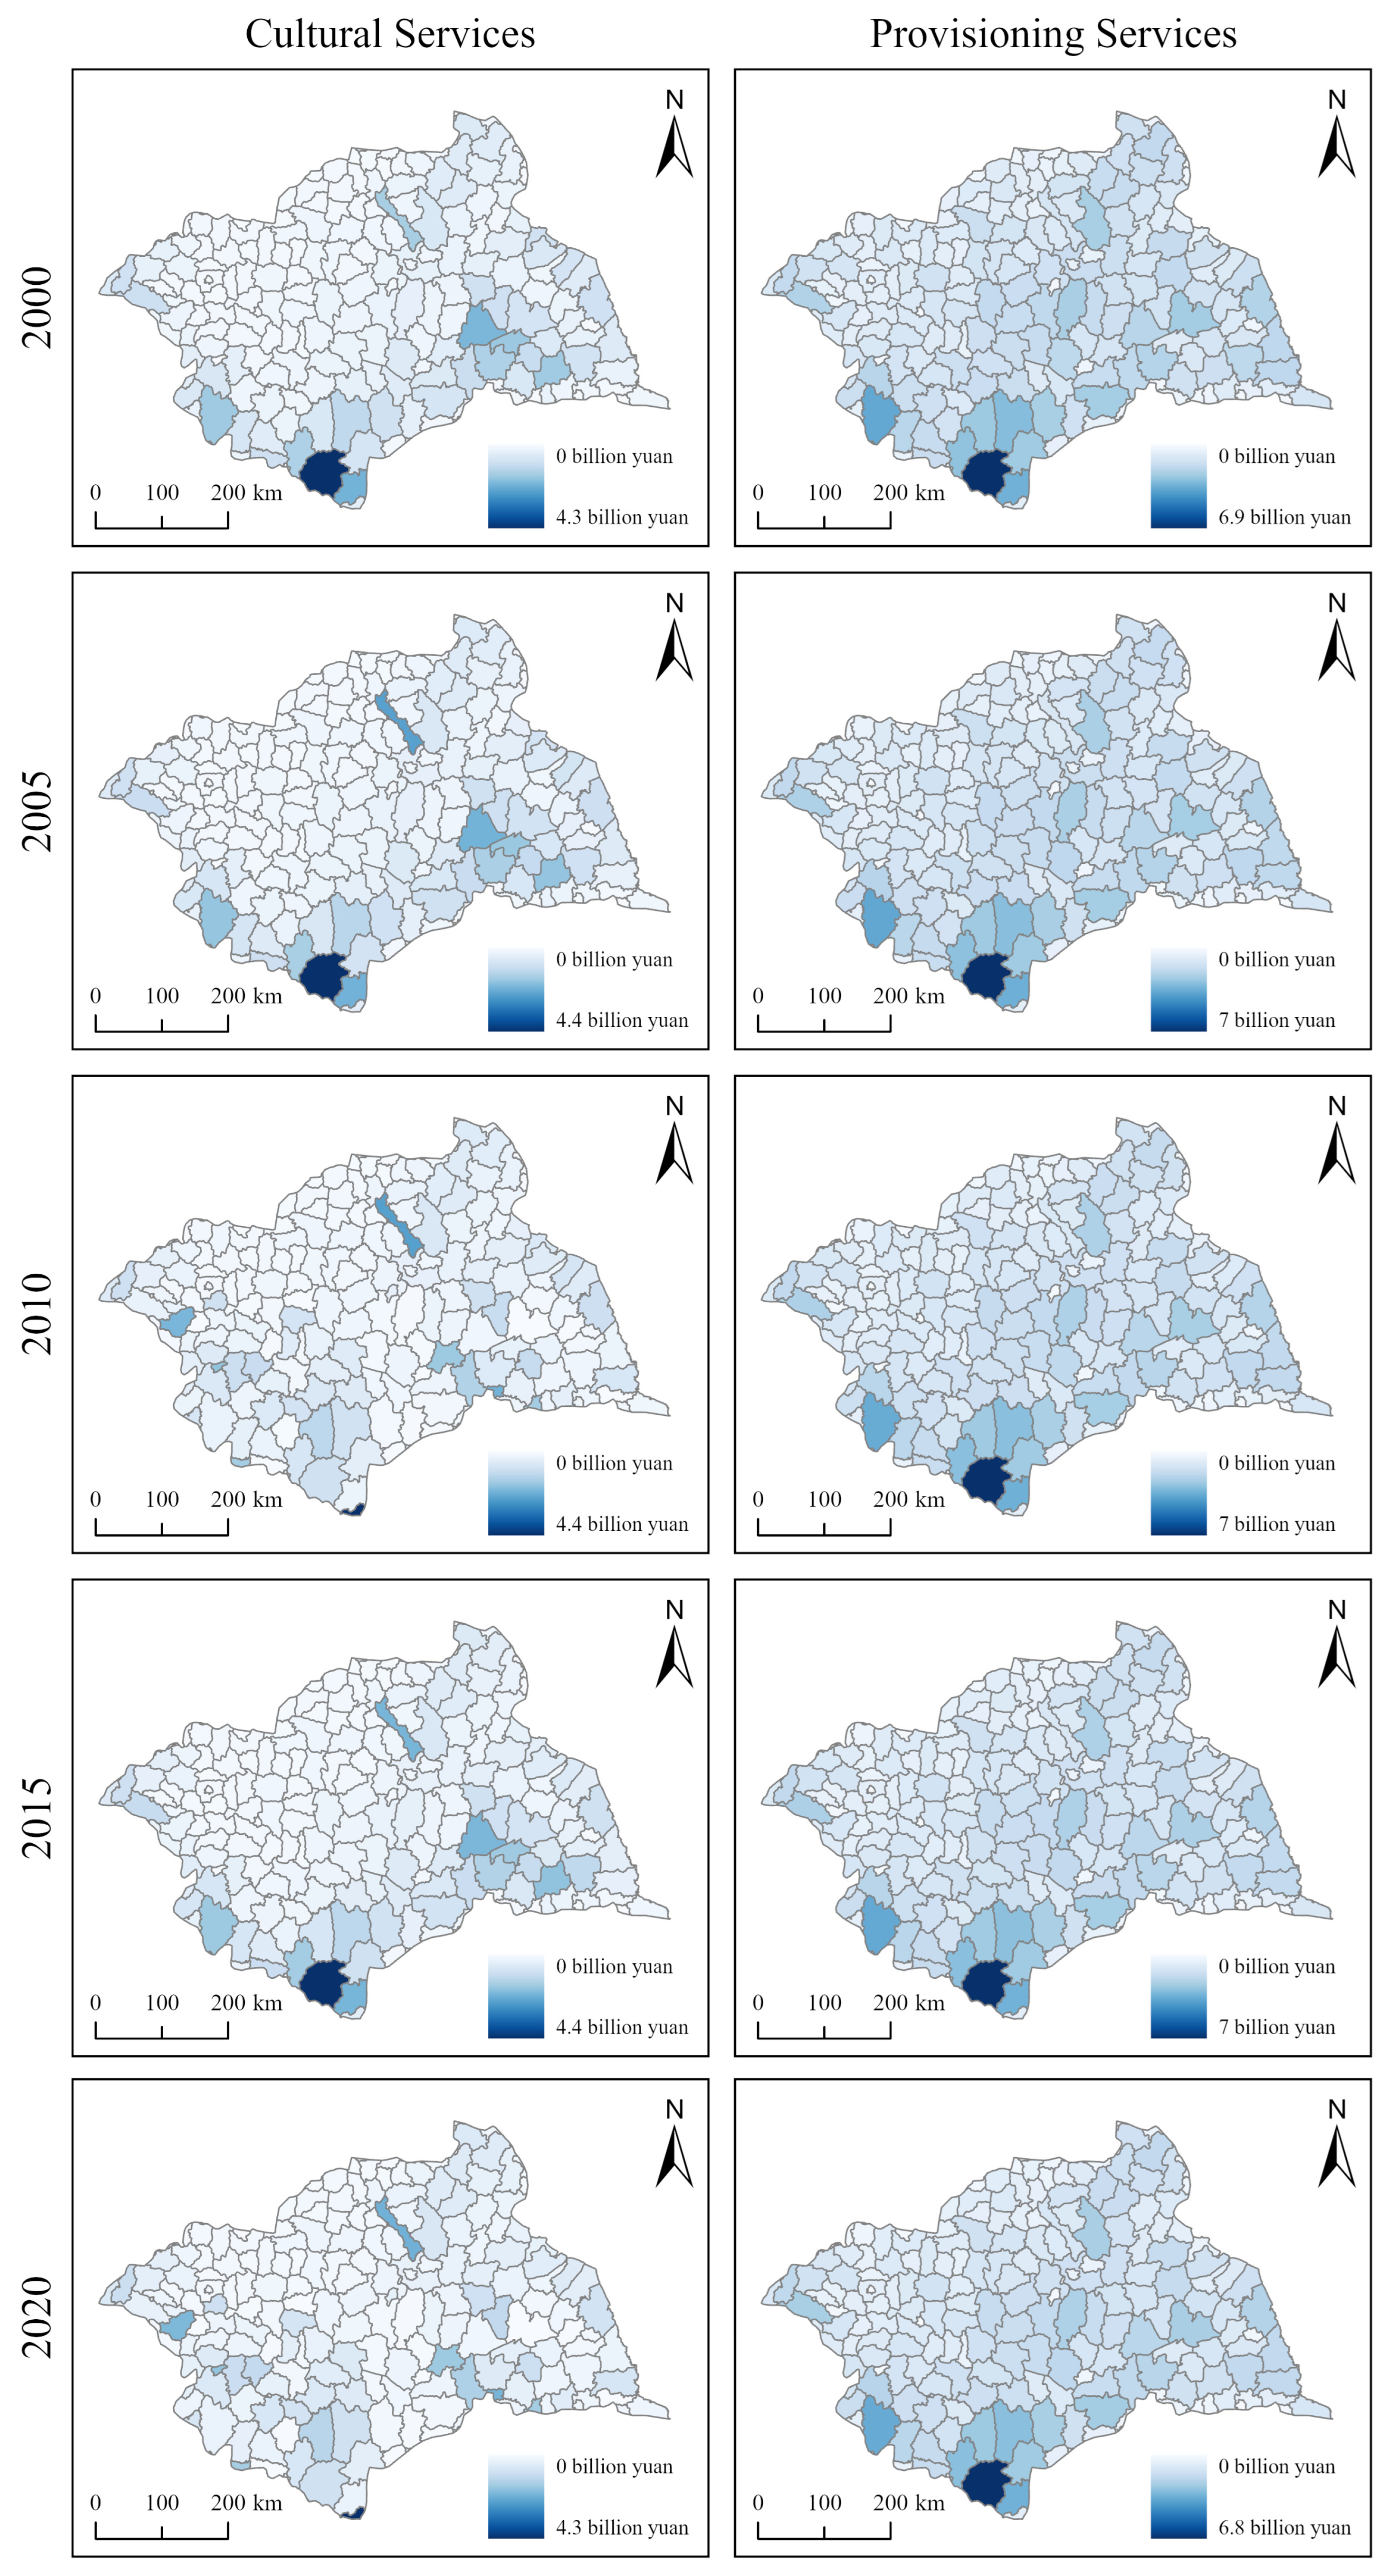
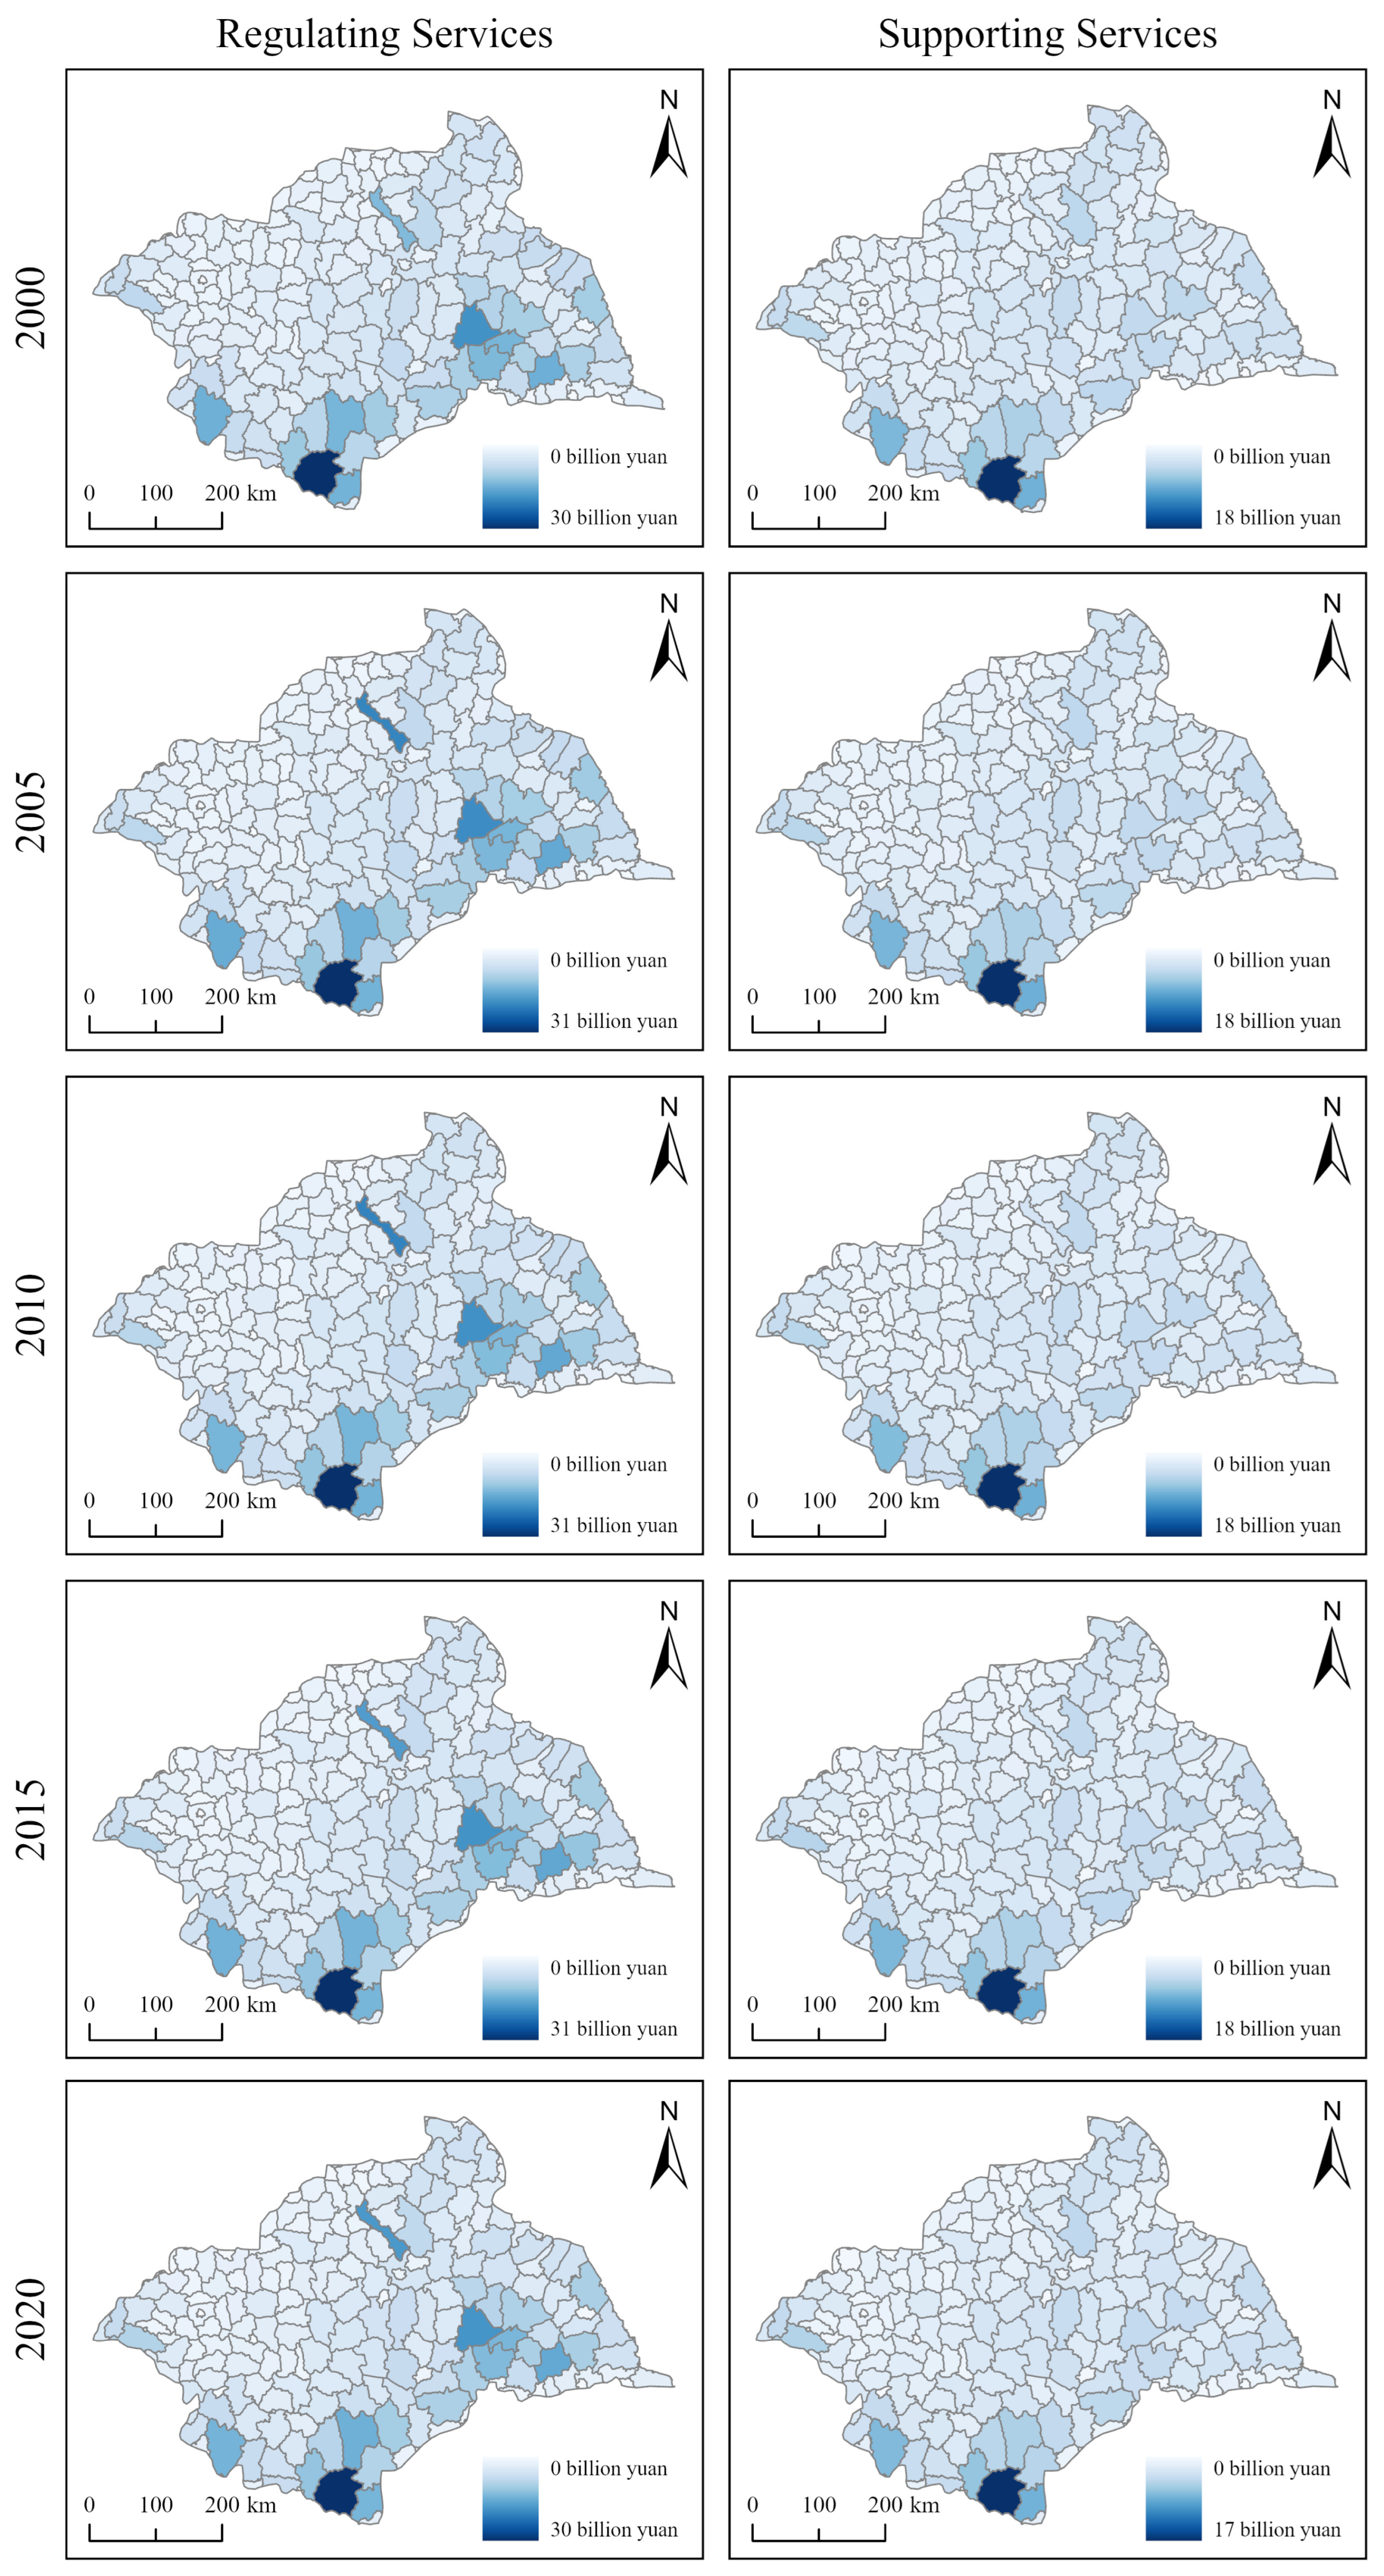
Figure A2.
Theoretical framework.
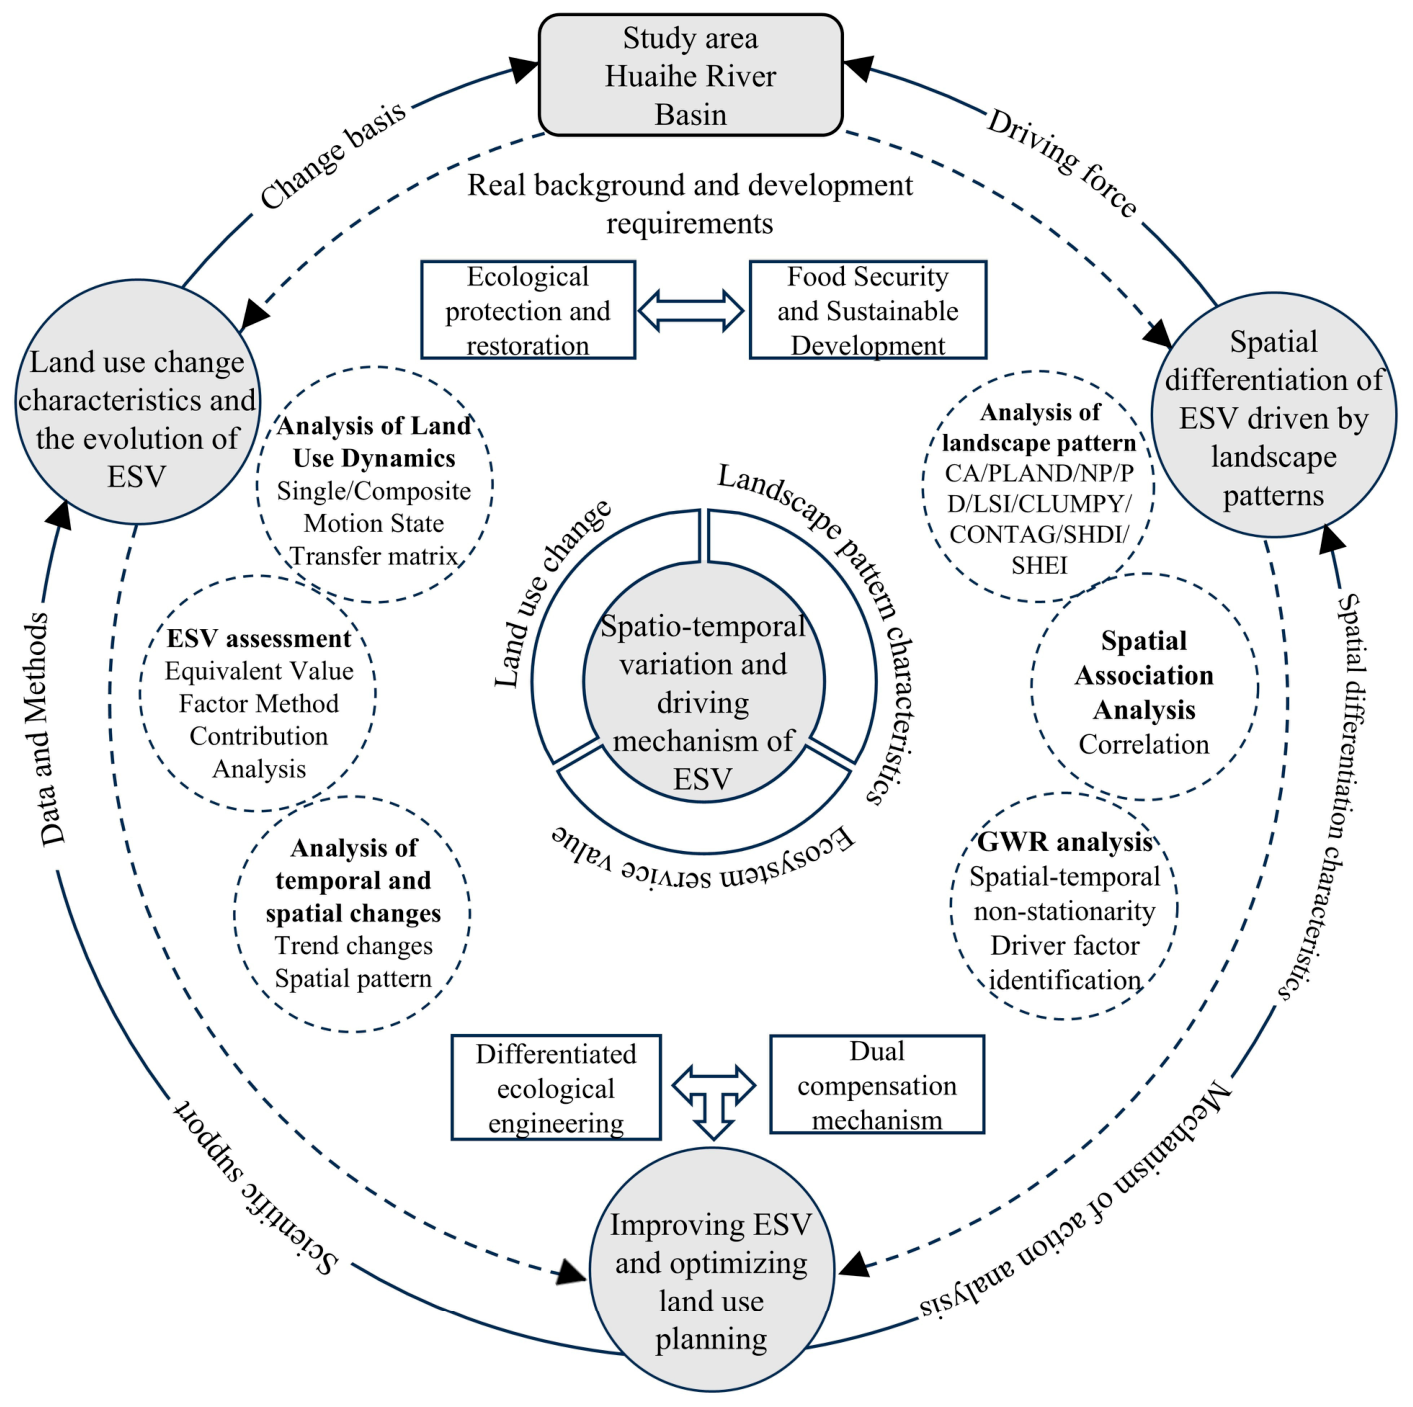
Table A2.
Table of ecosystem service value equivalent factors.
Table A3.
Key diagnostic metrics (GWR).
Table A4.
Summary of abbreviations and their full names used in this study.
References
- Yang, X.; Qian, B.; Ji, G.; Chen, W.; Huang, J.; Guo, Y.; Chen, Y. Characteristics of spatial and temporal changes in carbon stocks in the middle and upper reaches of the Huaihe River basin and future multi-scenario simulation prediction. Environ. Sci. 2024, 45, 5970–5982. [Google Scholar] [CrossRef] [Scilit] [PubMed]
- Jiang, W.; Xu, Y.; Li, D.; Bi, S.; Li, Q.; Lu, L. Process and correlation between ecosystem services value and ecological risk in river basin-a case study at Huaihe River basin in Anhui province. Bull. Soil Water Conserv. 2022, 42, 121–128. [Google Scholar] [CrossRef]
- Yu, Z.; Xu, Q.; Wei, J.; Hu, S.; Li, A.; Xie, X.; Song, Y. 70 years’ governance process of Huaihe River and the prospect of the 14th five-year plan period. Environ. Eng. 2020, 10, 5–12. [Google Scholar] [CrossRef]
- Long, X.; Lin, H.; An, X.; Chen, S.; Qi, S.; Zhang, M. Evaluation and analysis of ecosystem service value based on land use/cover change in Dongting Lake wetland. Ecol. Indic. 2022, 136, 108619. [Google Scholar] [CrossRef] [Scilit]
- Costanza, R.; D’Arge, R.; de Groot, R.; Farber, S.; Grasso, M.; Hannon, B.; Limburg, K.; Naeem, S.; O’Neill, R.V.; Paruelo, J.; et al. The value of the world’s ecosystem services and natural capital. Nature 1997, 387, 253–260. [Google Scholar] [CrossRef] [Scilit]
- Kremen, C. Managing ecosystem services: What do we need to know about their ecology? Ecol. Lett. 2005, 8, 468–479. [Google Scholar] [CrossRef] [Scilit] [PubMed]
- Zheng, Q.; Qiao, X.; Yang, Y.; Zhao, T.; Li, H.; Zhou, H.; Gao, H. Drivers and dominant pathways for ecosystem service trade-offs in the Luo River basin at the local optimal scale. J. Environ. Manag. 2026, 398, 128551. [Google Scholar] [CrossRef] [Scilit]
- Costanza, R.; de Groot, R.; Sutton, P.; van der Ploeg, S.; Anderson, S.J.; Kubiszewski, I.; Farber, S.; Turner, R.K. Changes in the global value of ecosystem services. Glob. Environ. Change 2014, 26, 152–158. [Google Scholar] [CrossRef] [Scilit]
- Zhang, P.; He, L.; Fan, X.; Huo, P.; Liu, Y.; Zhang, T.; Pan, Y.; Yu, Z. Ecosystem service value assessment and contribution factor analysis of land use change in Miyun county, China. Sustainability 2015, 7, 7333–7356. [Google Scholar] [CrossRef] [Scilit]
- García-Nieto, A.P.; Geijzendorffer, I.R.; Baró, F.; Roche, P.K.; Bondeau, A.; Cramer, W. Impacts of urbanization around Mediterranean cities: Changes in ecosystem service supply. Ecol. Indic. 2018, 91, 589–606. [Google Scholar] [CrossRef] [Scilit]
- Mitchell, M.G.E.; Suarez-Castro, A.F.; Martinez-Harms, M.; Maron, M.; McAlpine, C.; Gaston, K.J.; Johansen, K.; Rhodes, J.R. Reframing landscape fragmentation’s effects on ecosystem services. Trends Ecol. Evol. 2015, 30, 190–198. [Google Scholar] [CrossRef] [Scilit] [PubMed]
- Assefa, W.W.; Eneyew, B.G.; Wondie, A. The impacts of land-use and land-cover change on wetland ecosystem service values in peri-urban and urban area of Bahir Dar city, upper Blue Nile basin, northwestern Ethiopia. Ecol. Process. 2021, 10, 1. [Google Scholar] [CrossRef] [Scilit]
- Li, J.; Xi, H.; Wang, F.; Ding, X.; Chen, X.; Tao, Y.; Huang, C.; Tao, Q.; Cheng, X.; Ou, W. Non-linear responses of ecosystem service trade-offs to landscape heterogeneity: Implications for spatially targeted landscape management in an urbanizing agricultural basin. Landsc. Urban Plan. 2026, 271, 105642. [Google Scholar] [CrossRef] [Scilit]
- Liu, S.; Wang, Z.; Wu, W.; Yu, L. Effects of landscape pattern change on ecosystem services and its interactions in karst cities: A case study of Guiyang city in China. Ecol. Indic. 2022, 145, 109646. [Google Scholar] [CrossRef] [Scilit]
- Dong, Y.; Liu, S.; Pei, X.; Wang, Y. Identifying critical landscape patterns for simultaneous provision of multiple ecosystem services—A case study in the central district of Wuhu city, China. Ecol. Indic. 2024, 158, 111380. [Google Scholar] [CrossRef] [Scilit]
- Zhao, Y.; Zhang, X.; Wu, Q.; Huang, J.; Ling, F.; Wang, L. Characteristics of spatial and temporal changes in ecosystem service value and threshold effect in Henan along the Yellow River, China. Ecol. Indic. 2024, 166, 112531. [Google Scholar] [CrossRef] [Scilit]
- Li, Y.; Zeng, C.; Liu, Z.; Cai, B.; Zhang, Y. Integrating landscape pattern into characterising and optimising ecosystem services for regional sustainable development. Land 2022, 11, 140. [Google Scholar] [CrossRef] [Scilit]
- Qiao, X.; Yang, Z.; Yang, Y. Trade-off and synergy of ecosystem services and their scale effects in the Huaihe River basin from 1995 to 2020. Areal Res. Dev. 2023, 42, 150–154, 166. [Google Scholar] [CrossRef]
- Wei, Y.; Qiao, X.; Zhang, Z.; Yang, Y.; Niu, H. Trade-off and driving mechanisms for farmland ecosystem services based on climatic zones and agricultural regionalization. Trans. Chin. Soc. Agric. Eng. 2022, 38, 220–228. [Google Scholar] [CrossRef]
- King-Okumu, C. Valuing environmental benefit streams in the dryland ecosystems of sub-Saharan Africa. Land 2018, 7, 142. [Google Scholar] [CrossRef] [Scilit]
- Gashaw, T.; Tulu, T.; Argaw, M.; Worqlul, A.W.; Tolessa, T.; Kindu, M. Estimating the impacts of land use/land cover changes on ecosystem service values: The case of the Andassa watershed in the upper Blue Nile basin of Ethiopia. Ecosyst. Serv. 2018, 31, 219–228. [Google Scholar] [CrossRef] [Scilit]
- Xie, L.; Wang, H.; Liu, S. The ecosystem service values simulation and driving force analysis based on land use/land cover: A case study in inland rivers in arid areas of the Aksu River basin, China. Ecol. Indic. 2022, 138, 108828. [Google Scholar] [CrossRef] [Scilit]
- You, M.; Zou, Z.; Zhao, W.; Zhang, W.; Fu, C. Study on land use and landscape pattern change in the Huaihe River ecological and economic zone from 2000 to 2020. Heliyon 2023, 9, e13430. [Google Scholar] [CrossRef] [Scilit] [PubMed]
- Hao, L.; He, S.; Zhou, J.; Zhao, Q.; Lu, X. Prediction of the landscape pattern of the Yancheng coastal wetland, China, based on XGBoost and the MCE-CA-Markov model. Ecol. Indic. 2022, 145, 109735. [Google Scholar] [CrossRef] [Scilit]
- Yu, H.; Zhang, F.; Ma, H.; Lu, Y. Spatio-temporal evolution and driving factors of ecological environment quality in the Huaihe River basin based on RSEI. Environ. Sci. 2024, 45, 4112–4121. [Google Scholar] [CrossRef] [Scilit] [PubMed]
- Druckenmiller, H. Accounting for ecosystem service values in climate policy. Nat. Clim. Change 2022, 12, 596–598. [Google Scholar] [CrossRef] [Scilit]
- Mitchell, M.G.E.; Bennett, E.M.; Gonzalez, A. Linking landscape connectivity and ecosystem service provision: Current knowledge and research gaps. Ecosystems 2013, 16, 894–908. [Google Scholar] [CrossRef] [Scilit]
- Gao, X.; Zhao, M.; Zhang, M.; Guo, Z.; Liu, X.; Yuan, Z. Carbon conduction effect and multi-scenario carbon emission responses of land use patterns transfer: A case study of the Baiyangdian basin in China. Front. Environ. Sci. 2024, 12, 1374383. [Google Scholar] [CrossRef] [Scilit]
- Zhu, H.; Li, X. Discussion on the index method of regional land use change. Acta Geogr. Sin. 2003, 58, 643–650. [Google Scholar] [CrossRef]
- Liu, J. Study on national resources & environment survey and dynamic monitoring using remote sensing. J. Remote Sens. 1997, 1, 225–230. [Google Scholar] [CrossRef] [Scilit]
- Wang, F.; Gao, J.; Shao, H.; Zhang, T.; Zhang, Y.; Xu, X.; Zhao, C.H.; Wang, H.J. Response of ecosystem service values to land use change based on GIS and ecological compensation in Loess Plateau. Sci. Soil Water Conserv. 2013, 11, 25–31. [Google Scholar] [CrossRef]
- Ma, X.; Peng, S. Research on the spatiotemporal coupling relationships between land use/land cover compositions or patterns and the surface urban heat island effect. Environ. Sci. Pollut. Res. 2022, 29, 39723–39742. [Google Scholar] [CrossRef] [Scilit] [PubMed]
- Csikos, N.; Schwanebeck, M.; Kuhwald, M.; Szilassi, P.; Duttmann, R. Density of biogas power plants as an indicator of bioenergy-generated transformation of agricultural landscapes. Sustainability 2019, 11, 2500. [Google Scholar] [CrossRef] [Scilit]
- Legarreta-Miranda, C.K.; Prieto-Amparán, J.A.; Villarreal-Guerrero, F.; Morales-Nieto, C.R.; Pinedo-Alvarez, A. Long-term land-use/land-cover change increased the landscape heterogeneity of a fragmented temperate forest in Mexico. Forests 2021, 12, 1099. [Google Scholar] [CrossRef] [Scilit]
- Wei, C.; Zhang, Z.; Wang, Z.; Cao, L.; Wei, Y.; Zhang, X.; Zhao, R.; Xiao, L.; Wu, Q. Response of variation of water and sediment to landscape pattern in the Dapoling watershed. Sustainability 2022, 14, 678. [Google Scholar] [CrossRef] [Scilit]
- Bruen, M.; Hallouin, T.; Christie, M.; Matson, R.; Siwicka, E.; Kelly, F.; Bullock, C.; Feeley, H.B.; Hannigan, E.; Kelly-Quinn, M. A Bayesian modelling framework for integration of ecosystem services into freshwater resources management. Environ. Manag. 2022, 69, 781–800. [Google Scholar] [CrossRef] [Scilit] [PubMed]
- Ma, W.; Yang, F.; Wang, N.; Zhao, L.; Tan, K.; Zhang, X.; Zhang, L.; Li, H. Study on spatial-temporal evolution and driving factors of ecosystem service value in the Yangtze River Delta urban agglomerations. J. Ecol. Rural Environ. 2022, 38, 1365–1376. [Google Scholar] [CrossRef]
- Geng, W.; Li, Y.; Zhang, P.; Yang, D.; Jing, W.; Rong, T. Analyzing spatio-temporal changes and trade-offs/synergies among ecosystem services in the Yellow River basin, China. Ecol. Indic. 2022, 138, 108825. [Google Scholar] [CrossRef] [Scilit]
- Guo, H.; Cai, Y.; Li, B.; Wan, H.; Yang, Z. An improved approach for evaluating landscape ecological risks and exploring its coupling coordination with ecosystem services. J. Environ. Manag. 2023, 348, 119277. [Google Scholar] [CrossRef] [Scilit] [PubMed]
- Mamat, A.; Halik, Ü.; Rouzi, A. Variations of ecosystem service value in response to land-use change in the Kashgar region, northwest China. Sustainability 2018, 10, 200. [Google Scholar] [CrossRef] [Scilit]
- Zhao, Y.; Yang, H.; Zhu, C.; Cao, J. Spatial and temporal distribution of the ecosystem provisioning service and its correlation with food production in the Songhua River basin, northeastern China. Land 2024, 13, 451. [Google Scholar] [CrossRef] [Scilit]
- Chen, Y.; Zhang, R.; Dehghanifarsani, L.; Amani-Beni, M. Dynamics and Drivers of Ecosystem Service Values in the Qionglai–Daxiangling Region of China’s Giant Panda National Park (1990–2020). Systems 2025, 13, 807. [Google Scholar] [CrossRef] [Scilit]
- Jin, T.; Chen, Y.; Shu, B.; Gao, M.; Qiu, J. Spatiotemporal evolution of ecosystem service value and topographic gradient effect in the Da-Xiao Liangshan Mountains in Sichuan Province, China. J. Mt. Sci. 2023, 20, 2344–2357. [Google Scholar] [CrossRef] [Scilit]
- Xie, G.; Zhang, C.; Zhang, C.; Xiao, Y.; Lu, C. The value of ecosystem services in China. Resour. Sci. 2015, 37, 1740–1746. [Google Scholar]
- Yi, L.; Zhang, Z.; Zhao, X.; Liu, B.; Wang, X.; Wen, Q.; Zuo, L.; Liu, F.; Xu, J.; Hu, S. Have changes to unused land in China improved or exacerbated its environmental quality in the past three decades? Sustainability 2016, 8, 184. [Google Scholar] [CrossRef] [Scilit]
- Song, W.; Deng, X. Land-use/land-cover change and ecosystem service provision in China. Sci. Total Environ. 2017, 576, 705–719. [Google Scholar] [CrossRef] [Scilit] [PubMed]
- Leong, Y.; Yue, J.C. A modification to geographically weighted regression. Int. J. Health Geogr. 2017, 16, 11. [Google Scholar] [CrossRef] [Scilit] [PubMed]
- Zhang, L.; Cheng, J.; Jin, C. Spatial interaction modeling of OD flow data: Comparing geographically weighted negative binomial regression (GWNBR) and OLS (GWOLSR). ISPRS Int. J. Geo-Inf. 2019, 8, 220. [Google Scholar] [CrossRef] [Scilit]
- Liu, F.; Liu, F.; Chen, G. Spatio-temporal differentiation and non-stationarity of driving factors in the urbanization willingness of rural-urban migrants in China: An empirical test based on the geographically and temporally weighted regression model. Geogr. Res. 2026, 45, 1047–1068. [Google Scholar] [CrossRef]
- Qiao, Y.; Xu, W.; Liu, K.; Pei, W.; Wang, Z.; Han, X.; Zhang, H. Spatio-temporal evolution of vegetation NPP in Heilongjiang province based on the multi-scale geographically weighted regression model. Acta Ecol. Sin. 2025, 45, 4878–4888. [Google Scholar] [CrossRef]
- Wu, H.; Zhang, Z.; Zhou, J.; Chen, X.; Kong, Y.; Kong, X. Spatial differentiation and association between ecosystem service value and landscape ecological risk index in Anning River dry valley. PeerJ 2026, 14, e20914. [Google Scholar] [CrossRef] [Scilit] [PubMed]
- Deng, J.; Ma, Q.; Wei, H.; Wang, X.; Yang, C.; Zhou, H.; Zhang, Z. Spatial-temporal evolution of cultivated land resources in Huai River basin of Henan province from the perspective of food security. Res. Soil Water Conserv. 2021, 28, 390–396. [Google Scholar] [CrossRef]
- Wang, Z.; Mao, J.; Wang, X.; Chen, W. Spatial evolution of territorial spatial pattern and its effects on ecosystem services value in Chinese urban agglomerations. Acta Ecol. Sin. 2026, 46, 3062–3078. [Google Scholar] [CrossRef]
- Zhang, J.; Gu, M.; Wang, C. Comprehensive ecological compensation mechanisms of the Yellow River basin from the sharing perspective. China Popul. Resour. Environ. 2024, 34, 192–204. [Google Scholar] [CrossRef]
- Fu, D.; Wei, J. Study on spatio-temporal synergy between ecosystem service value and landscape ecological risk in Anhui province. J. Yunnan Agric. Univ. (Soc. Sci.) 2024, 18, 130–140. [Google Scholar] [CrossRef]
- Zhang, M.; Zhang, Y.; Tian, Q.; Wang, M.; Liu, H. Ecological compensation standard and influencing factors of water resources in Yellow River basin. Pearl River 2024, 45, 74–82. [Google Scholar] [CrossRef]
- Jing, X.; Tian, G.; He, Y.; Wang, M. Spatial and temporal differentiation and coupling analysis of land use change and ecosystem service value in Jiangsu province. Ecol. Indic. 2024, 163, 112076. [Google Scholar] [CrossRef] [Scilit]
- Wu, K.; Wang, D.; Lu, H.; Liu, G. Temporal and spatial heterogeneity of land use, urbanization, and ecosystem service value in China: A national-scale analysis. J. Clean. Prod. 2023, 418, 137911. [Google Scholar] [CrossRef] [Scilit]
- Wen, Y.; Gong, Z.; Wei, J.; Wang, X.; Cai, Y. Land use changes and ecosystem service value in the buffer zone of Poyang Lake in recent 30 years. Acta Ecol. Sin. 2022, 42, 9261–9273. [Google Scholar] [CrossRef] [Scilit]
- Wang, H.; Qin, F.; Zhu, J.; Zhang, C. The effects of land use structure and landscape pattern change on ecosystem service values. Acta Ecol. Sin. 2017, 37, 1087–1096. [Google Scholar] [CrossRef] [Scilit]
- Zhang, M.; Wang, K.; Liu, H.; Chen, H.; Zhang, C.H.; Yue, Y.M. Responses of ecosystem service values to landscape pattern change in typical karst area of northwest Guangxi, China. Chin. J. Appl. Ecol. 2010, 21, 1174–1179. [Google Scholar]
- Zhang, Z.; Tong, Z.; Zhang, L.; Liu, Y. Nonlinear effects of landscape pattern on ecosystem services and threshold regulation: A case study of eco-efficient synergistic zone in Fujian province. Acta Ecol. Sin. 2024, 44, 9535–9551. [Google Scholar] [CrossRef]
- Xiong, Y.; Zhang, A.; Liu, M.; Li, H. Effects of citrus orchard expansion on ecosystem services and landscape pattern: A case study of Xinfeng county, Jiangxi province, China. Acta Ecol. Sin. 2022, 42, 7845–7857. [Google Scholar] [CrossRef] [Scilit]
- Ma, S.; Wang, H.; Zhang, X.; Wang, L.; Jiang, J. A nature-based solution in forest management to improve ecosystem services and mitigate their trade-offs. J. Clean. Prod. 2022, 351, 131557. [Google Scholar] [CrossRef] [Scilit]
- Fu, H.; Yan, Y. Ecosystem service value assessment in downtown for implementing the “mountain-river-forest-cropland-lake-grassland system project”. Ecol. Indic. 2023, 154, 110751. [Google Scholar] [CrossRef] [Scilit]
- Xia, Y.; Zhong, M.; Kou, D. Economic benefits of the pilot watershed ecological compensation project. J. World Econ. 2024, 47, 64–95. [Google Scholar] [CrossRef]
- Wen, X.; Wang, J.; Han, X. Impact of land use evolution on the value of ecosystem services in the returned farmland area of the Loess Plateau in northern Shaanxi. Ecol. Indic. 2024, 163, 112119. [Google Scholar] [CrossRef] [Scilit]
- Wang, X.; Chen, B.; Zhu, D.; Yang, K.; Shen, Q.; Wu, C.; Wang, Y.; Huang, Y.; Zhu, J. On strategies and examples of ecological transformation and development of Chinese megapolis. Urban Rural Plan. 2019, 4, 109–110. [Google Scholar] [CrossRef]
- Zeng, C.; Li, Y.; Duan, X.; Xu, Y. Assessment and driving force analysis of ecosystem service value in the urban agglomeration along the middle reaches of the Yangtze river. Res. Soil Water Conserv. 2022, 29, 362–371. [Google Scholar]
- Ren, Y.; Lu, L.; Cheng, H.; Yu, H. Research progress and prospect of the interaction between watershed eco-compensation and sustainable livelihoods of rural residents. J. Nat. Resour. 2024, 39, 1039–1052. [Google Scholar] [CrossRef] [Scilit]
- Cushman, S.A.; McGarigal, K.; Neel, M.C. Parsimony in landscape metrics: Strength, universality, and consistency. Ecol. Indic. 2008, 8, 691–703. [Google Scholar] [CrossRef] [Scilit]
- Assis, J.C.; Hohlenwerger, C.; Metzger, J.P.; Rhodes, J.R.; Duarte, G.T.; Da Silva, R.A.; Boesing, A.L.; Prist, P.R.; Ribeiro, M.C. Linking landscape structure and ecosystem service flow. Ecosyst. Serv. 2023, 62, 101535. [Google Scholar] [CrossRef] [Scilit]
- Liang, Y.; Liu, L. Integration of ecosystem services and landscape pattern: A review. Acta Ecol. Sin. 2018, 38, 7159–7167. [Google Scholar] [CrossRef] [Scilit]
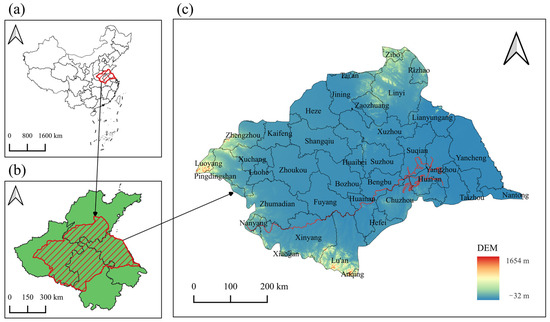
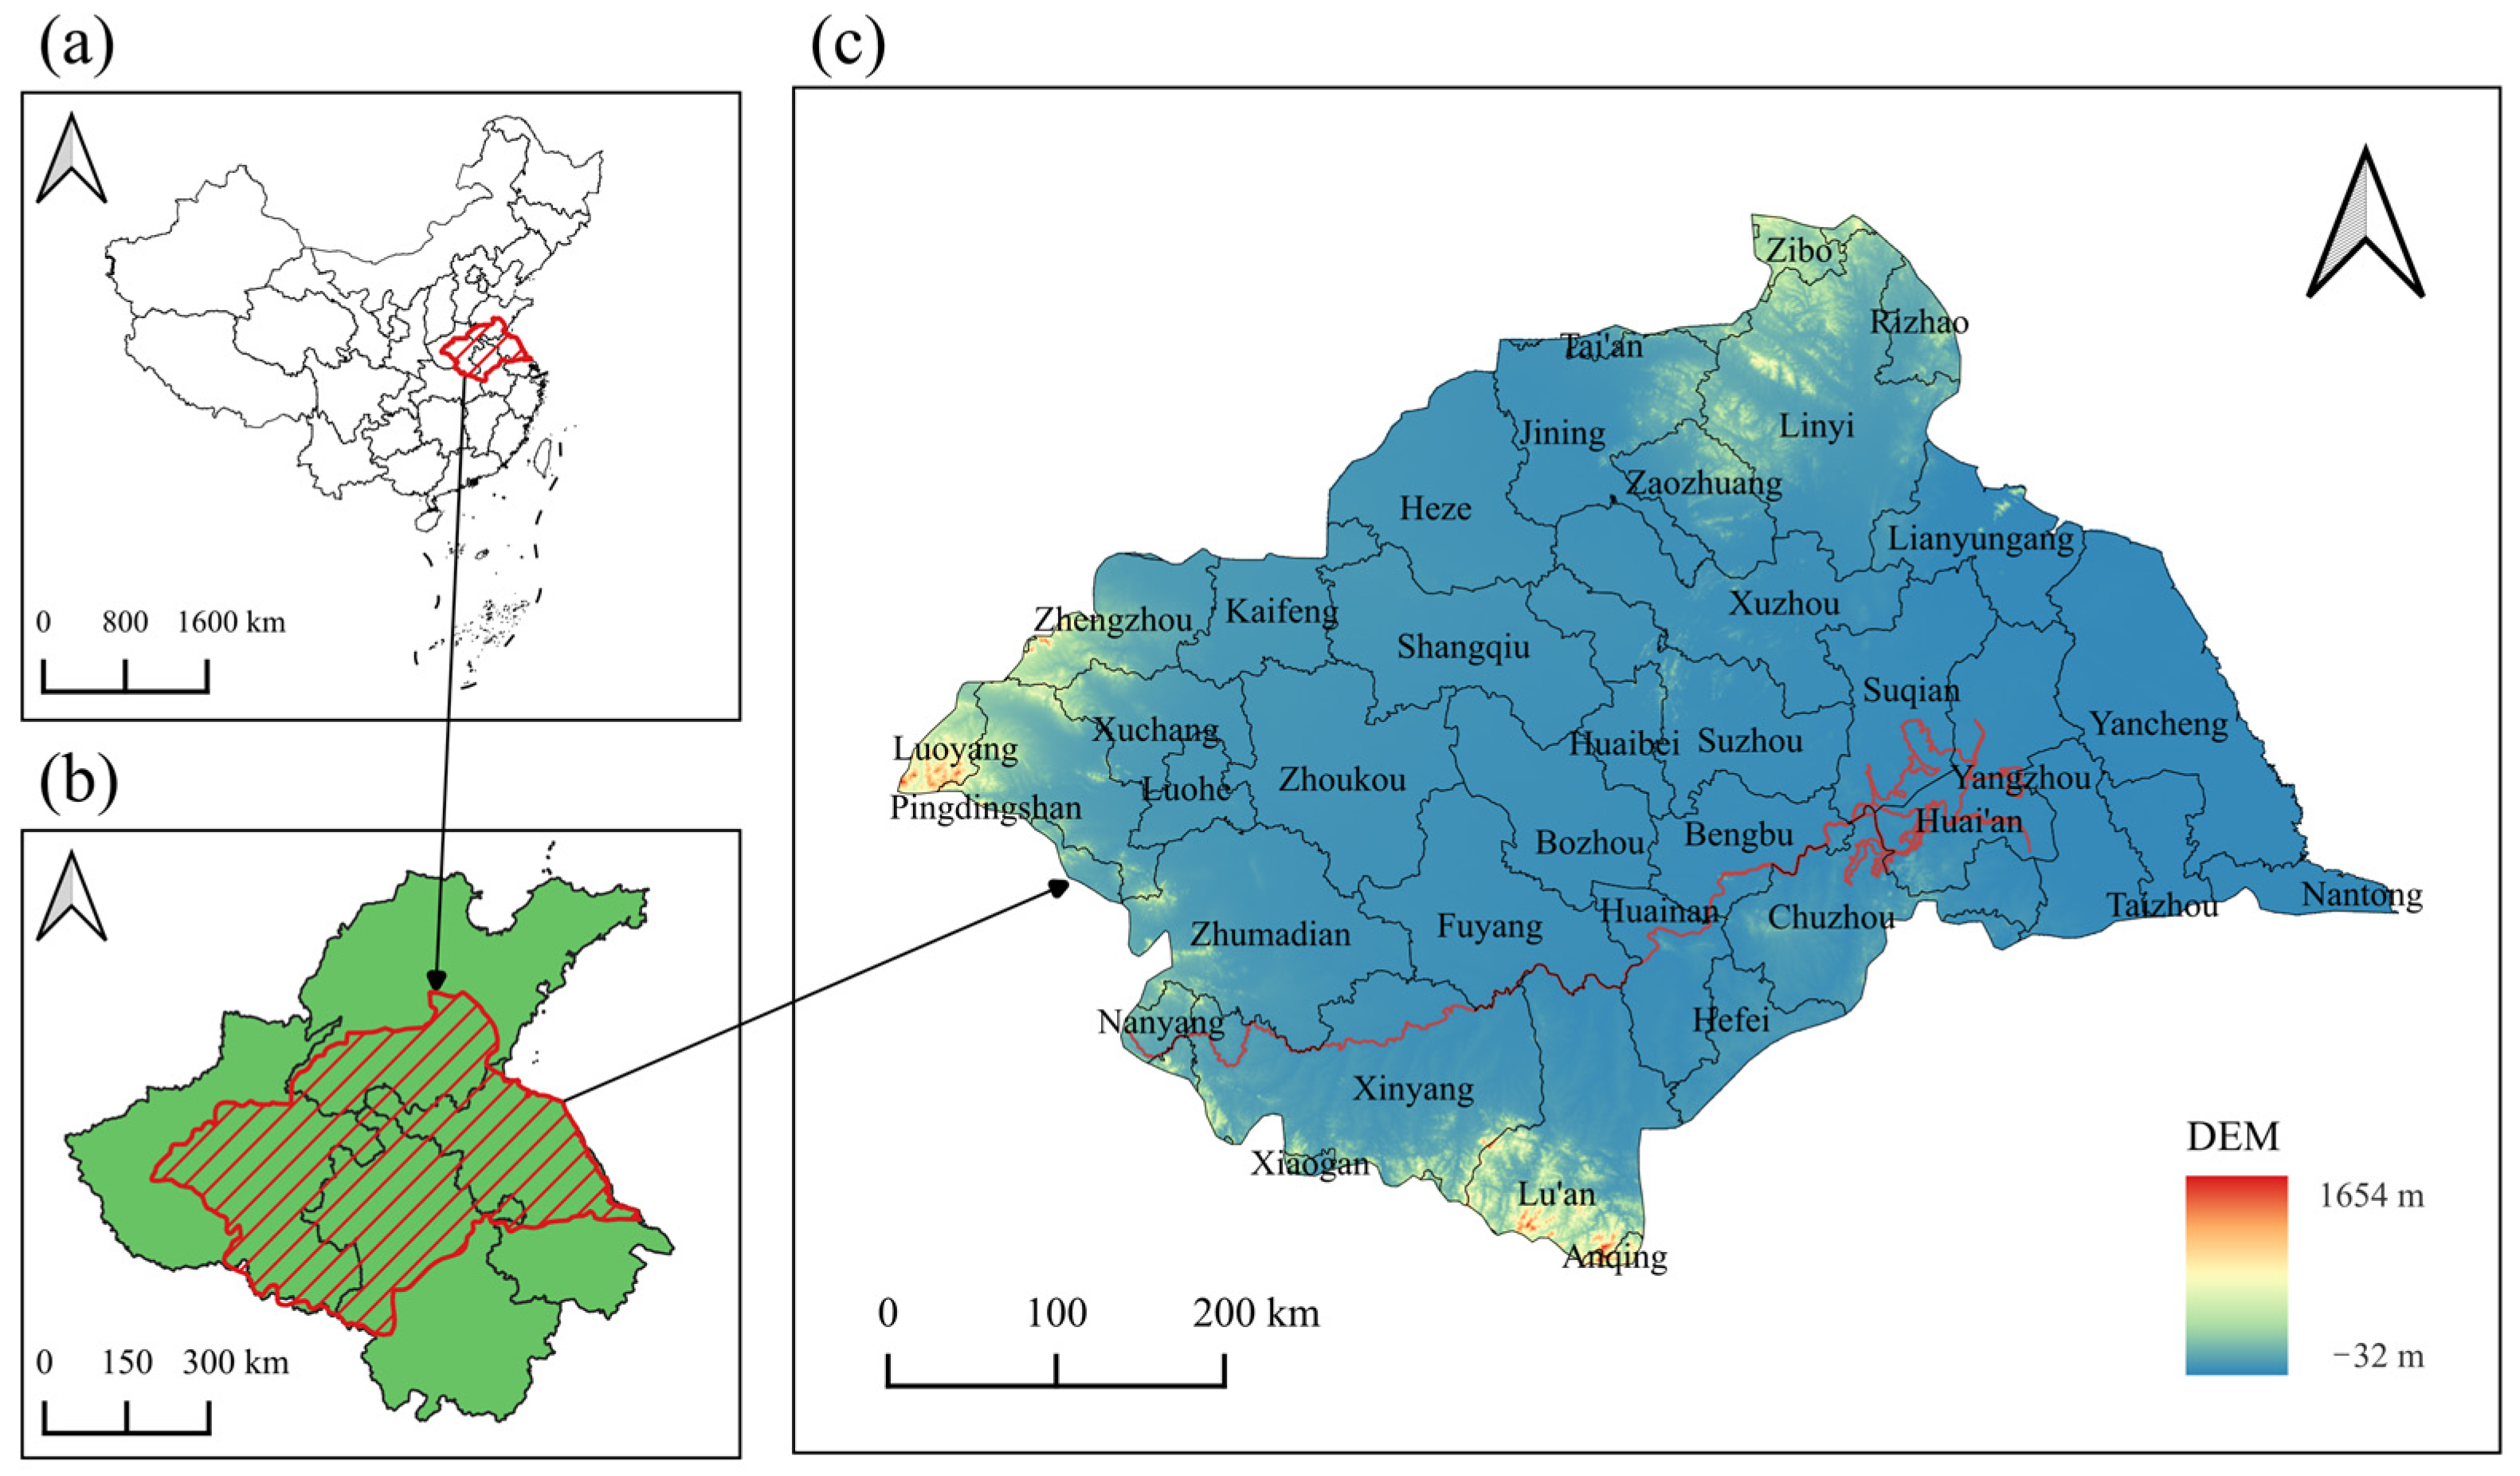
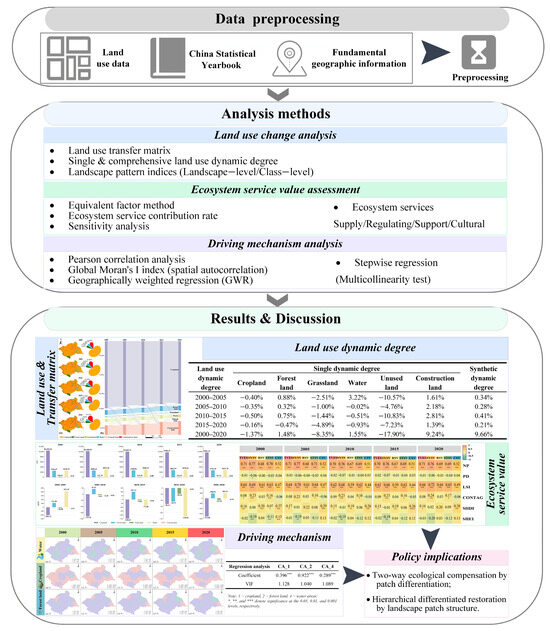
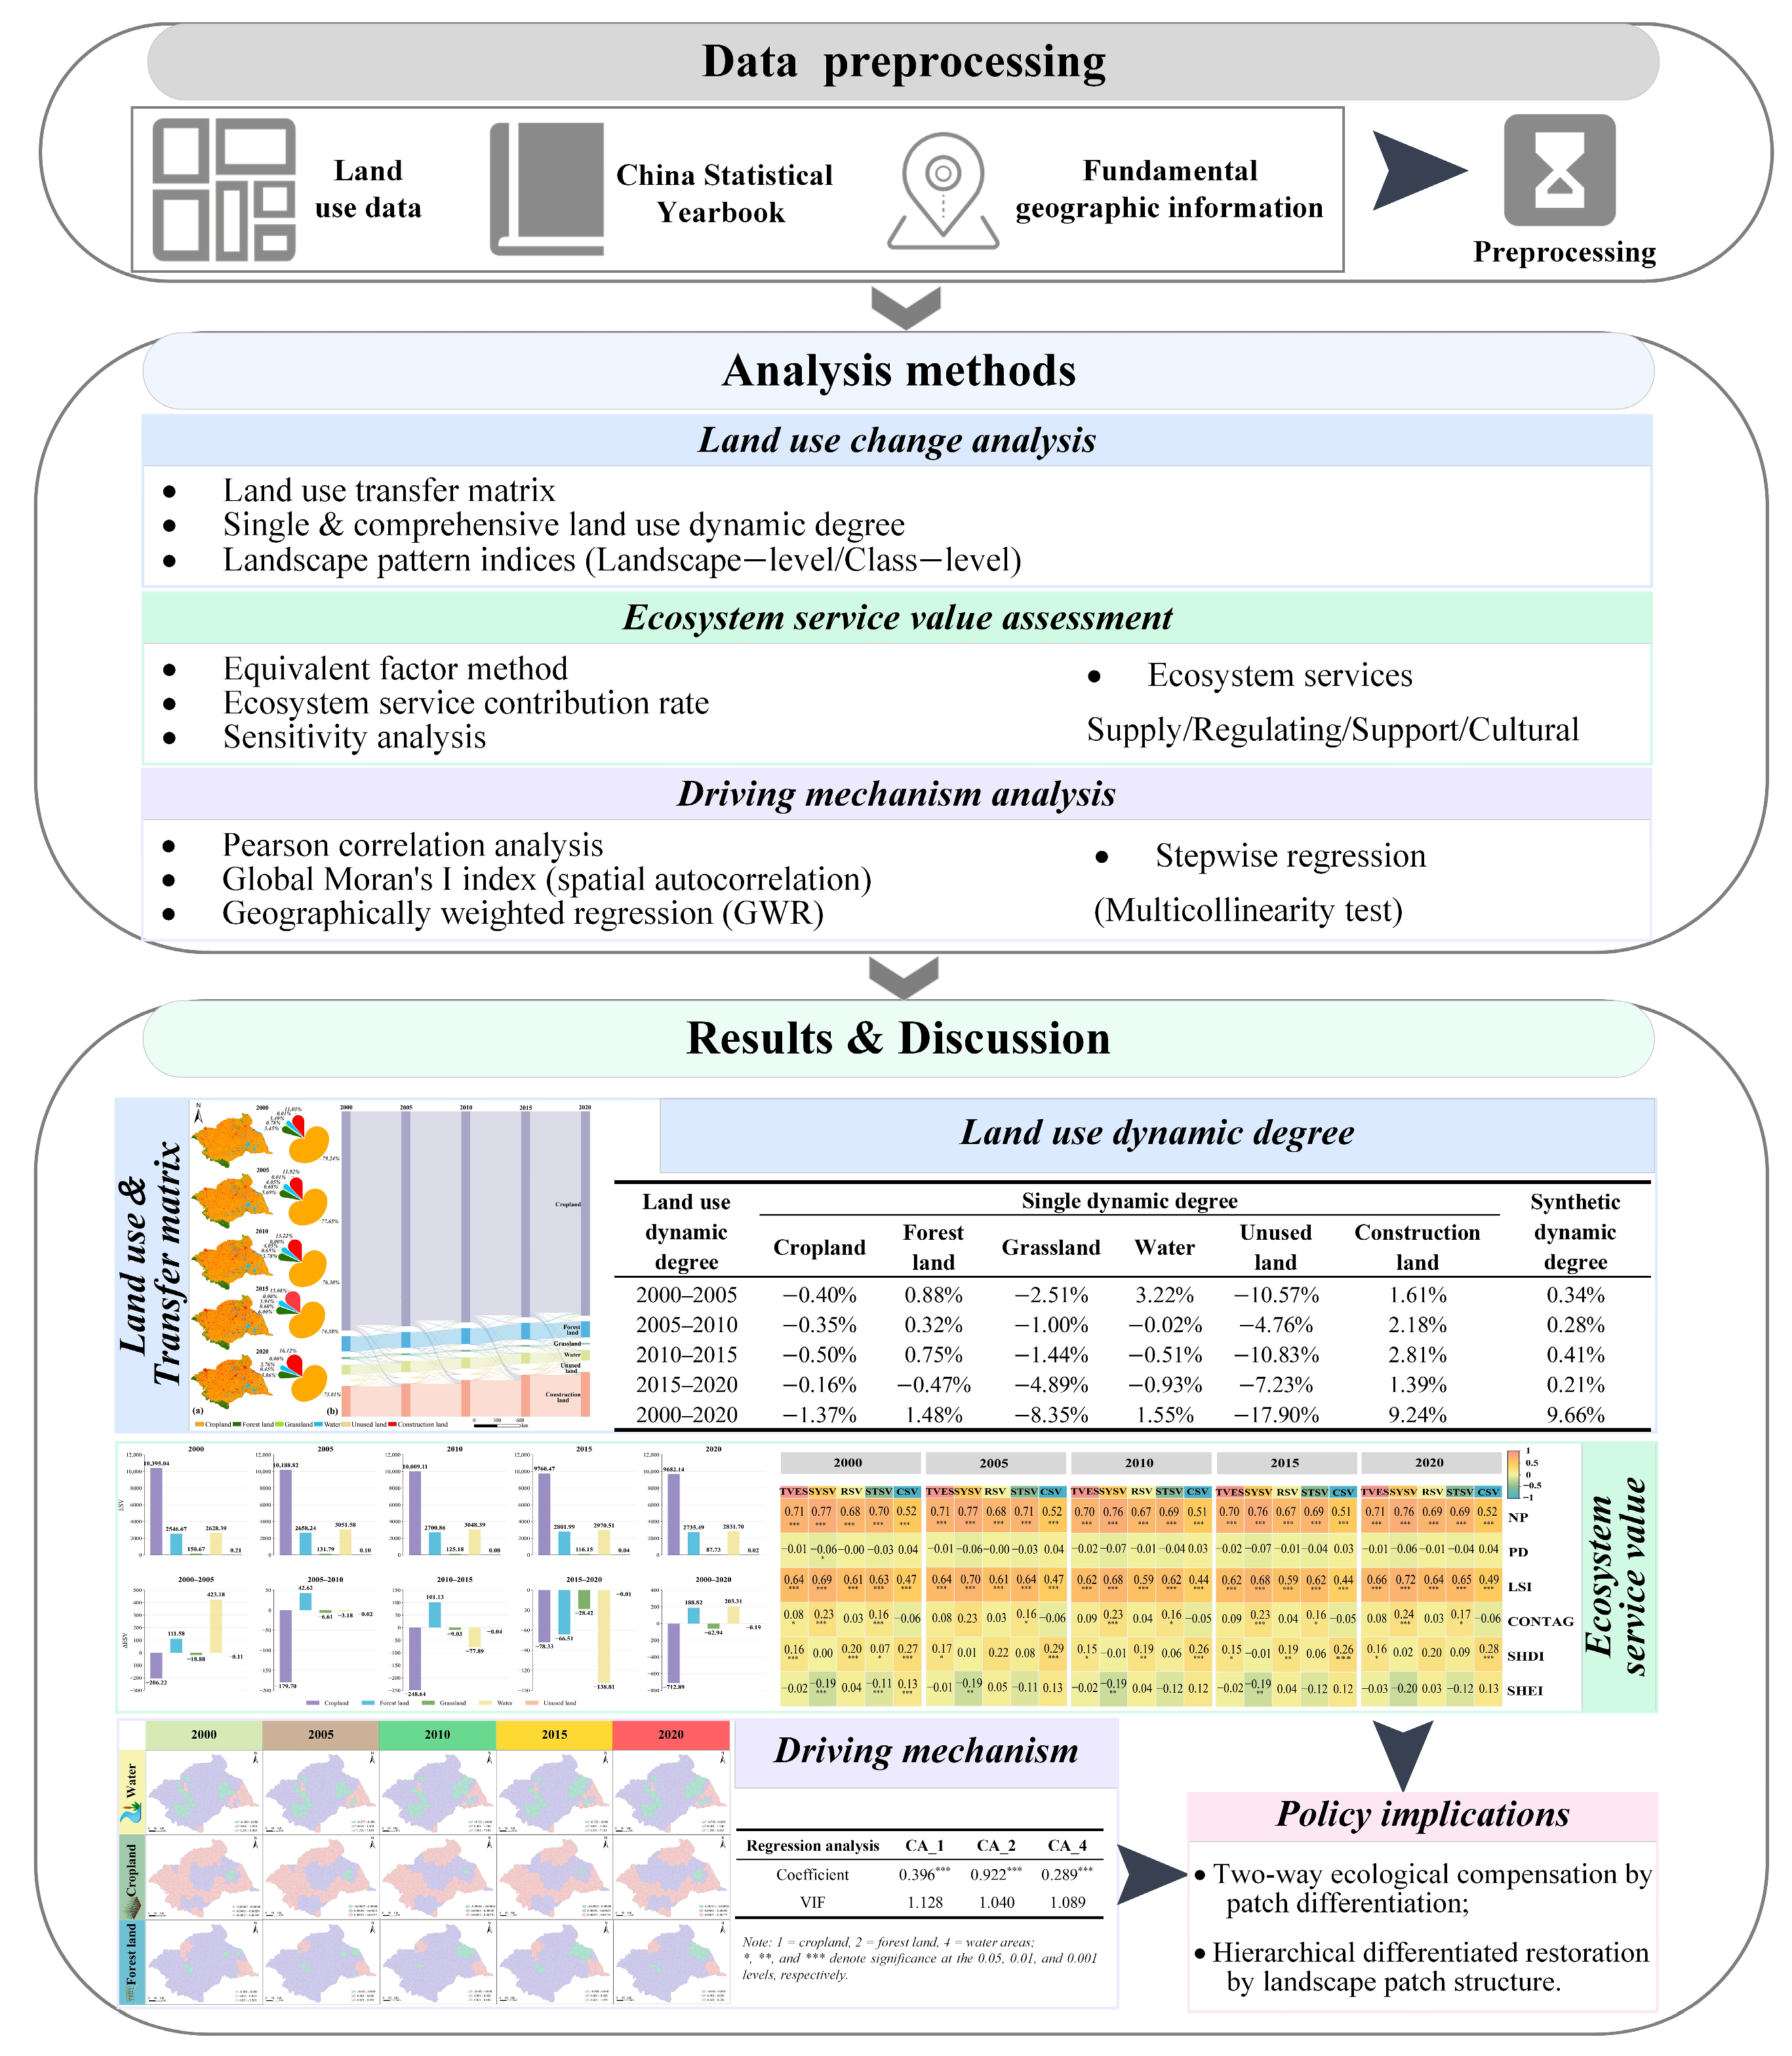
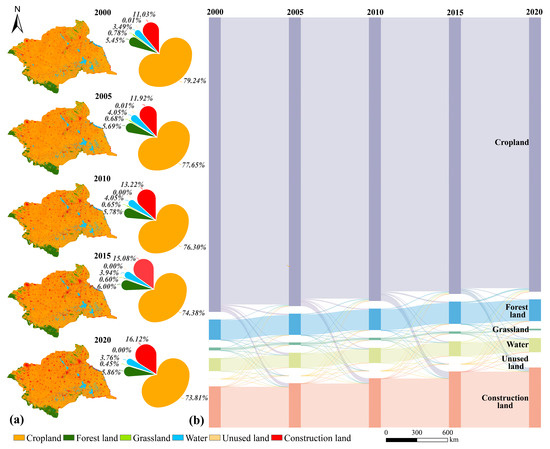
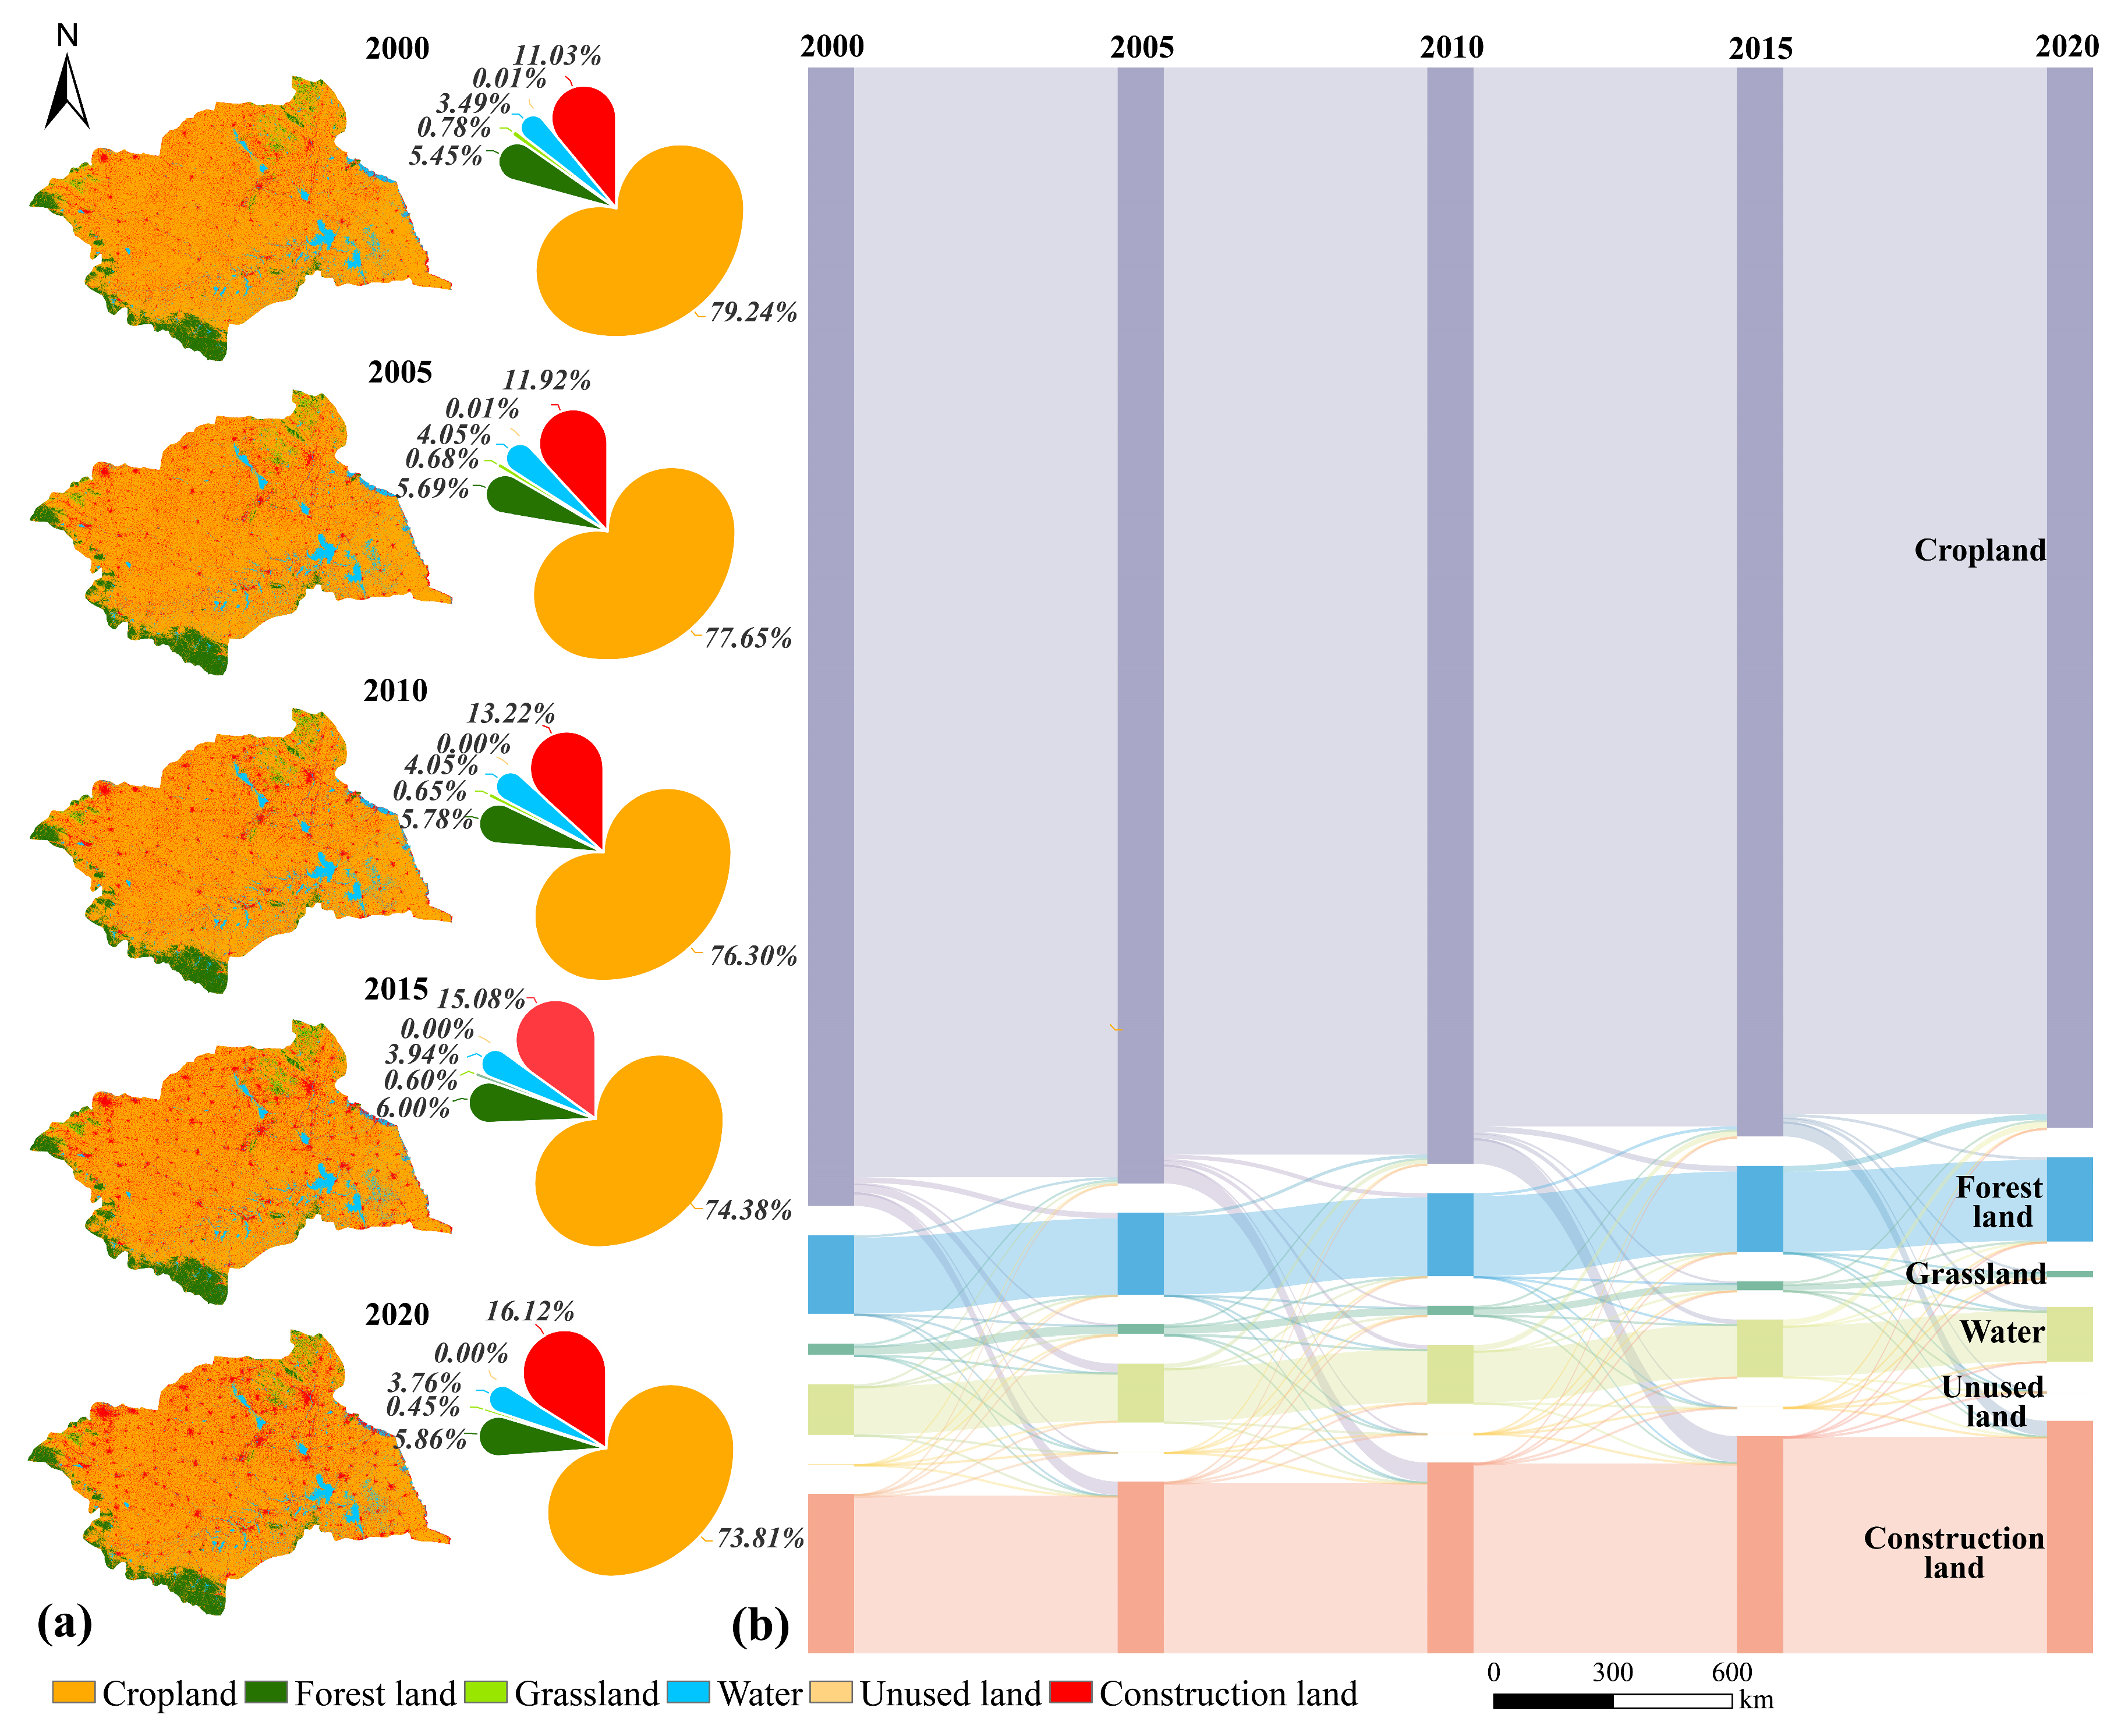
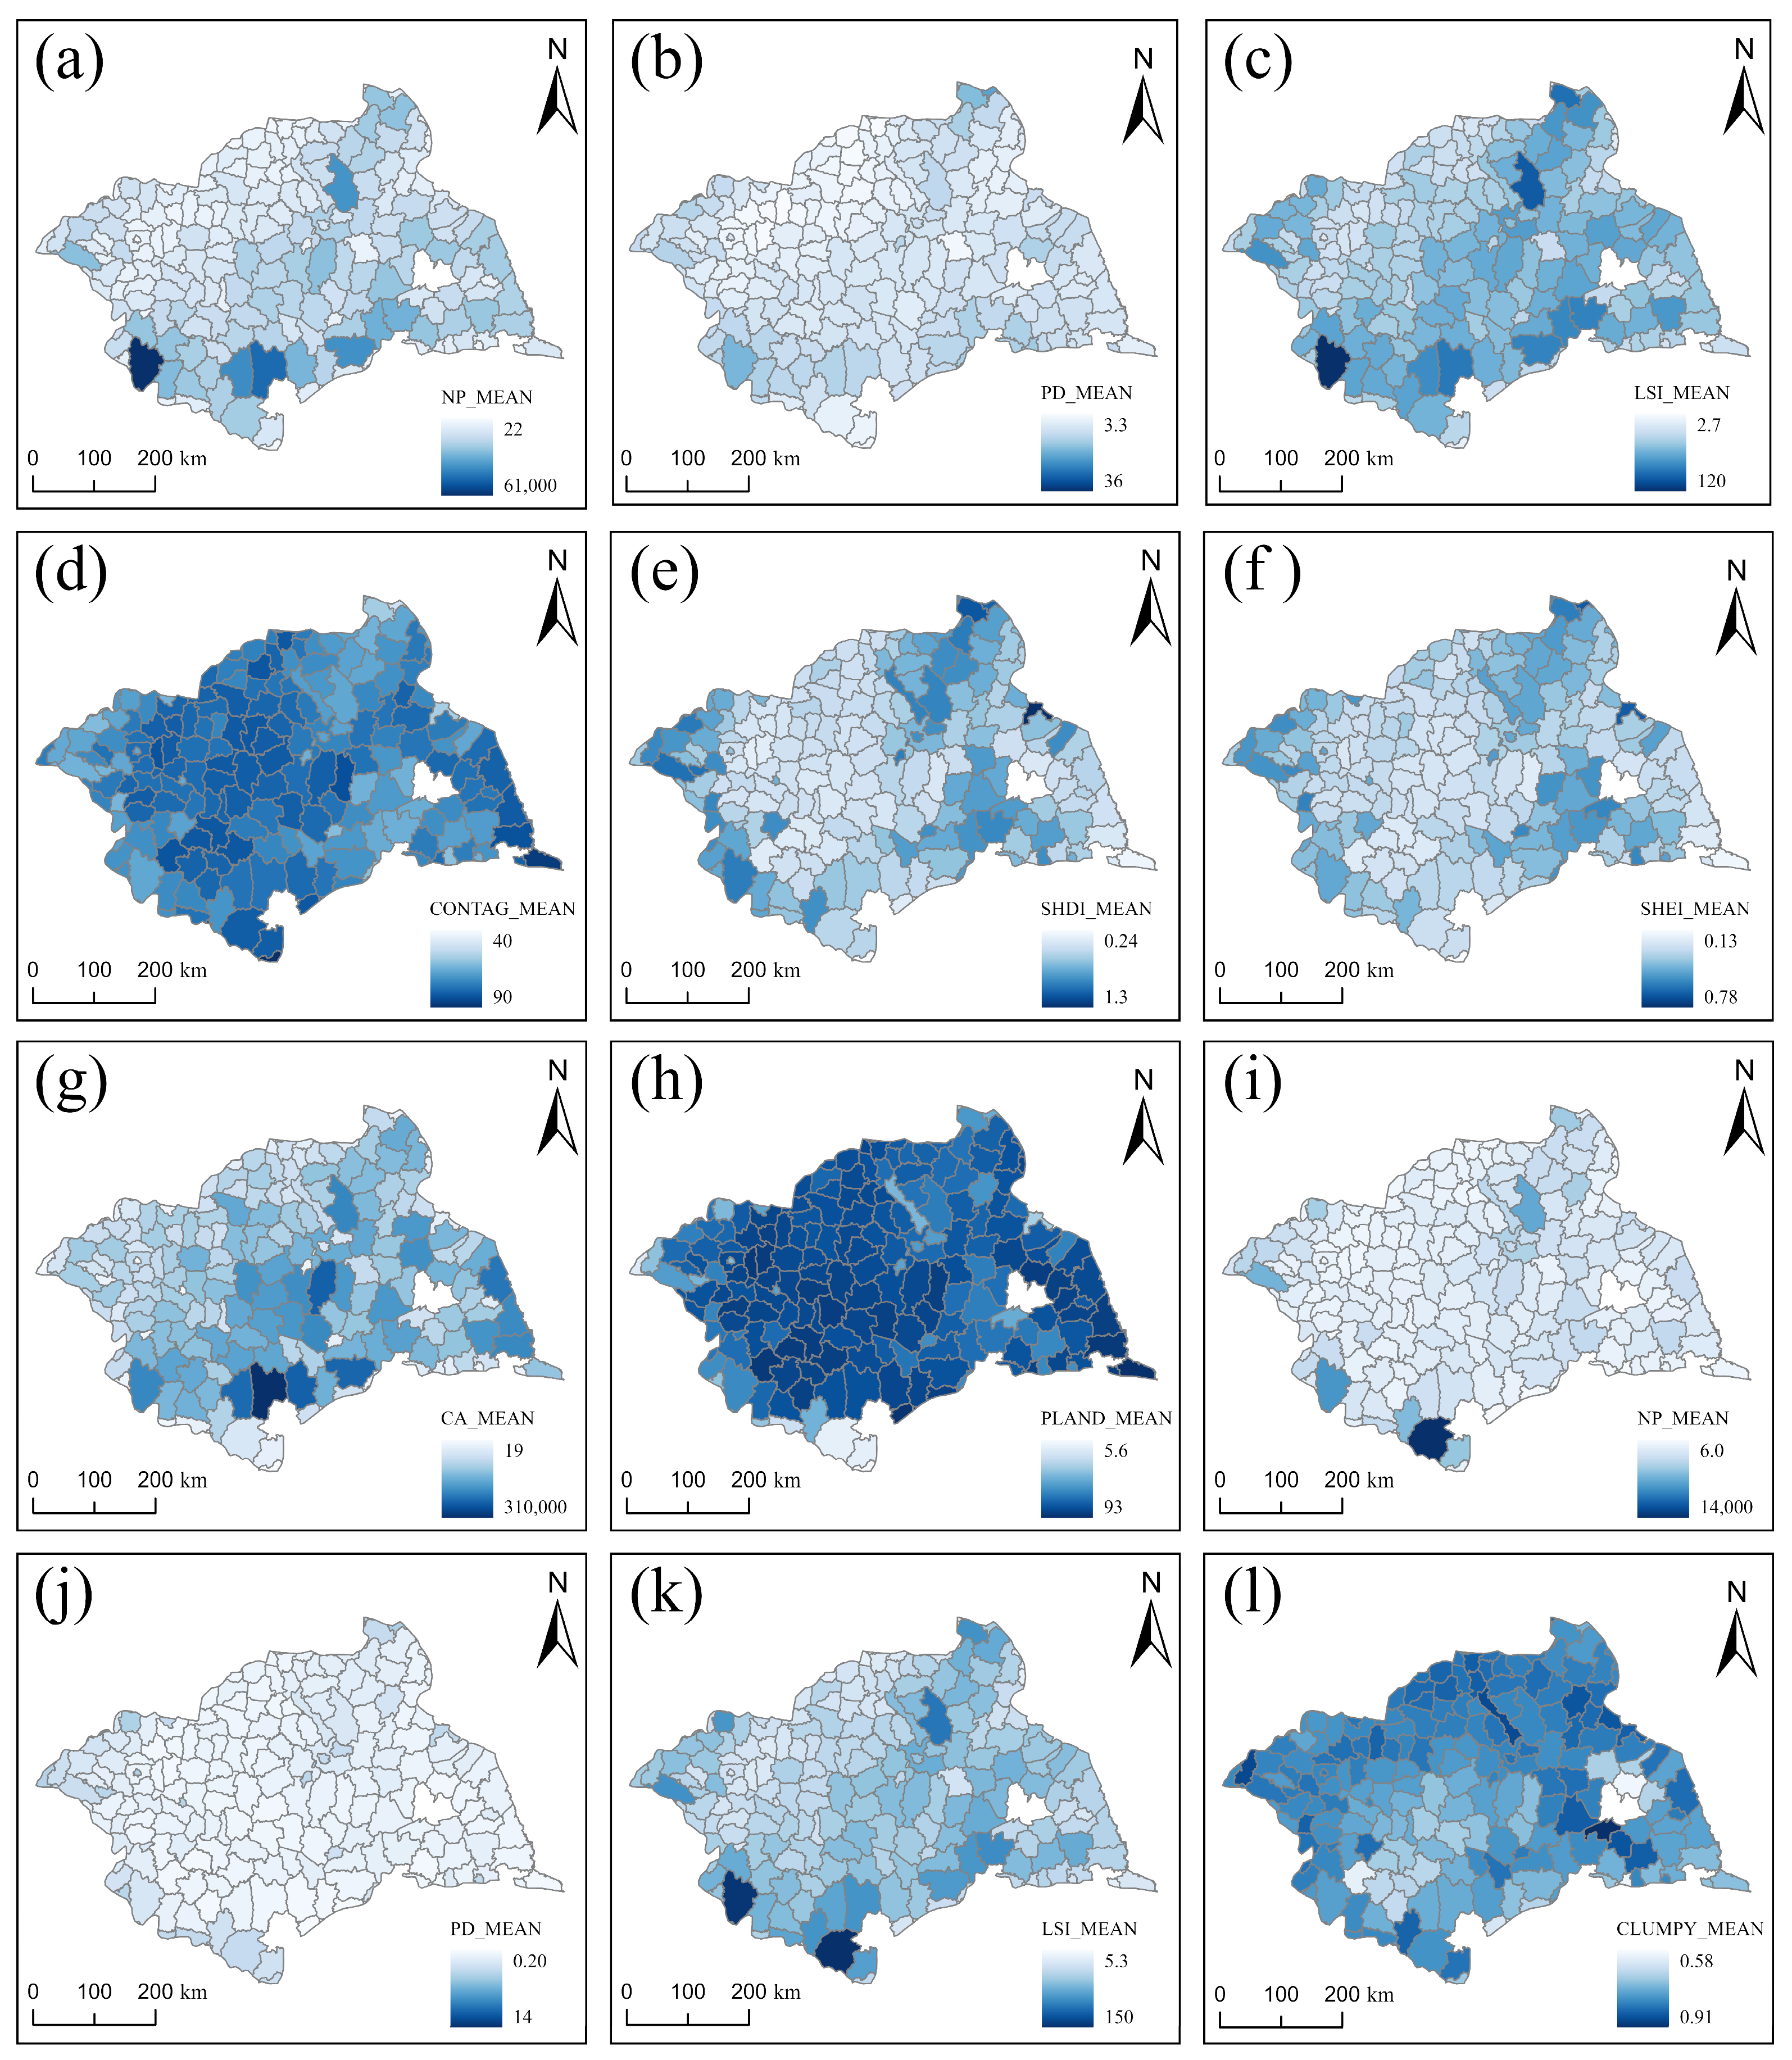
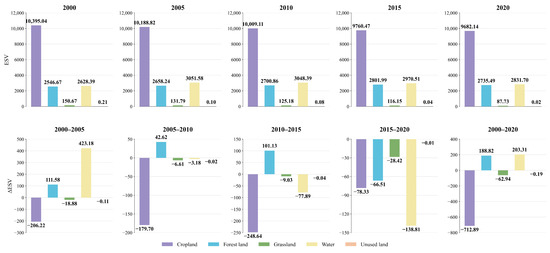
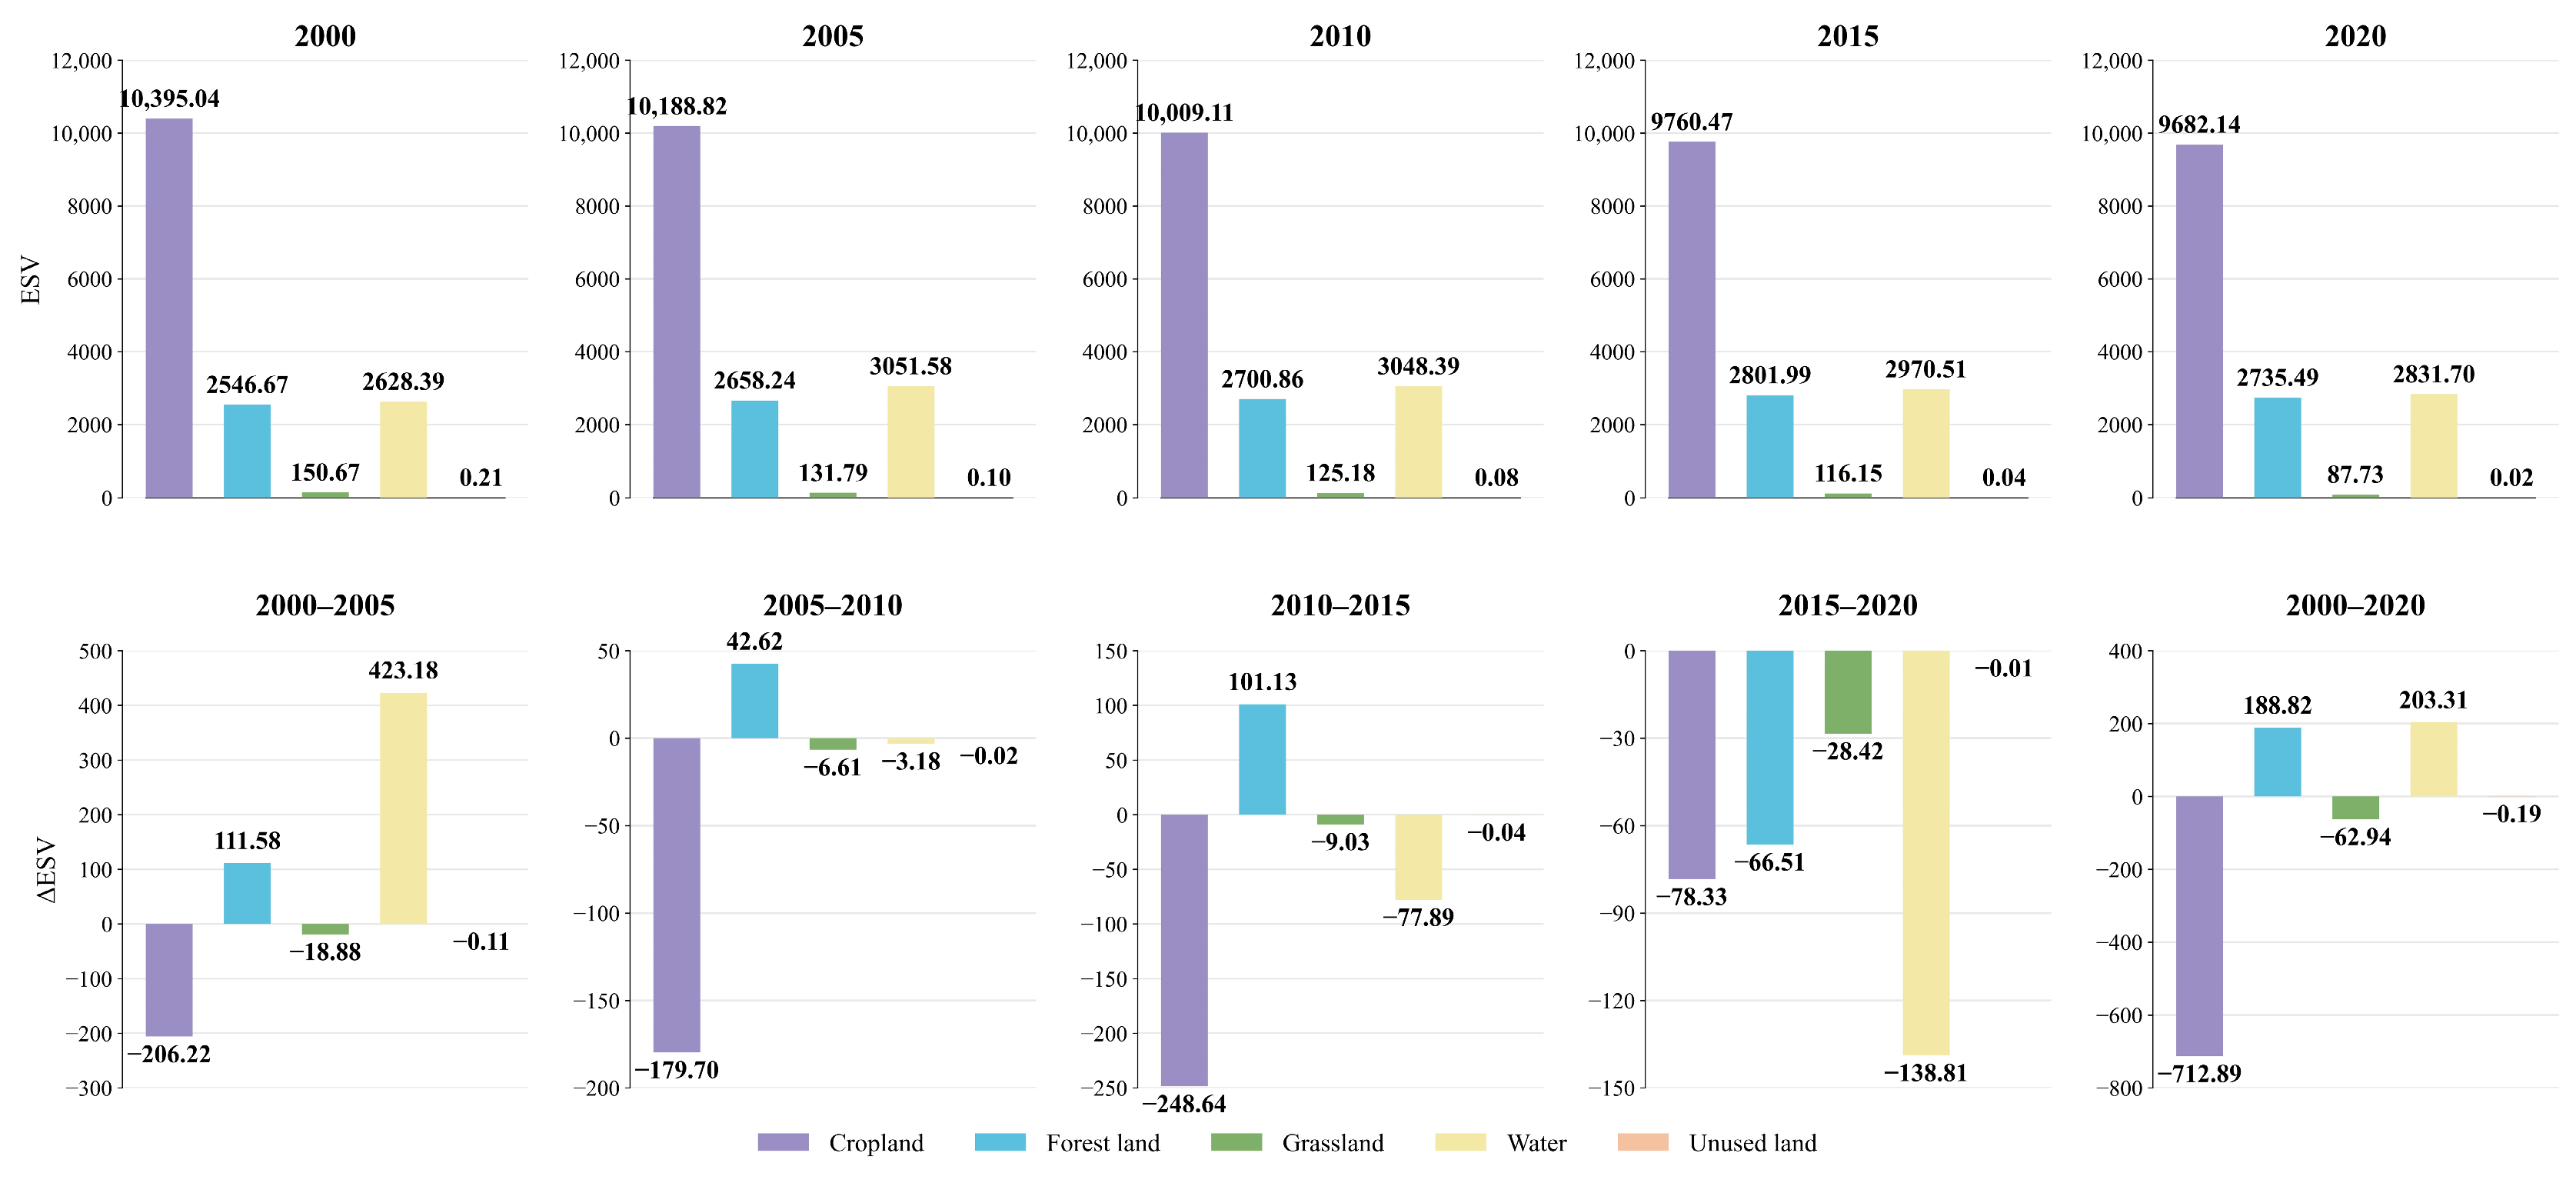
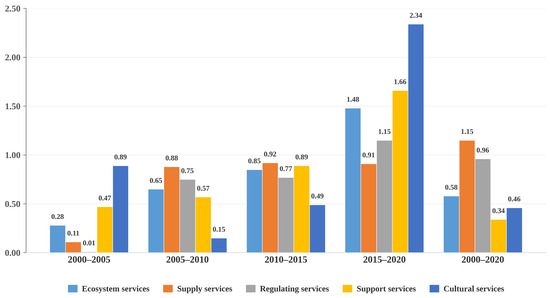
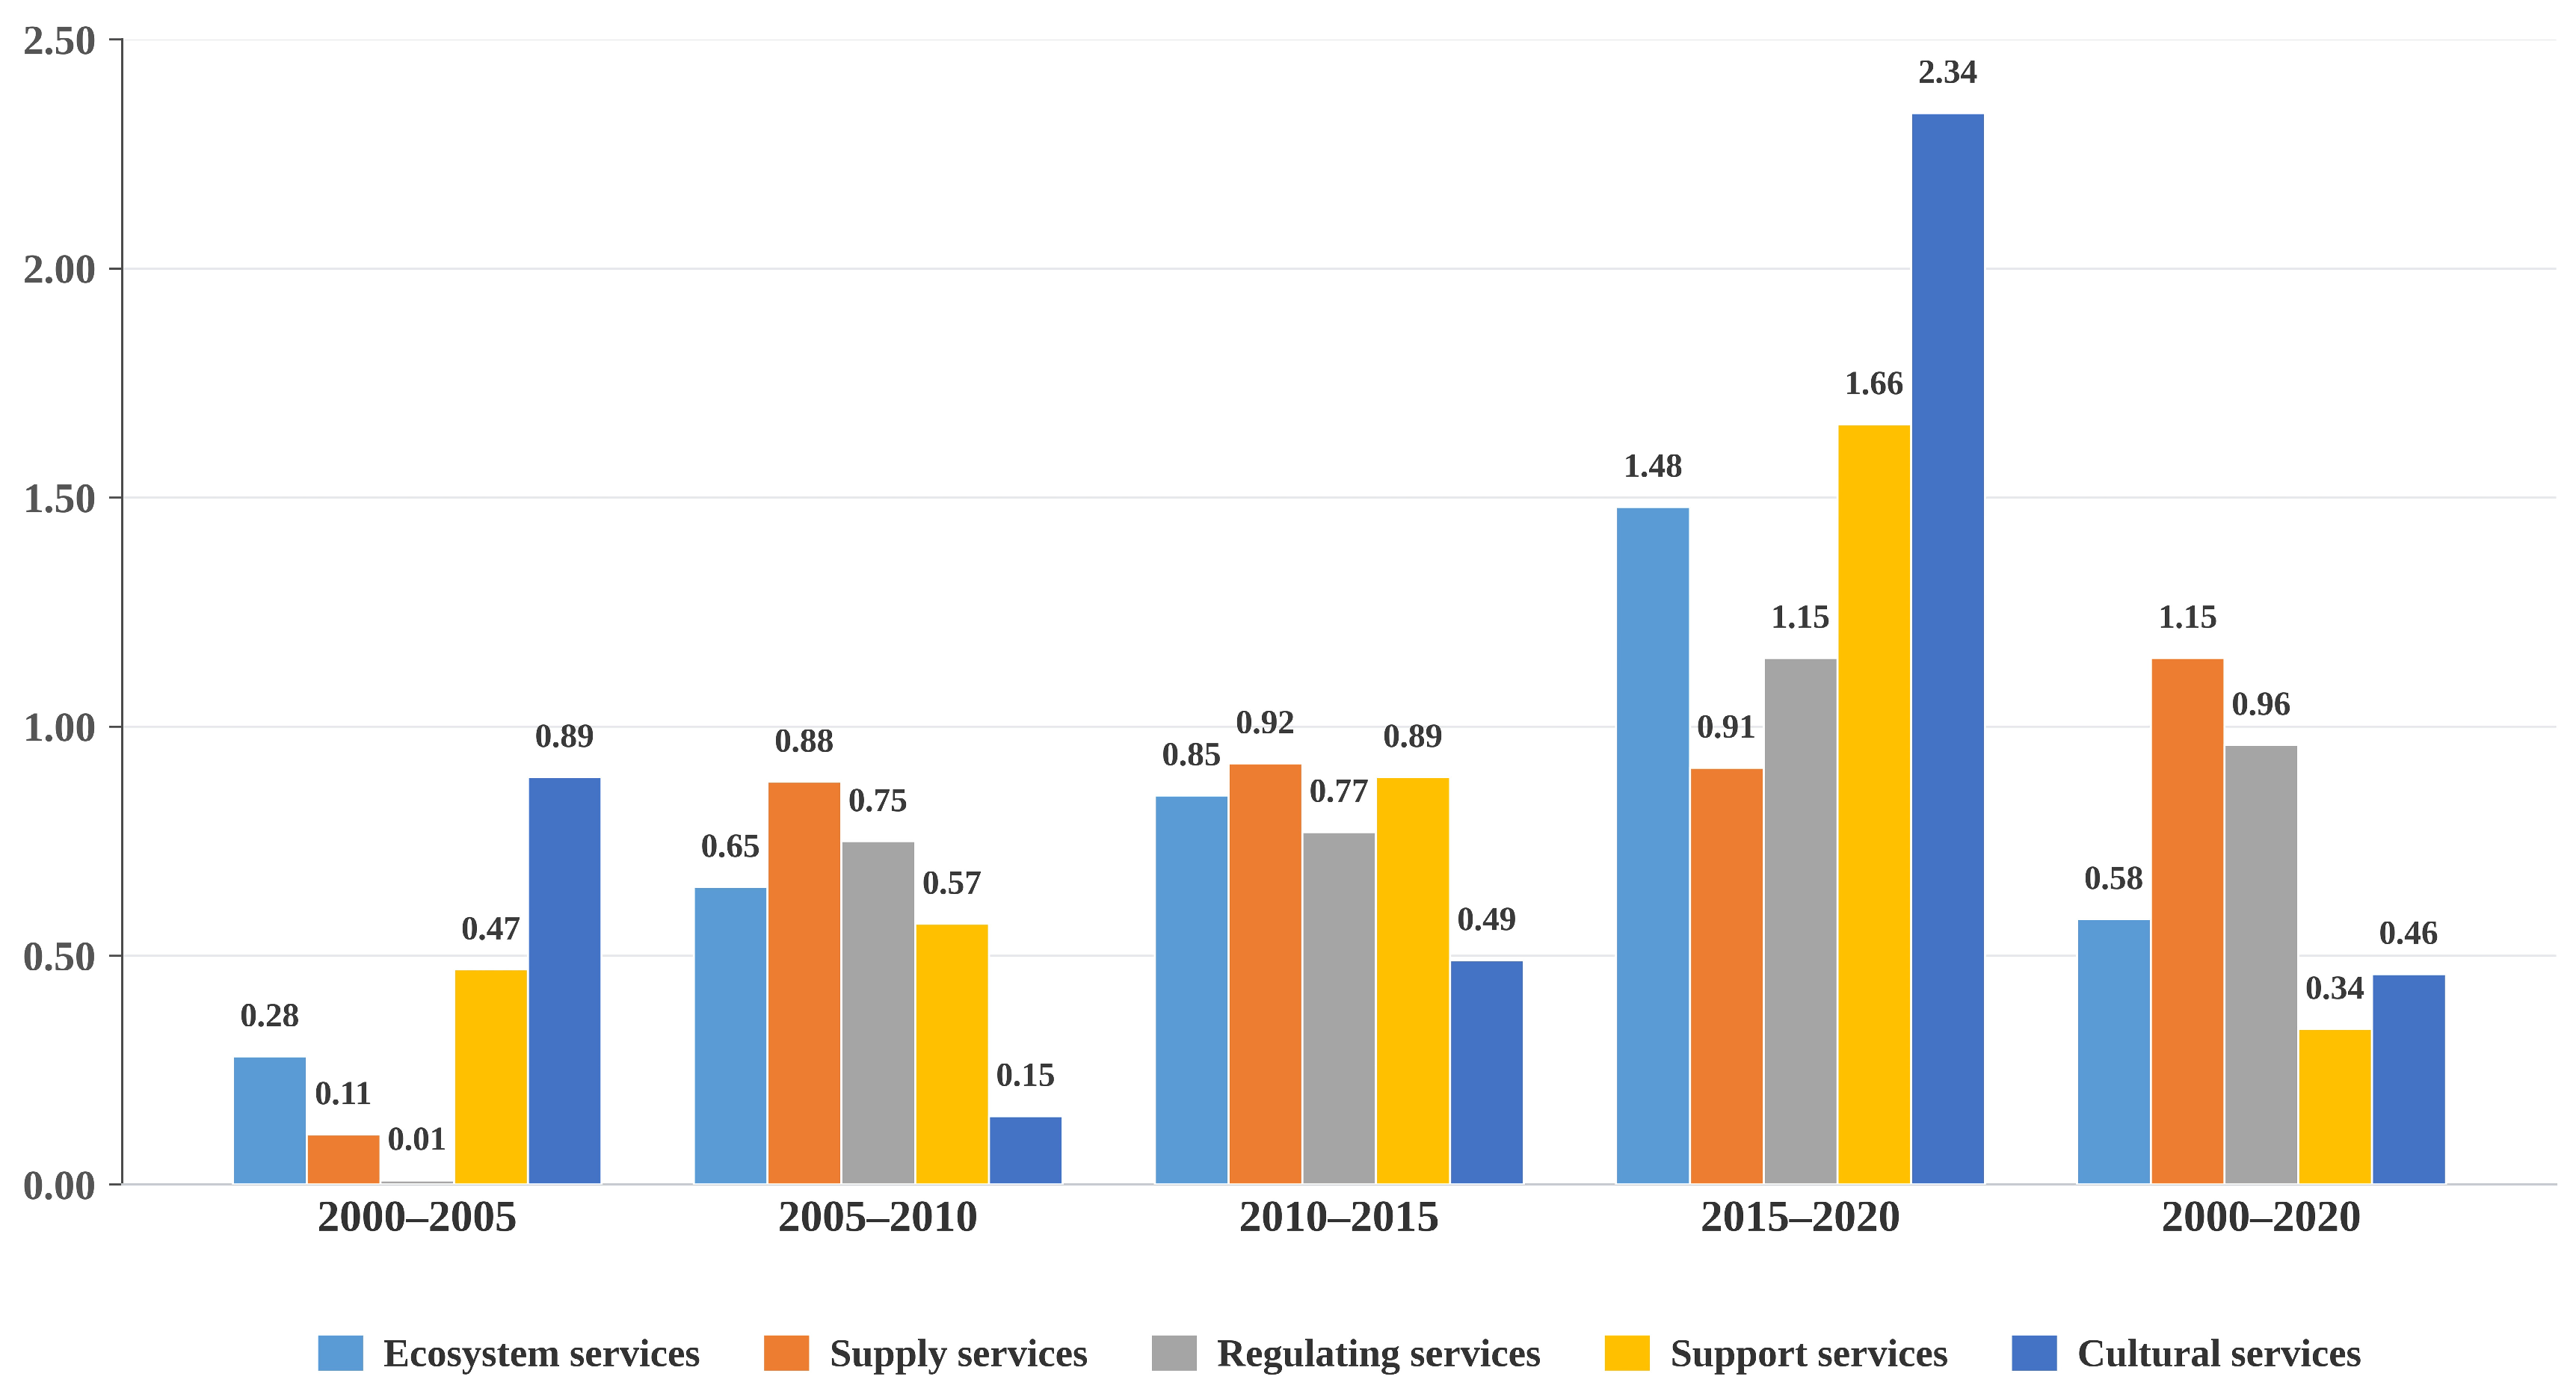
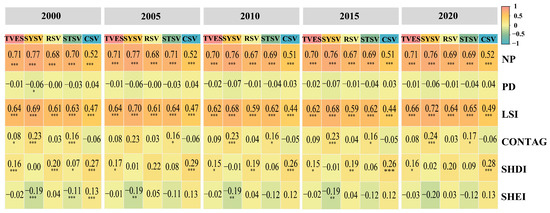
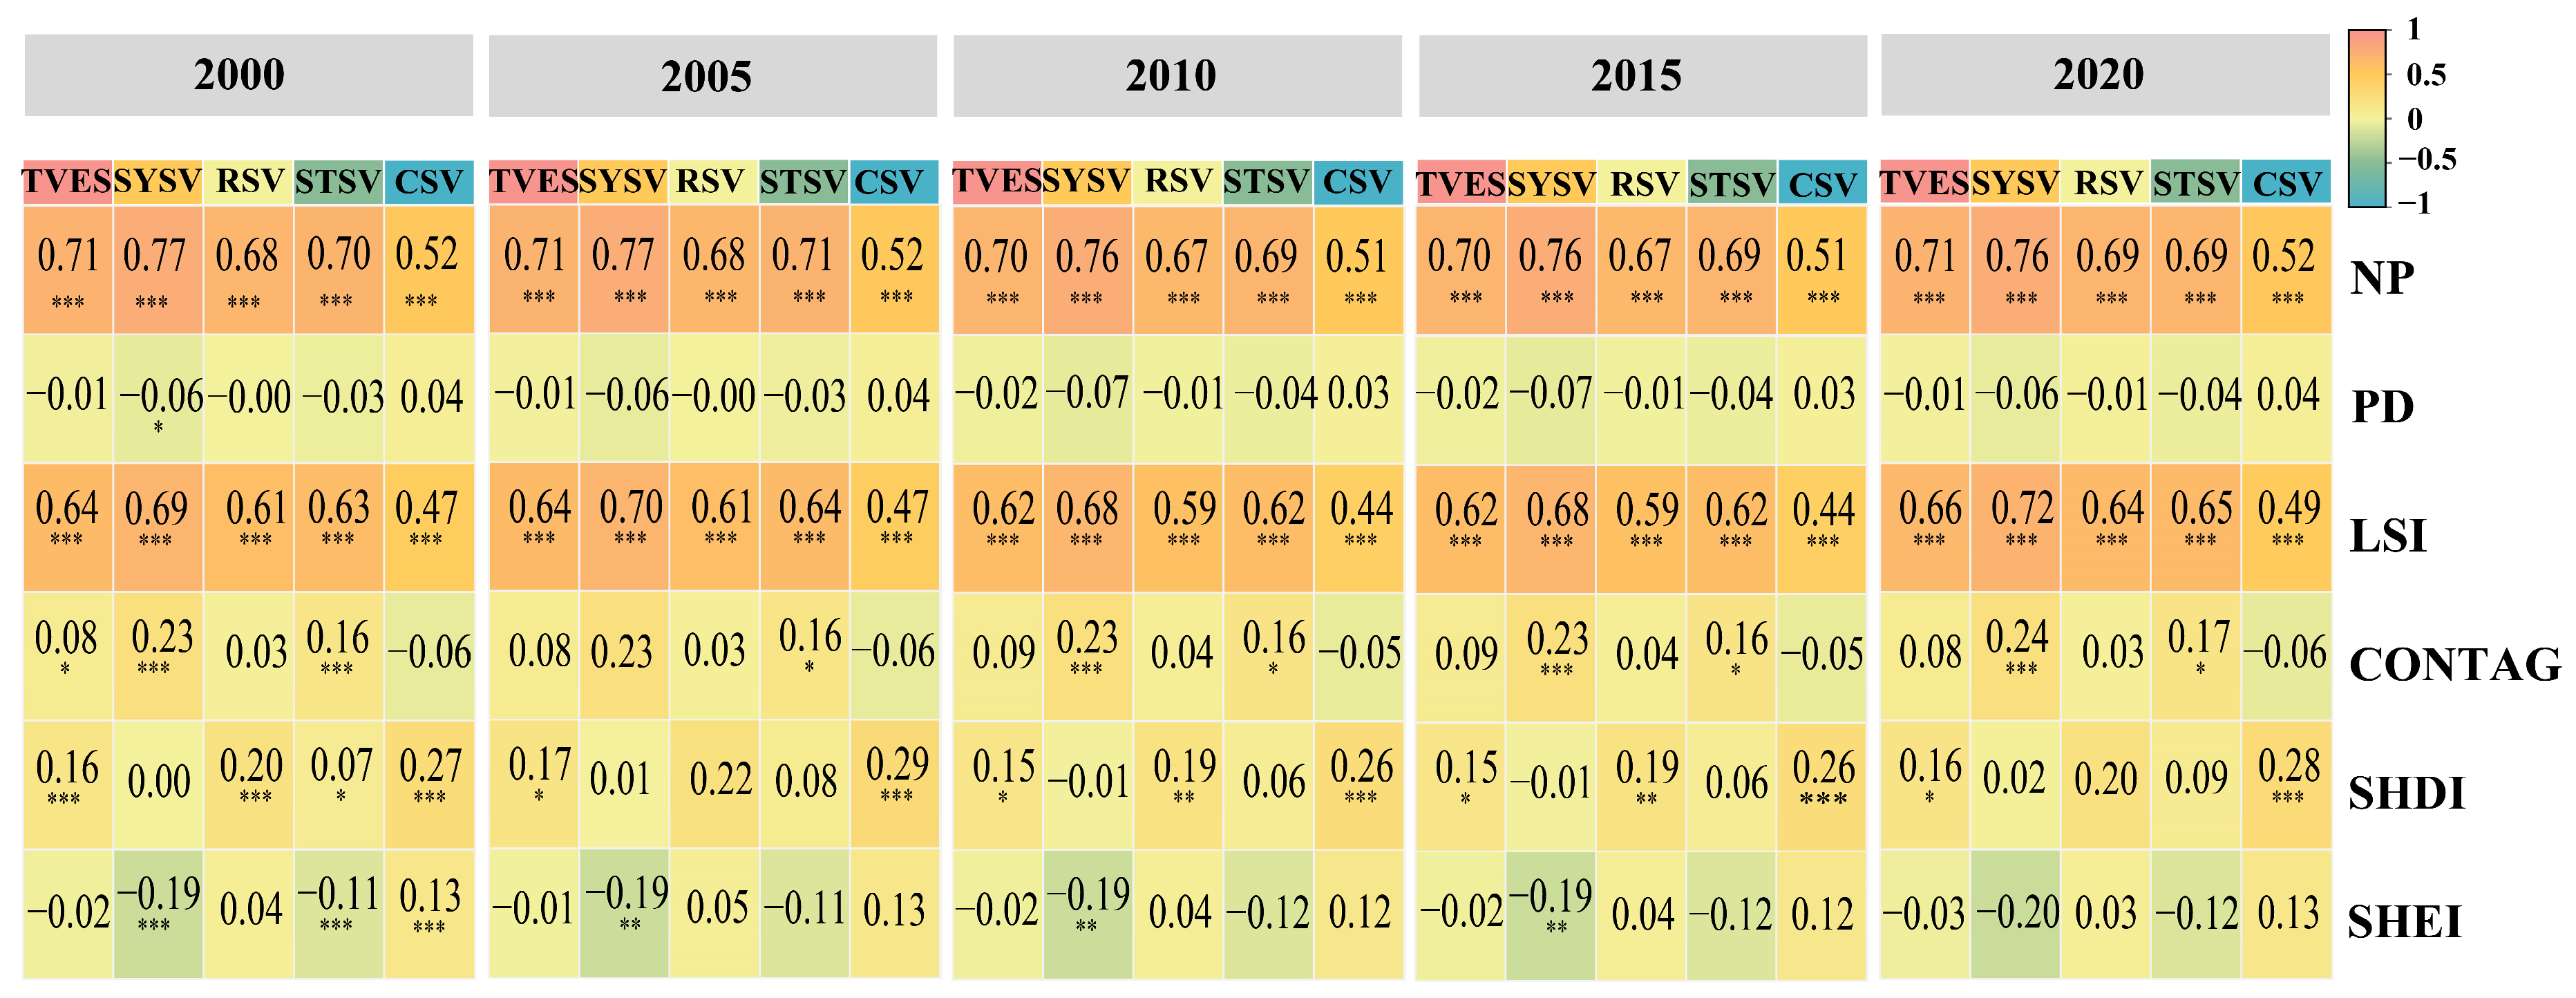
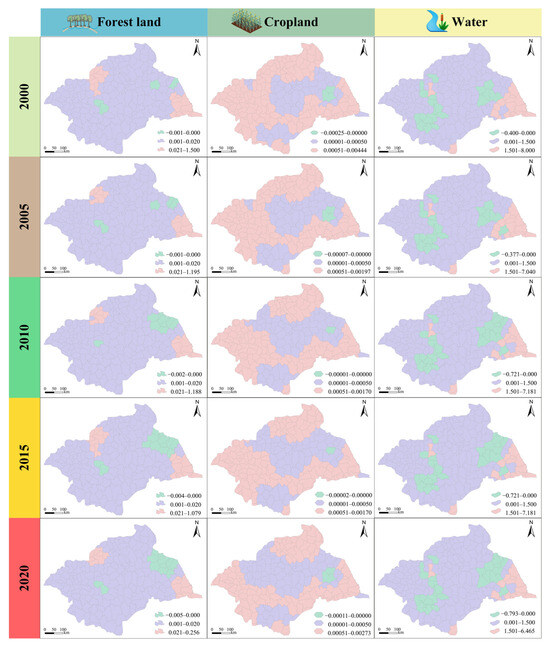
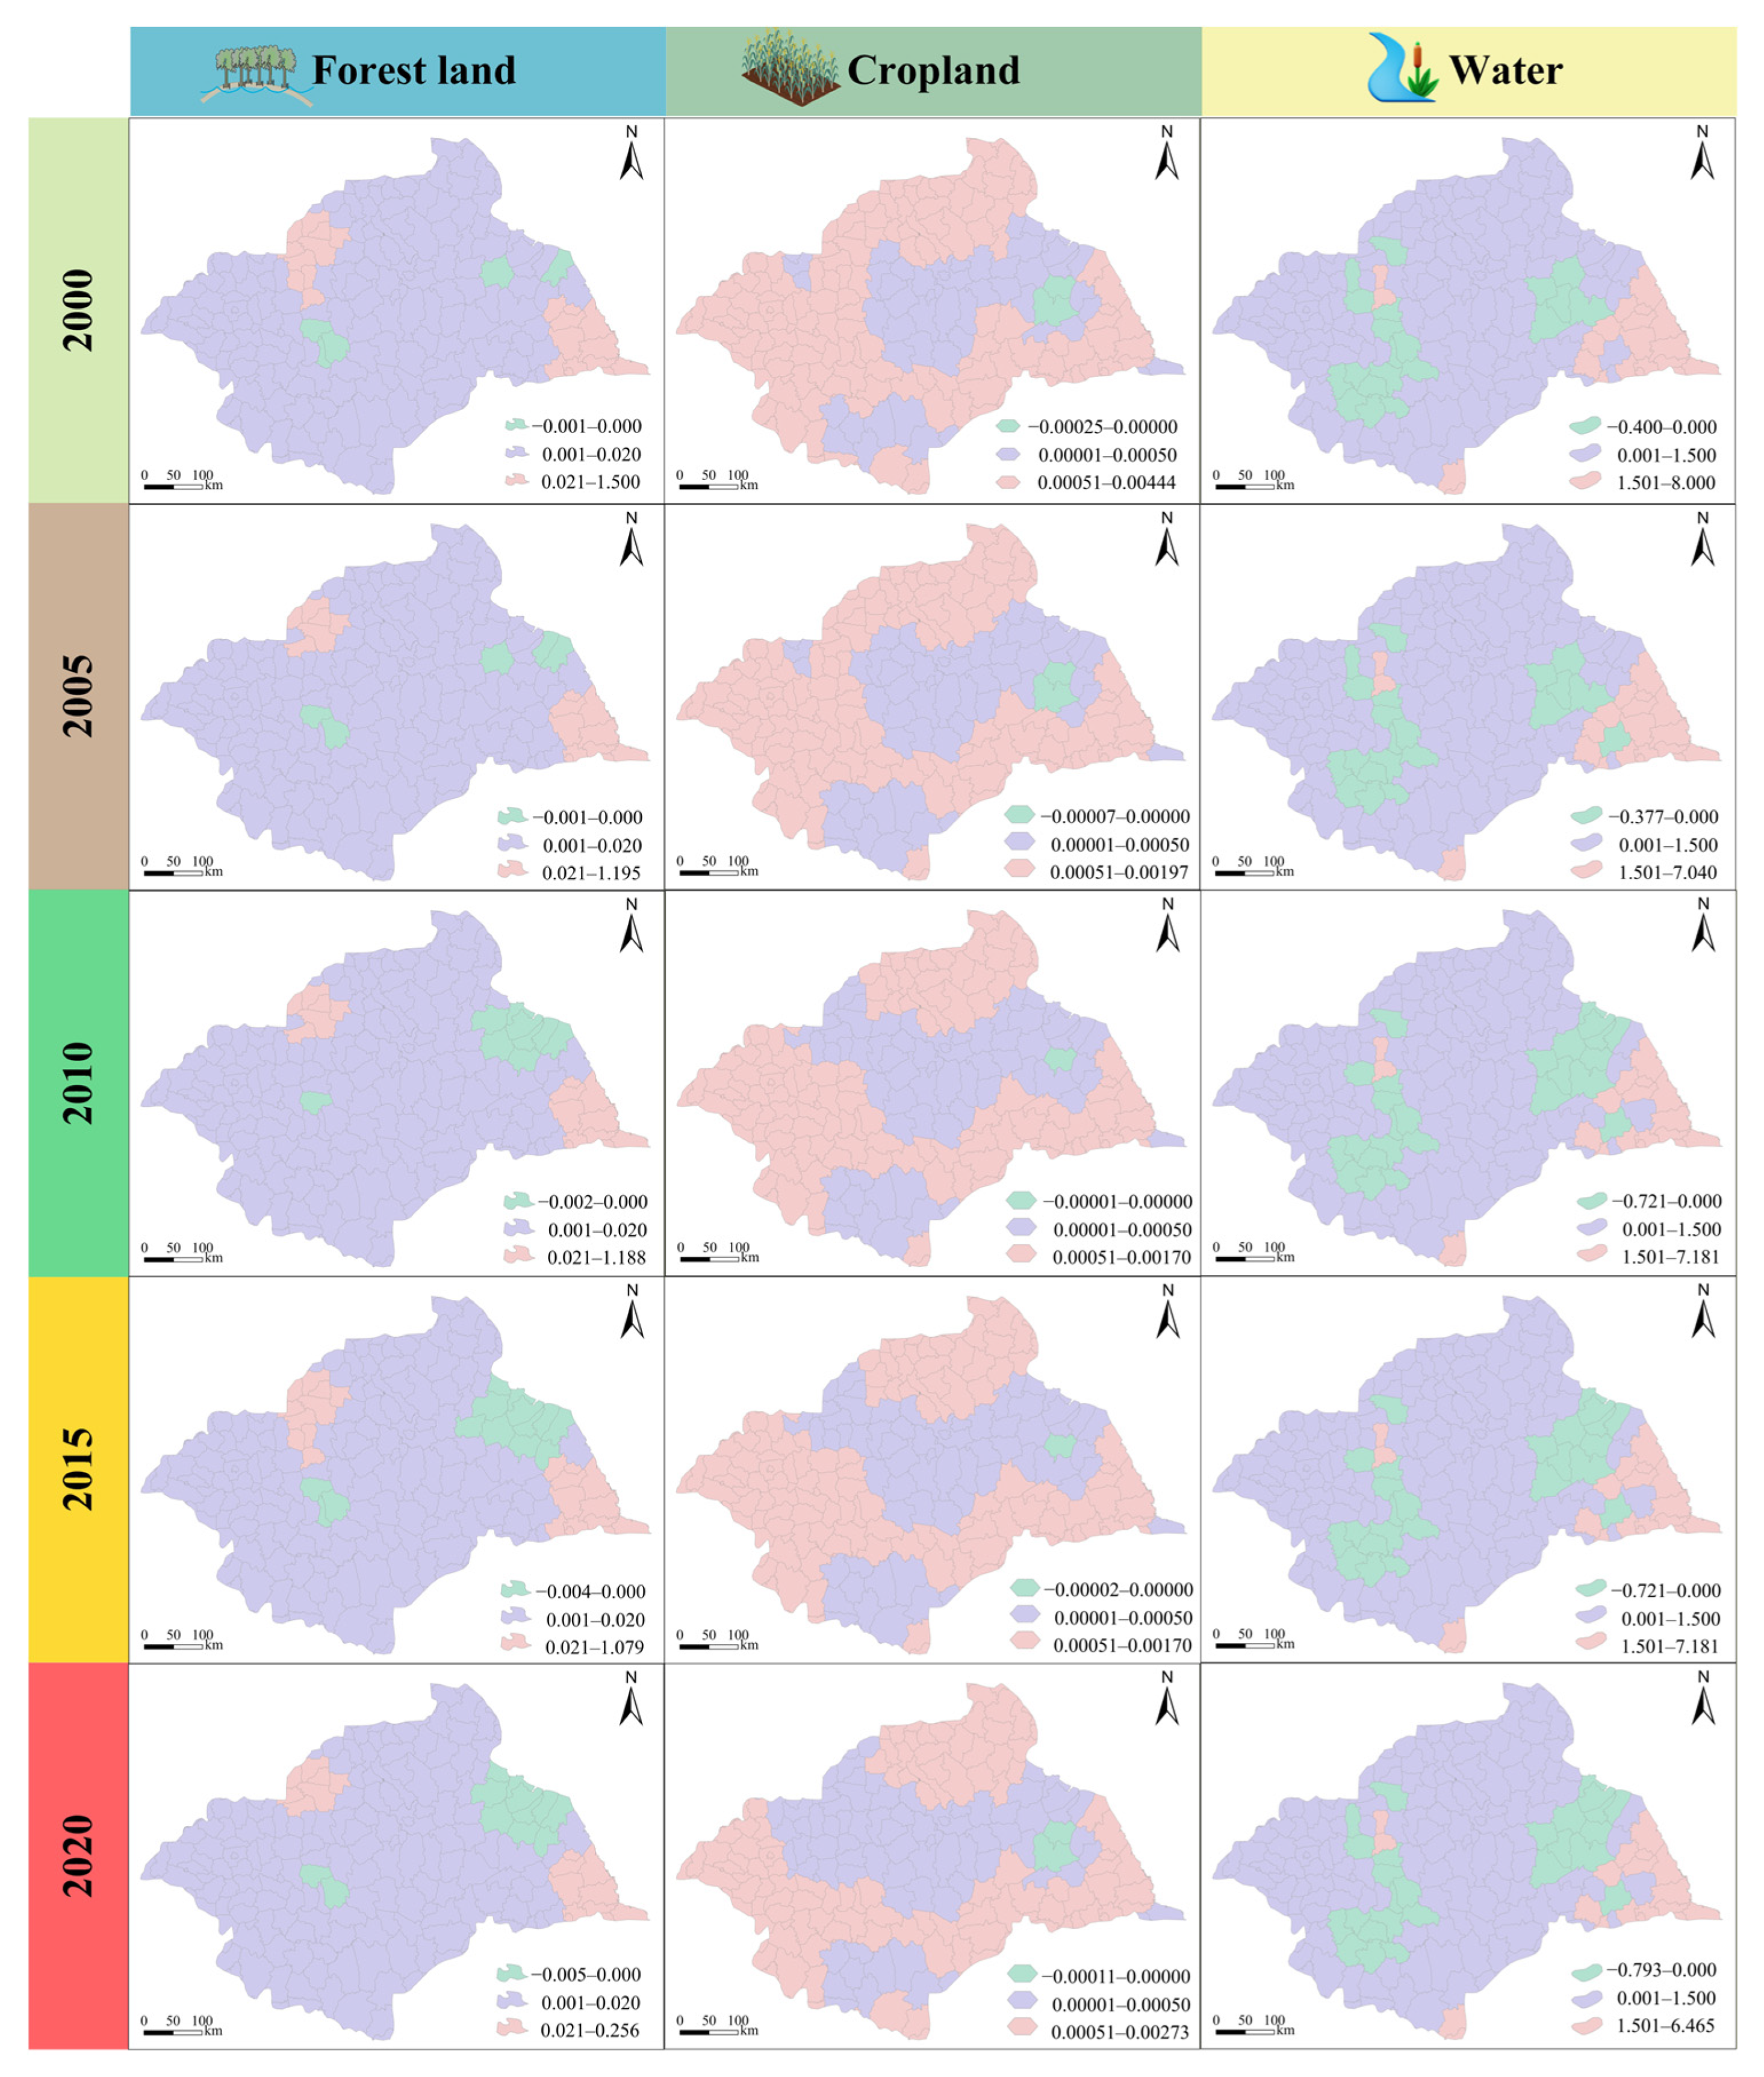
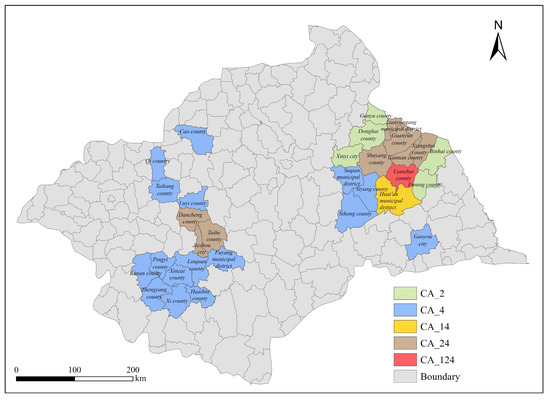
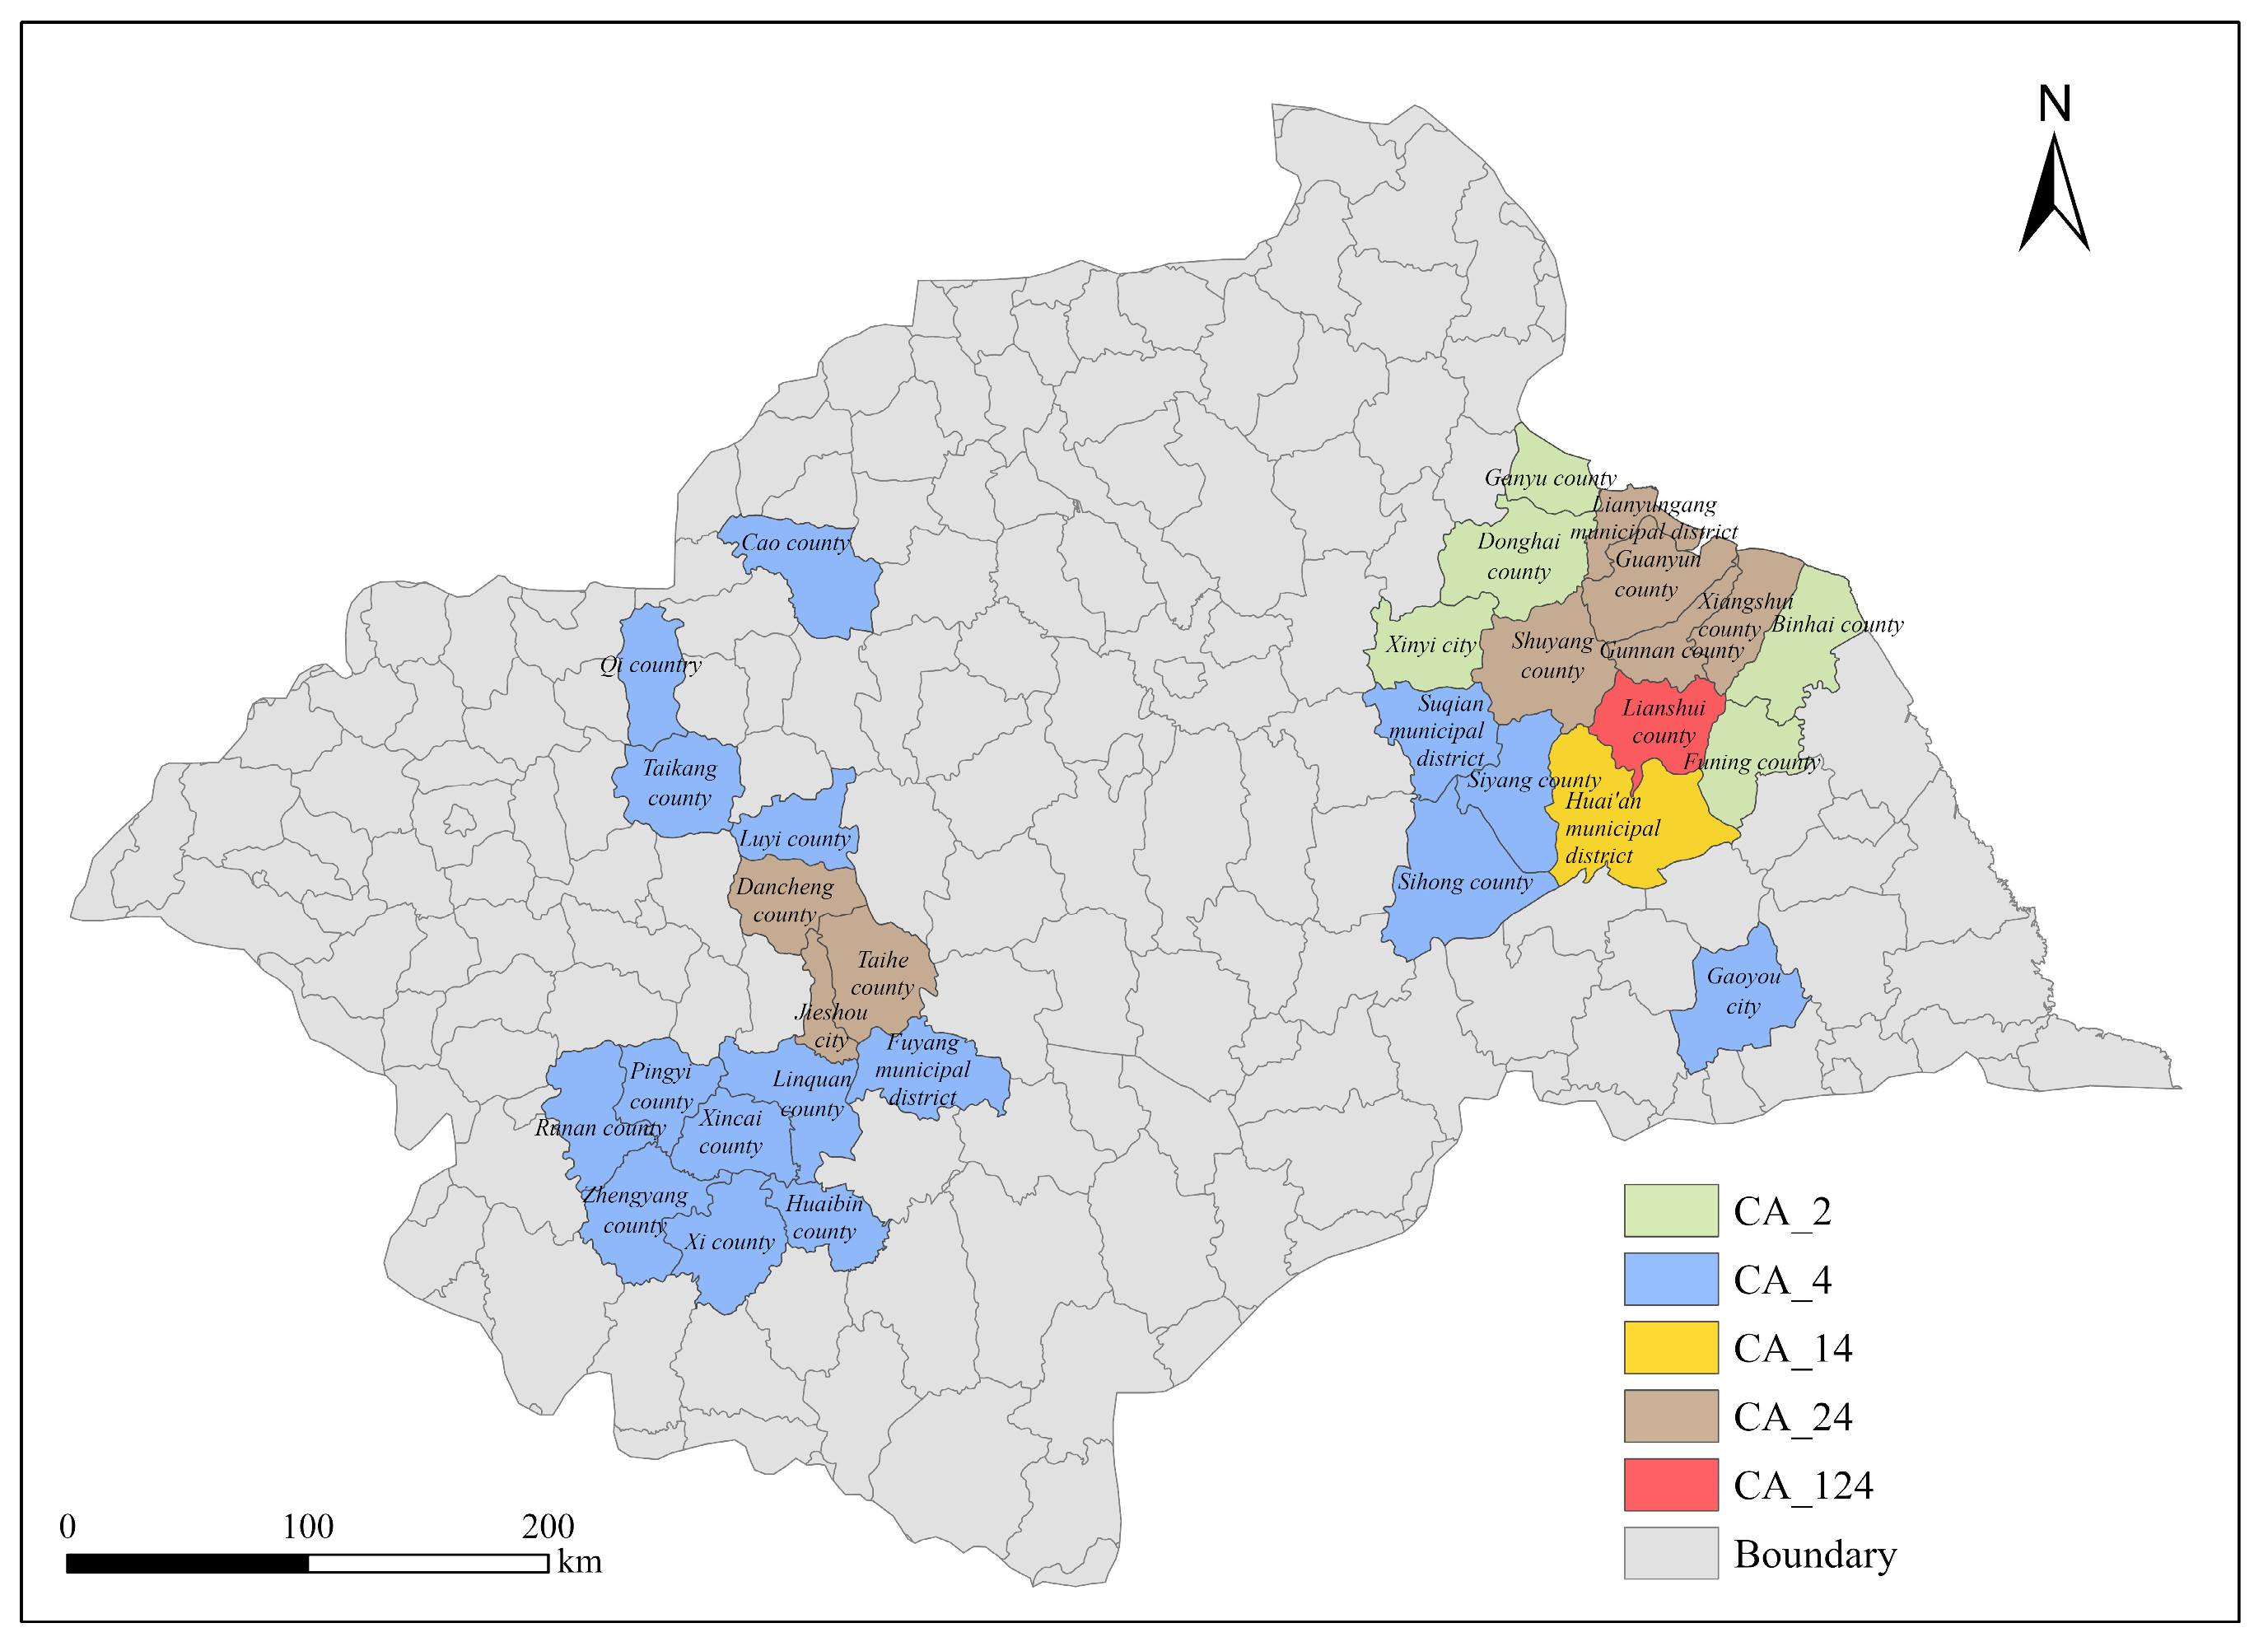

Disclaimer/Publisher’s Note: The statements, opinions and data contained in all publications are solely those of the individual author(s) and contributor(s) and not of MDPI and/or the editor(s). MDPI and/or the editor(s) disclaim responsibility for any injury to people or property resulting from any ideas, methods, instructions or products referred to in the content. |
© 2026 by the authors. Licensee MDPI, Basel, Switzerland. This article is an open access article distributed under the terms and conditions of the Creative Commons Attribution (CC BY) license.