


Abstract
This study provides baseline information for environmental assessment in North Riyadh, Saudi Arabia. It assessed the concentrations of eight heavy metals, namely cobalt (Co), chromium (Cr), copper (Cu), iron (Fe), nickel (Ni), lead (Pb), vanadium (V), and zinc (Zn), in 28 surface soil samples collected across the area. Pollution status was evaluated using the contamination factor (CF), geoaccumulation index (Igeo), enrichment factor (EF), pollution load index (PLI), and degree of contamination (DC), while Pearson correlation, principal component analysis (PCA), and standardized hierarchical cluster analysis (HCA) were applied to identify the possible sources of these metals. Iron was the most abundant element (mean 8482.14 mg kg−1), consistent with its role as a major crustal constituent. Co, Cr, Fe, Ni, and V showed low contamination (CF < 1) and a predominantly geogenic origin, reflected in strong inter-element correlations and a dominant rotated principal component explaining 54.8% of the total variance; Cu, Pb, and, in particular, Zn departed from this pattern, loading together on a distinct secondary component (32.1% of variance) and showing localized enrichment at a small number of sites. None of the 28 samples exceeded the pollution threshold for PLI (all < 1) or DC (all < 8), indicating that the soils of North Riyadh remain overall unpolluted with respect to these eight metals. These findings provide an early geochemical baseline for the district and identify Cu–Pb–Zn enrichment near construction and traffic corridors.
1. Introduction
The long-term persistence of heavy metals in the environment and the build-up of food chains have rendered heavy metal pollution an ever-increasing, serious global issue [1,2]. Heavy metals (HMs) are metallic elements with an atomic number above 20 and a density of more than 5 g/cm3 [3,4,5]. These elements are present naturally in soil in small amounts, but many of them serve as essential micronutrients that are vital for plants, animals, and human beings [6,7]. In suitable amounts, they offer benefits such as improved nutrition, healthy development, and increased crop production [8,9]. On the other hand, excessive amounts of these microelements can adversely affect plant development, leading to oxidative stress and interference with enzymes that weaken plant cells [10,11]. Similar dynamics have been documented outside the Arabian Peninsula: multivariate source-apportionment models applied to urban soils elsewhere have consistently separated a dominant lithogenic component from smaller anthropogenic contributions tied to traffic and industry [12,13].
The most recognized of these include cadmium (Cd), chromium (Cr), copper (Cu), iron (Fe), lead (Pb), nickel (Ni), selenium (Se), and zinc (Zn) [14]. High HM contents in soil may result from lithogenic (natural) or anthropogenic sources [6]. The Kingdom of Saudi Arabia is mostly covered by desert landscapes and has a hot, arid climate, including some of the highest average summer maximum temperatures in the world [15]. Environmental scientists have developed a number of quantitative pollution indices and statistical tools to accurately determine the extent and origin of HM contamination. The most commonly used indices are the Contamination Factor (CF), the Geoaccumulation Index (Igeo), the Enrichment Factor (EF, which separates natural from anthropogenic sources using a reference element such as Fe), the Pollution Load Index (PLI), and the Degree of Contamination (DC) [16,17,18,19,20,21,22,23]. Moreover, other techniques such as Hierarchical Cluster Analysis (HCA) and Principal Component Analysis (PCA) can be used to identify possible sources of heavy metal contamination [24,25,26,27,28,29,30,31]. A prerequisite for the assessment of soil contamination by heavy metals, particularly for large multivariate datasets, is a detailed understanding of inter-element relationships. PCA is a robust statistical method for reducing the dimensionality of data, as some factors may have a disproportionate effect on pollution patterns [32]. The method generates a small number of significant components that explain most of the overall variance, allowing the interpretation of the underlying geochemical relationships and likely sources of contamination [33,34]. PCA also has the advantage of being able to handle large datasets without limitation on the number of variables or samples [35,36,37,38]. It has been widely used to identify possible sources of soil heavy metal contamination, distinguish between industrial, agricultural, and other anthropogenic inputs, and estimate the relative contribution of individual metals to the overall contamination signature [39,40].
Previous heavy-metal surveys in Riyadh have focused on the industrial districts to the south and the agricultural palm farms of the northwest (Al-Ammariah region) [15,41]. These are different land-use settings from North Riyadh, which is presently the city’s fastest-growing residential and infrastructure frontier, encompassing large-scale road building and new residential districts such as An Narjis, Al Yasmin, and Al Qirawan, yet no baseline soil geochemical dataset exists for this specific sector. This gap matters because construction- and traffic-related inputs, if present, would be expected to leave a different geochemical signature than the industrial or agricultural sources characterized elsewhere in the city.
This study addresses that gap by reporting the first geochemical baseline for eight heavy metals (Co, Cr, Cu, Fe, Ni, Pb, V, and Zn) in the surface soils of North Riyadh, with a specific focus on construction- and traffic-related inputs in an arid urban setting. Rather than relying on a single pollution metric, we combine the standard contamination indices with multivariate statistics (PCA with varimax rotation, HCA, and Pearson correlation) to separate natural from anthropogenic contributions. Taken together, the quantitative thresholds and the source-apportionment evidence presented here indicate that the current pace of urban sprawl has not yet substantially altered the natural geochemistry of these soils, providing both a reference point and a practical monitoring tool as Riyadh continues to expand northwards.
The results of this research are anticipated to add to the scientific knowledge of heavy metal dynamics in arid urban soils and support evidence-based policy making based on several United Nations Sustainable Development Goals (SDGs).
2. Materials and Methods
2.1. Location of Study Area
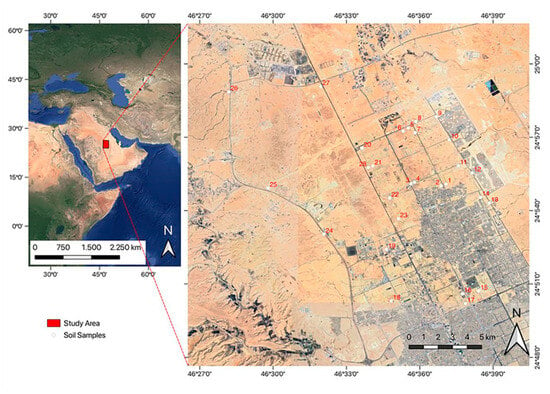
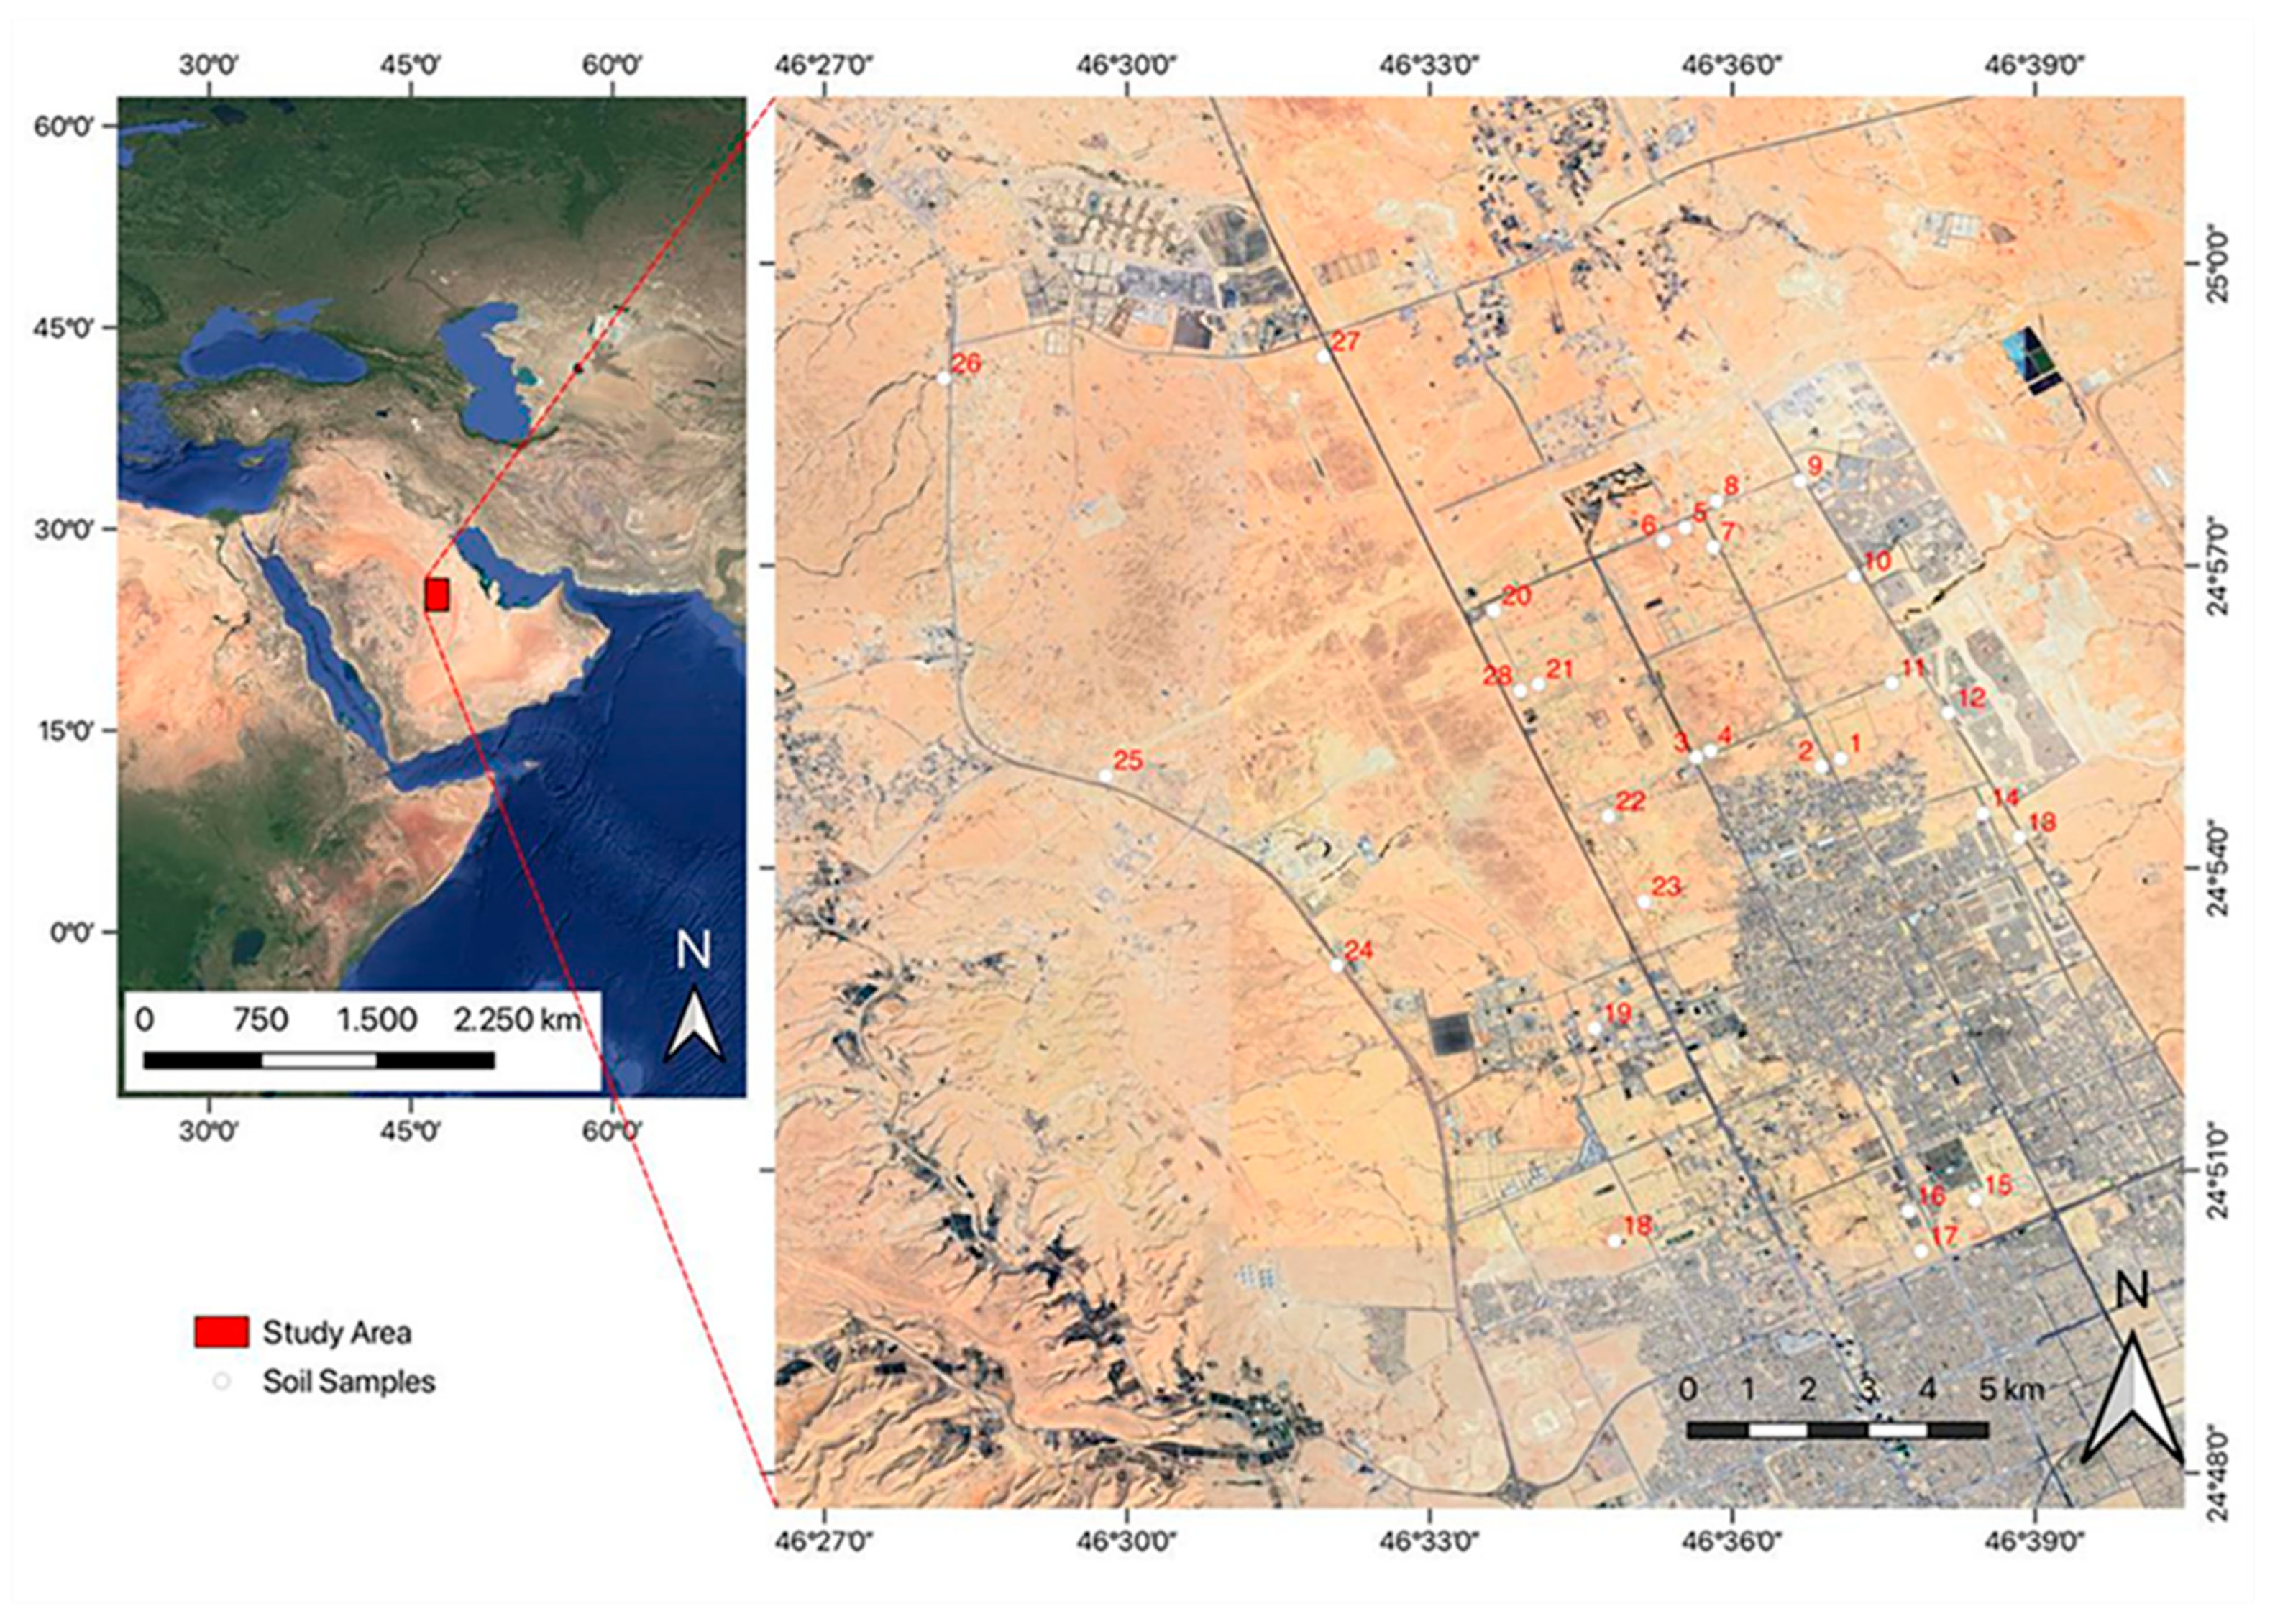
The study area is situated in North Riyadh, the capital city of Saudi Arabia, at the following coordinates: latitude 24°50′ N–24°59′ N and longitude 46°29′ E–46°38′ E (Figure 1). Individual GPS coordinates for all 28 sampling sites are provided in Supplementary Table S8. Riyadh has a hot and arid climate with the highest average maximum temperatures occurring in summer [42,43]. The area is characterized by large desert expanses, severe climatic conditions, high traffic, and the presence of industrial activities. The study area is covered by Upper Jurassic marine carbonate rocks and siliciclastic rocks of the Hanifa and Jubaila formations, together with a thick Quaternary sediment cover [44,45,46,47,48,49,50]. The Hanifa Formation disconformably overlies the Tuwaiq Mountain Formation and is composed of muddy carbonates in its lower part, overlain by lagoonal carbonate deposits [48]. The Jubaila Formation overlies the Hanifa Formation and is likewise separated from it by a disconformity; its lower part consists of marine carbonates deposited in moderately deep water, and its upper part of shallow-water assemblages associated with stromatoporoids [51].
Figure 1.
Location and geographical distribution of soil samples within the study area.
2.2. Field Work and Laboratory Analysis
Twenty-eight topsoil samples were collected from North Riyadh, Saudi Arabia (Figure 1). Sampling targeted the 0–5 cm surface horizon rather than the deeper 20–25 cm profile sometimes used in agricultural soil surveys, because in this arid, sparsely vegetated urban setting, there is negligible organic topsoil to remove and construction- and traffic-related particulates (vehicle exhaust, brake and tyre wear, cement and asphalt dust, and wind-blown material from nearby earthworks) are deposited on and interact primarily with the uppermost few centimeters; a shallow sampling depth therefore maximizes sensitivity to these anthropogenic surface inputs, at the cost of not characterizing the full pedogenic profile. At each site, three sub-samples were collected within a ~5 m radius of the site’s central GPS point (one at the center and two at opposite ends of the radius) and thoroughly homogenized into a single composite sample representing that site, following standard practice for reducing small-scale spatial variability in surface soils. The samples were placed in plastic bags and transported in an ice box. In the laboratory they were air-dried, and after the removal of visible stones and plant residues, the material was lightly ground with an agate mortar and pestle. The ground samples were then sieved into size fractions (>500 μm, 500–250 μm, 250–125 μm, 125–63 μm, and <63 μm), and the <63 μm fraction was retained for elemental analysis. Inductively coupled plasma–atomic emission spectrometry (ICP–AES) was used to determine concentrations of Co, Cr, Cu, Fe, Ni, Pb, V, and Zn at the ALS Geochemistry Laboratory, Jeddah, Saudi Arabia. A 0.50 g aliquot of the <63 μm fraction was digested in a graphite heating block with aqua regia (HNO3–HCl) for 45 min [52]. After digestion, the solution was cooled, diluted to 12.5 mL with deionized water, mixed, and measured by ICP–AES. The method was validated for linearity and limits of detection (LODs) and quantification (LOQs), accuracy, and precision (Tables S1 and S2). Three samples were run in duplicate to confirm analytical precision, a reagent blank was run for background correction, and a certified reference material (CRM) was included in each analytical batch for quality control, in accordance with standard ALS Geochemistry Laboratory procedures.
2.3. Statistical Analysis
Data entry and descriptive statistics (including the mean and standard deviation of each heavy metal) were computed in IBM SPSS version 23 and Python v3.10. Pearson correlation coefficients among the eight heavy metals were calculated in Python v3.10 to test for statistically significant linear associations. To reduce the dimensionality of the data set and aid interpretation, principal component analysis (PCA) with varimax rotation and Kaiser normalization was applied to the elemental concentrations [53]; consistent with standard practice, PCA was performed on the correlation matrix of the eight elements rather than the covariance matrix, which is mathematically equivalent to first standardizing each variable to zero mean and unit variance (z-scores). This prevents Fe, which has a raw concentration roughly two to three orders of magnitude larger than the other elements, from dominating the extracted components. The number of retained factors and the percentage of variance explained were determined from the eigenvalues and eigenvectors of this correlation matrix. PCA is a widely used tool for the source apportionment of heavy metal contamination in soils [54]. Hierarchical cluster analysis (HCA) was performed using average linkage on Euclidean distances calculated from z-score-standardized element concentrations [55,56,57]; on the raw concentration scale, Fe’s much larger absolute values would otherwise dominate the distance metric and drive clustering that reflects total metal loading rather than the relative geochemical signature of each sample. For comparison, HCA was also run on the unstandardized (raw) concentrations; the resulting cluster structure and its implications are discussed in Section 3.5.
2.4. Assessing of the Contamination Levels
For assessing the contamination of soil samples under consideration by heavy metals using a background condition reference [58,59,60], this work employed several indices, including the enrichment factor (EF) [18], the geoaccumulation index (Igeo) [16], the contamination factor (CF) [17], the pollution load index (PLI) [60], and the degree of contamination (DC) [16]. For the determination of the background values, the concentrations reported by Turekian and Wedepohl [61] for average shale were used. The geochemical background baseline for the present study was established using the Average Shale values of Turekian and Wedepohl [61]. North Riyadh is characterized by a mixed carbonate–siliciclastic system of the Upper Jurassic Hanifa and Jubaila formations over a thick cover of weathered Quaternary sediments [62,63]. Trace metals are naturally low in pure marine carbonate matrices and the trace element budget in such environments is dominated almost entirely by the interbedded argillaceous mudstones, clays and detrital siliciclastic fractions [64]. Average shale is a good mineralogical proxy for these fine-grained sedimentary components and shows well the geochemical concentration effects from surface weathering and sediment sorting [65]. Furthermore, because shales maintain a naturally elevated baseline budget for transition metals relative to bulk crustal averages, this standard establishes a mathematically conservative threshold for environmental indices [16]. Hence, the elemental enrichment detected can be confidently ascribed to anthropogenic pollution as opposed to natural lithogenic variations [66]. The classification criteria for these indices are shown in Supplementary Tables S3–S7, and their calculation Equations (1)–(5) are given below:
In the equations above, Cn is the concentration of element n measured in the soil sample, and Bn is its background (reference) concentration [61]. For EF, CFe and BFe are the measured and background concentrations of iron, respectively, used as the conservative reference element for normalization. In the Igeo equation, the constant 1.5 is a correction factor that accounts for natural lithogenic variability in background values [16].
3. Results and Discussion
3.1. Heavy Metal Distribution Within the Study Area
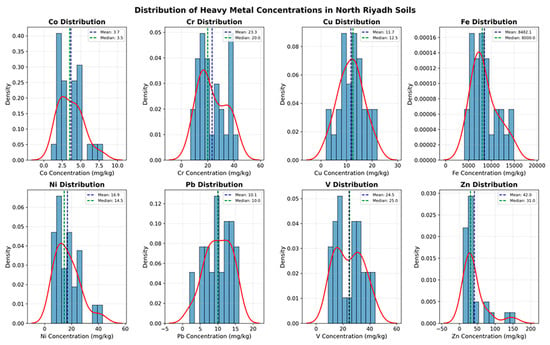
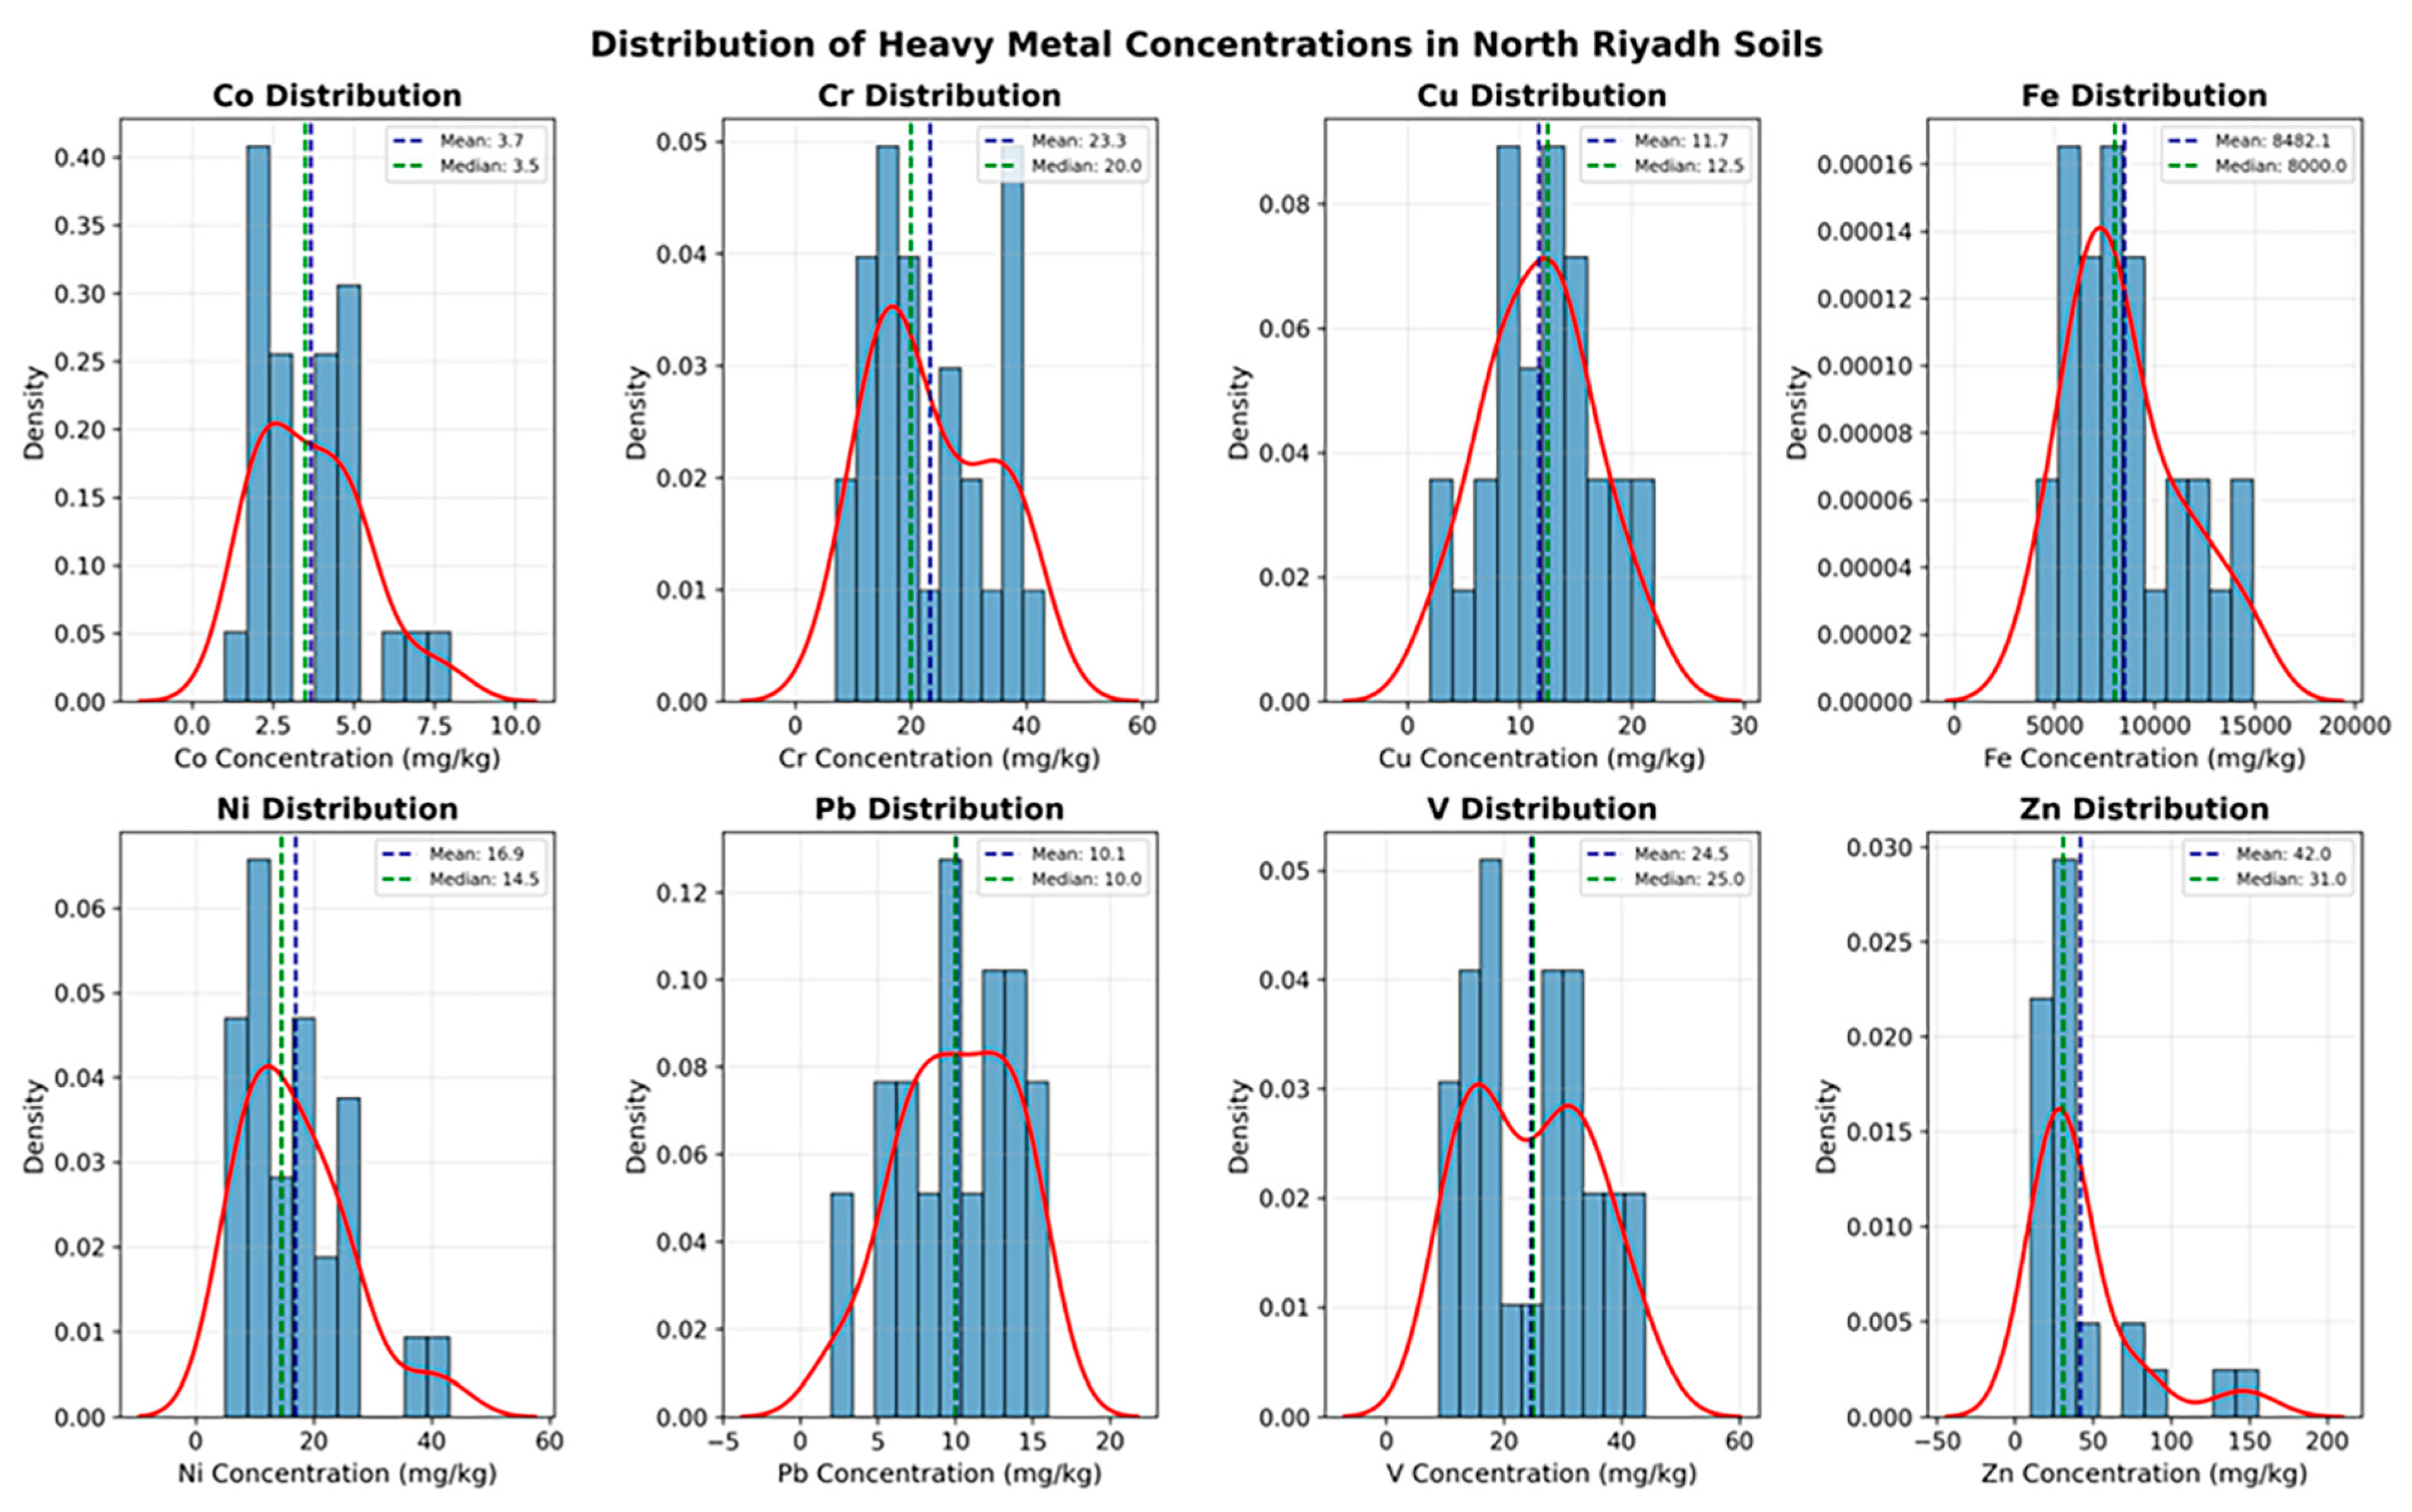
The descriptive statistics for all eight elements are presented in Table 1. Iron was the dominant element by a wide margin, averaging 8482.14 mg kg−1 and ranging from 4100 to 14,900 mg kg−1, consistent with its role as a major crustal constituent rather than a pollutant in the usual sense [15,61,67]. Zinc followed with a mean of 41.96 mg kg−1, but its range (10–156 mg kg−1) was the widest of the eight metals, and its coefficient of variation (CV = 82.6%) was more than double that of any other element. Nickel was the next most variable metal (CV = 55.5%), while Co, Cr, Cu, Pb, and V showed comparable, moderate dispersion (CV = 37–46%). Iron, by contrast, had the most stable distribution of all (CV = 34.1%). The mean Co, Cr, Cu, and V concentrations obtained (3.68, 23.29, 11.68, and 24.54 mg kg−1, respectively) are almost similar to those recorded by Alarifi et al. [41] in the palm farms of northwest Riyadh (3.89, 19.97, 11.36, and 18.94 mg kg−1) and Alharbi et al. [7] in the Al-Jilah soils west of the city (6.44, 28.61, and 11.44 mg kg−1, for Co, Cr, and Cu, respectively), though the two comparison studies differ from the present one in land-use type.
Table 1.
Descriptive statistics of heavy metal concentrations (mg kg−1) in the 28 soil samples from North Riyadh, Saudi Arabia.
The concentrations of Ni (16.89 mg kg−1) and Pb (10.07 mg kg−1) found in this study were also fairly similar to, if slightly smaller than, those found in Al Majma’ah agricultural soils farther to the north (31.11 and 6.47 mg kg−1, respectively; [22]). The similarity between these two studies, which differed in land use, sampling year, and precise location but shared the same arid central Arabian geological setting, suggests that the same lithogenic factor is the main source of the metals found there. A broadly similar pattern, with Ni and Pb concentrations tracking natural background levels more closely than traffic-related inputs, was reported for roadside soils sampled across several Chinese cities [68].
Zinc stands apart from the other seven metals on several independent lines of evidence from this data set: it has the widest concentration range (10–156 mg kg−1) and, at CV = 82.6%, more than double the coefficient of variation for any other element (Table 1); its correlation with Fe (r = 0.46, p < 0.05) is the weakest of the eight metal–Fe pairs (Section 3.3); and, as shown below, it has the weakest loading of all eight metals on the dominant geogenic PC1, while contributing one of the two largest loadings (alongside Pb) on the secondary PC2 (Section 3.4). Two comparatively elevated samples (S1 and S10) drive both its long right-hand tail (Figure 2) and its status as the only metal to exceed the moderate-contamination CF threshold at any site (Section 3.6.1). This pattern is broadly consistent with regional comparisons, the present mean of 41.96 mg kg−1 sits within the range reported for Al-Jilah (30.11 mg kg−1; Alharbi [69] et al.) but well below the more heavily fertilized palm-farm soils of Al-Ammariah (52.16 mg kg−1; [41]), which is consistent with Zn inputs linked to land management (e.g., Zn-based fertilizers and amendments) rather than the shared parent-material signal that dominates the other elements.
Figure 2.
Frequency distribution of Co, Cr, Cu, Fe, Ni, Pb, V, and Zn concentrations (mg kg−1) in the soil samples, with mean and median values indicated.
Metals controlled mainly by natural weathering tend to vary together within a fairly narrow band, whereas metals influenced by localized inputs tend to show sharper, more erratic spikes [61]. The unusually high variability in Zn documented above is therefore consistent with a partly non-geogenic origin for this element, a possibility examined more closely through the correlation, multivariate, and pollution-index results presented below. The frequency distributions of all eight metals are illustrated in Figure 2; most elements approximated a moderately right-skewed, unimodal pattern, whereas Zn displayed a markedly longer right tail driven by the same two elevated samples. Multivariate discrimination between geogenic and anthropogenic contributions has proven useful in other industrialized urban settings as well, where similar clustering of lithophile elements was observed [70,71].
3.2. Appropriateness of Dataset for PCA
The appropriateness of the dataset for factor extraction was first assessed using the Kaiser–Meyer–Olkin (KMO) statistic and Bartlett’s test of sphericity. The KMO statistic of 0.728 exceeds the threshold of 0.60 usually required for principal component analysis [72], and Bartlett’s test yielded a highly significant result (Approx. Chi-Square = 305.223, df = 28, p < 0.001; Table 2). Both tests indicate that the correlation matrix is sufficiently different from the identity matrix to justify dimension reduction.
Table 2.
Kaiser–Meyer–Olkin (KMO) measure of sampling adequacy and Bartlett’s test of sphericity.
To complement this univariate description, the dataset was further examined using Pearson correlation analysis together with two multivariate techniques, principal component analysis (PCA) and hierarchical cluster analysis (HCA), both of which are widely applied to disentangle natural from anthropogenic contributions to soil metal content [15,56,73,74]. Spatial–PCA frameworks that combine ordinary multivariate analysis with geostatistical interpolation have recently been proposed to sharpen this natural-versus-anthropogenic distinction at the sub-city scale [75,76].
3.3. Pearson Correlation Matrix of the Studied Heavy Metals
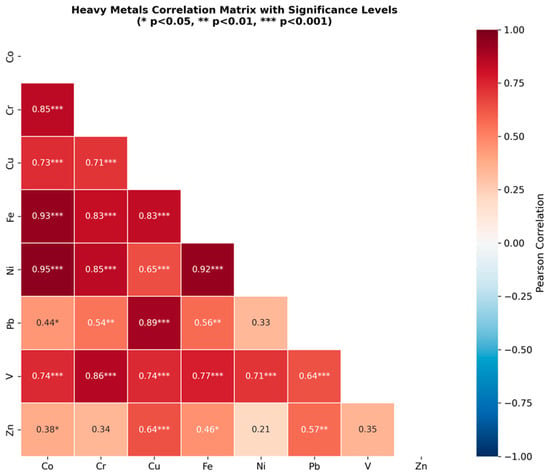
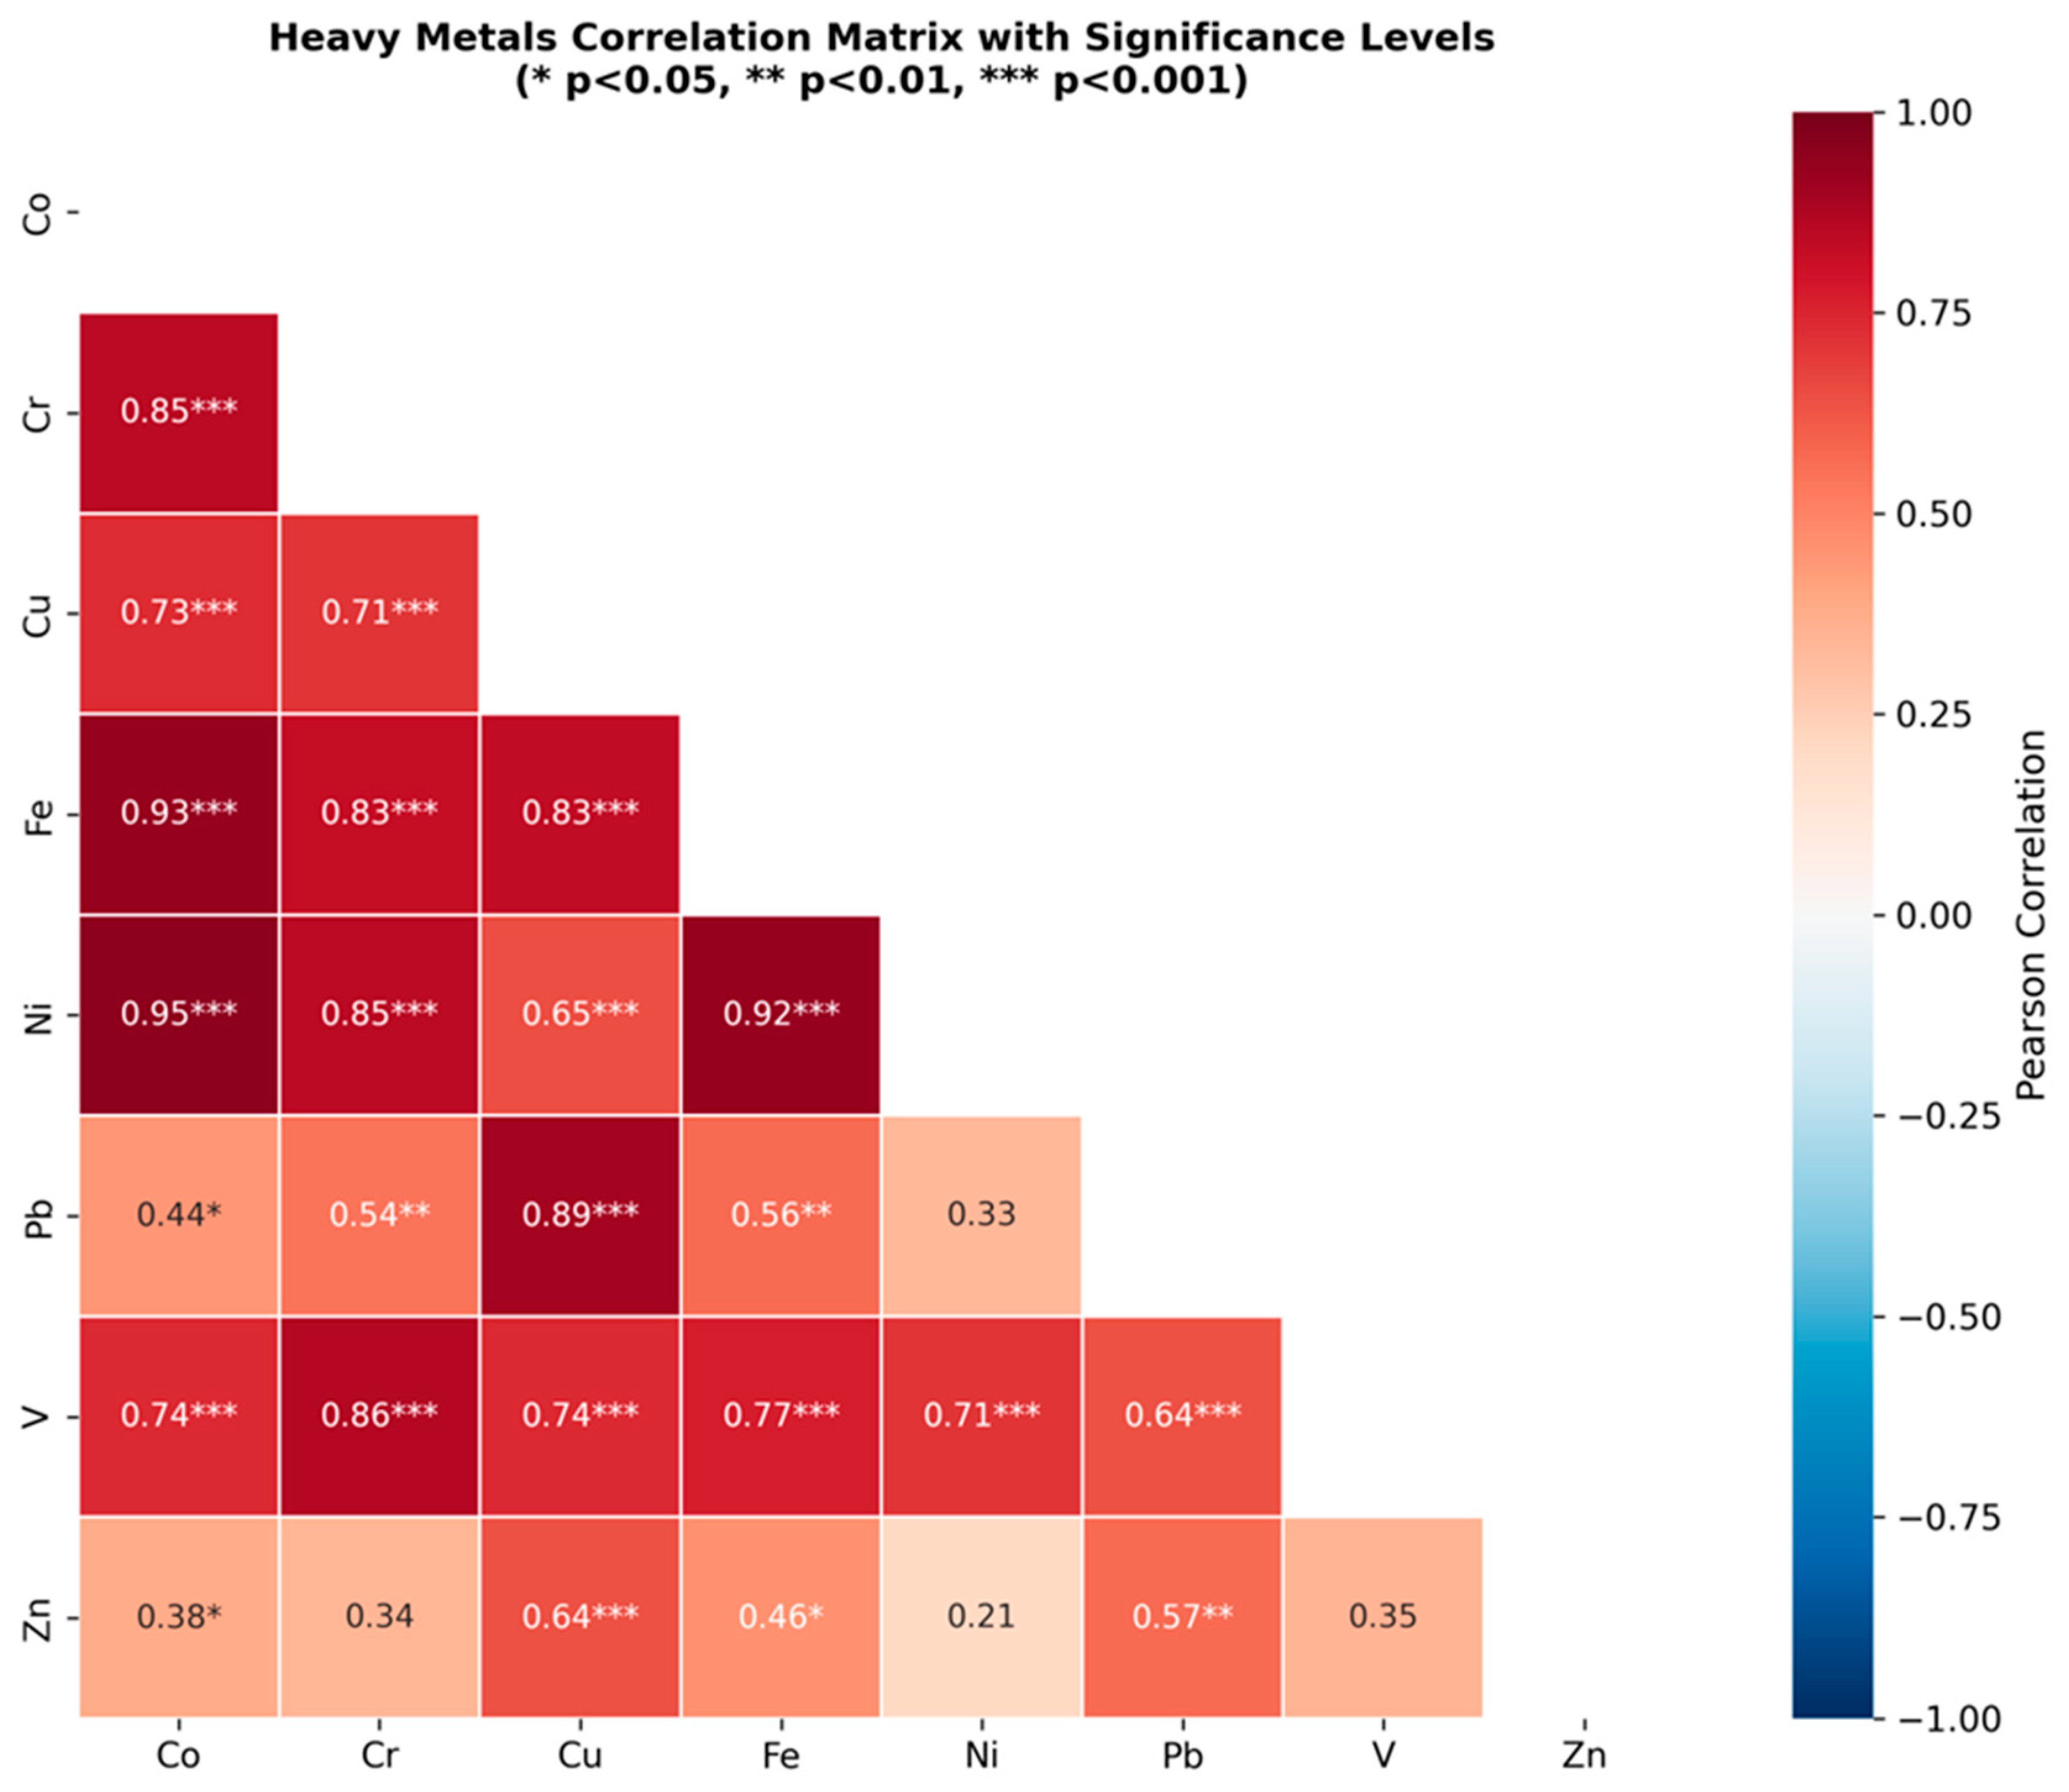
Pearson’s correlation coefficient was used to determine the linear correlations among the tested heavy metals (Figure 3). This statistical measure is one of the most extensively used methods in the natural sciences for the evaluation of the strength and direction of relationships between variables [77]. The analysis showed significant correlations at p < 0.05 and very significant correlations at p < 0.01 between several pairs of metals showing strong inter-element interactions.
Figure 3.
Pearson correlation matrix of the eight heavy metals, with asterisks denoting significance levels (* p < 0.05, ** p < 0.01, *** p < 0.001).
The majority of pairs showed a significant positive correlation, but the strength of the relationships varied greatly across the data set. A tight cluster consisted of Co, Cr, Fe, Ni, and V, with coefficients mostly greater than 0.74 and as high as 0.95 between Co and Ni (p < 0.001). Fe is commonly used as a proxy for the lithogenic, or crustal, fraction of soil [18]. The strong correlation of Co, Cr, Ni and V with Fe (r = 0.93, 0.83, 0.92 and 0.77, respectively; all p < 0.001) indicates that these four elements are mainly controlled by the natural mineralogical composition of the parent material, rather than by external inputs [56,78]. Copper behaved somewhat differently: although it correlated significantly with the Fe-associated group, its single strongest relationship in the entire matrix was with Pb (r = 0.89, p < 0.001), suggesting that Cu and Pb share an additional source on top of their common geogenic background. Zinc was the clear outlier. It correlated only weakly, and in several cases non-significantly, with the other seven metals (r = 0.21–0.64), including a comparatively weak link with Fe itself (r = 0.46, p < 0.05). Taking into consideration the high coefficient of variation observed previously, such observations suggest that Zn has a unique source independent from the major crustal one which influences the majority of other elements.
3.4. Principal Component Analysis (PCA) for the Eight Heavy Metals
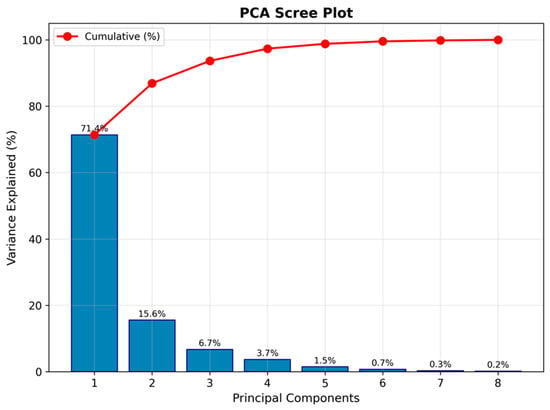
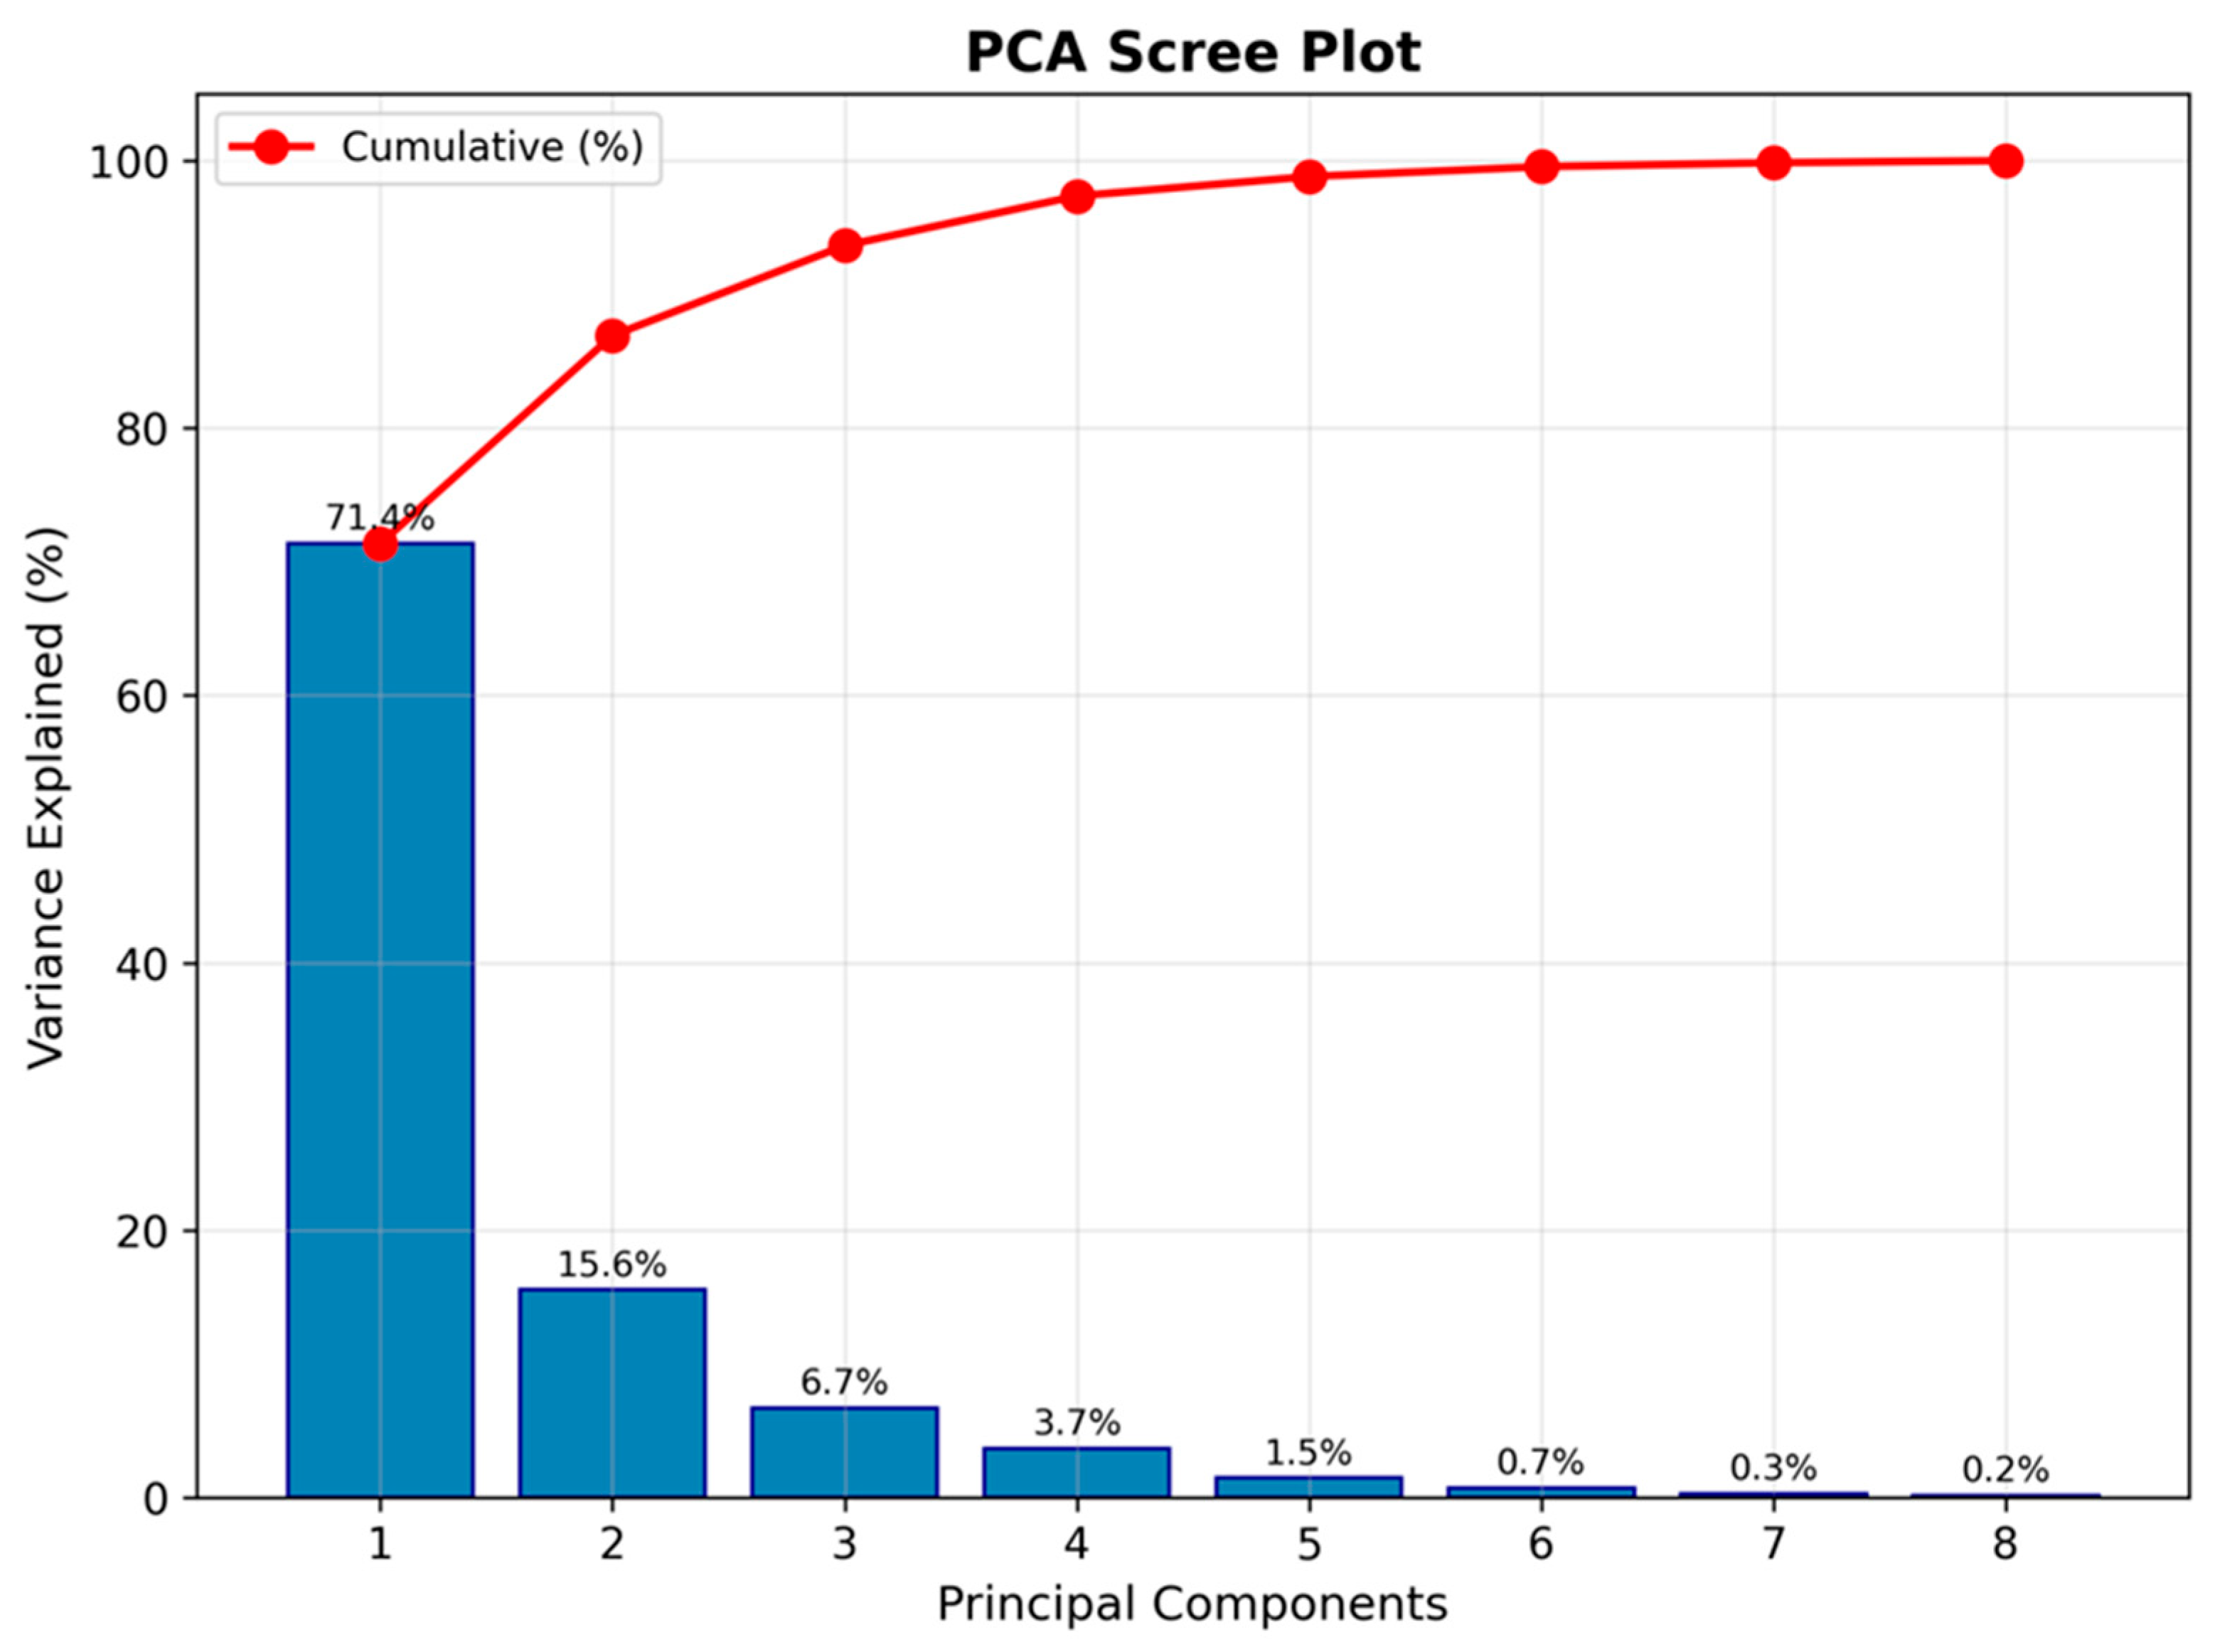
Two principal components with eigenvalues above one were identified (Figure 4), together accounting for 87.0% of the total variance in the data set (71.4% for the first unrotated component and 15.6% for the second, before rotation; these unrotated eigenvalues are what determine how many components are retained). After varimax rotation, which redistributes variance across the retained components while preserving each variable’s total communality, the same two components explain 54.8% (rotated PC1) and 32.1% (rotated PC2) of the total variance, respectively (Table 3). Rotated PC1 loaded strongly on Ni (0.977), Co (0.925), Cr (0.882), Fe (0.879), and V (0.769), and is best interpreted as a single dominant geogenic factor, reflecting the natural mineralogical inheritance of these soils from the surrounding carbonate bedrock and from aeolian dust, both characteristic of the arid environment of Riyadh [15]. Rotated PC2 loaded strongly on Pb (0.869), Zn (0.847), and, notably, Cu (0.775), cleanly separating this three-metal group from the Fe-associated geogenic factor. This is a stronger and more clearly defined secondary factor than a modest two-metal pairing would be: it explains nearly a third of total variance, and its loadings are comparable in strength to those on PC1. We interpret rotated PC2 as reflecting an incipient, spatially localized anthropogenic contribution superimposed on the dominant lithogenic background, consistent with three independent lines of evidence: the same Cu–Pb pairing recurs in the raw Pearson correlations as the single strongest bond in the entire matrix (Section 3.3, r = 0.89); the samples that define the smaller, higher-pollution HCA cluster (Section 3.5) are the same ones driving the elevated Zn and Pb pollution indices; and locally elevated CF/EF values for Zn and Pb (Section 3.6.1) coincide with these same sites. The inclusion of Cu alongside Pb and Zn on this factor is also consistent with previous work in Saudi soils linking Cu, Pb, and Zn jointly to traffic- and construction-related inputs [63,78]. The dominance of a clear geogenic factor mirrors enrichment-factor evidence from other Gulf industrial corridors, where the crustal signal likewise outweighed localized anthropogenic loading except at a few discrete hotspots [79].
Figure 4.
Scree plot showing the percentage of variance explained by each of the eight extracted components.
Table 3.
Rotated component matrix of the principal component analysis (varimax rotation with Kaiser normalization) for the eight heavy metals; loadings are for the two retained components after rotation.
The sharp decline following the second component proves that two factors suffice in capturing the majority of the variation present in the data, while the other six factors contribute less than 13% of the total variation (Figure 4).
3.5. Hierarchical Cluster Analysis
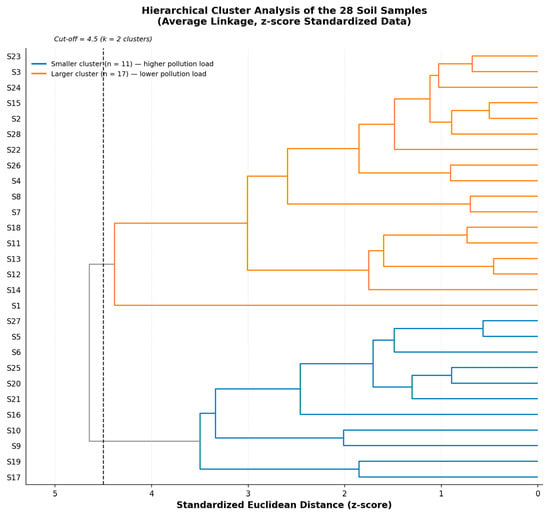
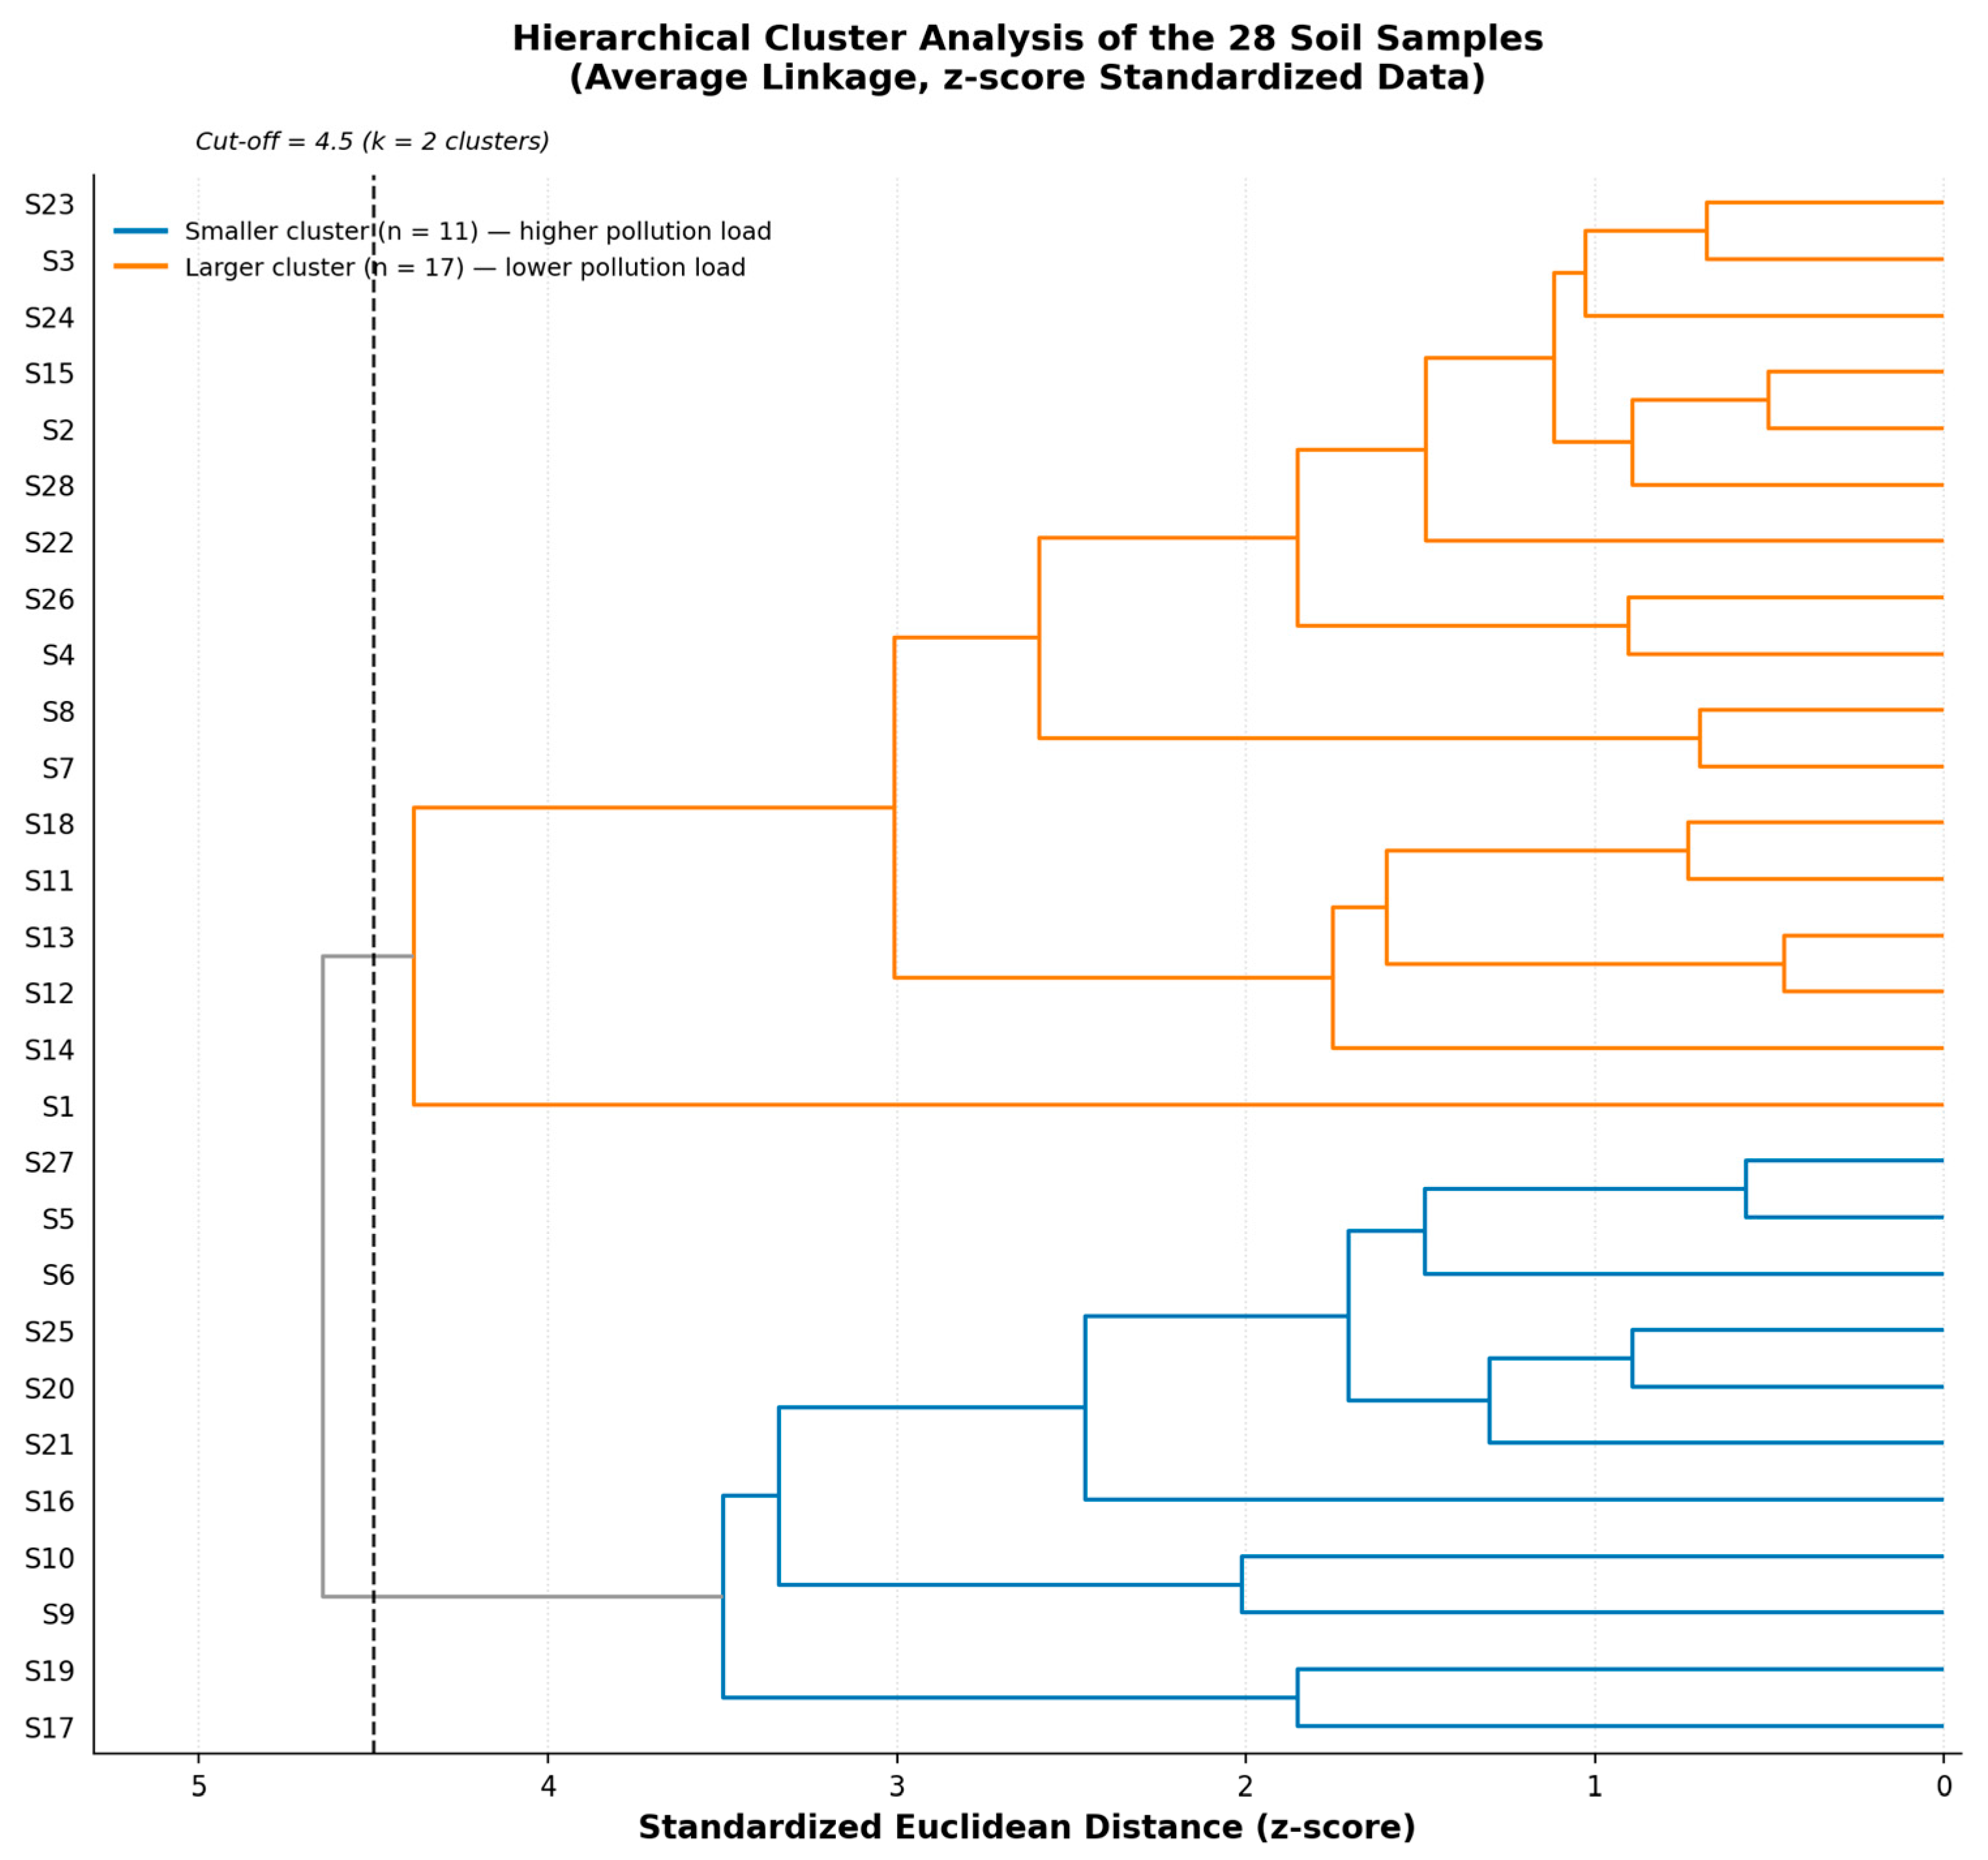
Because Fe’s raw concentrations (thousands of mg kg−1) are roughly two to three orders of magnitude larger than those of the other seven metals, an HCA run on unstandardized data risks being driven almost entirely by Fe rather than by the relative geochemical signature of each sample. We therefore report HCA performed on z-score-standardized concentrations as the primary analysis (Section 2.3), and compare it below with the unstandardized version. On the standardized data, average-linkage HCA grouped the 28 samples into two main clusters at a cut-off of 4.5 standardized (z-score) Euclidean distance units, shown as a dashed line in Figure 5. The larger cluster comprised 17 samples (S1–S4, S7–S8, S11–S15, S18, S22–S24, S26, and S28), corresponding mainly to the lower end of the concentration range, including the two least-contaminated samples in the data set, S7 and S8. The smaller cluster grouped the remaining 11 samples (S5–S6, S9–S10, S16–S17, S19–S21, S25, and S27), which coincide closely with the samples showing the highest pollution-load and degree-of-contamination values (Section 3.6.2). This correspondence between the standardized HCA grouping and the pollution-index ranking, obtained through an independent statistical procedure, reinforces the conclusion that a subset of sampling locations in North Riyadh is subject to a modest but consistent additional metal input not shared by the rest of the study area. Standardization did change the cluster membership relative to the unstandardized (raw) data, as anticipated: HCA on raw concentrations groups the 28 samples at a rescaled Euclidean distance of approximately 5400 (dominated by absolute Fe differences) into a smaller cluster of 8 samples (S9, S10, S16, S17, S19, S20, S21, and S25) and a larger cluster of 20. The 8-sample raw-data cluster is a strict subset of the 11-sample standardized cluster; the three additional sites identified only after standardization (S5, S6, and S27) show intermediate degree-of-contamination values (mean DC ≈ 2.43), higher than the rest of the larger cluster (mean DC ≈ 1.77) but below the core higher-pollution group (mean DC ≈ 3.29), consistent with a borderline geochemical signature that the Fe-dominated raw clustering had obscured. We regard the standardized solution as the more defensible of the two and use it in the interpretation below, while noting that the core finding, a coherent subgroup of sites with modestly elevated, non-lithogenic metal input, is robust to the choice of scaling.
Figure 5.
Dendrogram derived from hierarchical cluster analysis (average linkage) of the 28 soil samples based on z-score-standardized concentrations of the eight studied metals. The dashed vertical line marks the 4.5-unit cut-off used to define the two clusters.
To evaluate whether the higher-pollution cluster corresponds to a distinct land-use setting, the GPS coordinates of all 28 sites (Supplementary Table S8) were checked against current satellite imagery and map records. The 11 sites in the smaller, higher-pollution cluster fall within North Riyadh’s most actively developing residential districts, principally An Narjis, Al Yasmin, and Al Qirawan, areas that have seen extensive road construction and new residential-compound building in recent years, and several sites lie within roughly 1 km of arterial roads, active construction fronts, or scattered light-industrial/building-supply premises. By contrast, a larger share of the lower-pollution cluster’s sites fall in more established or still largely undeveloped parts of the study area, farther from current construction activity. This spatial association is consistent with, though not, on its own, proof of, the construction- and traffic-related origin proposed for the Cu–Pb–Zn enrichment identified by the PCA and pollution-index results, and it strengthens the case that the rotated PC2 reflects a genuine, if localized, anthropogenic contribution rather than a statistical artefact.
3.6. Contamination Levels in the Study Area
3.6.1. Single Indices
Combining several complementary indices in this way, rather than relying on a single metric, is consistent with recommendations from source-oriented risk assessments of urban sediment systems elsewhere, which found that index choice can noticeably shift the perceived severity of contamination at a given site [80]. The classification schemes proposed by Sutherland et al. [23] for EF and by Muller [20] for Igeo were adopted in this study (Table 4). The mean EF values for Co (1.05), V (1.04), Ni (1.31), Cr (1.41), and Cu (1.43) were close to unity or only slightly above it, implying that these elements fall into the “no enrichment” to “minor enrichment” category. Lead and Zn again formed an exception, with average EF values of 2.88 and 2.39, respectively, still within the minor-to-moderate contamination category on average, though some individual samples had much larger values (EF = 5.70 for Pb in S18; EF = 8.91 for Zn in S1). For all eight elements, the mean Igeo values were negative, representing the “uncontaminated” category (Igeo ≤ 0), as proposed by Muller [20]. The only exception was Zn at S1, where the Igeo value was barely positive (0.13), placing that one sample into class 1 (“uncontaminated to moderately contaminated”).
Table 4.
Summary of the geoaccumulation index (Igeo), and enrichment factor (EF) for the eight metals, calculated relative to the background values of Turekian and Wedepohl [61] and normalized to Fe for the EF.
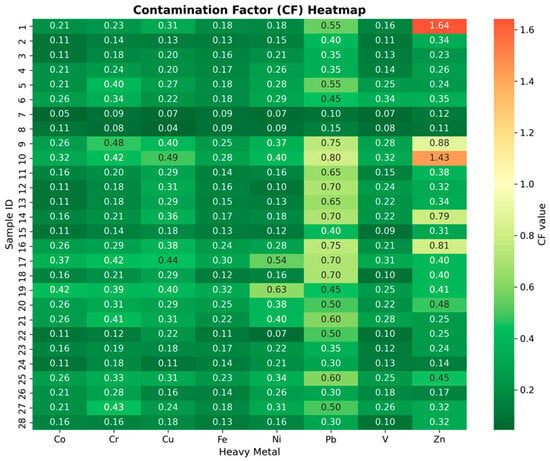
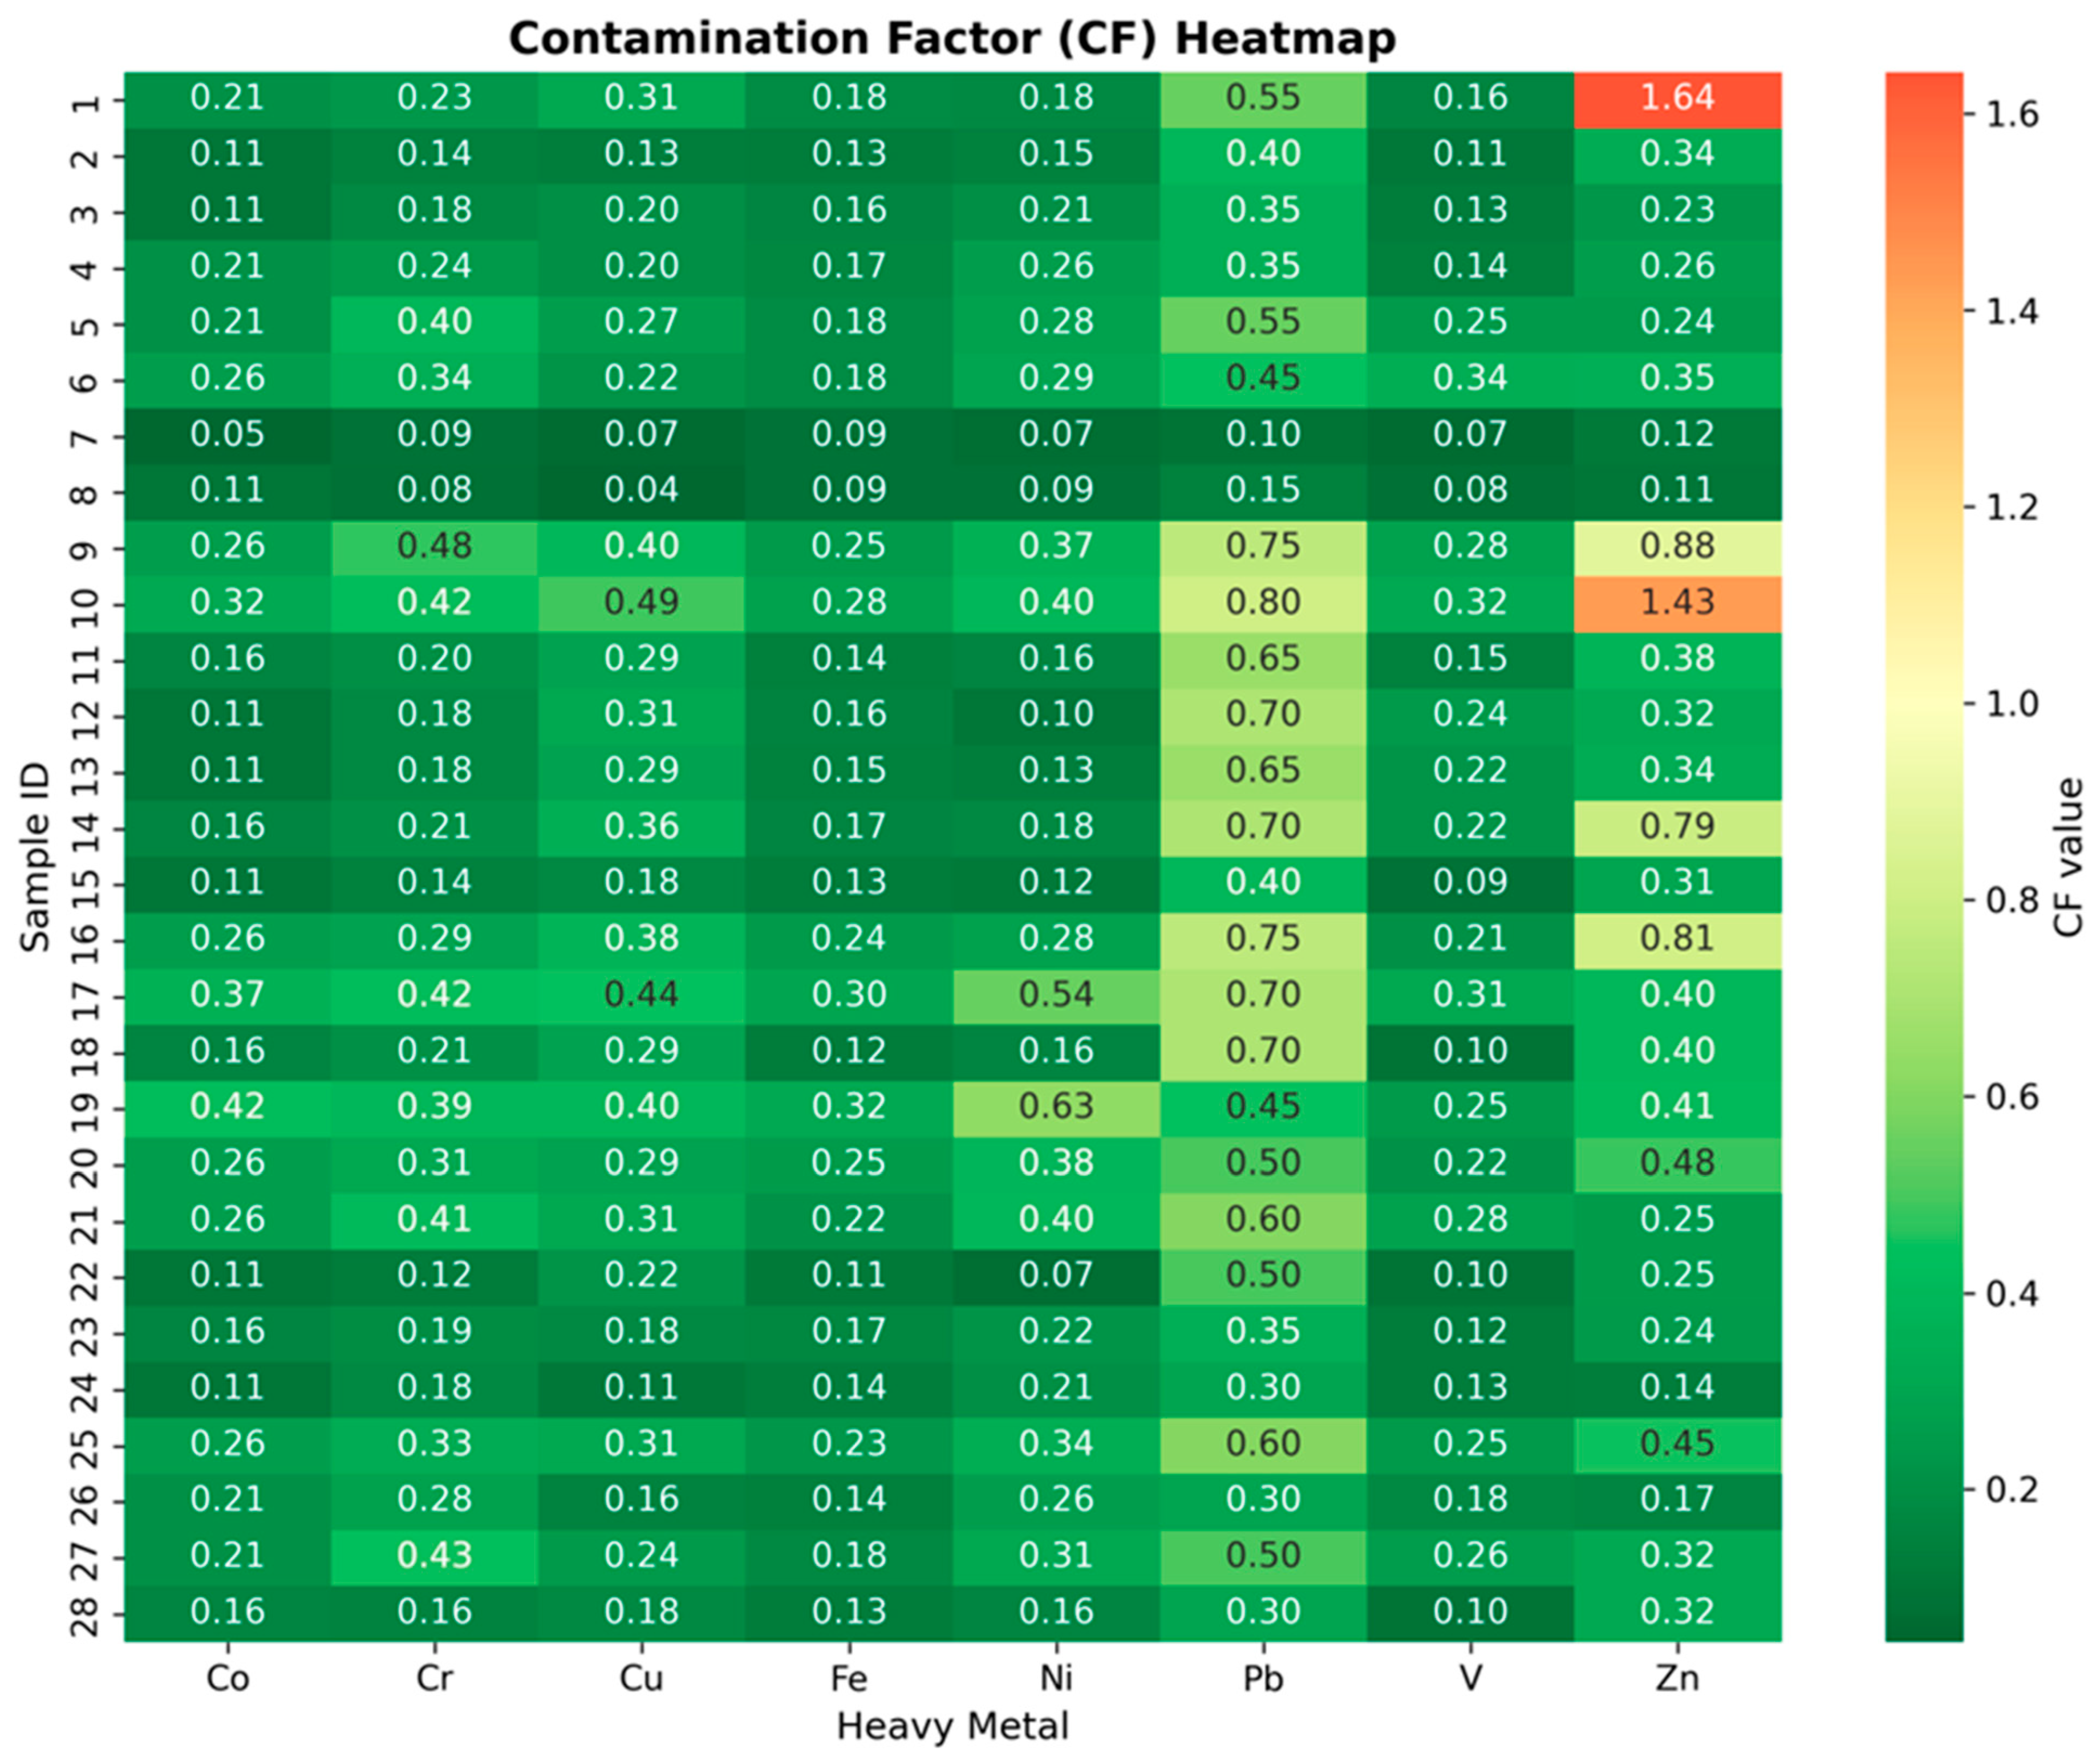
The contamination factor (CF), calculated according to the average shale background values of Turekian and Wedepohl [61], is listed for all samples and metals shown in Figure 6. According to the classification of Hakanson [17], CF < 1 indicates low contamination, 1 ≤ CF < 3 indicates moderate contamination, 3 ≤ CF < 6 indicates considerable contamination and CF ≥ 6 indicates very high contamination. In this class, the contamination levels of Co, Cr, Cu, Fe, Ni, V and Pb were found to be unchanged in 28 samples with average CF values ranging from 0.18 (Fe) to 0.50 (Pb). The low contamination and mainly lithogenic sources of Co, Cr, Fe, Ni and V are consistent with the results of recent studies on soil of Saudi Arabia, such as natural sources of heavy metals in the Al Ghat Governorate, estimated by contamination factor (CF), enrichment factor (EF) and geoaccumulation index (Igeo) calculations [56,79,80].
Figure 6.
Contamination factor (CF) of each metal in each soil sample, calculated relative to the average shale background values of Turekian and Wedepohl [61].
The only metal to be in the moderate contamination level was zinc, which in two samples S1 (CF = 1.64) and S10 (CF = 1.43) had its CF value exceeding unity. Average CF of Zn in all samples was 0.44. Isolated behavior of Zn here is a reiteration of its anomaly in the results of correlation and PCA, and is similar to the results obtained by Al-Swadi et al. [15] in Riyadh. In their study, the metals Zn, Cu, and Pb were found to be influenced by anthropogenic industrial activities (EF > 2). Such consistency indicates that although the geological setting plays the major role in the chemical composition of soils of North Riyadh, the anthropogenic impact is becoming a noticeable feature for Zn. Independent hazard-quotient-based assessments of soil and water systems elsewhere have likewise found that even where mean contamination remains low, non-carcinogenic risk indices can still warrant periodic re-evaluation as land use intensifies [81].
3.6.2. Integrated Indices
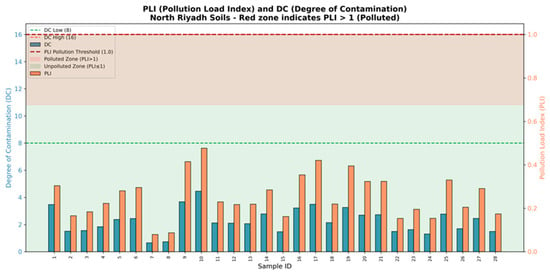
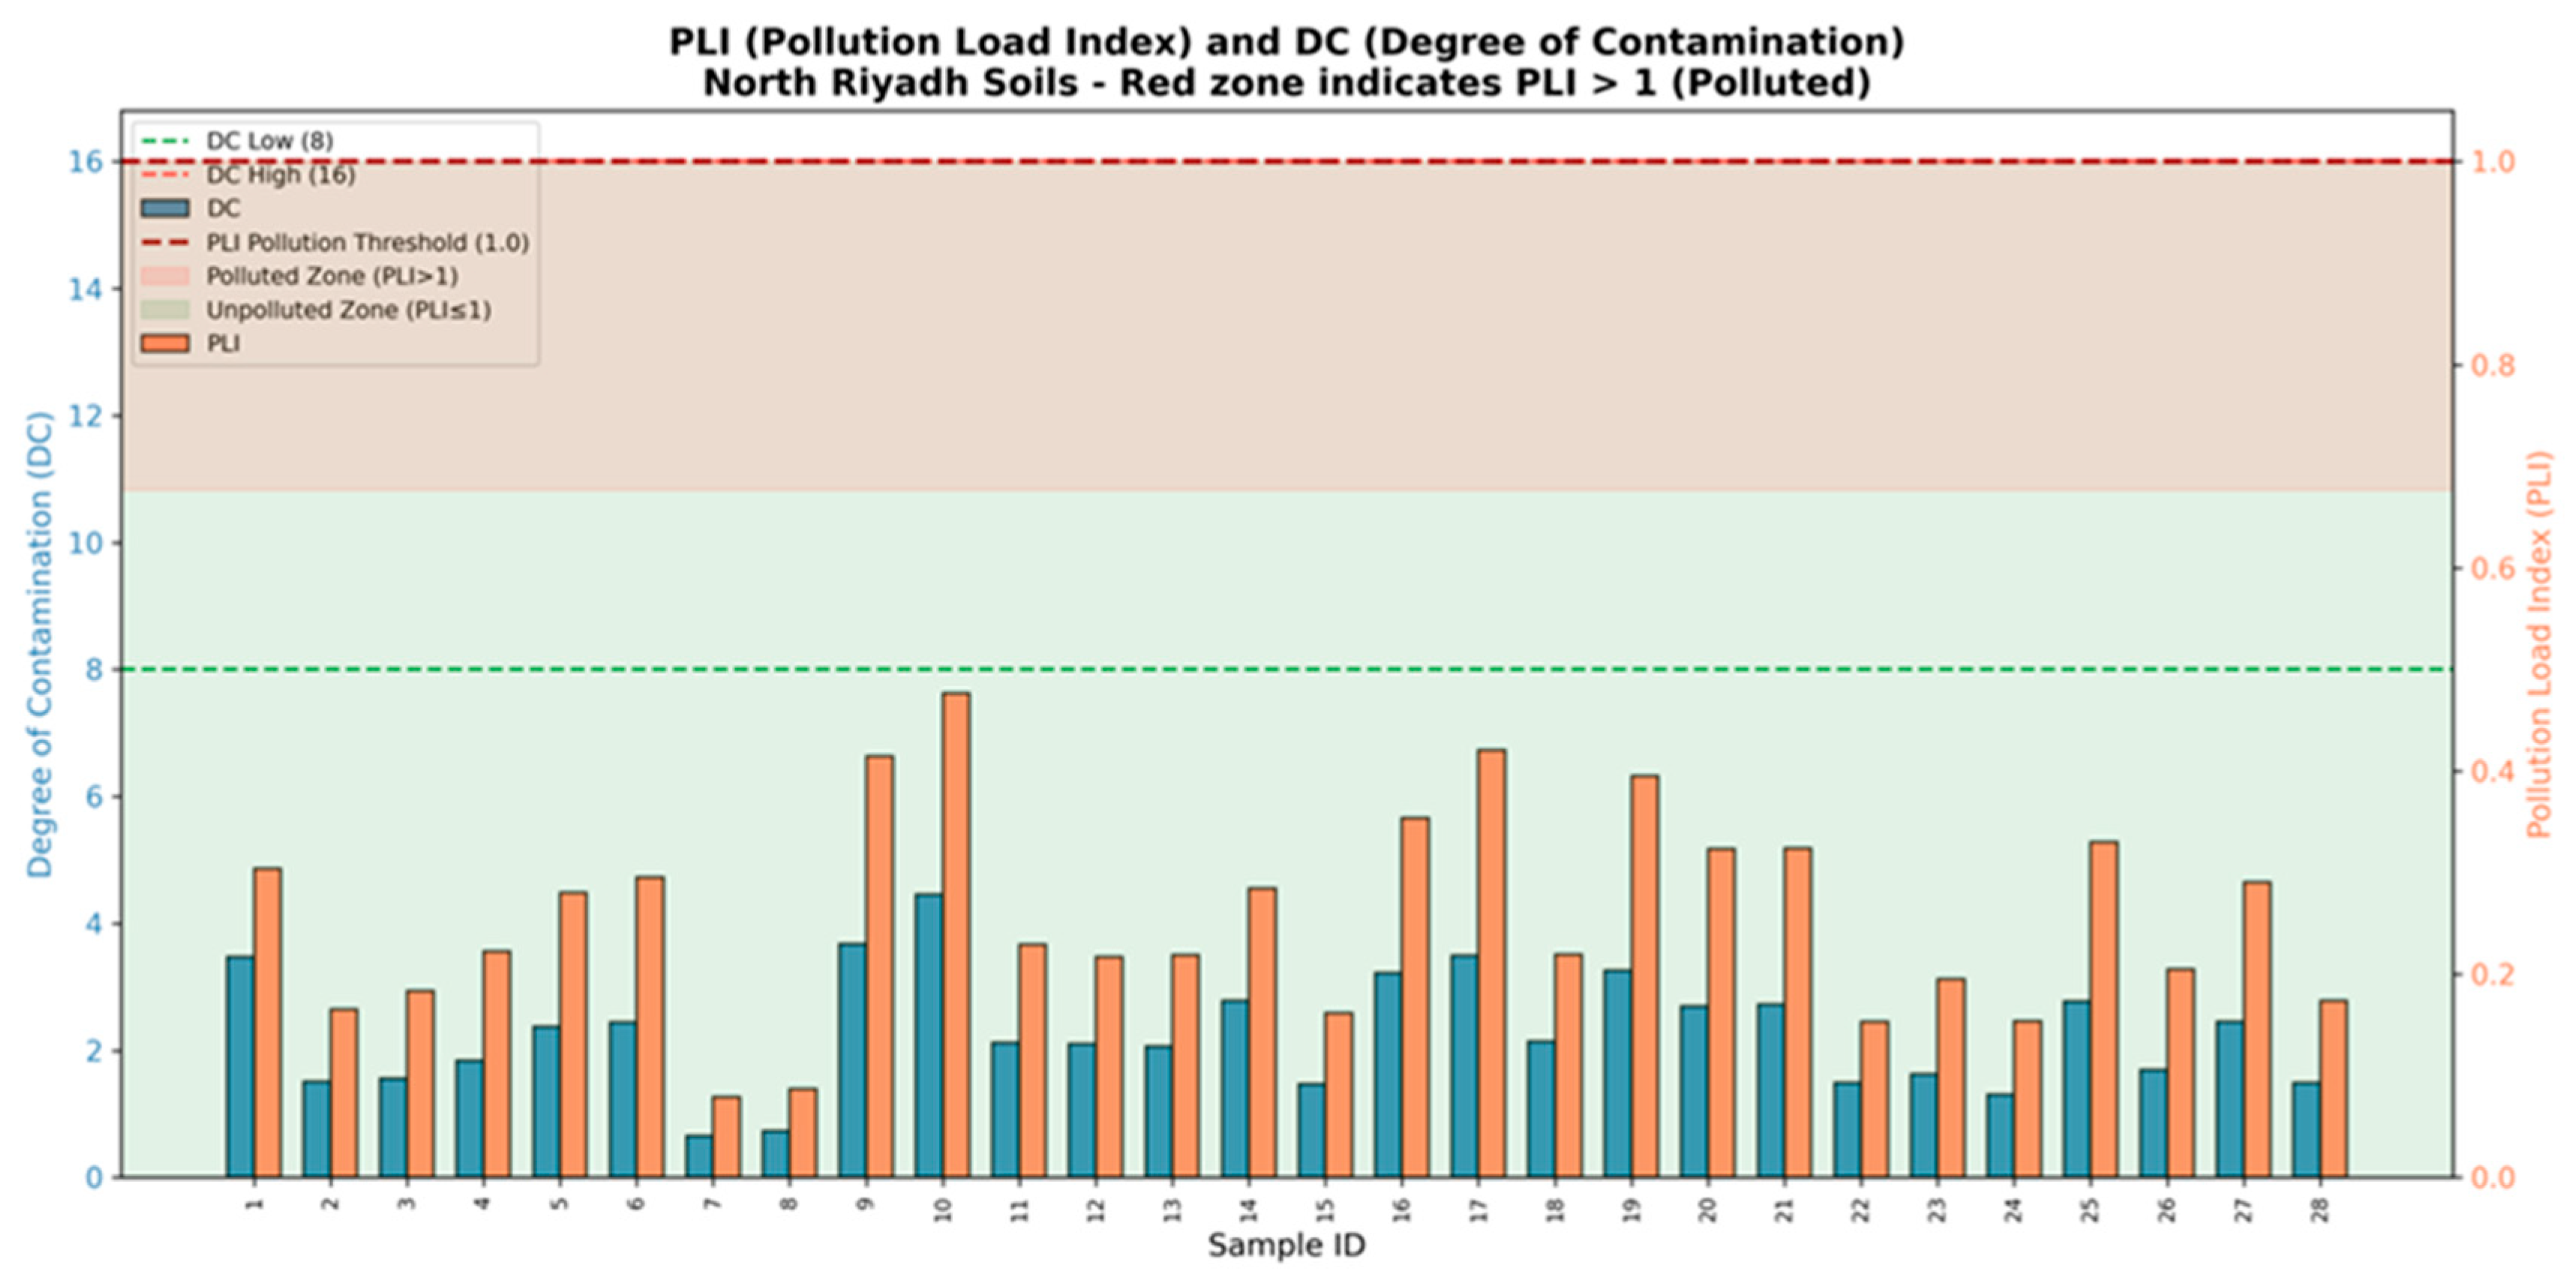
The degree of contamination (DC), determined by summing the CF values of the eight metals for each sample [16], ranged from 0.65 (S7) to 4.45 (S10), with a study-wide average of 2.27 (Figure 7). All samples therefore fell far below Hakanson’s [17] “low degree of contamination” threshold (DC < 8) and did not approach the next classification, “moderate” (8 ≤ DC < 16). The pollution load index (PLI), calculated as the geometric mean of the eight CF values for each sample [82], showed the same trend: PLI values ranged from 0.08 (S7) to 0.48 (S10), with all 28 values under the critical value of 1 that separates unpolluted from polluted soils (Figure 7). Notably, the five samples with the highest PLI values, S10 (0.48), S17 (0.42), S9 (0.41), S19 (0.40), and S16 (0.35), are identical to samples in the smaller (higher-pollution) cluster of the hierarchical cluster analysis discussed above. Such findings are similar to those made recently in other parts of Saudi Arabia. In Al-Muzahmiya, west of Riyadh, Alarifi et al., [30] found PLI values ranging from 0.23 to 0.85, with an average of 0.49. In another investigation conducted at Huraymla, northwest of Riyadh, the reported value was 0.29 (range 0.11–0.56) using the same background reference levels, again confirming the trend of less-contaminated soil in central Saudi Arabia. Similarly, the Al-Uyaynah-Al-Jubailah area, about 35 km northwest of Riyadh, showed very little contamination, with environmental indices indicating no ecological risk and element levels below regional and international guidelines [69]. Overall, the pollution-index results converge on the same conclusion reached from the correlation and multivariate analyses: the soils of North Riyadh remain, at present, largely unpolluted with respect to the eight studied metals, with Pb and, especially, Zn the only elements showing localized enrichment above the natural background, concentrated in a small number of sampling sites. Regional syntheses of Gulf coastal and urban environments similarly conclude that, despite rapid development, most sampled sites remain within low-to-moderate contamination categories, with only isolated locations exceeding background thresholds [83,84,85,86,87,88].
Figure 7.
Pollution load index (PLI) and degree of contamination (DC) calculated for each of the 28 soil samples. The shaded band marks the threshold above which PLI indicates polluted conditions (PLI > 1).
Table 5 consolidates the integrated pollution indices (DC, PLI), the single most-enriched metal at each site, and the standardized–HCA cluster assignment for all 28 samples to give a single point of reference for their spatial pattern.
Table 5.
Summary of integrated pollution indices (degree of contamination, DC; pollution load index, PLI), the metal with the highest contamination factor (CF) at each site, and HCA cluster assignment (standardized data; Section 3.5), for all 28 soil samples.
3.7. Contribution to the United Nations Sustainable Development Goals (SDGs)
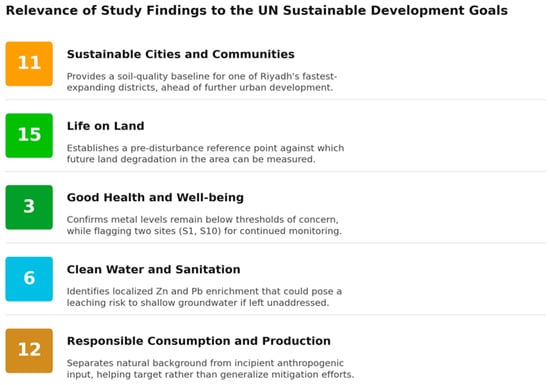
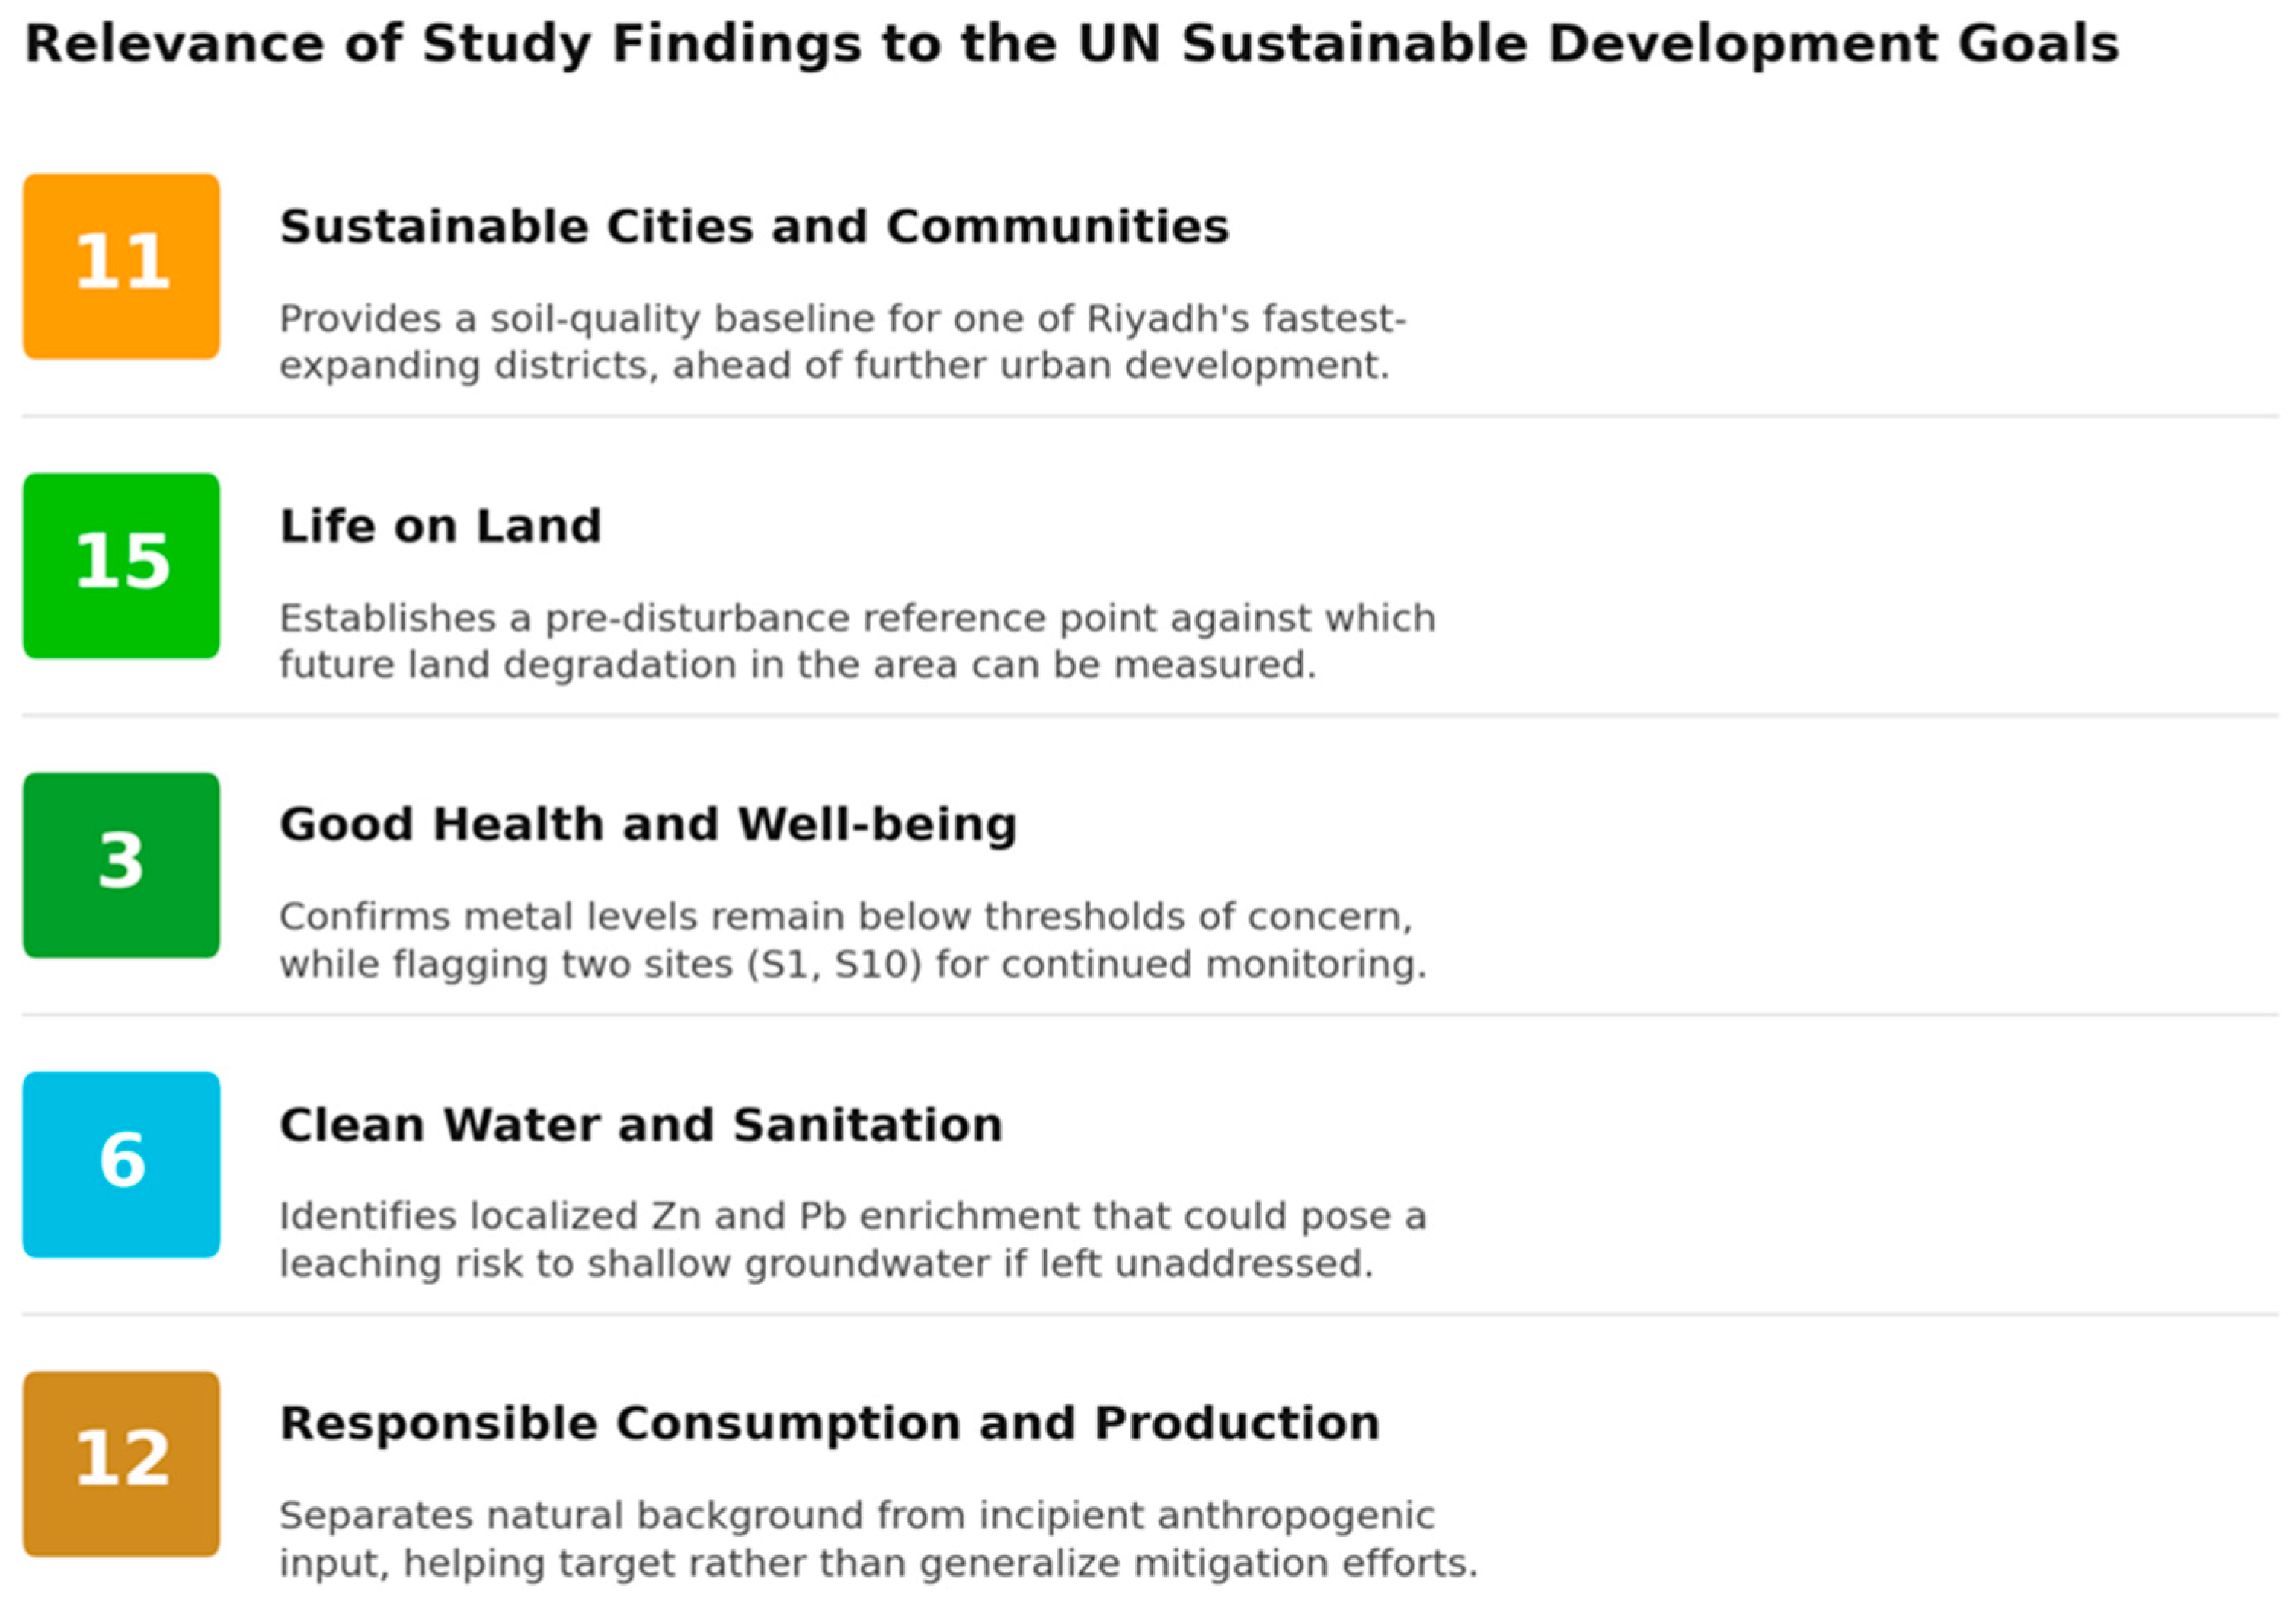
These results speak most directly to a small number of United Nations Sustainable Development Goals (Figure 8): the generally low contamination levels support SDG 3 (Good Health and Well-being) and SDG 15 (Life on Land), while the localized Cu-Pb-Zn enrichment identified at specific sites gives urban planners and regulators actionable, site-specific evidence for SDG 11 (Sustainable Cities and Communities) and SDG 6 (Clean Water and Sanitation, given the potential for these elements to leach into shallow groundwater), consistent with SDG 12 (Responsible Consumption and Production), rather than requiring that the entire urban-expansion zone be treated as uniformly at risk.
Figure 8.
Contribution of the present study to relevant United Nations Sustainable Development Goals (SDGs).
3.8. Limitations of the Current Study
There are some limitations to be acknowledged. The 28 samples analysed here are sufficient to support the statistical treatments applied, but they come from a single sampling campaign and a single depth interval, and so cannot capture seasonal variability or the influence of dust storms known to redistribute heavy metals across large areas of central Saudi Arabia [89]. The use of aqua regia, a partial rather than total digestion, is a further limitation: it does not fully dissolve silicate-bound fractions of Co, Cr, Ni, and V, so the absolute concentrations reported here likely under-represent total metal content for these elements. The geogenic-versus-anthropogenic apportionment made in Section 3.3, Section 3.4 and Section 3.5 should therefore be read as applying to the aqua-regia-extractable (broadly bioavailable and environmentally mobile) fraction rather than the whole-rock composition [90]. Because this partial recovery is expected to affect all samples uniformly, it should have a smaller effect on relative comparisons (indices, correlations, and clustering) than on the absolute concentrations themselves, although this assumption has not been independently verified for these soils. Likewise, the absence of arsenic, cadmium, and mercury, three elements frequently implicated in the more severe contamination cases reported elsewhere in the Kingdom [22,41], means that the low-risk conclusion reached here applies specifically to the eight metals studied and should not be generalized to overall soil quality without further analysis. Future work that extends the present sampling grid, repeats it seasonally, incorporates a total-digestion or multi-acid comparison on a subset of samples, and adds a wider suite of potentially toxic elements would considerably strengthen the baseline established here. Complementary approaches such as proximal soil sensing could help extend future monitoring efficiently across a wider suite of potentially toxic elements without a proportional rise in analytical cost [91].
4. Conclusions
This study establishes the first geochemical baseline for eight heavy metals (Co, Cr, Cu, Fe, Ni, Pb, V, and Zn) in the surface soils of North Riyadh. Correlation analysis, PCA, and standardized HCA agree that Co, Cr, Fe, Ni, and V are controlled predominantly by the natural geochemical background, with iron acting as a reliable indicator element for a single dominant geogenic factor that explains over half of the total variance after rotation. Cu, Pb, and Zn depart from this pattern: all three load together on a distinct secondary statistical component (32.1% of variance), cluster together in a subset of 11 sites concentrated in North Riyadh’s most actively developing residential districts, and show localized enrichment above background at two sites (S1 and S10). All indices applied here, namely CF, PLI, and DC, classify the soils as non-polluted overall, with Zn enrichment at those two sites being the only exception. Taken together, these results indicate that North Riyadh’s rapid urban growth has not yet produced a widespread geochemical signal, though a modest, spatially localized construction- and traffic-related contribution to Cu, Pb, and Zn is detectable against the dominant lithogenic background. For ongoing monitoring, we recommend prioritizing re-sampling at the identified higher-pollution sites; extending the analysis list to include arsenic, cadmium, and mercury; and periodically repeating this baseline survey as North Riyadh’s development continues, so that any shift from the present geogenic-dominated pattern can be detected early.
Supplementary Materials
The following supporting information can be downloaded at https://www.mdpi.com/article/10.3390/land15081482/s1. Table S1. Limit of Detection (LOD) and Limit of Quantification (LOQ) of the studied elements, Table S2. Accuracy: recovery from certified reference materials, Table S3. EF Index classification used for the present study, Table S4. Standard of contamination levels by the geoaccumulation index (Igeo), Table S5. CF classes according to Hakanson [16], Table S6. Classification of the pollution load index (PLI), Table S7. DC classes, Table S8. GPS coordinates of the 28 soil sampling sites in North Riyadh, Saudi Arabia.
Author Contributions
Conceptualization, S.S.A., M.S.S., O.A. and A.A.; methodology, S.S.A., O.A., A.A. and M.S.S.; software, M.A., O.A., A.A. and M.S.S.; validation S.S.A., O.A. and A.A.; formal analysis, K.A.-K., O.A., A.A. and M.S.S.; investigation, S.S.A.; resources, S.S.A.; data curation, S.S.A., O.A. and A.A.; writing—original draft preparation, A.S.E.-S., K.A.-K., M.A. and M.S.S.; writing—review and editing, A.S.E.-S., K.A.-K. and M.A.; visualization, M.S.S.; supervision, A.S.E.-S., K.A.-K. and S.S.A.; project administration, S.S.A.; funding acquisition, K.A.-K. All authors have read and agreed to the published version of the manuscript.
Funding
Ongoing Research Funding program, (ORF-RICSP-2026-5), King Saud University, Riyadh, Saudi Arabia.
Data Availability Statement
All data are available in the manuscript and Supplementary Files.
Acknowledgments
The authors thank the Ongoing Research Funding program (ORF-RICSP-2026-5), King Saud University, Riyadh, Saudi Arabia, for supporting this work. This publication has also been supported by RUDN University.
Conflicts of Interest
The authors declare no conflicts of interest.
References
- Uchimiya, M.; Bannon, D.; Nakanishi, H.; McBride, M.B.; Williams, M.A.; Yoshihara, T. Chemical Speciation, Plant Uptake, and Toxicity of Heavy Metals in Agricultural Soils. J. Agric. Food Chem. 2020, 68, 12856–12869. [Google Scholar] [CrossRef] [Scilit] [PubMed]
- Laoye, B.; Olagbemide, P.; Ogunnusi, T.; Akpor, O.J.F. Heavy metal contamination: Sources, health impacts, and sustainable mitigation strategies with insights from nigerian case studies. F1000Research 2025, 14, 134. [Google Scholar] [CrossRef] [Scilit]
- Khalef, R.N.; Hassan, A.I.; Saleh, H.M. Heavy metal’s environmental impact. In Environmental Impact and Remediation of Heavy Metals; IntechOpen: London, UK, 2022. [Google Scholar]
- Pant, M.; Singh, J. Distribution of heavy metals contamination in the environment and their toxicological impacts. In Heavy Metal Contamination in the Environment; CRC Press: Boca Raton, FL, USA, 2024; pp. 95–113. [Google Scholar]
- Guo, F.; Hu, X.; Zhang, X.; Chen, Y.; Hou, J. Study on soil heavy metal contamination and its remediation using lignin-based adsorbents: A review. Environ. Technol. Innov. 2025, 37, 103958. [Google Scholar] [CrossRef] [Scilit]
- Alloway, B.J. Trace metals and metalloids in soils and their bioavailability. Heavy Met. Soils 2013, 22, 4–18. [Google Scholar]
- Alharbi, T.; El-Sorogy, A.S. Spatial distribution and risk assessment of heavy metals pollution in soils of marine origin in central Saudi Arabia. Mar. Pollut. Bull. 2021, 170, 112605. [Google Scholar] [CrossRef] [Scilit] [PubMed]
- Imtiaz, M.; Rashid, A.; Khan, P.; Memon, M.; Aslam, M. The role of micronutrients in crop production and human health. Pak. J. Bot. 2010, 42, 2565–2578. [Google Scholar]
- White, P.J.; Brown, P. Plant nutrition for sustainable development and global health. Ann. Bot. 2010, 105, 1073–1080. [Google Scholar] [CrossRef] [Scilit] [PubMed]
- Ali, H.; Khan, E.; Ilahi, I. Environmental chemistry and ecotoxicology of hazardous heavy metals: Environmental persistence, toxicity, and bioaccumulation. J. Chem. 2019, 2019, 6730305. [Google Scholar] [CrossRef] [Scilit]
- El-Sorogy, A.S.; Al Khathlan, M.H. Assessment of potentially toxic elements and health risks of agricultural soil in Southwest Riyadh, Saudi Arabia. Open Chem. 2024, 22, 20240017. [Google Scholar] [CrossRef] [Scilit]
- Luo, X.-S.; Ding, J.; Xu, B.; Wang, Y.-J.; Li, H.-B.; Yu, S. Incorporating bioaccessibility into human health risk assessments of heavy metals in urban park soils. Sci. Total. Environ. 2012, 424, 88–96. [Google Scholar] [CrossRef] [Scilit] [PubMed]
- Ma, L.; Yang, Z.; Li, L.; Wang, L. Source identification and risk assessment of heavy metal contaminations in urban soils of Changsha, a mine-impacted city in Southern China. Environ. Sci. Pollut. Res. 2016, 23, 17058–17066. [Google Scholar] [CrossRef] [Scilit] [PubMed]
- Bhat, A.A.; Moglad, E.; Bansal, P.; Kaur, H.; Deorari, M.; Thapa, R.; Almalki, W.H.; Kazmi, I.; Alzarea, S.I.; Kukreti, N.; et al. Pollutants to pathogens: The role of heavy metals in modulating TGF-β signaling and lung cancer risk. Pathol. Res. Pract. 2024, 256, 155260. [Google Scholar] [CrossRef] [Scilit] [PubMed]
- Al-Swadi, H.A.; Usman, A.R.; Al-Farraj, A.S.; Al-Wabel, M.I.; Ahmad, M.; Al-Faraj, A. Sources, toxicity potential, and human health risk assessment of heavy metals-laden soil and dust of urban and suburban areas as affected by industrial and mining activities. Sci. Rep. 2022, 12, 8972. [Google Scholar] [CrossRef] [Scilit] [PubMed]
- Muller, G. Index of geoaccumulation in sediments of the Rhine River. Geo J. 1969, 2, 108–118. [Google Scholar]
- Hakanson, L. An ecological risk index for aquatic pollution control. A sedimentological approach. Water Res. 1980, 14, 975–1001. [Google Scholar] [CrossRef] [Scilit]
- Reimann, C.; Caritat, P. Intrinsic flaws of element enrichment factors (EFs) in environmental geochemistry. Environ. Sci. Technol. 2000, 34, 5084–5091. [Google Scholar] [CrossRef] [Scilit]
- Sutherland, R.; Tack, F.; Tolosa, C.; Verloo, M. Operationally Defined Metal Fractions in Road Deposited Sediment, Honolulu, Hawaii; 0047-2425; Wiley Online Library: Hoboken, NJ, USA, 2000. [Google Scholar]
- Liu, W.; Zhao, J.; Ouyang, Z.; Söderlund, L.; Liu, G. Impacts of sewage irrigation on heavy metal distribution and contamination in Beijing, China. Environ. Int. 2005, 31, 805–812. [Google Scholar] [CrossRef] [Scilit] [PubMed]
- Vineethkumar, V.; Sayooj, V.; Shimod, K.; Prakash, V. Estimation of pollution indices and hazard evaluation from trace elements concentration in coastal sediments of Kerala, Southwest Coast of India. Bull. Natl. Res. Cent. 2020, 44, 198. [Google Scholar] [CrossRef] [Scilit]
- Al-Kahtany, K. Ecological risk assessment of heavy metals contamination in agricultural soil from Al Majma’ah, central Saudi Arabia. J. King Saud. Univ.—Sci. 2024, 36, 102993. [Google Scholar] [CrossRef] [Scilit]
- Youssef, M.; Otaibi, S.A.; El-Sorogy, A.S. Distribution, source, and contamination of heavy metals in coastal sediments of Jeddah, Red Sea, Saudi Arabia. Bull. Environ. Contam. Toxicol. 2024, 113, 12. [Google Scholar] [CrossRef] [Scilit] [PubMed]
- Idris, A.M. Combining multivariate analysis and geochemical approaches for assessing heavy metal level in sediments from Sudanese harbors along the Red Sea coast. Microchem. J. 2008, 90, 159–163. [Google Scholar] [CrossRef] [Scilit]
- El-Sorogy, A.S.; Youssef, M.; Al-Kahtany, K. Integrated assessment of the Tarut Island coast, Arabian Gulf, Saudi Arabia. Environ. Earth Sci. 2016, 75, 1336. [Google Scholar] [CrossRef] [Scilit]
- Mummullage, S.; Egodawatta, P.; Ayoko, G.A.; Goonetilleke, A. Use of physicochemical signatures to assess the sources of metals in urban road dust. Sci. Total. Environ. 2016, 541, 1303–1309. [Google Scholar] [CrossRef] [Scilit] [PubMed]
- Mishra, S.; Kumar, A.; Yadav, S.; Singhal, M.K. Assessment of heavy metal contamination in water of Kali River using principle component and cluster analysis, India. Sustain. Water Resour. Manag. 2018, 4, 573–581. [Google Scholar] [CrossRef] [Scilit]
- Hammam, A.A.; Mohamed, W.S.; Sayed, S.E.-E.; Kucher, D.E.; Mohamed, E.S. Assessment of soil contamination using gis and multi-variate analysis: A case study in El-Minia Governorate, Egypt. Agronomy 2022, 12, 1197. [Google Scholar] [CrossRef] [Scilit]
- Kahangwa, C.A. Application of principal component analysis, cluster analysis, pollution index and geoaccumulation index in pollution assessment with heavy metals from gold mining operations, Tanzania. J. Geosci. Environ. Prot. 2022, 10, 303–317. [Google Scholar]
- Alarifi, S.S.; El-Sorogy, A.S.; Al-Kahtany, K.; Alharbi, T.; Alhejji, S.S.S.; de Larriva, J.E.M.; Shokr, M.S. Exploring soil heavy metal (loid) levels in Huraymla, Saudi Arabia: Implications for sustainable agriculture and food supply. Front. Sustain. Food Syst. 2025, 9, 1726872. [Google Scholar] [CrossRef] [Scilit]
- Kuznietsov, P.; Biedunkova, O. Application of multivariate statistical techniques for assessing spatiotemporal variations of heavy metal pollution in freshwater ecosystems. Water Conserv. Sci. Eng. 2025, 10, 13. [Google Scholar] [CrossRef] [Scilit]
- Jolliffe, I. Principal Component Analysis. In International Encyclopedia of Statistical Science; Springer: Berlin/Heidelberg, Germany, 2025; pp. 1945–1948. [Google Scholar]
- Abd-Elmabod, S.K.; Bakr, N.; Muñoz-Rojas, M.; Pereira, P.; Zhang, Z.; Cerdà, A.; Jordán, A.; Mansour, H.; De la Rosa, D.; Jones, L. Assessment of soil suitability for improvement of soil factors and agricultural management. Sustainability 2019, 11, 1588. [Google Scholar] [CrossRef] [Scilit]
- Abdel-Fattah, M.K.; Mohamed, E.S.; Wagdi, E.M.; Shahin, S.A.; Aldosari, A.A.; Lasaponara, R.; Alnaimy, M.A. Quantitative evaluation of soil quality using Principal Component Analysis: The case study of El-Fayoum depression Egypt. Sustainability 2021, 13, 1824. [Google Scholar] [CrossRef] [Scilit]
- Halko, N.; Martinsson, P.-G.; Shkolnisky, Y.; Tygert, M. An algorithm for the principal component analysis of large data sets. SIAM J. Sci. Comput. 2011, 33, 2580–2594. [Google Scholar] [CrossRef] [Scilit]
- Jolliffe, I.T.; Cadima, J. Principal component analysis: A review and recent developments. Philos. Trans. Ser. A Math. Phys. Eng. Sci. 2016, 374, 20150202. [Google Scholar] [CrossRef] [Scilit] [PubMed]
- Abdel-Fattah, M.K.; Abd-Elmabod, S.K.; Aldosari, A.A.; Elrys, A.S.; Mohamed, E.S. Multivariate analysis for assessing irrigation water quality: A case study of the Bahr Mouise Canal, Eastern Nile Delta. Water 2020, 12, 2537. [Google Scholar] [CrossRef] [Scilit]
- Hasan, B.M.S.; Abdulazeez, A.M. A review of principal component analysis algorithm for dimensionality reduction. J. Soft Comput. Data Min. 2021, 2, 20–30. [Google Scholar] [CrossRef] [Scilit]
- Yang, Y.; Christakos, G.; Guo, M.; Xiao, L.; Huang, W. Space-time quantitative source apportionment of soil heavy metal concentration increments. Environ. Pollut. 2017, 223, 560–566. [Google Scholar] [CrossRef] [Scilit] [PubMed]
- Yang, Y.; Yang, X.; He, M.; Christakos, G. Beyond mere pollution source identification: Determination of land covers emitting soil heavy metals by combining PCA/APCS, GeoDetector and GIS analysis. Catena 2020, 185, 104297. [Google Scholar] [CrossRef] [Scilit]
- Alarifi, S.S.; El-Sorogy, A.S.; Al-Kahtany, K.; Alotaibi, M. Contamination and environmental risk assessment of potentially toxic elements in soils of palm farms in Northwest Riyadh, Saudi Arabia. Sustainability 2022, 14, 15402. [Google Scholar] [CrossRef] [Scilit]
- Qureshi, S.; Khan, N. Estimation of climatic transition in Riyadh (Saudi Arabia) in global warming perspectives. GeoJournal 1994, 33, 423–432. [Google Scholar] [CrossRef] [Scilit]
- Kafy, A.A.; Alsulamy, S.; Alsaleh, A.M. Escalating heat hazard risk in arid urban environments: A two-decade assessment of thermal stress patterns and health risks using UTCI and WBGT indices in Riyadh, Saudi Arabia. Nat. Hazards 2026, 122, 156. [Google Scholar] [CrossRef] [Scilit]
- Hussein, M.T.; Al Yousif, M.M.; Awad, H.S. Potentiality of secondary aquifers in Saudi Arabia: Evaluation of groundwater quality in Jubaila limestone. Int. J. Geosci. 2012, 3, 71–80. [Google Scholar]
- AlKahtany, K.; Youssef, M.; El-Sorogy, A. Geochemical and foraminiferal analyses of the bottom sediments of Dammam coast, Arabian Gulf, Saudi Arabia. Arab. J. Geosci. 2015, 8, 11121–11133. [Google Scholar] [CrossRef] [Scilit]
- El-Asmar, H.M.; Assal, E.M.; El-Sorogy, A.S.; Youssef, M. Facies analysis and depositional environments of the Upper Jurassic Jubaila Formation, central Saudi Arabia. J. Afr. Earth Sci. 2015, 110, 34–51. [Google Scholar] [CrossRef] [Scilit]
- Youssef, M.; El-Sorogy, A.S. Paleoecology of benthic foraminifera in coral reefs recorded in the Jurassic Tuwaiq Mountain Formation of the Khashm Al-Qaddiyah area, Central Saudi Arabia. J. Earth Sci. 2015, 26, 224–235. [Google Scholar] [CrossRef] [Scilit]
- Al-Dabbagh, M.E.; El-Sorogy, A.S. Diagenetic alterations of the upper Jurassic scleractinian corals, Hanifa formation, Jabal Al-Abakkayn, central Saudi Arabia. J. Geol. Soc. India 2016, 87, 337–344. [Google Scholar] [CrossRef] [Scilit]
- Tawfik, M.; Al-Dabbagh, M.; El-Sorogy, A. Sequence stratigraphy of the late middle Jurassic open shelf platform of the Tuwaiq Mountain Limestone Formation, central Saudi Arabia. Proc. Geol. Assoc. 2016, 127, 395–412. [Google Scholar] [CrossRef] [Scilit]
- El-Sorogy, A.; Al-Kahtany, K.; Almadani, S.; Tawfik, M. Depositional architecture and sequence stratigraphy of the Upper Jurassic Hanifa Formation, central Saudi Arabia. J. Afr. Earth Sci. 2018, 139, 367–378. [Google Scholar] [CrossRef] [Scilit]
- Powers, R.; Ramirez, L.F.; Redmond, C.; Elberg, E., Jr. Geology of the Arabian Peninsula: Sedimentary Geology of Saudi Arabia; 2330-7102; US Geological Survey: Reston, VA, USA, 1966.
- Grassin-Delyle, S.; Martin, M.; Hamzaoui, O.; Lamy, E.; Jayle, C.; Sage, E.; Etting, I.; Devillier, P.; Alvarez, J.-C. A high-resolution ICP-MS method for the determination of 38 inorganic elements in human whole blood, urine, hair and tissues after microwave digestion. Talanta 2019, 199, 228–237. [Google Scholar] [CrossRef] [Scilit] [PubMed]
- Makupa, E.E. Conservation Efforts and Local Livelihoods in Western Serengeti, Tanzania: Experiences from Ikona Community Wildlife Management Area. Ph.D. Thesis, University of Dar es Salaam, Dar es Salaam, Tanzania, 2013. [Google Scholar]
- Gergen, I.; Harmanescu, M. Application of principal component analysis in the pollution assessment with heavy metals of vegetable food chain in the old mining areas. BMC Chem. 2012, 6, 156. [Google Scholar] [CrossRef] [Scilit] [PubMed]
- Alzahrani, H.; El-Sorogy, A.S.; Okok, A.; Shokr, M.S. GIS-and multivariate-based approaches for assessing potential environmental hazards in some areas of southwestern Saudi Arabia. Toxics 2024, 12, 569. [Google Scholar] [CrossRef] [Scilit] [PubMed]
- El-Sorogy, A.S.; Al-Kahtany, K.; Alharbi, T.; Al Hawas, R.; Rikan, N. Geographic information system and multivariate analysis approach for mapping soil contamination and environmental risk assessment in arid regions. Land 2025, 14, 221. [Google Scholar] [CrossRef] [Scilit]
- Kahal, A.Y.; El-Sorogy, A.S.; Meroño de Larriva, J.E.; Shokr, M.S. Mapping soil contamination in arid regions: A GIS and multivariate analysis approach. Minerals 2025, 15, 124. [Google Scholar] [CrossRef] [Scilit]
- Harikrishnan, N.; Ravisankar, R.; Chandrasekaran, A.; Gandhi, M.S.; Kanagasabapathy, K.; Prasad, M.; Satapathy, K. Assessment of heavy metal contamination in marine sediments of east coast of Tamil Nadu affected by different pollution sources. Mar. Pollut. Bull. 2017, 121, 418–424. [Google Scholar] [CrossRef] [Scilit] [PubMed]
- Trifuoggi, M.; Donadio, C.; Mangoni, O.; Ferrara, L.; Bolinesi, F.; Nastro, R.A.; Stanislao, C.; Toscanesi, M.; Di Natale, G.; Arienzo, M. Distribution and enrichment of trace metals in surface marine sediments in the Gulf of Pozzuoli and off the coast of the brownfield metallurgical site of Ilva of Bagnoli (Campania, Italy). Mar. Pollut. Bull. 2017, 124, 502–511. [Google Scholar] [CrossRef] [Scilit] [PubMed]
- Kowalska, J.B.; Mazurek, R.; Gąsiorek, M.; Zaleski, T. Pollution indices as useful tools for the comprehensive evaluation of the degree of soil contamination–A review. Environ. Geochem. Health 2018, 40, 2395–2420. [Google Scholar] [CrossRef] [Scilit] [PubMed]
- Turekian, K.K.; Wedepohl, K.H. Distribution of the elements in some major units of the earth’s crust. Geol. Soc. Am. Bull. 1961, 72, 175–192. [Google Scholar] [CrossRef] [Scilit]
- Al-Awwad, S.F.; Collins, L.B. Arabian carbonate reservoirs: A depositional model of the Arab-D reservoir in Khurais field, Saudi Arabia. AAPG Bull. 2013, 97, 1099–1119. [Google Scholar] [CrossRef] [Scilit]
- Abdulla, H.Y.H. Petrological and Petrophysical Causes for Porosity Reduction by Bitumen Plugging, Uwainat Limestone (Middle Jurassic), Dukhan Field, Qatar. Master’s Thesis, Texas A&M University, College Station, TX, USA, 2002. [Google Scholar]
- Pendias, H. Trace Elements in Soils and Plants; Springer: Dordrecht, The Netherlands, 1992. [Google Scholar]
- Taylor, S.R.; McLennan, S.M. The Continental Crust: Its Composition and Evolution; Blackwell Scientific Publications: Oxford, UK, 1985. [Google Scholar]
- EL-Sorogy, A.S.; Almadani, S.A.; Al-Dabbagh, M.E. Microfacies and diagenesis of the reefal limestone, callovian Tuwaiq mountain limestone formation, central Saudi Arabia. J. Afr. Earth Sci. 2016, 115, 63–70. [Google Scholar] [CrossRef] [Scilit]
- El-Sorogy, A.S.; Al-kahtany, K.; Alharbi, T.; Alarifi, S.S. Distribution patterns, health hazards, and multivariate assessment of contamination sources of As, Pb, Ni, Zn, and Fe in agricultural soils. J. King Saud. Univ.—Sci. 2024, 36, 103489. [Google Scholar] [CrossRef] [Scilit]
- Ma, H.; Mi, M.; Wang, C.; Wu, X.; Zhen, Z. The concentrations, sources, ecological, and human health risk assessment of heavy metals in roadside soils of six cities in Shanxi Province, China. Environ. Toxicol. Chem. 2023, 42, 1485–1500. [Google Scholar] [CrossRef] [Scilit] [PubMed]
- Alharbi, T.; El-Sorogy, A.S.; Al-Kahtany, K.; Giacobbe, S.; Nour, H.E. Ecological and health risk evaluation of Pb, Cd, As, and Cu contamination in agricultural soils in arid regions. Phys. Chem. Earth Parts A/B/C 2026, 144, 104564. [Google Scholar] [CrossRef] [Scilit]
- Habous Nazzal, Y.; Al-Arifi, N.; Kamran Jafri, M.; Kishawy, H.; Ghrefat, H.A.; El-Waheidi, M.M.; Batayneh, A.T.; Zumlot, T.A. Study the urban soils contamination by heavy metals for selected industrial locations in the Greater Toronto area, Canada, using multivariate statistical analysis. Geol. Croat. 2015, 68, 147–159. [Google Scholar] [CrossRef] [Scilit]
- Nazzal, Y.; Bărbulescu, A.; Sharma, M.; Howari, F.; Salem, I.B.; Dghaim, R.; Kumbhar, P.; Xavier, C.M.; Alghafli, S.; Al-Taani, A.A.; et al. Heavy metal pollution in arid urban environments: Anthropogenic and geogenic insights from road dust in the united arab emirates. Arch. Environ. Contam. Toxicol. 2025, 89, 313–334. [Google Scholar] [CrossRef] [Scilit] [PubMed]
- Kaiser, H.F. An index of factorial simplicity. Psychometrika 1974, 39, 31–36. [Google Scholar] [CrossRef] [Scilit]
- Kazapoe, R.W.; Mvile, B.N.; Kalimenze, J.D.; Kwayisi, D.; Sagoe, S.D.; Ibrahim, K.; Fynn, O.F. Source apportionment of potentially toxic elements in soils from an urbanising region: Insights from multivariate analysis in Singida, Tanzania. Geosyst. Geoenviron. 2025, 4, 100396. [Google Scholar] [CrossRef] [Scilit]
- Ali, M.; Alshamsi, D.; Ahmad, T.; Ahmed, A.; Abdelfadil, K.M. Assessment of Potentially Toxic Metals (PTMs) Pollution, Ecological Risks, and Source Apportionment in Urban Soils from University Campuses: Insights from Multivariate and Positive Matrix Factorisation Analyses. Minerals 2025, 15, 482. [Google Scholar] [CrossRef] [Scilit]
- Liu, J.; Kang, H.; Tao, W.; Li, H.; He, D.; Ma, L.; Tang, H.; Wu, S.; Yang, K.; Li, X. A spatial distribution–Principal component analysis (SD-PCA) model to assess pollution of heavy metals in soil. Sci. Total. Environ. 2023, 859, 160112. [Google Scholar] [CrossRef] [Scilit] [PubMed]
- Zhang, Y.; Song, B.; Zhou, Z. Pollution assessment and source apportionment of heavy metals in soil from lead–Zinc mining areas of south China. J. Environ. Chem. Eng. 2023, 11, 109320. [Google Scholar] [CrossRef] [Scilit]
- Polanco-Martínez, J.M.; Fernández-Macho, J.; Medina-Elizalde, M. Dynamic wavelet correlation analysis for multivariate climate time series. Sci. Rep. 2020, 10, 21277. [Google Scholar] [CrossRef] [Scilit] [PubMed]
- Okturen Asri, F.; Demirtas, E.I.; Simsek, M.; Erturk, M.E.; Ari, N.; Ozkan, C.F.; Ozbek, O.; Guven, D.; Caglayan, N. Ecological and human health risk assessment of potential toxic elements in agricultural soils in Mugla Province, Turkiye. Environ. Geochem. Health 2025, 48, 4. [Google Scholar] [CrossRef] [Scilit] [PubMed]
- Almasoud, F.I.; Usman, A.R.; Al-Farraj, A.S. Heavy metals in the soils of the Arabian Gulf coast affected by industrial activities: Analysis and assessment using enrichment factor and multivariate analysis. Arab. J. Geosci. 2015, 8, 1691–1703. [Google Scholar] [CrossRef] [Scilit]
- Al-Wabel, M.I.; Sallam, A.E.-A.S.; Usman, A.R.; Ahmad, M.; El-Naggar, A.H.; El-Saeid, M.H.; Al-Faraj, A.; El-Enazi, K.; Al-Romian, F.A. Trace metal levels, sources, and ecological risk assessment in a densely agricultural area from Saudi Arabia. Environ. Monit. Assess. 2017, 189, 252. [Google Scholar] [CrossRef] [Scilit] [PubMed]
- Ahmad, W.; Alharthy, R.D.; Zubair, M.; Ahmed, M.; Hameed, A.; Rafique, S. Toxic and heavy metals contamination assessment in soil and water to evaluate human health risk. Sci. Rep. 2021, 11, 17006. [Google Scholar] [CrossRef] [Scilit] [PubMed]
- Tomlinson, D.L.; Wilson, J.G.; Harris, C.; Jeffrey, D. Problems in the assessment of heavy-metal levels in estuaries and the formation of a pollution index. Helgoländer Meeresunters 1980, 33, 566–575. [Google Scholar] [CrossRef] [Scilit]
- Freije, A.M. Heavy metal, trace element and petroleum hydrocarbon pollution in the Arabian Gulf. J. Assoc. Arab. Univ. Basic Appl. Sci. 2015, 17, 90–100. [Google Scholar] [CrossRef] [Scilit]
- Al-Taani, A.A.; Nazzal, Y.; Howari, F.M.; Iqbal, J.; Bou Orm, N.; Xavier, C.M.; Bărbulescu, A.; Sharma, M.; Dumitriu, C.-S. Contamination assessment of heavy metals in agricultural soil, in the Liwa area (UAE). Toxics 2021, 9, 53. [Google Scholar] [CrossRef] [Scilit] [PubMed]
- Hui, X.; Sheikh Asadi, A.M.; Fakhri, Y.; Mehri, F.; Limam, I.; Thai, V.N. Potential toxic elements in costal sediment of the Persian Gulf: A systematic review-meta-analysis, non-dietary risk assessment and ecological risk assessment. Environ. Sci. Pollut. Res. 2023, 30, 64891–64903. [Google Scholar] [CrossRef] [Scilit] [PubMed]
- Jupp, B.P.; Uddin, S.; Fowler, S.W.; Faizuddin, M. Trace metal and TBT pollution in the Gulf and Oman: Spatial variation and hot spots. Environ. Sci. Pollut. Res. 2023, 30, 76351–76371. [Google Scholar] [CrossRef] [Scilit] [PubMed]
- Swetha, S.; Veerasingam, S.; Rajendran, S.; Hassan, H.; Hashmi, M.Z.U.R.; Alsaadi, H.; Rangel-Buitrago, N.; Sadooni, F.N. Long-term trends in heavy metal contamination of marine sediments in the Arabian Gulf: A meta-analysis. Environ. Monit. Assess. 2025, 197, 873. [Google Scholar] [CrossRef] [Scilit] [PubMed]
- Thankamony, R.; Al Hammadi, H.A.; Al Hashmi, A.H.; AlJaberi, K.K.; Perumal, P.; Al Khaled, H.; Al Yafei, M.A.; Al Neyadi, M.R.; Al Hosani, Y. Heavy Metal Pollution in Abu Dhabi Marine Sediments: A Comparative Study across Different Environmental Areas Using Various Pollution Assessment Indices. Eur. J. Environ. Earth Sci. 2025, 6, 15–29. [Google Scholar] [CrossRef] [Scilit]
- Alotaibi, M.O.; Albedair, L.A.; Alotaibi, N.M.; Elobeid, M.M.; Al-Swadi, H.A.; Alasmary, Z.; Ahmad, M. Pollution indexing and health risk assessment of heavy-metals-laden indoor and outdoor dust in elementary school environments in Riyadh, Saudi Arabia. Atmosphere 2022, 13, 464. [Google Scholar] [CrossRef] [Scilit]
- Santoro, A.; Held, A.; Linsinger, T.P.; Perez, A.; Ricci, M. Comparison of total and aqua regia extractability of heavy metals in sewage sludge: The case study of a certified reference material. TrAC Trends Anal. Chem. 2017, 89, 34–40. [Google Scholar] [CrossRef] [Scilit] [PubMed]
- Nawar, S.; Mohamed, E.S.; Essam-Eldeen Sayed, S.; Mohamed, W.S.; Rebouh, N.Y.; Hammam, A.A. Estimation of key potentially toxic elements in arid agricultural soils using Vis-NIR spectroscopy with variable selection and PLSR algorithms. Front. Environ. Sci. 2023, 11, 1222871. [Google Scholar] [CrossRef] [Scilit]

Disclaimer/Publisher’s Note: The statements, opinions and data contained in all publications are solely those of the individual author(s) and contributor(s) and not of MDPI and/or the editor(s). MDPI and/or the editor(s) disclaim responsibility for any injury to people or property resulting from any ideas, methods, instructions or products referred to in the content. |
© 2026 by the authors. Licensee MDPI, Basel, Switzerland. This article is an open access article distributed under the terms and conditions of the Creative Commons Attribution (CC BY) license.