


Abstract
Desertification is destabilizing the Agro-Pastoral Ecotone of Northern China (APENC) as a critical ecological barrier, making its monitoring and management a central challenge for dryland sustainability. We tracked desertification dynamics across the APENC (2000–2024) using the desertification difference index (DDI) and, by integrating multi-source remote sensing data with an interpretable machine learning framework, systematically deciphered its drivers. The primary results were as follows: (1) Desertification underwent a net reversal, with 60.09% of the region showing significant improvement; extremely severe and severe desertification declined by approximately 40% and 35%, respectively, despite a brief degradation pulse during 2005–2010. (2) Land surface temperature (LST), precipitation (PRE), and soil moisture (SM) were identified as the primary drivers of desertification outweighing human activities, exhibiting nonlinear threshold behaviors with critical tipping points at 17.93 °C (LST), 416.44 mm (PRE), 6.91 mm (SM), and 0.75 kPa (VPD) that govern ecological degradation–recovery transitions. (3) 2D partial dependence plots (PDPs) reveal that under compound dry-heat stress (LST > 20 °C and PRE < 300 mm), wind speed reduction alone fails to reverse degradation due to collapsed ecosystem resilience. The results reveal elevation-dependent pathways of desertification reversal. Strong hydrothermal coupling in lowland areas enables water supplementation to rapidly promote vegetation recovery and desertification reversal, whereas weakened hydrothermal coupling in highland areas requires coordinated management of moisture limitation, thermal stress, and wind erosion. These findings underscore the nonlinear dynamics and critical thresholds of dryland restoration, offering a practical framework for adaptive, spatially explicit land management in the APENC and similar dryland ecotones globally.
1. Introduction
Desertification refers to the long-term degradation of land in arid, semi-arid, and dry subhumid regions under the combined influence of climate change and human activities [1,2]. It has become one of the most serious environmental challenges worldwide, threatening the livelihoods of nearly one billion people, restricting agricultural and industrial development, and generating substantial economic losses, especially in developing countries [3,4]. Current global efforts to combat desertification typically include vegetation restoration, water management, and sustainable agricultural practices, with the aim of increasing surface cover, improving soil structure, and ultimately mitigating land degradation [5]. However, the responses of dryland ecosystems to external disturbances often exhibit abrupt shifts and regional heterogeneity [6]. This complexity hinders the implementation of precise, site-specific interventions and, in water-scarce regions, may even give rise to paradoxical outcomes such as “local improvement but overall deterioration” or “short-term recovery but long-term failure” [7,8,9].
Satellite remote sensing has substantially advanced desertification monitoring across broad spatial and temporal scales. Most previous studies relied on visual interpretation or single spectral indices (e.g., NDVI, EVI, MSAVI) combined with vegetation field surveys [10,11,12]. However, such one-dimensional indices inherently limit classification accuracy and often miss the coupled surface energy–water fluxes that drive desertification, introducing considerable uncertainty in heterogeneous semi-arid landscapes [13]. To overcome this limitation, scholars proposed a desertification difference index (DDI) based on the Albedo–NDVI feature space that can simultaneously integrate surface albedo and vegetation cover information [14,15]. Across various sand and grassland ecosystems in Northern China, the DDI has proven highly sensitive and reliable in capturing surface cover evolution and hydrothermal dynamics [16]. However, a systematic understanding of desertification dynamics and the quantitative attribution of driving mechanisms across the agro-pastoral transition zone remain insufficient [17,18]. The absence of a large-scale energy–water synergy perspective obscures desertification stress under climate–human couplings and severely constrains sustainable management.
Disentangling the complex mechanisms driving desertification remains a formidable challenge [19,20]. Methods such as principal component analysis (PCA), residual trend analysis (RESTREND), Geodetector, and correlation analysis are fundamentally linear and have been widely used to evaluate individual drivers of desertification expansion and reversal [21,22,23]. Climate fluctuations, topographic constraints, vegetation feedbacks, and anthropogenic perturbations are tightly interwoven and often exhibit strong nonlinearities and threshold-type behaviors that conventional linear approaches cannot adequately capture [24]. Machine learning has recently opened up a practical way forward. Algorithms such as random forest (RF), extreme Gradient Boosting (XGBoost), and Categorical Boosting (CatBoost) effectively handle high-dimensional predictors, accommodate nonlinear relationships, and disentangle complex ecological interactions [25]. However, spatial heterogeneity and geographic context often cause local feature effects to obscure global interpretation in these models, making it difficult to infer consistent directions and strengths of influence and limiting mechanistic understanding [26,27]. Although explainable artificial intelligence, exemplified by SHAP, has been introduced into land degradation assessment, most studies remain at a shallow level, using SHAP primarily for coarse feature importance ranking or unidirectionally identifying dominant factors such as climate change and human activities [28,29]. Systematic exploration of nonlinear marginal effects is needed, and so is exploring response patterns of joint interactions among multiple drivers. These efforts are essential for revealing synergistic and antagonistic mechanisms. Such mechanisms drive ecosystems towards critical thresholds. Yet, this exploration has received relatively limited attention [30]. Combining SHAP with partial dependence analysis (PDP) can more effectively characterize nonlinear transitions in driver–response relationships, thereby providing methodological support for delineating threshold-sensitive zones and identifying key control targets [31]. This shift toward an interpretable paradigm enables the accurate, quantitative characterization of nonlinear ecological thresholds, offering a more refined perspective on the coupled mechanisms driving desertification.
The Agro-Pastoral Ecotone of Northern China (APENC) serves as a critical ecological barrier under substantial stress. Prior to 2000, this region was historically situated along a sharp hydroclimatic transition, possessing an inherently fragile ecological baseline that was highly susceptible to climate fluctuations [18,32]. In response, China’s central and local governments have implemented a series of large-scale ecological restoration initiatives, most notably the Three-North Shelterbelt Forest Program and the Grain-for-Green Program [19,33]. Yet their effectiveness remains intensely debated in the context of climate change [7,8]. On the one hand, numerous studies confirm that vegetation cover in the APENC has increased substantially, desertification has reversed, carbon sequestration has improved, and soil erosion has declined [34,35,36]. Notably, in key governance regions such as the Loess Plateau and the Mu Us Sandy Land, substantial achievements have been made [37,38]. Conversely, an increasing amount of evidence reveals a potential ecological constraint—vegetation restoration may have reached the maximum sustainable limit of regional water availability [8], as increased greening enhances transpiration, thickens the soil dry layer, and degrades secondary vegetation, with excessive restoration causing local ecological decline in some arid sub-regions [7,39]. Furthermore, evidence suggests that the 400 mm isohyet is shifting northwestward, potentially reshaping the desertification gradient [40]. Therefore, it is worth discussing and conducting comprehensive analysis regarding whether the current ecological restoration projects have truly and sustainably improved the desertified environment of APENC.
To address the above limitations, this study focuses on two core objectives. First, we apply the DDI to classify desertification severity across the APENC region. On this basis, we conduct an in-depth analysis of the spatiotemporal characteristics and evolution patterns of desertification in the region from 2000 to 2024. Second, by integrating machine learning techniques with the SHAP framework, we reveal how key drivers influence desertification within the APENC region. Specifically, this study quantifies the contributions of natural and anthropogenic drivers and quantitatively analyzes the thresholds of their nonlinear interactions, offering the wind erosion community deeper insights into the limitations of traditional wind-speed-centric mitigation strategies. The findings are intended to provide a robust and interpretable scientific basis for formulating precise and sustainable land management policies, particularly in adapting and optimizing wind-erosion control under shifting hydrothermal constraints, for the APENC region and comparable arid areas worldwide.
2. Materials and Methods
2.1. Study Area
This study focuses on the APENC (Figure 1), situated in the arid–semi-arid transitional zone of Northeast and North China (102°56′–123°42′ E, 36°01′–47°09′ N). The APENC spans nine provincial-level administrative units: NM (Nei Mongol), HLJ (Heilongjiang), JL (Jilin), LN (Liaoning), HE (Hebei), SX (Shanxi), SN (Shaanxi), NX (Ningxia), and GS (Gansu) [41,42]. Covering a total area of approximately 7.07 × 10⁵ km2, the region extends from the Greater Khingan Mountains to the eastern foothills of the Qilian Mountains [43]. Straddling the 400 mm mean annual precipitation isohyet, the APENC is characterized by a sharp decrease in annual precipitation from approximately 450 mm in the southeast to 250 mm in the northwest, while annual evapotranspiration ranges from 300 to 1100 mm [44]. Cultivated land and grassland are intricately interwoven, and over remarkably short distances the landscape transitions from forest-steppe to desert-steppe, closely tracking the steep gradients in moisture and temperature. Under the compound pressures of intensifying climatic aridity, anthropogenic activities, and large-scale ecological restoration projects, the APENC serves as an indispensable natural laboratory for unraveling desertification drivers and advancing sustainable dryland governance; insights gained here can inform land management strategies across fragile arid regions globally.
Figure 1.
The location of the study area (GS (2025) 1508).
2.2. Data Sources and Preprocessing
Table 1 summarizes the datasets used in this study. Drawing on multi-source remote sensing and reanalysis products for the 2000–2024 period, the data fall into five broad categories: topography, human activity, meteorology, vegetation, and soil properties. Annual average NDVI values were derived from the MODIS 8-day surface reflectance product (MOD09A1). To capture peak vegetation vigor and reduce phenological bias, we extracted imagery spanning the growing season (June 1 to September 30) for each year. A rigorous quality control process was applied using the StateQA band to mask clouds, cloud shadows, and snow, alongside an MNDWI threshold (<0.2) to exclude water bodies. The annual NDVI was then computed as the mean of these quality-filtered observations, which was subsequently utilized alongside surface albedo to construct the feature space for desertification analysis. Topographic information was obtained from 2024 elevation data, from which slope data were extracted for the study area. Temperature, precipitation, wind speed, potential evapotranspiration, and land surface temperature are all represented as annual averages. Both satellite and climate datasets were sourced from the Google Earth Engine (GEE) platform (https://code.earthengine.google.com), where datasets such as MOD11A2, MOD09A1, and MOD13A3 were downloaded, processed, and calculated. To ensure good spatial overlap among the indicators used, all raster data were projected and spatially cropped to the study area. During spatial harmonization, continuous variables such as climatic data and vegetation indices were resampled to a uniform 1 km spatial resolution using bilinear interpolation. Conversely, the nearest neighbor resampling method was applied to categorical variables, including land use and land cover change and soil texture, to strictly preserve their original discrete class designations. Non-land features such as water bodies and snow/ice were subsequently masked out to eliminate interference.
Table 1.
Data source and information.
2.3. Research Methods
Figure 2 illustrates the overall methodological framework of this study. First, the DDI was constructed using the Albedo–NDVI feature space, and desertification was classified into five severity levels (ranging from extremely severe to non-desertification), followed by a rigorous accuracy validation with high-resolution imagery. In the second step, the spatiotemporal evolution of desertification was examined. From 2000 to 2024, the spatiotemporal dynamics of different desertification severity levels were characterized using the Theil–Sen median trend analysis combined with the Mann–Kendall significance test. Third, desertification state transitions were investigated. A transition matrix was used to trace and visualize conversions among different desertification states, thereby capturing their flow characteristics across the continuous time series. Finally, an interpretable machine learning framework was adopted. After evaluating seven candidate algorithms, the optimal XGBoost model was coupled with SHAP and 2D-PDP to unravel the nonlinear drivers, critical ecological thresholds, and synergistic mechanisms underlying regional desertification.
Figure 2.
The research framework.
2.3.1. Construction of the Desertification Difference Index (DDI)
The DDI model was constructed based on the Albedo–NDVI feature space, and surface parameters were retrieved to classify desertification states (Figure 3). The Albedo–NDVI feature space captures variations in land cover and hydrothermal conditions, where the two variables exhibit an overall negative correlation, typically forming a trapezoidal distribution. Different land surface types occupy distinct positions within the feature space. Point A represents arid bare land with sparse vegetation and low moisture content; point B represents densely vegetated regions with low moisture or water stress; point C represents areas with dense vegetation and high moisture; and point D represents areas with sparse vegetation but relatively high moisture, such as wet bare soil. These four points characterize the extreme surface conditions. The fitted linear trend line in the figure represents the desertification process, indicating a gradual loss of moisture from points C and D toward points A and B.
Figure 3.
Feature space of Albedo–NDVI.
According to the findings of Verstraete and Pinty [45], partitioning along the perpendicular direction to the linear fitting trend line allows for the effective discrimination of different desertification states, thereby enabling the inversion of the DDI. The position of the perpendicular direction in the feature space can be expressed using a simple binary linear polynomial:
Surface albedo was derived from the MOD09A1 product using a linear combination of five spectral bands (Band 1, Band 3, Band 4, Band 5, and Band 7), where DDI denotes the desertification difference index, and k is a coefficient that can be estimated through a univariate linear regression of NDVI and Albedo, as shown below:
where a and b are the fitted coefficient and intercept, respectively.
2.3.2. Theil–Sen–MK Trend Analysis
Trend analysis is a key method for determining the direction of change in the degree of desertification. This paper employs Theil–Sen (TS) trend analysis and the Mann–Kendall (MK) test to investigate the upward or downward trends in desertification and their significance in the APENC between 2000 and 2024 [46,47].
The TS method is less susceptible to outliers and is suitable for trend analysis of long-term time series containing noise [48]; it is used to characterize the temporal trends in the DDI of APENC. The calculation method is as follows:
where represents the trend magnitude, > 0 indicates an upward trend in the DDI, < 0 indicates a downward trend, and = 0 indicates stability. The significance of the trend is determined using the MK statistical test.
The MK test is a non-parametric statistical method that examines monotonic trends by analyzing the rank relationships within time-series data. Its advantages lie in its independence of data distribution assumptions and its strong robustness to missing and outlier values, making it widely used for testing the significance of monotonic trends in long-term time series. At a given significance level α, if |Z| ≥ Z1 − α/2, the null hypothesis is rejected, indicating that a significant trend exists in the series, where Z > 0 indicates an upward trend and Z < 0 indicates a downward trend. Typically, significance is determined based on corresponding confidence intervals. If |Z| ≥ 1.96 or 1.65 ≤ |Z| < 1.96, the trend passes the 95% (p ≤ 0.05) or 90% (p ≤ 0.10) confidence level tests, respectively. Trends where |Z| < 1.65 are considered to have no significant change. The detailed 7-category classification standards are presented in Table 2.
Table 2.
Mann–Kendall test method significance statistics.
2.3.3. Transition Matrix
To investigate changes in desertification levels in the APENC from 2000 to 2024, a transition matrix was employed to characterize spatiotemporal variations across the study period [49]. A transition matrix allows us to follow how land changes between desertification classes over a given period. It captures both structural changes and area conversions. Its general form is given below:
where represents the area converted from desertification type to type within the study period, and denotes the total number of desertification categories.
2.3.4. Machine Learning Methods and SHAP Model
We chose seven machine learning models for this study: XGBoost, CatBoost, Adaptive Boosting (AdaBoost), Light Gradient Boosting Machine (LightGBM), RF, Gradient Boosting Decision Tree (GBDT), and Support Vector Regression (SVR) [50,51]. Prior to model interpretation, a rigorous training and evaluation protocol was established to ensure robust predictive performance. The dataset was randomly partitioned into a training set (80%) and an independent testing set (20%). To prevent overfitting and determine the optimal model architecture, we applied a grid search approach coupled with 5-fold cross-validation during the training phase. The predictive performance and generalization capabilities of all seven models were subsequently quantified on the independent test set using three standard statistical metrics: the Coefficient of Determination (R^2), Root Mean Square Error (RMSE), and Mean Absolute Error (MAE). While these models achieve exceptional predictive accuracy for regression and classification tasks, their inherent “black-box” nature obscures the specific direction and magnitude of the impacts of individual driving factors on the DDI. To overcome this limitation and decode the optimal model, we integrated the SHAP approach [52]. SHAP, based on cooperative game theory, quantifies marginal contributions of each variable across feature subsets to decompose predictions. Its global and local interpretability, delivered through intuitive visuals, significantly bolsters model transparency and robustness [53]. The calculation is formulated as follows:
where is the SHAP value of feature ; is the set of all features; represents a feature subset excluding ; and denote the number of features in the respective sets; and is the model’s predicted output given the feature subset .
2.3.5. Partial Dependence Plot (PDP) Interaction Analysis
To capture these interactive effects, we subsequently adopted a bivariate PDP framework to examine the joint responses of the DDI to key driving variables [54]. By plotting the combined effects of two feature variables on the prediction results within a two-dimensional space, this approach systematically examines how paired features jointly influence the predicted values. Traditional one-dimensional analyses often obscure the complex, coupled mechanisms inherent in ecosystems. Bivariate PDPs circumvent this limitation by intuitively mapping the synergistic or antagonistic interactions between two variables across varying continuous ranges.
3. Results
3.1. Desertification Classification and Accuracy Assessment
By constructing an Albedo–NDVI feature space, we calculated the DDI across the entire study period. The Natural Breaks (Jenks) method was then applied to this pooled DDI dataset to establish fixed thresholds, categorizing desertification severity in the APENC region into five distinct classes: extremely severe, severe, moderate, slight, and non-desertification [55].
To ensure the validity of our desertification classification, we evaluated its accuracy by employing a confusion matrix. For this purpose, a total of 200 reference points were drawn from the 2024 classification maps, with their respective land cover types determined through visual interpretation of high-resolution Google Earth imagery obtained from the same timeframe. The cross-validation results confirmed the high accuracy of the DDI-based desertification classification, with 186 validation samples correctly identified. Across all classes, the User’s Accuracy (UA) ranged from 90% to 100%, and the Producer’s Accuracy (PA) ranged from 87.5% to 97.22%. In addition, the overall accuracy (OA) reached 93%, with a Kappa coefficient of 0.9092. These accuracy metrics indicate strong spatial consistency between the mapped desertification patterns and ground reference data, highlighting the reliability and applicability of the DDI for large-scale desertification assessment.
3.2. Spatiotemporal Dynamics and Trajectories of Desertification in the APENC
3.2.1. Spatial Patterns and Evolution of Desertification in the APENC
Desertification in the APENC exhibited a clear spatial gradient (Figure 4). Areas with higher desertification severity were mainly concentrated in the southwest, while the severity gradually decreased toward the northeast. Extreme and severe desertification were predominantly observed in the southwest, covering GS, NX, northern SX, and parts of NM, areas geomorphologically situated along the northern fringe of the Loess Plateau, the Ordos Plateau, and the Mu Us Sandy Land, where aeolian sand and loess hilly landscapes are prevalent. Conversely, lightly degraded or non-desertified land was largely found in the northeast. Throughout the 24-year observation period, the spatial footprint of these severe degradation zones exhibited marked shrinkage, breaking down from large, continuous expanses into more isolated and scattered patches. Concurrently, slight and non-desertified areas gradually expanded, with notable regional amelioration observed in northern SX and eastern NM (e.g., Horqin Sandy Land). Overall, these findings point to a sustained and successful ecological recovery within the APENC over the past two decades, leading to a significant mitigation and near-reversal of desertification.
Figure 4.
Spatiotemporal dynamics of desertification severity in the APENC.
3.2.2. Temporal Dynamics and Provincial Heterogeneity of Desertification Evolution
In order to systematically analyze the spatial and temporal evolution laws of APENC desertification, we analyze and quantify the succession of different degrees of desertification and the spatial differences between provinces (Figure 5). The analysis results show that APENC accounts for the largest proportion of moderate desertification area, and there is no obvious trend of time change (K = −0.0289, R2 = 0.047). The area of extreme and severe desertification has decreased significantly, from 9.95% and 19.35% to 5.97% and 12.57%, while the proportion of slight desertification and non-desertification areas has increased from 15.44% and 10.03% to 22.17% and 15.70%. Overall, extreme levels have decreased, moderate levels have remained stable, and mild desertification has expanded. Corresponding to these changes, the DDI value of the whole region has increased, indicating that the humidity conditions in the region have improved and the ecological conditions are recovering. However, there are still significant differences between regions. HE, LN, and HLJ maintained relatively high and increasing DDI values (e.g., LN increased from 0.466 to 0.946), whereas SX and SN showed steady increases (e.g., SX increased from 0.344 to 0.801), and NX shifted from negative to positive values (−0.187 to 0.294). These results suggest that ecological restoration measures have been effective, although the system remains dynamically evolving and exhibits substantial regional differences.
Figure 5.
Spatiotemporal dynamics of desertification in the APENC region from 2000 to 2024. (a) Transitions among different desertification levels. The shaded bands indicate the 95% confidence intervals of the fitted linear trends. (b) Interannual variations in the average DDI values across individual provinces.
3.3. Trend Analysis of Desertification Evolution
Applying the Theil–Sen–MK trend analysis (Figure 6), we detected a significant rise in the DDI from 2000 to 2024, with a decadal increase of 0.15 (p < 0.05). Spatial trends were classified into seven distinct categories. Improvement was the dominant trend, covering 65.59% of the total area. Within this category, significant improvement (p ≤ 0.05) accounted for 60.09%, slight improvement (0.05 < p ≤ 0.10) for 1.67%, and non-significant improvement (p > 0.10) for 3.80%. Geographically, these improvements were largely concentrated in NM and HLJ north of the APENC, and in LN, HE, and SX to the south, with minor occurrences in southern GS. Meanwhile, 33.13% of the region remained stable, primarily along the western margins (in NM, SX, and NX) and west of the Horqin Sandy Land. Degradation was minimal, affecting only 1.28% of the area, and appeared as fragmented patches in NM and HE north of the ecotone.
Figure 6.
Spatial distribution of desertification difference index (DDI) trends in the APENC from 2000 to 2024, based on Theil–Sen median trend analysis and Mann–Kendall significance tests.
3.4. Spatiotemporal Evolution and Transition Flow Characteristics of Desertification
The transition matrix in Figure 7 characterizes the evolutionary pathways of desertification in the APENC by showing the shifts among different degradation states. These transitions were classified into five types according to the degree of class change, namely significant degradation, degradation, stabilization, recovery, and significant recovery, corresponding to a decline of two or more classes, a decline of one class, no change, an improvement of one class, and an improvement of two or more classes, respectively.
Figure 7.
Segmented transformation characteristics of desertification types in the APENC. (a) 2000–2005, (b) 2005–2010, (c) 2010–2015, (d) 2015–2020, (e) 2020–2024, and (f) 2000–2024.
Over the entire study period (2000–2024), desertification in the APENC shifted from localized deterioration to an overall reversal. Areas of stabilization dominated the region, covering 25.71 × 10⁴ km2. During this period, desertification control was highly effective, with recovery and significant recovery areas far exceeding degraded areas. Significant degradation was limited to only 0.35 × 10⁴ km2. From 2000 to 2005, recovery was dominant, covering 18.93 × 10⁴ km2, mainly occurring in central-eastern NM, HE, and LN. The area that transitioned from severe to moderate desertification reached 12.66 × 10⁴ km2, while that transitioning from moderate to slight desertification reached 3.97 × 10⁴ km2. Between 2005 and 2010, degraded and significantly degraded areas reached 13.27 × 10⁴ km2 and 0.82 × 10⁴ km2, respectively. The transition from moderate to severe desertification was the dominant pathway. Meanwhile, transitions from severe to extremely severe (9.24 × 10⁴ km2) and from slight to moderate desertification (10.94 × 10⁴ km2) further intensified the overall degradation trend. After 2010, desertification shifted from intensification to gradual recovery. From 2010 to 2015, the transition from severe to moderate desertification was dominant. The combined recovery area reached 12.10 × 10⁴ km2, approximately 1.6 times the degraded area. During 2015–2020 and 2020–2024, the recovery trend continued to strengthen, with the recovery area reaching 13.25 × 10⁴ km2 and 14.55 × 10⁴ km2, respectively. These transitions were primarily from severe to moderate and from moderate to slight desertification, indicating the effectiveness of regional ecological restoration efforts.
3.5. Driving Forces of Desertification
3.5.1. Feature Selection and Multicollinearity Diagnostics
An initial pool of 19 potential factors influencing land desertification was compiled, covering climatic and environmental conditions, human activities, and soil properties. It is worth noting that while specific large-scale ecological engineering projects were not introduced as standalone proxy variables, their anthropogenic impacts are intrinsically quantified and represented by the LUCC indicator. These factors were screened through multicollinearity diagnosis and feature selection, as illustrated by the correlation heat map (Figure 8), which confirms that our final modeling framework possesses sufficient stability and interpretative reliability to effectively attribute the driving forces of the DDI in the APENC.
Figure 8.
Correlation heat map.
Our initial correlation analysis indicated a pronounced association between actual evapotranspiration (AET) and both precipitation (PRE) and soil moisture (SM). We consequently chose to exclude AET from the model. This decision was based on the fact that PRE acts as the principal water source for the APENC, while SM plays an unmatched critical role in the region’s ecohydrological circulation. We also observed substantial collinearity among the four vegetation indices: the enhanced vegetation index (EVI), normalized difference vegetation index (NDVI), fractional vegetation cover (FVC), and leaf area index (LAI). These redundant factors with severely overlapping information were removed to prevent model distortion or overfitting caused by highly correlated explanatory variables. Furthermore, the diagnosis revealed a very low correlation between nighttime light (NTL) and both gross domestic product (GDP) and population (POP). This finding reflects a spatial decoupling between human activities and infrastructure development in the APENC; consequently, GDP and POP were retained as independent variables representing human activities. After multicollinearity diagnosis, six factors with VIF > 10 were removed, yielding 13 variables for the subsequent driving mechanism analysis.
3.5.2. Contributions of Key Drivers and Predictive Modeling Analysis
After cross-validation and grid search-based hyperparameter optimization of seven machine learning models, XGBoost was selected for feature interpretation because it achieved the best predictive performance on the test set (Table 3). The relatively small gap between training and testing performance (ΔR2 = 0.12) further indicated that the model had good generalization ability and a low risk of overfitting. Therefore, XGBoost was used for the subsequent interpretation analysis.
Table 3.
Model performance summary.
The global SHAP results shown in Figure 9a quantified the relative contribution of each predictor to DDI variation. Land surface temperature (LST), precipitation (PRE), soil moisture (SM), elevation (DEM), land use and cover change (LUCC), and vapor pressure deficit (VPD) were identified as the dominant drivers of desertification dynamics across the APENC. Overall, regional DDI variation was mainly controlled by surface thermal and moisture conditions, whereas the direct contribution of socioeconomic factors, such as human activities, was relatively limited. Among all predictors, LST had the strongest influence, followed by PRE and SM, indicating that the interaction between heat and water availability plays a central role in regulating ecological sensitivity and desertification trajectories in the region. High LST values were mainly distributed on the negative side of the SHAP scale, suggesting that stronger surface heating can enhance evaporation, reduce DDI, and increase the risk of desertification. Similar negative effects were also observed for VPD and wind speed (WS), implying that dry atmospheric conditions and wind forcing may further accelerate local degradation. In contrast, PRE and SM showed positive effects on the DDI, indicating that improved water availability can alleviate environmental degradation and promote desertification reversal in the APENC.
Figure 9.
Global feature contributions and nonlinear dependence effects derived from the XGBoost-SHAP framework. (a) SHAP bar and swarm diagrams. (b) Partial dependence plots for the top six predictors, featuring Lowess smoothing curves and identifying critical transition thresholds between positive and negative impacts on the model output.
The partial dependence plots in Figure 9b further revealed nonlinear responses of the DDI to the main predictors. To quantitatively determine the critical ecological limits for each predictor, we identified the transition thresholds where the Lowess curves of the SHAP values intersected the zero-impact baseline (SHAP = 0). These intersection points signify the boundary where a driver’s marginal effect shifts between mitigating and exacerbating desertification. LST showed a strong negative effect, with an overall inverted S-shaped response curve. When LST was below 17.93 °C, thermal conditions generally had a moderately positive ecological effect and contributed to the recovery of degraded land. Once LST exceeded this threshold, the SHAP response declined sharply, indicating that higher-temperature conditions can significantly intensify desertification. Moisture-related variables, including PRE and SM, displayed gradually increasing positive effects. As PRE increased from 400 to 420 mm, the DDI rose markedly, and when PRE exceeded the threshold of 416.44 mm, its effect became positive and continued to strengthen with further increases in rainfall. For SM, the recovery threshold was identified at 6.91 mm, suggesting that even a small increase in soil moisture can trigger a rapid improvement in the DDI. However, the marginal positive effect tended to weaken as moisture conditions continued to improve. For topographic factors, DEM exhibited a bell-shaped response, with SHAP values peaking at approximately 500 m. This suggests that moderate elevation increases in low- and middle-altitude areas can help suppress desertification, while very high elevations may limit such improvements. LUCC showed a key ecological threshold at 9.0 (Savannas). LUCC categories below this threshold generally exerted a mitigative effect on surface desertification. In contrast, classes above nine shifted the SHAP response into a persistently negative state, with the notable exception of a brief positive anomaly at class 12 (croplands). The most pronounced negative ecological impacts were associated with classes 15 (permanent snow and ice) and 16 (barren land). Finally, the threshold of VPD was approximately 0.75 kPa. Once this threshold was exceeded, stronger atmospheric evaporative demand intensified soil water loss and vegetation stress, thereby aggravating desertification. These thresholds provide quantitative references for regional desertification prevention and control strategies.
3.5.3. Interaction Effects of Leading Predictors
To evaluate the interaction effects among influencing factors (represented by off-diagonal elements), we selected and combined the top eight off-diagonal SHAP values to compute the feature interaction SHAP matrix (Figure S1), outputting the top six groups of key interaction pairs (LST–PRE, LST–SM, LST–DEM, LST–WS, WS–DEM and WS–PRE). Subsequently, 2D PDP was employed to analyze and visualize the interaction effects on the DDI.
The interaction between land surface thermal stress and moisture availability (LST-PRE, Figure 10a) reveals a pronounced threshold-driven buffering mechanism. High DDI values (>Q3: 0.96) are strictly confined to a “cool–humid” ecological window (LST < 15 °C and PRE > 450 mm). Under severe hydrothermal stress (LST > 20 °C and PRE < 300 mm), the DDI drops to its absolute lowest point. Crucially, cooling the surface is insufficient to enhance the DDI when PRE falls below 300 mm, which clearly demonstrates that water scarcity imposes an irreversible constraint on ecological restoration in this region. This hydrothermal coupling is further corroborated by the LST-SM interaction (Figure 10b). Although relying solely on SM results in a higher baseline DDI (0.16) under dry conditions, suggesting a local buffering effect from deep soil moisture, a systemic reversal of desertification ultimately hinges upon meteoric precipitation inputs (PRE).
Figure 10.
2D PDPs of (a) PRE and LST; (b) SM and LST; (c) DEM and LST; (d) WS and LST; (e) WS and DEM; and (f) WS and PRE.
Figure 10c illustrates the coupling between LST and DEM, revealing that areas with an elevated DDI are largely confined to low-altitude zones (DEM < 1500 m) where surface thermal conditions remain cooler (LST < 15 °C). At higher elevations, the contour lines become parallel, suggesting that the effects of LST and DEM on the DDI become largely independent. A comparable threshold pattern characterizes the LST–WS interaction (Figure 10d). When LST remains below 15 °C, the DDI rises progressively with decreasing wind speed, peaking under conditions of LST < 10 °C and WS < 2 m/s. In contrast, once LST exceeds 20 °C, the DDI stays at a persistently low level irrespective of wind speed, indicating that under intense thermal stress, variations in wind speed are incapable of reversing the depressed DDI state.
Figure 10e demonstrates that the model predicts higher DDI values in low-elevation (DEM < 1200 m) and low-wind-speed (WS < 2.5 m/s) environments, which may be attributed to the relatively stable microclimates found in valleys or plains. In contrast, the predicted DDI sharply declines when the elevation exceeds 1200 m.
Finally, Figure 10f shows that regions with predicted high DDI values (>Q3: 0.74) are strictly confined to conditions of high precipitation (PRE > 450 mm) and moderate-to-low wind speeds (WS < 3.0 m/s). Conversely, low DDI values are clustered in low-precipitation zones, with the absolute minimum (0.39) occurring under extreme conditions (PRE < 200 mm and WS > 3.0 m/s). Notably, precipitation exhibits a strong dominant and threshold-driven role in this interaction. When PRE < 400 mm, the DDI struggles to surpass the median (0.59) regardless of wind speed, indicating that in severe moisture-deficit states, merely reducing wind speed cannot halt the desertification trend. Conversely, when PRE > 500 mm, lower wind speeds significantly amplify the positive ecological benefits of moisture, leading to a rapid surge in the DDI.
4. Discussion
4.1. Feature Space Construction and Robustness of Interpretable Machine Learning
In this study, the DDI was derived from the Albedo–NDVI feature space. By integrating vegetation condition with albedo-related information on surface drying and exposure, the index can more comprehensively characterize the spatial heterogeneity of land degradation across the semi-arid transition zone of the APENC [45,56,57]. This integrated approach is particularly suitable for long term desertification monitoring over large spatial extents. Compared with single-index approaches, it reduces the influence of seasonal vegetation phenology, soil background reflectance, and local surface heterogeneity, which often introduce uncertainty into desertification assessment [58,59]. Based on visual interpretation of high-resolution Google Earth imagery from 2024, the DDI classification achieved an overall accuracy (OA) of 93%, further supporting its applicability for monitoring fragile ecosystems in semi-arid transition zones. In terms of driver analysis, conventional linear and logistic regression methods have clear interpretability, yet their ability to capture nonlinear responses, threshold effects, and interactions among variables remains limited [60,61]. Consequently, these models often fail to adequately represent the complex coupling among hydroclimatic conditions, topography, and human activities in arid and semi-arid ecosystems [62]. Based on this, we compared the prediction performance of multiple machine learning models and selected the XGBoost model, which achieved the best performance on the test set (R2 = 0.864) with superior generalization ability, as the core explanatory model [63,64]. Compared with conventional tree-based ensemble models, XGBoost iteratively optimizes residual errors through gradient boosting, enabling it to capture complex nonlinear relationships while effectively reducing prediction bias. Meanwhile, its regularization strategy improves model generalization and reduces the risk of overfitting under heterogeneous environmental conditions. To decode the nature of desertification on APENC, we employed XGBoost alongside SHAP and PDP, and filtered candidate machine learning results before operationalizing the final model.
By coupling the XGBoost algorithm with the SHAP interpretation framework and the PDP, and initially screening multiple machine learning results to incorporate them into the operation, the “black box” driven by desertification on APENC is decrypted [65]. Before fitting the model, we checked for redundancy using correlation coefficients and VIF. Variables with VIF greater than 10 were excluded, which left us with 13 features. The XGBoost model then performed well on the test data, and the training-test difference fell within an acceptable range, so we considered its generalization ability satisfactory.
4.2. Spatial and Temporal Reversals of Desertification and Policy Implications
Against the backdrop of rapid climate change, there is still no unified consensus on the evolutionary patterns of desertification. Existing studies indicate that rising temperatures have significantly increased potential evapotranspiration, leading to widespread drying even in regions with relatively low precipitation risk [66,67]. In the APENC region in particular, desertification evolution has profoundly affected regional environmental structures and ecosystem functions. Spatially, desertification in APENC largely mirrors the 400 mm isohyet, with severity falling off from northeast to southwest and displaying strong heterogeneity. This matches the patterns reported for key restoration areas like the agro-pastoral ecotone of Inner Mongolia, the northeast, and Xilingol League [68,69,70]. Studies have shown that China’s 400 mm isohyet is migrating northwestward. This means that within the APENC, areas originally situated on the semi-humid side of the desertification gradient are climatically transitioning into semi-arid territory, driving an irreversible restructuring of desertification patterns [71]. Notably, between 2000 and 2020, approximately 32.88% of desertified land in Northern China experienced significant reversal [72]. However, our analysis reveals that desertification dynamics in APENC do not follow a monotonically linear improvement trend; instead, they exhibit a fluctuating trajectory from “localized deterioration” to “overall reversal”. Notably, the degradation peak during 2005–2010 was particularly pronounced in the central section of the APENC (the border area of south-central Nei Mongol and northern Shanxi–Hebei) and the western section (Central Gansu and the Hexi Corridor). This starkly contradicts the narrative of “overall reversal” in Northern China derived from large-scale studies, exposing how coarse regional averages conceal sharp internal spatial heterogeneity [73].
Although the overall desertification area has undergone large-scale contraction, this does not mean that the problem of desertification has been eliminated. Areas experiencing moderate desertification have maintained a high level of fluctuation over a long period without exhibiting a significant trend, indicating that moderate desertification acts as a highly active “buffer zone” during ecological succession. According to the state transition model in drought ecology, this buffer state represents an ecological threshold of instability [74]. Minor environmental fluctuations or human disturbances may drive these areas towards recovery or degradation, and some regions may transform from “deserts” to subcategories such as “semi-deserts” and “xerophytic shrublands” [75]. This finding provides a new perspective for evaluating the long-term benefits of ecological projects: the recovery of arid and semi-arid areas is not a linear and gradual process; rather, it is jointly regulated by climate fluctuations and the carrying capacity of regional water resources, exhibiting distinct phases and spatially differentiated behaviors [76,77,78,79]. Therefore, future ecological management strategies for desertification in the APENC should abandon “one-size-fits-all” engineering approaches and shift toward refined, dynamic, and adaptive management based on the different climatic zones and water resource conditions on both sides of the 400 mm isohyet.
4.3. Multi-Factor Nonlinear Driving Forces and Hydrothermal Coupling Interactions
Previous studies have shown that disturbance factors, such as fire, grazing, and nutrient supply, together with climatic variables, play important roles in arid and semi-arid ecosystems [80,81]. The nonlinear thresholds identified in this study further suggest that climatic drivers, particularly moisture deficits associated with climate warming, have become dominant forces driving desertification in APENC. The SHAP importance ranking indicates that climatic variables, including LST, PRE, and SM, collectively account for more than 50% of the total driving contribution, whereas LUCC and other direct anthropogenic interventions make relatively weaker contributions. Analysis based on NPP residuals similarly indicates that desertification reversal is mainly driven by the coupled effects of climate change and human activities, whereas desertification expansion is controlled by these factors with considerable spatial heterogeneity [82]. It is worth noting that while water bodies and permanent snow/ice were masked during the initial DDI calculations to strictly isolate terrestrial vegetation dynamics, they were intentionally retained in this modeling phase. Their inclusion is essential, as these land cover types act as critical natural regulators of regional hydrothermal patterns. Although LUCC ranks only fifth in the global SHAP importance ranking, the significant threshold inflection points near LUCC = 9 (savannas) and LUCC = 15–16 (permanent snow and ice; barren land) should not be overlooked. This suggests that, in coupled human–land systems, land-use transitions may trigger stepwise increases in desertification risk rather than gradual risk accumulation [6,83]. Although not dominant drivers, overgrazing and cropland expansion may indirectly disrupt the fragile LST–SM balance by altering surface albedo and soil structure, thereby acting as catalysts for crossing ecological resilience thresholds [84,85]. Traditional desertification management tends to focus on reversing land degradation through windbreaks (reducing wind speed) [86,87].
Crucially, under severe drought (PRE < 200 mm) or heat stress (LST > 20 °C), lowering wind speed alone cannot restore the desertification index. Ecosystem resilience has thus completely broken down under these compound extremes, meaning that sand control alone is powerless to compensate for the gulf between soaring transpiration demand and depleted soil moisture [88,89]. This finding is highly relevant to global efforts to understand and manage the increasing vulnerability of vegetation under compound dry-heat extreme events (CDHEs) [90]. Under coupled water–atmosphere stress, increased VPD accelerates evaporative water loss, activating a positive land–atmosphere feedback loop in which stomatal closure suppresses vegetation growth and the resulting loss of vegetation cover raises surface albedo and temperature, further amplifying VPD and locking the system into a degraded state [91]. Frequent crossing of these hydrothermal thresholds can repeatedly trigger this feedback loop, progressively eroding ecosystem resilience and driving persistent desertification, whereas even infrequent but sufficiently extreme crossings may induce hysteresis, locking the system into a degraded state for prolonged periods before any recovery becomes possible. Notably, the study found that even a small increase in soil moisture (threshold: 6.91 mm) can rapidly trigger desertification recovery. This finding supports the “water memory” hypothesis proposed by D’Odorico et al. [92], which suggests that small increases in surface soil moisture can promote the recovery of degraded dryland vegetation, although this process depends strongly on periodic rainfall as a reset mechanism.
Topography, represented by DEM, may influence desertification mainly by regulating local hydrothermal conditions rather than acting as a direct driving factor. The results indicate that hydrothermal coupling is stronger in low-altitude areas, whereas temperature and moisture factors become more weakly coupled or relatively independent at higher elevations. This elevation-related weakening of hydrothermal coupling reflects the regulatory role of complex terrain in ecological processes. In high-altitude areas, lower temperatures and stronger winds can limit vegetation growth and reduce the direct control of soil moisture on desertification. In low-altitude areas, stronger hydrothermal coupling leads to a more sensitive and nonlinear response of desertification reversal to changes in precipitation and soil moisture [93,94]. Therefore, when implementing desertification-control measures, low-elevation areas should prioritize water-recharge enhancement, such as rainwater harvesting and recharge projects, to activate the positive memory effect of SM, whereas high-elevation areas require greater attention to the integrated management of thermal stress and wind-erosion protection.
4.4. Research Limitations and Future Perspectives
Despite the valuable insights gained into the spatiotemporal evolution of desertification in the APENC and its nonlinear hydrothermal driving thresholds, several critical limitations warrant acknowledgment. Methodologically, the uniform 1 km spatial resolution, while optimal for macro-regional assessments, inevitably smooths out microtopographic variations, localized soil heterogeneity, and patch-scale ecological dynamics. This scale constraint may underrepresent local degradation hotspots, suggesting that future studies should integrate multi-source high-resolution imagery to capture finer spatial nuances. Temporally, relying on annual average meteorological and vegetation indices risks masking crucial intra-annual dynamics and short-term extreme weather events. Pulse disturbances, such as spring dust storms or abrupt flash droughts during the peak growing season, can impose disproportionate ecological stress that annual aggregates fail to capture, necessitating the incorporation of sub-seasonal or monthly time-series analyses. Finally, although SHAP and PDP effectively identify variable contributions and threshold responses, the resulting relationships should be interpreted as statistical associations rather than evidence of causality. In particular, for highly coupled hydrothermal variables such as LST, PRE, SM, and VPD, PDPs may produce combinations of predictor values that rarely occur in reality, potentially reducing the ecological realism of local threshold estimates. To get around this, we recommend that future work integrates nested cross-validation with ground-based observations, allowing for independent checks on major thresholds and the processes driving them. That way, both the statistical stability and the ecological plausibility of our inferences would be enhanced.
5. Conclusions
Using an integrated framework that combines the DDI, Theil–Sen–MK trend analysis, transition matrix, and XGBoost-SHAP-PDP interpretable modeling, we systematically deciphered the spatiotemporal patterns and nonlinear driving mechanisms of desertification across the APENC from 2000 to 2024. Our core findings are outlined as follows:
- (1)
- Desertification severity in the APENC exhibits a distinct southwest-to-northeast decreasing gradient, but its temporal dynamics are non-monotonic, characterized by three phases: local deterioration (2005–2010), overall reversal (post-2010), and fluctuating recovery. Moderately desertified areas remain highly volatile with no significant trend, serving as an unstable ecological buffer highly sensitive to climatic perturbations.
- (2)
- Climatic factors (LST, PRE, and SM) dominate the desertification process, accounting for >50% of the total explanatory power, while direct anthropogenic factors such as LUCC play a weaker but threshold-sensitive role. XGBoost-SHAP analysis identified critical nonlinear thresholds: LST exceeding 17.93 °C exacerbates desertification; PRE above 416 mm and SM above 6.91 mm trigger positive recovery effects; and LUCC classes 15–16 (barren land, permanent snow/ice) exhibit the strongest negative impacts.
- (3)
- Two-dimensional partial dependence plots reveal synergistic and antagonistic driver interactions. Under extreme drought (PRE < 200 mm) or heat stress (LST > 20 °C), wind speed reduction alone fails to reverse desertification, indicating a collapse of ecosystem resilience. At low elevations, a modest increase in soil moisture (≥6.91 mm) is sufficient to rapidly trigger recovery. At high elevations, hydrothermal decoupling necessitates comprehensive management strategies that jointly address thermal stress and wind erosion.
In conclusion, our study provides robust quantitative ecological thresholds and actionable targets for desertification control, emphasizing a shift from traditional windbreak engineering to threshold-guided hydrothermal adaptive management. Guided by our 2D-PDP interaction results, future governance should be spatially explicit: low-altitude, strong-coupling zones must prioritize targeted water replenishment to activate the soil moisture “water memory” effect, whereas high-altitude or compound stress zones require integrated strategies jointly managing thermal stress and wind erosion, providing a threshold-driven framework transferable to global drylands.
Supplementary Materials
The following supporting information can be downloaded at: https://www.mdpi.com/article/10.3390/land15081465/s1.
Author Contributions
Conceptualization, D.L. and Q.G.; methodology, D.L. and Q.G.; software, D.L., Y.D. and S.W.; validation, D.L., Q.G., S.Z. and B.D.; formal analysis, D.L. and Y.D.; investigation, D.L., Q.G., S.Z. and S.W.; resources, Q.G., S.Z. and S.W.; data curation, D.L. and Q.G.; writing—original draft preparation, D.L.; writing—review and editing, D.L., Q.G. and S.Z.; visualization, D.L., S.W. and B.D.; supervision, S.Z., S.W. and Y.D.; project administration, Q.G. and S.Z.; funding acquisition, Q.G. and S.Z. All authors have read and agreed to the published version of the manuscript.
Funding
This research was supported by the China Geological Survey Project (No. DD20230701102), the Natural Science Foundation of Inner Mongolia Autonomous Region of China (No. 2025QN04005, 2026QC0864), the Research-oriented Survey Project of the Ministry of Natural Resources of China (No. 2024ZRYJDC031), and the funding project of Northeast Geological S&T Innovation Center of China Geological Survey (No. QCJJ2024-32).
Data Availability Statement
No new data were created or analyzed in this study. Data sharing is not applicable to this article.
Acknowledgments
We are grateful to the Google Earth Engine platform and the data providers (including NASA, TerraClimate, WorldPop, and the National Earth System Science Data Center of China) for making the remote sensing and reanalysis datasets freely available. We also appreciate the constructive suggestions from the anonymous reviewers and the editorial team, which greatly improved the quality of this manuscript. Finally, we thank all members of our research group for their valuable discussions and technical assistance during data processing and model development.
Conflicts of Interest
The authors declare no conflicts of interest.
References
- United Nations Convention to Combat Desertification. United Nations Convention to Combat Desertification in Those Countries Experiencing Serious Drought and/or Desertification, Particulary in Africa; UN General Assembly: New York, NY, USA, 1999. [Google Scholar]
- Huang, J.; Zhang, G.; Zhang, Y.; Guan, X.; Wei, Y.; Guo, R. Global desertification vulnerability to climate change and human activities. Land Degrad. Dev. 2020, 31, 1380–1391. [Google Scholar] [CrossRef] [Scilit]
- Zolotokrylin, A. Global warming, desertification/degradation, and droughts in arid regions. Izv. Ross. Akad. Nauk. Seriya Geogr. 2019, 83, 3–13. [Google Scholar] [CrossRef] [Scilit]
- Bastin, J.-F.; Berrahmouni, N.; Grainger, A.; Maniatis, D.; Mollicone, D.; Moore, R.; Patriarca, C.; Picard, N.; Sparrow, B.; Abraham, E.M.; et al. The extent of forest in dryland biomes. Science 2017, 356, 635–638. [Google Scholar] [CrossRef] [Scilit] [PubMed]
- Bryan, B.A.; Gao, L.; Ye, Y.; Sun, X.; Connor, J.D.; Crossman, N.D.; Stafford-Smith, M.; Wu, J.; He, C.; Yu, D.; et al. China’s response to a national land-system sustainability emergency. Nature 2018, 559, 193–204. [Google Scholar] [CrossRef] [Scilit] [PubMed]
- Reynolds, J.F.; Smith, D.M.S.; Lambin, E.F.; Turner, B.; Mortimore, M.; Batterbury, S.P.; Downing, T.E.; Dowlatabadi, H.; Fernández, R.J.; Herrick, J.E. Global desertification: Building a science for dryland development. Science 2007, 316, 847–851. [Google Scholar] [CrossRef] [Scilit] [PubMed]
- Cao, S.; Chen, L.; Shankman, D.; Wang, C.; Wang, X.; Zhang, H. Excessive reliance on afforestation in China’s arid and semi-arid regions: Lessons in ecological restoration. Earth-Sci. Rev. 2011, 104, 240–245. [Google Scholar] [CrossRef] [Scilit]
- Feng, X.; Fu, B.; Piao, S.; Wang, S.; Ciais, P.; Zeng, Z.; Lü, Y.; Zeng, Y.; Li, Y.; Jiang, X.; et al. Revegetation in China’s Loess Plateau is approaching sustainable water resource limits. Nat. Clim. Change 2016, 6, 1019–1022. [Google Scholar] [CrossRef] [Scilit]
- Zhang, Y.; Feng, X.; Zhou, C.; Sun, C.; Leng, X.; Fu, B. Aridity threshold of ecological restoration mitigated atmospheric drought via land-atmosphere coupling in drylands. Commun. Earth Environ. 2024, 5, 381. [Google Scholar] [CrossRef] [Scilit]
- Sternberg, T.; Tsolmon, R.; Middleton, N.; Thomas, D. Tracking desertification on the Mongolian steppe through NDVI and field-survey data. Int. J. Digit. Earth 2011, 4, 50–64. [Google Scholar] [CrossRef] [Scilit]
- Tomasella, J.; Vieira, R.M.S.P.; Barbosa, A.A.; Rodriguez, D.A.; de Oliveira Santana, M.; Sestini, M.F. Desertification trends in the Northeast of Brazil over the period 2000–2016. Int. J. Appl. Earth Obs. Geoinf. 2018, 73, 197–206. [Google Scholar] [CrossRef] [Scilit]
- Manzo, C.; Valentini, E.; Taramelli, A.; Filipponi, F.; Disperati, L. Spectral characterization of coastal sediments using Field Spectral Libraries, Airborne Hyperspectral Images and Topographic LiDAR Data (FHyL). Int. J. Appl. Earth Obs. Geoinf. 2015, 36, 54–68. [Google Scholar] [CrossRef] [Scilit]
- Koutroulis, A.G. Dryland changes under different levels of global warming. Sci. Total Environ. 2019, 655, 482–511. [Google Scholar] [CrossRef] [Scilit] [PubMed]
- Smith, W.K.; Dannenberg, M.P.; Yan, D.; Herrmann, S.; Barnes, M.L.; Barron-Gafford, G.A.; Biederman, J.A.; Ferrenberg, S.; Fox, A.M.; Hudson, A.; et al. Remote sensing of dryland ecosystem structure and function: Progress, challenges, and opportunities. Remote Sens. Environ. 2019, 233, 111401. [Google Scholar] [CrossRef] [Scilit]
- Pan, J.; Li, T. Extracting desertification from Landsat TM imagery based on spectral mixture analysis and Albedo-Vegetation feature space. Nat. Hazards 2013, 68, 915–927. [Google Scholar] [CrossRef] [Scilit]
- Feng, Y.; Wang, S.; Zhao, M.; Zhou, L. Monitoring of land desertification changes in urat front banner from 2010 to 2020 based on remote sensing data. Water 2022, 14, 1777. [Google Scholar] [CrossRef] [Scilit]
- Yang, S.; Zhao, M.; Zhao, M.; Zhang, Q.; Liu, X. Changes and Driving Factors of Ecological Environment Quality in the Agro-Pastoral Ecotone of Northern China from 2000 to 2020. Land 2025, 14, 2309. [Google Scholar] [CrossRef] [Scilit]
- Yang, L.; Horion, S.; He, C.; Fensholt, R. Tracking sustainable restoration in agro-pastoral ecotone of Northwest China. Remote Sens. 2021, 13, 5031. [Google Scholar] [CrossRef] [Scilit]
- Huang, J.; Yu, H.; Guan, X.; Wang, G.; Guo, R. Accelerated dryland expansion under climate change. Nat. Clim. Change 2016, 6, 166–171. [Google Scholar] [CrossRef] [Scilit]
- Rietkerk, M.; Dekker, S.C.; De Ruiter, P.C.; van de Koppel, J. Self-organized patchiness and catastrophic shifts in ecosystems. Science 2004, 305, 1926–1929. [Google Scholar] [CrossRef] [Scilit] [PubMed]
- Wang, J.-F.; Zhang, T.-L.; Fu, B.-J. A measure of spatial stratified heterogeneity. Ecol. Indic. 2016, 67, 250–256. [Google Scholar] [CrossRef] [Scilit]
- Burrell, A.L.; Evans, J.P.; Liu, Y. Detecting dryland degradation using time series segmentation and residual trend analysis (TSS-RESTREND). Remote Sens. Environ. 2017, 197, 43–57. [Google Scholar] [CrossRef] [Scilit]
- Bestelmeyer, B.T.; Okin, G.S.; Duniway, M.C.; Archer, S.R.; Sayre, N.F.; Williamson, J.C.; Herrick, J.E. Desertification, land use, and the transformation of global drylands. Front. Ecol. Environ. 2015, 13, 28–36. [Google Scholar] [CrossRef] [Scilit]
- Spake, R.; Barajas-Barbosa, M.P.; Blowes, S.A.; Bowler, D.E.; Callaghan, C.T.; Garbowski, M.; Jurburg, S.D.; van Klink, R.; Korell, L.; Ladouceur, E.; et al. Detecting thresholds of ecological change in the Anthropocene. Annu. Rev. Environ. Resour. 2022, 47, 797–821. [Google Scholar] [CrossRef] [Scilit]
- Reichstein, M.; Camps-Valls, G.; Stevens, B.; Jung, M.; Denzler, J.; Carvalhais, N.; Prabhat, F. Deep learning and process understanding for data-driven Earth system science. Nature 2019, 566, 195–204. [Google Scholar] [CrossRef] [Scilit] [PubMed]
- Meyer, H.; Pebesma, E. Machine learning-based global maps of ecological variables and the challenge of assessing them. Nat. Commun. 2022, 13, 2208. [Google Scholar] [CrossRef] [Scilit] [PubMed]
- Ploton, P.; Mortier, F.; Réjou-Méchain, M.; Barbier, N.; Picard, N.; Rossi, V.; Dormann, C.; Cornu, G.; Viennois, G.; Bayol, N.; et al. Spatial validation reveals poor predictive performance of large-scale ecological mapping models. Nat. Commun. 2020, 11, 4540. [Google Scholar] [CrossRef] [Scilit] [PubMed]
- Lundberg, S.M.; Erion, G.; Chen, H.; DeGrave, A.; Prutkin, J.M.; Nair, B.; Katz, R.; Himmelfarb, J.; Bansal, N.; Lee, S.-I. From local explanations to global understanding with explainable AI for trees. Nat. Mach. Intell. 2020, 2, 56–67. [Google Scholar] [CrossRef] [Scilit] [PubMed]
- Ngabire, M.; Wang, T.; Liao, J.; Sahbeni, G. Quantitative analysis of desertification-driving mechanisms in the Shiyang River Basin: Examining Interactive effects of Key factors through the Geographic detector model. Remote Sens. 2023, 15, 2960. [Google Scholar] [CrossRef] [Scilit]
- Roscher, R.; Bohn, B.; Duarte, M.F.; Garcke, J. Explainable machine learning for scientific insights and discoveries. IEEE Access 2020, 8, 42200–42216. [Google Scholar] [CrossRef] [Scilit]
- Fu, Z.; Yang, X.; Ma, Y.; Sun, Y.; Wang, T. Integrating explainable AI and causal inference to unveil regional air quality drivers in China. J. Environ. Manag. 2025, 390, 126270. [Google Scholar] [CrossRef] [Scilit] [PubMed]
- Wang, X.; Chen, F.; Hasi, E.; Li, J. Desertification in China: An assessment. Earth-Sci. Rev. 2008, 88, 188–206. [Google Scholar] [CrossRef] [Scilit]
- Liu, J.; Li, S.; Ouyang, Z.; Tam, C.; Chen, X. Ecological and socioeconomic effects of China’s policies for ecosystem services. Proc. Natl. Acad. Sci. USA 2008, 105, 9477–9482. [Google Scholar] [CrossRef] [Scilit] [PubMed]
- Chen, C.; Park, T.; Wang, X.; Piao, S.; Xu, B.; Chaturvedi, R.K.; Fuchs, R.; Brovkin, V.; Ciais, P.; Fensholt, R.; et al. China and India lead in greening of the world through land-use management. Nat. Sustain. 2019, 2, 122–129. [Google Scholar] [CrossRef] [Scilit] [PubMed]
- Ouyang, Z.; Zheng, H.; Xiao, Y.; Polasky, S.; Liu, J.; Xu, W.; Wang, Q.; Zhang, L.; Xiao, Y.; Rao, E.; et al. Improvements in ecosystem services from investments in natural capital. Science 2016, 352, 1455–1459. [Google Scholar] [CrossRef] [Scilit] [PubMed]
- Wang, T.; Yan, C.; Song, X.; Xie, J. Monitoring recent trends in the area of aeolian desertified land using Landsat images in China’s Xinjiang region. ISPRS J. Photogramm. Remote Sens. 2012, 68, 184–190. [Google Scholar] [CrossRef] [Scilit]
- Fu, B.; Wang, S.; Liu, Y.; Liu, J.; Liang, W.; Miao, C. Hydrogeomorphic ecosystem responses to natural and anthropogenic changes in the Loess Plateau of China. Annu. Rev. Earth Planet. Sci. 2017, 45, 223–243. [Google Scholar] [CrossRef] [Scilit]
- Akiyama, T.; Kawamura, K. Grassland degradation in China: Methods of monitoring, management and restoration. Grassl. Sci. 2007, 53, 1–17. [Google Scholar] [CrossRef] [Scilit]
- Wang, X.; Zhang, C.; Hasi, E.; Dong, Z. Has the Three Norths Forest Shelterbelt Program solved the desertification and dust storm problems in arid and semiarid China? J. Arid Environ. 2010, 74, 13–22. [Google Scholar] [CrossRef] [Scilit]
- Jiang, C.; Guo, H.; Wei, Y.; Yang, Z.; Wang, X.; Wen, M.; Yang, L.; Zhao, L.; Zhang, H.; Zhou, P. Ecological restoration is not sufficient for reconciling the trade-off between soil retention and water yield: A contrasting study from catchment governance perspective. Sci. Total Environ. 2021, 754, 142139. [Google Scholar] [CrossRef] [Scilit] [PubMed]
- Zhang, B.; Hao, H. Carbon Storage Distribution and Influencing Factors in the Northern Agro-Pastoral Ecotone of China. Sustainability 2025, 17, 10197. [Google Scholar] [CrossRef] [Scilit]
- Bai, Y.; Liu, Y.; Yuan, X. Tracing the agro-pastoral ecotone transition in northern China from the human-Earth system perspective. J. Geogr. Sci. 2025, 35, 783–799. [Google Scholar] [CrossRef] [Scilit]
- Zhou, J.; Zhang, F.; Xu, Y.; Gao, Y.; Xie, Z. Evaluation of land reclamation and implications of ecological restoration for agro-pastoral ecotone: Case study of Horqin Left Back Banner in China. Chin. Geogr. Sci. 2017, 27, 772–783. [Google Scholar] [CrossRef] [Scilit]
- Chen, W.; Li, A.; Hu, Y.; Li, L.; Zhao, H.; Han, X.; Yang, B. Exploring the long-term vegetation dynamics of different ecological zones in the farming-pastoral ecotone in northern China. Environ. Sci. Pollut. Res. 2021, 28, 27914–27932. [Google Scholar] [CrossRef] [Scilit] [PubMed]
- Verstraete, M.M.; Pinty, B. Designing optimal spectral indexes for remote sensing applications. IEEE Trans. Geosci. Remote Sens. 1996, 34, 1254–1265. [Google Scholar] [CrossRef] [Scilit]
- Higginbottom, T.P.; Symeonakis, E. Assessing land degradation and desertification using vegetation index data: Current frameworks and future directions. Remote Sens. 2014, 6, 9552–9575. [Google Scholar] [CrossRef] [Scilit]
- Fensholt, R.; Langanke, T.; Rasmussen, K.; Reenberg, A.; Prince, S.D.; Tucker, C.; Scholes, R.J.; Le, Q.B.; Bondeau, A.; Eastman, R.; et al. Greenness in semi-arid areas across the globe 1981–2007—An Earth Observing Satellite based analysis of trends and drivers. Remote Sens. Environ. 2012, 121, 144–158. [Google Scholar] [CrossRef] [Scilit]
- Sen, P.K. Estimates of the regression coefficient based on Kendall’s tau. J. Am. Stat. Assoc. 1968, 63, 1379–1389. [Google Scholar] [CrossRef]
- Pontius, R.G., Jr.; Shusas, E.; McEachern, M. Detecting important categorical land changes while accounting for persistence. Agric. Ecosyst. Environ. 2004, 101, 251–268. [Google Scholar] [CrossRef] [Scilit]
- Prokhorenkova, L.; Gusev, G.; Vorobev, A.; Dorogush, A.V.; Gulin, A. CatBoost: Unbiased boosting with categorical features. Adv. Neural Inf. Process. Syst. 2018, 31, 6639–6649. [Google Scholar]
- Ke, G.; Meng, Q.; Finley, T.; Wang, T.; Chen, W.; Ma, W.; Ye, Q.; Liu, T.-Y. Lightgbm: A highly efficient gradient boosting decision tree. Adv. Neural Inf. Process. Syst. 2017, 30, 3149–3157. [Google Scholar]
- Lundberg, S.M.; Lee, S.-I. A unified approach to interpreting model predictions. Adv. Neural Inf. Process. Syst. 2017, 30, 4768–4777. [Google Scholar]
- Jia, X.; Liu, H.; Zhang, X.; Liang, L.; Liu, D.; Zheng, X. Exploring the Spatiotemporal Driving Forces of Vegetation Cover Variations on the Loess Plateau: A Comprehensive Assessment of Climate Change and Human Activity. Land 2025, 14, 929. [Google Scholar] [CrossRef] [Scilit]
- Moosbauer, J.; Herbinger, J.; Casalicchio, G.; Lindauer, M.; Bischl, B. Explaining hyperparameter optimization via partial dependence plots. Adv. Neural Inf. Process. Syst. 2021, 34, 2280–2291. [Google Scholar]
- Jenks, G.F. Generalization in statistical mapping. Ann. Assoc. Am. Geogr. 1963, 53, 15–26. [Google Scholar] [CrossRef] [Scilit]
- Li, L.; Yan, M.; Zhang, L.; Karimian, H.; Shao, W.; Zha, G.; Kang, Y. Spatiotemporal Dynamics and Driving Forces of Desertification in Northwestern China. Land 2026, 15, 403. [Google Scholar] [CrossRef] [Scilit]
- Zeng, Y.-N.; Xiang, N.-P.; Feng, Z.-D.; Hu, H. Albedo-NDVI space and remote sensing synthesis index models for desertification monitoring. Geogr. Sci. 2006, 26, 75–81. [Google Scholar]
- Du, Z.; Yu, L.; Chen, X.; Gao, B.; Yang, J.; Fu, H.; Gong, P. Land use/cover and land degradation across the Eurasian steppe: Dynamics, patterns and driving factors. Sci. Total Environ. 2024, 909, 168593. [Google Scholar] [CrossRef] [Scilit] [PubMed]
- Karnieli, A.; Bayarjargal, Y.; Bayasgalan, M.; Mandakh, B.; Dugarjav, C.; Burgheimer, J.; Khudulmur, S.; Bazha, S.; Gunin, P. Do vegetation indices provide a reliable indication of vegetation degradation? A case study in the Mongolian pastures. Int. J. Remote Sens. 2013, 34, 6243–6262. [Google Scholar] [CrossRef] [Scilit]
- Li, Z. Extracting spatial effects from machine learning model using local interpretation method: An example of SHAP and XGBoost. Comput. Environ. Urban Syst. 2022, 96, 101845. [Google Scholar] [CrossRef] [Scilit]
- Gong, P.; Wang, J.; Yu, L.; Zhao, Y.; Zhao, Y.; Liang, L.; Niu, Z.; Huang, X.; Fu, H.; Liu, S.; et al. Finer resolution observation and monitoring of global land cover: First mapping results with Landsat TM and ETM+ data. Int. J. Remote Sens. 2013, 34, 2607–2654. [Google Scholar] [CrossRef] [Scilit]
- Cui, L.; Zheng, S.; Jin, Y.; Shen, Z.; Dong, X.; Xu, M. Understanding the nonlinear trade-off relationship to optimize urban-rural ecosystem services: A case study in arid and semi-arid region, China. Habitat Int. 2025, 166, 103567. [Google Scholar] [CrossRef] [Scilit]
- Goldstein, A.; Kapelner, A.; Bleich, J.; Pitkin, E. Peeking inside the black box: Visualizing statistical learning with plots of individual conditional expectation. J. Comput. Graph. Stat. 2015, 24, 44–65. [Google Scholar] [CrossRef] [Scilit]
- Meng, X.; Li, S.; Akhmadi, K.; He, P.; Dong, G. Trends, turning points, and driving forces of desertification in global arid land based on the segmental trend method and SHAP model. GISci. Remote Sens. 2024, 61, 2367806. [Google Scholar] [CrossRef] [Scilit]
- Grekousis, G. Geographical-XGBoost: A new ensemble model for spatially local regression based on gradient-boosted trees. J. Geogr. Syst. 2025, 27, 169–195. [Google Scholar] [CrossRef] [Scilit]
- Berdugo, M.; Delgado-Baquerizo, M.; Soliveres, S.; Hernández-Clemente, R.; Zhao, Y.; Gaitán, J.J.; Gross, N.; Saiz, H.; Maire, V.; Lehmann, A.; et al. Global ecosystem thresholds driven by aridity. Science 2020, 367, 787–790. [Google Scholar] [CrossRef] [Scilit] [PubMed]
- Miao, C.; Zhang, Q.; Li, X.; Hu, J.; Sadegh, M.; AghaKouchak, A. Global drought extremes in 2025: Climate chronicles. Nat. Rev. Earth Environ. 2026, 7, 277–279. [Google Scholar]
- Jiang, Y.; Hu, Y.; Gao, M.; Xue, Y.; Liu, B. The paradox of green fragmentation: Fractional vegetation cover and landscape pattern coupling in the agro-pastoral ecotone of Inner Mongolia. J. Environ. Manag. 2026, 401, 128844. [Google Scholar] [CrossRef] [Scilit] [PubMed]
- Dai, L.; Li, S.; Lewis, B.J.; Wu, J.; Yu, D.; Zhou, W.; Zhou, L.; Wu, S. The influence of land use change on the spatial–temporal variability of habitat quality between 1990 and 2010 in Northeast China. J. For. Res. 2019, 30, 2227–2236. [Google Scholar] [CrossRef] [Scilit]
- Li, J.; Cao, C.; Xu, M.; Yang, X.; Gao, X.; Wang, K.; Guo, H.; Yang, Y. A 20-year analysis of the dynamics and driving factors of grassland desertification in Xilingol, China. Remote Sens. 2023, 15, 5716. [Google Scholar] [CrossRef] [Scilit]
- Xiong, Y.; Sun, Z.; Shen, H.; Tu, L.; Huang, K.; Ou, W. Spatiotemporal Dynamics of Annual Precipitation and Future Projections of China’s 400 mm Isohyet. Remote Sens. 2025, 17, 3078. [Google Scholar] [CrossRef] [Scilit]
- Wang, J.; Wang, Y.; Xu, D. Desertification in northern China from 2000 to 2020: The spatial–temporal processes and driving mechanisms. Ecol. Inform. 2024, 82, 102769. [Google Scholar] [CrossRef] [Scilit]
- Zhang, C.; Wang, X.; Li, J.; Hua, T. Identifying the effect of climate change on desertification in northern China via trend analysis of potential evapotranspiration and precipitation. Ecol. Indic. 2020, 112, 106141. [Google Scholar] [CrossRef] [Scilit]
- Bestelmeyer, B.T. Threshold concepts and their use in rangeland management and restoration: The good, the bad, and the insidious. Restor. Ecol. 2006, 14, 325–329. [Google Scholar] [CrossRef] [Scilit]
- Wang, X.; Geng, X.; Liu, B.; Cai, D.; Li, D.; Xiao, F.; Zhu, B.; Hua, T.; Lu, R.; Liu, F. Desert ecosystems in China: Past, present, and future. Earth-Sci. Rev. 2022, 234, 104206. [Google Scholar] [CrossRef] [Scilit]
- Chen, X.; Zhao, X.; Zhao, Y.; Lu, J.; Wang, R.; Zhu, X.; Bai, L.; Qiao, Y. The dynamic patterns of groundwater storage in Horqin Sandy Land are driven primarily by climate factors but threatened by human activity. J. Hydrol. Reg. Stud. 2025, 59, 102388. [Google Scholar] [CrossRef] [Scilit]
- Wang, X.; Geng, X.; Sun, F.; Han, M.; Chen, F.; Chen, S.; Peñuelas, J.; Gao, L.; Bryan, B.A.; Li, C.; et al. Strategies reimagined: SDG-driven solutions for combating global desertification. Proc. Natl. Acad. Sci. USA 2026, 123, e2515470123. [Google Scholar] [CrossRef] [Scilit] [PubMed]
- Wang, S.; Tao, Z.; Sun, P.; Chen, S.; Sun, H.; Li, N. Spatiotemporal variation of forest land and its driving factors in the agropastoral ecotone of northern China. J. Arid Land 2022, 14, 1–13. [Google Scholar] [CrossRef] [Scilit]
- Wu, Z.; Zhu, W.; Guo, H.; Zhang, Y.; Shen, C.; Guo, J.; Liu, M.; Zhao, T.; Teng, H.; Zhu, W.; et al. Effects of Soil Nutrient Restoration Aging and Vegetation Recovery in Open Dumps of Cold and Arid Regions in Xinjiang, China. Land 2024, 13, 1690. [Google Scholar] [CrossRef] [Scilit]
- Ravi, S.; Breshears, D.D.; Huxman, T.E.; D’Odorico, P. Land degradation in drylands: Interactions among hydrologic–aeolian erosion and vegetation dynamics. Geomorphology 2010, 116, 236–245. [Google Scholar] [CrossRef] [Scilit]
- Asner, G.P.; Elmore, A.J.; Olander, L.P.; Martin, R.E.; Harris, A.T. Grazing systems, ecosystem responses, and global change. Annu. Rev. Environ. Resour. 2004, 29, 261–299. [Google Scholar] [CrossRef] [Scilit]
- Xu, D.; Li, C.; Song, X.; Ren, H. The dynamics of desertification in the farming-pastoral region of North China over the past 10 years and their relationship to climate change and human activity. Catena 2014, 123, 11–22. [Google Scholar] [CrossRef] [Scilit]
- Bestelmeyer, B.T.; Ellison, A.M.; Fraser, W.R.; Gorman, K.B.; Holbrook, S.J.; Laney, C.M.; Ohman, M.D.; Peters, D.P.; Pillsbury, F.C.; Rassweiler, A.; et al. Analysis of abrupt transitions in ecological systems. Ecosphere 2011, 2, 1–26. [Google Scholar] [CrossRef] [Scilit]
- Dong, P.; Gong, J.; Yi, Y.; Yang, S.; He, C.; Zuo, R.; Xiong, T. Spatiotemporal dynamics and multi-scenario projections of habitat quality in a karst cascade-hydropower basin: An integrated InVEST–IntPLUS–OPGD framework. Land 2026, 15, 363. [Google Scholar] [CrossRef] [Scilit]
- Schlesinger, W.H.; Reynolds, J.F.; Cunningham, G.L.; Huenneke, L.F.; Jarrell, W.M.; Virginia, R.A.; Whitford, W.G. Biological feedbacks in global desertification. Science 1990, 247, 1043–1048. [Google Scholar] [CrossRef] [Scilit] [PubMed]
- Tian, L.; Wu, W.; Zhang, D.; Lu, R.; Wang, X. Characteristics of erosion and deposition of straw checkerboard barriers in alpine sandy land. Environ. Earth Sci. 2015, 74, 573–584. [Google Scholar] [CrossRef] [Scilit][Green Version]
- Okin, G.; Gillette, D.; Herrick, J. Multi-scale controls on and consequences of aeolian processes in landscape change in arid and semi-arid environments. J. Arid Environ. 2006, 65, 253–275. [Google Scholar] [CrossRef] [Scilit]
- Wang, X.; Wu, J.; Zhang, B.; Zhang, Z.; Tian, J.; Cheng, Y.; He, C. Reduced upwind moisture transport contributes to drought in the agro-pastoral ecotone of Northern China. Geophys. Res. Lett. 2026, 53, e2025GL119587. [Google Scholar] [CrossRef] [Scilit]
- Burrell, A.L.; Evans, J.P.; De Kauwe, M.G. Anthropogenic climate change has driven over 5 million km2 of drylands towards desertification. Nat. Commun. 2020, 11, 3853. [Google Scholar] [CrossRef] [Scilit] [PubMed]
- Zhang, G.; Zhang, S.; Wang, H.; Gan, T.Y.; Su, X.; Wu, H.; Shi, L.; Xu, P.; Fu, X. Evaluating vegetation vulnerability under compound dry and hot conditions using vine copula across global lands. J. Hydrol. 2024, 631, 130775. [Google Scholar] [CrossRef] [Scilit]
- Yuan, W.; Zheng, Y.; Piao, S.; Ciais, P.; Lombardozzi, D.; Wang, Y.; Ryu, Y.; Chen, G.; Dong, W.; Hu, Z.; et al. Increased atmospheric vapor pressure deficit reduces global vegetation growth. Sci. Adv. 2019, 5, eaax1396. [Google Scholar] [CrossRef] [Scilit] [PubMed]
- D’Odorico, P.; Bhattachan, A.; Davis, K.F.; Ravi, S.; Runyan, C.W. Global desertification: Drivers and feedbacks. Adv. Water Resour. 2013, 51, 326–344. [Google Scholar] [CrossRef] [Scilit]
- Hoylman, Z.H.; Jencso, K.; Hu, J.; Holden, Z.A.; Allred, B.W.; Dobrowski, S.; Robinson, N.; Martin, J.T.; Affleck, D.L.; Seielstad, C. The topographic signature of ecosystem climate sensitivities in the western US. In Proceedings of the AGU Fall Meeting Abstracts, San Francisco, CA, USA, 9–13 December 2019; p. H44A–06. [Google Scholar]
- Chen, N.; Jayaprakash, C.; Yu, K.; Guttal, V. Rising variability, not slowing down, as a leading indicator of a stochastically driven abrupt transition in a dryland ecosystem. Am. Nat. 2018, 191, E1–E14. [Google Scholar] [CrossRef] [Scilit] [PubMed]
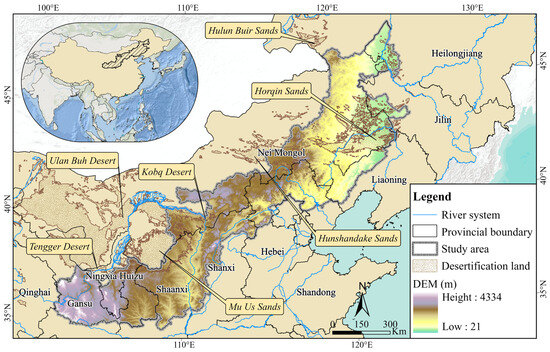
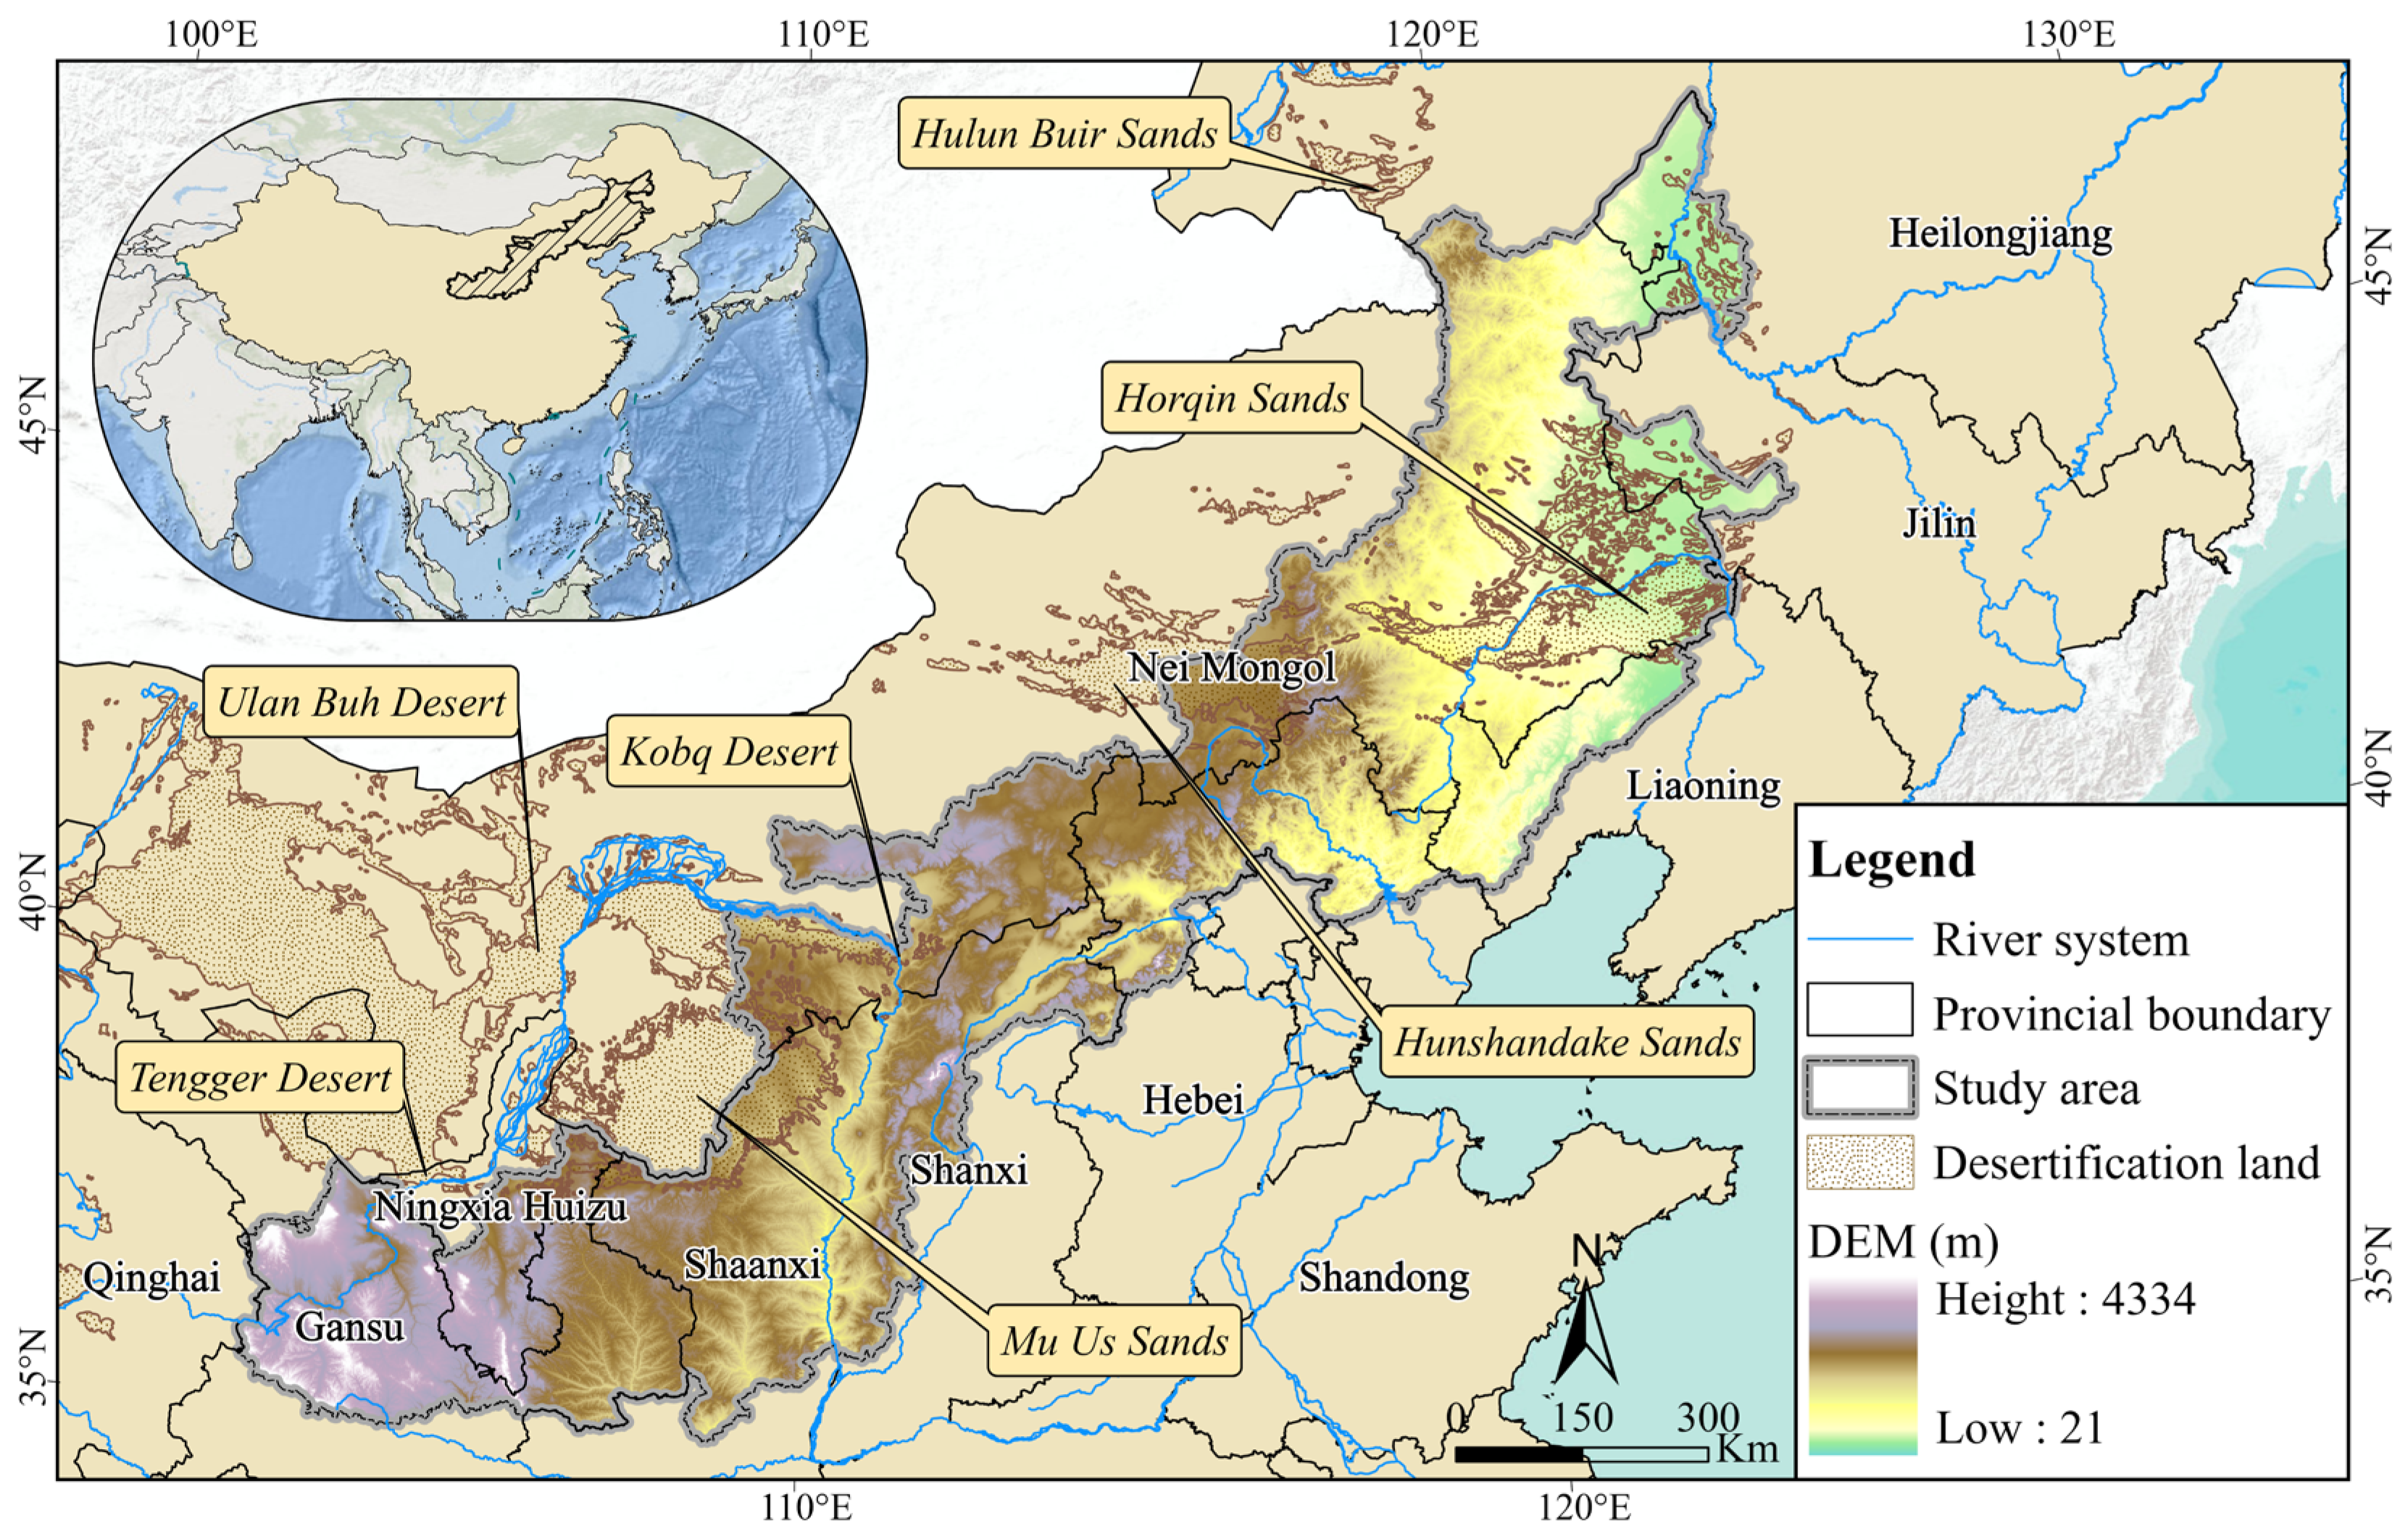
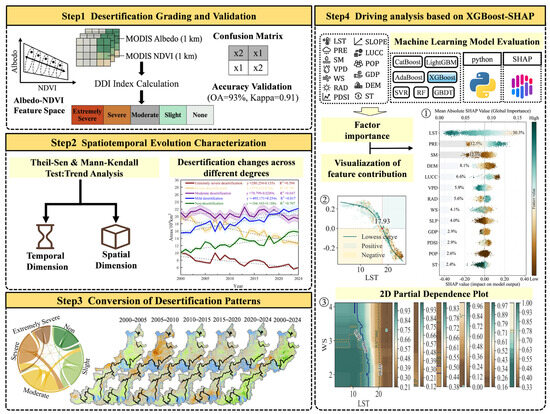
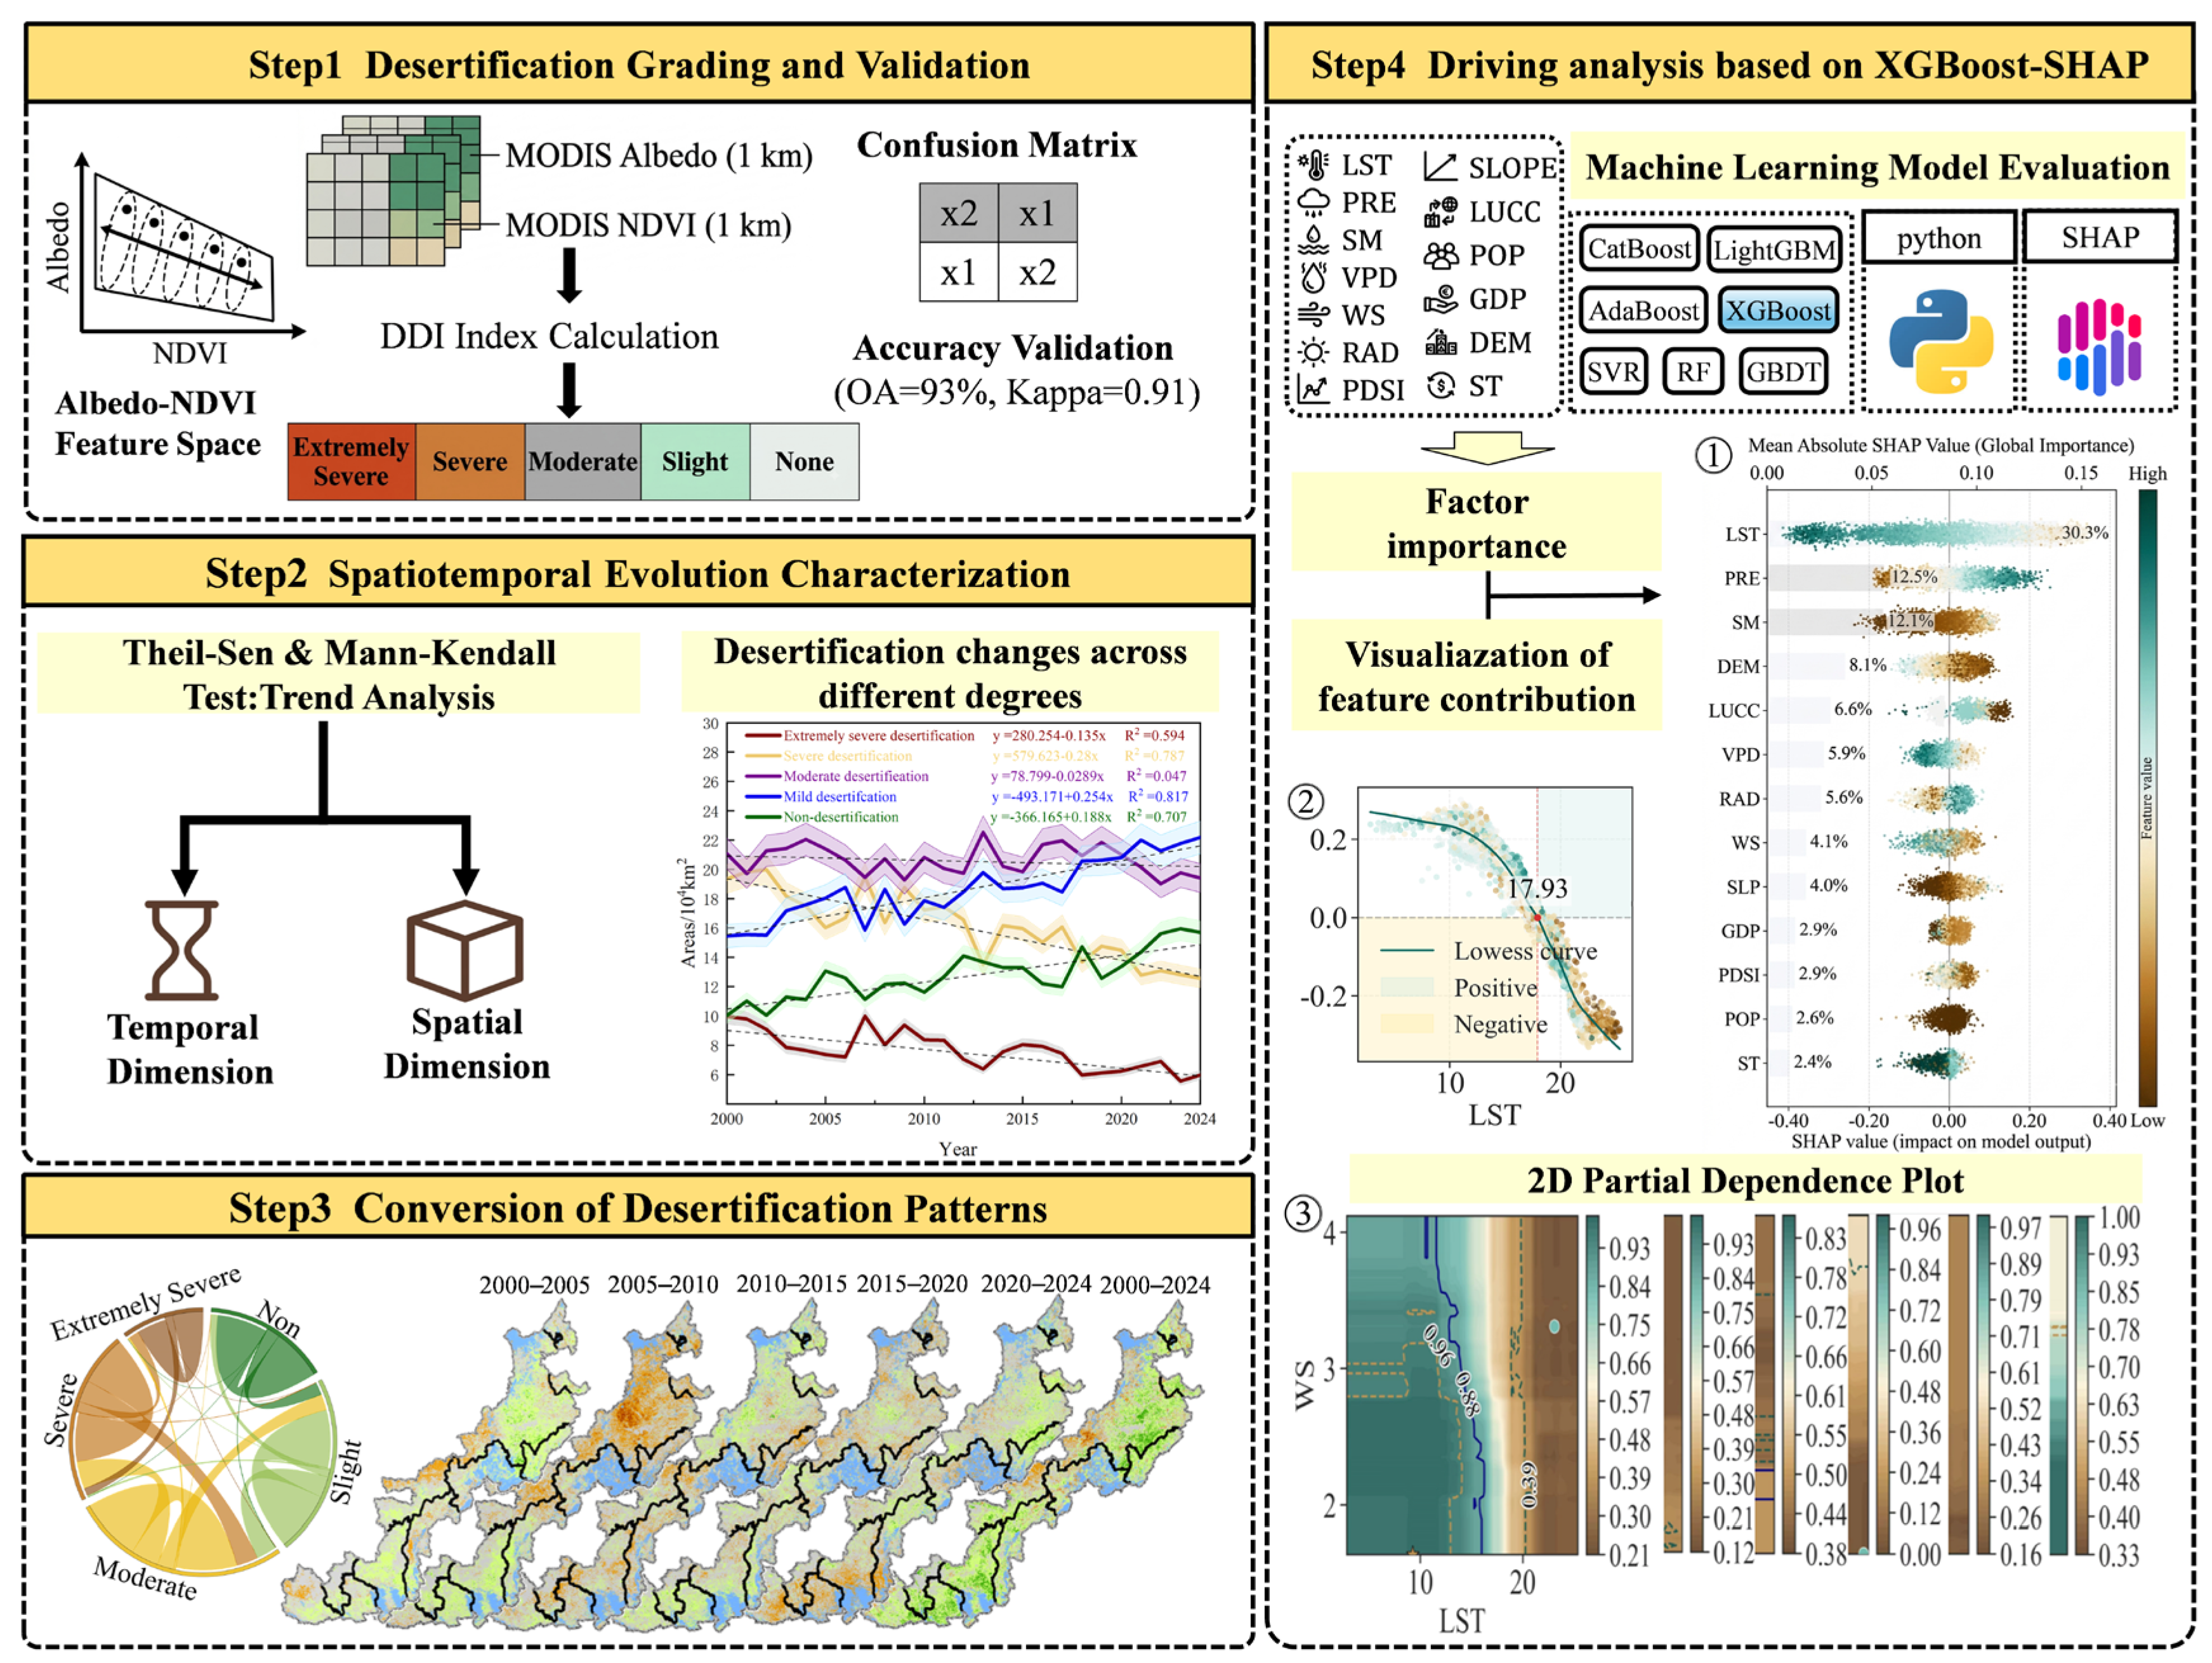
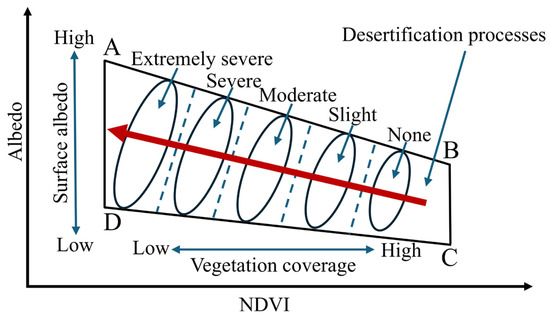
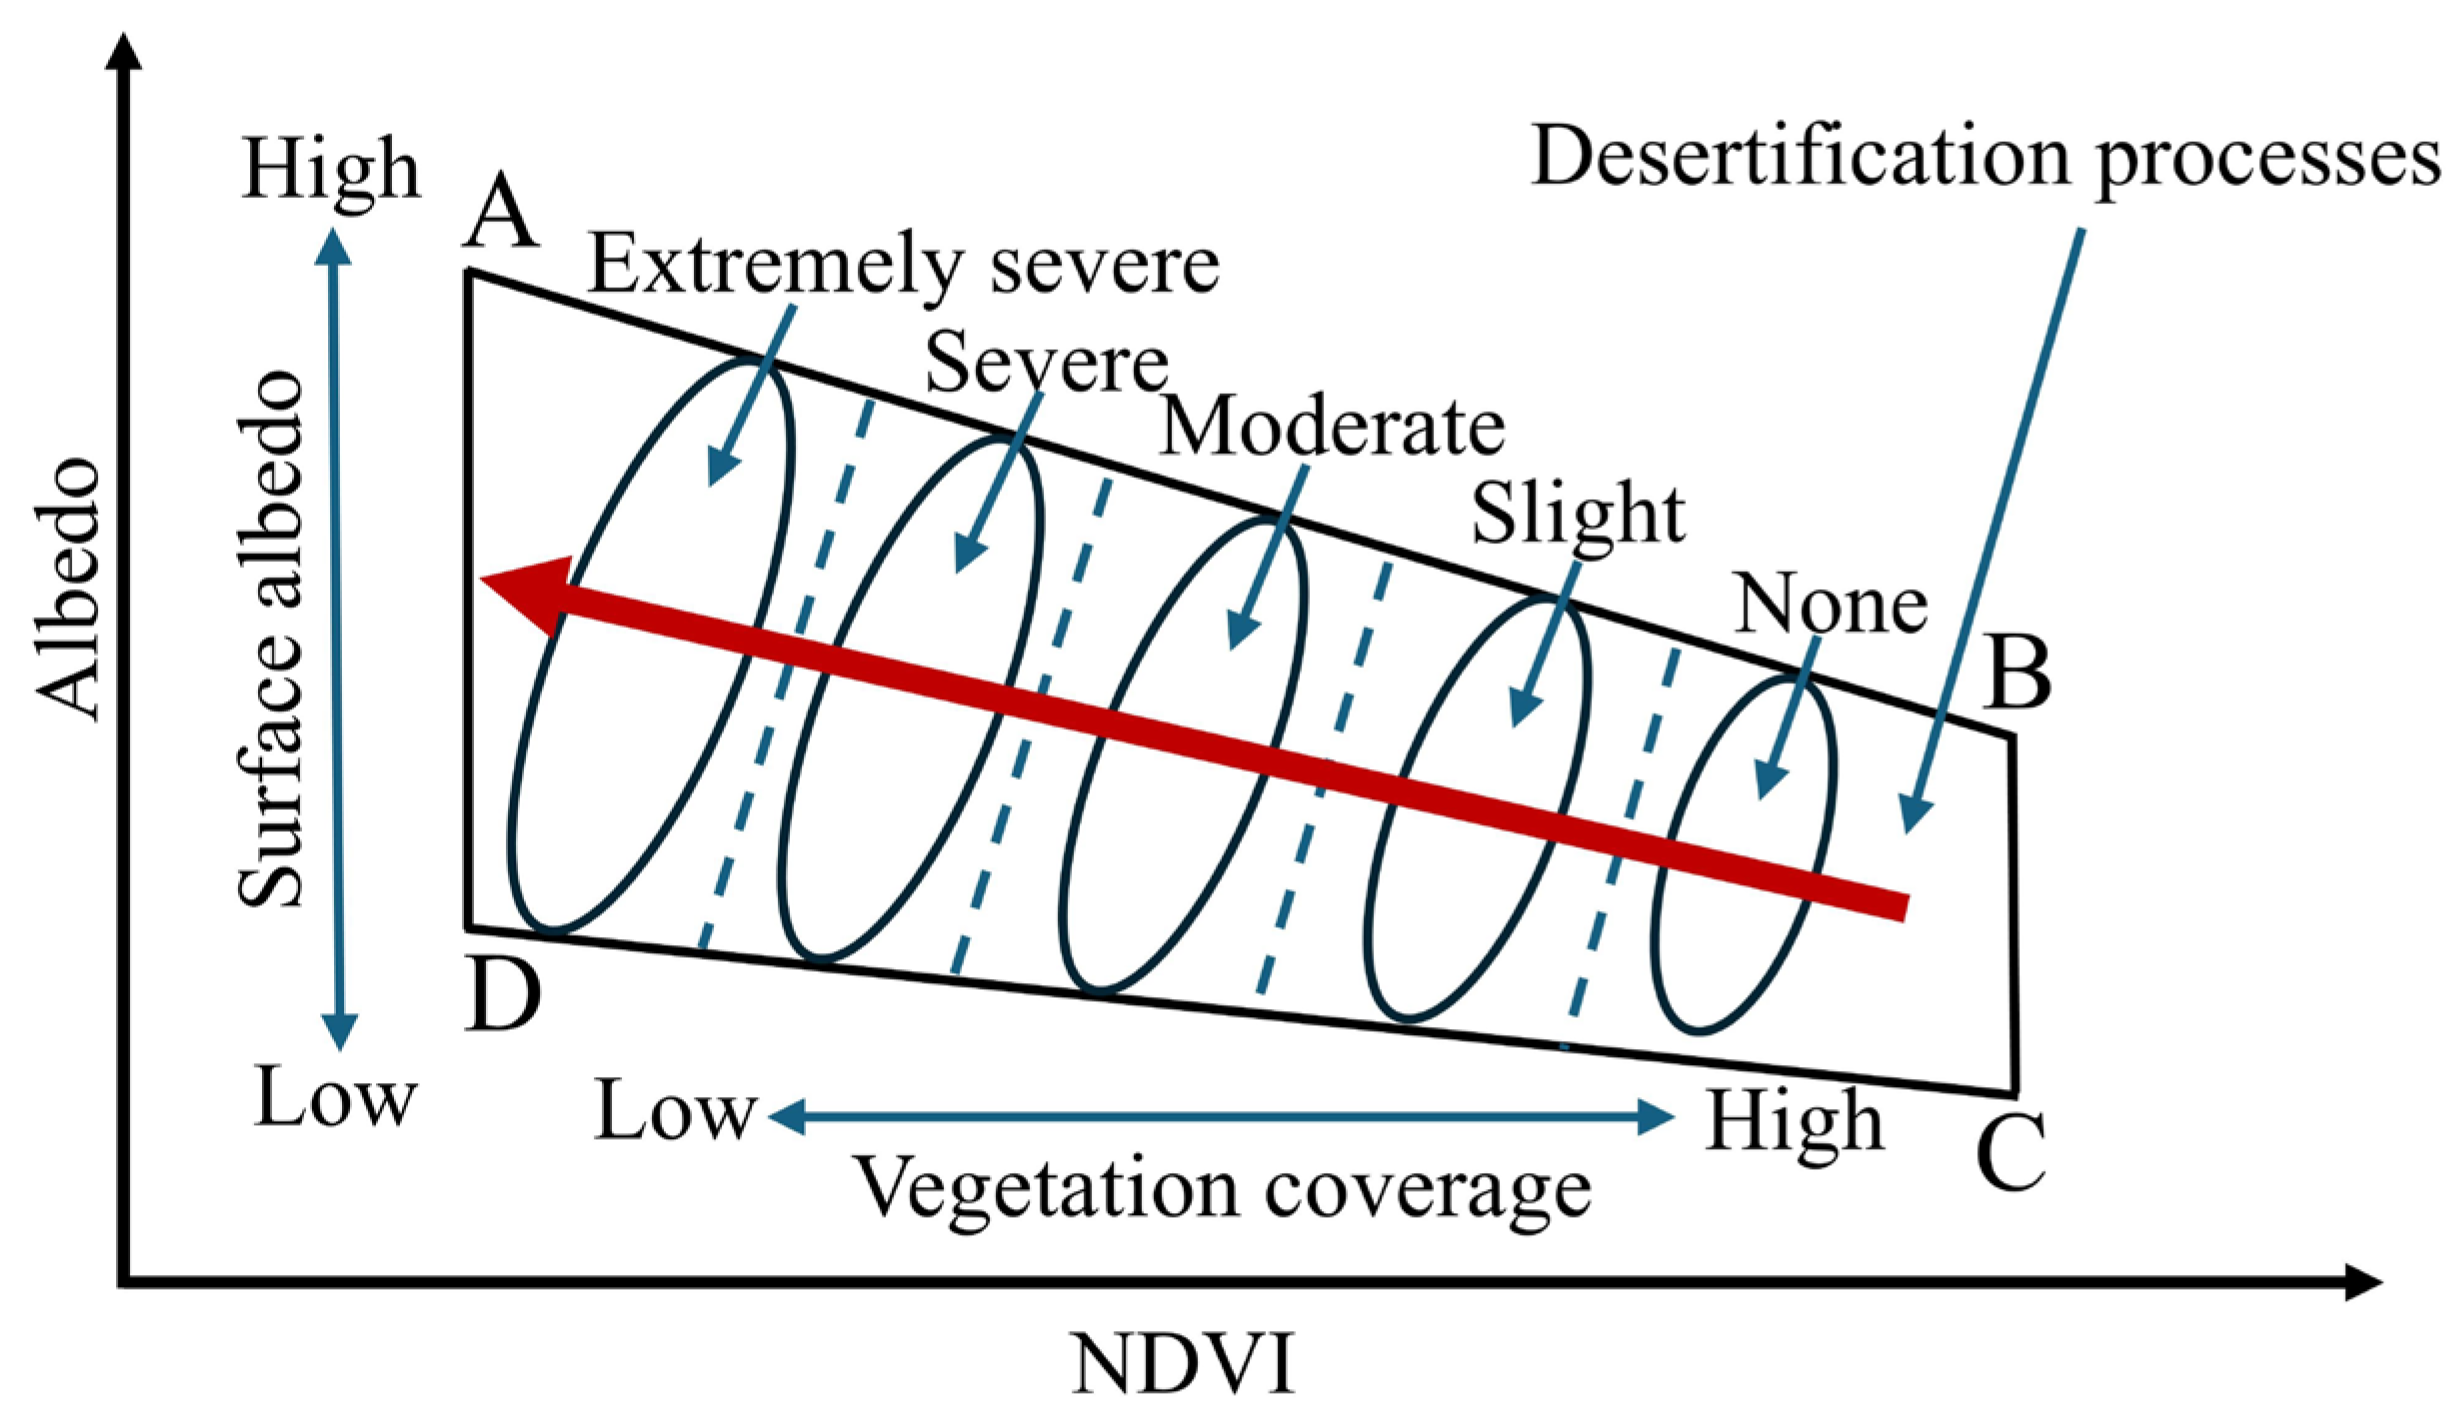
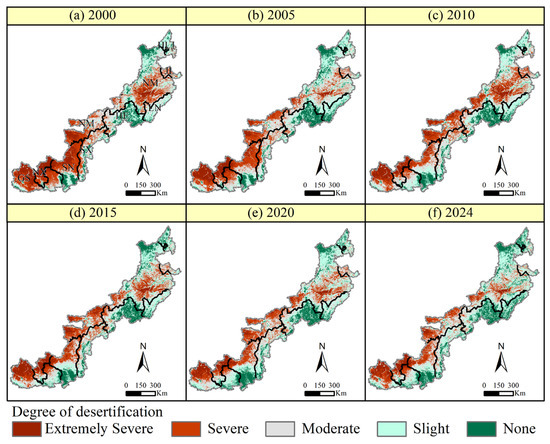
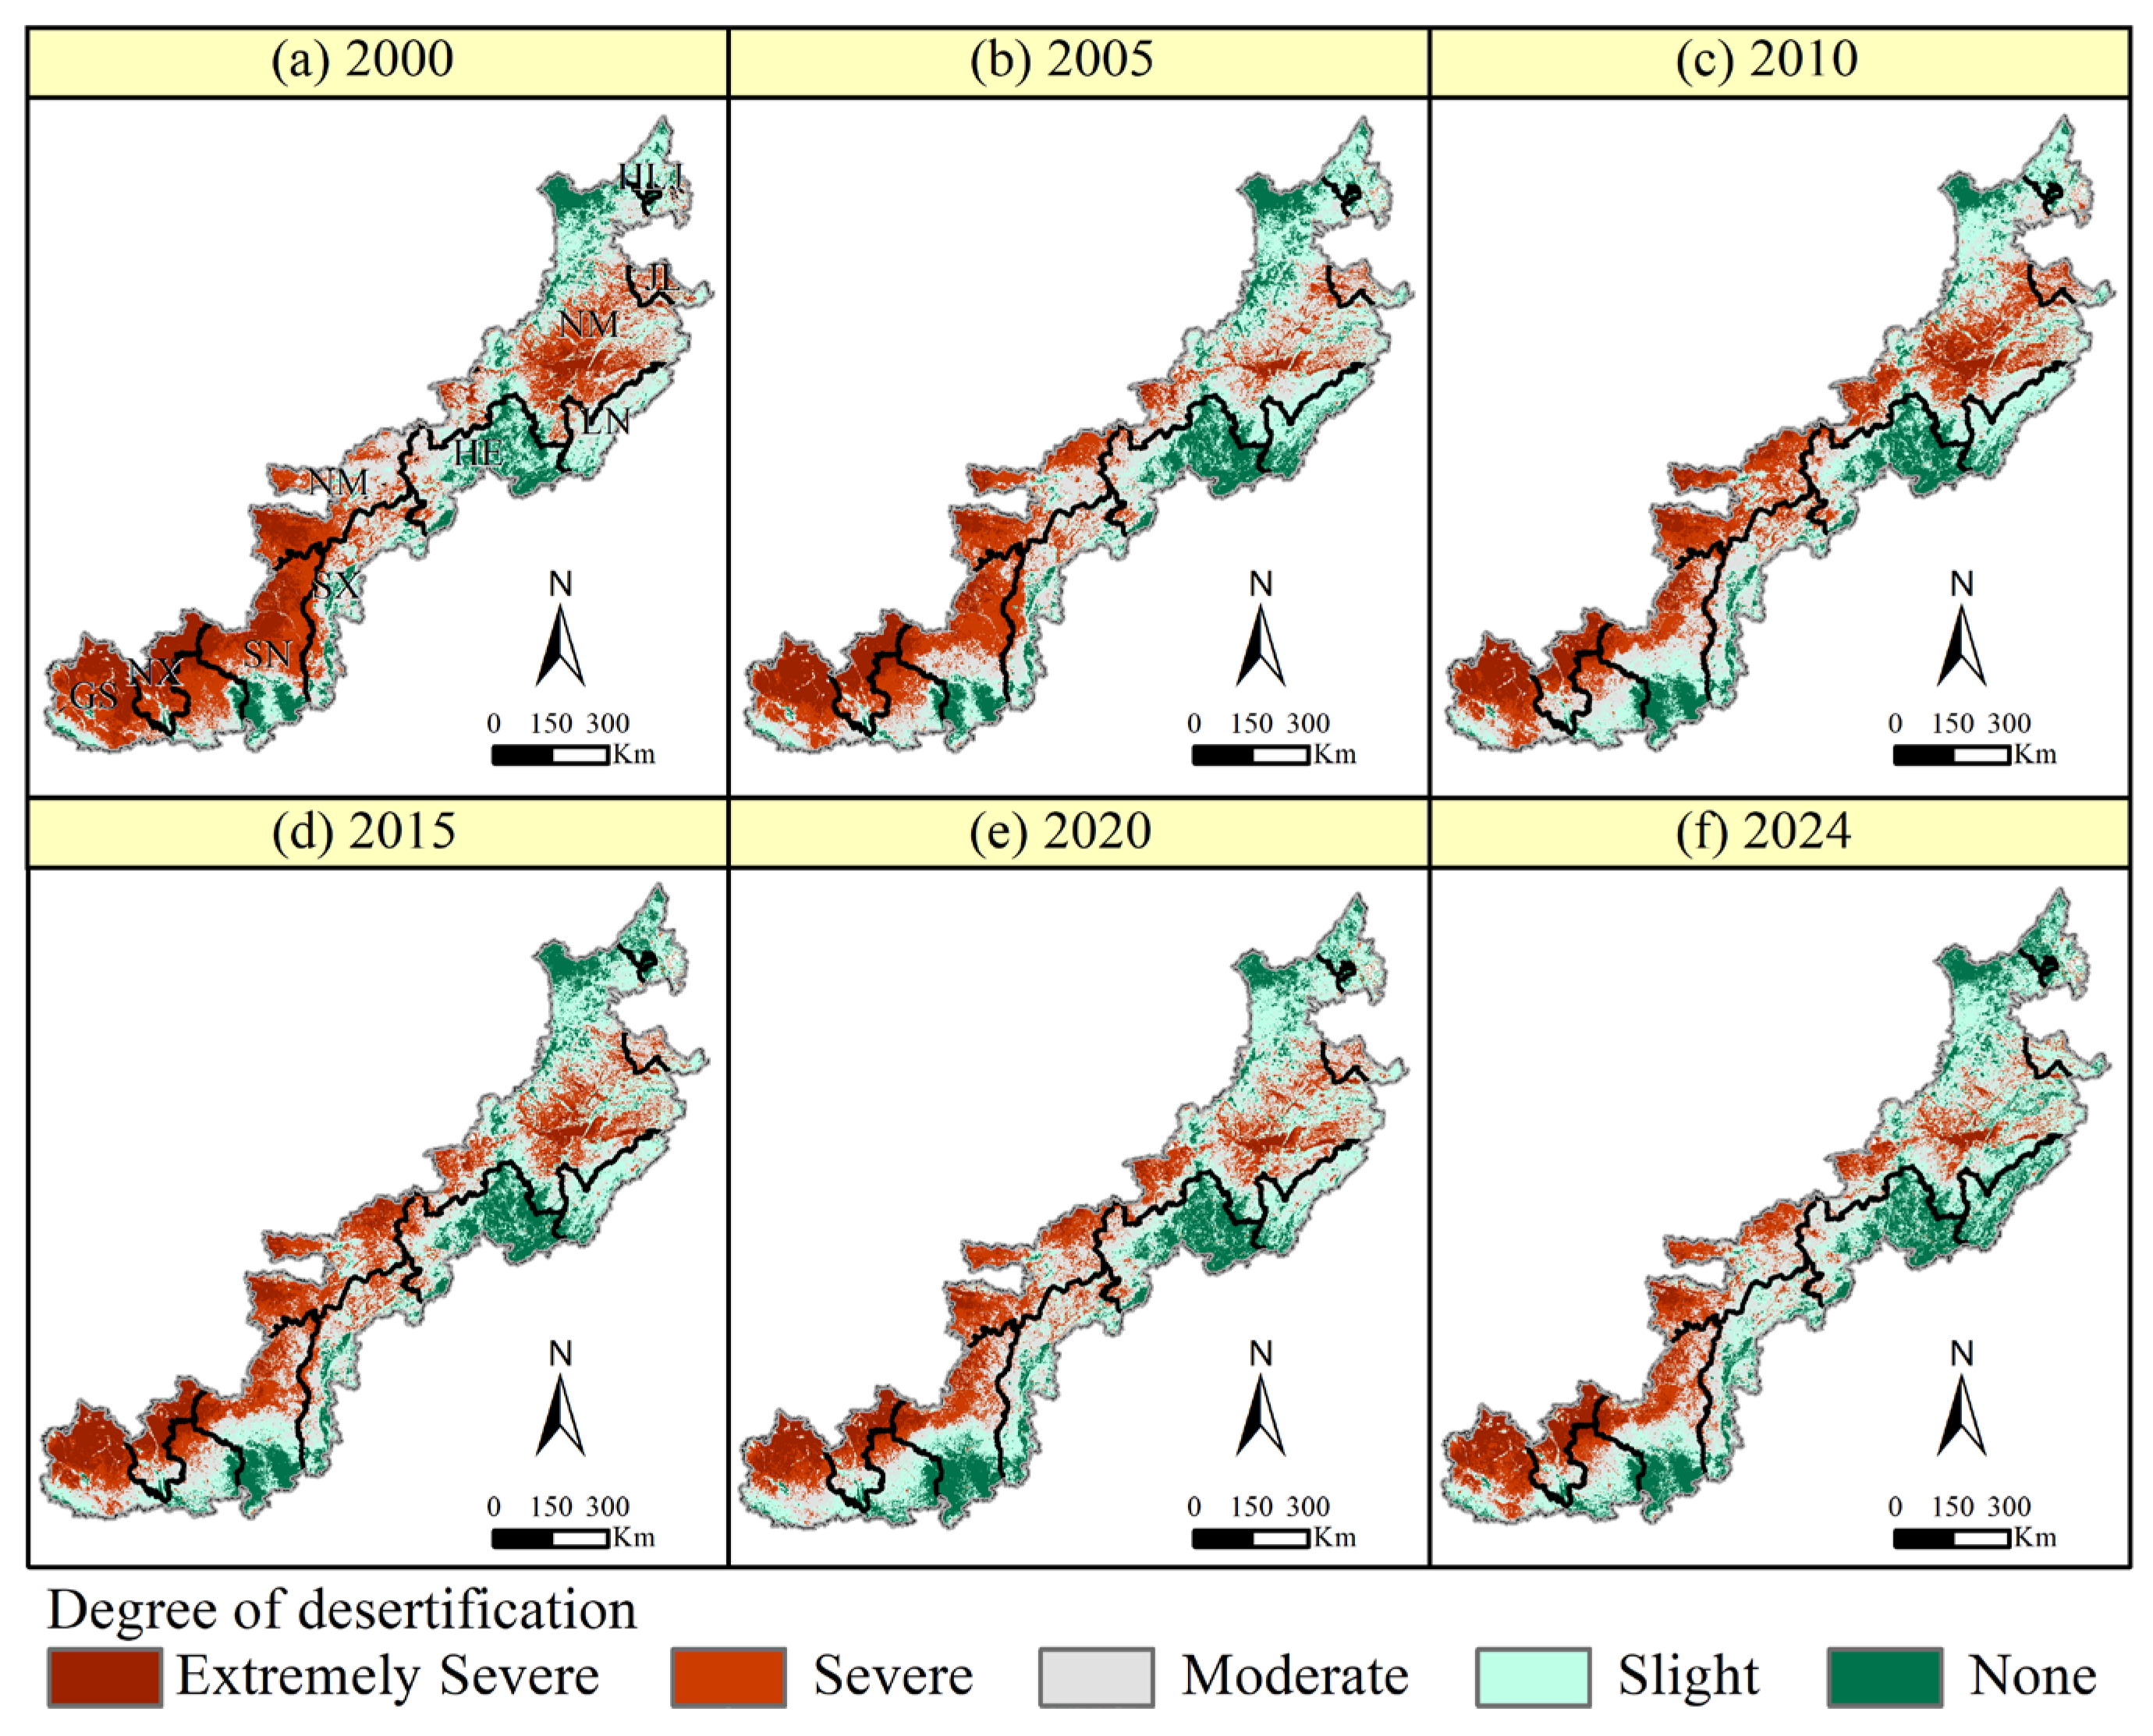
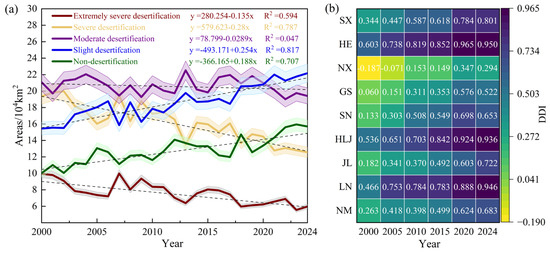
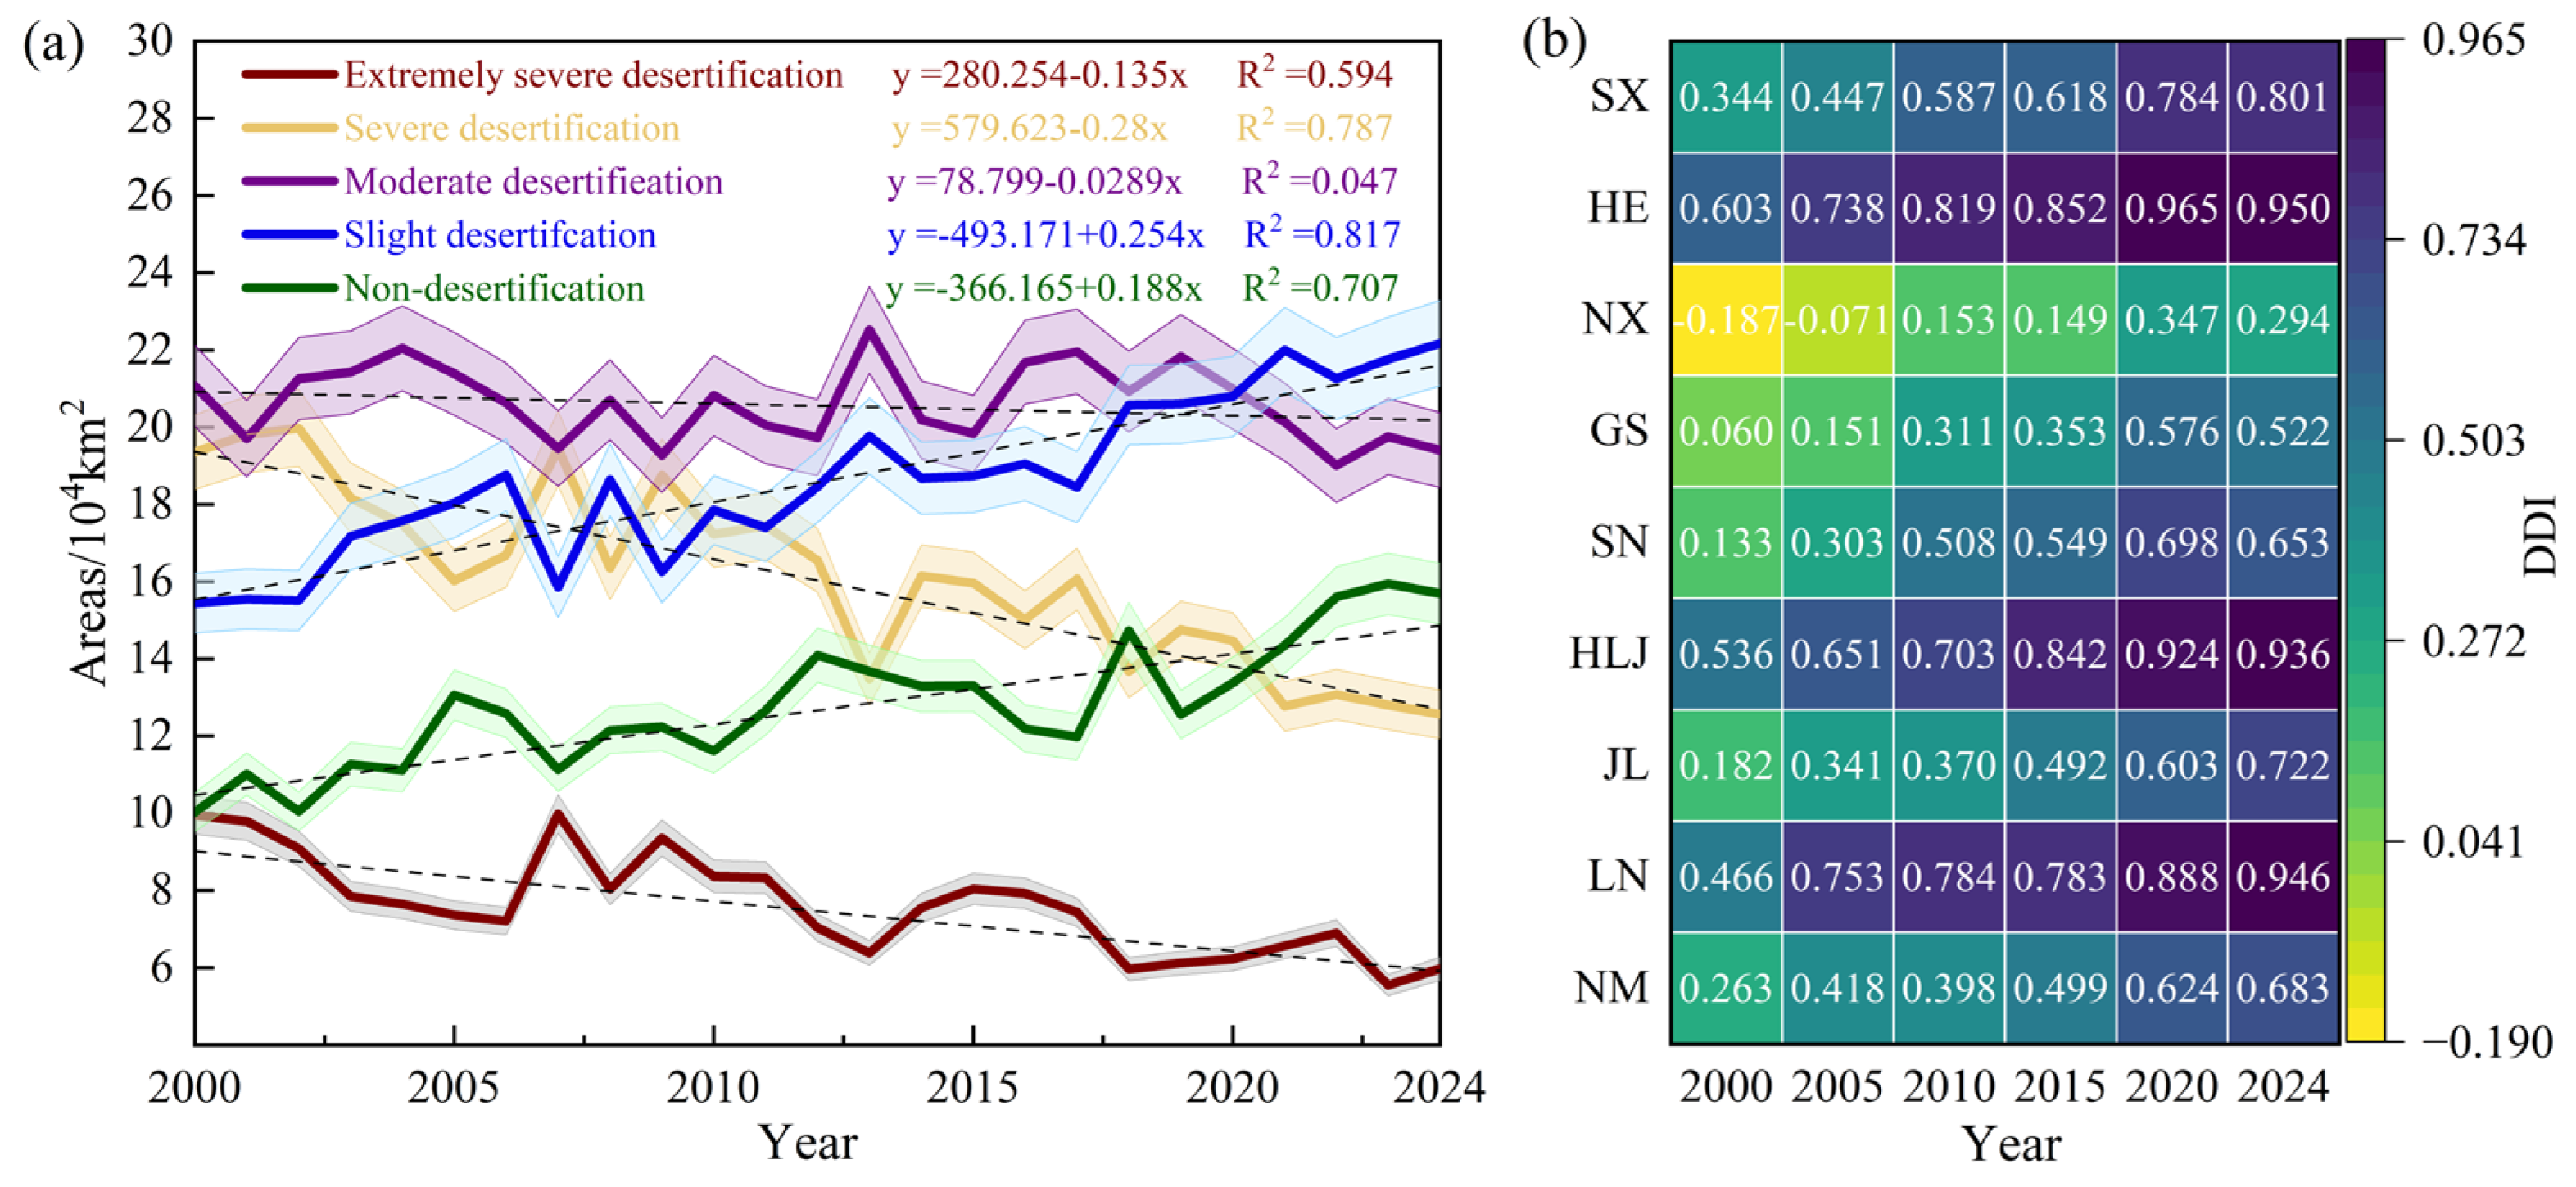
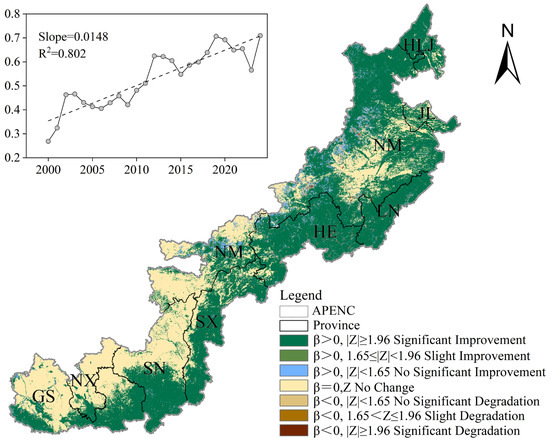
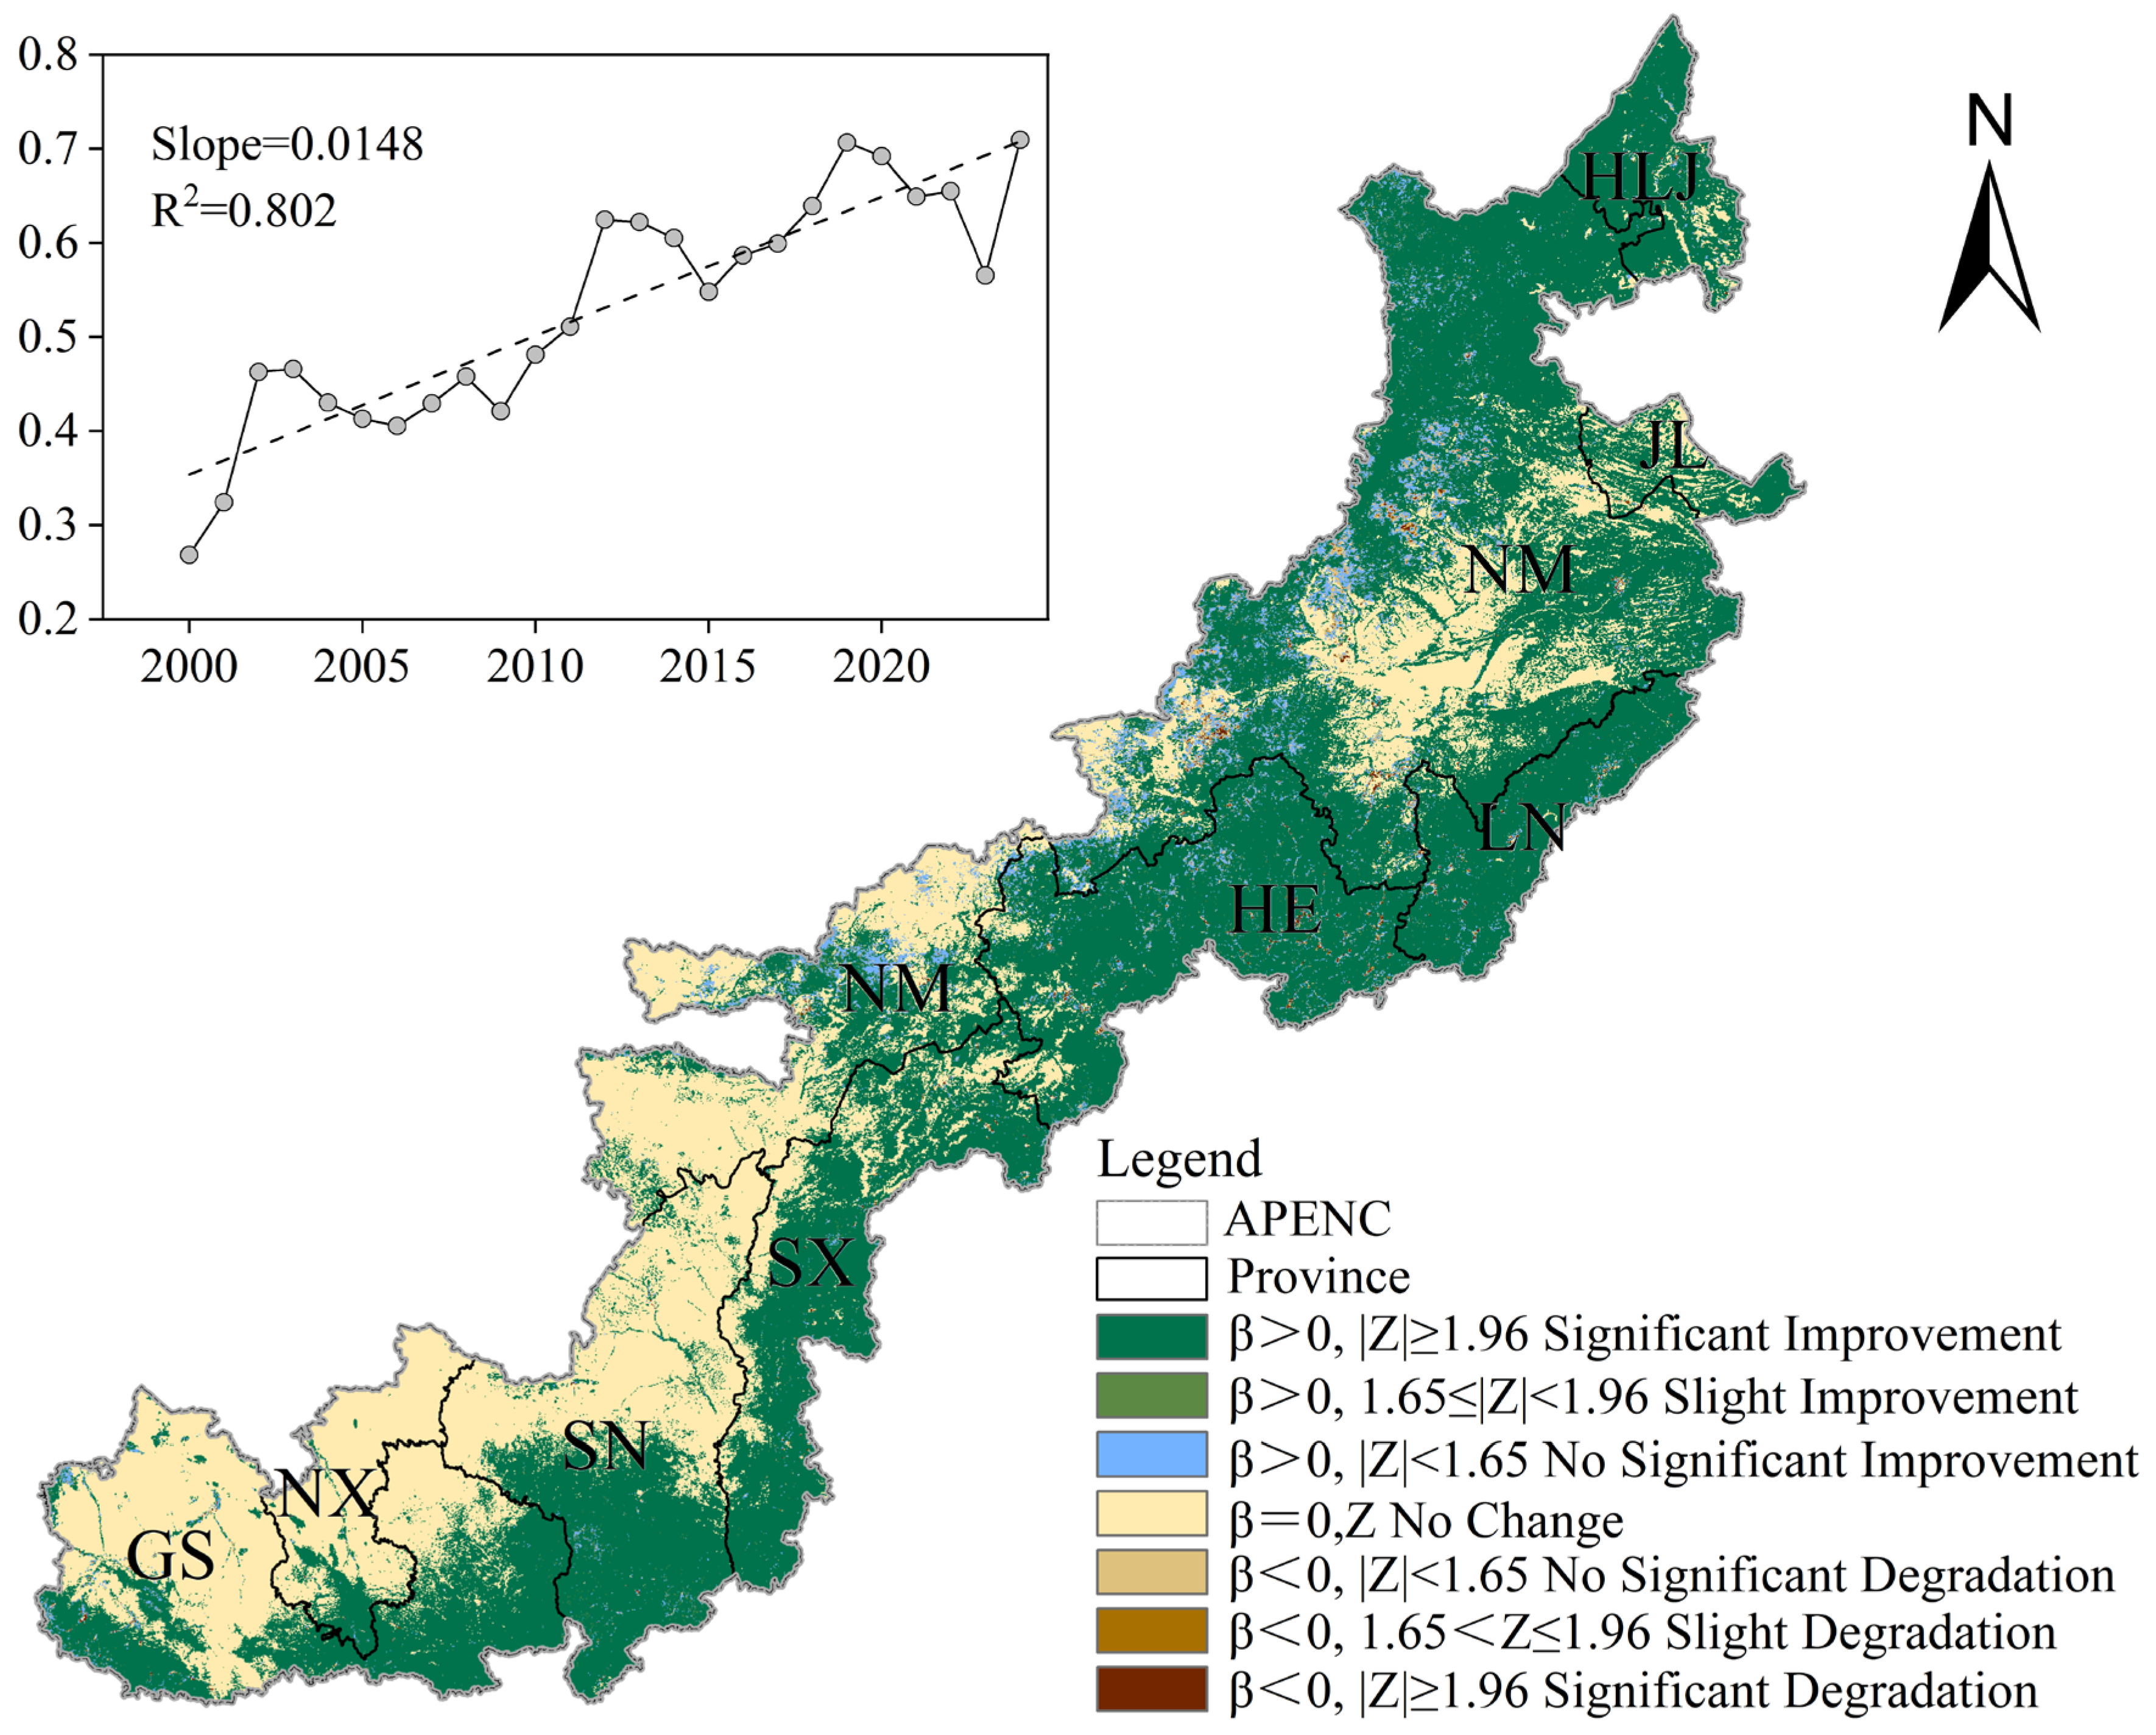
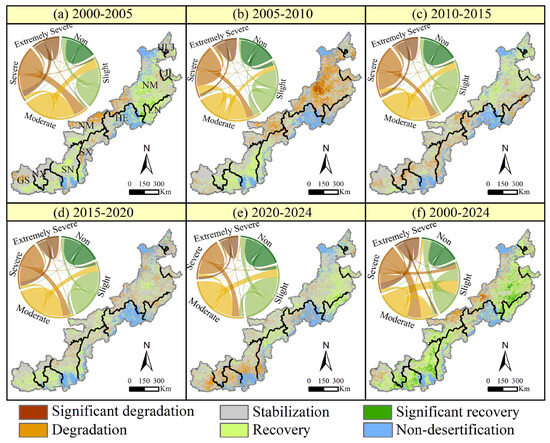
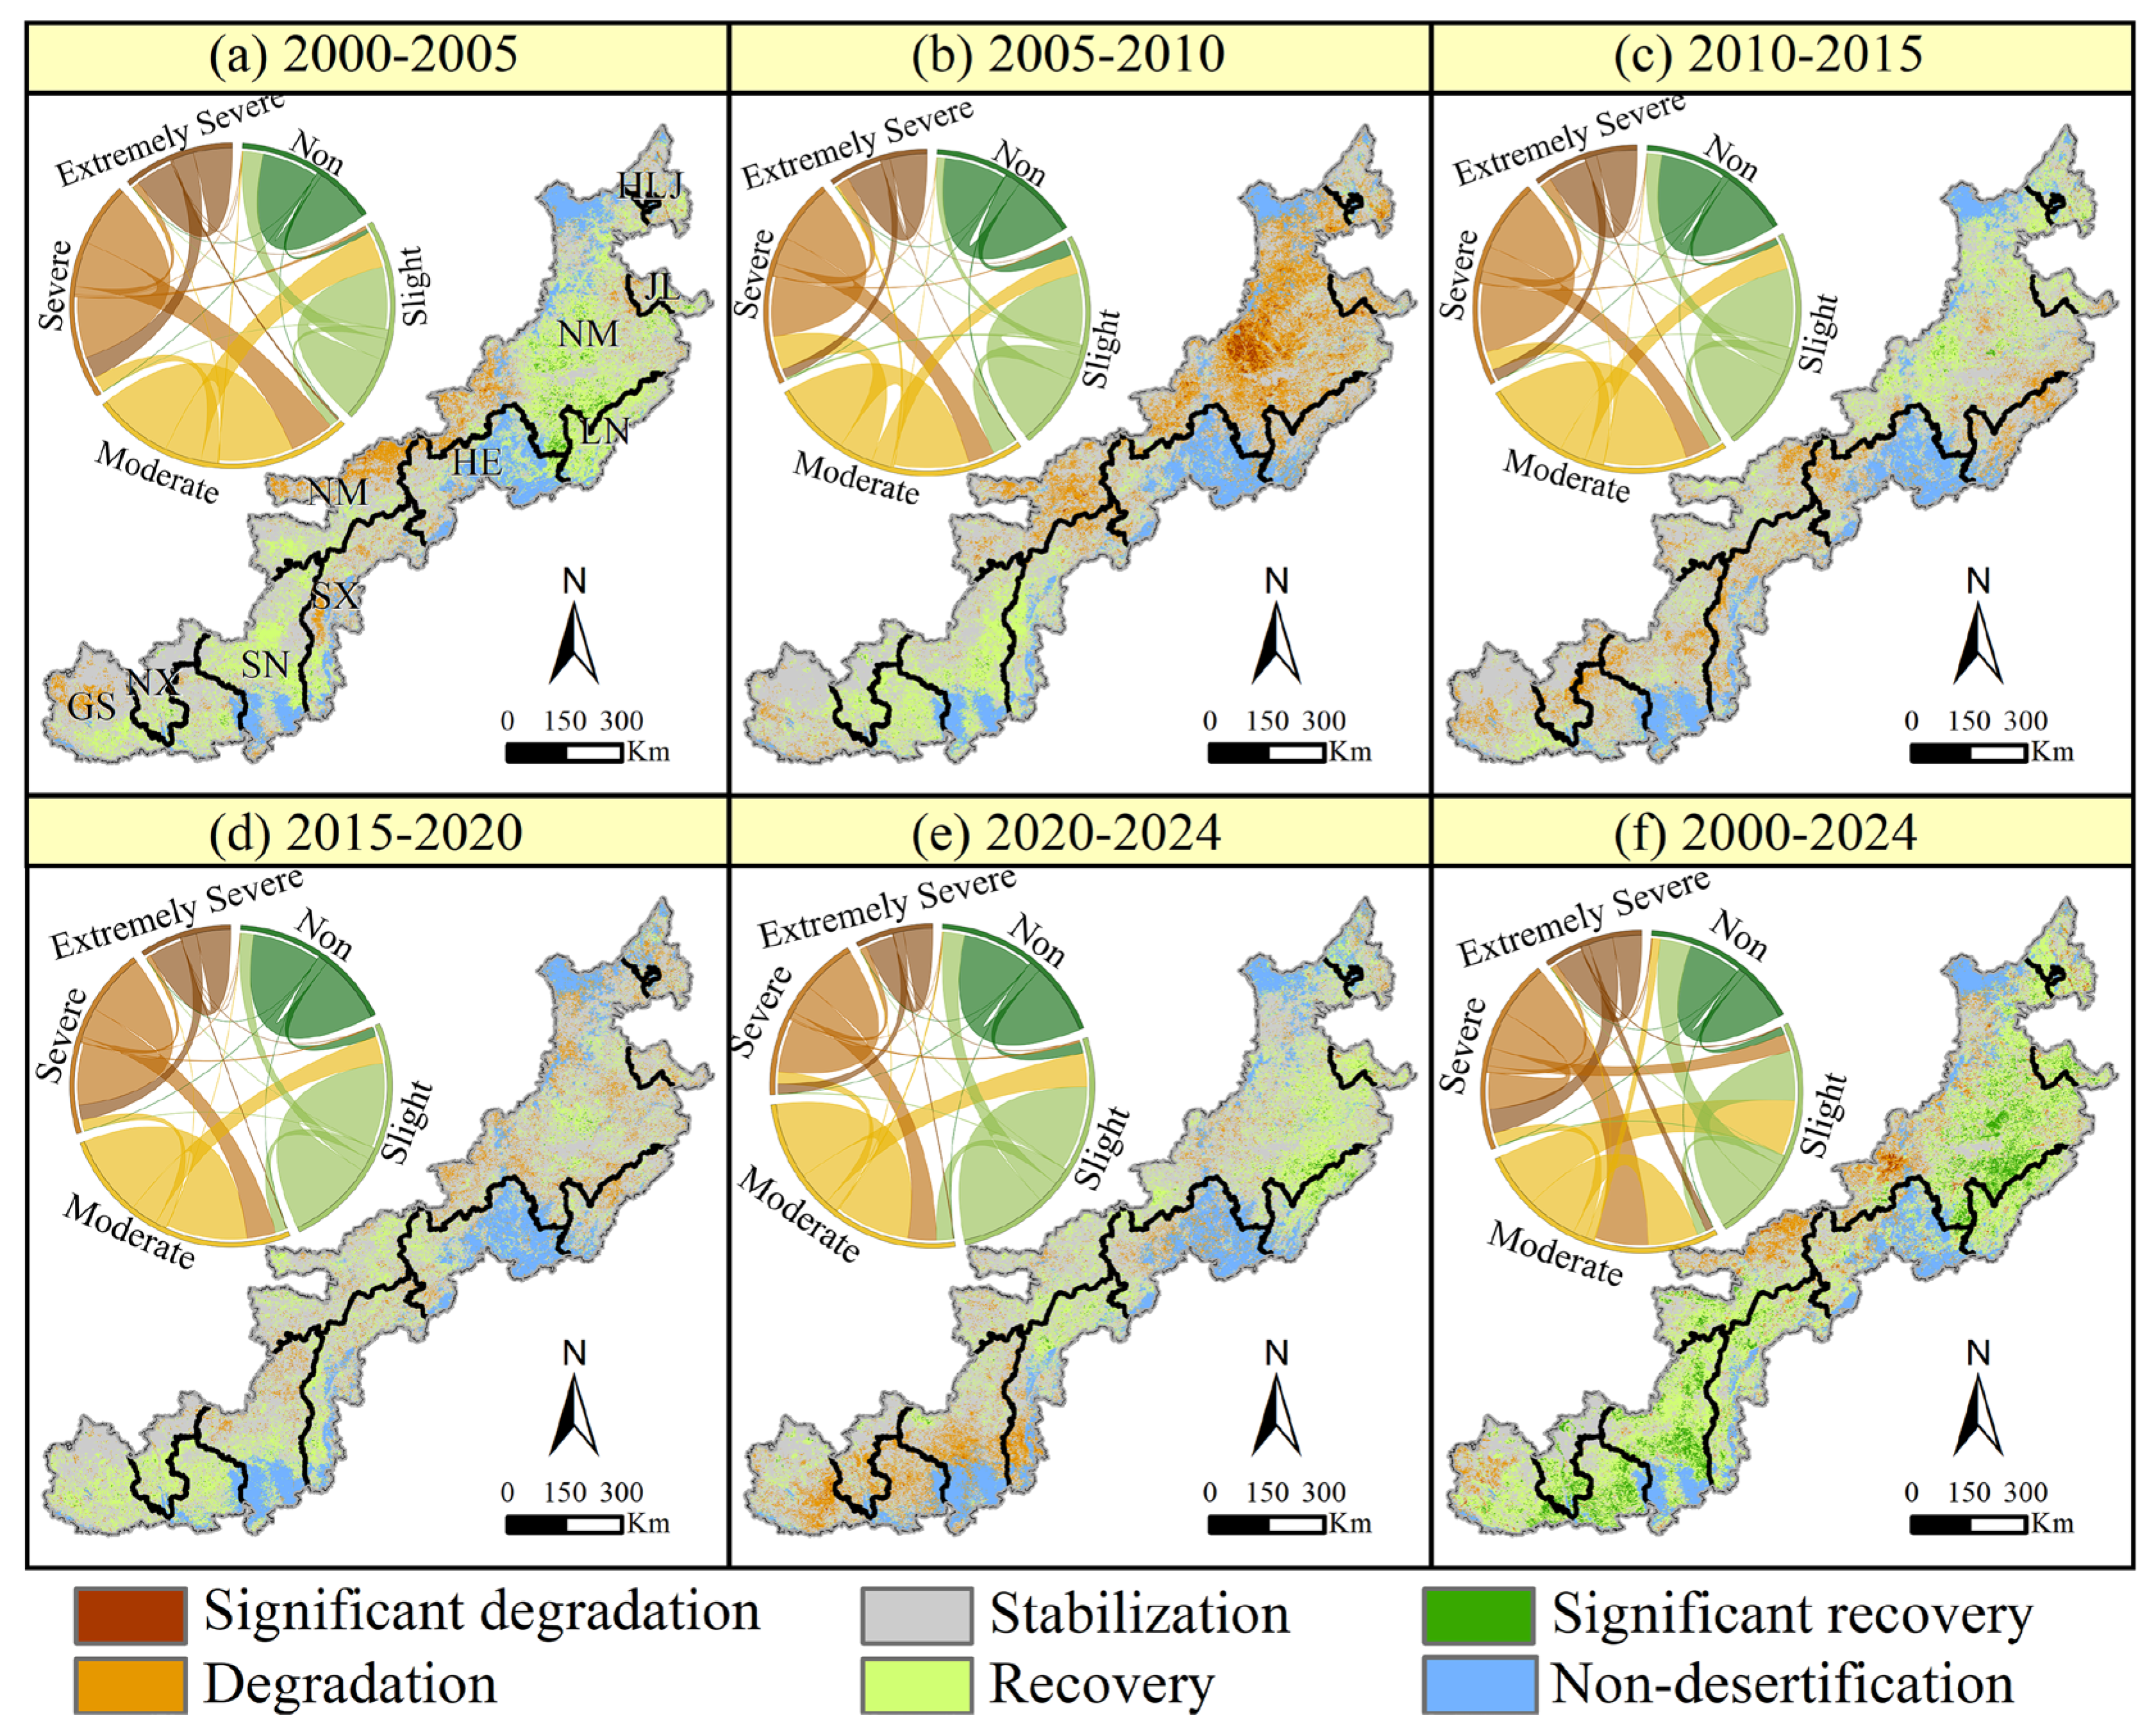
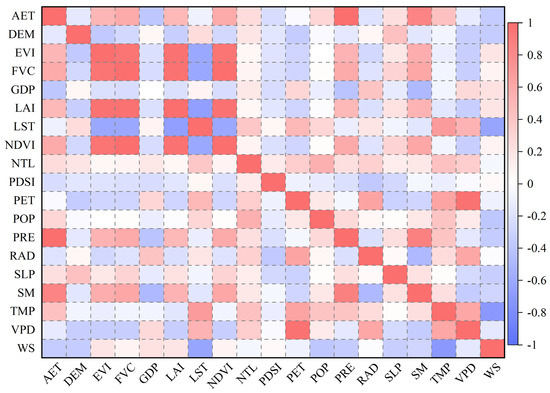
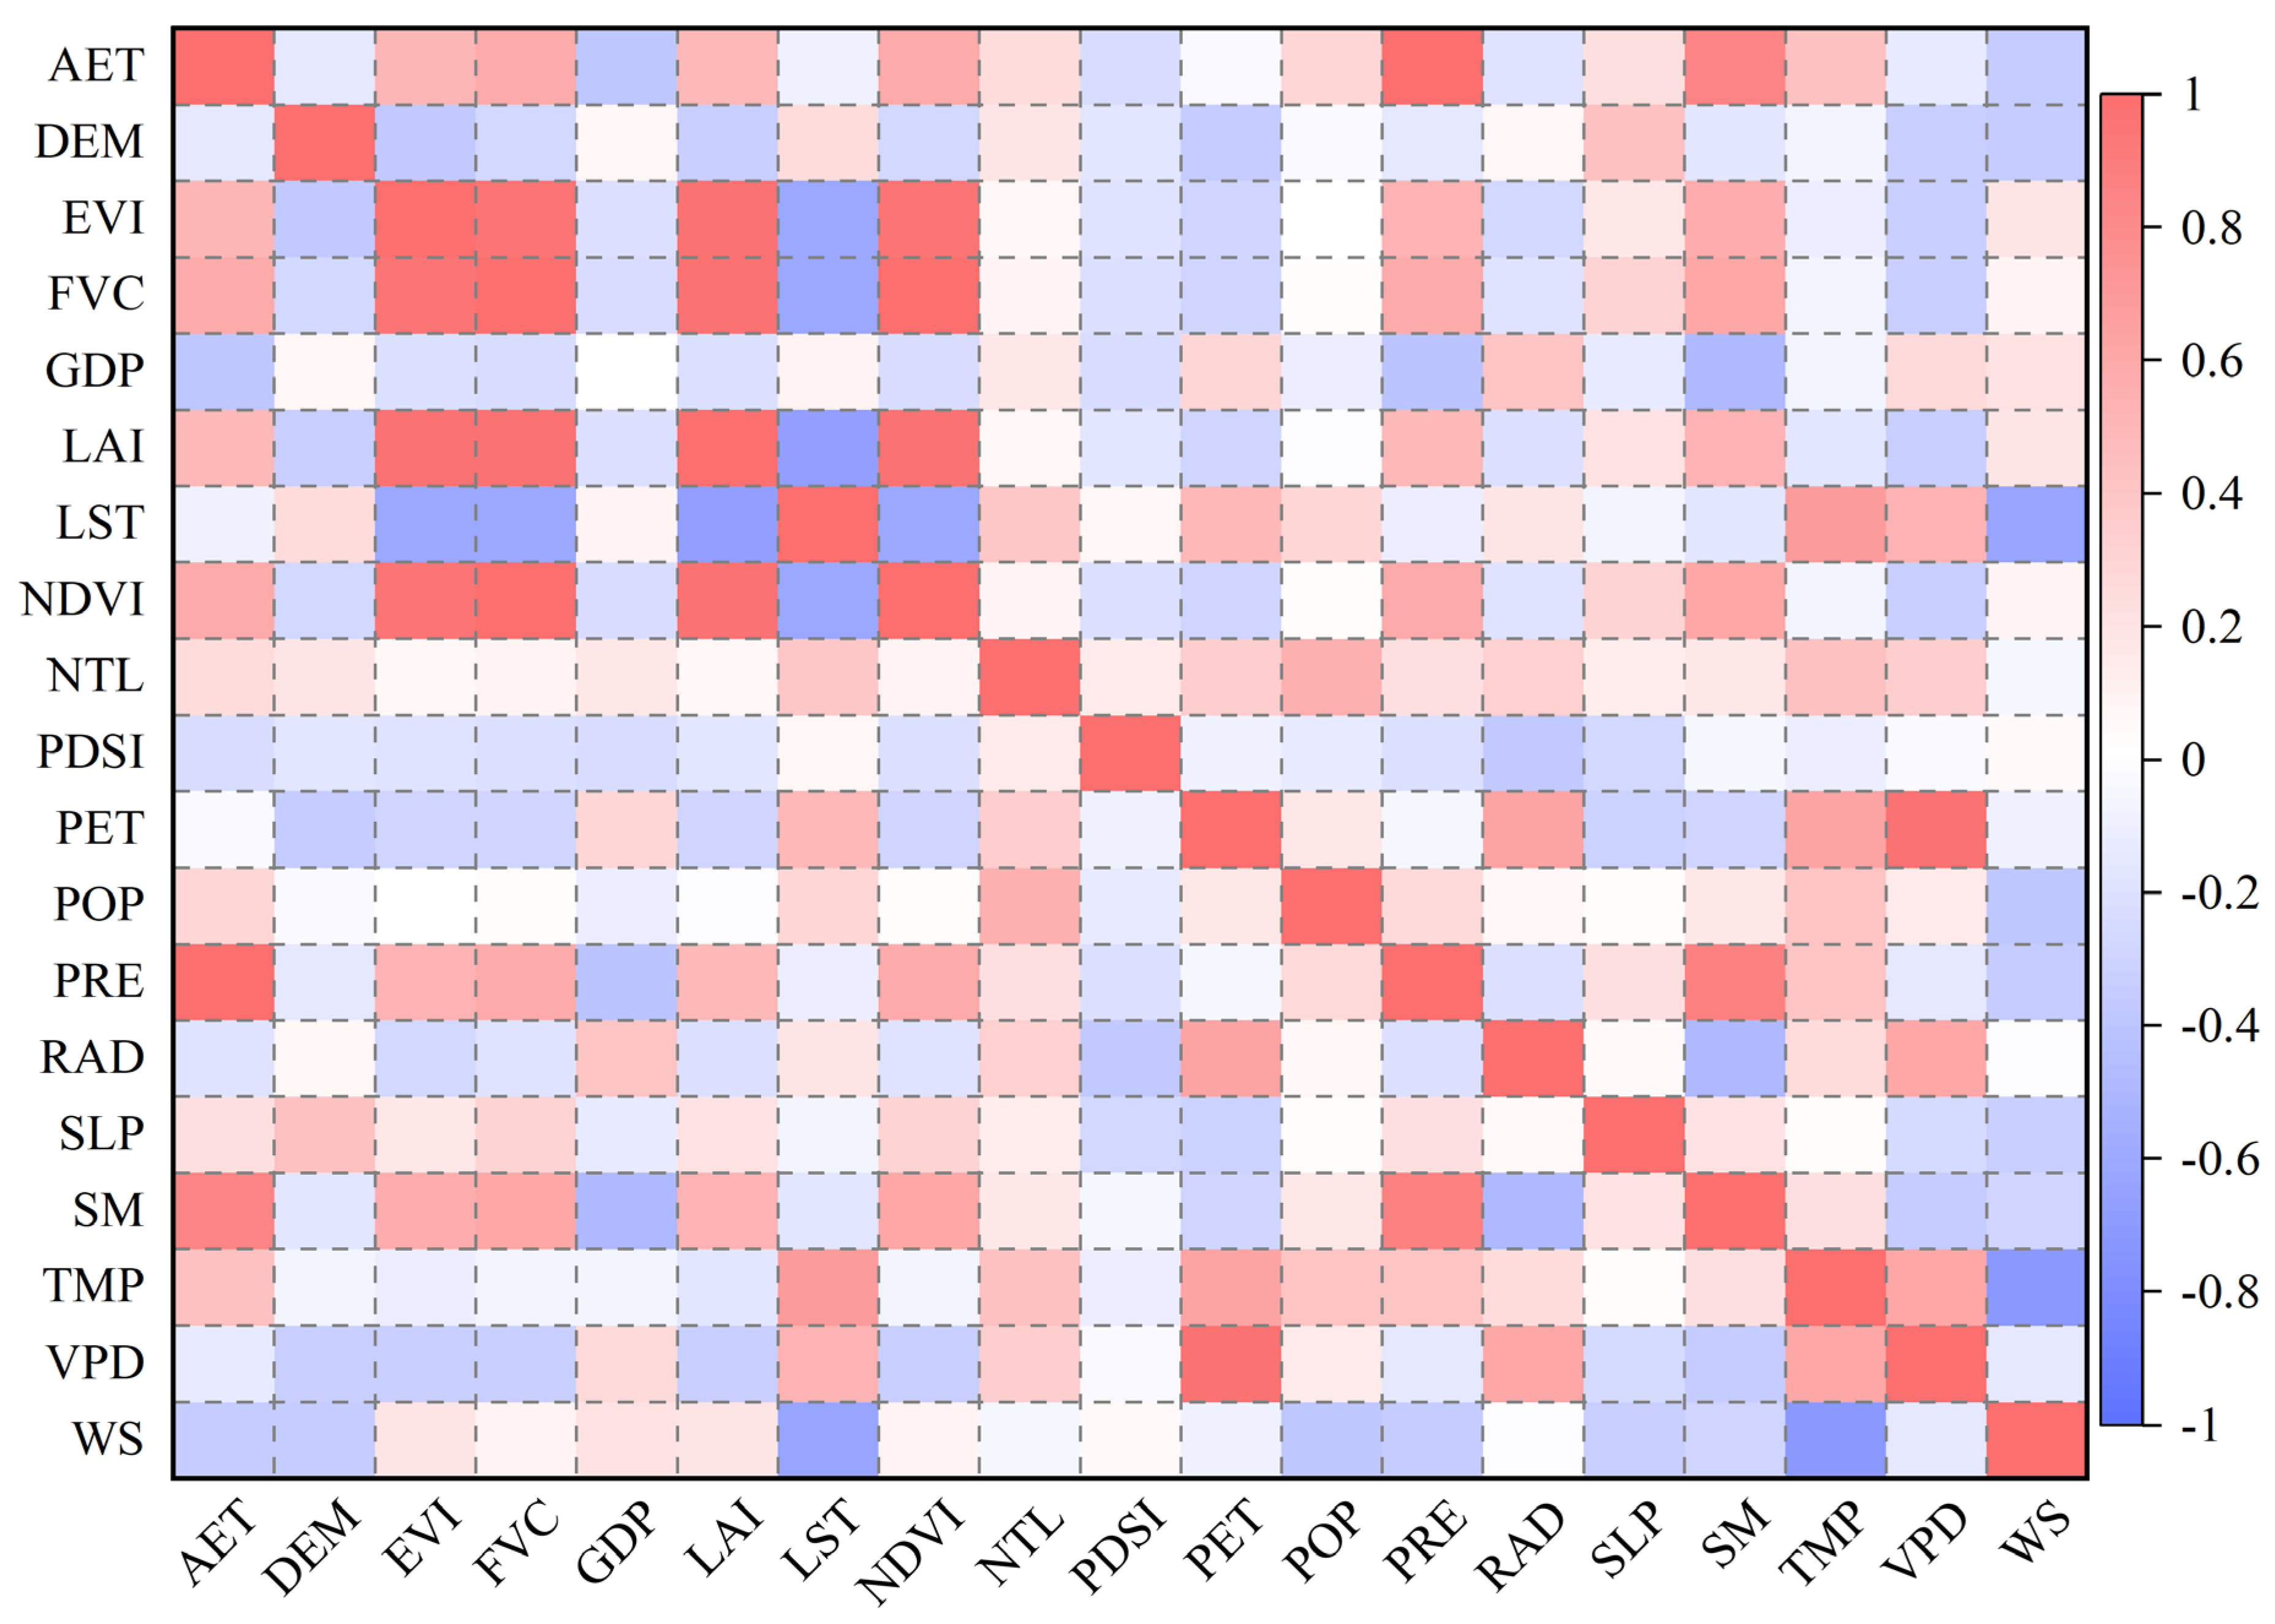
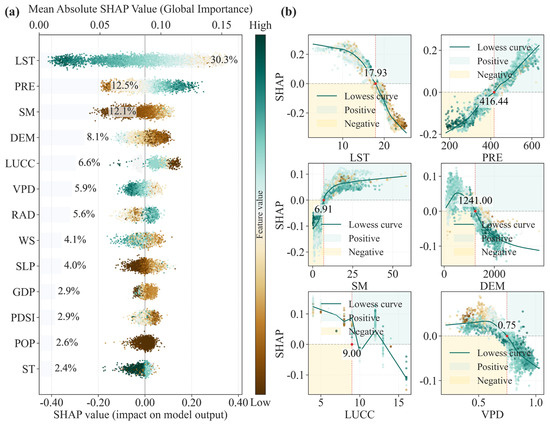
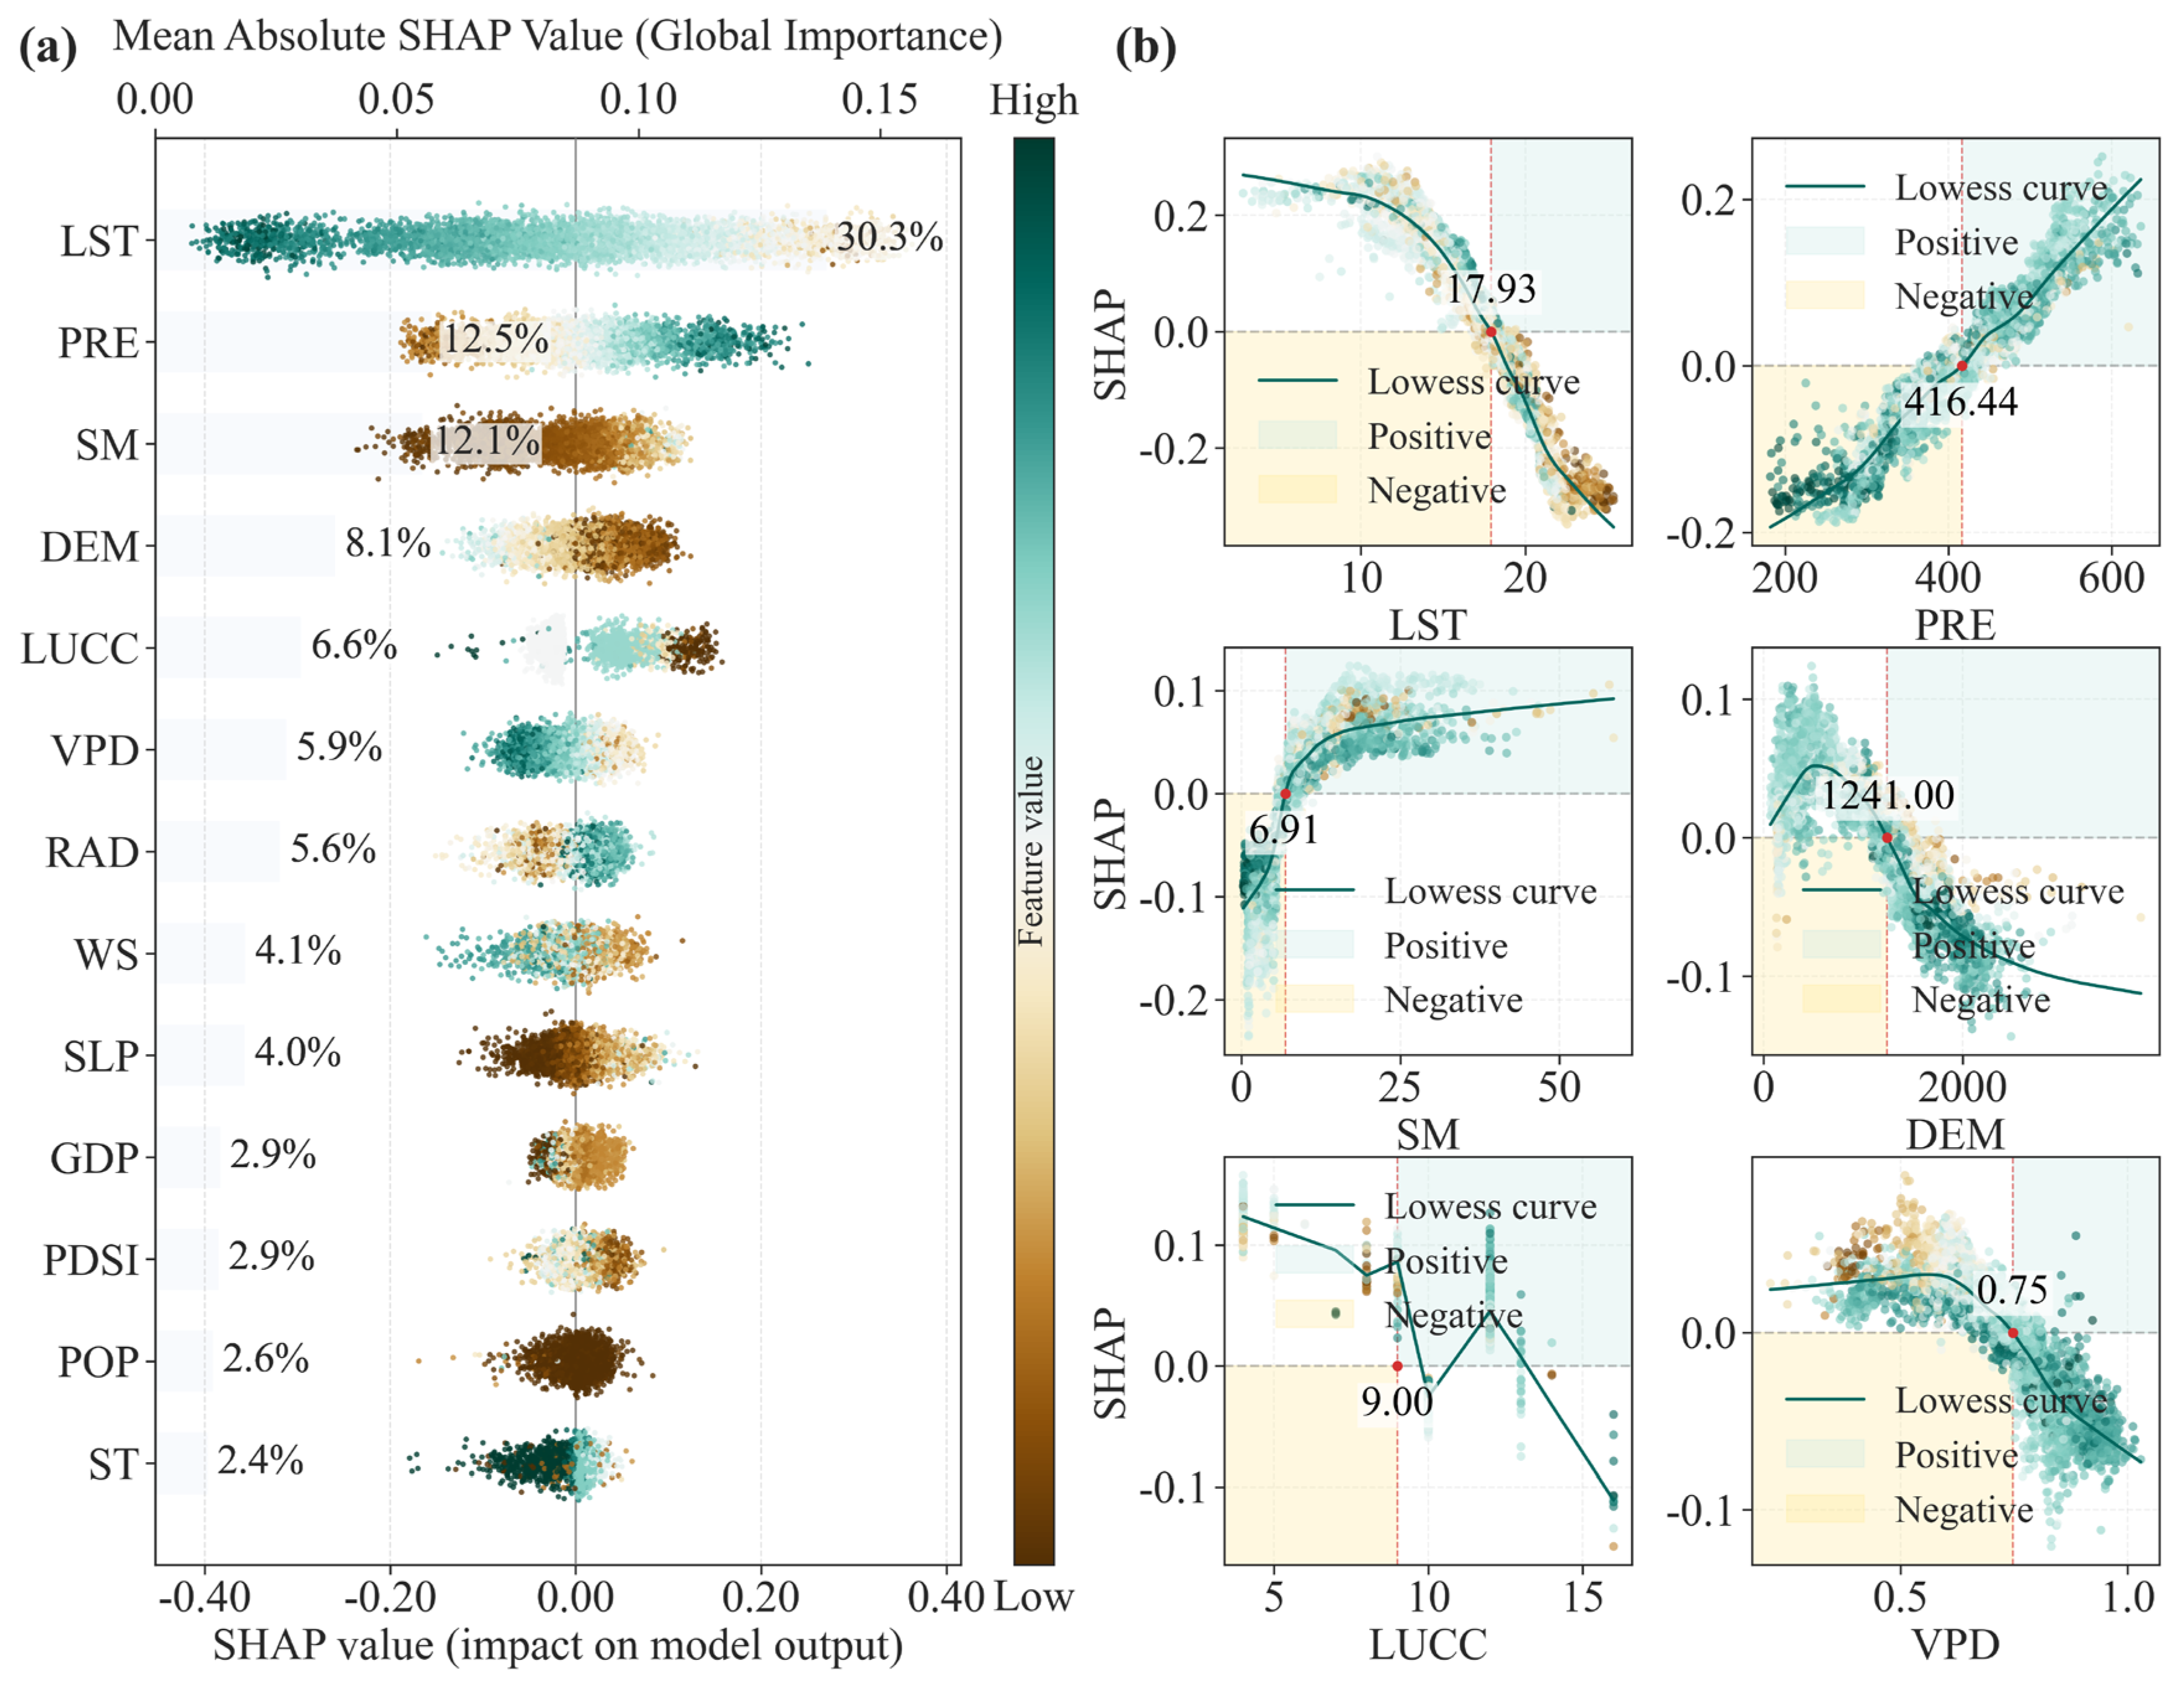
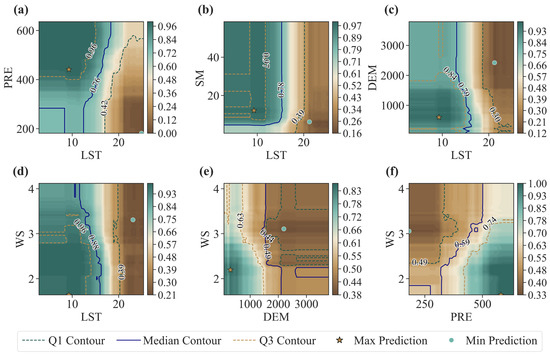
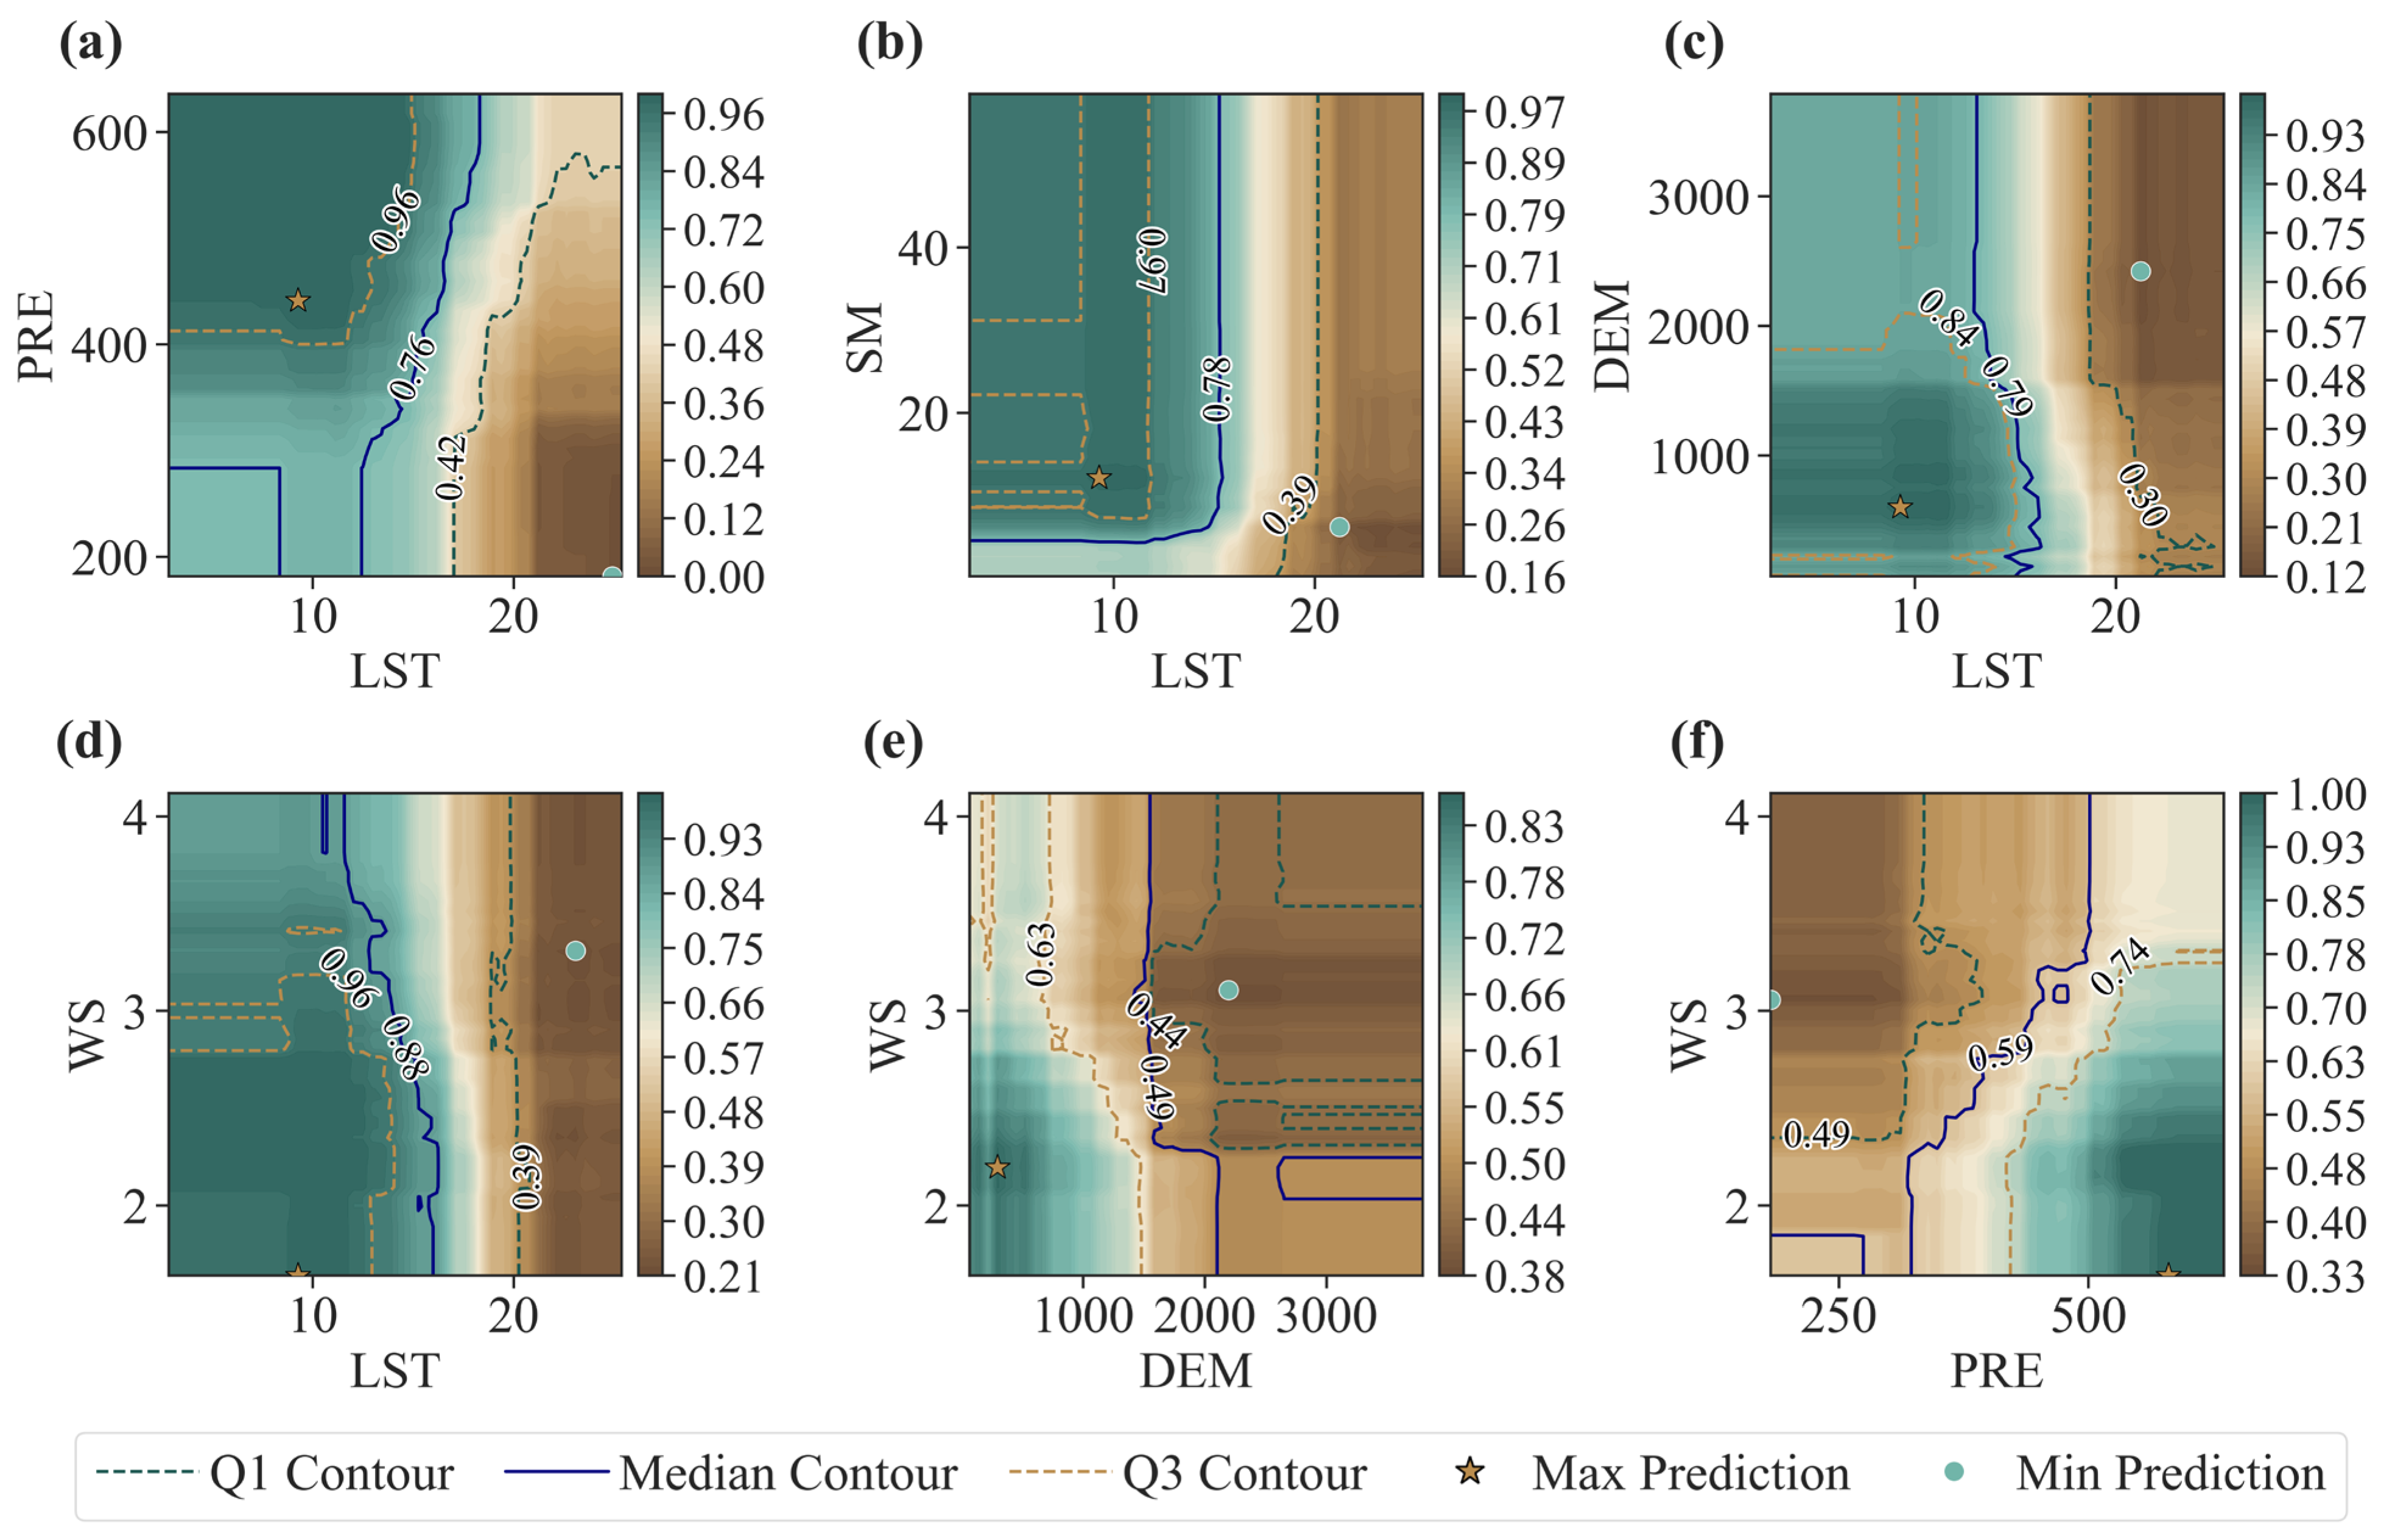

Disclaimer/Publisher’s Note: The statements, opinions and data contained in all publications are solely those of the individual author(s) and contributor(s) and not of MDPI and/or the editor(s). MDPI and/or the editor(s) disclaim responsibility for any injury to people or property resulting from any ideas, methods, instructions or products referred to in the content. |
© 2026 by the authors. Licensee MDPI, Basel, Switzerland. This article is an open access article distributed under the terms and conditions of the Creative Commons Attribution (CC BY) license.