


Abstract
Addressing the issue of ecological vulnerability and against the backdrop of urban expansion in arid regions, this study constructs a composite urban resilience capacity index (CURCI) for the urban agglomeration on the northern slopes of the Tianshan Mountains and examines its space-time evolution together with the relative contribution of key indicators. The evaluation system was constructed from economic, social, ecological, and infrastructure dimensions. The CRITIC-entropy combined weighting method, TFPW-MK method, standard deviation ellipse, and XGBoost-SHAP model were used to analyze urban resilience capacity from 2005 to 2022. Results show that, temporally, CURCI showed a sustained overall increase. Urumqi City and Karamay City grew relatively fast as dual core cities, while peripheral and county-level cities improved gradually. Spatially, resilience was higher in the north and west and lower in the south and east. High-value areas expanded, low-value areas gradually disappeared, and the resilience centroid point remained near the boundary between Urumqi City and Changji City, with a northwest–southeast orientation. In terms of factor contributions, economic factors contributed most, followed by social and ecological factors. Based on contribution differences, cities were classified into industrial-advantage, ecological-advantage, natural-constraint, and population-pressure types. These findings provide a reference for resilience assessment and differentiated governance in arid-region urban agglomerations.
1. Introduction
The intensification of global climate change and the acceleration of urbanization have placed modern cities under mounting pressures, making the enhancement of urban resilience the key to overcoming these challenges [1]. Building inclusive, safe, resilient, and sustainable urban environments has become a shared global goal. China’s 14th Five-Year Plan (2021–2025) [2,3,4] and the report of the 20th National Congress of the Communist Party of China [5,6] have both explicitly set forth the strategic requirement to build “resilient, livable, and smart cities.” Due to limited precipitation and fragile ecological conditions, cities in arid regions are more sensitive to climate fluctuations and disturbances caused by human activities. Therefore, investigating the evolutionary characteristics of multidimensional urban resilience capacity and the contribution patterns of its constituent conditions is essential for implementing national strategies and addressing the challenges of sustainable development in these cities.
The term “resilience” emerged in the mechanical engineering field and subsequently was brought into ecology by Holling, who defined it as the capacity of natural systems to absorb external disturbances and restore their stability [7]. As research has continued to expand, “resilience” has become a core concept in the study of socio-ecological systems. It is often used to explain how such systems respond to disturbances and change over time. This concept has also been widely applied in urban studies, offering new avenues for addressing urban risks and advancing sustainable development.
At present, “urban resilience” is generally characterized as the capacity of an urban system to absorb internal and external pressures. It also describes the ability of a city to quickly restore its functions and order. In the long term, urban resilience also involves continuous adjustment and adaptation. In resilience assessment, domestic and international scholars have developed evaluation indicator systems from multiple dimensions. These dimensions include society, economy, culture, ecology, infrastructure, and spatial layout. For example, the TOSE framework conceptualizes resilience through four dimensions: technical, organizational, social, and economic [8]. Some studies also emphasize features such as adaptability, robustness, and innovation. These features reflect the complexity of urban systems; they also show how cities respond to external shocks [9]. In regard to research methods, current studies mainly use TOPSIS [10], AHP [11], and the CRITIC-entropy combined weighting method [12] to measure development levels. They also analyze spatiotemporal evolution based on these methods [13,14]; The Hurst index [15] and system dynamics models [16] are often used to predict future trends in resilience. The geographical detector [17] is often used to explore influencing factors. Geographically and temporally weighted regression [18] and multiple linear regression [19] are also commonly used.
The existing research has laid the foundation for studies on urban resilience capacity. However, there is still room for further exploration. This is especially true for special urban agglomerations in arid regions. It is also true for the nonlinear contribution patterns within urban resilience capacity assessments. First, most existing studies focus on the provincial level, prefecture-level cities, or large urban agglomerations. Less attention has been paid to secondary urban agglomerations and small-scale units. The urban cluster on the northern slope of the Tianshan Mountains is one such example. Second, urban resilience is a complex system with multidimensional coupling relationships. Its evaluation indicators often have collinearity. Therefore, traditional analytical methods have certain limitations. In recent years, a growing body of research has applied the XGBoost-SHAP model to reveal nonlinear contribution patterns within urban resilience and related urban systems [5,20]. However, few such applications have focused on arid-region urban agglomerations or on capacity-based composite indices such as the Composite Urban Resilience Capacity Index (CURCI) adopted in this study, leaving the model-based attribution of constituent indicators to CURCI in this specific context largely unexplored.
Located on the northern slope of the Tianshan Mountains, this urban cluster is situated in the arid region of northwestern China. With abundant energy reserves and a uniquely advantageous geographical location, the region serves as a pillar of growth for the “Western Development” strategy, a core hub of the “Silk Road Economic Belt,” and the most densely populated urbanized area in Xinjiang [21]. However, resource scarcity, environmental constraints, and rapid urbanization pose a serious threat to the sustainable future of urban clusters. In this context, this study takes the Northern Slope of Tianshan Mountains Urban Agglomeration as the research object. It constructs a composite urban resilience capacity index from four dimensions: economy, society, ecology, and infrastructure. It uses the CRITIC-entropy combined weighting method, the trend-free pre-whitening Mann–Kendall method, the standard deviation ellipse, and the XGBoost-SHAP model. It calculates CURCI of the cities of the Northern Slope of Tianshan Mountains Urban Agglomeration. It analyzes its spatiotemporal evolution patterns. It quantifies the relative contribution of key indicators to this resilience capacity index. This study aims to provide new insights for assessing urban resilience capacity in cities located in arid regions.
2. Materials and Methods
2.1. Study Area
The Northern Tianshan Mountain Urban Agglomeration was officially designated as one of China’s 19 national-level urban agglomerations in the 13th Five-Year Plan. It is not only one of the country’s two urban agglomerations located in border regions, but also the only one situated within the core area of the Silk Road Economic Belt, giving it distinctive strategic importance. Although it occupies a relatively limited area within Xinjiang, the agglomeration accounts for 83.0% of the region’s heavy industry and 62.0% of its light industry. It is also the most densely populated and economically dynamic area in Xinjiang and serves as the principal spatial platform for advancing urbanization and industrialization in the autonomous region. However, the high concentration of population, industry, and strategic functions conflicts with the inherent fragility of oasis ecosystems in China’s arid inland regions, thereby posing major challenges to resilient urban development and sustainability. Therefore, scientifically assessing the resilience of cities in arid regions and identifying the contributions of internal factors to urban resilience are essential for formulating targeted strategies to enhance resilience in these cities.
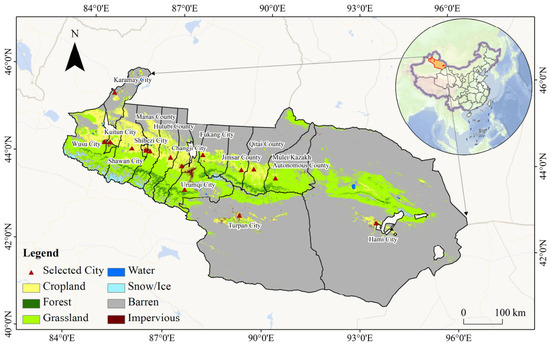
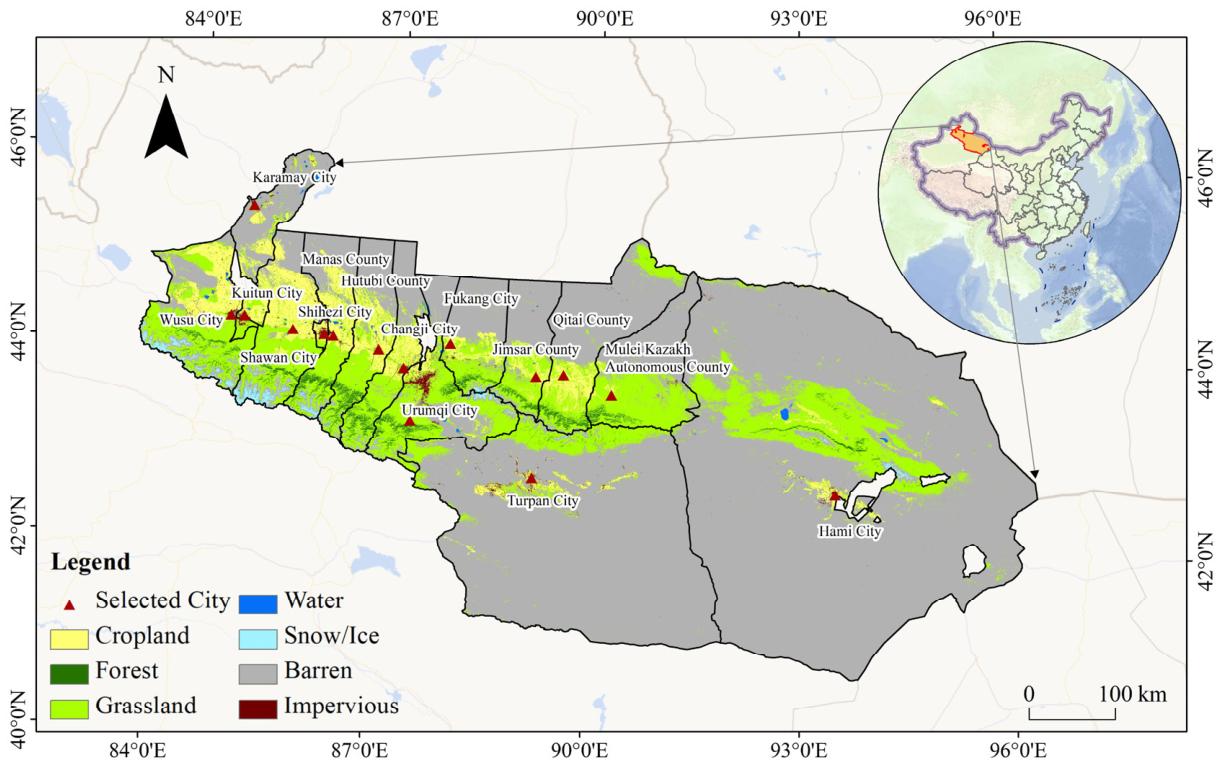
Some cities in the urban agglomeration have a short history. Relevant data are also limited. Therefore, this study selects 15 core cities as the research objects (Figure 1).
Figure 1.
Schematic diagram of the study area.
2.2. Data
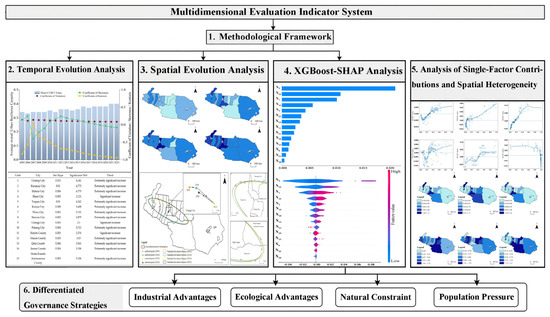
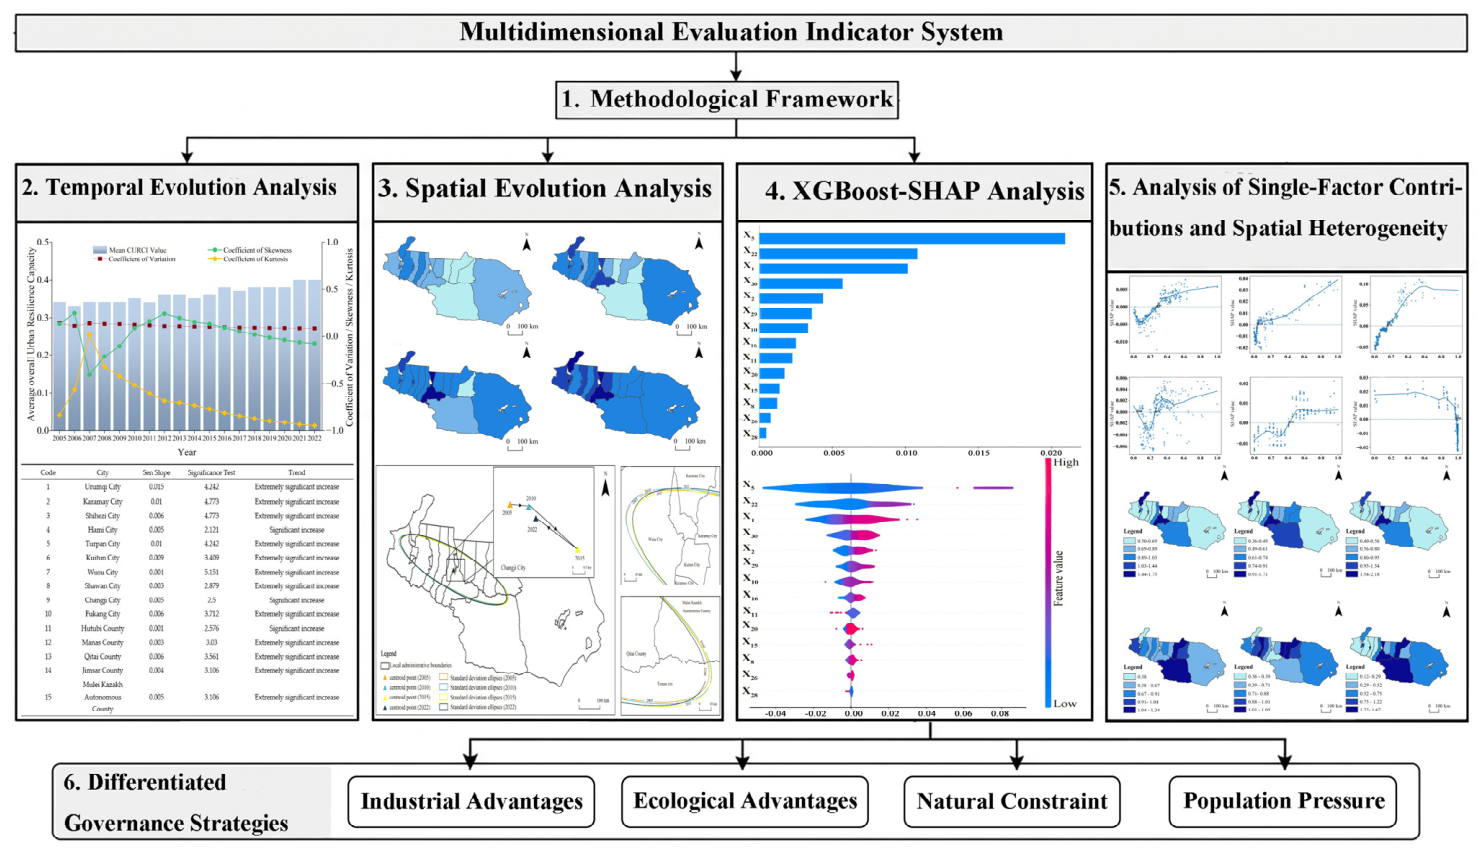
The following is the workflow diagram for this article, which consists of six sections (Figure 2). They are Methodological Framework, Temporal Evolution Analysis, Spatial Evolution Analysis, XGBoost-SHAP Analysis, Analysis of Single-Factor Contributions and Spatial Heterogeneity and Differentiated Governance Strategies.
Figure 2.
Research process diagram.
2.2.1. Designing the Indicator System
Urban resilience refers to the comprehensive capacity of an urban system to withstand disturbances, restore normal operations, and adapt to change. These disturbances may come from external shocks or internal emergencies [22]. Urban resilience encompasses economic, social, ecological, and infrastructure elements, and also emphasizes the synergy among these elements [23]. Based on existing research and regional characteristics, this paper adopts a sustainable perspective and constructs a composite urban resilience capacity index. The index comprises 30 indicators across four dimensions: economy, society, ecology, and infrastructure (Table 1). Consistent with the capacity-based tradition of resilience measurement—exemplified by the Baseline Resilience Indicators for Communities framework [24] and related work on measuring resilience capacities [25]—these indicators characterize the structural conditions and capitals that underpin a city’s capacity to withstand, recover from, and adapt to disturbance, rather than directly measuring the disturbance-response process itself. This distinction, and its methodological implications, is discussed further in Section 4.4.
Table 1.
Indicator framework for urban resilience capacity.
2.2.2. Data Sources
Using land use data, groundwater-level grid data, meteorological observations, the Normalized Difference Vegetation Index (NDVI), and socioeconomic data. Land use data sourced from the China Land Cover Dataset (CLCD) (https://zenodo.org/record/8176941, accessed on 15 January 2026). This dataset was released by Professor Yang Jie’s team at Wuhan University. Its spatial resolution is 30 m × 30 m. Groundwater level grids, SO2 data, and precipitation data were obtained from the National Qinghai–Tibet Plateau Science Data Center (https://data.tpdc.ac.cn, accessed on 20 December 2025). Their spatial resolution is 1 km × 1 km. PM2.5 data were obtained from the Atmospheric Composition Analysis Group at Washington University in St. Louis (https://sites.wustl.edu/, accessed on 10 January 2026). Their spatial resolution is 1 km × 1 km. The Normalized Difference Vegetation Index (NDVI) was downloaded from the National Aeronautics and Space Administration (https://ladsweb.modaps.eosdis.nasa.gov/, accessed on 26 January 2026). Its spatial resolution is 1 km × 1 km. Data on socioeconomic conditions, infrastructure, and other factors were obtained from the China Urban Statistical Yearbook, the China Urban Construction Statistical Yearbook, the China County Statistical Yearbook, the Xinjiang Statistical Yearbook, and statistical bulletins on national economic and social development issued by various cities and counties. Some data were not published. According to the type of data gap, missing values were completed using linear interpolation and the nearest-neighbor linear trend method.
2.3. Methods
2.3.1. CRITIC-Entropy Combined Weighting Method
To improve the scientific rigor and stability of the weighting of CURCI, this paper uses the CRITIC-entropy combined weighting method. First, the original data are uniformly standardized. On this basis, the indicator weights are calculated using the entropy method and the CRITIC method, respectively. Finally, the final weight of each indicator is determined through the combined weighting method. In the weight determination process, the CRITIC method can consider the variation degree of indicators. It can also consider the conflict among indicators. It can reflect the degree of information overlap among indicators [41]. The specific formulas are as follows:
In the equation, is the number of indicators; is the information content of the j-th indicator; is the weight of the j-th indicator calculated using the CRITIC method.
The entropy method is an objective weighting method that primarily determines weights based on the amount of information contained in the indicators. It measures the dispersion degree of data by calculating the information entropy of indicators. It also reflects the amount of information contained in each indicator [32], The specific formulas are as follows:
In the formula, denotes the information redundancy of the j-th indicator. It reflects the amount of effective information. denotes the weight of the j-th indicator calculated using the entropy method.
The entropy method has limitations in reflecting correlations among indicators. The CRITIC method also has certain shortcomings in characterizing indicator dispersion. Therefore, the two types of weights are linearly integrated. The specific formula is as follows:
In the formula, denotes the final comprehensive weight of the j-th indicator. It is used to adjust the contribution degree of the two methods. Considering the information complementarity of the two methods, this paper sets = 0.5. This means that the two methods are given equal weights. After the two sets of weights are combined, the final weight of each indicator is obtained. Then, the standardized data of each indicator and the corresponding final weights are used for calculation. CURCI was then calculated for each city-year observation.
2.3.2. Standard Deviation Ellipse
To analyze the spatial evolution of composite urban resilience capacity index in the Northern Slope of Tianshan Mountains Urban Agglomeration, this paper uses the standard deviation ellipse method. This method is a classic method for describing the directionality and dispersion characteristics of spatial distribution. It can reveal the overall trend of spatial evolution [42]. The calculation formula is as follows:
In the formula, denotes the rotation angle of the ellipse. and denote the X and Y coordinates of the i-th city. and denote the coordinates of the mean center. n denotes the number of cities in the study area. and are the standard deviations along the major and minor axes of the ellipse. a and b are the standard deviations of the major and minor axes. F denotes the shape index. A value closer to 1 indicates a more balanced spatial distribution. Otherwise, the directionality is stronger.
2.3.3. The Trend-Free Pre-Whitening Mann–Kendall Method (TFPW-MK)
To analyze the temporal trend of the urban resilience capacity index in the Northern Slope of Tianshan Mountains Urban Agglomeration, this paper uses the trend-free pre-whitening Mann–Kendall (TFPW-MK) method. The Mann–Kendall (MK) test is a nonparametric statistical method. It can effectively identify change trends in time series. Its premise is that samples are independent of each other. When a sequence has significant autocorrelation, the traditional MK test may overestimate trend significance. In comparison, the trend-free pre-whitening Mann–Kendall (TFPW-MK) method first removes the effect of autocorrelation in the sequence. It then conducts the MK test. This can improve the reliability of trend analysis results [43,44]. The calculation formula is as follows:
denotes the pre-whitened time series. denotes the original observed value at time t. denotes the original observed value at time t − 1. denotes the Sen slope, it is used to characterize the change rate of the time series. denotes the first-order (Lag − 1) autocorrelation coefficient. t denotes the time-series index.
is the Mann–Kendall test statistic. is the length of the time series. is the observed value at time i. is the observed value at time j. i and j are position numbers in the time series. They satisfy (j > i). is the sign function. It is used to quantify the comparison result of each pair of data.
The Sen slope is used to characterize the change rate and identify the direction of change. A positive slope value indicates an upward trend. A negative slope value indicates a downward trend. The Mann–Kendall test is employed to evaluate the significance of changes in trends. When (|Z|) is greater than 1.96 or 2.576, the trend achieves statistical significance at the 95% or 99% confidence level, respectively. This is based on a two-sided test. Considering the overall upward trend in the urban resilience capacity index within the research area, this paper combines the Sen slope with the results of the significance test. It classifies the change trends of urban resilience capacity into four types (Table 2).
Table 2.
Classification of trends in urban resilience capacity.
2.3.4. XGBoost-SHAP Model
To compare the relative contributions of selected constituent indicators to CURCI, an Extreme Gradient Boosting (XGBoost) regression model was developed. CURCI, calculated using the CRITIC–entropy weighting method, was used as the dependent variable, while selected indicators from the same indicator system were used as predictors. Because these predictors are constituent components of CURCI, an inherent part–whole relationship exists between the predictors and the dependent variable. Therefore, the analysis characterizes their relative contribution patterns within the CURCI framework rather than identifying independent causal determinants of real-world urban resilience.
XGBoost iteratively constructs multiple regression trees and can capture nonlinear predictive associations and interactions among the selected indicators when estimating CURCI. Its objective function includes a regularization term to control model complexity, improve estimation accuracy, and reduce the risk of overfitting [37]. Compared with conventional linear models, XGBoost relies less on linearity assumptions and can accommodate correlated predictor information, although correlated indicators may share or redistribute their contributions within the fitted model. The basic expression is as follows:
In the formula, denotes the model-estimated CURCI for the i-th observation, representing a given city in a given year; is the vector of selected indicator values; denotes the k-th regression tree; K is the total number of regression trees.
The objective function consists of a loss function and a regularization term:
In the formula, denotes the prediction error function. denotes the model complexity regularization term. It is used to control model complexity and prevent overfitting.
Because the fitted XGBoost model does not directly indicate how individual indicators contribute to each estimated CURCI value, the SHapley Additive exPlanations (SHAP) method was introduced. SHAP decomposes each model estimate into an expected model output and the contributions of individual indicators. Its expression is as follows:
In the equation, is the expected model output; m is the number of indicators; represents the expected model output; and is the SHAP value of indicator j for observation i. Positive and negative SHAP values indicate promoting and inhibiting effects on the model-estimated CURCI, respectively, while the absolute SHAP value indicates the contribution magnitude. Mean absolute SHAP values were used to compare the relative contributions of the indicators and identify key indicators within the fitted model.
3. Results
3.1. CURCI Assessment Results
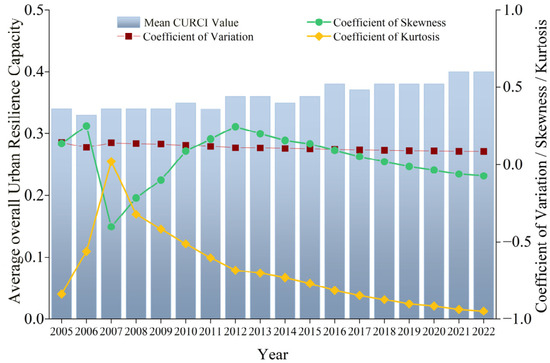
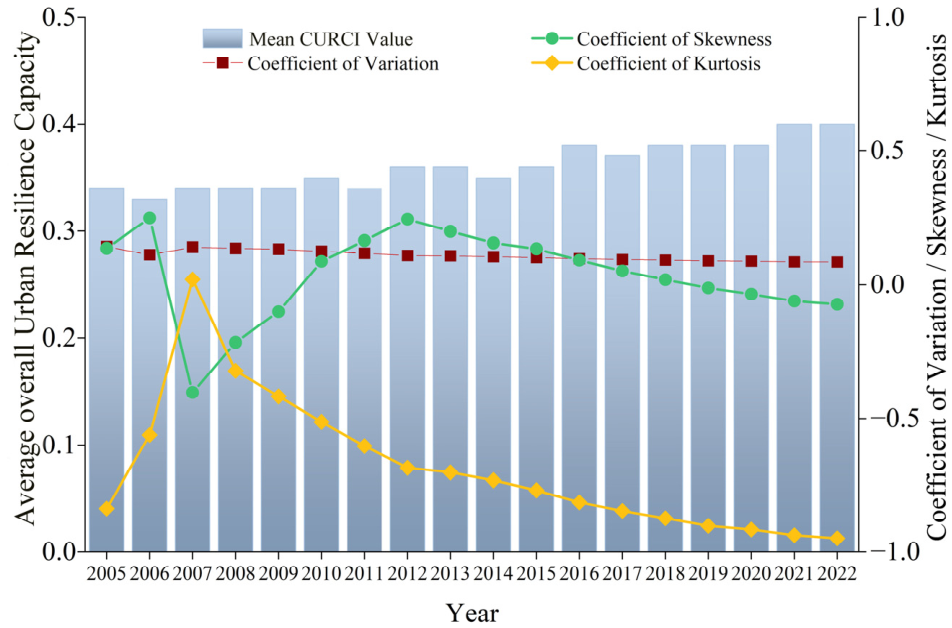
The mean CURCI value of the Northern Slope of Tianshan Mountains Urban Agglomeration ranges from 0.33 to 0.40, showing an overall upward trend with distinct stage-specific fluctuations. Significant increases occurred in 2010, 2012, 2016, and 2021 (Figure 3). Viewed from the perspective of within-group variability, the coefficient of variation ranges from 0.085 to 0.140. The values are relatively low. Their fluctuations are also small. This indicates that internal differences within the urban agglomeration remained relatively stable during the study period. The skewness coefficient ranges from −0.404 to 0.248. Positive skewness occurred in most years. This indicates that a small number of cities with high CURCI values had a strong driving effect on the overall level. However, negative skewness appeared in 2022. This suggests that the advantages of high-value cities may have weakened to some extent. The kurtosis coefficient shows large fluctuations, ranging from −0.948 to 0.019. It reached relatively high values during 2006–2007. It then gradually declined. This indicates that the distribution of CURCI values became flatter. Regional coordination also improved. Overall, CURUI exhibited a phased upward trend. Development differences among cities remained generally stable. Some differentiation still existed between cities with high and low CURCI values. The distribution of CURCI values gradually became flatter. The region showed a slow trend toward a more balanced pattern.
Figure 3.
Temporal evolution of the mean CURCI value.
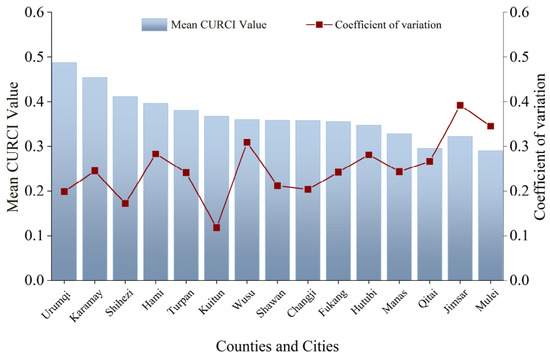
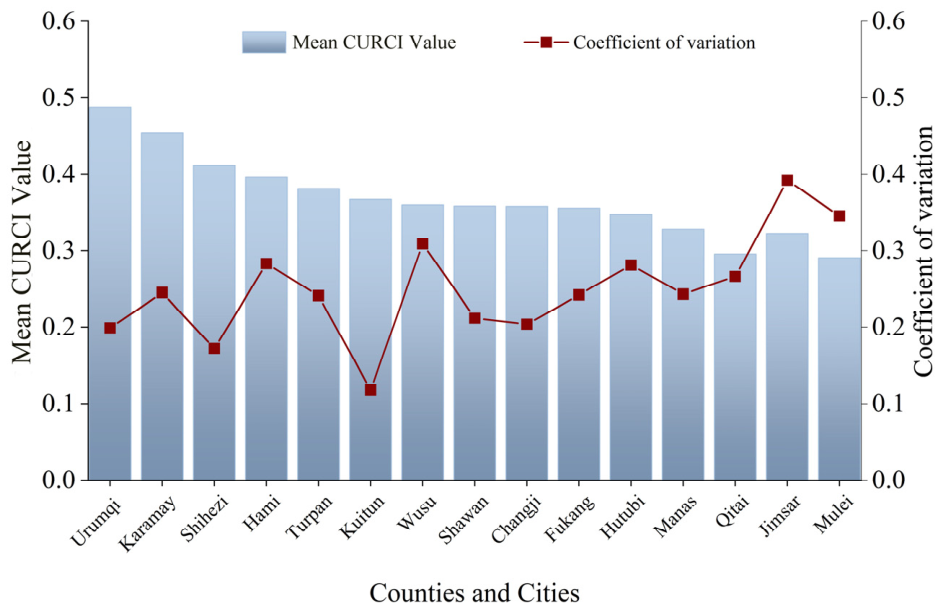
The cities in the study area show clear differences in mean CURCI values and their temporal variability. As shown by the distribution of mean CURCI values in Figure 4, Urumqi City has the highest mean CURCI value. Karamay City ranks second. The CURCI values of these two cities differ significantly from those of the other cities. The mean CURCI values of the remaining cities range from 0.290 to 0.454. Prefecture-level cities generally have higher resilience capacity levels. County-level cities generally have lower resilience levels. In terms of temporal stability of CURCI values, Hutubi County and Urumqi City have relatively low coefficients of variation. Their CURCI values varied less over the study period. Their CURCI trajectories were comparatively stable. In contrast, Qitai County and Turpan City have relatively high coefficients of variation. Their mean CURCI values fluctuate more markedly. Their resilience development is relatively less stable.
Figure 4.
Mean CURCI values of the selected cities and counties. Note: The county and city names on the horizontal axis are abbreviated.
3.2. Temporal Evolution Trends of CURCI
Using the Sen’s Slope and TFPW-MK methods, we analyzed the temporal trends in urban resilience capacity within the study area from 2005 to 2022. The results show (Table 3) that urban resilience capacity in all cities exhibited an overall trend of continuous improvement during the study period. The Sen’s Slope values for all cities were positive, indicating an overall increase in urban resilience capacity index. In regards to the rate of change, the Sen’s slope values of the cities range from 0.001 to 0.015. Clear spatial differences are observed.
Table 3.
TFPW–MK results for CURCI.
Urumqi City has the fastest growth rate (Slope = 0.015). This may be related to its role as the regional capital and core city. It has advantages in resource concentration, policy support, and infrastructure. Karamay City and Turpan City rank second (Slope = 0.010). Their growth rates are about 33% lower than that of Urumqi City. Karamay City may benefit from its petroleum industry and industrial transformation. Turpan City may benefit from its location as a node city of the Silk Road Economic Belt. These factors may have jointly supported increases in CURCI. Hutubi County has the slowest growth rate (Slope = 0.001). Its growth rate is less than 7% of that of Urumqi City. This may be related to its ongoing industrial restructuring, relatively limited innovation capacity, and room for improvement in public services. Its CURCI values show a significant upward trend. However, the magnitude of improvement remains relatively limited.
According to the significance test results, all 15 cities showed upward trends. Among them, 12 cities showed highly significant increases. They accounted for 80% of the total. The remaining three cities showed significant increases. They accounted for 20%. No city showed a nonsignificant trend. These results indicate that the improvement in CURCI values was relatively stable and continuous during the study period. Wusu City had the highest trend significance (|Z| = 5.151). Karamay City and Shihezi City ranked second (|Z| = 4.773). Urumqi City and Turpan City followed (|Z| = 4.242). Most of these cities are located in the core area of the study area. Their rapid resilience improvement may be related to industrial upgrading and improved transport infrastructure. It may also be related to regional coordinated development strategies, such as the Urumqi-Changji-Shihezi Metropolitan Area.
In contrast, Shawan City and Manas County had relatively low growth rates, with a Slope value of 0.003. Hutubi County also had a low growth rate, with a Slope value of 0.001. Hutubi County reached a significant increase level, with (|Z| = 2.576). However, its improvement was much smaller than that of regional central cities. This indicates that county-level cities still have room for improvement. This is mainly reflected in industrial structure optimization and public resources.
Overall, from 2005 to 2022, CURCI in the 15 cities of study area showed three evolutionary characteristics. The overall level improved. Core cities grew faster. County-level cities improved gradually. With the development of the Belt and Road Initiative, the growth of the core region of the Silk Road Economic Belt, and the coordinated development of the urban cluster at the northern foot of the Tianshan Mountains, the connections between these cities continue to strengthen. The overall CURCI values have entered a stage of continuous improvement. However, differences in development speed still exist among cities.
3.3. Spatial Evolution of CURCI
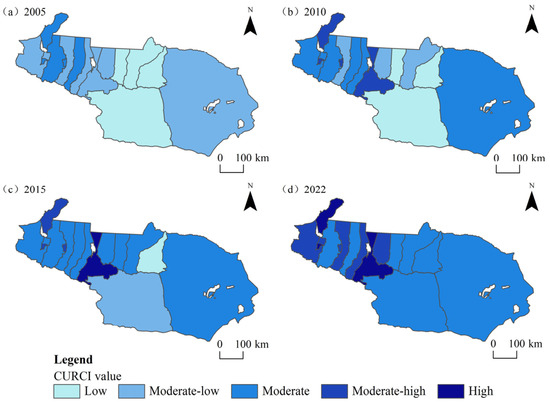
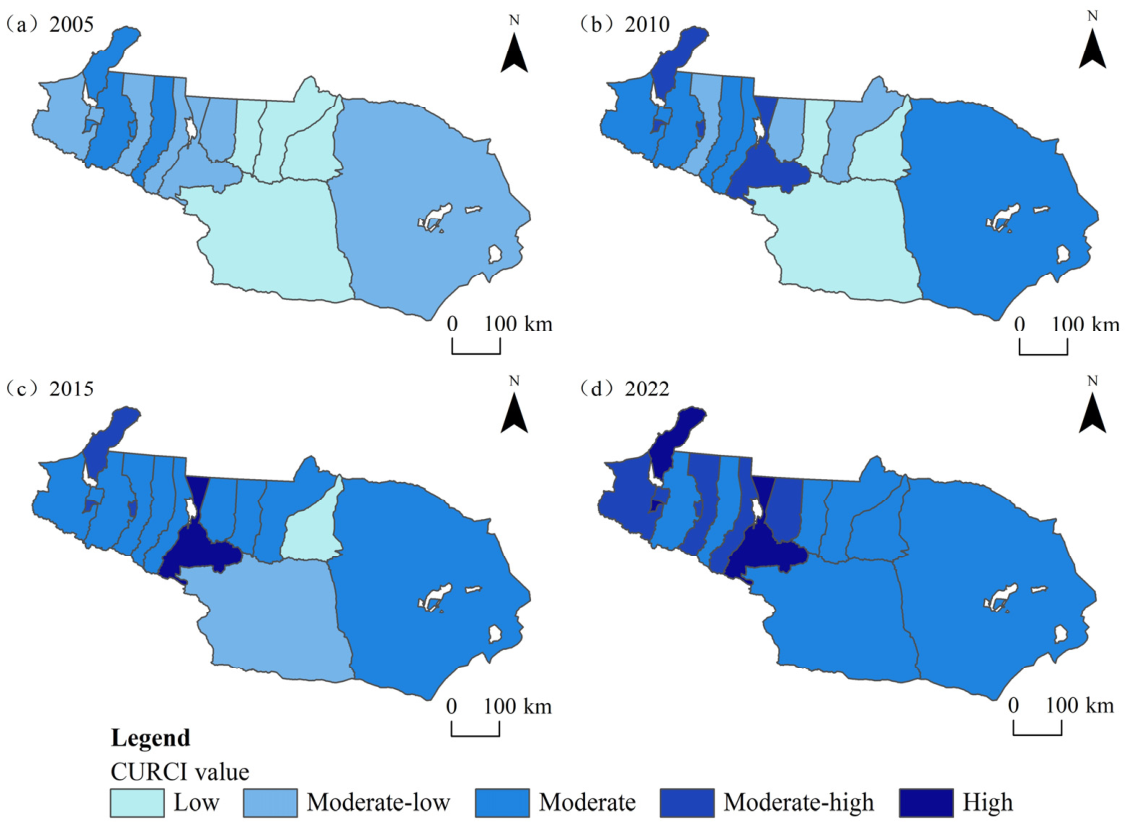
Using the natural breaks method, CURCI values were divided into five levels: Low (CURCI value ≤ 0.30), Moderate–Low (0.30 < CURCI value ≤ 0.35), Moderate (0.35 < CURCI value ≤ 0.40), Moderate–High (0.40 < CURCI value ≤ 0.45), and High (0.45 < CURCI value) (Figure 5). The results show that the overall CURCI level of the study area continued to improve from 2005 to 2022. The number of Cities with low CURCI values gradually decreased. By 2022, Cities with low CURCI values had basically disappeared. The overall pattern was dominated by Moderate CURCI values. It also showed a gradual shift from low levels to moderate and high levels.
Figure 5.
Spatiotemporal evolution of CURCI from 2005 to 2022.
Spatially, CURCI values showed a distribution pattern in which values are higher in the north and lower in the south. It also showed that values are higher in the west and lower in the east. Specifically, Moderate–High and High CURCI value areas were chiefly distributed in the western and northern regions. They radiated outward from Urumqi City and Karamay City. The area with Moderate CURCI values gradually expanded between 2005 and 2015, extending from the core cities to the east and west, including cities such as Changji City and Fukang City. Moderate–Low CURCI value areas were distributed in western and eastern cities, such as Wusu City and Hami City. By 2022, these areas had basically shifted to Moderate CURCI values. Between 2005 and 2015, areas with lower CURCI values were mainly distributed in the northern and southern parts of the study area. These areas included Qitai County and Turpan City. The Low CURCI value areas continued to shrink. They gradually shifted to Moderate CURCI values.
Overall, the CURCI values of the study area exhibited a distinct “core-periphery” pattern from 2005 to 2022. Regional differences changed from significant differentiation to relative balance. The overall spatial pattern evolved toward a higher level.
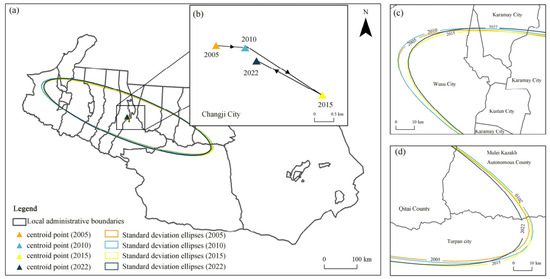
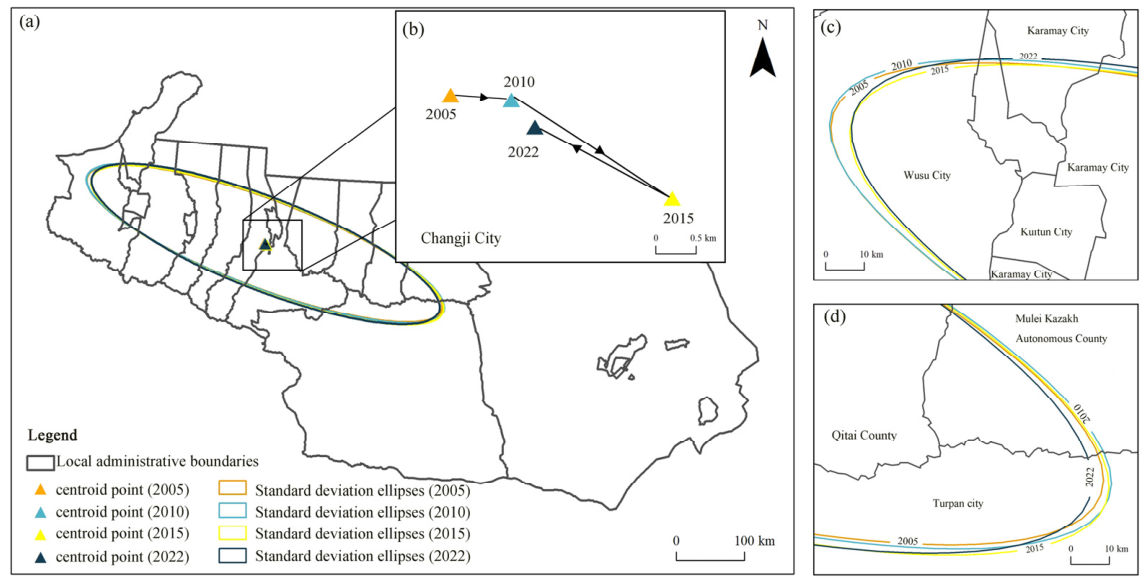
The Standard deviation ellipses and centroid point shifts diagram (Figure 6a) show that from 2005 to 2022, the spatial distribution of CURCI values in the study area consistently exhibited a “northwest–southeast” band-like pattern, with an overall stable configuration that closely aligns with the main axis of the region’s urban distribution. The map of the centroid shifts in the spatial distribution of CURCI (Figure 6b) reveals distinct phased characteristics: from 2005 to 2010, the centroid point shifted southeastward; from 2010 to 2015, it continued to shift significantly toward the southeast, marking the most pronounced phase of change during the study period; from 2015 to 2022, it shifted back toward the northwest, but the centroid point remained within the boundary area between Changji City and Urumqi City, indicating that the core spatial pattern had not undergone any fundamental changes. Combined with the locally magnified boundary maps (Figure 6c,d), the standard deviation ellipse remained generally stable along the “northwest–southeast” axis, with a high degree of boundary overlap; whereas the boundaries along the “northeast–southwest” axis exhibited a certain degree of outward expansion, with the most pronounced expansion occurring in 2015. This indicates that, against the backdrop of an overall stable pattern, the spatial differentiation of CURCI has gradually evolved from unidirectional agglomeration to multidirectional diffusion.
Figure 6.
Standard deviation ellipses and centroid shifts in CURCI from 2005 to 2022. Note: (a) Overall distribution of standard deviation ellipses and centroid points; (b) centroid shift trajectories from 2005 to 2022; (c) enlarged view of the northwestern portions of the standard deviation ellipses; (d) enlarged view of the southeastern portions of the standard deviation.
Based on the changes in the standard deviational ellipse parameters in 2005, 2010, 2015, and 2022 (Table 4), the standard deviation of the “northwest–southeast” major axis first increased and then decreased. It rose from 276.93 km to 278.77 km. It then declined to 272.07 km. The overall pattern showed slow contraction. The spatial dispersion range along the major axis narrowed. The regional differences in CURCI values decreased. The degree of spatial agglomeration further increased.
Table 4.
Standard deviation ellipse parameters for CURCI.
The standard deviation of the “northeast–southwest” secondary axis increased from 62.74 km to 65.77 km. The spatial range of the secondary axis expanded slightly. The spatial configuration of CURCI extended outward along this direction.
In each year, the standard deviation of the major axis was much larger than that of the secondary axis. The spatial distribution of CURCI extended mainly along the “northwest–southeast” direction. It showed a belt-shaped spatial pattern.
The rotation angle of the ellipse remained stable between 110.04° and 110.60°. The spatial orientation changed only slightly. The shape index decreased from 4.41 to 4.14. This indicates a gradual shift from highly directional agglomeration to coordinated development. The spatial distribution shows a more balanced pattern. Overall, the spatial distribution of CURCI remained oriented in the Tianshan North Slope Urban Agglomeration and still extended along the “northwest–southeast” direction. It showed a spatial evolution pattern of “stable major axis and diffusing secondary axis.” Meanwhile, the distribution of CURCI values within the study area continues to follow a “core-periphery” pattern. The trend toward coordinated regional development is gradually gaining momentum.
3.4. Model-Based Attribution of Selected Constituent Indicators to CURCI
3.4.1. XGBoost Reconstruction of CURCI and Global SHAP Attribution
The long-term effects of multiple factors have shaped the development and changes in urban resilience [34]. CURCI integrates the structural conditions represented by economic, infrastructure, social, and ecological indicators. To identify which selected indicators played a larger role in explaining differences in CURCI and to examine whether they showed promoting or inhibiting effects on CURCI at different observed levels, representative indicators from the four dimensions were included in the XGBoost model. Here, the promoting and inhibiting effects describe the directions of contribution identified by the model within the CURCI framework, rather than independent causal effects on real-world urban resilience. The specific variables are shown in Table 5. Given the substantial interannual variation in groundwater-level elevation, annual average precipitation and NDVI were selected to represent natural and vegetation conditions in the ecological dimension of CURCI. Although excluded from this reduced set, groundwater-level elevation (X24) remains part of the full 30-indicator CURCI framework (Table 1; weight = 0.036) and therefore continues to contribute to the composite resilience index underlying the city-classification results presented in Section 4.3.
Table 5.
Selected constituent indicators used in the XGBoost attribution analysis of CURCI.
Representativeness indicators for the aforementioned dimensions were fed into the XGBoost model (Figure 7). The model parameters were set as follows. The learning rate was 0.05. The maximum tree depth was 4. The number of decision trees was 150. The dataset was divided into the training set and the test set at a ratio of 8:2. Five-fold cross-validation was used to evaluate model performance.
Figure 7.
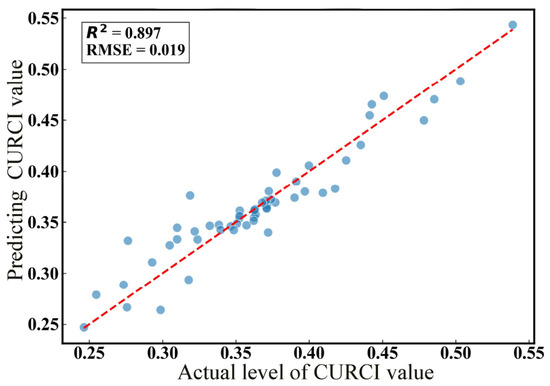
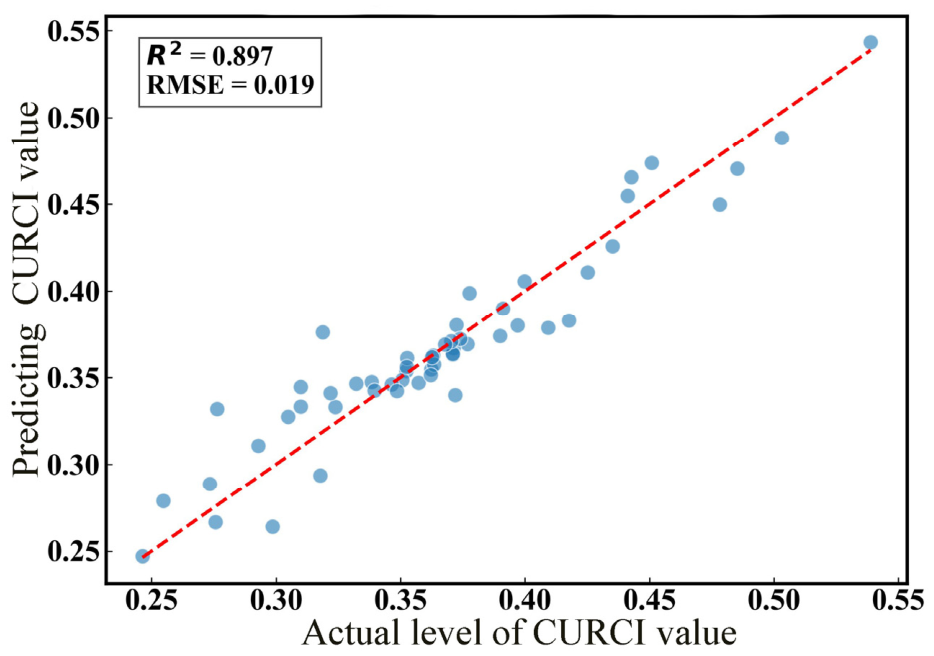
Model reconstruction performance for CURCI. Note: Blue dots represent the test-set observations, and the red dashed line represents the 1:1 reference line (y = x) for comparison between the actual and model estimated CURCI values.
The average five-fold cross-validation R2 was 0.909 ± 0.022, while the training- and test-set R2 values were 0.971 and 0.897, respectively. These performance results indicate that, under the current sample and random-split procedure, the selected indicators reproduced CURCI with relatively small errors. However, because these indicators were selected from the same indicator system used to construct CURCI, the relatively high goodness of fit is partly expected. The results should therefore not be interpreted as evidence that the model can predict independent external outcomes or identify causal relationships. The observed model fit provides a reasonable basis for the subsequent SHAP analysis of the relative contributions of the selected indicators within the CURCI framework.
In addition, all variables were normalized to the range of 0–1, resulting in a relatively limited numerical range for CURCI, which partly explains the low root mean square error (RMSE). Moreover, because the observations were drawn from the same urban agglomeration and the sample size was relatively limited, the common spatiotemporal structure of the data may have been partly retained across the training and test sets under the random split, which may also have contributed to the relatively low RMSE and high R2 values.
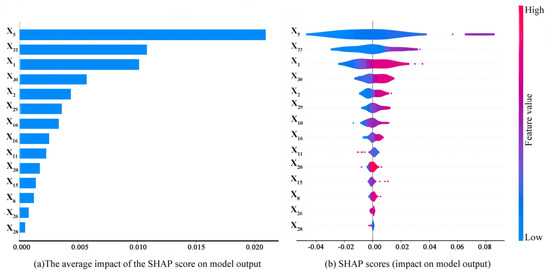
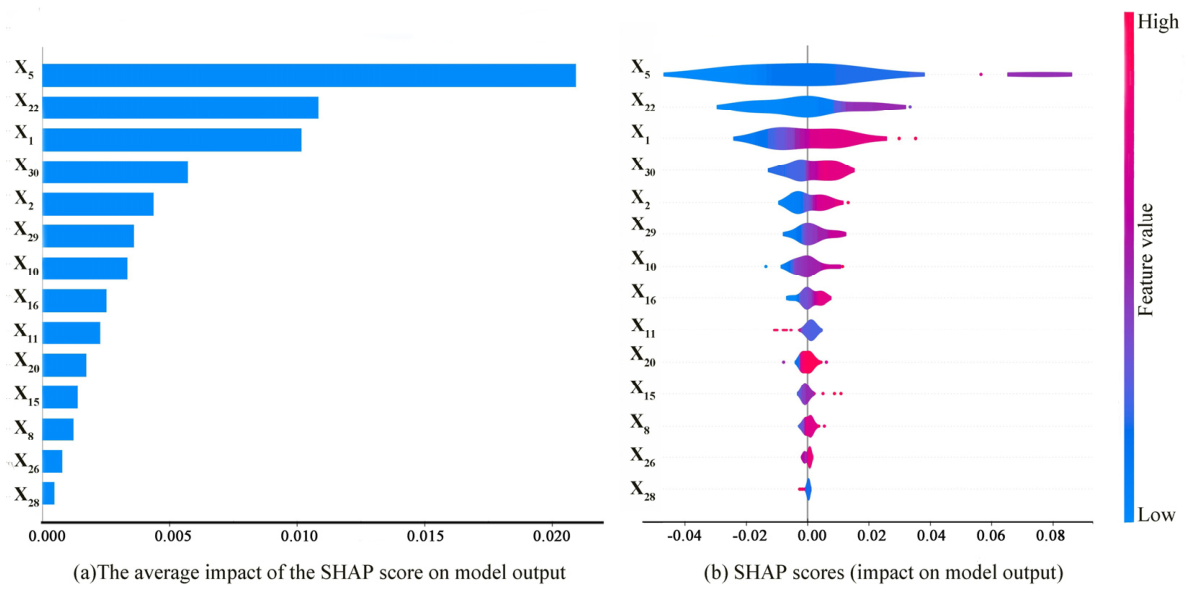
The XGBoost–SHAP analysis was used to compare the relative contributions of the selected indicators to CURCI and to examine their promoting or inhibiting effects (Figure 8). Figure 8a presents the mean absolute SHAP value of each indicator. A larger value indicates that the indicator makes a greater relative contribution to the estimation of CURCI in the fitted model. Figure 8b shows the distribution of SHAP values for each indicator. Positive SHAP values indicate a promoting effect on the model-estimated CURCI value, whereas negative values indicate an inhibiting effect. The absolute magnitude of a SHAP value reflects the strength of the contribution. Here, the relative contributions and their directions represent only the patterns identified by the fitted model within the CURCI framework. In Figure 8b, color indicates the level of each indicator, with red representing higher values and blue representing lower values.
Figure 8.
Global SHAP attribution of selected indicators to CURCI.
From different dimensions, X5, X1, and X2 among economic factors made the most significant contributions to CURCI values. Among social factors, X22 made the most significant contribution. Among ecological factors, X29 and X30 made relatively significant contributions. Among infrastructure factors, X10 made a relatively high contribution. The SHAP values of the other variables were mainly distributed near zero. This indicates that their effects were relatively weak in this model.
Overall, X5, X22, X1, X30, X2, and X29 were the six variables with the highest contributions. It should be noted that the numerical scale of SHAP values is consistent with the model output. In this study, the model output is the CURCI value. This index is mainly distributed between 0.3 and 0.6. Its overall fluctuation range is small. Therefore, the model predictions themselves have a limited range of change. The prediction change caused by a single indicator is also relatively small. As a result, the mean absolute SHAP value of a single variable is relatively low.
At the same time, this study includes many underlying indicators. Some indicators may contain similar information. The XGBoost model has a certain ability to adapt to this type of indicator correlation. Therefore, indicator correlation usually does not clearly reduce the model prediction accuracy. However, in SHAP interpretation, similar information may be assigned to several related indicators. The contribution of one indicator will not be amplified alone. This also makes the absolute SHAP value of a single variable relatively low.
Therefore, this study focuses more on the relative magnitude of mean absolute SHAP values. It also focuses on variable importance ranking and the positive or negative direction of model-based attribution. It does not place special emphasis on the absolute size of SHAP values alone.
3.4.2. SHAP Dependence Patterns of Selected Indicators for CURCI
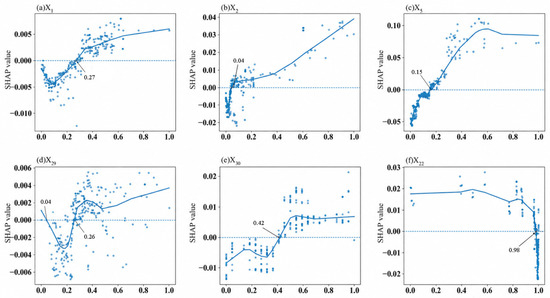
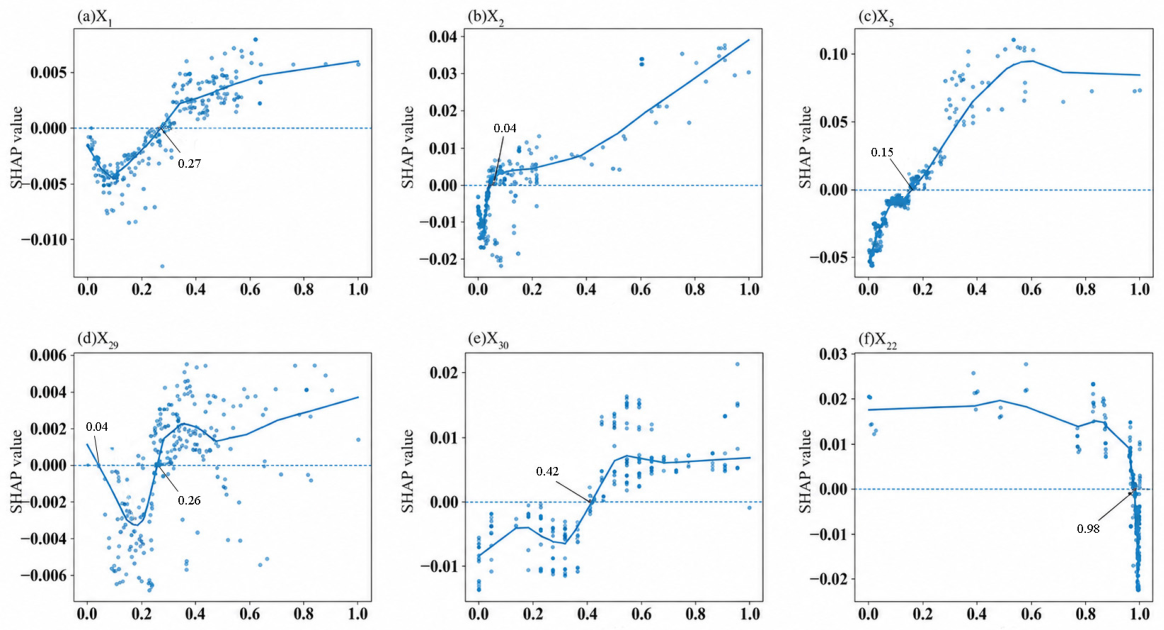
By drawing single-feature SHAP dependence plots (Figure 9), this study further analyzed the contribution patterns of the top six key factors to CURCI. A SHAP value greater than 0 indicates a promoting effect. A SHAP value less than 0 indicates an inhibitory effect. A LOWESS curve was used to fit the scatter distribution in the figure.
Figure 9.
SHAP dependence patterns of selected indicators for CURCI estimated by the model. Note: Blue dots represent individual observations, the solid blue line represents the LOWESS fit, and the dashed horizontal line indicates SHAP = 0. The annotated values indicate the identified turning points.
Overall, all factors showed nonlinear associations with CURCI. Economic factors had the highest contribution. Among economic factors, X1 showed an apparent transition pattern on CURCI. The feature value of 0.27 was the turning point. When the feature value was lower than 0.27, X1 had an inhibitory effect. When the feature value was higher than 0.27, X1 changed to a promoting effect. X2 showed a nonlinear feature of “weak at first and strong later” in its effect on CURCI. When the feature value was lower than 0.04, X2 had a negative effect on CURCI. When the feature value was higher than 0.04, its positive effect increased rapidly. There was an obvious nonlinear relationship between X5 and CURCI. When the feature value was lower than 0.15, its promoting effect was limited. When the feature value exceeded 0.15, its positive effect increased significantly.
Among ecological factors, X29 showed a nonlinear pattern of “promotion, weakening, and renewed promotion” in its effect on CURCI. When the feature value ranged from 0 to 0.04, X29 had a promoting effect. Between 0.04 and 0.26, it exerted a weakening effect. When the feature value exceeded 0.26, it rapidly shifted back to a promoting effect. X30 showed a nonlinear effect on CURCI. The feature value of 0.42 was the turning point. When the feature value was lower than 0.42, X30 had an inhibitory effect. When the feature value was higher than 0.42, X30 changed to a promoting effect. It remained stable in the medium- and high-level ranges.
Among social factors, X22 showed a turning point in its effect on CURCI. When the feature value was lower than 0.98, X22 had a stable promoting effect. When the feature value was higher than 0.98, it quickly changed to a significant inhibitory effect.
3.4.3. An Assessment of Spatial Heterogeneity in the Influence of Single Factors on CURCI Values
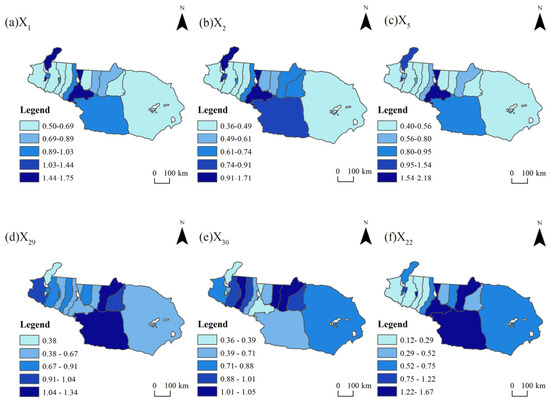
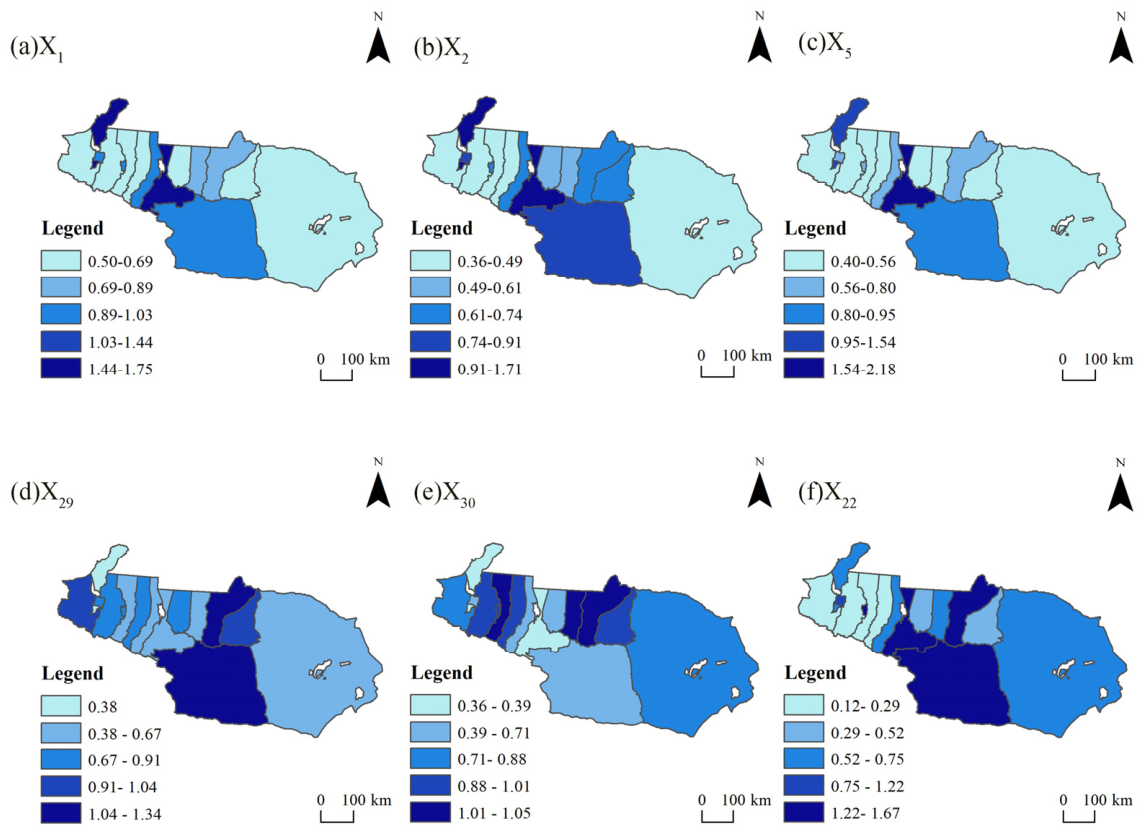
For each city in each study year, the normalized values of X1, X2, X5, X29, X30 and X22 were entered into the XGBoost model, and the corresponding SHAP values were calculated for the model-estimated CURCI. To examine spatial differences, the absolute SHAP values of each key indicator were summed across all study years for each city. These cumulative values represent the overall magnitude of each key indicator’s contribution to the estimation of CURCI for that city, regardless of whether its contribution was promoting or inhibiting. The resulting values were classified using the Jenks natural breaks method in Python (v3.12.0) and mapped in Figure 10.
Figure 10.
Regional variations in the impact of various factors.
Among economic factors, X1 and X5 had strong effects on urban resilience capacity in Urumqi City and Karamay City. Their effects on Turpan City were secondary. Their effects on the other cities were relatively weak. X2 had the strongest effect on Urumqi City. Karamay City ranked second. Its effects on the other cities were relatively weak. The SHAP values were generally lower than 0.91.
Among ecological factors, X29 had the strongest effects on Turpan City and Qitai County. Most cities in the eastern and western sections of the study area were at a medium level. Karamay City showed the weakest effect. Its SHAP value was only 0.38. X30 had the strongest effects on Qitai County, Jimsar County, Manas County, and other cities and counties. Its effects on most cities in the eastern and western sections of the study area were relatively weak. Its effects on Karamay City and Urumqi City were the lowest. Their SHAP values were all lower than 0.39.
Among social factors, X22 had the strongest relationship with urban resilience capacity in Turpan City, Qitai County, and Urumqi City. Hami City, Karamay City, and other northern cities in the study area ranked second. The effects on the remaining cities were the lowest. Their SHAP values were all below 0.52.
4. Discussion
4.1. Spatiotemporal Evolution of CURCI
Between 2005 and 2022, CURCI values in the Tianshan North Slope Urban Agglomeration remained generally at a low level, although its temporal trajectory exhibited a fluctuating upward trend punctuated by marked increases in several key years—a pattern consistent with the findings of Wang Xinxing et al. [45]. This persistently low CURCI level and its comparatively slow growth can be attributed to the region’s fragile arid-zone ecosystem, scarce water resources, and weak foundation for urban development, all of which constrain the pace at which CURCI can increase. Against this constrained backdrop, however, a series of policy interventions—including the Xinjiang 12th Five-Year Development Plan (2011–2015), the Xinjiang 13th Five-Year Development Plan (2016–2020), and the Development Plan for the Tianshan North Slope Economic Belt—together with the agglomeration’s the socioeconomic recovery and policy adjustments after 2021, jointly contributed to the phased increases in CURCI observed over the study period. This evolutionary pattern echoes the findings of Fang Chuanglin et al. [46].
While the temporal evolution of resilience displayed clear fluctuations, its spatial configuration proved considerably more stable: between 2005 and 2022, CURCI levels across the agglomeration consistently exhibited a “two-core” spatial pattern with an axial feature extending along a northwest–southeast direction. Despite this structural stability, however, pronounced spatial disparities persisted throughout the study period, reflecting an imbalanced and poorly coordinated pattern of development that is broadly consistent with the spatial characteristics reported for most Chinese urban agglomerations [28,30,33].
Notably, these spatial disparities did not continue to widen over the long term. Instead, as core-agglomeration and axial-diffusion effects coexisted, the differences among cities gradually eased. Nevertheless, the persistent development gap between core cities and peripheral areas continued to constrain the overall improvement of CURCI across the region, indicating that spatial convergence alone has not been sufficient to overcome the agglomeration’s underlying structural imbalance.
This spatial pattern can be understood as the product of two interrelated processes: the shaping of regional development axes, and the divergence in urban development foundations across cities. On one hand, the advancement of the Western Development Strategy and the Belt and Road Initiative progressively deepened intercity connections, giving rise to the “Karamay–Shihezi–Urumqi–Changji” development axis, along which the urban agglomeration gradually extended in a belt-shaped configuration. On the other hand, cities within the agglomeration differed markedly in their development foundations and resource endowments: core cities such as Urumqi, benefiting from superior development conditions, exhibited both higher CURCI levels and faster resilience growth, and—leveraging their resource and locational advantages—generated strong radiation effects on surrounding areas that strengthened regional connectivity while simultaneously reinforcing the dominant position of the core. The combined outcome of these two processes is a spatial distribution of CURCI values that remains, on balance, distinctly uneven.
4.2. Nonlinear Attribution Patterns and Relative Contributions of Selected Indicators to Urban Resilience Capacity
Although traditional linear models are capable of capturing the overall association patterns between influencing factors and urban resilience, they remain limited in their ability to characterize the nonlinear evolution and threshold-response behavior exhibited by certain variables [12,15,17]. To address this limitation, the present study applies the XGBoost–SHAP model and identifies economic indicators as the factors with the highest marginal contribution to the composite regional urban resilience capacity index [18,23,30], a finding consistent with the majority of existing studies on urban agglomerations.
It is worth noting, however, that while Huang Siyuan et al. [26] examined the effects of multiple indicators on urban resilience within the Tianshan North Slope Urban Agglomeration, their analysis stopped short of revealing the nonlinear change patterns underlying each indicator—an aspect that the present study specifically addresses.
Building on this, the findings of the present study further extend the view of Ye et al. [27] regarding the association between economic conditions and assessed urban resilience capacity. Specifically, within the CURCI framework, the promoting effect of economic accumulation was nonlinear and became more pronounced only after the indicators reached certain apparent transition levels. This pattern may indicate that increases in CURCI are associated not merely with the expansion of aggregate economic scale, but also with whether economic development has reached a level sufficient to support the stable operation of the urban system.
A comparable nonlinear pattern was observed for population agglomeration (X22). Moderate population concentration exerted a promoting effect on CURCI, whereas excessive agglomeration showed an inhibiting effect. In the arid-region context, excessive population concentration may increase resource consumption and ecological carrying pressure, intensify human–land conflicts, and thereby constrain the improvement of urban resilience capacity. This pattern is broadly consistent with the findings of Li Chi et al. [47].
Similar nonlinear constraints were also observed for annual average precipitation X29 and X30. Given the fragile ecological background of arid regions, limited precipitation and low vegetation cover may weaken ecosystem stability [45], thereby restricting the continuous improvement of CURCI. However, because these indicators are constituent components of CURCI, the observed promoting and inhibiting effects should be understood as model-based attribution patterns within the constructed assessment framework. The apparent transition levels depend on the present sample, indicator normalization, correlations among indicators, and the fitted model, and should therefore not be regarded as universal causal thresholds or direct policy standards.
4.3. Zoning Based on Model-Based Indicator Attributions to CURCI and Differentiated Recommendations
Based on the CURCI indicator contribution patterns and spatial heterogeneity revealed by the SHAP analysis, together with the actual indicator conditions of each city, the cities in the study area were further classified into four types: industrial-advantage, ecological-advantage, natural-constraint, and population-pressure cities [20]. Each type reflects a distinct combination of dominant contributing indicators and major constraints.
This study identifies Urumqi City, Karamay City, Kuitun City, and Changji City as industrial-advantage cities, sharing the common feature that X1, X2, and X5 dominate their SHAP contribution profiles. However, their underlying industrial bases differ, and the recommended pathways diverge accordingly. For Karamay, the relatively high SHAP attribution of X2 may be associated with the city’s historically petroleum-dependent fiscal revenue structure. We therefore recommend establishing a dedicated resource-revenue stabilization mechanism under which a fixed share of petroleum-related fiscal revenues would be earmarked for economic diversification, including renewable energy, advanced materials, higher-value-added downstream petrochemical activities, and a cloud-computing-based digital economy. In parallel, a workforce transition and retraining mechanism should be introduced to facilitate the movement of workers and technical personnel from resource-extraction occupations into growth sectors such as renewable energy, advanced chemical materials, and the digital economy [48]. For Urumqi, Kutuun, and Changji, the attribution of X1, X2, and X5 is relatively high, indicating that their CURCI characteristics are closely related to economic accumulation and industrial capacity. Their future development paths should focus on consolidating and enhancing existing economic and industrial capacities, rather than on the transformation of specific industries. Kutun City could strengthen coordination with neighboring industrial zones such as Dushanzi and Wusu City, while Changji City could deepen regional cooperation with Urumqi and Shihezi.
This study identifies Jimsar County, Manas County, Shawan City, and Shihezi City as ecological-advantage cities. Given that this subgroup’s ecological advantage stems from sustained irrigation investment rather than natural precipitation abundance, and that evidence from Xinjiang’s oasis systems confirms ecological performance remains closely coupled to, and constrained by, water-resource management—rather than determined by climatic conditions—even as drip-irrigation coverage continues to expand [49], we propose two directly applicable recommendations addressing this dependency. First, the irrigation-water entitlements of this subgroup should be explicitly protected from reallocation pressure originating in neighboring natural-constraint cities, whose water-scarcity trajectory is projected to intensify further through 2030–2050 [50]. From an administrative governance perspective, such protection should be anchored in the subregion’s designated role within the broader development framework for the Northern Slope of the Tianshan Mountains, ensuring that decisions to reallocate water resources in response to shortages elsewhere in the subregion do not come at the expense of this ecology-dependent oasis base. Second, we recommend that water savings generated by irrigation-efficiency gains (e.g., the shift to drip irrigation) not be left to ad hoc, temporary allocation, but instead be formalized into a defined ecological-water-use share within this sub-region’s water accounting framework. A water-rights-trading assessment conducted in the Shihezi Irrigation District—part of the same oasis system—demonstrates that the economic and ecological benefits generated by water reallocation in this sub-region depend directly on how agricultural water savings are redistributed between industrial and ecological uses, with specific transfers capable of generating both quantifiable economic value and ecological restoration benefits [51]. We recommend that Jimsar County, Manas County, and Shawan City adopt a comparable allocation rule, ensuring that a portion of the water freed by efficiency gains is reserved for ecological replenishment rather than being redirected entirely toward industrial or urban expansion [52]. Shihezi City’s anomalously high X22 contribution—the highest among all fifteen cities, and currently unexplained by available evidence—remains flagged as a monitoring priority rather than serving as a basis for reclassification.
Natural-constraint cities include Turpan City, Hami City, Qitai County, Mulei Kazakh Autonomous County, Wusu City, Hutubi County, and Fukang City. Their classification reflects the region-specific environmental constraints imposed by water scarcity and vegetation stress, rather than being based solely on the relatively prominent contributions of annual average precipitation (X29) and NDVI (X30) to CURCI. This constraint is projected to intensify: hydrological modeling indicates that approximately 32% of watersheds along the northern slope of the Tianshan Mountains will face persistent water scarcity through 2030–2050, with most cropland at high risk of groundwater depletion even under scenarios of modest precipitation increase [50]. A basin-specific analysis of the Turpan–Hami region further shows that cultivated-land use efficiency and agricultural water-use efficiency in this sub-region remain at a relatively low overall coordination level, with pronounced intra-regional disparities [53]. First, groundwater extraction should be strictly regulated, and agricultural water use efficiency should be improved through sprinkler and drip irrigation. We recommend extending the groundwater monitoring and drip irrigation retrofitting models to other cities facing natural constraints identified in this study, and prioritizing them based on the water scarcity risk levels determined for each city by [50], so that preventive measures can be taken to avoid severe water scarcity events. Second, establishing a unified water resources management mechanism through a framework for water rights confirmation and inter-basin water allocation [54] will help reduce the reliance of cities constrained by natural conditions on local reservoir projects alone to meet their water needs [55].
Population-pressure challenges in this study area, represented by Urumqi City, are substantiated by both SHAP-based evidence and the region’s demographic record: as the regional capital, Urumqi City added 1.3861 million people between 2015 and 2020—accounting for 23.33% of Xinjiang’s total population growth over that decade [56]. This demographic trajectory is consistent with the “center–periphery” spatial-pressure structure independently documented for Urumqi [57], and further echoes a broader finding that population agglomeration functions as a distinct, quantifiable factor in the resilience performance of Chinese urban agglomerations [58]. Based on the above analysis, we propose two specific recommendations. First, we recommend formally establishing and expanding the existing metropolitan coordination mechanism surrounding Urumqi, rather than creating a new framework. The region’s 14th Five-Year Plan explicitly calls for promoting the integrated urban development of Changji, Wujiaqu, Fukang, and Qitai, with Urumqi at the center, and fostering economic integration among “Urumqi–Changji–Shihezi” [59,60]. This existing policy tool has already provided a ready-made institutional channel for transferring industrial capacity and population to surrounding cities. Second, we recommend adopting the 0.98 contribution threshold identified by the SHAP model as a forward-looking early-warning indicator for other rapidly urbanizing cities within the study area. As population density approaches this threshold, its marginal contribution to resilience may shift from facilitative to inhibitory; sustained monitoring of this indicator could help other cities anticipate similar risks in advance, providing an early-warning reference for the governance costs that may arise from unmanaged population agglomeration.
4.4. Limitations and Outlook
The current study still has some limitations that need further improvement. First, the ecological indicators adopted in this study are broadly consistent with those used in recent indicator-based assessments of urban systems in arid regions, particularly in treating precipitation and groundwater resource endowments as core dimensions that distinguish arid-region urban systems from their humid-region counterparts [61]. However, owing to data limitations, more fine-grained indicators, such as sector-specific water-use efficiency and county-level innovation capacity (e.g., invention patent counts and research and development intensity), could not be included. Because cities administered by the Xinjiang Production and Construction Corps and prefecture-level cities differ in their statistical standards and reporting practices, these data could not be consistently compiled across the 15 sample cities. Future studies could further refine the indicator system as statistical standards become more harmonized and longer, more complete time series become available.
Second, the study did not fully take into account the spatial connections and spillover effects between cities, even though the flow of factors and functional linkages within urban agglomerations play a role in the evolution of urban resilience. Future research can further expand the indicator dimensions. It can also integrate multi-source data. Spatial econometric analysis methods can be introduced. This would enhance the spatial relevance and explanatory power of the results.
Third, consistent with the capability-based framework outlined in Section 2.2.1, this composite index reflects the structural conditions and capital associated with urban resilience, rather than the dynamic disturbance-response processes themselves (e.g., reductions in risk exposure, recovery trajectories following specific shocks, or adaptive responses over time)—a distinction that has received broader attention in critical reviews of resilience assessment tools [62]. Future research that incorporates event-based or time-series perturbation-response data will help bridge the gap between the capability-based and process-based perspectives in urban resilience research.
5. Conclusions
- (1)
- From 2005 to 2022, CURCI in the Tianshan North Slope Urban Agglomeration showed an overall upward trend. Resilience differences among cities were significant. In the study area, 80% of the cities reached a highly significant growth level. A “core–periphery” differentiation pattern still existed within the urban agglomeration. Urumqi City and Karamay City, as regional core cities, grew relatively fast. County-level cities grew relatively slowly. However, all cities were generally in a stage of continuous growth.
- (2)
- From 2005 to 2022, the high-value areas of CURCI continued to expand. The low-value areas gradually shrank and eventually disappeared. The spatial distribution showed clear characteristics. The north was higher than the south. The west was higher than the east. CURCI in the Tianshan North Slope Urban Agglomeration showed unbalanced development. The centroid point was always located near the boundary between Changji City and Urumqi City. The directional pattern of resilience followed a “northwest–southeast” orientation. The overall spatial pattern remained stable. Spatial differences narrowed slightly.
- (3)
- From 2005 to 2022, economic factors made the highest contribution to CURCI. Social factors ranked second. Ecological factors had the weakest effects. At the indicator level, the six key factors were X5, X22, X1, X30, X2 and X29. Based on the SHAP spatial distribution characteristics of the contribution values of key factors, cities in the study area were divided into four types. They were industrial-advantage cities, ecological-advantage cities, natural-constraint cities, and population-pressure cities.
Author Contributions
Conceptualization, methodology, software, formal analysis, writing—original: B.N.; funding acquisition, supervision: Y.J.; funding acquisition, supervision: A.A.; investigation, formal analysis: R.Y.; investigation, formal analysis: X.L.; writing—review and editing: S.T.; writing—review and editing: X.W.; writing—review and editing: A.Y. All authors have read and agreed to the published version of the manuscript.
Funding
This research was supported by the Third Xinjiang Scientific Expedition Program (Grant No. 2022xjkk1100). This research was supported by the Science and Technology Project Commissioned by Enterprises and Institutions, “Research on Service Quality Assessment and Accuracy Verification of ‘Indoor Operation’ for Crop Planting Area Measurement in Xinjiang in 2025 Based on Remote Sensing Data” (Project Number: 202634140002). Funding Source: Science and Technology Project Commissioned by Enterprises and Institutions.
Data Availability Statement
The data presented in this study are available on request from the corresponding author. The data are not publicly available due to the nature of this research.
Conflicts of Interest
The authors declare no conflicts of interest.
References
- Zhao, R.D.; Fang, C.L.; Liu, H.M. Progress and prospect of urban resilience research. Prog. Geogr. 2020, 39, 1717–1731. [Google Scholar] [CrossRef] [Scilit]
- Yin, Y.; Gu, J.; Li, M. Sustainability-oriented urban resilience assessment: The case of China’s Yangtze River Delta region. J. Clean. Prod. 2025, 514, 145835. [Google Scholar] [CrossRef] [Scilit]
- Fu, L.; Han, X.; Peng, J. The impact of innovation-driven policies on urban resilience. Humanit. Soc. Sci. Commun. 2025, 12, 484. [Google Scholar] [CrossRef] [Scilit]
- Huang, G.; Hu, Y.; An, H.; Huang, J.; Shi, T. Urban resilience and spatial inequality in China: Toward sustainable development under multi-dimensional constraints. Land 2025, 14, 2415. [Google Scholar] [CrossRef] [Scilit]
- Yin, S.; Shi, R.; Wu, N.; Yang, J. Measuring the impact of technological innovation on urban resilience through explainable machine learning: A case study of the Yangtze River Delta region, China. Sustain. Cities Soc. 2025, 127, 106457. [Google Scholar] [CrossRef] [Scilit]
- Wu, N.; Zhou, Y.; Yin, S.; Gong, H.; Zhang, C. Revealing the nonlinear impact of environmental regulation on ecological resilience using the XGBoost-SHAP model: Evidence from the Yangtze River Delta region, China. J. Clean. Prod. 2025, 514, 145700. [Google Scholar] [CrossRef] [Scilit]
- Holling, C.S. Resilience and stability of ecological systems. Annu. Rev. Ecol. Syst. 1973, 4, 460–482. [Google Scholar] [CrossRef] [Scilit]
- Bruneau, M.; Chang, S.E.; Eguchi, R.T.; Lee, G.C.; O’Rourke, T.D.; Reinhorn, A.M.; Shinozuka, M.; Tierney, K.; Wallace, W.A.; von Winterfeldt, D. A framework to quantitatively assess and enhance the seismic resilience of communities. Earthq. Spectra 2003, 19, 733–752. [Google Scholar] [CrossRef] [Scilit]
- Ribeiro, P.J.G.; Gonçalves, L.A.P.J. Urban resilience: A conceptual framework. Sustain. Cities Soc. 2019, 50, 101625. [Google Scholar] [CrossRef] [Scilit]
- Wang, S.M.; Ning, W.P.; Niu, J.L.; An, K. Spatiotemporal differentiation and convergence of urban ecological resilience in the Yellow River Basin: An empirical analysis based on 61 cities in seven major urban agglomerations. Arid Land Geogr. 2024, 47, 93–103. [Google Scholar]
- Mushwani, H.; Ahmadzai, M.R.; Ullah, H.; Baheer, M.S.; Peroz, S. A comprehensive AHP numerical module for assessing resilience of Kabul City to flood hazards. Urban Clim. 2024, 55, 101939. [Google Scholar] [CrossRef] [Scilit]
- Cao, K.J.; Long, S.F. Spatiotemporal pattern and influencing factors of rural economic resilience in Xinjiang Uygur Autonomous Region. Hum. Geogr. 2025, 40, 89–100. [Google Scholar]
- Chen, M.X.; Xian, Y.; Huang, Y.H.; Sun, Z.G.; Wu, C.B. Geographical features and development models of estuarine cities. J. Geogr. Sci. 2024, 34, 25–40. [Google Scholar] [CrossRef] [Scilit]
- Yang, Z.; Cui, X.; Dong, Y.; Guan, J.; Wang, J.; Xi, Z.; Li, C. Spatio-temporal heterogeneity and influencing factors in the synergistic enhancement of urban ecological resilience: Evidence from the Yellow River Basin of China. Appl. Geogr. 2024, 173, 103459. [Google Scholar] [CrossRef] [Scilit]
- Wang, H.F.; Wang, W. Pattern evolution and spatial spillover effect of urban resilience in the Yangtze River Delta. Geogr. Geo-Inf. Sci. 2024, 40, 57–66. [Google Scholar]
- Guan, W.H.; Xu, H.; Wu, W.; Wu, X.; Zhang, H.; Wu, L. Comprehensive urban resilience and dynamic prediction of Nanjing City based on the new development concept. Sci. Geogr. Sin. 2024, 44, 681–692. [Google Scholar]
- Chen, X.H.; Lou, J.N.; Wang, Y. Evolution and dynamic simulation of the temporal-spatial pattern of urban resilience in Harbin-Changchun Urban Group. Sci. Geogr. Sin. 2020, 40, 2000–2009. [Google Scholar]
- Liu, H.L.; An, Z.X.; Wang, H.K.; Zhang, P.H.; Wang, G.Y.; Wang, Z. Spatiotemporal evolution of coupling coordination between urban resilience and innovation efficiency and spatial heterogeneity of influencing factors in counties of Beijing-Tianjin-Hebei Urban Agglomeration. Geogr. Res. 2025, 44, 577–602. [Google Scholar]
- Zhao, R.D.; Fang, C.L.; Liu, J.; Zhang, L.F. The evaluation and obstacle analysis of urban resilience from the multidimensional perspective in Chinese cities. Sustain. Cities Soc. 2022, 86, 104160. [Google Scholar] [CrossRef] [Scilit]
- Chen, Y.; Cai, S.W.; Zhang, D.N.; Wang, L.; Sun, Y.J. An interpretable machine learning-assisted urban resilience evaluation and determinants identification: A case study of the Yangtze River Economic Belt, China. Sustain. Cities Soc. 2025, 134, 106930. [Google Scholar] [CrossRef] [Scilit]
- Yin, J.; Zhang, B.; Ding, R.; Qiu, Y.; Jiang, H. Urban agglomeration economic connection and evolution of spatial features in the New Western Land-Sea Corridor of China. Sci. Geogr. Sin. 2023, 43, 1983–1993. [Google Scholar]
- Shi, L.Y.; Zheng, Q.Y.; Yang, M.; Liu, L. A review of definitions, influence factors and assessment of urban resilience. Acta Ecol. Sin. 2022, 42, 6016–6029. [Google Scholar] [CrossRef] [Scilit]
- Wang, Y.; Liu, X.H.; Liu, Y. Spatiotemporal evolution and influence mechanisms of urban resilience in the Guangdong-Hong Kong-Macao Greater Bay Area. Geogr. Res. 2025, 44, 3025–3046. [Google Scholar]
- Cutter, S.L.; Burton, C.G.; Emrich, C.T. Disaster resilience indicators for benchmarking baseline conditions. J. Homel. Secur. Emerg. Manag. 2010, 7, 51. [Google Scholar] [CrossRef] [Scilit]
- Sherrieb, K.; Norris, F.H.; Galea, S. Measuring capacities for community resilience. Soc. Indic. Res. 2010, 99, 227–247. [Google Scholar] [CrossRef] [Scilit]
- Huang, S.Y.; Zhou, S.H.; Dong, Y. Spatio-temporal evolution characteristics and development trend prediction of urban resilience of urban agglomeration on the northern slope of Tianshan Mountains. Arid Land Geogr. 2025, 48, 559–570. [Google Scholar]
- Ye, C.S.; Hu, M.S.; Lu, L.; Dong, Q.; Gu, M.L. Spatio-temporal evolution and factor explanatory power analysis of urban resilience in the Yangtze River Economic Belt. Geogr. Sustain. 2022, 3, 299–311. [Google Scholar] [CrossRef] [Scilit]
- Wei, J.C.; Yan, Z.R.; Zhou, L. Urban resilience levels of five major urban agglomerations in China: A study on spatial and temporal evolution of urban resilience levels. China Emerg. Manag. 2023, 8, 56–61. [Google Scholar]
- Tan, J.; Hu, X.; Hassink, R.; Ni, J. Industrial structure or agency: What affects regional economic resilience? Evidence from resource-based cities in China. Cities 2020, 106, 102906. [Google Scholar] [CrossRef] [Scilit]
- Wang, X.; Wang, C.X.; Shi, J.L. Spatial and temporal evolution of urban resilience and its transition mechanism in Zhongyuan urban agglomeration. Sci. Geogr. Sin. 2024, 44, 1206–1216. [Google Scholar]
- Ma, H.T.; Wang, K.W. Spatial-temporal evolution and influencing factors of green urbanization in the Northern Slope Economic Belt of Tianshan Mountains, China. Sustain. Cities Soc. 2024, 113, 105686. [Google Scholar] [CrossRef] [Scilit]
- Zou, Y.F.; Zhang, Q.; Rao, Y.F.; Deng, M.; Wang, Q. Evolution of new urbanization of provincial capitals in western China. Arid Land Geogr. 2023, 46, 636–648. [Google Scholar]
- Yin, J.J.; Hu, J.; Huang, Y.X. Spatial-temporal evolution characteristics and dynamic prediction of urban resilience in urban agglomerations in middle reaches of Yangtze River. Resour. Environ. Yangtze Basin 2023, 32, 2312–2325. [Google Scholar]
- Li, H.Y.; Wang, Y.; Zhang, H.W.; Yin, R.; Liu, C.; Wang, Z.; Fu, F.; Zhao, J. The spatial-temporal evolution and driving mechanism of urban resilience in the Yellow River Basin cities. J. Clean. Prod. 2024, 447, 141614. [Google Scholar] [CrossRef] [Scilit]
- Wang, C.; Meng, J.J.; Zhu, L.K. Assessing urban drought vulnerability in northwest China using a social-ecological-technological framework. Sustain. Cities Soc. 2025, 134, 106925. [Google Scholar] [CrossRef] [Scilit]
- Zhang, L.Y.; Sun, L.X.; Yu, Y.; Ding, X.Y.; Guo, Z.K.; Yu, R.D. Analyzing water footprint and water resources sustainability in China’s arid Northwest with Bayesian network. Ecol. Indic. 2025, 177, 113792. [Google Scholar] [CrossRef] [Scilit]
- Hu, H.; Yan, K.G.; Shi, Y.; Lv, T.G.; Zhang, X.M.; Wang, X.Y. Decrypting resilience: The spatiotemporal evolution and driving factors of ecological resilience in the Yangtze River Delta Urban Agglomeration. Environ. Impact Assess. Rev. 2024, 106, 107540. [Google Scholar] [CrossRef] [Scilit]
- Zhou, Y.J.; Zhang, C.G.; Yin, S.G.; Sun, T. Coupling coordination and impact mechanism of ecological resilience-resistance-adaptation-restoration in the Yangtze River Delta region. Econ. Geogr. 2025, 45, 160–170. [Google Scholar]
- Zhang, S.B.; Lei, J.; Zhang, X.L.; Fan, L.Q.; Duan, Z.L. Urban human settlement quality refined assessment and its spatial relationship with human activity intensity in arid area: A case study of Urumqi, China. Habitat Int. 2025, 161, 103422. [Google Scholar] [CrossRef] [Scilit]
- Zhang, Y.; Alimujiang, K.; Song, N.; Tang, L. Analysis of spatiotemporal variations and driving mechanisms of ecosystem health in arid oasis urban agglomerations using machine learning. Ecol. Indic. 2026, 182, 114504. [Google Scholar] [CrossRef] [Scilit]
- Zhang, A.X.; Miao, C.L.; Chen, Z.Y. Urban ecological resilience, social networks and its influencing factors in the Yellow River Basin. Arid Land Geogr. 2025, 48, 130–142. [Google Scholar]
- Zheng, Z.; Chen, X. Study on the distribution dynamics and spatial convergence of urban innovation potential in the Yangtze River middle reaches urban agglomeration. Resour. Environ. Yangtze Basin 2024, 33, 271–284. [Google Scholar]
- Yue, S.; Pilon, P.; Phinney, B.; Cavadias, G. The influence of autocorrelation on the ability to detect trend in hydrological series. Hydrol. Process. 2002, 16, 1807–1829. [Google Scholar] [CrossRef] [Scilit]
- Yue, S.; Wang, C.Y. The Mann-Kendall test modified by effective sample size to detect trend in serially correlated hydrological series. Water Resour. Manag. 2004, 18, 201–218. [Google Scholar] [CrossRef] [Scilit]
- Wang, X.X.; Zhao, X.Y. Spatial and temporal coupling research of economic resilience and ecological resilience in the northern slope economic belt of Tianshan Mountains. Acta Ecol. Sin. 2024, 44, 9670–9683. [Google Scholar]
- Fang, C.L.; Gao, Q.; Zhang, X.L.; Cheng, W.G. Spatial and temporal evolution characteristics of urban agglomeration expansion and its impact on the ecological environment: A case study of the urban agglomeration on the northern slope of the Tianshan Mountains. Sci. Sin. Terrae 2019, 49, 1413–1424. [Google Scholar]
- Li, C.; Ma, X.Y.; Xia, Q. The study of resilient cities in domestic and overseas and the implications to the spatial planning of Yellow River Floodplain Area. Urban Dev. Stud. 2020, 27, 54–61. [Google Scholar]
- Li, N.; Bai, L.; Qiao, Q.; Yang, Q.; Xie, M.; Zhou, C.; Zhang, L. Economic development, emission reduction potential, and strategy analysis of industrial green development in Northern Tianshan Mountain Economic Zone. Res. Environ. Sci. 2020, 33, 503–510. [Google Scholar]
- Ma, G.; Zhang, J.; Yin, F.; Zhang, J.; Guo, L.; Wen, Y.; Ma, Z.; Feng, Z.; Mu, X.; Wang, Z. Coupled coordination of oasis agriculture water–environment–economy systems under drip irrigation: Pathways and constraints in Xinjiang, China. Agric. Water Manag. 2026, 324, 110126. [Google Scholar] [CrossRef] [Scilit]
- Liu, X.; Tang, Q.; Zhao, Y.; Wang, P. Persistent water scarcity due to high irrigation demand in arid China: A case study in the north slope of the Tianshan Mountains. Earths Future 2024, 12, e2024EF005070. [Google Scholar] [CrossRef] [Scilit]
- He, T.; Wang, C.; Wang, Z.; He, X.; Liu, H.; Zhang, J. Assessing the agricultural water savings–economy–ecological environment system in an arid area of northwest China using a water rights transaction model. Water 2021, 13, 1233. [Google Scholar] [CrossRef] [Scilit]
- Wang, Z.Q.; Qin, F. Assessment and spatial-temporal distribution characteristics of land use ecological risk in production-living-ecological spaces: A case study of the urban agglomerations on the northern slope of the Tianshan Mountains. Arid Zone Res. 2025, 42, 2278–2289. [Google Scholar]
- Kong, Y.; Abliz, A.; Guo, D.; Liu, X.; Li, J.; Nurahmat, B. Coupling coordination development between cultivated land and agricultural water use efficiency in arid regions: A case study of the Turpan–Hami Basin. Agriculture 2025, 15, 1153. [Google Scholar] [CrossRef] [Scilit]
- Yuan, L.; Abulizi, A.; Mamitimin, Y.; Mamat, K.; Wang, J.X.; Bai, S.J. Evolution of trade-offs and synergies in eco-functional zones based on ecosystem service bundles: A case study of the Turpan-Hami region. Environ. Sci. 2025, 46, 3042–3057. [Google Scholar]
- Wang, Z.X.; Liu, S.X. Estimation and spatio-temporal evolution of groundwater storage on the northern slope of the Tianshan Mountains over the past three decades. Acta Geogr. Sin. 2023, 78, 1744–1763. [Google Scholar]
- Jing, L.; Yang, Y.F. Study on the spatial agglomeration, flow characteristics and evolutionary trend of population distribution: A case study of Xinjiang. Urban Stud. 2025, 113–120. [Google Scholar]
- Zhang, S.; Lei, J.; Zhang, X.; Tong, Y.; Lu, D.; Fan, L.; Duan, Z. Assessment and optimization of urban spatial resilience from the perspective of life circle: A case study of Urumqi, NW China. Sustain. Cities Soc. 2024, 109, 105527. [Google Scholar] [CrossRef] [Scilit]
- Chen, P.; Huang, L.; Cao, W.; Huang, K.; Zeng, Y.; Wang, H.; Tang, X.; Tian, C. Urban resilience to heatwave shocks in China’s three coastal agglomerations: Spatial heterogeneity and nonlinear driving mechanisms with threshold effects. Land 2026, 15, 1052. [Google Scholar] [CrossRef] [Scilit]
- Tuersunayi, R.; Alimujiang, K.; Gao, P.W.; Zhao, H.M.; Abulaiti, H. Research on urban agglomeration expansion on the Northern Slope of Tianshan Mountains based on DMSP/OLS and NPP/VIIRS data. Geospat. Inf. 2022, 20, 20–25. [Google Scholar]
- Zhang, T.; Huang, X.Y.; Li, P.; Dang, X.H.; Cao, X.S.; Deng, M.J. Basic theories and construction layout of eco-economic pivotal zones in northwest China based on the Three Water Lines strategy. Acta Geogr. Sin. 2022, 77, 2154–2173. [Google Scholar]
- Sun, Y.; Li, X. Coupling coordination analysis and factors of “Urban renewal-ecological resilience-water resilience” in arid zones. Front. Environ. Sci. 2025, 13, 1615419. [Google Scholar] [CrossRef] [Scilit]
- Sharifi, A. A critical review of selected tools for assessing community resilience. Ecol. Indic. 2016, 69, 629–647. [Google Scholar] [CrossRef] [Scilit]

Disclaimer/Publisher’s Note: The statements, opinions and data contained in all publications are solely those of the individual author(s) and contributor(s) and not of MDPI and/or the editor(s). MDPI and/or the editor(s) disclaim responsibility for any injury to people or property resulting from any ideas, methods, instructions or products referred to in the content. |
© 2026 by the authors. Licensee MDPI, Basel, Switzerland. This article is an open access article distributed under the terms and conditions of the Creative Commons Attribution (CC BY) license.