Article

Application of Deep Learning Semantic Segmentation Models in Remote Sensing-Based Cropland Non-Grain and Non-Agriculturalization Monitoring: A Comparative Study

1
Changsha Natural Resources Comprehensive Survey Center, China Geological Survey, Changsha 410600, China
2
Hunan Provincial Key Laboratory of Geochemical Processes and Resource Environmental Effects, Geophysical and Geochemical Survey Institute of Hunan, Changsha 410114, China
3
School of Aeronautic Engineering, Changsha University of Science and Technology, Changsha 410114, China
4
School of Computer and Mathematics, Central South University of Forestry and Technology, Changsha 410004, China
5
School of Low-Altitude Economy, Central South University of Forestry and Technology, Changsha 410004, China
*
Author to whom correspondence should be addressed.
Land 2026, 15(8), 1437; https://doi.org/10.3390/land15081437
Submission received: 1 June 2026 / Revised: 2 August 2026 / Accepted: 4 August 2026 / Published: 9 August 2026

Abstract

Cropland non-grain and non-agriculturalization monitoring (CNNM) is of great significance for ensuring national food security. Recently, semantic segmentation has been a promising approach that can fully exploit the advantages of high-resolution remote sensing imagery. It is of great significance to clarify the performance of semantic segmentation algorithms for CNNM and their influencing factors. This paper contributes to research on deep learning-based semantic segmentation models for CNNM by investigating the robustness and generalization ability of detection models in complex scenarios. To investigate these models, seven mainstream segmentation models were examined with respect to two self-constructed unmanned aerial vehicle (UAV)-based cropland monitoring datasets under various experimental settings. The experimental results reveal several key findings: For the datasets employed in the present study, remote sensing semantic segmentation models demonstrate superior performance relative to generic visual models. Increasing backbone depth does not guarantee significant performance improvements. The recognition challenges posed by task-specific categories such as agricultural facility land further underscore the need for tailored deep learning semantic segmentation algorithms for CNNM. These experimental results provide valuable insights into the practical performance of deep learning semantic segmentation models and offer useful guidance for future semantic segmentation research in the field of CNNM.

1. Introduction

Cropland is a fundamental guarantee for food security and plays a key role in the stable development of the economy and society [1]. The Chinese government has always regarded food security as an important part of the current national economy. For a long time, China, driven by factors such as the urban–rural gap, has used much of its cropland for non-grain production [2]. Currently, in response to these issues, the government has explicitly required the prevention of cropland conversion to non-grain and non-agricultural uses [3]. Therefore, using machine learning to carry out the rapid and large-scale monitoring of cropland, especially cropland non-grain and non-agriculturalization monitoring (CNNM), has become an important research topic.
Remote sensing technology, with its advantages of wide coverage and low cost, plays a crucial role in farmland monitoring. Traditional methods employ conventional machine learning or image processing and segmentation techniques for pixel-level segmentation, such as maximum likelihood classification, support vector machines, and edge detection, which are widely applied [4,5,6]. However, with the widespread adoption of high-spatial-resolution remote sensing imagery, traditional extraction methods exhibit insufficient robustness and poor generalization capabilities due to the complexity of spectral and textural characteristics [7].
In recent years, with the advancement of deep learning methods and their successful application across diverse domains, their potential in remote sensing research has garnered increasing recognition. Numerous studies [7,8] have corroborated that deep learning models exhibit a significant accuracy advantage over traditional classifiers. Convolutional neural networks (CNNs) have demonstrated exceptional performance in early-stage deep learning tasks owing to their robust local feature extraction capabilities [9]. For semantic segmentation, FCN [10] addresses the problem that traditional CNNs can only perform classification and detection on fixed-size images by replacing fully connected layers with convolutional layers. On the basis of this structure, numerous models have been proposed [11,12]. In addition, dilated convolutions have attracted considerable attention for their ability to expand the receptive field [13,14,15,16]. Among them, DeepLabv3+ [17] integrates dilated convolutions and pyramid pooling techniques, making it another classic model for semantic segmentation. To tackle the limitation of local receptive fields in CNN-based models, many researchers have attempted to combine such models with attention mechanisms and have achieved remarkable results [18,19]. Transformers were originally widely applied in the field of Natural Language Processing (NLP). The introduction of Vision Transformer (ViT) [20] leveraged the self-attention mechanism of Transformers to process image data, establishing a brand-new paradigm. Segmenter [21], SegFormer [22] and Swin-UNet [23] are classic Transformer-based models for semantic segmentation.
Similarly, in the field of remote sensing, the relevant algorithms have been extensively adopted in farmland monitoring [24,25,26]. Researchers have achieved notable progress by adapting these models to the unique characteristics of remote sensing data, thereby effectively capturing multi-level features. For instance, Zhang et al. [7] optimized PSPNet by integrating deep long-range features with shallow local features, enabling high-resolution predictions. Sun et al. [27] proposed a specialized module embedded between the encoder and decoder to facilitate comparative operations on deep features extracted by the backbone network. Beyond architectural modifications, many studies leverage the multispectral characteristics of remote sensing imagery, which distinguish it from conventional optical images. For example, Liu et al. [28] proposed an application method to fuse spectral features and vegetation indices with UNet networks, achieving improved accuracy over conventional models relying solely on spectral features. With the widespread adoption of Transformers, their applications in cropland monitoring have been extensively researched. The lightweight edge-aware Transformer segmentation network LaFormer [29] effectively enhances farmland extraction adaptability and generalization performance. Chen et al. [30] optimized SegFormer, significantly improving the Precision of farmland information extraction. Although Transformer models demonstrate excellent performance, their computational demands often necessitate a trade-off between accuracy and efficiency in practical applications [22]. Furthermore, various attention mechanisms and cutting-edge approaches such as Mamba have been progressively adopted in this field [31,32,33].
Despite the effectiveness of deep learning methods in cropland extraction tasks demonstrated by existing studies, several limitations remain for cropland conversion monitoring. On the one hand, most publicly available remote sensing datasets are designed for general land use classification, and dedicated datasets specifically tailored for cropland conversion detection are still lacking. On the other hand, the applicability and performance differences in various semantic segmentation models for monitoring cropland non-grain and non-agriculturalization use have not yet been comparatively investigated.
To address these issues, this study conducts a comparative analysis of deep learning-based semantic segmentation models for cropland monitoring. The main contributions are summarized as follows:
(1)
Two unmanned aerial vehicle (UAV)-based cropland monitoring datasets are constructed to support cropland monitoring at different spatial granularities. The first dataset covers the major land cover categories involved in monitoring cropland non-grain and non-agricultural conversion, while the second dataset is specifically designed for rice-related extraction and analysis.
(2)
Seven semantic segmentation models are comparatively evaluated for cropland monitoring tasks, encompassing three categories: CNN-based models, Transformer-based models, and hybrid architectures.
Overall, for cropland monitoring, deep learning-based semantic segmentation is an important yet insufficiently explored research direction that deserves further investigation. As deep learning continues to evolve rapidly with emerging algorithms, the experimental results presented in this study provide valuable insights and guidance for future research on deep learning methods in cropland monitoring.
The remainder of this paper is organized as follows. Section 2 introduces the study area and dataset construction, and describes the seven semantic segmentation models evaluated in this study. Section 3 presents the experimental settings and provides a comprehensive analysis of the experimental results. Section 4 discusses the influence of model architectures, backbone network depth, and different land cover categories on segmentation performance. Finally, Section 5 concludes the paper.

2. Materials and Methods

2.1. Study Area and Material

2.1.1. Study Area

As shown in Figure 1, the UAV image data used in this study were acquired from two regions in Hunan Province, China. Study area 1 is located in Changsha City, within the ranges of 113°05′27.20″ E–113°07′59.17″ E, 28°05′44.80″ N–28°09′10.98″ N. Study area 2 is located in Changsha City, within the ranges of 29°26′39.74″ N–29°28′08.85″ N, 112°15′38.08″ E–112°17′35.49″ E. Study area 1 comprises multiple non-contiguous aerial images, whereas study area 2 is a single complete mosaicked UAV image.

2.1.2. Material

1.
Dataset 1
Dataset 1 is generated from raw UAV aerial imagery, with a spatial resolution of about 0.05 m. These samples were visually annotated by remote sensing experts to extract key land cover types that are critical for monitoring the non-grain monitoring of cropland.
We have specifically tailored the category system for CNNM. For instance, unlike the building category commonly adopted in public semantic segmentation datasets, agricultural facility buildings in our proposed dataset are classified under the agricultural facility land category. This category design is intended to better align with the practical requirements of CNNM.
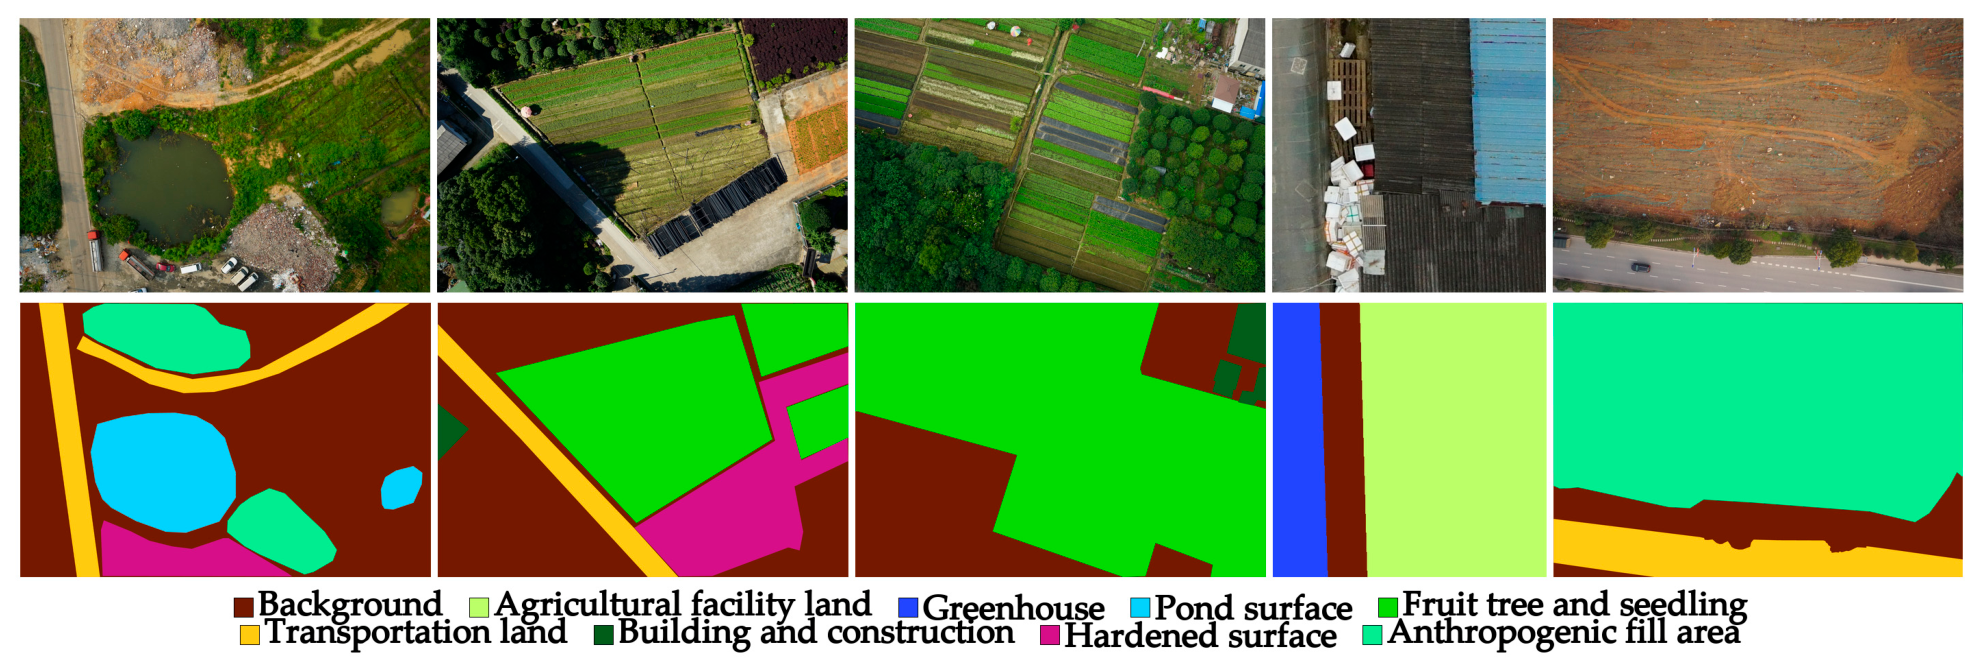
The structure of the dataset is depicted in the following figure, encompassing nine categories: background, agricultural facility land, greenhouse, pond surface, fruit tree and seedling, transportation land, building and construction, hardened surface, and anthropogenic fill area. The targets for non-agriculturalization monitoring include transportation land, building and construction, hardened surface, anthropogenic fill area, agricultural facility land, pond surface, fruit tree and seedling, and greenhouse.
The annotation work was completed by three professionals with over 3 years of experience in remote sensing interpretation of land use. The annotation was performed through vector polygon delineation and then batch-converted into single-band raster label maps by the program, with pixel values strictly corresponding to class indices.
In accordance with the territorial spatial land use classification standards and the practical characteristics of non-grain conversion of cultivated land, this paper defines nine semantic classes in total and formulates unified boundary delineation rules:
Background: Normal grain cultivated land and a small amount of natural vegetation, which is the dominant land cover class in the dataset.
Agricultural facility land: Agricultural supporting facility land excluding greenhouses, including guard houses, breeding pens, drying yards, agricultural material storage yards, etc.
Greenhouse: Crop cultivation facilities covered with plastic film or glass, including solar greenhouses and multi-span greenhouses.
Pond surface: Small artificial water bodies formed by excavation, used for aquaculture or irrigation water storage.
Fruit trees and seedlings: Orchards and seedling nurseries planted in contiguous patches on cultivated land, characterized by regular row–column planting patterns.
Transportation land: Roads of all levels, including rural roads and hardened production roads, presenting linear land features.
Buildings and structures: Permanent structures such as rural residences and factory buildings.
Hardened surface: Hardened sites such as public squares and parking lots, excluding roads and building roofs.
Anthropogenic fill area: Bare soil areas formed by construction excavation and earth-filling, with no vegetation coverage.
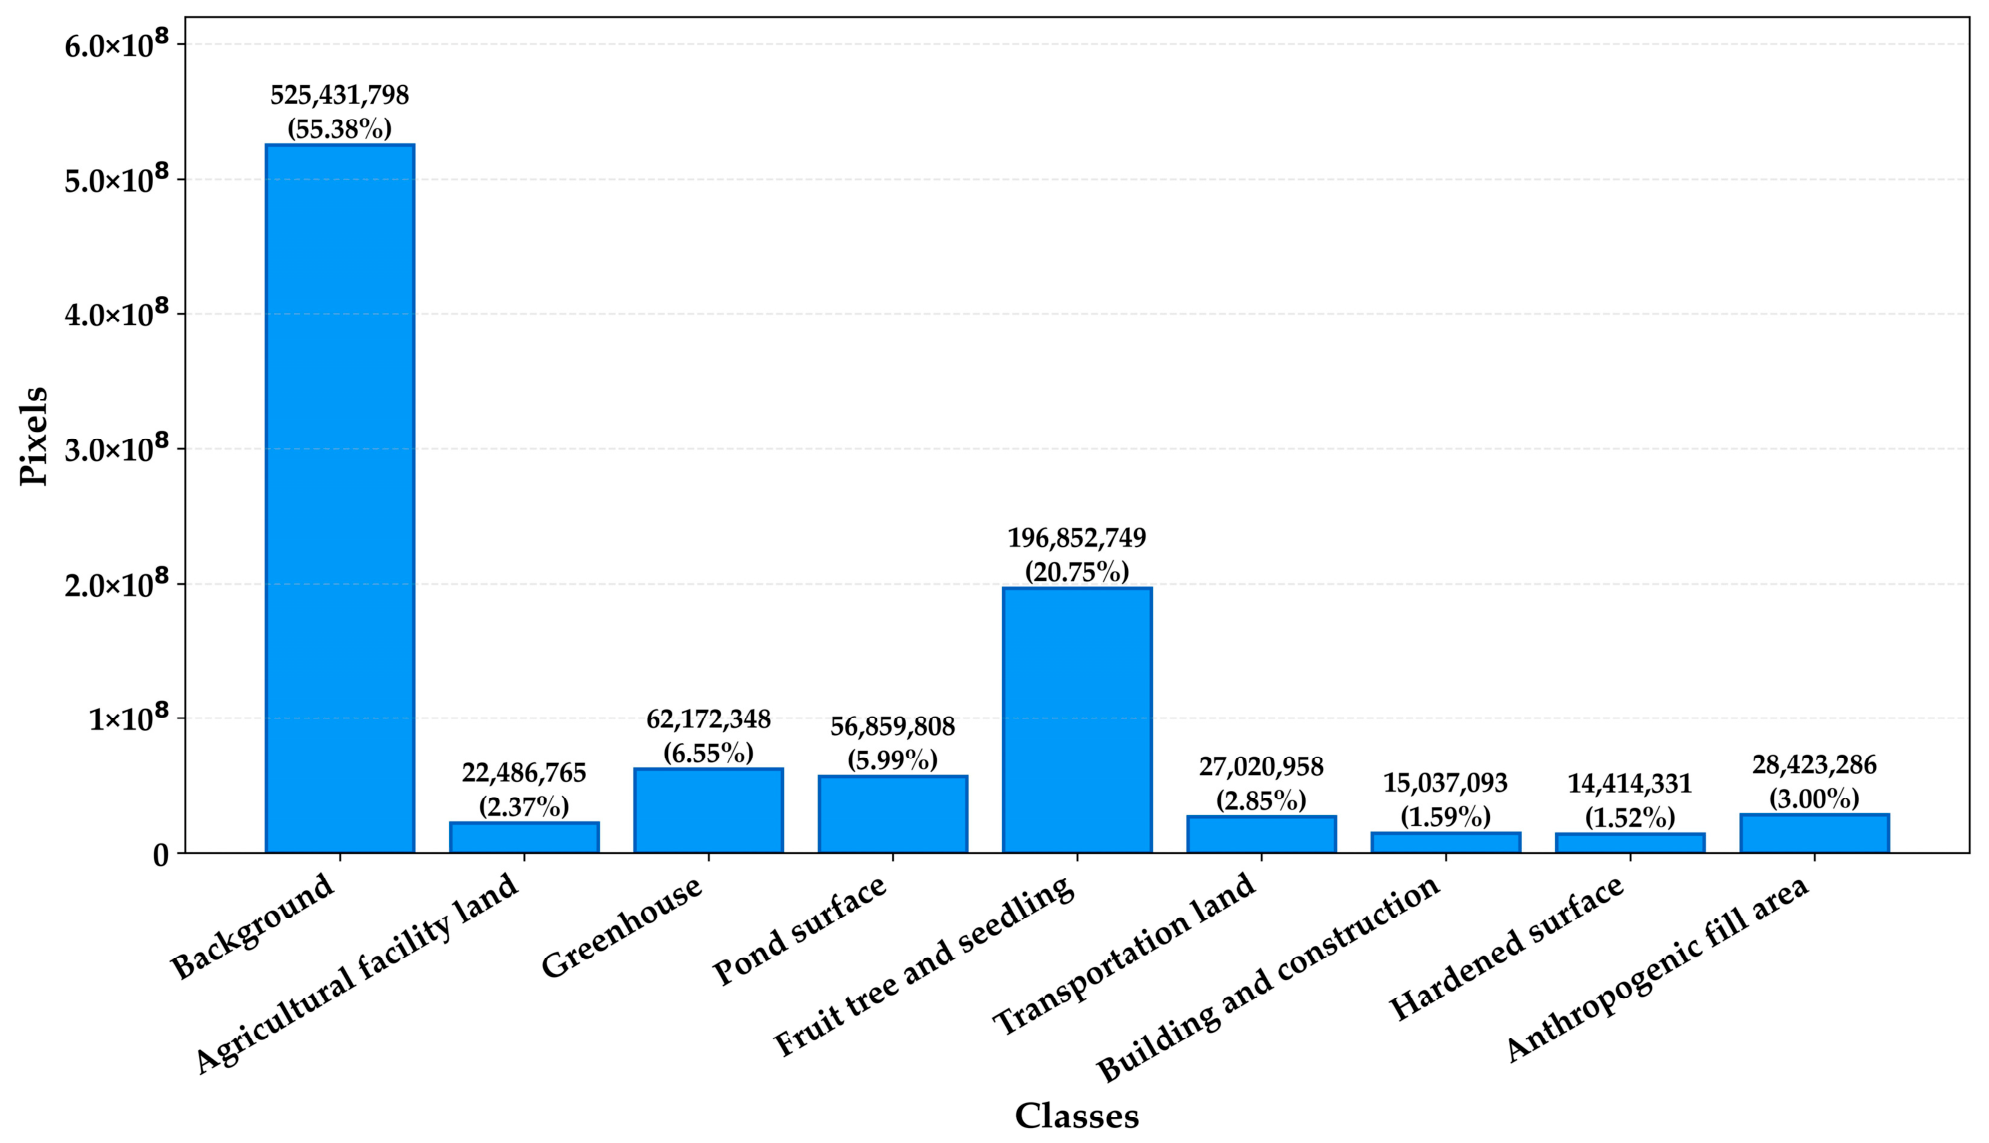
The pixel proportions of each category in the training set are calculated, with the results summarized in Figure 2. The dataset exhibits a prominent long-tailed distribution: the background class accounts for the largest share, while small patch categories such as transportation land and hardened surface each make up less than 3%, constituting a typical class imbalance scenario. This distribution aligns with the actual land surface characteristics of non-grain cultivated land and enables an objective verification of the models’ recognition performance on minority classes.
Figure 3 shows an example of Dataset 1. After cropping and other preprocessing steps, the dataset contains 3619 images with a pixel size of 512 × 512, which facilitates the input of subsequent models. The dataset is partitioned into three subsets: a training set of 2171 images, a validation set of 724 images, and a test set of 724 images.
2.
Dataset 2
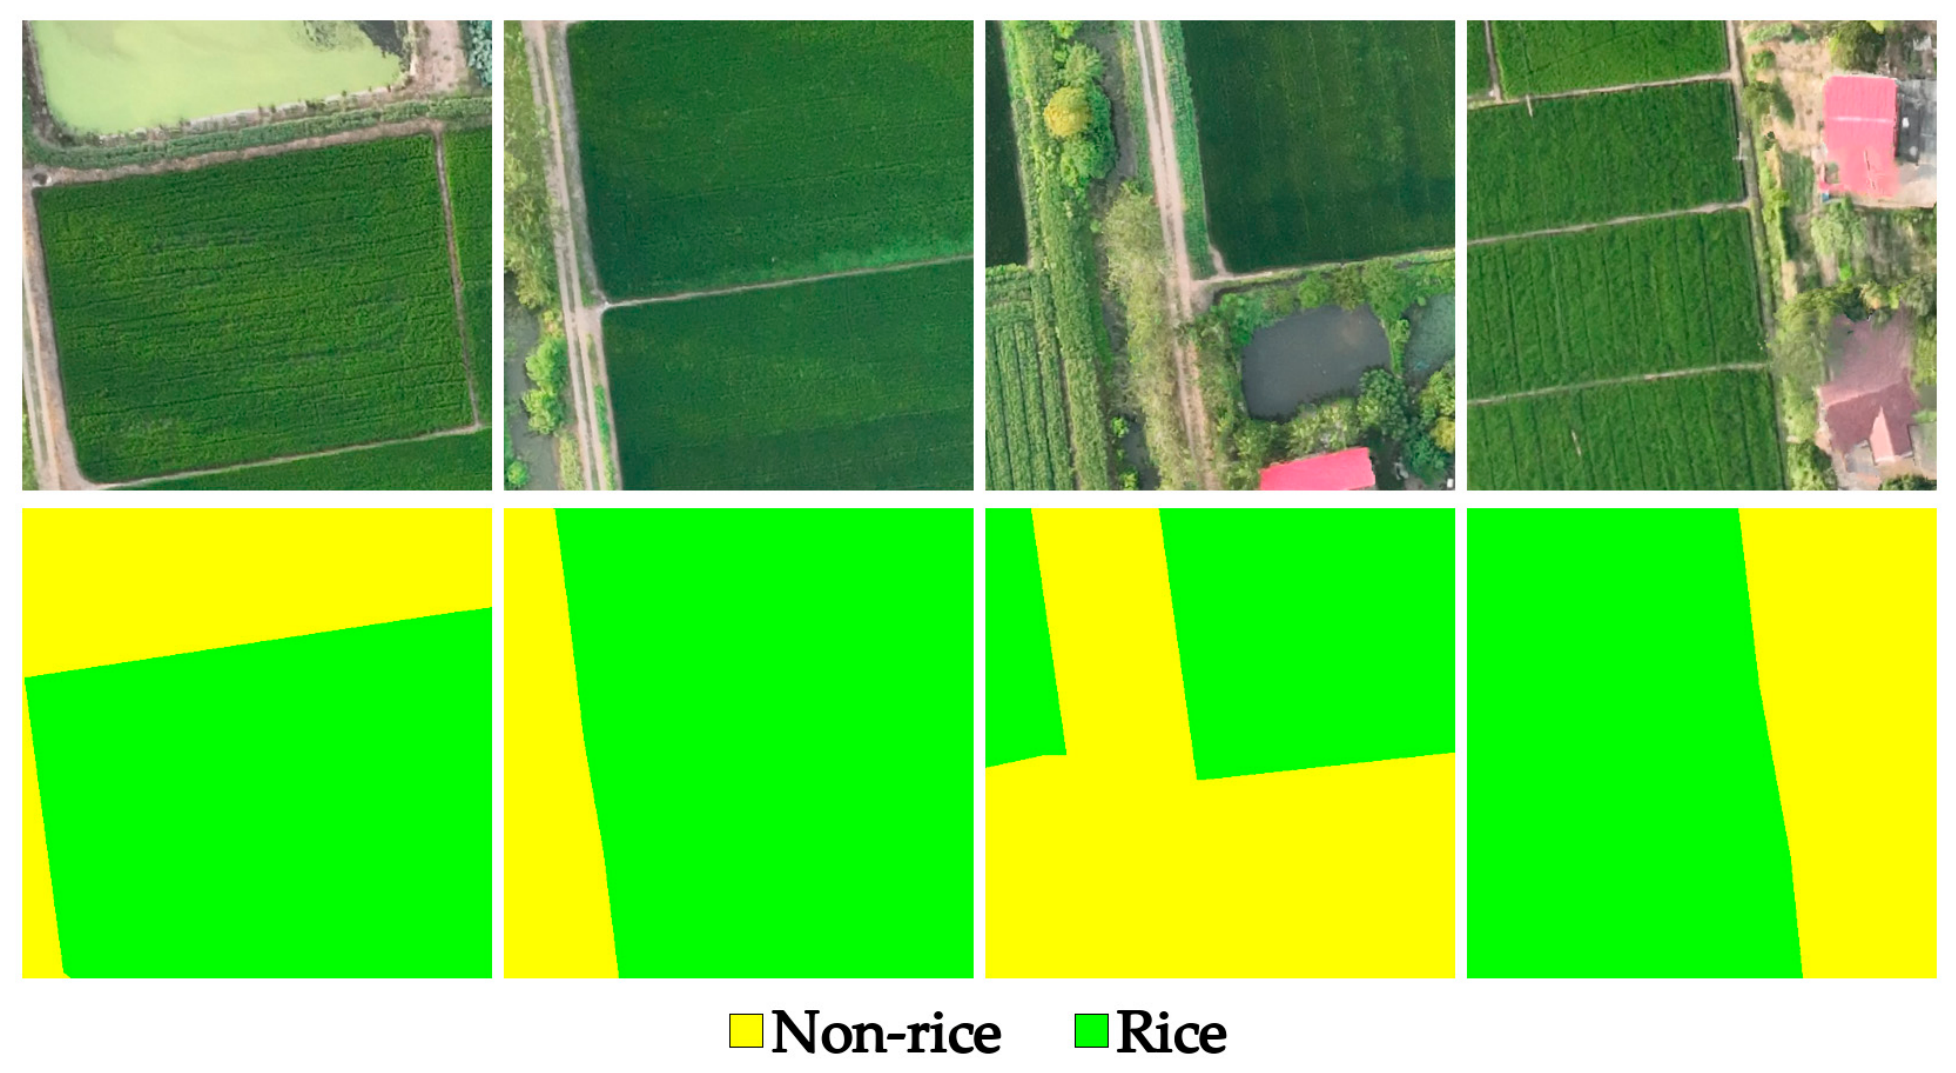
Dataset 2 takes 0.1 m resolution UAV imagery from Anxiang County, Hunan Province, as its data source. Remote sensing experts visually annotated and extracted rice—the primary food crop—along with other crops (including mid-season rice, late rice, and lotus), man-made structures such as buildings, and other land types. The final annotation categories are divided into two classes: rice and background (Figure 4).
Rice: The rice class includes all paddy rice categories that were initially annotated separately, specifically mid-season rice and late rice. These two subcategories were merged into a single “rice” class because the primary objective of Dataset 2 is to monitor the overall extent of rice cultivation rather than distinguishing between different rice cropping seasons.
Background: The background class encompasses all other land cover types, including lotus ponds, buildings, roads, hardened surfaces, water bodies, and other non-rice land types.
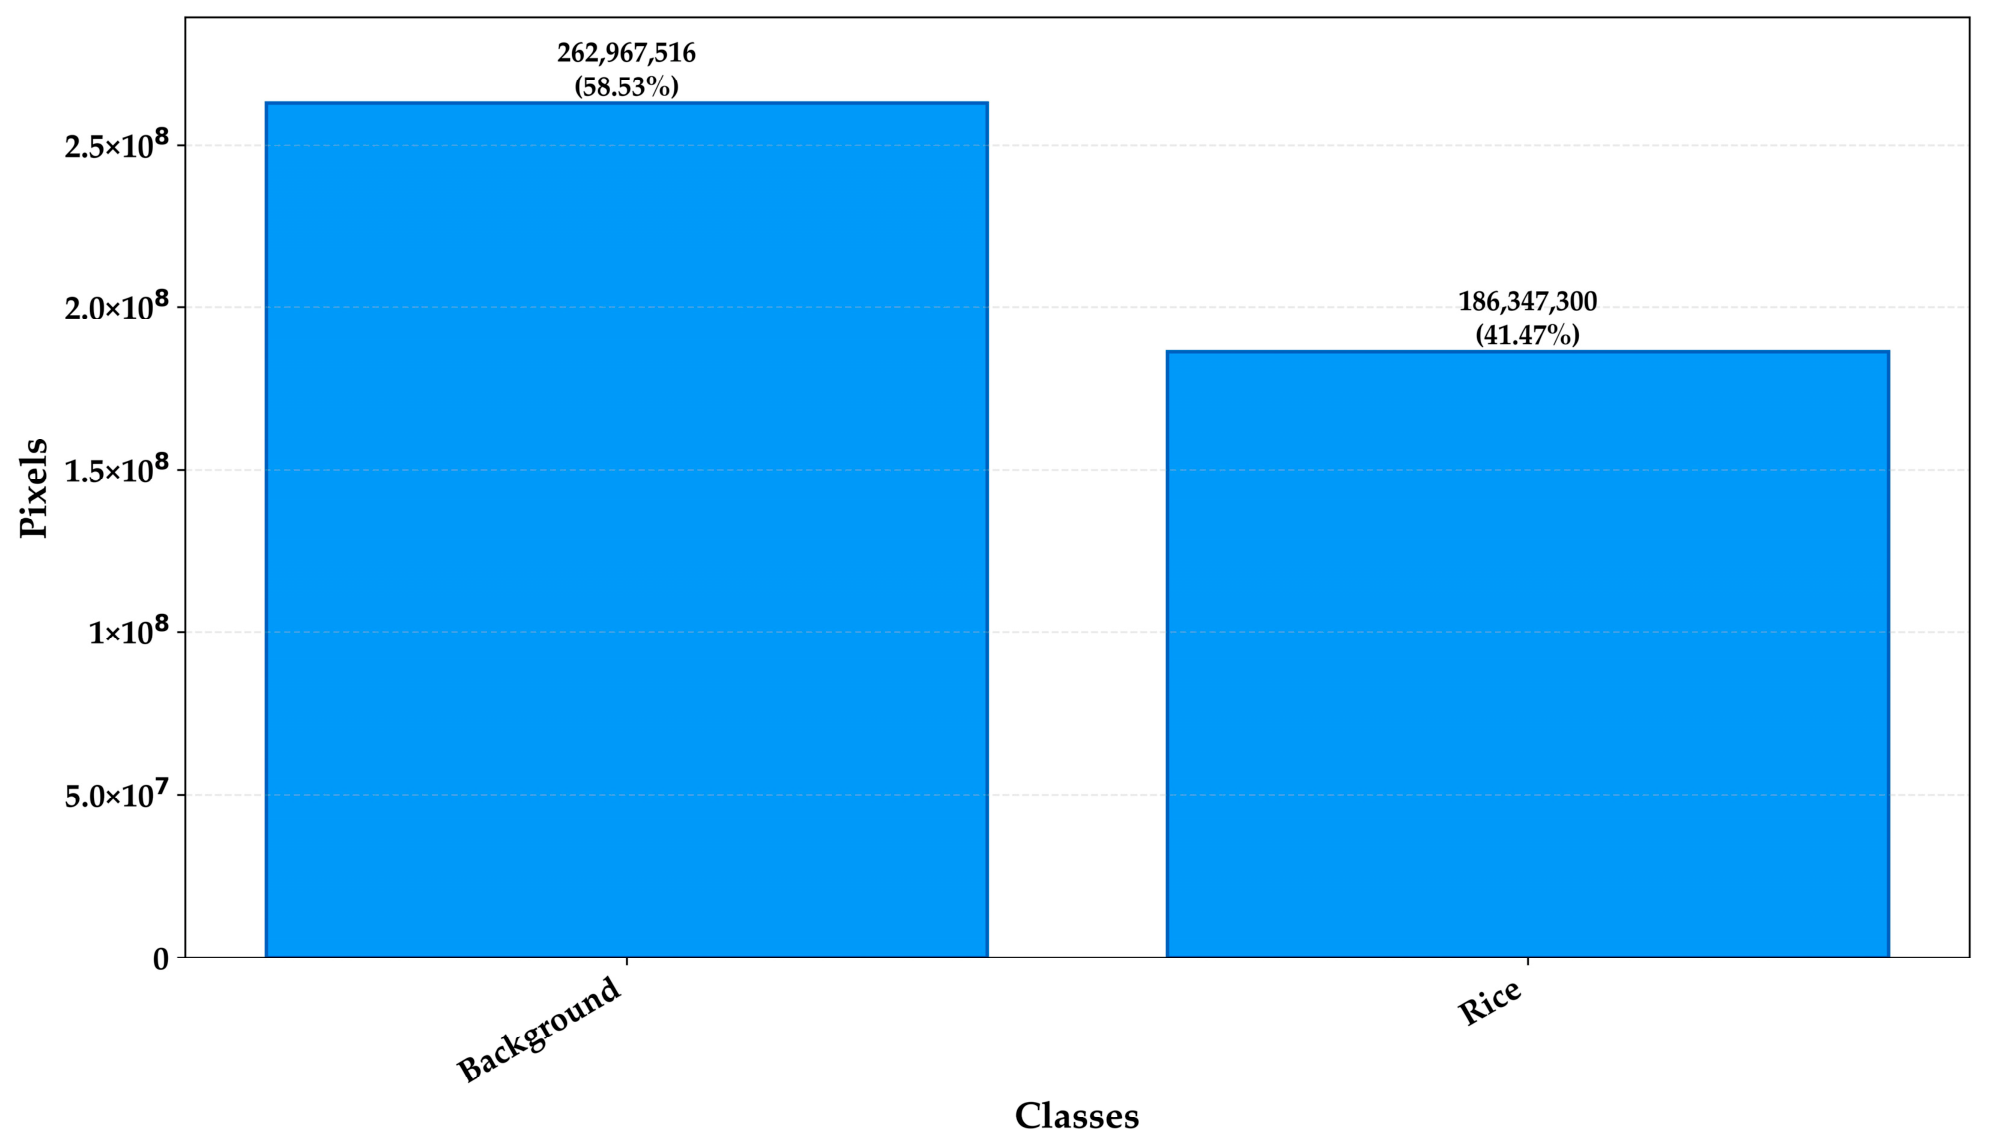
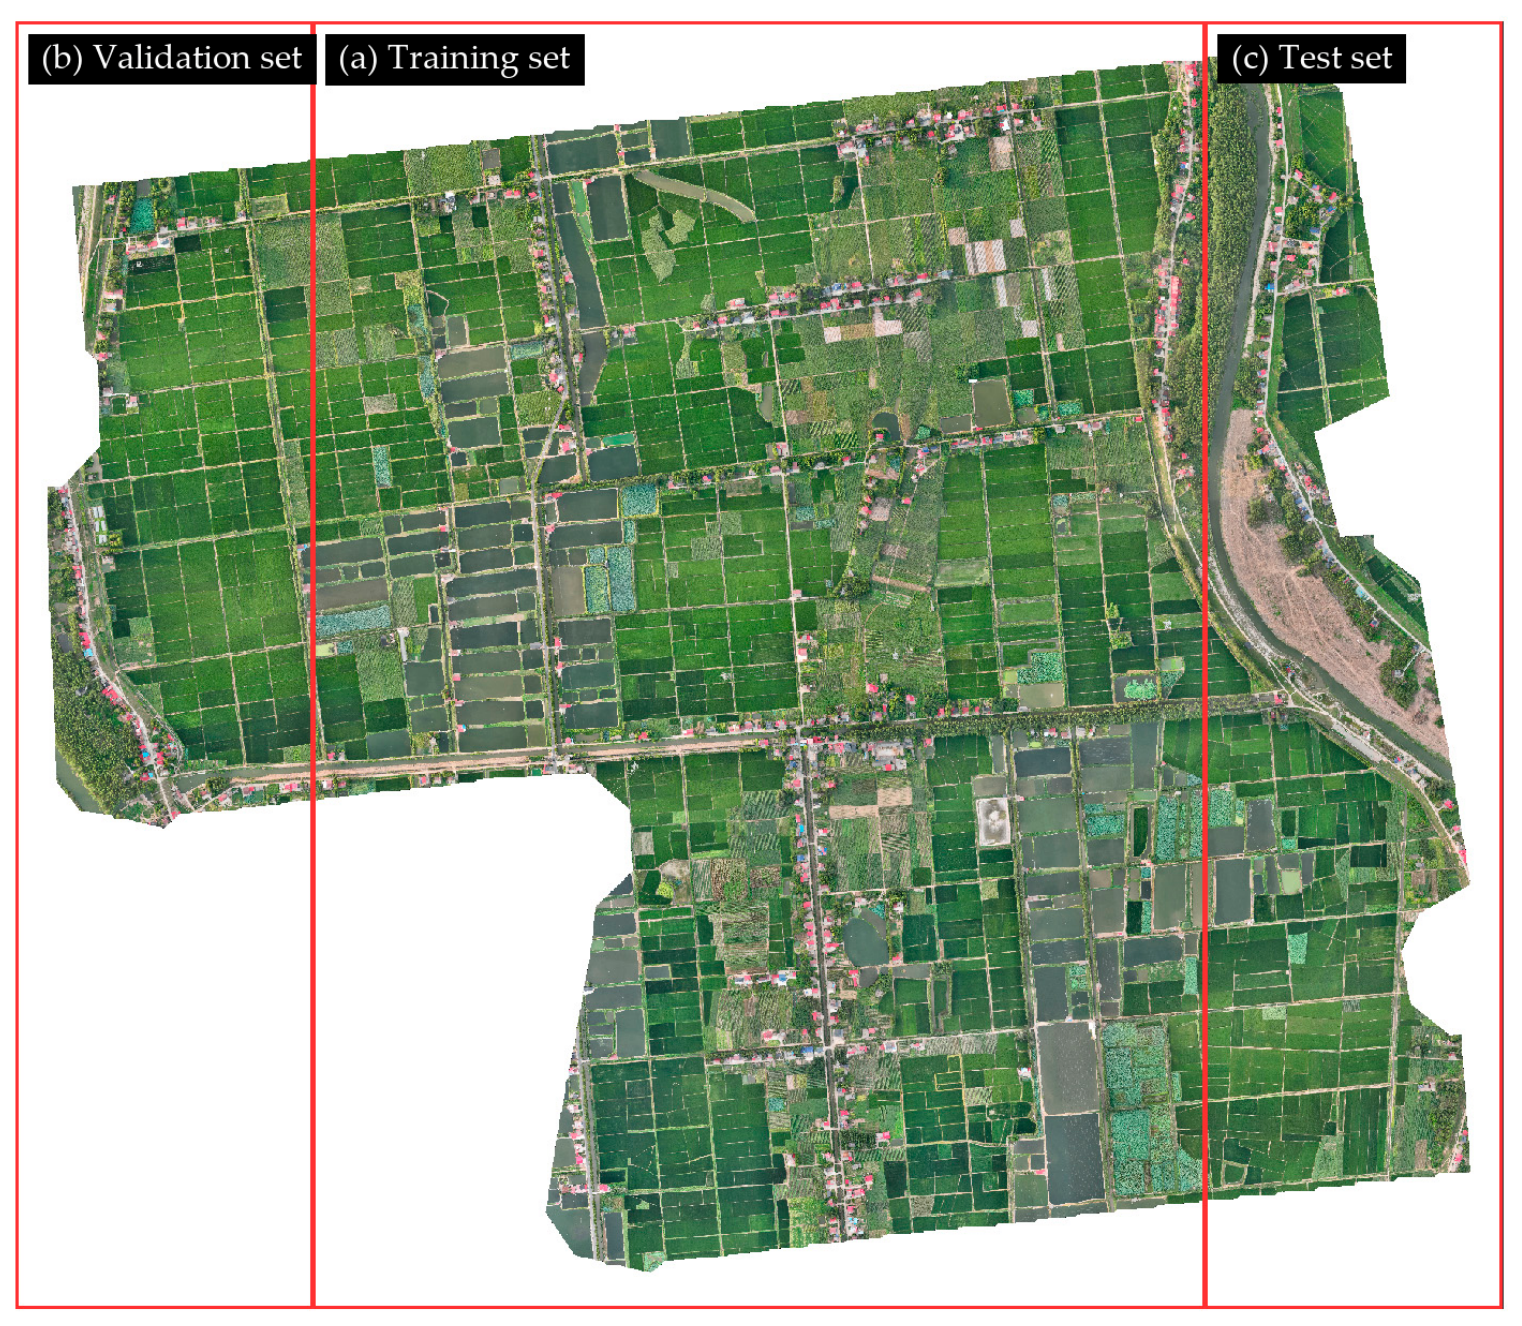
After being cropped to 512 × 512 pixels, the dataset comprises 1714 samples. This dataset enables more accurate and detailed results for cultivated land crop extraction, particularly for rice. Its pixel distribution characteristics are illustrated in Figure 5. For Dataset 2, we adopted a spatially independent partitioning strategy to evaluate the spatial generalization ability, as illustrated in Figure 6. The dataset is partitioned into three subsets: a training set of 1233 images, a validation set of 193 images, and a test set of 288 images. The data processing and quality control procedures for Dataset 2 are largely consistent with those for Dataset 1.

2.2. Methodology

To preliminarily evaluate the application performance of semantic segmentation methods on these two types of datasets, we selected representative models from CNN architecture, Transformer architecture, hybrid architecture, and the recently emerging Mamba architecture, as detailed below.

2.2.1. CNN-Based Models

Benefiting from strong local feature extraction capabilities, CNN-based methods have long dominated the field of semantic segmentation. Starting from the Fully Convolutional Network (FCN), these methods replace fully connected layers with convolutional layers to achieve end-to-end dense prediction.
DeepLabv3+ [17] employs an encoder–decoder architecture. In the decoder, after the input image is fed into the backbone, two feature layers are generated. The shallow feature layer is directly convolved with a 1 × 1 convolution, while the deep features are fed into the Atrous Spatial Pyramid Pooling (ASPP) module. The ASPP module contains multiple parallel atrous convolutions and a global image pooling module.
DANet [18] is a CNN-based model that emphasizes the attention mechanism, incorporating two types of attention modules in addition to dilated FCN. The position attention module and channel attention module are used to simultaneously capture spatial interdependencies and channel interdependencies.

2.2.2. Transformer-Based

Breaking the limitations of local receptive fields in CNNs, Transformer-based methods have revolutionized semantic segmentation by leveraging the powerful global contextual modeling capability of self-attention mechanisms.
Segmenter [21] is a Transformer-based model. Segmenter is built upon the ViT and extends it to semantic segmentation tasks. In the encoder, it projects image patches into a sequence of embeddings and then implements feature encoding with the Transformer. In the decoder, it adopts the Mask Transformer structure.
DC-Swin [34] is a remote sensing semantic segmentation model that primarily uses the Swin Transformer as its backbone network. It adopts the Swin Transformer as the backbone network to extract contextual information and designs a decoder equipped with a Densely Connected Feature Aggregation Module (DCFAM).
FT-UNetFormer [35] is constructed with a pure Transformer architecture. FT-UNetFormer is constructed by replacing the CNN encoder of UNetFormer (which will be described in detail below) with a pure Transformer architecture.

2.2.3. Hybrid

Hybrid segmentation models integrate the advantages of CNNs and Transformers, aiming to overcome the limitations of single-type architectures.
UNetFormer [35] is a lightweight remote sensing semantic segmentation model that combines CNN and Transformer architectures. Its decoder is designed based on Transformer, while the encoder employs a lightweight ResNet18 architecture. The feature maps output from each stage of the encoder are fused with those of the corresponding decoder layers via skip connections, forming a UNet-like architecture.

2.2.4. Mamba

The Mamba architecture efficiently captures global contextual information. Mamba is purpose-built for long-range dependency modeling, and its state space model (SSM)-based computation is characterized by high efficiency.
PyramidMamba [36] proposes a Mamba-based decoder that fully exploits dense spatial pyramid pooling and the selective mechanism of Mamba, which facilitates the generation of finer-grained multi-scale contexts and the elimination of homogeneous semantic redundancy.

3. Results

3.1. Experimental Settings

Evaluation Indicators: The evaluation metrics in this study include the Intersection–Union Ratio (IoU), F1-score (F1), Precision, Recall, mean F1 (mF1), Mean Intersection–Union Ratio (MIoU) and Overall Accuracy (OA).
For Dataset 1, the primary metrics are mIoU, mF1 and OA, while Dataset 2 employs rice-specific indicators, including Recall, Precision, IoU, and F1-score.
Experimental Design: The experimental platform in this study is equipped with an Intel® Core™ i9-12900H CPU, two NVIDIA GeForce RTX 4090 GPUs, 32 GB of RAM, and 16 GB of GPU memory per card.
According to previous studies and the parameter settings of each model, ResNet101 is used as the backbone network for DeepLabv3+ and DANet, ViT-Base for Segmenter, and Swin-Small for DC-Swin. With the exception of UNetFormer, which uses a small backbone network as a lightweight model, the parameters of all other comparative models are kept as close as possible, ensuring that the performance comparison across different architectural paradigms is conducted under similar model scale conditions. The batch size was 8. The training epoch was set as 200 epochs for Dataset 1 and 100 epochs for Dataset 2.
With reference to the original papers of each algorithm and their favorable experimental results, we tested SGD with momentum, the AdamW optimizer, and two learning rate scheduling strategies—polynomial learning rate decay and cosine annealing with warm restarts—and the best-performing parameter combination was ultimately determined as the final setting for each algorithm individually, as shown in Table 1.
The influence of different backbone networks on model performance will be discussed in detail in the following section.

3.2. Comparison of Algorithms on Dataset 1

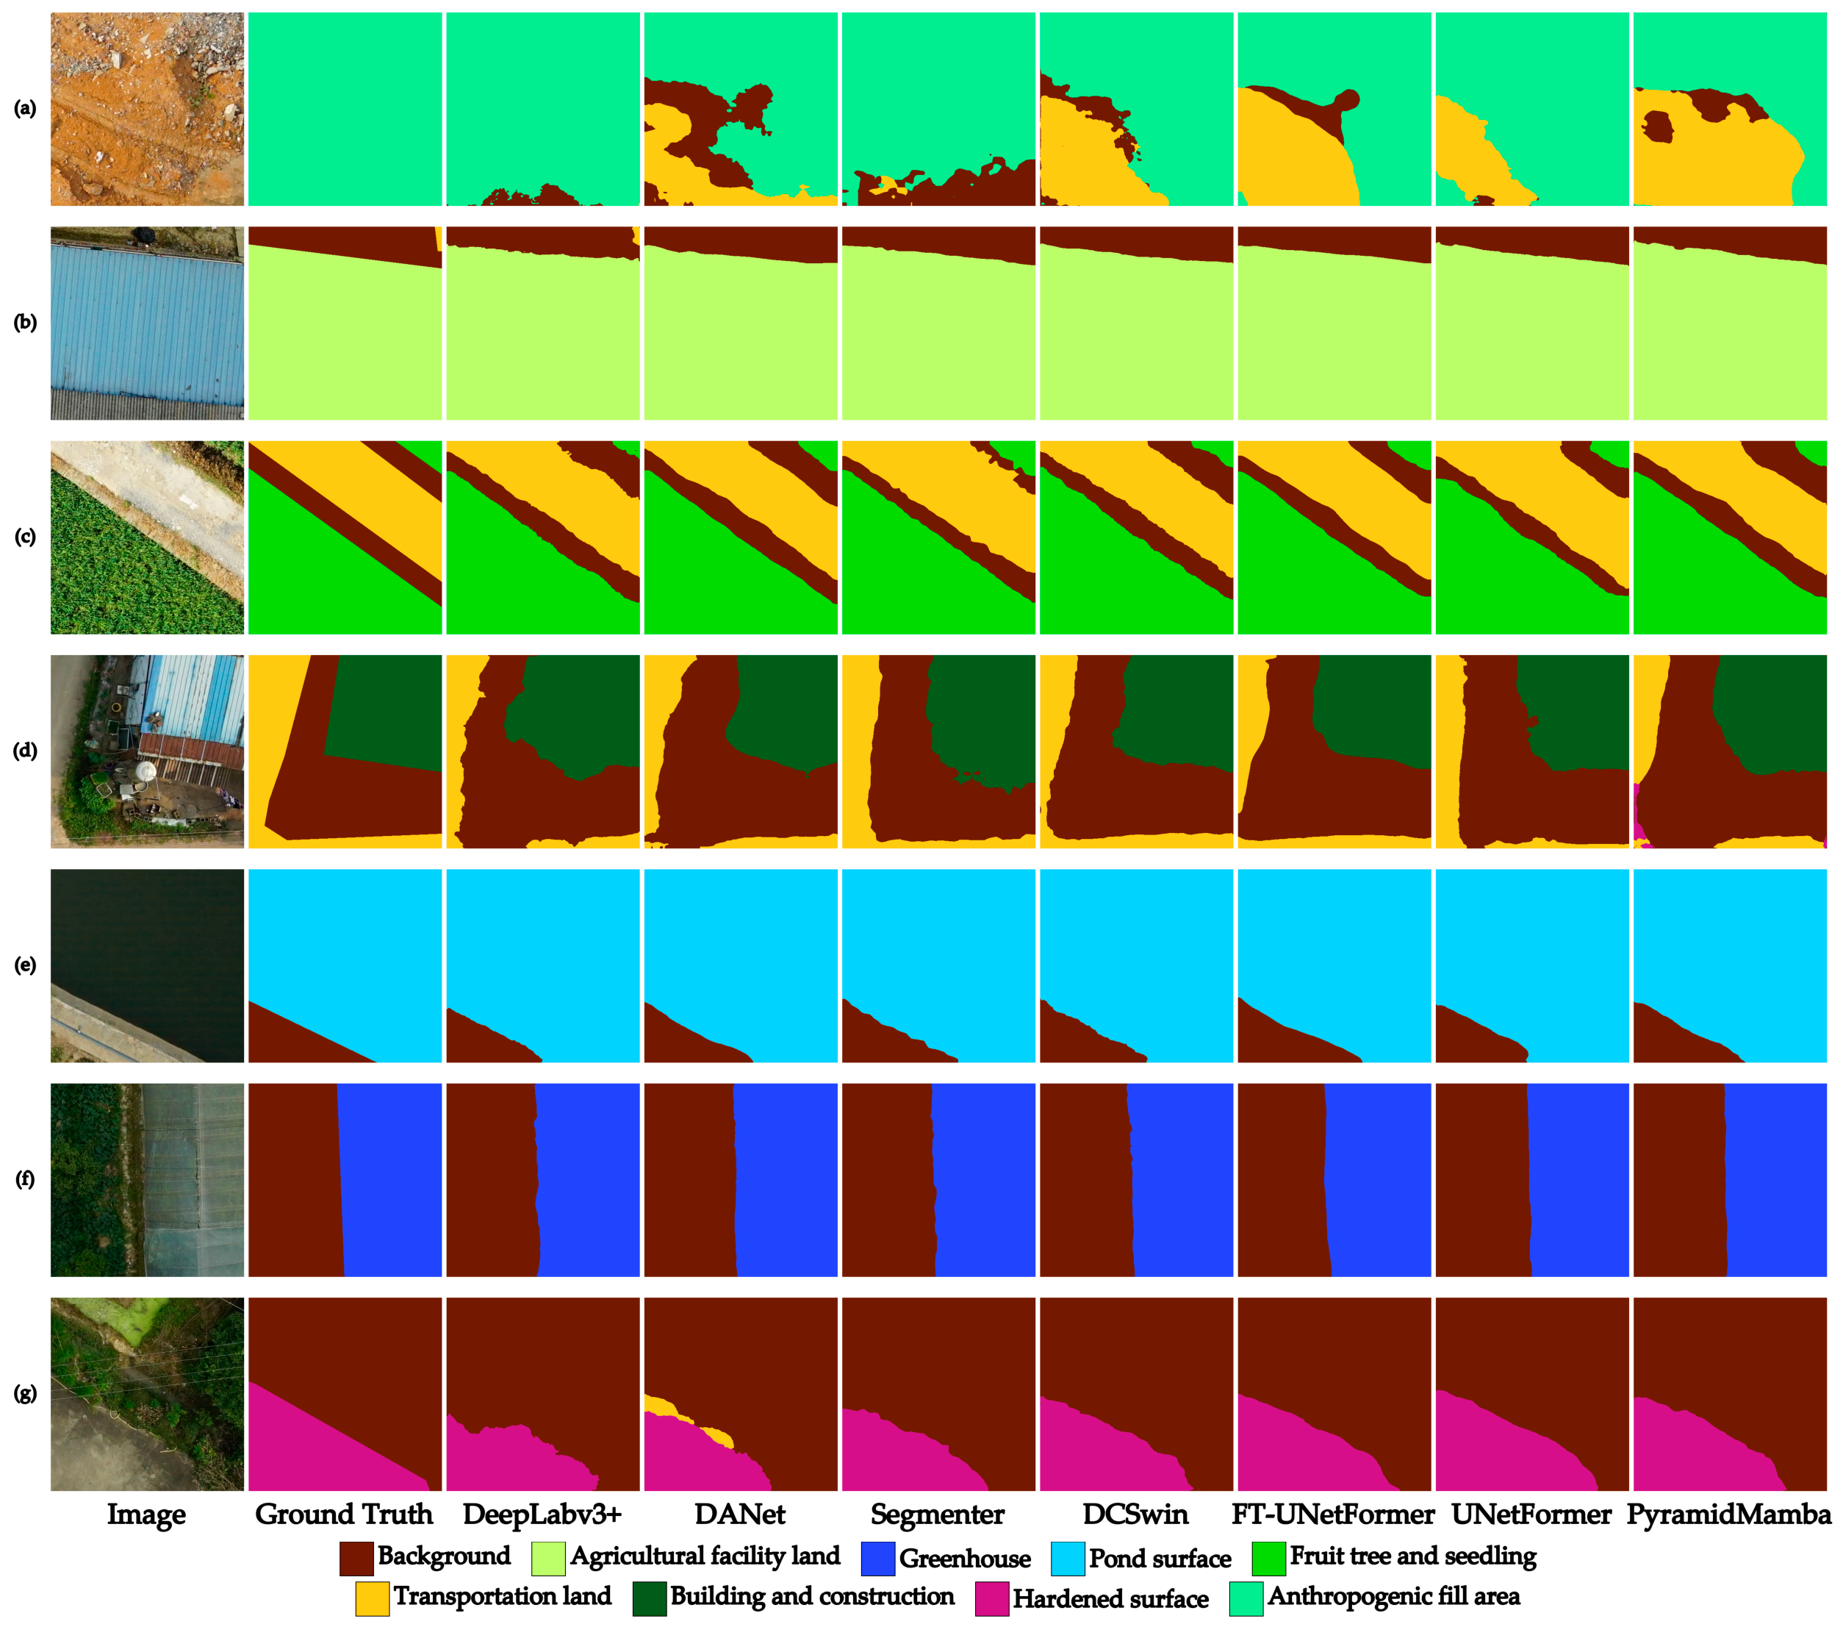
The optimal results achieved by each algorithm are listed in Figure 7.
Overall, from the comparison figures, DC-Swin, FT-UNetFormer and PyramidMamba achieved an overall superior performance. The boundaries of various ground objects segmented by these three algorithms are relatively smoother, with fewer burrs, and align better with the label images. Segmenter, DANet and DeepLabv3+ exhibit severe burrs at the object boundaries.
Notably, building structures in such rural areas are often subject to strong interference from auxiliary structures, debris adjacent to buildings, and other disturbances.
The quantitative results in Table 2 are basically consistent with the above analysis. DC-Swin achieves the best mIoU and mF1, while FT-UNetFormer obtains the highest OA. Overall, the algorithms designed specifically for remote sensing images outperform generic visual models. For DeepLabv3+, DANet, and Segmenter, the mIoU values are 76.89%, 79.32%, and 75.18%, the mF1 values are 86.23%, 87.96%, and 84.58%, and the OA values are 90.88%, 92.21%, and 91.24%, respectively, which are generally lower than those of mainstream remote sensing semantic segmentation models.

3.3. Comparison of Algorithms on Dataset 2

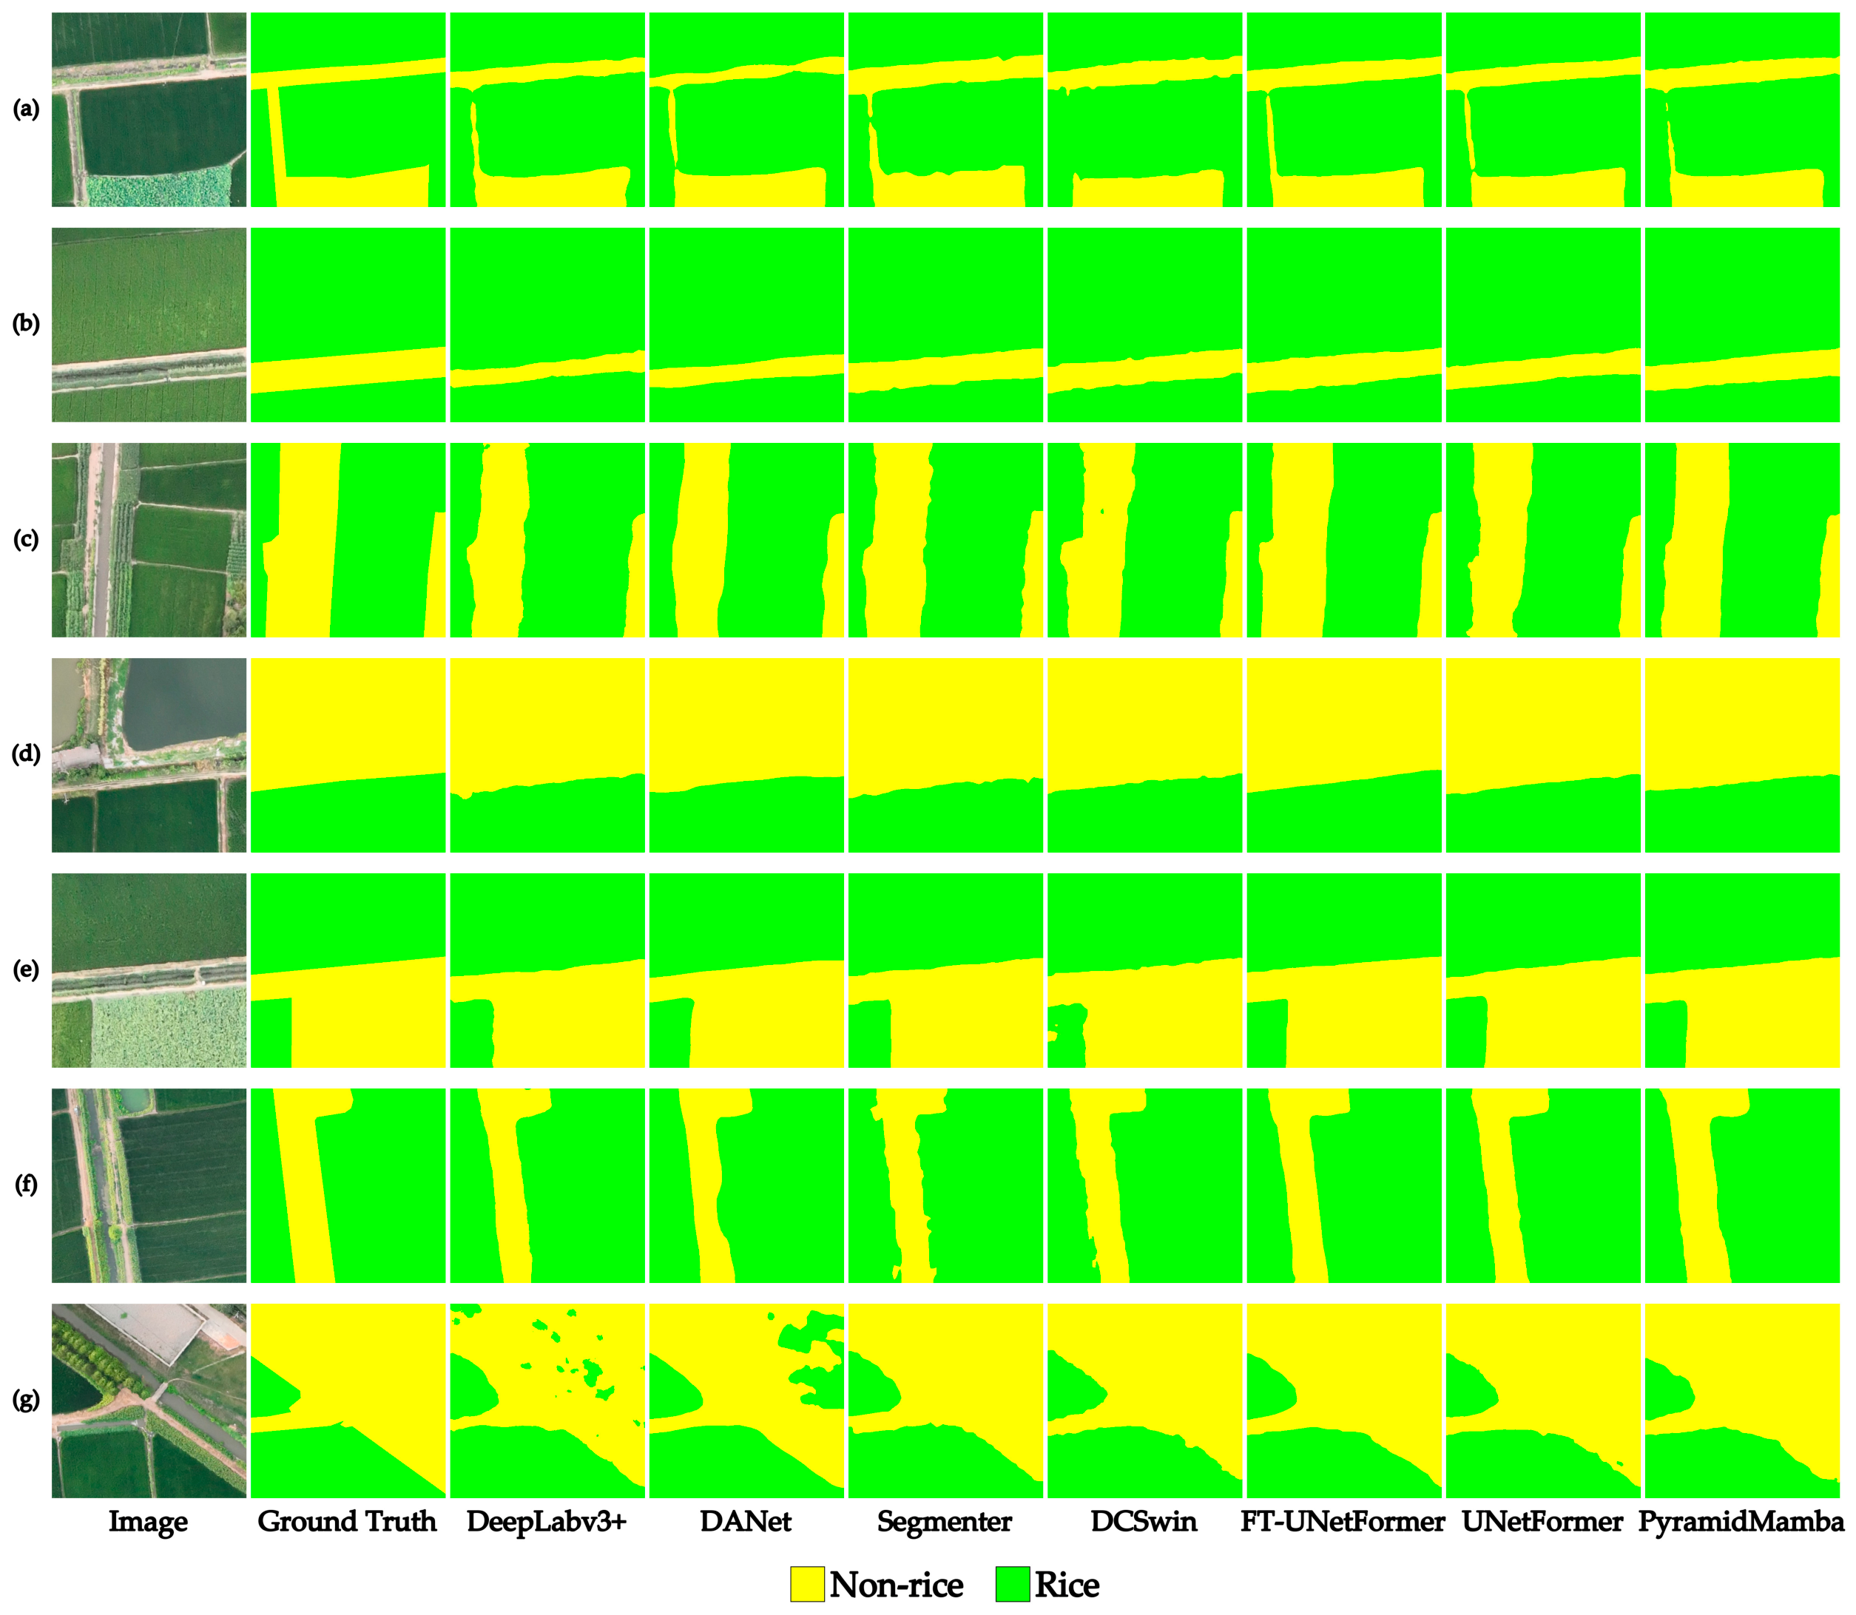
Figure 8 and Table 3 illustrate the qualitative and quantitative accuracy assessment results for rice extraction. In the prediction results of all compared methods, rice paddies can be effectively distinguished from other categories, including crops such as lotus, buildings, and ponds. As shown in Figure 8d,g, most algorithms achieve satisfactory identification results for ponds and small buildings. The main misclassifications are concentrated in regions such as those in Figure 8a and thin linear roads. DeepLabv3+ achieves acceptable overall performance in rice paddy segmentation, but it has low accuracy in boundary delineation. Pixels in adjacent non-rice and rice regions are confused, leading to many mis-segmented pixels in the edge areas. For example, in Figure 8g, the sharp boundaries of rice paddies are segmented into arc-shaped contours. Similar to DeepLabv3+, DANet shows low segmentation accuracy for rice paddy boundaries and narrow linear roads. The rice paddy boundaries predicted by Segmenter have numerous burrs, with large errors in narrow regions and coarse boundary segmentation.
In contrast, DC-Swin, FT-UNetFormer and PyramidMamba all achieve favorable extraction performance for fine structures, including narrow linear roads. Among them, FT-UNetFormer achieves the best overall performance and can satisfactorily segment the extent and boundaries of the rice paddy area. The algorithm shows strong adaptability to rice paddies of various shapes and sizes, with relatively few misclassifications and omissions. The prediction results are in the best agreement with the ground truth, and the extracted boundaries are the most consistent with the reference annotations.
Overall, remote sensing semantic segmentation models present certain performance advantages over general visual models. DC-Swin, FT-UNetFormer and PyramidMamba all achieve superior results. Among them, FT-UNetFormer achieves the best scores in this dataset, reaching 96.35% for IoU and 98.14% for F1. Another notable characteristic of the overall results for Dataset 2 is that the differences between Recall and Precision for rice are relatively small.

4. Discussion

4.1. Analysis of Model Architectures

The results demonstrate that Transformer-based remote sensing semantic segmentation models outperform generic vision models. In contrast, Segmenter achieves less satisfactory results for Dataset 1. This is because ViT-based models need many more training samples than CNN to learn the local characteristics of visual data [37], and these experimental findings are consistent with the general consensus in the deep learning community. Thus, how the Transformer components are employed and the design of other structural components of the model both play a critical role in the remote sensing image tasks of this study. For instance, the CNN-Transformer hybrid lightweight model UNetFormer, with only 11.7 M parameters, achieves competitive segmentation accuracy through elaborately designed local–global feature fusion, which fully verifies that rational architectural optimization can effectively balance segmentation performance and model scale. Furthermore, PyramidMamba, built on the selective state space model (SSM), delivers outstanding overall performance on this task.
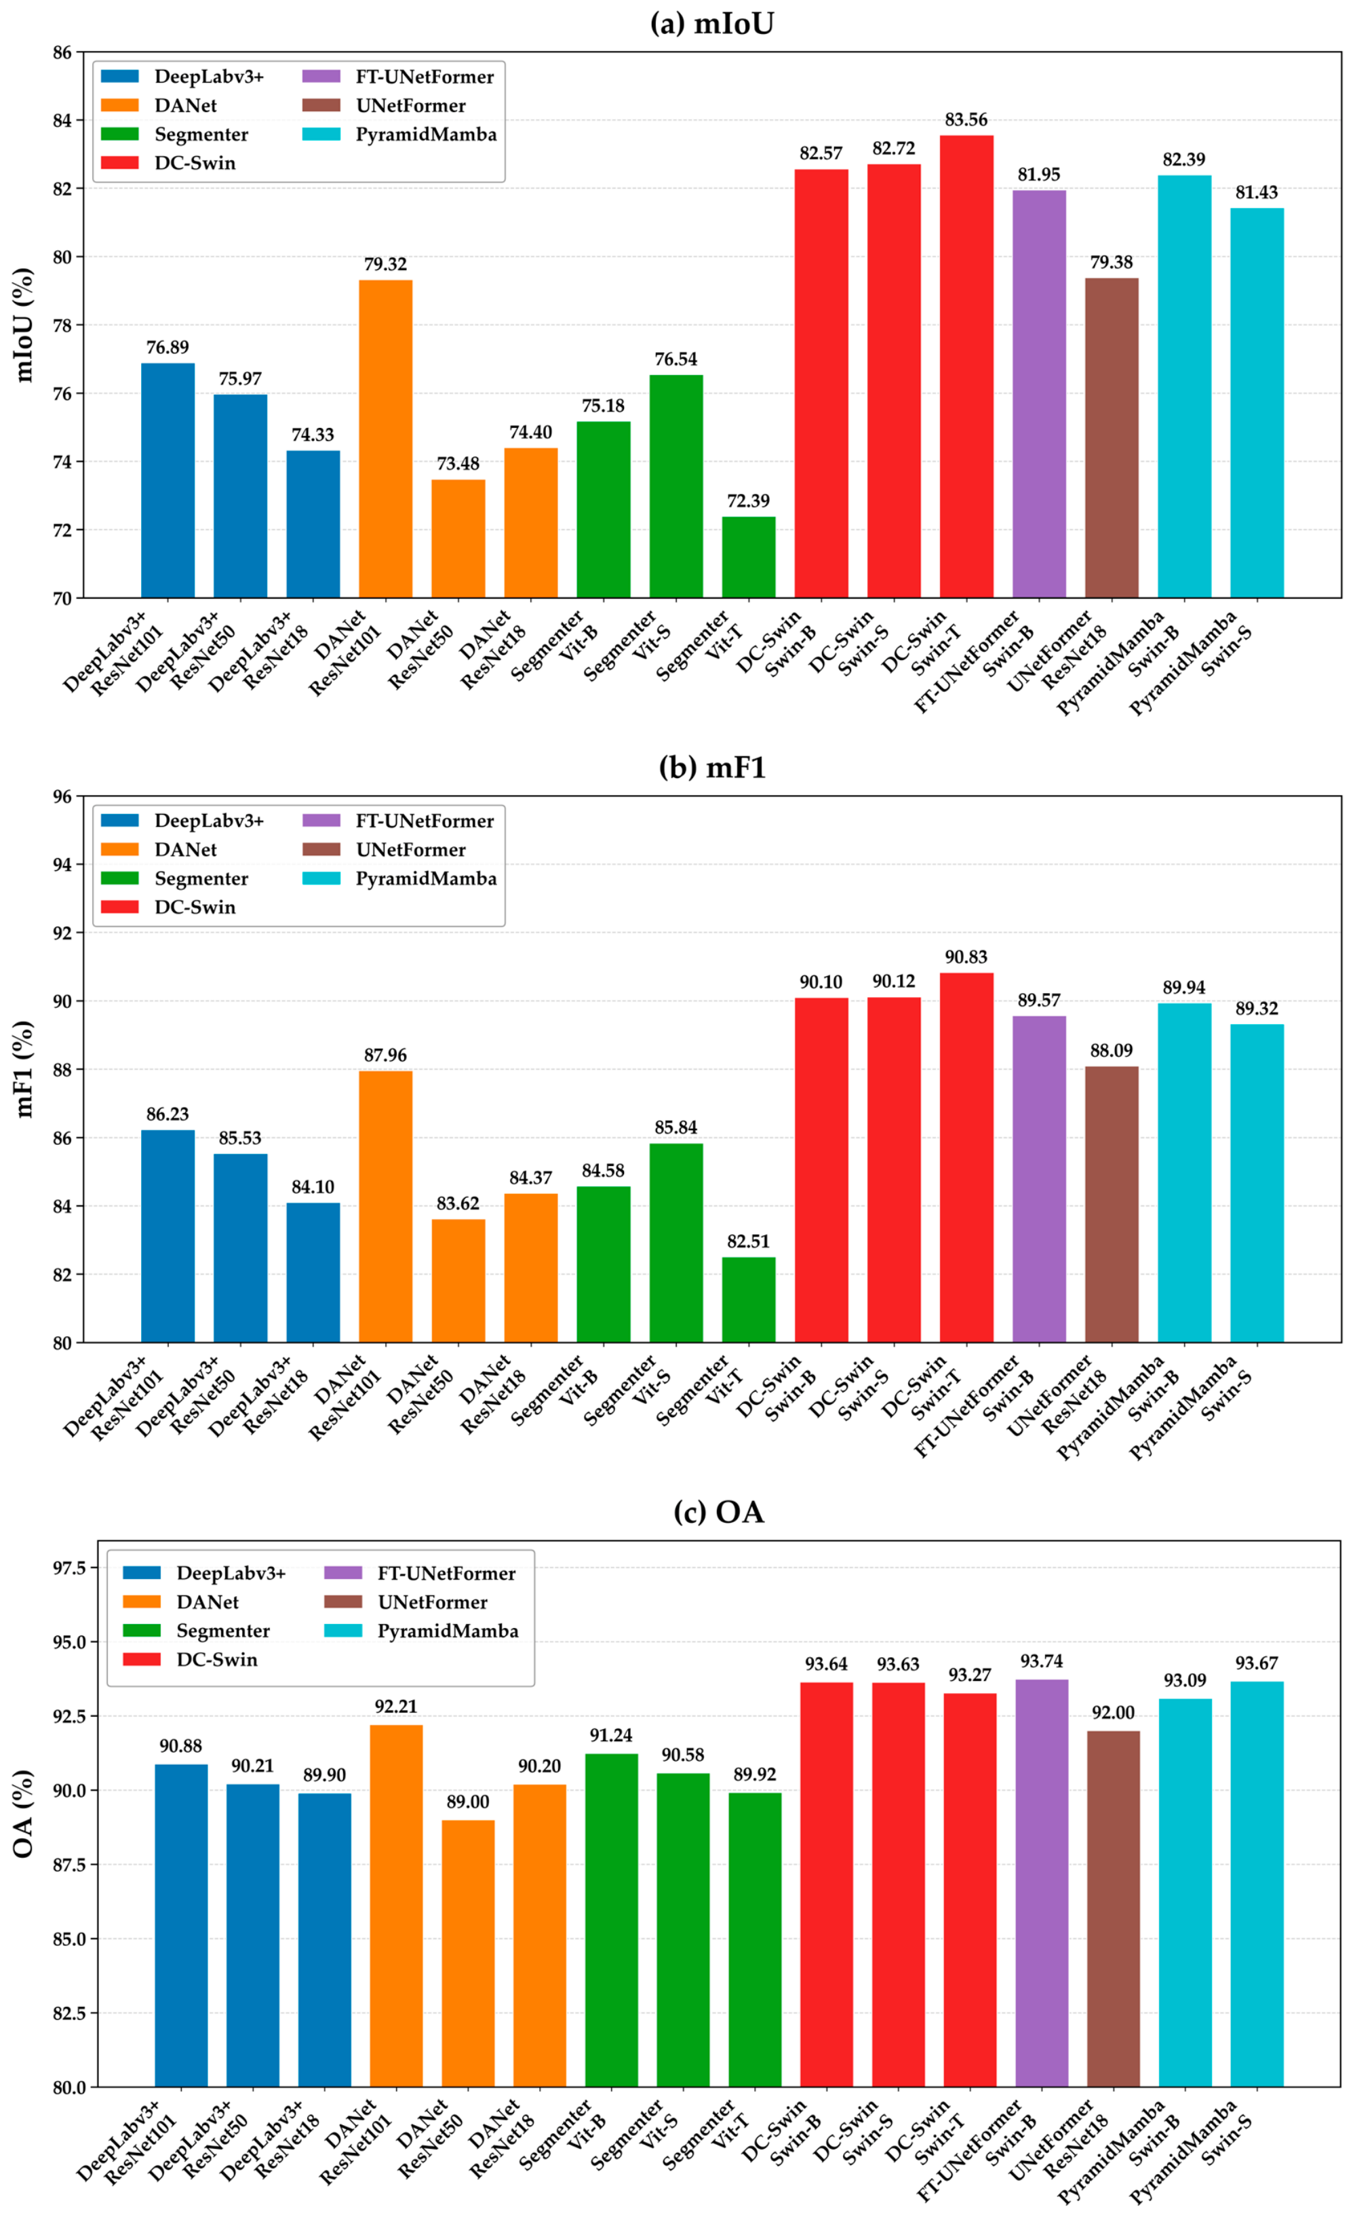
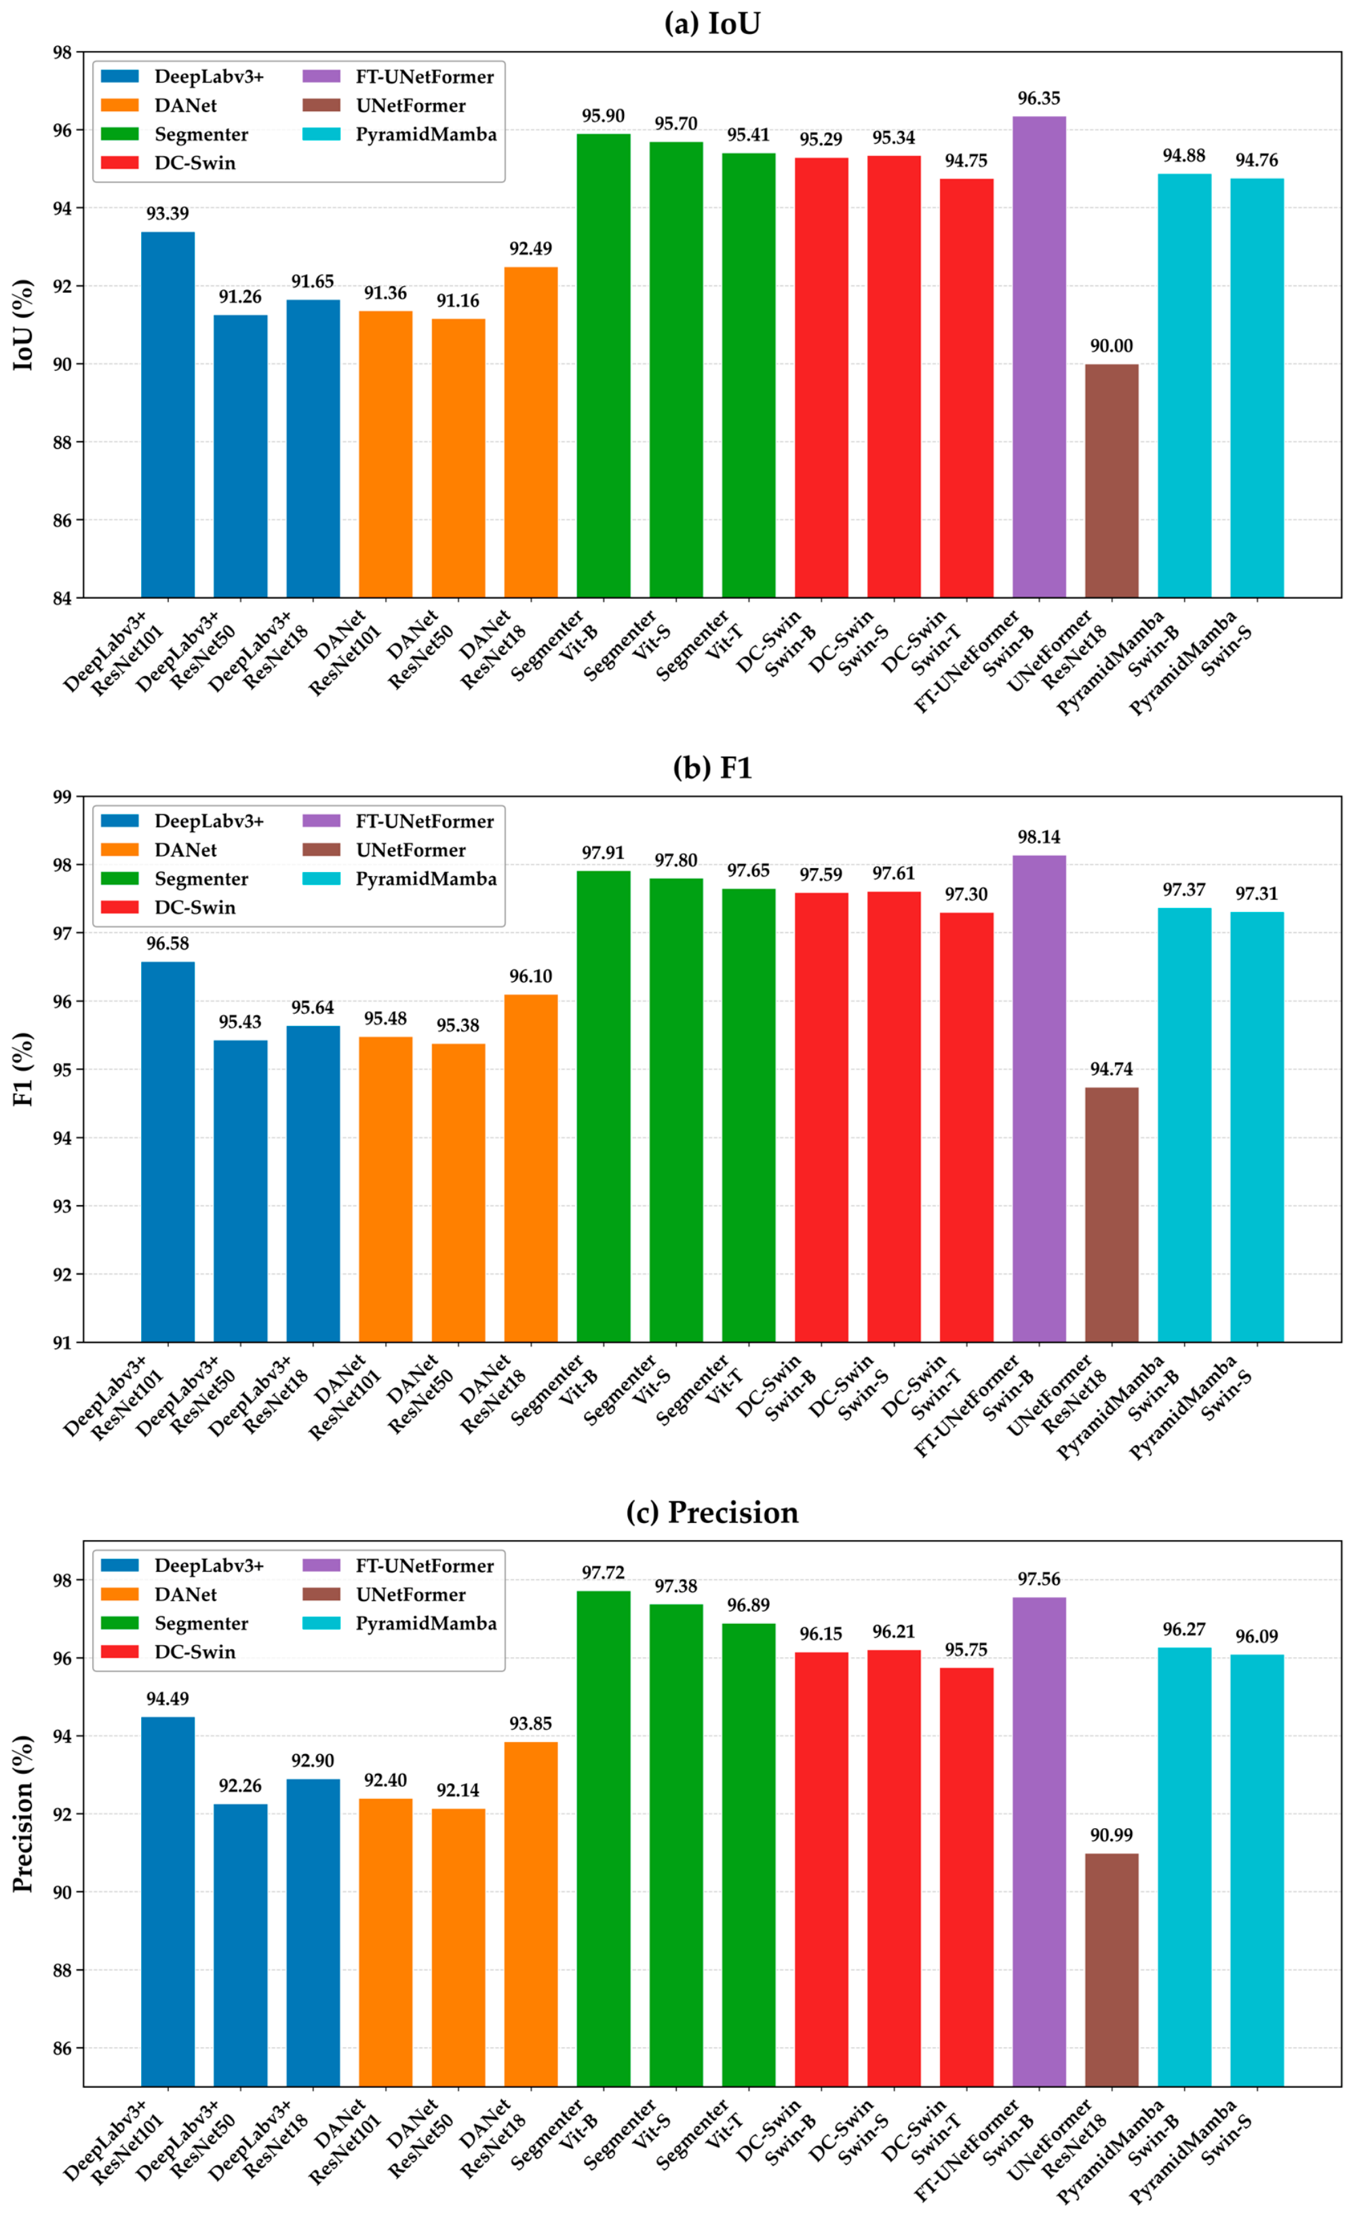
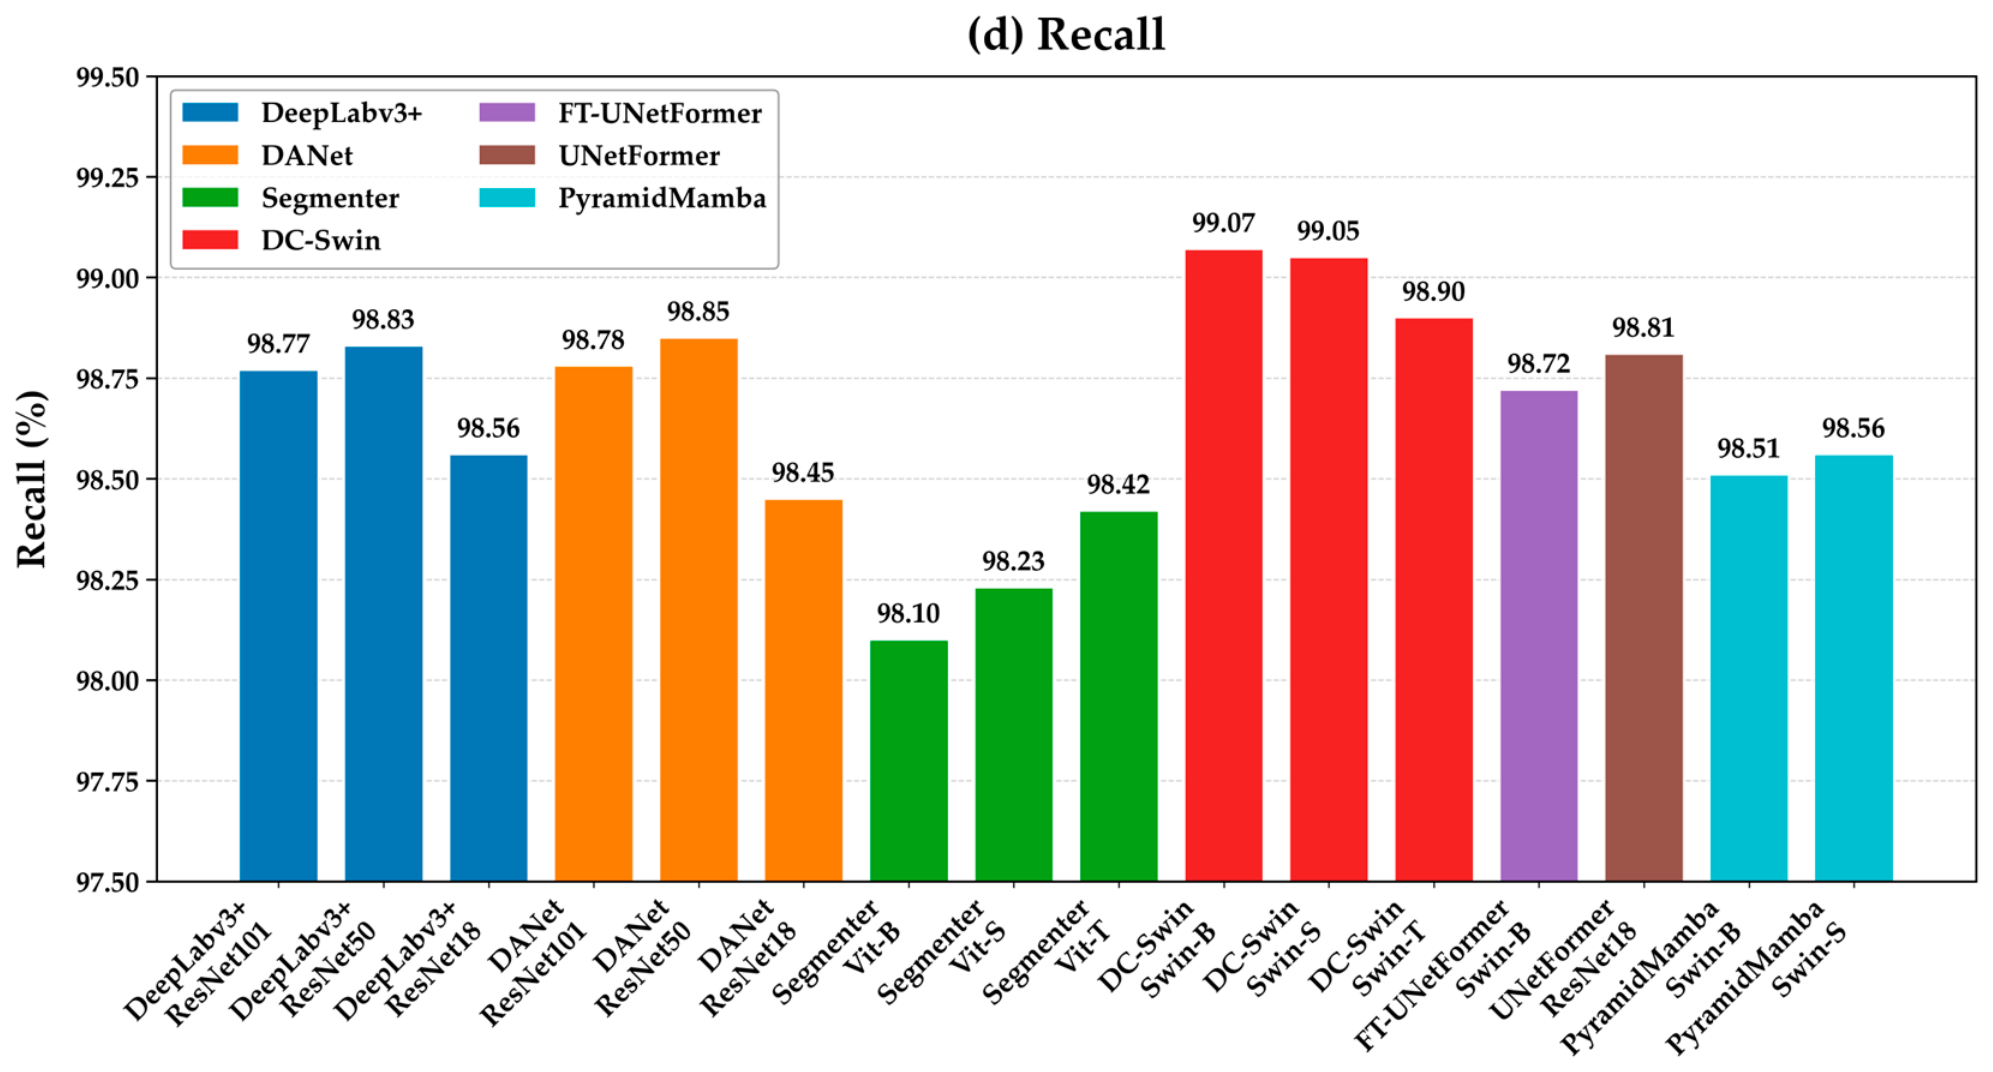
Next, we evaluate the impacts of the depth of the backbone. Figure 9 and Figure 10 illustrate the influence of different backbone networks.
The results indicate that the backbone network exerts a more substantial influence on the segmentation performance for Dataset 1. For example, for Dataset 1, in DeepLabv3plus and DANet, when the depth of the ResNet backbone is increased from 18 to 101, the mIoU improves by 2.56% (from 74.33% to 76.89%) and 4.92% (from 74.40% to 79.32%), respectively. The corresponding improvements in the mF1 are 2.13% and 3.59%. By contrast, for Dataset 2, increasing the ResNet backbone depth from 18 to 101 only brings marginal performance gains for all models. Furthermore, increasing the depth of both CNN and Transformer backbones may even lead to performance degradation in some cases.
This indicates that, for the relatively simple task of rice extraction, it is unnecessary to pursue large-parameter models when selecting network architectures—especially with small datasets.

4.2. Analysis of Accuracy for Different Land Cover Types

Table 4 presents the IoU values of different land cover types across all evaluated algorithms.
Overall, all algorithms achieve favorable performance for regular and clearly bounded features such as greenhouse and pond surface, with IoU values above 90% for both classes across all methods. Building and construction correspond to the class with the lowest segmentation accuracy.
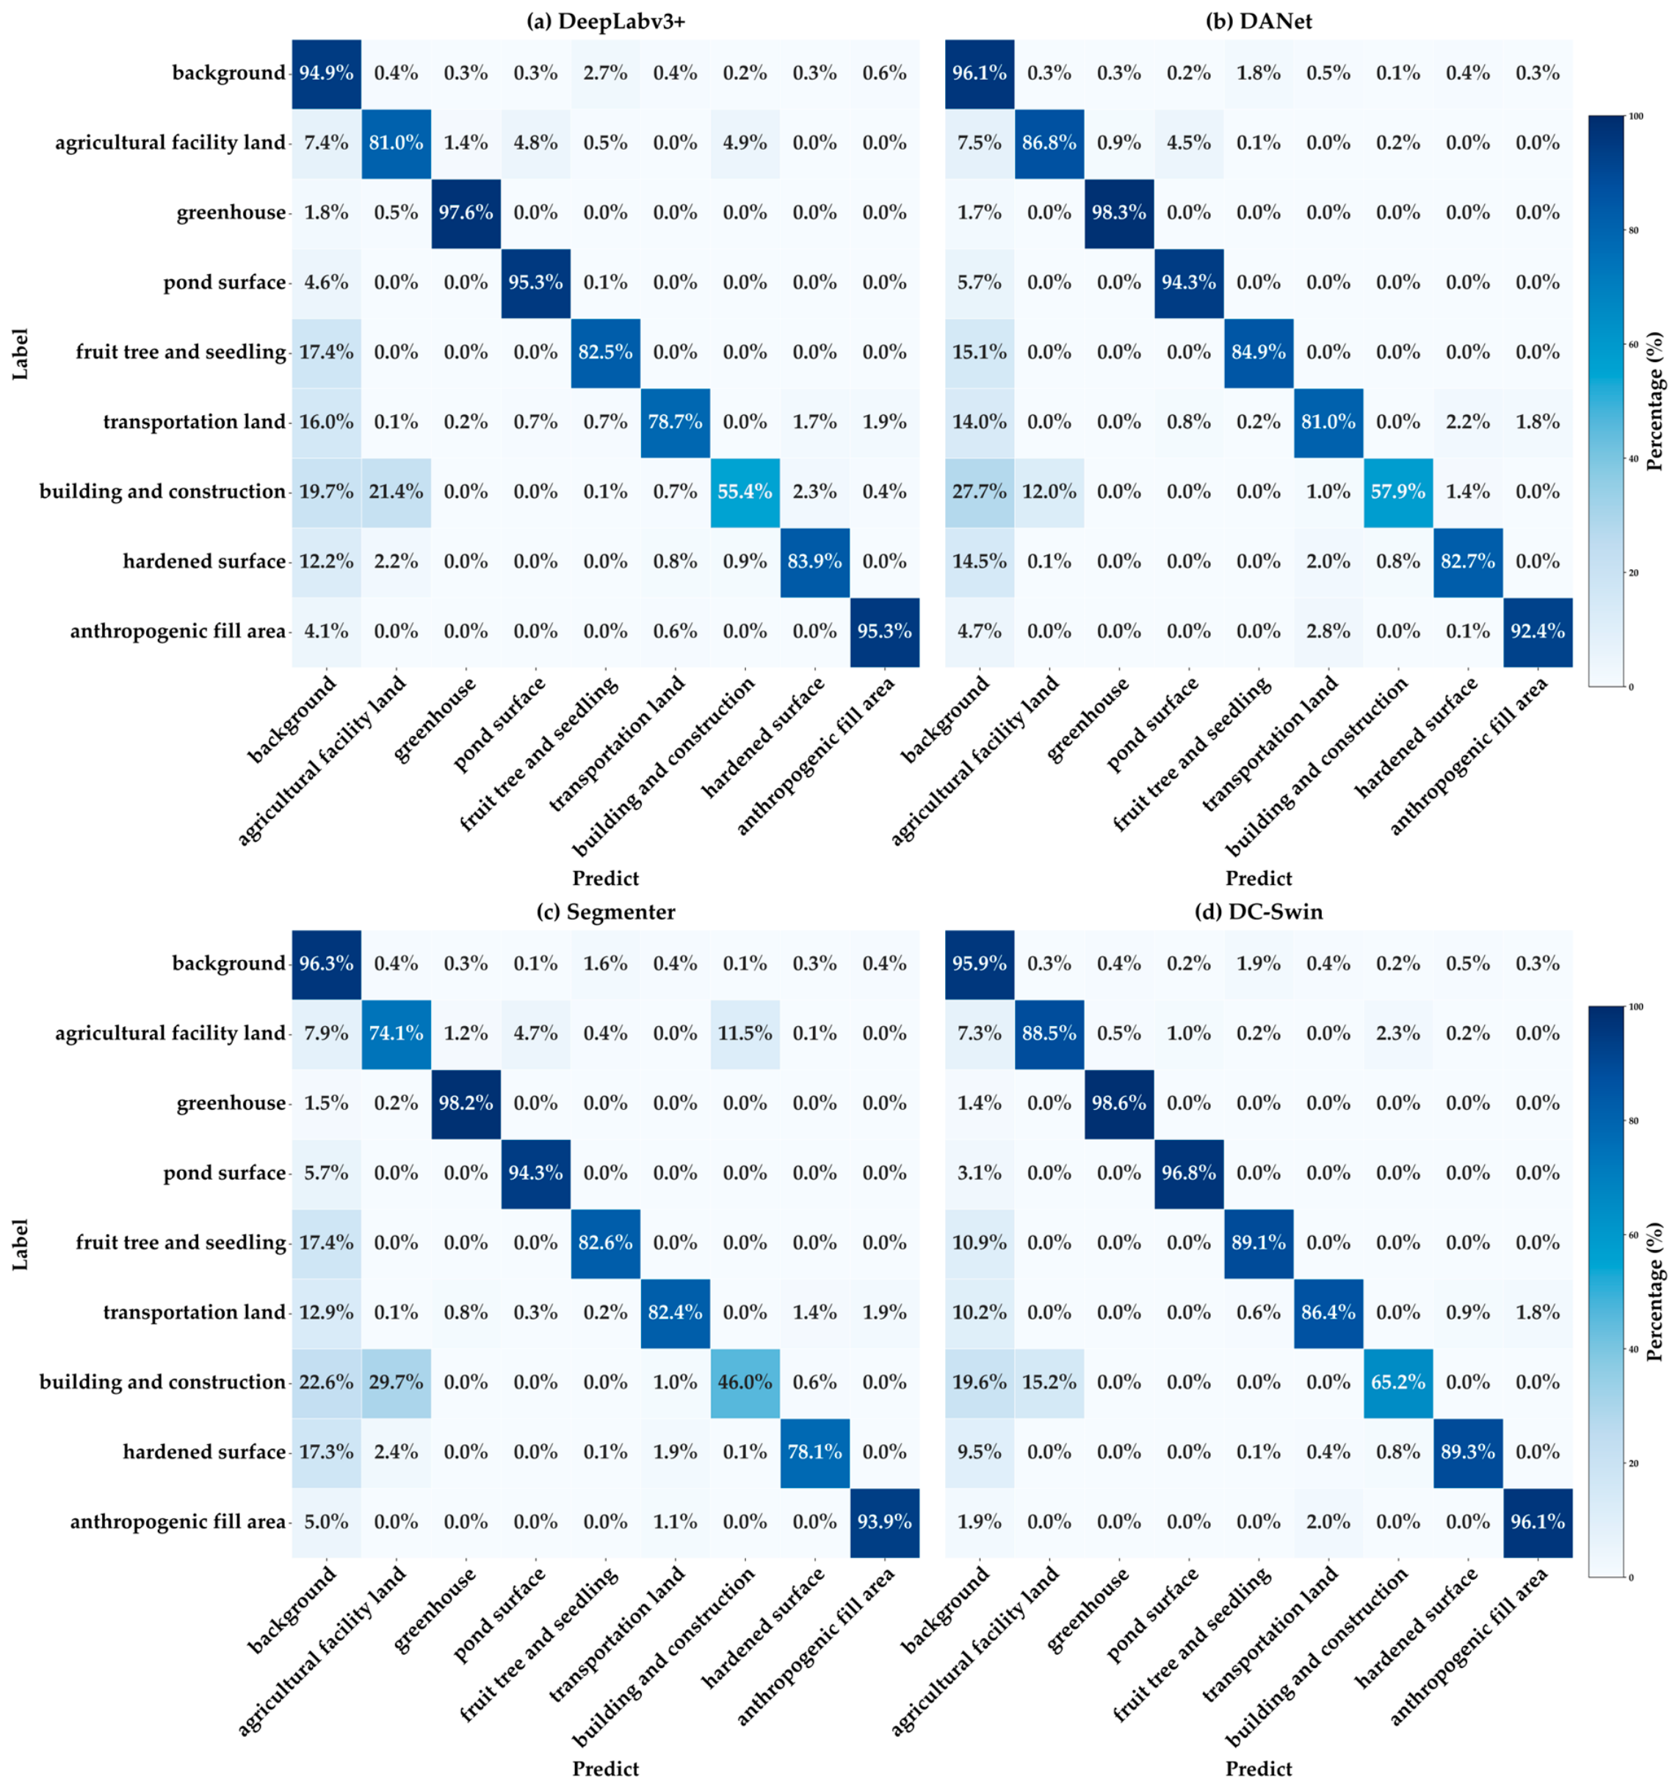
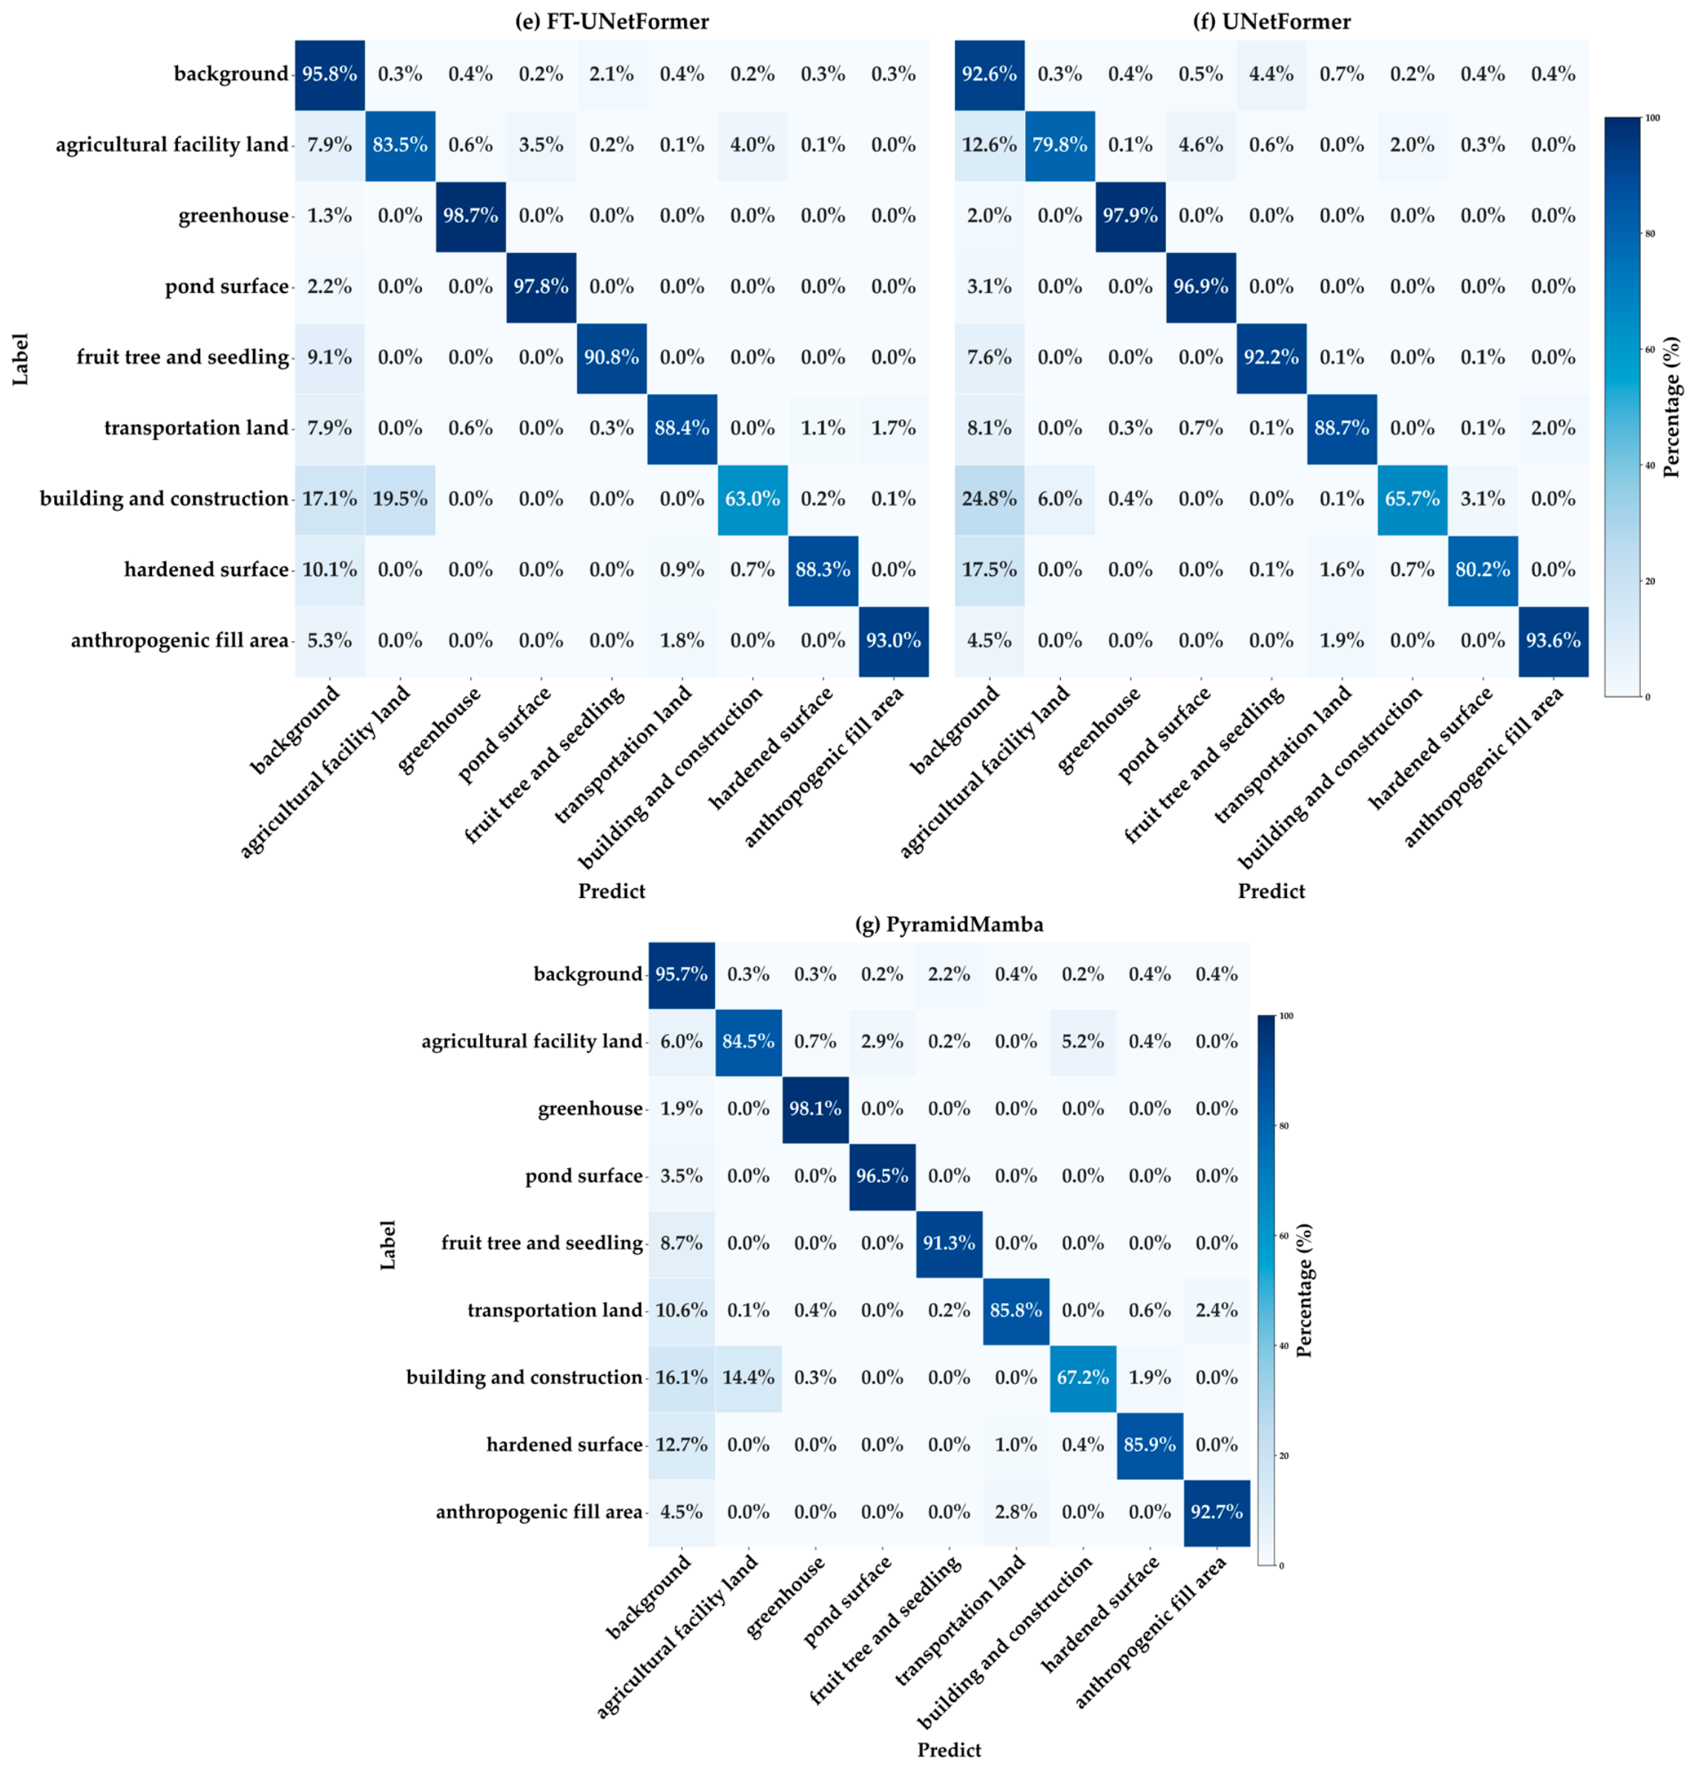
DC-Swin achieves the highest IoU for agricultural facility land (78.74%), greenhouse (94.97%), pond surface (94.71%), and anthropogenic fill area (88.64%), respectively. UNetFormer obtains the highest IoU for the building and construction class. FT-UNetFormer achieves the best IoU for background, transportation land, and hardened surface. PyramidMamba achieves the best IoU for fruit tree and seedling. Figure 11 shows the confusion matrix (row-normalized, %).
The segmentation of building and construction poses the greatest challenge, which mainly manifests in the misclassification of such features into background and agricultural facility land. The main reasons are as follows. First, the spectral tone and texture of the same building show considerable variations in the imagery, which tend to cause the incomplete extraction and partial omission of building structures. At the same time, agricultural facility land and buildings are highly confusing in this task, which further leads to relatively low segmentation accuracy.
As a mixed class, the background is prone to considerable confusion with other classes. For instance, woodlands and fruit trees exhibit high visual similarity in images, which results in misclassification. In addition, hardened surfaces suffer from frequent omission errors, mainly because they are often covered with various debris.
For the majority class background, the Recall of all models consistently remains above 92%, delivering the highest accuracy and the smallest inter-model fluctuation among all categories. Abundant training samples ensure that models can sufficiently learn the feature representations of this class.
For the middle-tier categories, including greenhouse, pond surface, fruit tree and seedling, and anthropogenic fill area, most models achieve moderate Recall rates, showing overall satisfactory performance. The sample volume is sufficient for supporting models in capturing their core discriminative features.
For minority classes like building and construction and agricultural facility land, the combined results of pixel distribution and confusion matrices demonstrate that, beyond the inherent impact of class imbalance, the spectral similarity between categories further exacerbates the adverse effects of imbalance.
Specifically, the anthropogenic fill area class accounts for only a tiny fraction of the pixel volume of the background class. Nevertheless, thanks to its distinctive land cover spectral and textural features, most models still achieve high Recall for this class, with an extremely low misclassification rate.
In stark contrast, the two categories of building and construction and agricultural facility land both rank in the lowest tier in terms of sample size and share highly similar spectral characteristics. With insufficient training samples, models struggle to learn robust classification boundaries between the two classes.

5. Conclusions

This study focuses on deep learning-based semantic segmentation for the non-grain and non-agriculturalization monitoring of cropland. We constructed two datasets dedicated to identifying non-grain and non-agriculturalization activities on cropland. Dataset 1 consists of UAV images and defines nine classes: background, agricultural facility land, greenhouse, pond surface, fruit tree and seedling, transportation land, buildings and construction, hardened surface, and anthropogenic fill area. Dataset 2 is composed of approximately 0.1 m UAV images and is labeled into two categories: rice and non-rice.
We evaluated seven semantic segmentation models—DeepLabv3+, DANet, Segmenter, DC-Swin, FT-UNetFormer, UNetFormer and PyramidMamba—for both datasets and achieved satisfactory and practical results.
The results indicate that remote sensing semantic segmentation models outperform generic vision models for the datasets employed in this study. Even though some models used in this study, such as UNetFormer, were originally designed for urban scenes, they still achieved superior performance in our experiments in Dataset 2. Nevertheless, they still exhibit certain limitations in the spatially independent generalization tests.
The selection of the backbone network size should consider multiple factors; for relatively simple segmentation tasks, a lightweight backbone is already sufficient to meet the performance requirements.
Due to the unique ground object segmentation requirements of CNNM (e.g., agricultural facility buildings), the recognition of relevant categories still has shortcomings. For example, the identification of building and construction is a core challenge in this semantic segmentation research. Different from conventional building segmentation, this challenge not only relies on the intrinsic characteristics of ground objects themselves but is also affected by global information such as the spatial correlation of surrounding landscapes. The above research conclusions can provide guidance for future relevant research and the targeted optimization of network architectures in this field.
There remain certain limitations in the experimental setup of this study. Dataset 1 adopts random sample partitioning instead of strict spatially independent splitting. Owing to the spatial autocorrelation inherent in remote sensing imagery, samples from adjacent areas share highly similar texture patterns and ground object features. The spatial data leakage issue arising from random partitioning is not further discussed in the original manuscript, which may lead to an overestimation of the model’s generalization performance for completely unseen geographic regions.
For future work, we will further expand the dataset scale and construct cross-regional spatially independent validation datasets to more comprehensively evaluate the practical generalization ability of models in unknown regions, so as to provide more robust support for the engineering application of cropland remote sensing interpretation algorithms.
Furthermore, follow-up research can further deepen the identification of special categories such as forest crops characterized by a multi-story structure, so as to broaden the research perspective of this work.

Author Contributions

Conceptualization, Z.D. and J.X.; methodology, P.Y., M.C. and J.X.; software, S.X., J.X. and P.Y.; validation, J.T. and S.X.; formal analysis, M.C.; investigation, Z.D.; resources, Z.D.; data curation, T.W.; writing—original draft preparation, J.X.; writing—review and editing, M.C., J.Z. and X.W.; visualization, T.W.; project administration, Z.D.; funding acquisition, Z.D. and M.C. All authors have read and agreed to the published version of the manuscript.

Funding

This research was funded by: National-level Field Verification of National Land Use Change Survey (Changsha Center), Grant No. DD20230800313; National-level Verification of Land Use Change Survey (Changsha Center), Grant No. DD202607202912; The Research and Application Demonstration of Key Technologies for the Construction of an Intelligent Interpretation Sample and Spectral Database for Remote Sensing of Natural Resources, Grant No. 2023ZRBSHZ021; Hunan Province Intellectual Property Strategy Promotion Special Project, Grant No. 2025F002R.

Data Availability Statement

The datasets presented in this article are not readily available because the data are sensitive and confidential natural resource data. Requests to access the datasets should be directed to the corresponding author.

Acknowledgments

We would like to thank the anonymous reviewers for their constructive and valuable suggestions on the earlier drafts of this manuscript.

Conflicts of Interest

The authors declare no conflicts of interest.

References

  1. Hao, Q.L.; Zhang, T.Y.; Cheng, X.H.; He, P.; Zhu, X.K.; Chen, Y. GIS-based non-grain cultivated land susceptibility prediction using data mining methods. Sci. Rep. 2024, 14, 17. [Google Scholar] [CrossRef]
  2. Zhao, X.; Zheng, Y.; Huang, X.; Kwan, M.-P.; Zhao, Y. The Effect of Urbanization and Farmland Transfer on the Spatial Patterns of Non-Grain Farmland in China. Sustainability 2017, 9, 1438. [Google Scholar] [CrossRef]
  3. Pan, S.L.; Di, C.H.; Qu, Z.G.; Chandio, A.A.; Rehman, A.; Zhang, H.Q. How do agricultural subsidies affect farmers’ non-grain cultivated land production? Evidence from the fourth rural Chinese households panel data survey. Econ. Polit. 2024, 41, 153–171. [Google Scholar] [CrossRef]
  4. Abou El-Magd, I.; Tanton, T.W. Improvements in land use mapping for irrigated agriculture from satellite sensor data using a multi-stage maximum likelihood classification. Int. J. Remote Sens. 2003, 24, 4197–4206. [Google Scholar] [CrossRef]
  5. Cai, L.P.; Wang, H.; Liu, Y.X.; Fan, D.L.; Li, X.X. Is potential cultivated land expanding or shrinking in the dryland of China? Spatiotemporal evaluation based on remote sensing and SVM. Land Use Policy 2022, 112, 10. [Google Scholar] [CrossRef]
  6. Hu, T.G.; Zhu, W.Q.; Yang, X.Q.; Pan, Y.Z.; Zhang, J.S. Farmland Parcel Extraction Based on High Resolution Remote Sensing Image. Spectrosc. Spectr. Anal. 2009, 29, 2703–2707. [Google Scholar] [CrossRef]
  7. Zhang, D.; Pan, Y.; Zhang, J.; Hu, T.; Zhao, J.; Li, N.; Chen, Q. A generalized approach based on convolutional neural networks for large area cropland mapping at very high resolution. Remote Sens. Environ. 2020, 247, 23. [Google Scholar] [CrossRef]
  8. Zhang, D.J.; Zhu, X.F.; Pan, Y.Z.; Guo, H.L.; Li, Q.N.; Wei, H.T. Comparative Analysis of Deep Learning and Traditional Methods for High-Resolution Cropland Extraction with Different Training Data Characteristics. Land 2025, 14, 2038. [Google Scholar] [CrossRef]
  9. Wang, F.; Zhang, L.Z.; Jiang, T.; Li, Z.Q.; Wu, W.Y.; Kuang, Y.C. An Improved Segformer for Semantic Segmentation of UAV-Based Mine Restoration Scenes. Sensors 2025, 25, 3827. [Google Scholar] [CrossRef] [PubMed]
  10. Shelhamer, E.; Long, J.; Darrell, T. Fully Convolutional Networks for Semantic Segmentation. IEEE Trans. Pattern Anal. Mach. Intell. 2017, 39, 640–651. [Google Scholar] [CrossRef] [PubMed]
  11. Ronneberger, O.; Fischer, P.; Brox, T. U-net: Convolutional networks for biomedical image segmentation. In Proceedings of the International Conference on Medical Image Computing and Computer-Assisted Intervention, Munich, Germany, 5–9 October 2015; pp. 234–241. [Google Scholar]
  12. Badrinarayanan, V.; Kendall, A.; Cipolla, R. SegNet: A Deep Convolutional Encoder-Decoder Architecture for Image Segmentation. IEEE Trans. Pattern Anal. Mach. Intell. 2017, 39, 2481–2495. [Google Scholar] [CrossRef] [PubMed]
  13. Yu, F.; Koltun, V. Multi-scale context aggregation by dilated convolutions. arXiv 2015, arXiv:1511.07122. [Google Scholar]
  14. Wu, H.; Zhang, J.; Huang, K.; Liang, K.; Yu, Y. Fastfcn: Rethinking dilated convolution in the backbone for semantic segmentation. arXiv 2019, arXiv:1903.11816. [Google Scholar]
  15. Guo, Z.; Bian, L.; Wei, H.; Li, J.; Ni, H.; Huang, X. DSNet: A Novel Way to Use Atrous Convolutions in Semantic Segmentation. IEEE Trans. Circuits Syst. Video Technol. 2025, 35, 3679–3692. [Google Scholar] [CrossRef]
  16. Chen, L.C.; Papandreou, G.; Kokkinos, I.; Murphy, K.; Yuille, A.L. DeepLab: Semantic Image Segmentation with Deep Convolutional Nets, Atrous Convolution, and Fully Connected CRFs. IEEE Trans. Pattern Anal. Mach. Intell. 2018, 40, 834–848. [Google Scholar] [CrossRef] [PubMed]
  17. Chen, L.-C.; Zhu, Y.; Papandreou, G.; Schroff, F.; Adam, H. Encoder-decoder with atrous separable convolution for semantic image segmentation. In Proceedings of the European Conference on Computer Vision, Munich, Germany, 8–14 September 2018; pp. 833–851. [Google Scholar]
  18. Fu, J.; Liu, J.; Tian, H.; Li, Y.; Bao, Y.; Fang, Z.; Lu, H. Dual Attention Network for Scene Segmentation. In Proceedings of the 2019 IEEE/CVF Conference on Computer Vision and Pattern Recognition (CVPR), Long Beach, CA, USA, 15–20 June 2019; pp. 3141–3149. [Google Scholar]
  19. Zhou, Q.; Qiang, Y.; Mo, Y.; Wu, X.; Latecki, L.J. Banet: Boundary-assistant encoder-decoder network for semantic segmentation. IEEE Trans. Intell. Transp. Syst. 2022, 23, 25259–25270. [Google Scholar] [CrossRef]
  20. Dosovitskiy, A.; Beyer, L.; Kolesnikov, A.; Weissenborn, D.; Zhai, X.; Unterthiner, T.; Dehghani, M.; Minderer, M.; Heigold, G.; Gelly, S. An image is worth 16x16 words: Transformers for image recognition at scale. arXiv 2020, arXiv:2010.11929. [Google Scholar]
  21. Strudel, R.; Garcia, R.; Laptev, I.; Schmid, C. Segmenter: Transformer for Semantic Segmentation. In Proceedings of the 2021 IEEE/CVF International Conference on Computer Vision (ICCV), Montreal, QC, Canada, 10–17 October 2021; pp. 7242–7252. [Google Scholar]
  22. Xie, E.; Wang, W.; Yu, Z.; Anandkumar, A.; Alvarez, J.M.; Luo, P. SegFormer: Simple and efficient design for semantic segmentation with transformers. Adv. Neural Inf. Process. Syst. 2021, 34, 12077–12090. [Google Scholar]
  23. Cao, H.; Wang, Y.; Chen, J.; Jiang, D.; Zhang, X.; Tian, Q.; Wang, M. Swin-unet: Unet-like pure transformer for medical image segmentation. In Proceedings of the European Conference on Computer Vision, Tel Aviv, Israel, 23–27 October 2022; pp. 205–218. [Google Scholar]
  24. Albarakati, H.M.; Khan, M.A.; Hamza, A.; Khan, F.; Kraiem, N.; Jamel, L.; Almuqren, L.; Alroobaea, R. A Novel Deep Learning Architecture for Agriculture Land Cover and Land Use Classification from Remote Sensing Images Based on Network-Level Fusion of Self-Attention Architecture. IEEE J. Sel. Top. Appl. Earth Obs. Remote Sens. 2024, 17, 6338–6353. [Google Scholar] [CrossRef]
  25. Li, H.P.; Tian, Y.J.; Zhang, C.; Zhang, S.Q.; Atkinson, P.M. Temporal sequence Object-based CNN (TS-OCNN) for crop classification from fine resolution remote sensing image time-series. Crop J. 2022, 10, 1507–1516. [Google Scholar] [CrossRef]
  26. Yang, H.; Yang, Z.Q.; Wu, Y.C.; Wang, C.L.; Wu, Y.L.; Zhang, P.; Wang, B. High-Resolution Remote Sensing Farmland Extraction Network Based on Dense-Feature Overlay Fusion and Information Homogeneity Enhancement. IEEE Geosci. Remote Sens. Lett. 2025, 22, 5. [Google Scholar] [CrossRef]
  27. Sun, Z.D.; Zhong, Y.F.; Wang, X.Y.; Zhang, L.P. Identifying cropland non-agriculturalization with high representational consistency from bi-temporal high-resolution remote sensing images: From benchmark datasets to real-world application. ISPRS-J. Photogramm. Remote Sens. 2024, 212, 454–474. [Google Scholar] [CrossRef]
  28. Liu, Z.Z.; Guo, J.H.; Li, C.H.; Wang, L.J.; Gao, D.K.; Bai, Y.L.; Qin, F. Effective Cultivated Land Extraction in Complex Terrain Using High-Resolution Imagery and Deep Learning Method. Remote Sens. 2025, 17, 931. [Google Scholar] [CrossRef]
  29. Zhang, W.L.; Rao, L.; Fan, G.Y.; Chen, N.S.; Cheng, S.L.; Song, X.Y.; Yang, D.Y. LaFormer: A Laplacian edge-guided transformer for farmland segmentation in remote sensing images. J. Appl. Remote Sens. 2025, 19, 20. [Google Scholar] [CrossRef]
  30. Chen, Y.Q.; Wang, X.X. Farmland Extraction from UAV Remote Sensing Images Based on Improved SegFormer Model. J. Indian Soc. Remote Sens. 2025, 53, 421–433. [Google Scholar] [CrossRef]
  31. Pan, J.P.; Qi, C.; Zhang, H.J.; Hu, Y.; Ren, Z.H.; He, Z.; Wang, X.X.; Li, Y.M.; Wang, Y.; Xie, J. KDANet: A farmland extraction network using band selection and dual attention fusion—A case study of paddy fields and irrigated land in Qingtongxia, China. Geocarto Int. 2025, 40, 25. [Google Scholar] [CrossRef]
  32. Huan, H.; Liu, Y.; Xie, Y.Q.; Wang, C.; Xu, D.D.; Zhang, Y. MAENet: Multiple Attention Encoder-Decoder Network for Farmland Segmentation of Remote Sensing Images. IEEE Geosci. Remote Sens. Lett. 2022, 19, 5. [Google Scholar] [CrossRef]
  33. Luo, G.H.; Li, H.; Li, J.Y.; Kang, A.Q.; Wu, H.; Yin, Z.C. MASNet: A Multitask Parallel Dual-Encoding Deep Learning Network for Farmland Parcel Segmentation. IEEE J. Sel. Top. Appl. Earth Obs. Remote Sens. 2025, 18, 29050–29070. [Google Scholar] [CrossRef]
  34. Wang, L.B.; Li, R.; Duan, C.X.; Zhang, C.; Meng, X.L.; Fang, S.H. A Novel Transformer Based Semantic Segmentation Scheme for Fine-Resolution Remote Sensing Images. IEEE Geosci. Remote Sens. Lett. 2022, 19, 5. [Google Scholar] [CrossRef]
  35. Wang, L.B.; Li, R.; Zhang, C.; Fang, S.H.; Duan, C.X.; Meng, X.L.; Atkinson, P.M. UNetFormer: A UNet-like transformer for efficient semantic segmentation of remote sensing urban scene imagery. ISPRS-J. Photogramm. Remote Sens. 2022, 190, 196–214. [Google Scholar] [CrossRef]
  36. Wang, L.; Li, D.; Dong, S.; Meng, X.; Zhang, X.; Hong, D. PyramidMamba: Rethinking pyramid feature fusion with selective space state model for semantic segmentation of remote sensing imagery. Int. J. Appl. Earth Obs. Geoinf. 2025, 144, 104884. [Google Scholar] [CrossRef]
  37. Yahui, L.; Sangineto, E.; Wei, B.; Sebe, N.; Bruno, L.; De Nadai, M. Efficient training of visual transformers with small-size datasets. Adv. Neural Inf. Process. Syst. 2021, 29, 23818–23830. [Google Scholar]
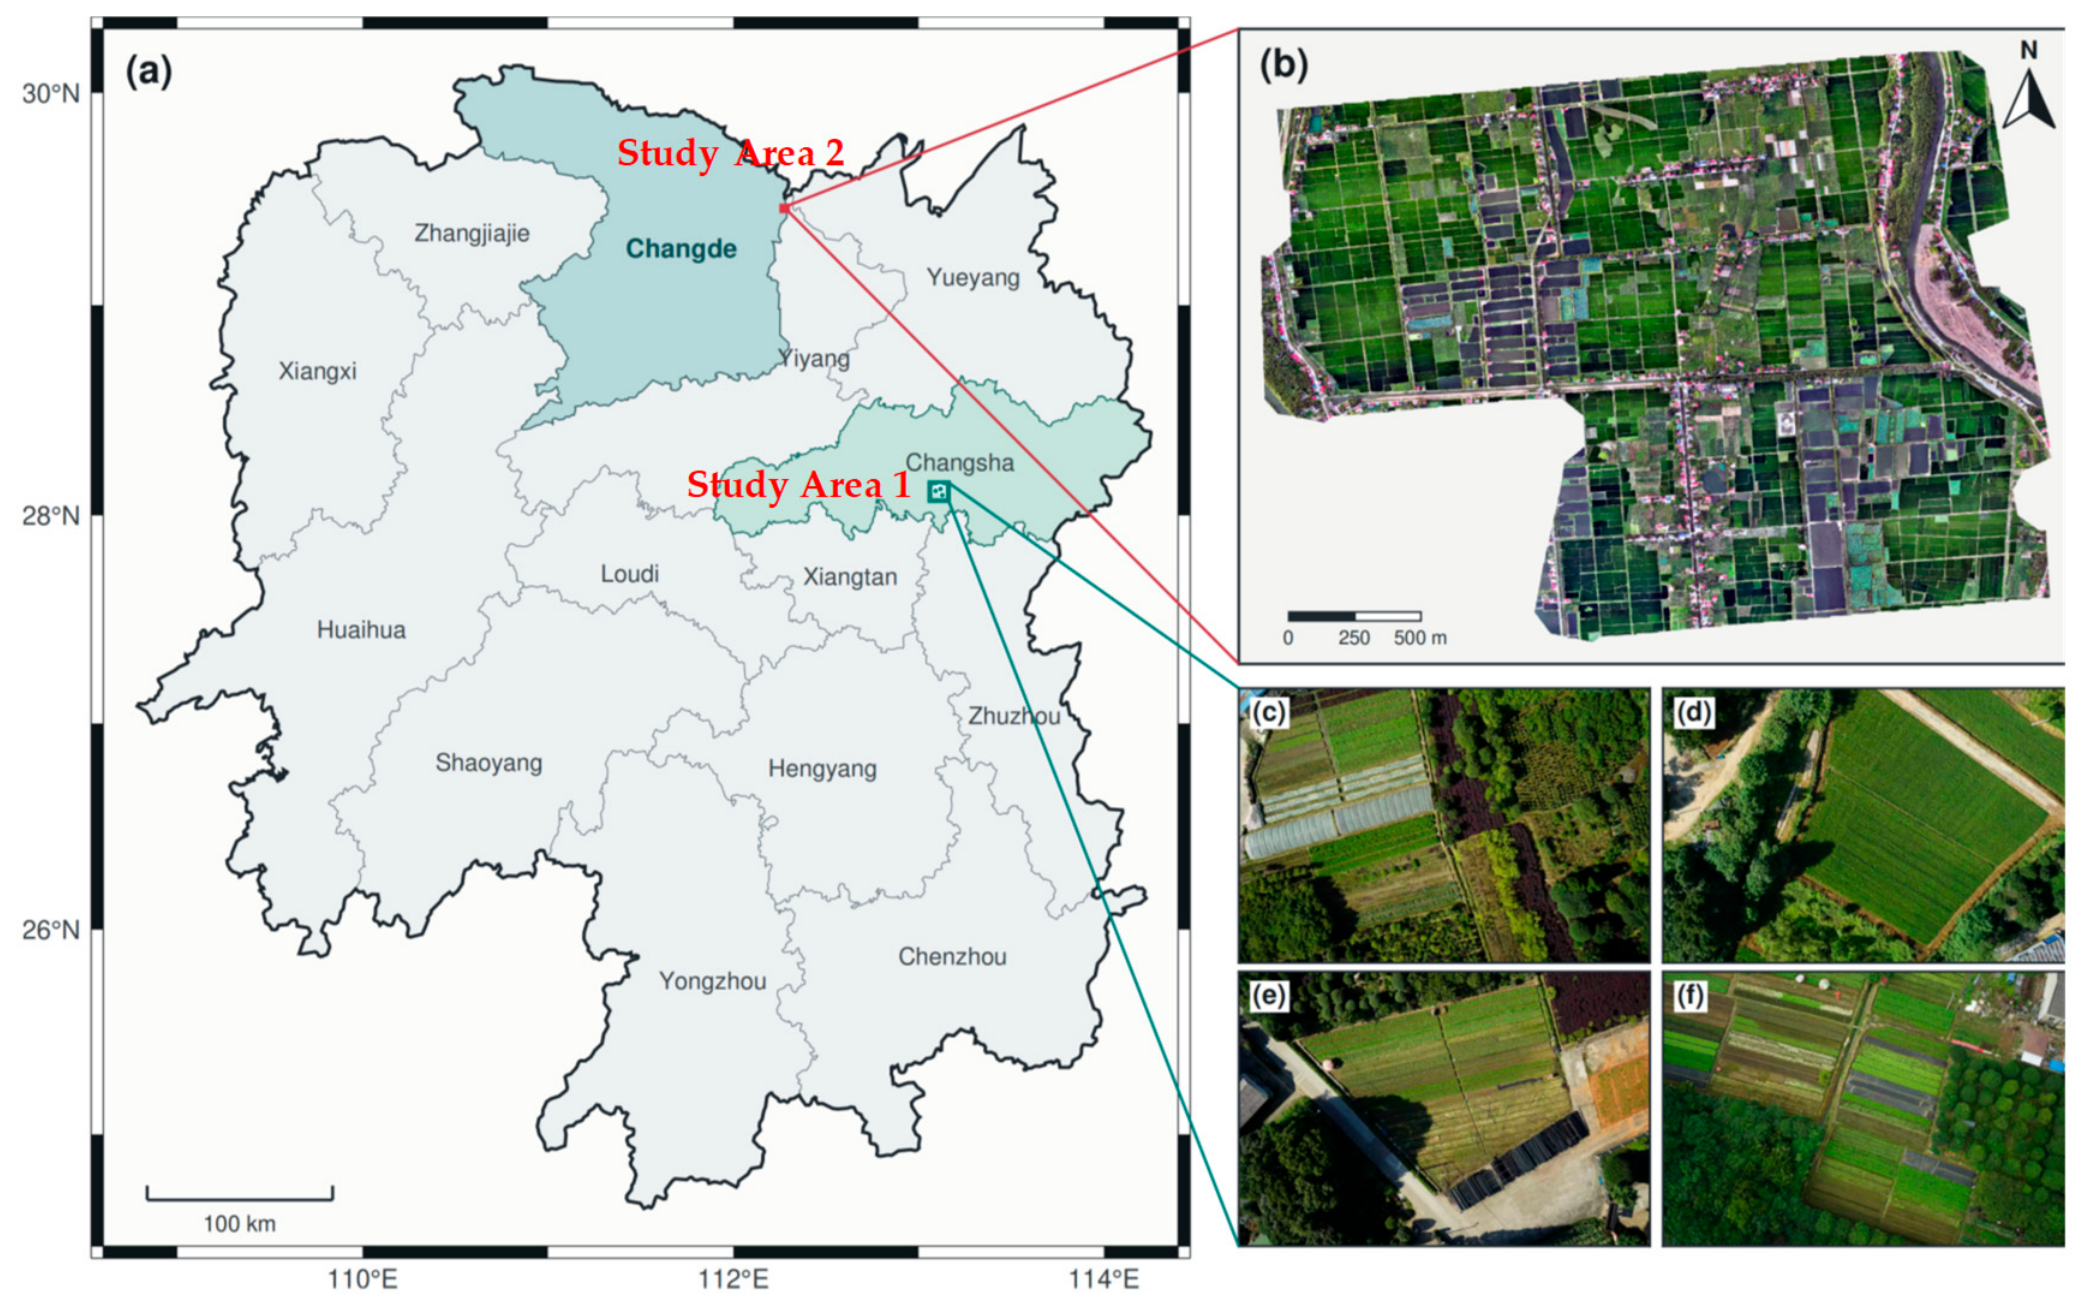
Figure 1. Location of the study areas. (a) Locations of the two study areas; (b) image of study area 2; (cf) example images captured in study area 1.
Land 15 01437 g001
Figure 2. Statistics for the pixels in Dataset 1.
Land 15 01437 g002
Figure 3. Example of Dataset 1.
Land 15 01437 g003
Figure 4. Example of Dataset 2.
Land 15 01437 g004
Figure 5. Statistics for the pixels in Dataset 2.
Land 15 01437 g005
Figure 6. Spatial distribution of Dataset 2 partitions.
Land 15 01437 g006
Figure 7. Visualization results for Dataset 1 across the models. (ag) show the results under different scenarios.
Land 15 01437 g007
Figure 8. Visualization results for Dataset 2 across the models. (ag) show the results under different scenarios.
Land 15 01437 g008
Figure 9. Impact of backbone networks on performance for each algorithm for Dataset 1. (a) mIoU; (b) mF1; (c) OA.
Land 15 01437 g009
Figure 10. Impact of backbone networks on performance for each algorithm for Dataset 2. (a) Rice IoU; (b) rice F1-score; (c) rice precision; (d) rice recall.
Land 15 01437 g010aLand 15 01437 g010b
Figure 11. Confusion matrix for Dataset 1 across models. (a) DeepLabv3+; (b) DANet; (c) Segmenter; (d) DC-Swin; (e) FT-UNetFormer; (f) UNetFormer; (g) PyramidMamba.
Land 15 01437 g011aLand 15 01437 g011b
Table 1. Training settings.
ModelBackboneParametersOptimizerLearning Rate Schedule
DeepLabv3+ResNet10160.2 MSGD with momentumPoly
DANetResNet10166.5 MSGD with momentumPoly
SegmenterViT-Base102 MSGD with momentumPoly
DC-SwinSwin-Small66.6 MAdamWCosine annealing with warm restarts
FT-UNetFormerSwin-Base96 MAdamWCosine annealing with warm restarts
UNetFormerResNet1811.7 MAdamWCosine annealing with warm restarts
PyraidMambaSwin-Small75.7 MAdamWCosine annealing with warm restarts
Table 2. Quantitative comparison results for Dataset 1 across the models.Bold values indicate the best performance. The best performer is boldfaced.
MethodmIoU (%)mF1 (%)OA (%)
DeepLabv3+76.8986.2390.88
DANet79.3287.9692.21
Segmenter75.1884.5891.24
DC-Swin82.7290.1293.63
FT-UNetFormer81.9589.5793.74
UNetFormer79.3888.0992.00
PyramidMamba81.4389.3293.67
Table 3. Quantitative comparison results for Dataset 2 across the models. The best performer is boldfaced.
MethodIoU (%)F1 (%)Recall (%)Precision (%)
DeepLabv3+93.3996.5898.7794.49
DANet91.3695.4898.7892.4
Segmenter95.9097.9198.1097.72
DC-Swin95.3497.6199.0596.21
FT-UNetFormer96.3598.1498.7297.56
UNetFormer90.0094.7498.8190.99
PyramidMamba94.7697.3198.5696.09
Table 4. IoU values of different land cover types across all evaluated algorithms. The best performer is boldfaced.
MethodBackground Agricultural Facility LandGreenhousePond SurfaceFruit Tree and SeedlingTransportation LandBuilding and ConstructionHardened SurfaceAnthropogenic Fill Area
DeepLabv3+86.7467.6394.0590.1576.7872.1147.1973.2484.16
DANet88.2978.0094.8490.4281.0170.254.8970.9585.27
Segmenter87.8259.7294.6790.5879.0273.3236.5170.0784.94
DC-Swin90.1778.7494.9794.7184.6478.1957.7176.6988.64
FT-UNetFormer90.6671.9694.5493.8985.8779.9054.6879.4186.60
UNetFormer87.4873.4594.2390.0282.2774.6458.5168.5285.33
PyramidMamba90.5575.2694.8793.4886.1576.3557.2174.7884.20
Disclaimer/Publisher’s Note: The statements, opinions and data contained in all publications are solely those of the individual author(s) and contributor(s) and not of MDPI and/or the editor(s). MDPI and/or the editor(s) disclaim responsibility for any injury to people or property resulting from any ideas, methods, instructions or products referred to in the content.