


Abstract
Global urbanization has caused widespread ecological degradation, yet habitat quality in agricultural plains remains understudied. This study addresses this gap by assessing and predicting land use and habitat quality changes in the Northern Anhui Plain from 2000 to 2030 using the PLUS and InVEST models under four scenarios (natural development, farmland protection, economic development, and sustainable development). The optimal parameters-based geographical detector (OPGD) was employed to identify driving factors. Results show that farmland continuously shrank while built-up land expanded, and habitat quality remained low and declined over time, with low-grade areas expanding. All four 2030 scenarios exhibited declines, with the farmland protection scenario yielding the highest habitat quality and the economic development scenario the lowest. The optimal spatial scale was 4 km, and discretization algorithms and break numbers significantly influenced driver analysis. Locational factors had relatively higher explanatory power, though the overall q-statistic was moderately low, indicating limited single-factor explanation. The study reveals the spatiotemporal dynamics and driving mechanisms of habitat quality in this farmland-dominated plain, providing useful insights for spatial planning and policy-making to support sustainable development in agricultural regions.
1. Introduction
The acceleration of global urbanization, along with the expansion and intensification of human activities, has induced the structural disintegration of primary ecosystems, ultimately triggering a cascading decline in hierarchical ecosystem service functions [1]. Habitat quality, as a core parameter for assessing regional biodiversity levels, reflects the capacity of an ecosystem to provide the fundamental conditions necessary for individual survival, population reproduction, and community succession within specific spatial and temporal dimensions [2]. Cultivated land-dominated plains, serving as vital global agricultural production bases, carry dual functions of ensuring food security and providing ecosystem services. However, under the backdrop of rapid urbanization, the expansion of construction land continuously encroaches upon ecological spaces, adversely affecting regional habitat quality [3]. Therefore, an in-depth investigation into the spatiotemporal differentiation characteristics and driving mechanisms of habitat quality is of significant importance for balancing food security with ecological diversity conservation, constructing ecological security patterns, and guiding territorial spatial planning [1]. Farmland-dominated plain areas differ from watersheds, urban agglomerations, or mountainous regions in the following distinctive features: farmland accounts for over 60% of the total land area, ecological restoration space is constrained by food security imperatives, and there is intense conflict between built-up land expansion and farmland protection. These particularities make it difficult to directly extrapolate existing habitat quality studies conducted in urban agglomerations or mountainous areas to such regions.
Changes in habitat quality are influenced by a combination of multiple factors, with specific drivers varying across different regions and hierarchical levels of ecosystems [4]. Among these, activities such as urban expansion, deforestation, agricultural expansion, and infrastructure development directly or indirectly alter or destroy natural habitats, constituting the primary causes of habitat degradation [5]. Concurrently, global warming indirectly impacts habitat quality by altering species distribution ranges and phenological cycles. The IPCC (2022) indicated that if global warming exceeds 2 °C, 15% of global terrestrial ecosystems will undergo irreversible degradation [6]. Furthermore, pesticide and fertilizer use, plastic pollution, over-exploitation of natural resources, and deficiencies in policy implementation can also lead to changes in habitat quality [7].
Currently, the primary methods for assessing habitat quality can be categorized into two groups. The first is the biodiversity and habitat survey method. This approach builds a comprehensive evaluation index system based on actual field surveys of samples to assess habitat quality [8]. It is suitable for smaller-scale regions but is constrained by time and labor costs. Jianqiang et al. [9] concluded through field surveys that the overall habitat quality along the Laizhou Bay coastal area was at a light to moderate pollution level, with water quality and marine biological quality pollution being more severe. The second category involves ecological assessment models, such as the SolVES model and the InVEST model. The Social Values for Ecosystem Services (SolVES) model can be applied to various biophysical and social environments, including global mountain, forest, coastal, riparian, agricultural, and urban settings [10]. Zhou et al. [11] identified and mapped cultural ecosystem services in two wetland parks using the SolVES model and preference survey data. This model relies on questionnaires, and its results depend on respondents’ understanding of ecosystem services. The InVEST model comprehensively analyzes habitat quality by integrating land use data, the spatial distribution of threat factors, and species habitat suitability parameters [12]. Qin et al. [13] used the InVEST model to study the evolution of habitat quality and its response to land use change in China’s coastal areas from 1985 to 2020. Due to its advantages of high accuracy, low cost, and ease of operation, the InVEST model has been widely applied for habitat quality assessment worldwide, making it the most developed and extensively used model for this purpose.
Current research on habitat quality primarily focuses on three aspects. First, studies investigate the relationship between land use and habitat quality. Wu et al. [14] used the InVEST model to study the impact of urban expansion on habitat quality in the Pearl River Delta from 1990 to 2018, finding that land use was the primary factor driving habitat quality change. They suggested that coupling habitat quality with land use change could provide deeper insights into the specific impacts of complex land use changes on habitat quality. Second, research involves predicting future land use and habitat quality under different scenarios using models. Huang et al. [15] employed the PLUS model to predict land use changes under various scenarios and explored their relationship with habitat quality, aiming to provide a scientific basis for territorial spatial planning and future urban planning. However, these studies often lack detailed investigation into the spatiotemporal heterogeneity of habitat quality and its specific driving factors. Third, research examines the driving factors of habitat quality. Xie and Zhang [16] analyzed the changing characteristics of habitat quality in Guizhou based on the InVEST model and used a geographical detector to analyze the driving forces behind its evolution. However, in traditional geographical detectors, the determination of spatial scale for driving factors, data discretization algorithms, and the number of stratification breakpoints are often based on researchers’ experience, preventing the analytical accuracy for spatial clustering from reaching its optimum. This study utilizes the Optimal Parameters-based Geographical Detector (OPGD) model [17] to determine the optimal combination of spatial data discretization algorithms, the number of stratification breakpoints, and scale parameters, with the aim of enhancing the accuracy of spatial clustering analysis.
Current research on habitat quality predominantly focuses on trans-provincial regions and river basins. Pu et al. [18] studied habitat quality degradation in the Taihu Lake Basin. Broquet et al. [19] investigated the impact of land use change on habitat quality in the Upper Paraguay River Basin in Brazil using the InVEST model. Chen et al. [20] studied the spatiotemporal changes in habitat quality in the Yangtze River Delta region from 2000 to 2020. Cultivated land-dominated plain areas, due to their unique geographical characteristics, hold high research value. However, studies on habitat quality in typical cultivated plain regions remain relatively scarce. The Northern Anhui Plain is an important part of the Huang-Huai Plain, with nearly 80% of its land area under farmland, and serves as a major grain-producing region in China. This area is simultaneously experiencing rapid urbanization, which imposes a heavy burden on farmland protection. It also belongs to the Huaihe River Ecological Economic Belt, where the designation of ecological redlines is urgently needed. Therefore, Northern Anhui represents a typical case for studying the food-ecology balance in farmland-dominated plains. Conventional geographical detectors rely on researchers’ empirical choices of discretization methods and spatial scales, which face particular challenges in farmland-dominated plains: high landscape homogeneity may allow empirical parameters to obscure subtle spatial differentiation, and the driving effects across different scales may exhibit scale dependence. By traversing and optimizing to determine the optimal discretization method and spatial scale, the OPGD model can more robustly detect the driving mechanisms of habitat quality in plain areas, avoiding biases from arbitrary parameter settings.
This study selects Northern Anhui as the research area. Based on land use data from 2000 to 2020, This study first predicts land use using the PLUS model, then evaluates the projected habitat quality with the InVEST model, and finally analyzes the driving mechanisms of habitat quality change via OPGD. This methodological framework is transferable to the agricultural plains of the middle and lower Yangtze River, as well as to habitat quality assessments in different regions worldwide, demonstrating strong applicability. This study aims to address the following questions: How did land-use changes in the Northern Anhui Plain from 2000 to 2020 affect the spatiotemporal patterns of habitat quality? How will habitat quality evolve under different 2030 land-use scenarios? Which natural, socioeconomic, and locational factors best explain the spatial differentiation of habitat quality, and what are their interaction effects?
2. Materials and Methods
2.1. Study Area Overview
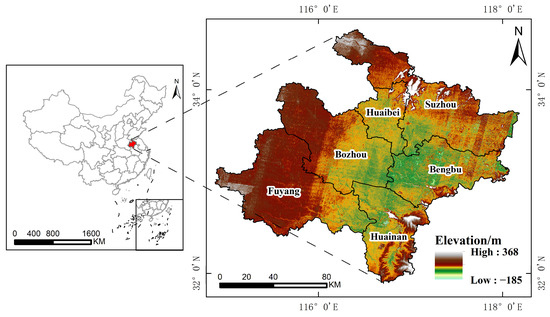
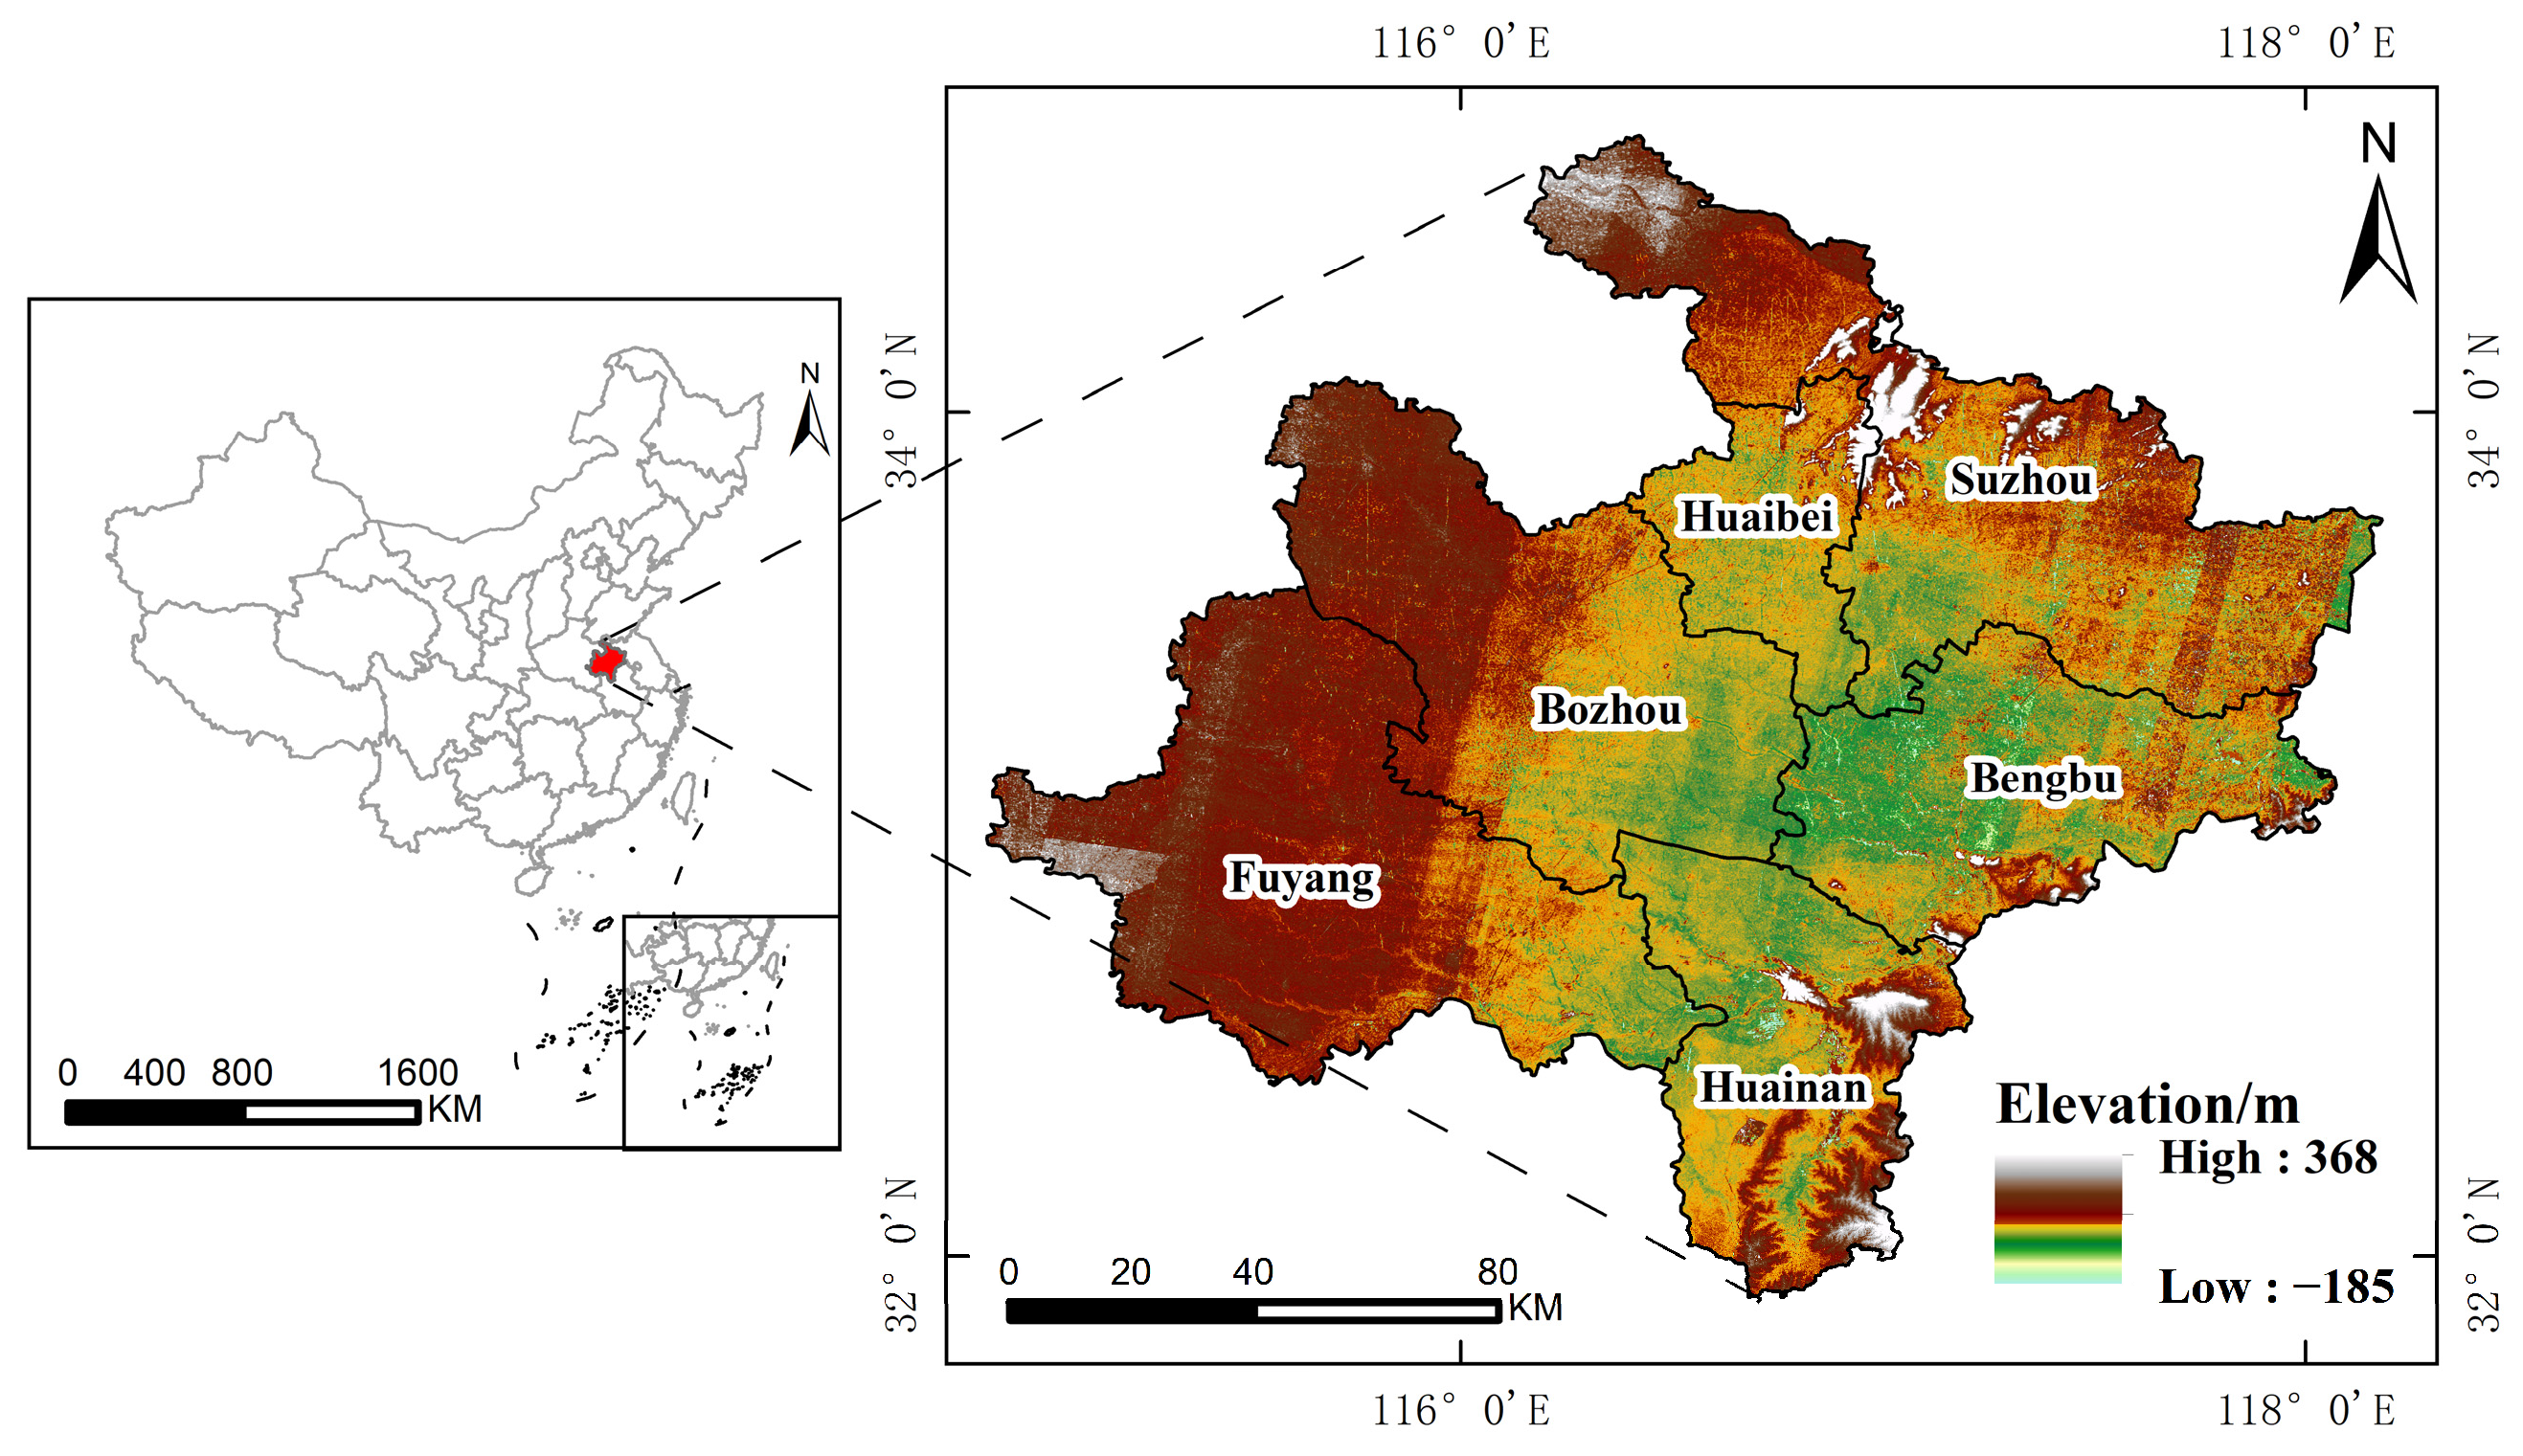
Northern Anhui is located in the region north of the Huai River in Anhui Province, encompassing six prefecture-level cities: Suzhou, Huaibei, Bengbu, Fuyang, Huainan, and Bozhou (Figure 1). The total area of this region is approximately 53,000 km2, spanning from 114°55′ E to 118°10′ E and 32°25′ N to 34°35′ N. The terrain is predominantly plain, characterized by the expansive Huaibei Plain, which features flat topography, with low mountains and hills distributed in the northeastern part. Farmland accounts for more than 80% of the total area, with wheat and maize as the main grain crops, and habitat fragmentation is severe. The region serves as a strategic hub connecting the north and south, as well as the east and west.
Figure 1.
Geographical Overview of Northern Anhui Region.
2.2. Data Sources
The data utilized in this study primarily include land use data, socioeconomic data, and natural environment data. The basic information of these data is presented in Table 1. The land use data were derived from the 30 m annual land cover dataset of China (CLCD). This dataset employed 335,709 Landsat images from the Google Earth Engine and introduced a post-processing method that integrates spatiotemporal filtering and logical reasoning. Based on 5463 visual interpretation samples, the overall accuracy of the CLCD reached 79.31% [21].
Table 1.
Research Data Types and Sources (Note: Except for the land-use data, all other data are from the year 2020).
For preprocessing, all datasets were first unified to the same projection and extracted for the study area by mask. Specifically, the land use raster data were reclassified into six land use types. The same projection and mask extraction procedures were applied to the other raster datasets. All socioeconomic variables are in raster format. The China GDP spatial distribution kilometer-grid dataset was generated based on county-level GDP statistics, with consideration of the spatial interaction patterns between GDP and factors closely related to human activities, including land use type, nighttime light intensity, and settlement density, through spatial interpolation. To explore the scale effect, we created regular fishnet grids at 1 km, 2 km, 3 km, and 4 km resolutions. At each resolution, we extracted values from all driving-factor rasters and from the InVEST-derived habitat quality raster. The extracted point-based datasets were then input into the OPGD model to identify the optimal spatial scale for subsequent analysis.
2.3. Research Methodology
- (1)
- Land Use Dynamic Degree
The Single Land Use Dynamic Degree is employed to quantify the rate of change in the area of a specific land use type over the study period, reflecting the intensity of its change [22]. Its formula is as follows:
In the formula, represents the dynamic degree of the target land use type (%/year), where a larger value indicates more intense change; denotes the area of that land use type at the beginning of the study period; denotes its area at the end of the study period; and is the duration of the study period.
The Comprehensive Land Use Dynamic Degree is used to quantify the overall activity level of land use change within a region, reflecting the macro-dynamic characteristics of the mutual conversion among multiple land use types [23]. Its formula is as follows:
In the formula, represents the regional comprehensive dynamic degree (%/year), where a larger value indicates more intense land use change; denotes the area converted out of the -th land use type during the study period; denotes the area of the -th land use type at the beginning of the study period; is the total number of land use types; and is the duration of the study period. The single dynamic degree captures the changes in individual land use types, while the comprehensive dynamic degree characterizes the overall disturbance intensity across the entire region. The combination of the two can provide a full picture of land transformation characteristics.
- (2)
- InVEST Model Habitat Quality Module
The Habitat Quality module of the InVEST (Integrated Valuation of Ecosystem Services and Trade-offs) model is a spatially explicit analysis tool developed based on ecosystem service assessment theory, aiming to quantify regional biodiversity maintenance functions [24]. This module integrates land use data, the spatial distribution of threat factors, and species habitat suitability parameters, using the Habitat Quality Index (HQI) to characterize the capacity of an ecosystem to provide a suitable environment for species survival. A higher HQI indicates better overall habitat quality. The calculation formula is as follows:
In the formula, represents habitat suitability; is a scaling factor; and is the half-saturation constant. The relative sensitivity of each habitat type to each threat in the landscape ultimately determines the total degradation within a cell. A sensitivity value close to 1 implies higher sensitivity. The model assumes that greater sensitivity to a threat leads to more severe degradation of that habitat type. In this study, key parameters were optimized based on the model’s guidance documentation and referencing relevant research findings [25], as detailed in Table 2 and Table 3. In the Northern Anhui Plain, intensive fertilizer and pesticide application in farmland, large-scale monocropping, an absence of understory habitats, and hardened ditches have substantially reduced regional biodiversity. With reference to multiple studies on the Huang-Huai-Hai Plain, cropland is therefore designated as a low-intensity threat source.
Table 2.
Distance and Weights of Threat Factors on Habitat Quality.
Table 3.
Ecological Suitability and Sensitivity of Land Use Types.
- (3)
- Spatial Autocorrelation
Spatial autocorrelation analysis is employed to examine the correlation characteristics of geographically distributed variables by quantifying the degree of attribute similarity among spatial units. This method reveals clustering or dispersion patterns within the data [26]. Through indices such as Moran’s I, it systematically assesses the dependency relationship between the observed values of geographic elements and their spatial locations, effectively identifying patterns of spatial dependence [27]. Spatial autocorrelation analysis is divided into two dimensions—global and local—each revealing the spatial association characteristics of regional variables at the overall and specific location levels, respectively [28]. In this study, Moran’s I was calculated using the Euclidean distance method between point pairs, and the spatial weight matrix was defined based on distance criteria.
- (4)
- Optimal Parameter-based Geographic Detector
The Geographic Detector (GeoDetector) is a statistical model proposed by the research team led by Wang Jinfeng at the Institute of Geographic Sciences and Natural Resources Research, Chinese Academy of Sciences [29]. It is designed to detect the spatial differentiation characteristics of geographic elements and analyze their driving mechanisms, quantifying the explanatory power of factors to reveal the causes of spatial clustering in geographic phenomena. As a widely used technique for spatial differentiation analysis, the GeoDetector model in practical application is often constrained by the empirical setting of fundamental parameters, such as spatial data discretization methods and scale effects, with quantitative evaluation of these key parameters remaining insufficient in traditional research. To address this, the research group led by Song Yongze [30] innovatively proposed the Optimal Parameters-based Geographic Detector (OPGD) model. This model systematically optimizes the best combination of spatial data discretization algorithms, the number of stratification breakpoints, and scale parameters, thereby significantly enhancing the accuracy of spatial clustering analysis.
- (5)
- PLUS model
The PLUS model is a cellular automaton (CA) model based on raster data, capable of simulating land use changes at the patch scale. It was jointly developed by the High-Performance Spatial Computational Intelligence Laboratory (HPSCIL) at the School of Geography and Information Engineering, China University of Geosciences (Wuhan), and the National Engineering Research Center for Geographic Information Systems. The PLUS model, developed on the basis of the FLUS model, comprises a land expansion analysis strategy module and a CA-based on random seeds (CARS) module, and is embedded with a Markov chain [31]. Multiple scenario settings are defined as follows: (1) Natural development scenario (M1): This scenario is based on the patterns of land use change observed from 2000 to 2020, without considering constraints such as policy guidance or planning directives. The Markov chain embedded in the PLUS model is used to predict the demand for each land type in 2030, and this scenario serves as the basis for other scenario simulations [32]; (2) Cultivated land protection scenario (M2): Based on the natural development scenario, this scenario significantly reduces the probability of cultivated land being converted to construction land, grassland, and water areas [33]; (3) Economic development scenario (M3): Based on the natural development scenario, this scenario greatly reduces the probability of construction land being converted to other land types, while increasing, to varying degrees, the probability of cultivated land, forest land, grassland, water areas, and unused land being converted to construction land; (4) Sustainable development scenario (M4): This scenario balances economic development with ecosystem protection. Based on the natural development scenario, it incorporates nature reserves as restricted conversion areas.
To validate the model and assess its reliability for predicting land use in 2030, we compared the predicted 2020 land use map with the actual 2020 land use data. The validation employed the Kappa coefficient, which is widely used in land use prediction validation, to evaluate the consistency between simulated and actual land use distributions. Based on the land use data of 2000 and 2010, we used the PLUS model to predict the 2020 land use distribution. Compared with the actual 2020 land use data, the Kappa coefficient was 0.82 and the overall accuracy reached 0.94. This indicates that the PLUS model has good simulation performance and accuracy in predicting future land use distribution in the Northern Anhui region.
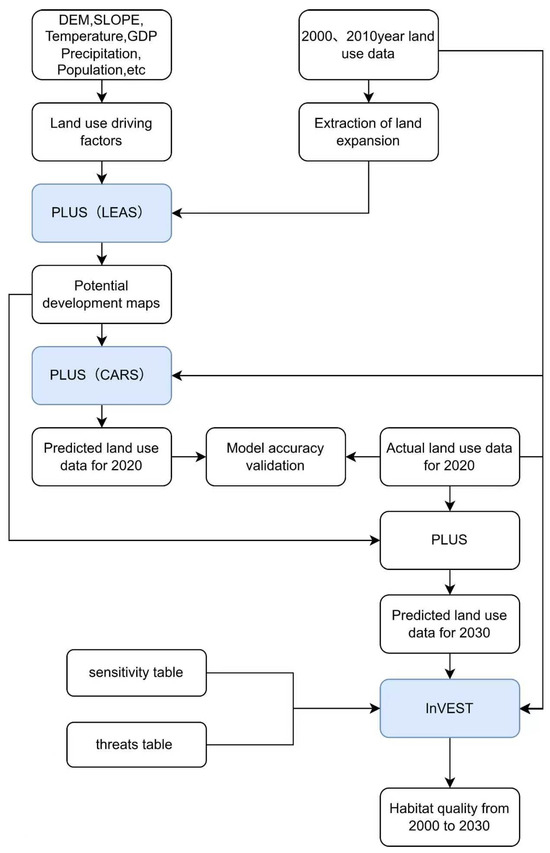
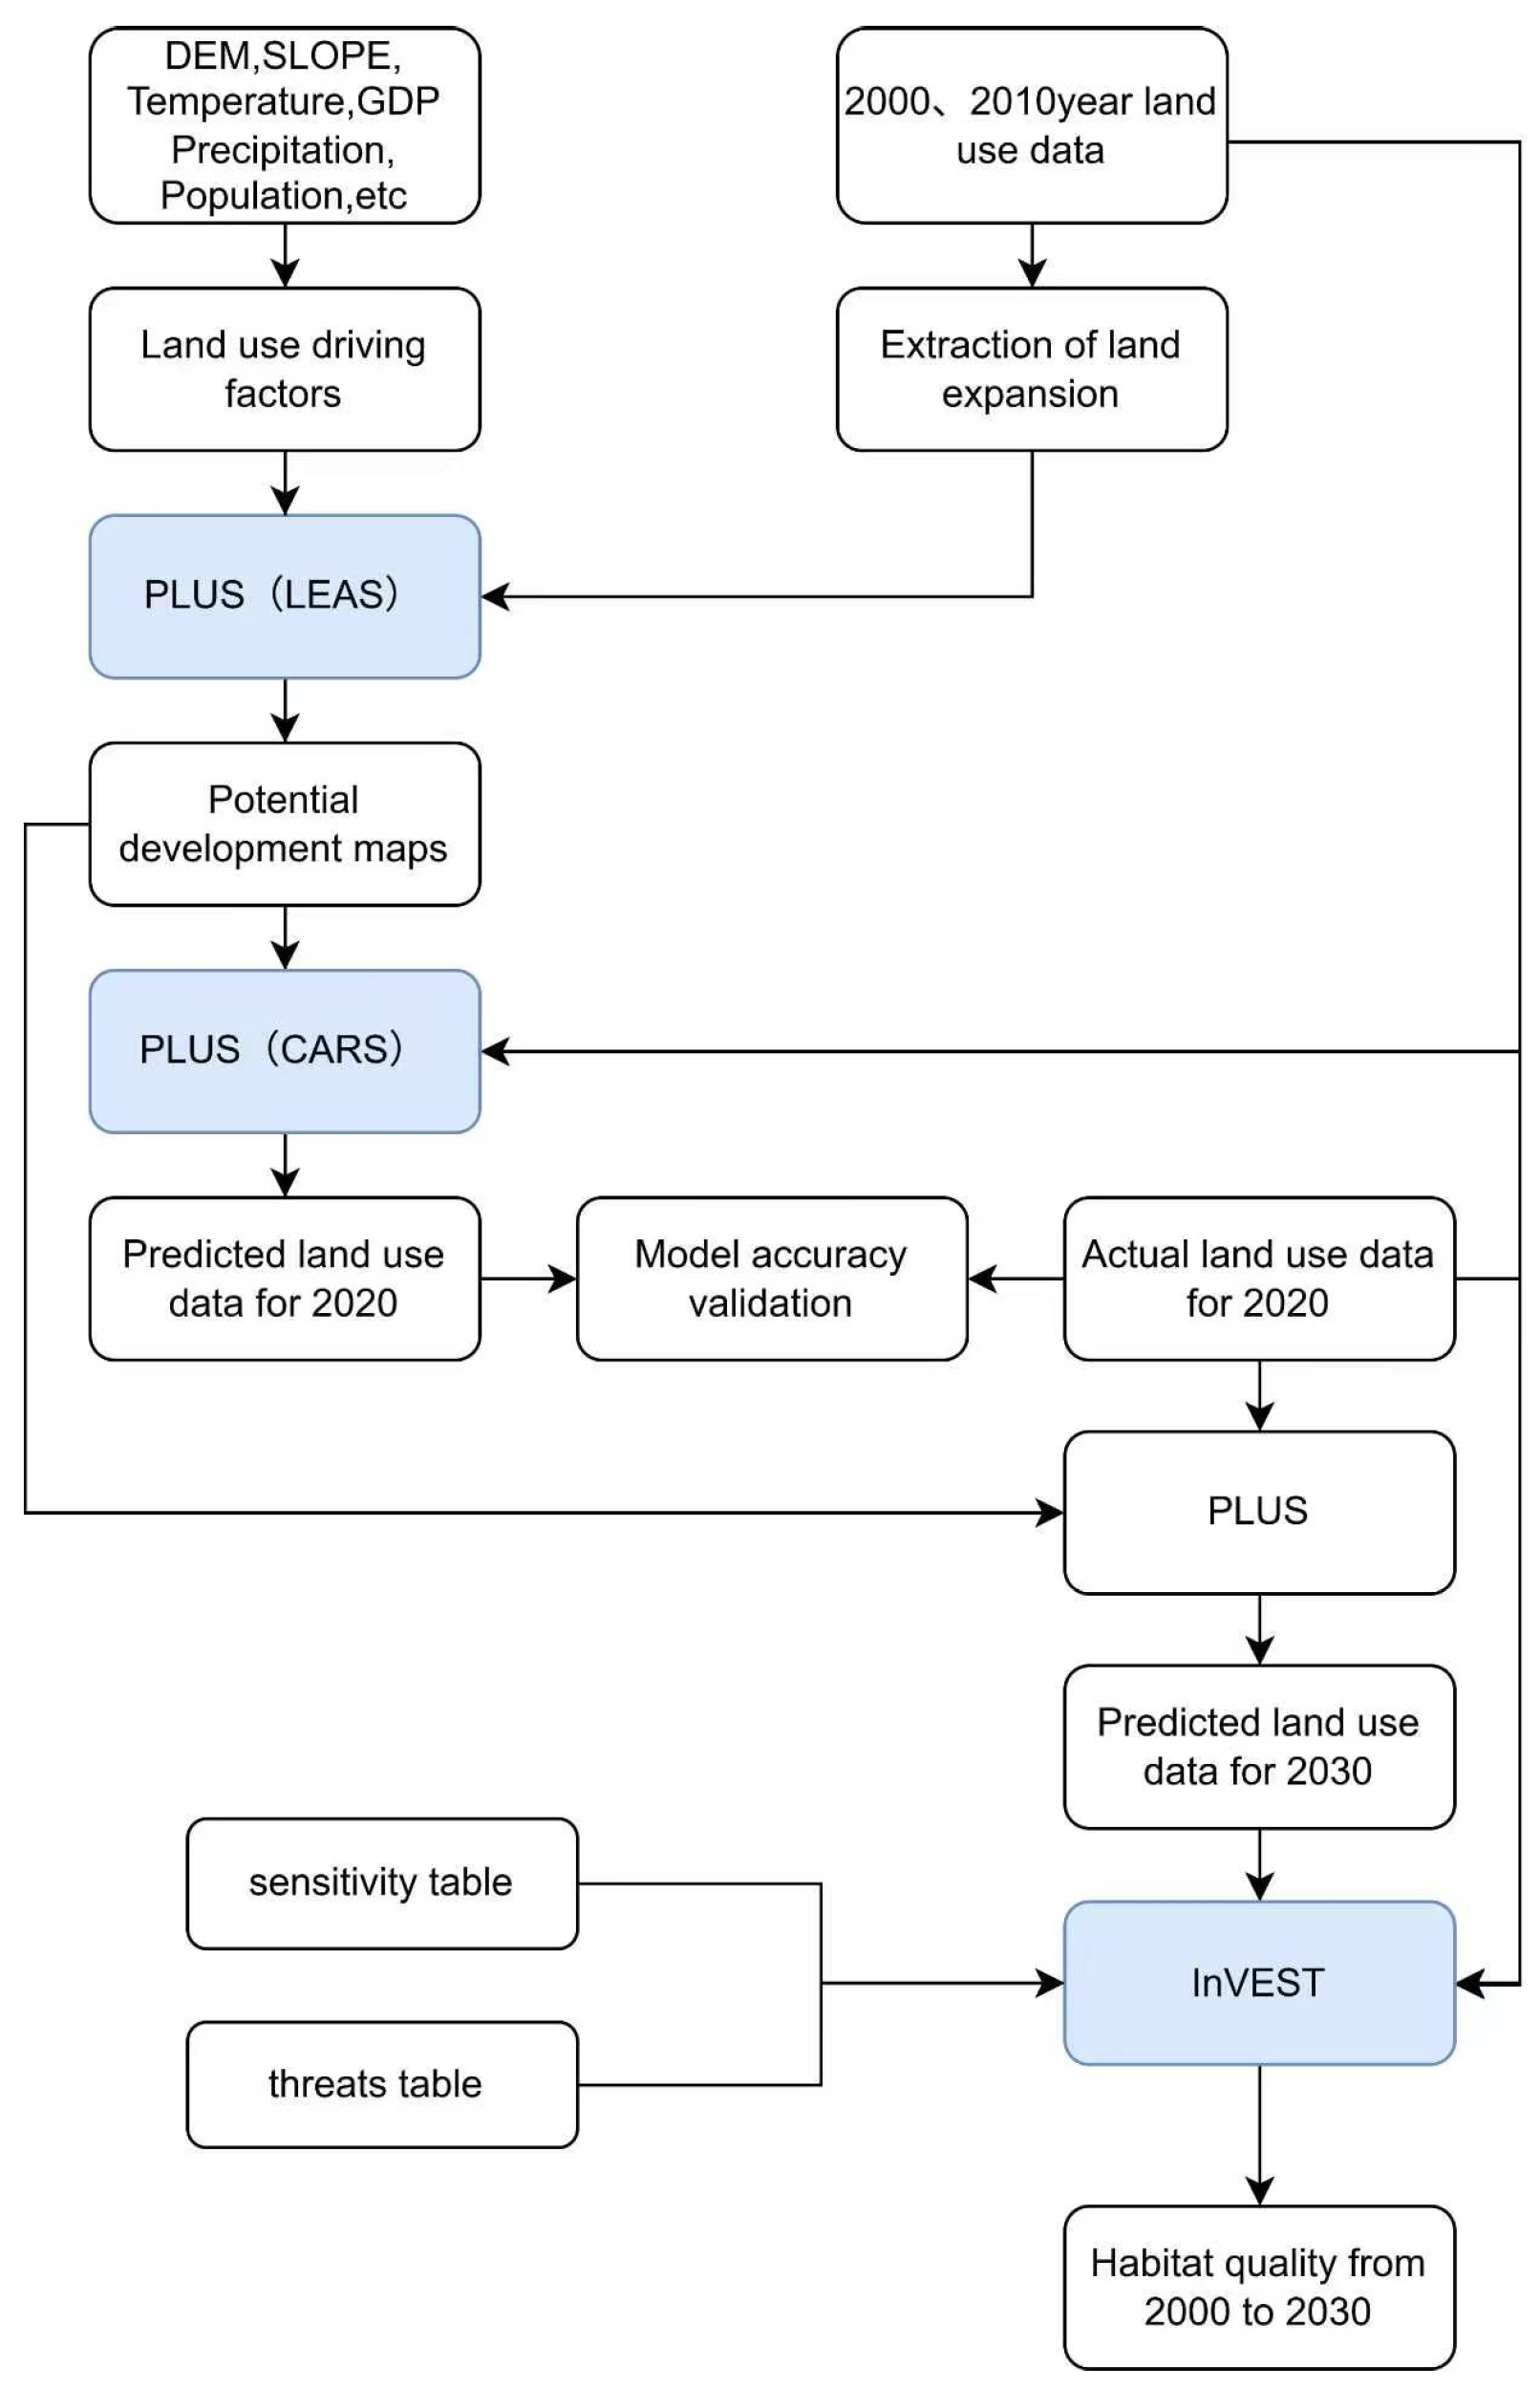
This study constructed land use driving factors based on topographic, climatic and socio-economic data. Combined with land expansion data of 2000 and 2010, the LEAS and CARS modules of the PLUS model were adopted to simulate land use in 2020 for accuracy verification, followed by the prediction of land use patterns in 2030. Afterwards, multi-period land use data, habitat sensitivity tables and threat tables were imported into the InVEST model to obtain habitat quality results from 2000 to 2030. The overall technical workflow is shown in Figure 2.
Figure 2.
Workflow of PLUS land use simulation and InVEST habitat quality evaluation.
3. Results
3.1. Land Use Change
- (1)
- Analysis of land use change from 2000 to 2020
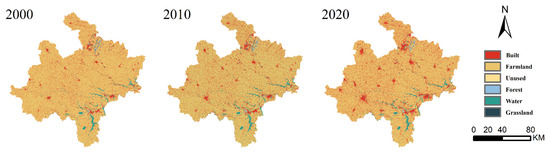
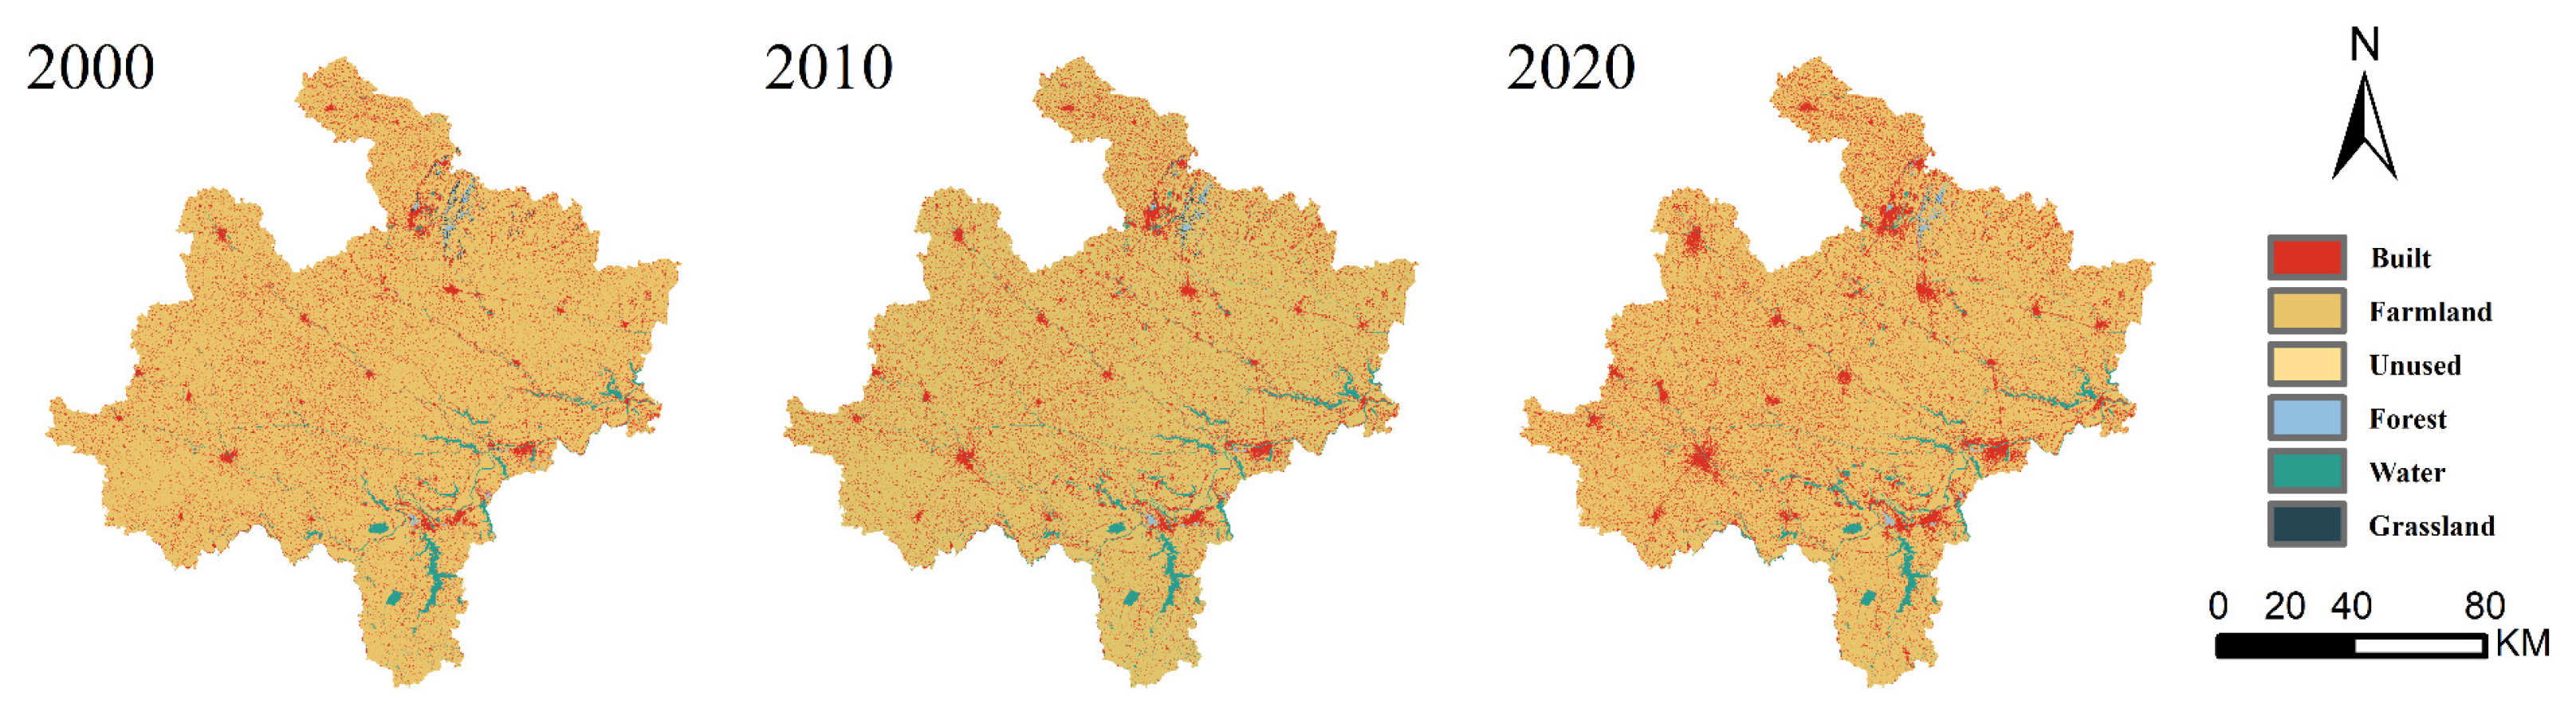
As shown in Figure 3, the land use types in Northern Anhui are predominantly cultivated land, with construction land concentrated in specific areas, while water bodies and forest land are sporadically distributed. Unutilized land and grassland are relatively scarce. Spatially, cultivated land extensively covers the entire Northern Anhui region, indicating the dominance of agricultural activities. Construction land is concentrated in cities and towns with convenient transportation, exhibiting a diffusive distribution pattern outward from these centers, presenting as scattered point-like distributions across the Northern Anhui Plain. Water bodies are primarily located in the southeastern part of the study area, where water resources are relatively abundant. Forest land is concentrated in the northeastern low mountainous and hilly areas. Grassland is limited in quantity and sporadically distributed, mainly found in the northeastern part of the study area. Unutilized land is the least prevalent category, appearing in scattered patches, often situated in areas unsuitable for development.
Figure 3.
Spatial Distribution of Land Use Types in Northern Anhui from 2000 to 2020.
To quantitatively analyze the evolutionary process of land use in Northern Anhui, this study systematically reveals the spatiotemporal characteristics of land use change from 2000 to 2020 by measuring indicators across two dimensions: the single and comprehensive land use dynamic degrees. As shown in Table 4, land use types in Northern Anhui exhibited significant dynamic changes from 2000 to 2020. Construction land continued to expand, with its growth rate increasing from 1.74% to 2.30%, and a comprehensive 20-year increase of 2.22%. This is closely related to the economic development and urbanization process in Northern Anhui. The degradation rate of grassland accelerated from −3.24% during 2000–2010 to −5.72% during 2010–2020, with an overall degradation intensity of −3.55%. Cultivated land showed a continuous shrinking trend, with its reduction rate accelerating from −0.26% during 2000–2010 to −0.36% during 2010–2020, and a comprehensive 20-year decline rate of −0.31%. This indicates that urbanization has intensified the encroachment on cultivated land. Changes in water bodies exhibited a phased characteristic: rapid expansion (1.65%) during 2000–2010, followed by a sharp decline in growth rate (0.22%) during 2010–2020, which may be related to water resource regulation policies and climate fluctuations. Forest land experienced a “V”-shaped turnaround, declining at a rate of −0.13% during 2000–2010 before reversing to achieve positive growth of 1.21% during 2010–2020, with a net increase of 0.5305% over the 20-year period. This reflects the effectiveness of ecological projects such as the Grain for Green Program. The evolution of unutilized land showed volatility, shifting from a high expansion rate of 8.01% during 2000–2010 to negative growth of −5.63% during 2010–2020, with an overall decline of −1.07%. This indicates the phased outcomes of land consolidation and ecological restoration efforts. The comprehensive land use dynamic degree increased from 0.23% to 0.31%, with a comprehensive 20-year change rate of 0.27%, revealing an accelerating trend of intensified human activity disturbance after 2010.
Table 4.
Land Use Dynamic Degree in Northern Anhui (2000–2020).
- (2)
- Analysis of land use change from 2020 to 2030
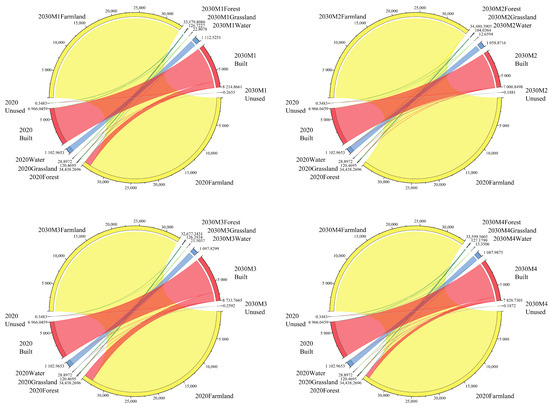
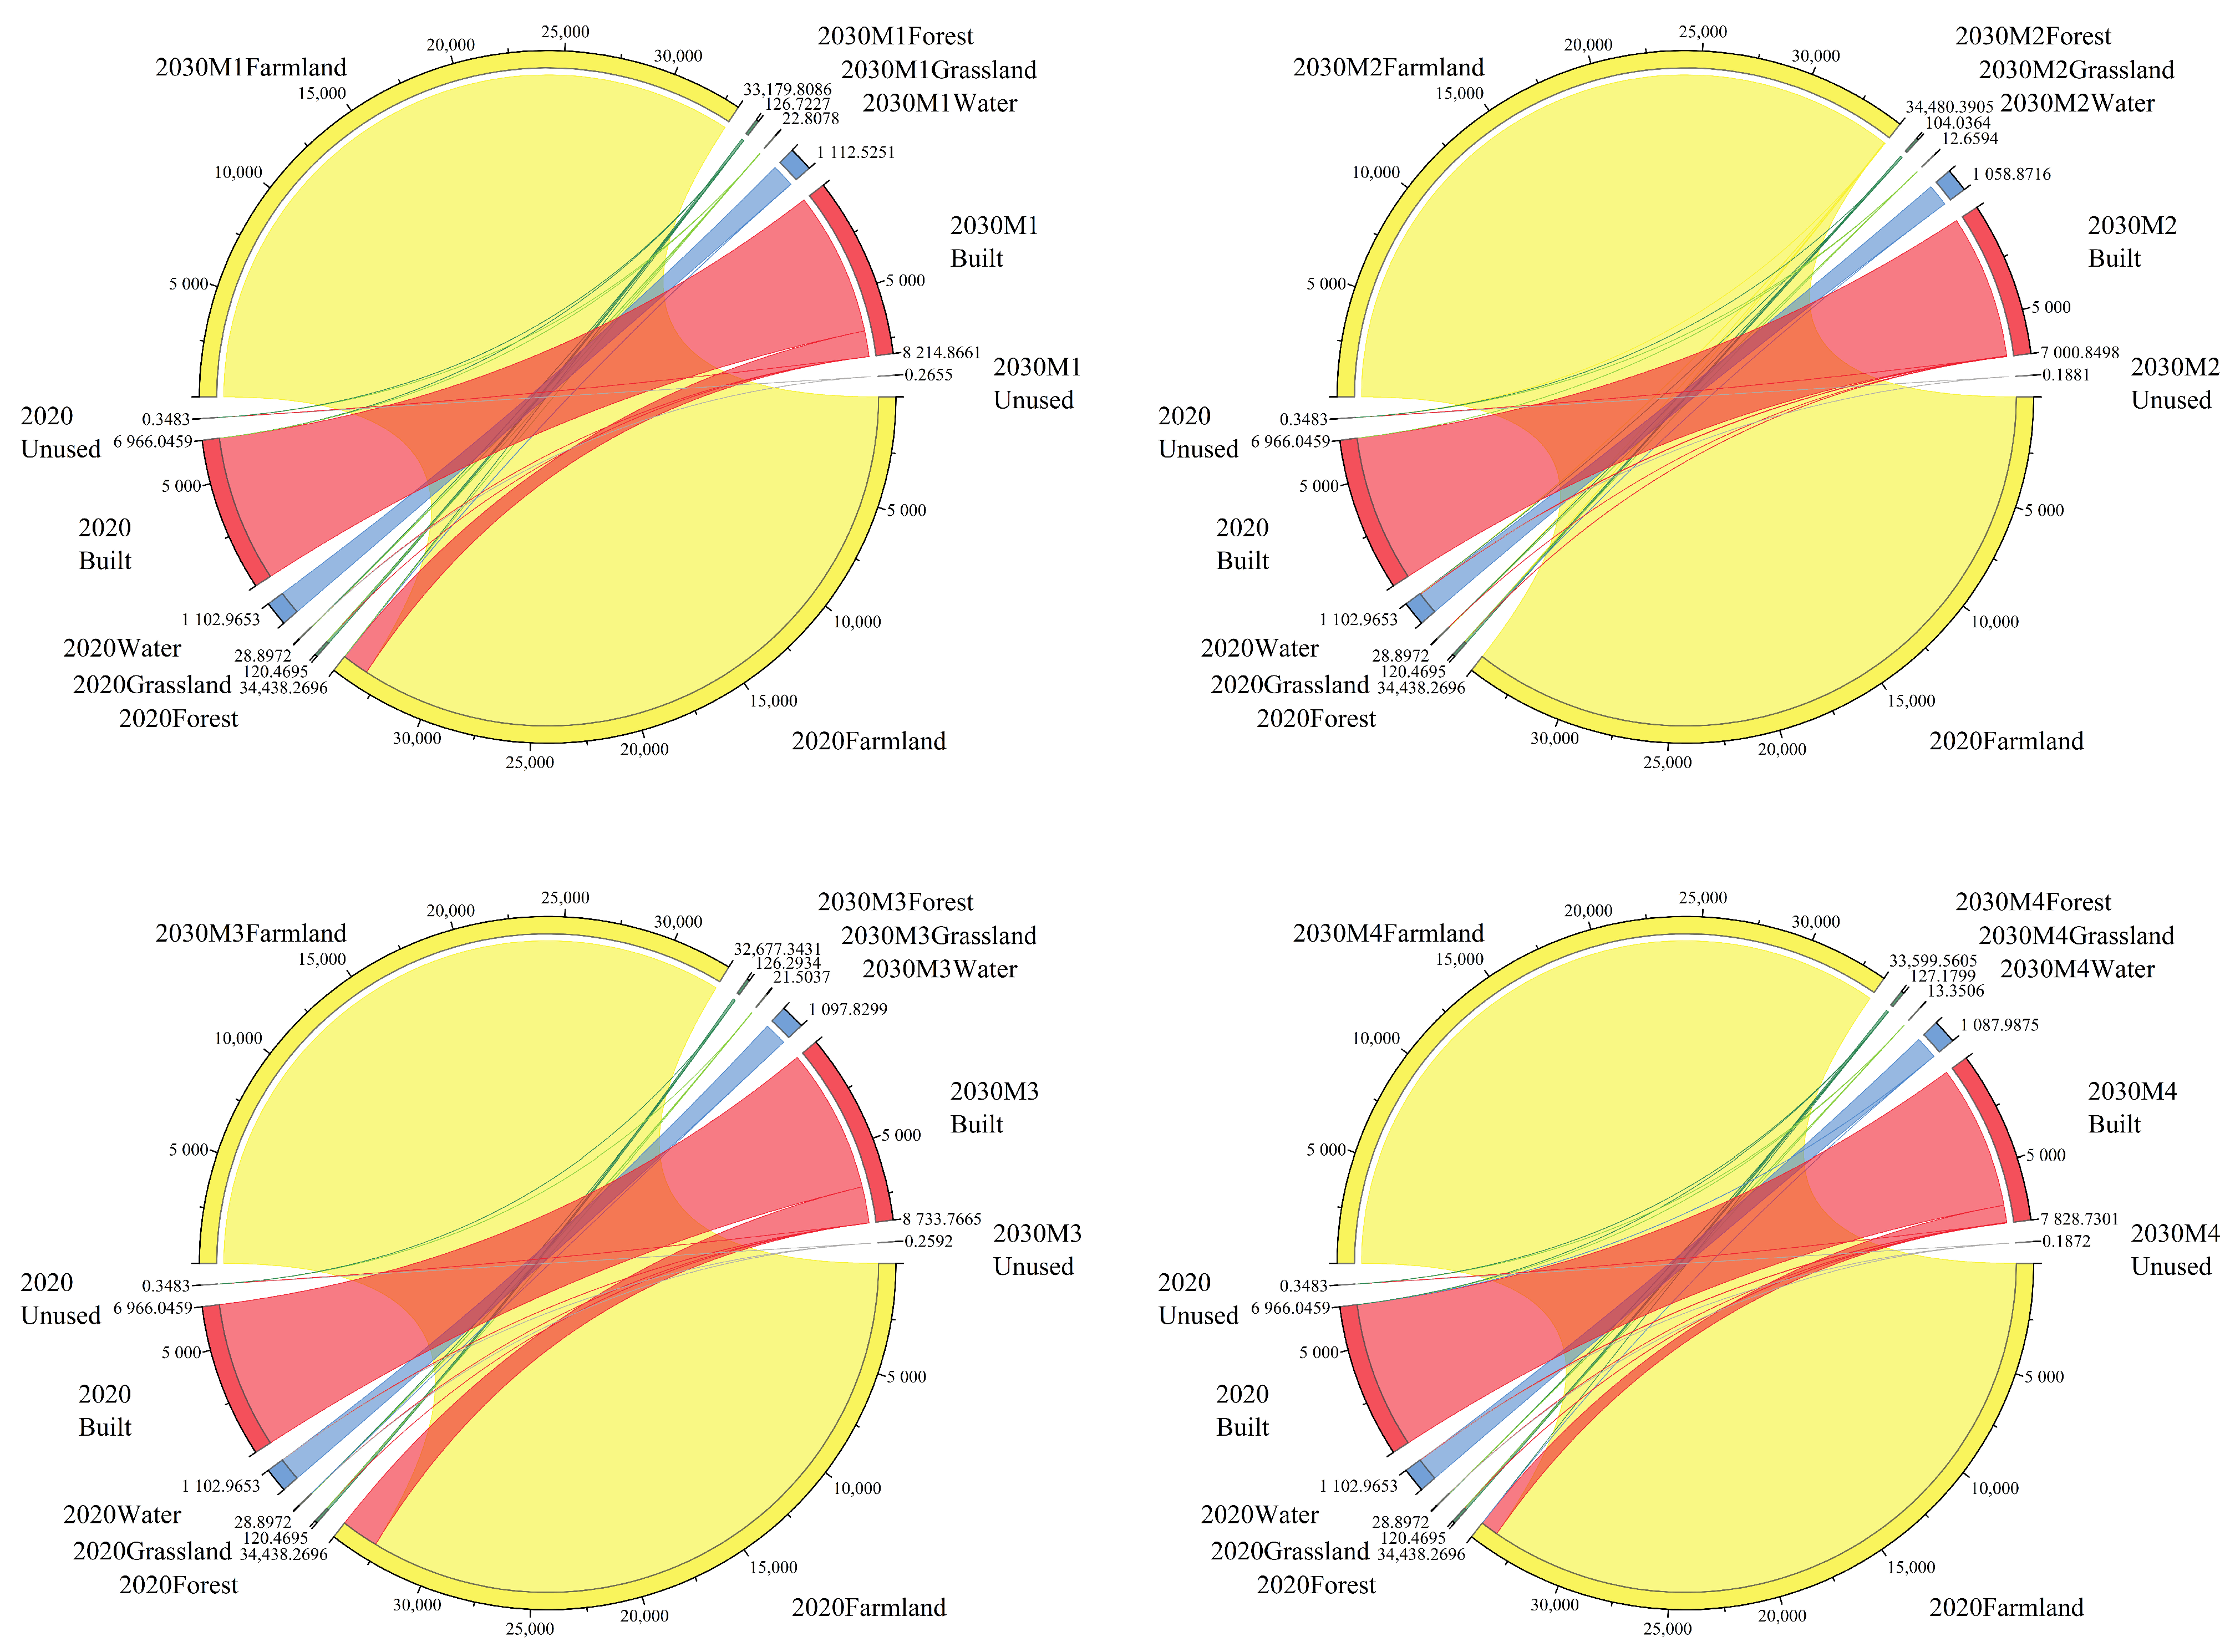
Based on the land use data of the study area in 2020 and the validated PLUS model, land use prediction maps under four different scenarios were obtained, as shown in Figure 4. Under the natural scenario, the trend of land use change remains consistent with that observed from 2000 to 2020. From 2020 to 2030, the area of cultivated land further decreases from 34,438.27 km2 to 33,179.81 km2, a reduction of 1258.46 km2. The primary outflow of cultivated land is still to construction land (1247.92 km2), followed by forest land and grassland. Given the continuous decline in cultivated land, more stringent cultivated land protection policies should be formulated in the future to ensure food security. The area of construction land increases significantly, from 6966.05 km2 to 8214.87 km2, an increase of 1248.82 km2, with cultivated land remaining its main source. With the rapid expansion of construction land, future efforts should focus on optimizing the layout of urban and industrial land, improving land use efficiency, and reducing the encroachment on cultivated land and other land types. The areas of other land types remain almost unchanged.
Figure 4.
Sankey Diagram of Land Use Transition under Multiple Scenarios.
Under the cultivated land protection scenario, from 2020 to 2030, the area of cultivated land changes from 34,438.27 km2 to 34,480.39 km2, showing a slight increase, indicating that cultivated land protection measures during this period were appropriate. Compared with 2020, the area of construction land in 2030 increases slightly from 6966.05 km2 to 7000.85 km2, with its main sources being the conversion of water areas, forest land, and grassland. Forest land, grassland, water areas, and unused land all decrease to varying degrees, suggesting that ecological protection measures, particularly the protection of water areas and forest land, should be strengthened in the future.
Under the economic development scenario, construction land increases significantly from 6966.05 km2 in 2020 to 8733.7665 km2 in 2030, an increase of 1767.72 km2, which is the largest increase among the four scenarios. Meanwhile, cultivated land decreases substantially from 34,438.27 km2 in 2020 to 32,677.34 km2 in 2030, a reduction of 1760.93 km2. The primary source of construction land is the conversion of cultivated land, while other land types remain almost unchanged. Under this scenario, given the substantial loss of cultivated land, cultivated land protection measures should be strengthened in the future to ensure food security and agricultural sustainability.
Under the sustainable development scenario, compared with 2020, cultivated land, grassland, water areas, and unused land in 2030 all show decreasing trends, with reductions of 838.71 km2, 15.55 km2, 14.9 km2, and 0.16 km2, respectively. Construction land and forest land increase by 862.68 km2 and 6.71 km2, respectively. In terms of conversion direction, cultivated land is mainly converted to construction land; forest land and water areas remain relatively stable; grassland and forest land undergo mutual conversion; and unused land is mainly converted to construction land. Under this scenario, although cultivated land still decreases, the rate of decrease is substantially mitigated, while construction land maintains a relatively high growth rate, and the area of unused land is the smallest among the four scenarios. This scenario ensures both the protection of cultivated land and the ecological environment, while also accommodating economic development. In the future, cultivated land protection measures should be further strengthened to ensure food security and agricultural sustainability.
3.2. Spatiotemporal Changes in Habitat Quality
- (1)
- Analysis of habitat quality change from 2000 to 2020
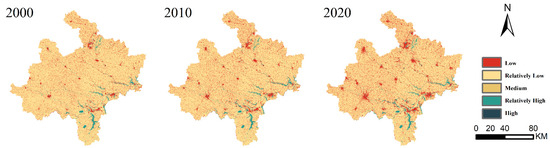
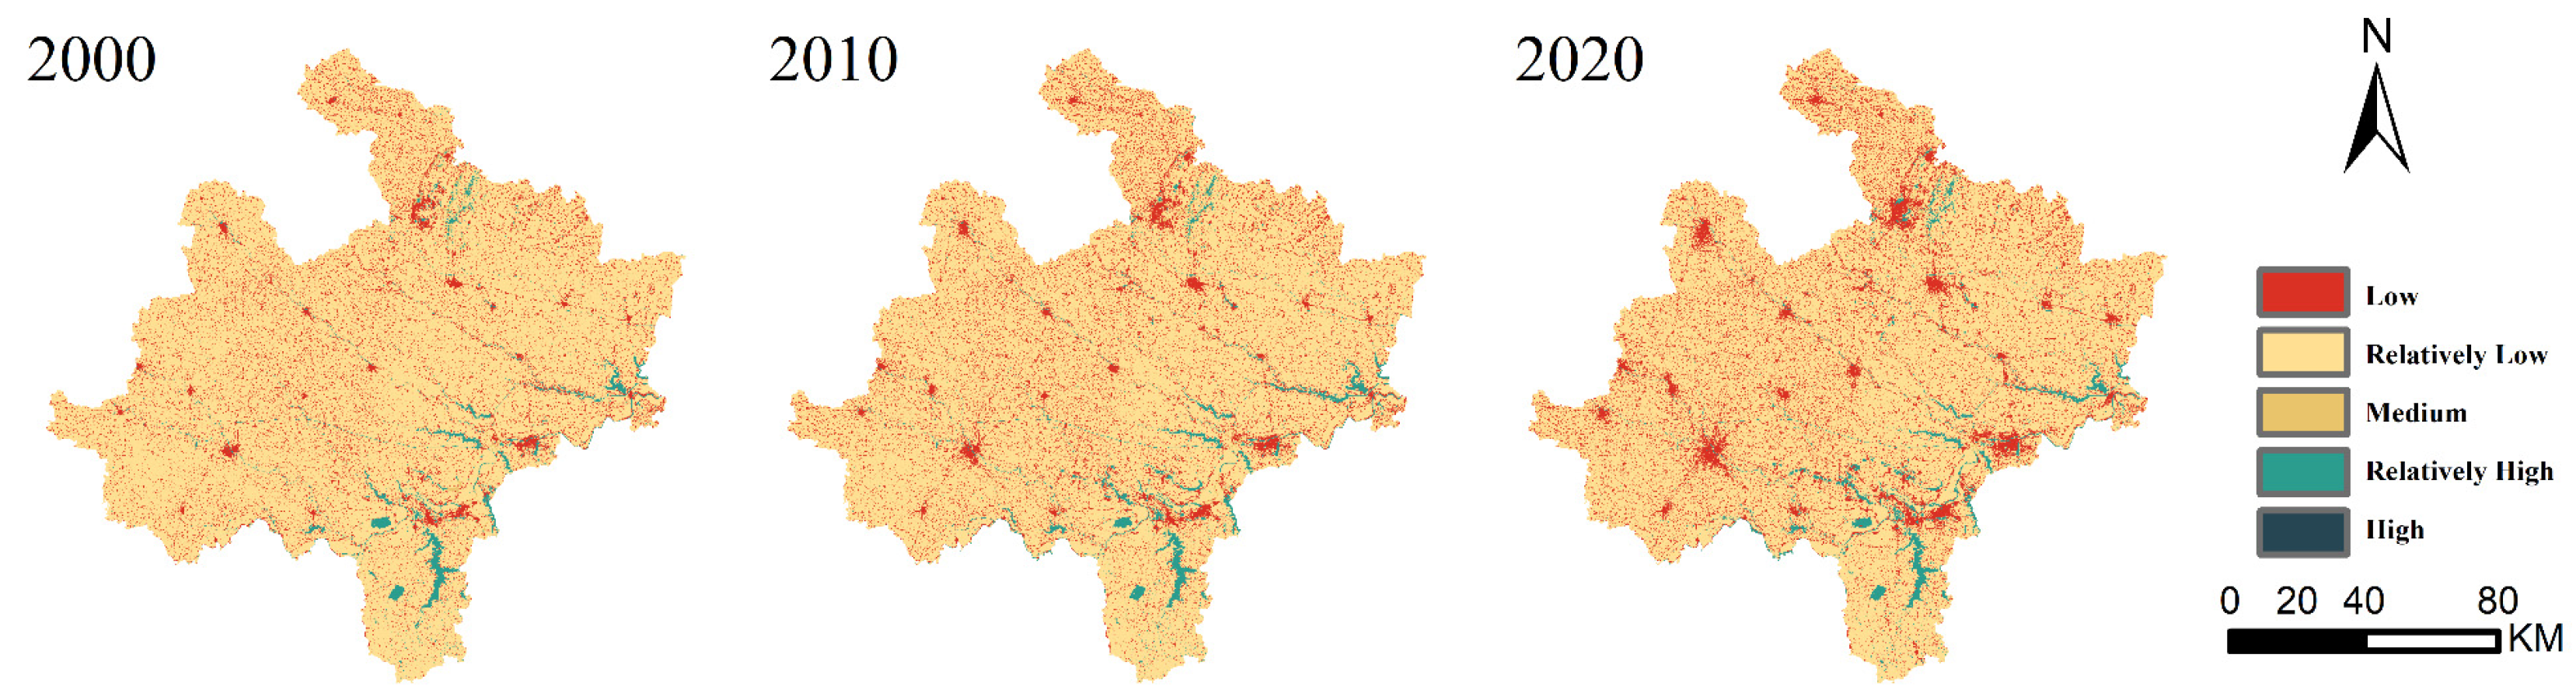
It should be noted that the habitat quality index is a model-estimated value derived from InVEST parameter settings, rather than field-measured data. The low-habitat-quality pattern partly reflects the cropland suitability weight (0.3) and threat parameter specifications. Therefore, the results should be interpreted as a relative assessment under a specific parameter framework, rather than an absolute measurement of ecological quality. By inputting land use data, the spatial distribution of threat factors, species habitat suitability parameters, and other relevant data into the habitat quality module of the InVEST model, the corresponding Habitat Quality Index (HQI) was obtained. Based on relevant literature [34] and the current conditions of the study area, the HQI was divided into five continuous intervals: 0–0.1, 0.1–0.3, 0.3–0.5, 0.5–0.7, and 0.7–1. These intervals respectively represent five distinct levels: low, relatively low, moderate, relatively high, and high. On this basis, the area corresponding to each habitat quality level and its proportional distribution within the study region were calculated (Table 5 and Figure 5).
Table 5.
Area Statistics of Habitat Quality Grades in Northern Anhui (2000–2020).
Figure 5.
Spatial Distribution of Habitat Quality in Northern Anhui from 2000 to 2020.
During the period from 2000 to 2020, the mean habitat quality in Northern Anhui decreased from 0.25 to 0.24, and further to 0.23, indicating a declining trend in habitat quality across the Northern Anhui Plain and highlighting an urgent need for policy intervention to regulate this decline. Although the relatively low habitat quality level remained dominant (accounting for 80.74% to 86.04%), its proportion gradually decreased over the years. In contrast, the low habitat quality level exhibited significant expansion, increasing by 44.5% (from 11.3% in 2000 to 16.33% in 2020). The moderate habitat quality level continued to shrink, dropping to less than 0.12% by 2020, forming a typical “middle depression” pattern. Although the relatively high habitat quality level showed steady growth (from 2.35% to 2.81%), its overall scale remained limited, while the high habitat quality level was nearly absent. Constrained by the land use pattern dominated by cultivated land, the overall habitat quality of the Northern Anhui Plain is relatively low, with a notable absence of high-quality habitat areas. As urbanization accelerates in the region, this phenomenon has become increasingly pronounced.
Spatially, the relatively low-quality level is widely distributed across the entire Northern Anhui Plain, which aligns closely with the pattern of land use distribution. The low-quality level is concentrated in urban and town areas with convenient transportation and exhibits a diffusive spread into surrounding regions, appearing as scattered point-like distributions throughout the Northern Anhui Plain. The relatively high-quality level is primarily located in the southeastern part of the study area, concentrated along rivers, lakes, and forested regions. This indicates that trends in land use change and habitat quality change are highly consistent.
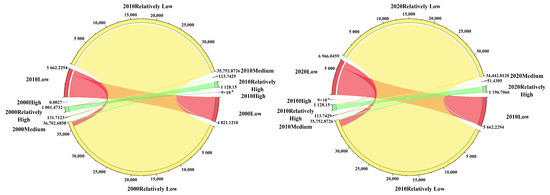
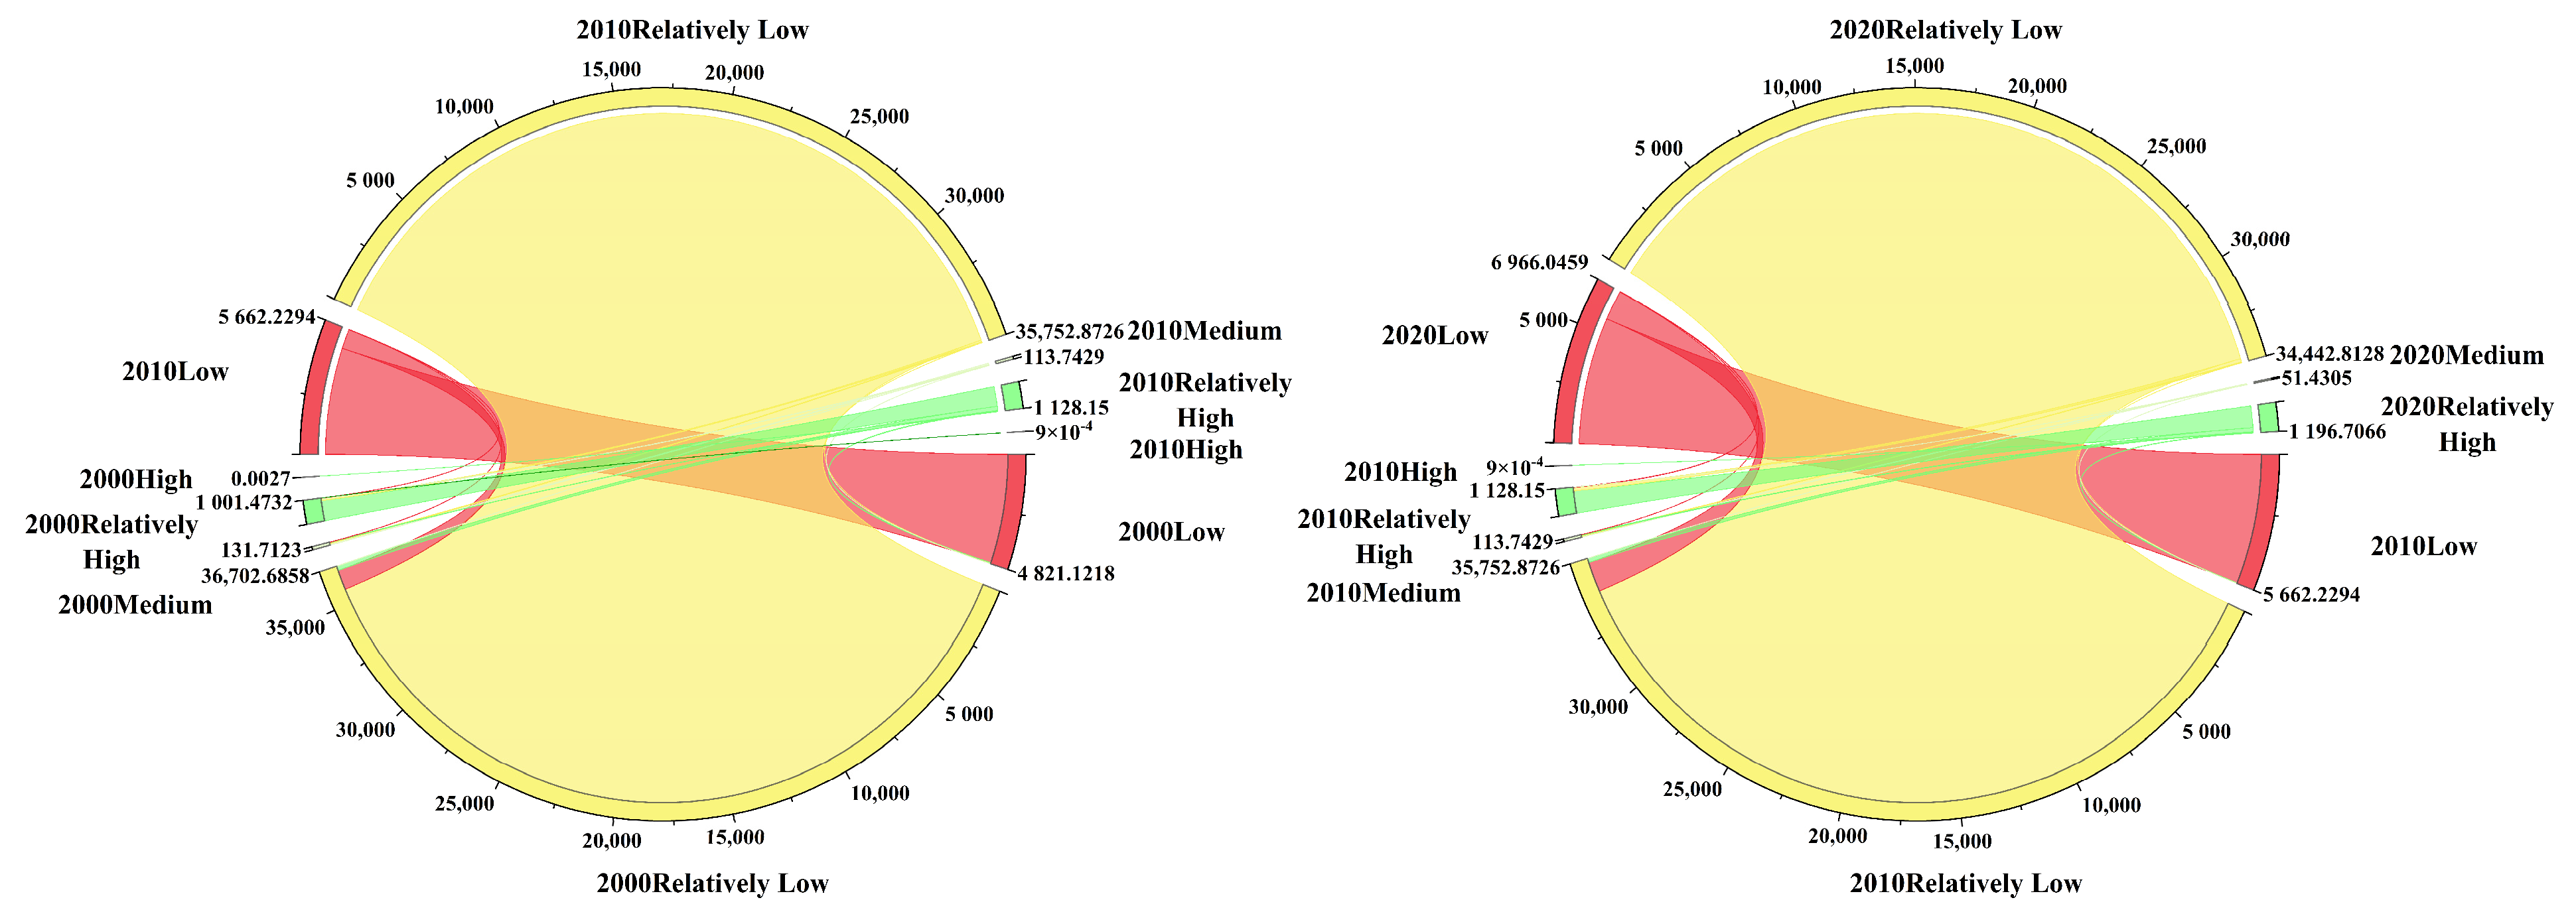
To further analyze the changes in the area of each habitat quality level in Northern Anhui from 2000 to 2020, habitat quality transition matrices were constructed for the periods 2000–2010 and 2010–2020 (Table 6). Additionally, chord diagrams were employed to quantitatively illustrate the transition processes among different habitat quality levels and the overall distribution of habitat quality levels during 2000–2020 (Figure 6). The results indicate that during 2000–2010, 96.93% of the Northern Anhui Plain maintained the same habitat quality level, while 2.44% of the area experienced habitat degradation, and 0.63% saw improvement. The largest area of habitat degradation was the transition from relatively low to low quality (875.32 km2), while 186.23 km2 of relatively low-quality habitat improved to a relatively high level. During 2010–2020, 95.87% of the Northern Anhui Plain retained its habitat quality level, while 3.70% of the area experienced degradation, and 0.60% showed improvement. The most significant area of habitat degradation was again the transition from relatively low to low quality (1307.38 km2), whereas 182.04 km2 of relatively low-quality habitat improved to a relatively high level.
Table 6.
Habitat Quality Area Transfer Matrix in Northern Anhui (2000–2020)/km2.
Figure 6.
Habitat Quality Area Transfer Chord Diagram in Northern Anhui (2000–2020)/km2.
- (2)
- Analysis of habitat quality change from 2020 to 2030
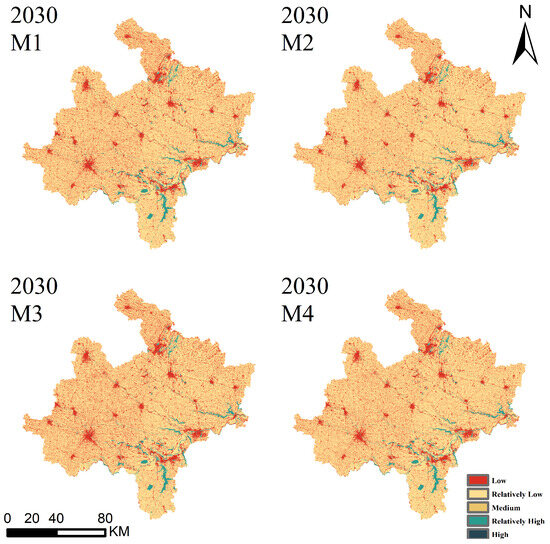
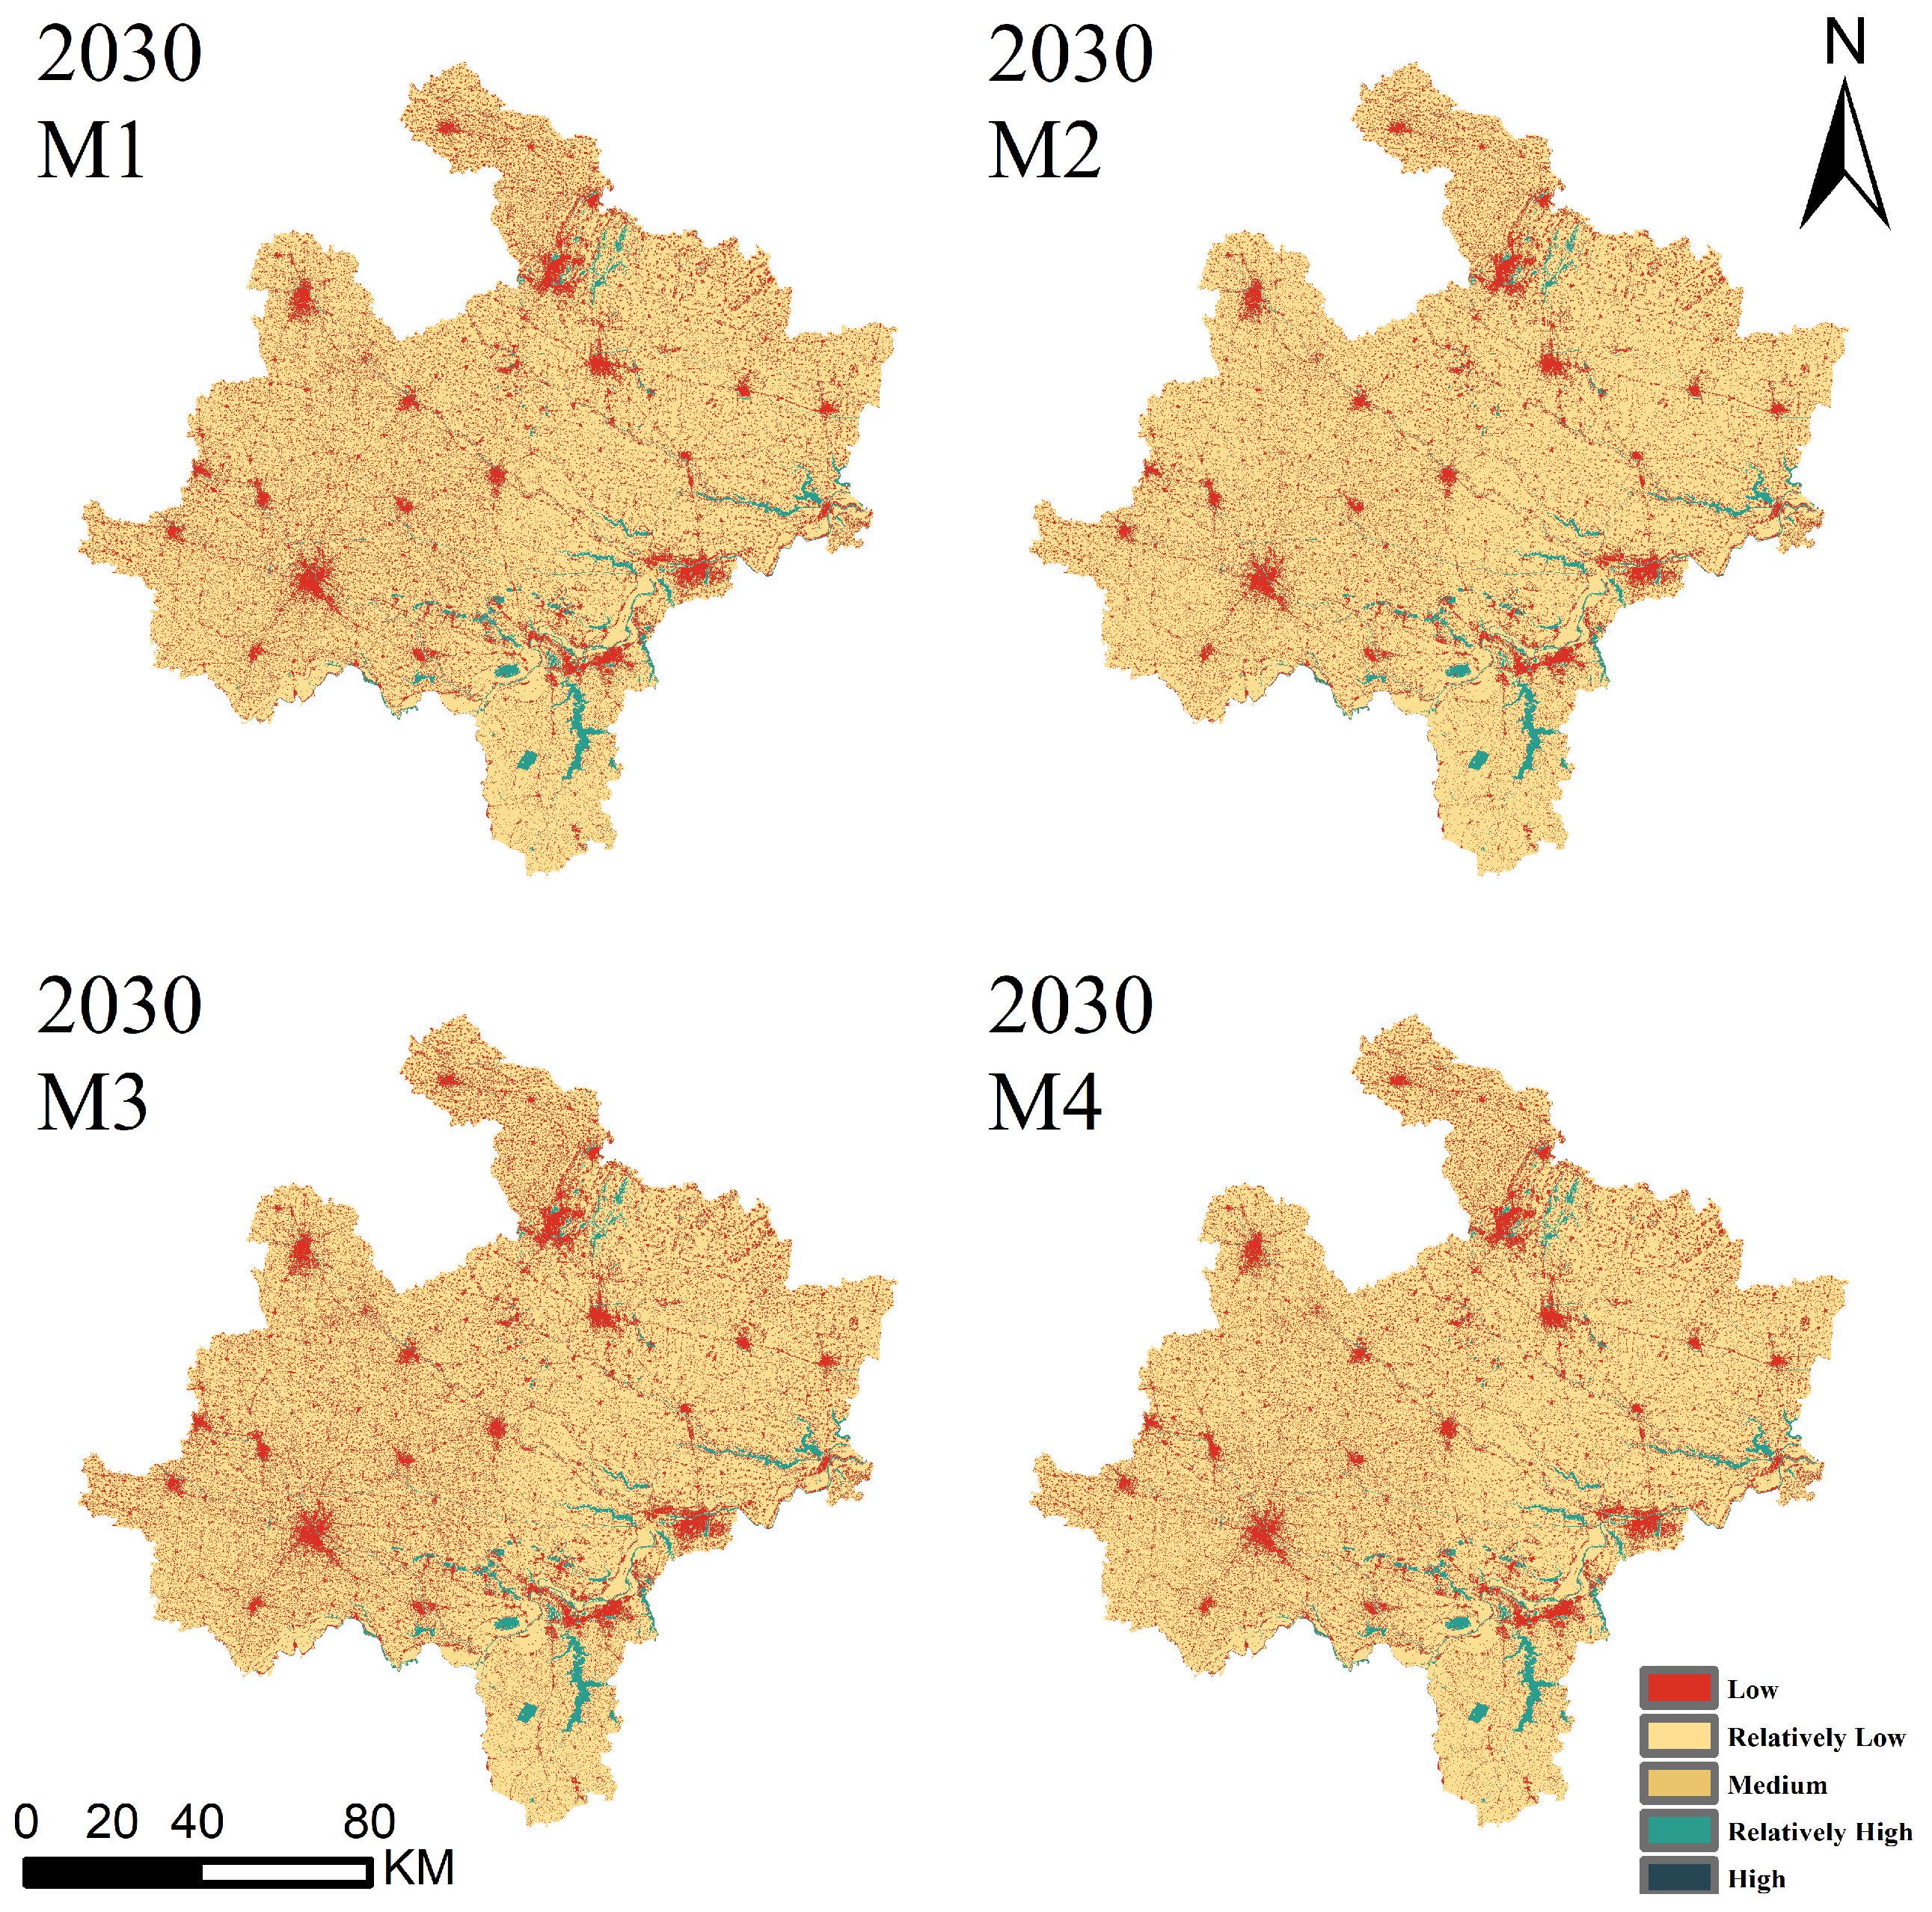
Based on the predicted land use data for the study area in 2030 under four different simulation scenarios, the habitat quality in the northern Anhui region for 2030 under different scenarios was obtained using the habitat quality module of the InVEST model. The spatial distribution of habitat quality under different scenarios in 2030 is generally consistent with that of 2020. The mean habitat quality values under various scenarios in 2030 range between 0.226 and 0.234, exhibiting clear differentiated fluctuations. Compared with 2020, habitat quality declines under all four simulation scenarios in 2030. Among them, the cultivated land protection scenario yields the highest mean habitat quality index, reaching 0.234 (a decrease of 0.2%, essentially unchanged from 2020), followed by the sustainable development scenario at 0.2288 (a decrease of 2.4%), then the natural development scenario at 0.2263 (a decrease of 3.5%), and the economic development scenario shows the lowest habitat quality at 0.2229 (a decrease of 5.0%, representing the most severe degradation). Thus, only the cultivated land protection scenario achieves habitat quality closest to that of 2020, while all other scenarios in 2030 exhibit significant degradation, with the economic development scenario experiencing the most serious deterioration.
Specifically, under the four scenarios in 2030, the area of low-grade habitat quality patches expands to varying degrees. Among them, the economic development scenario shows the largest expansion of low-grade habitat quality area, reaching 8733.77 km2 (25.4%), followed by the natural development scenario at 8214.87 km2 (17.9%), then the sustainable development scenario at 7828.73 km2 (12.4%), and finally the cultivated land protection scenario, which largely maintains the status quo at 7000.85 km2 (0.5%). It is evident that, except for the cultivated land protection scenario, all other scenarios exhibit substantial increases in low-grade habitat quality area, reflecting the immense pressure of ecological degradation in the northern Anhui region, which is closely related to accelerated urbanization and pollution caused by human activities. Under the natural development scenario, the expansion of low-grade habitat is the fastest; without policy regulation by the government, market-driven profit-seeking behavior may lead to excessively high land development intensity and the failure of protection policies.
Under the four scenarios in 2030, except for the cultivated land protection scenario, which shows a slight increase (0.1%), the area of relatively low-grade habitat quality patches degrades to varying degrees in the remaining scenarios. Among them, the economic development scenario exhibits the most obvious degradation (5.1%), followed by the natural development scenario (3.7%), and finally the sustainable development scenario (2.4%). The relatively low-grade habitat quality accounts for the largest proportion among all grades and is the dominant factor driving changes in habitat quality across the northern Anhui region.
Under the four scenarios in 2030, the area of medium-grade habitat quality patches degrades to varying degrees. For the higher-grade habitat quality patches, except for the cultivated land protection scenario, which shows a slight decrease (4.37%), the other scenarios all exhibit increases to varying degrees. Under all four scenarios, the area of high-grade habitat quality is zero. It can be observed that the proportion of areas above the medium grade is less than 3% in all cases, indicating that the entire northern Anhui region lacks high-quality habitat, and medium- to high-grade habitats are generally under pressure. This is primarily due to the poor ecological baseline conditions resulting from the current land use patterns in the northern Anhui region, as well as insufficient ecological and environmental protection caused by outdated ecological protection policies.
In summary, the expansion of low-grade habitat quality lowers the overall habitat quality of the northern Anhui region. The loss of relatively low- and medium-grade habitat quality not only reduces the overall habitat quality but also weakens ecological service functions such as biodiversity in the region. The absence of high-grade habitat raises concerns about the stability of the ecosystem across the northern Anhui region.
The results of the global spatial autocorrelation analysis are presented in Table 7. From 2000 to 2020, the global Moran’s I values for habitat quality in the Northern Anhui Plain were 0.55, 0.57, and 0.60, respectively. All Z-scores exceeded 160, and all p-values were less than 0.01, indicating that habitat quality in Northern Anhui exhibits significant spatial clustering characteristics. As shown in Figure 7, the global spatial autocorrelation index for habitat quality in the study area demonstrated a significant increasing trend from 2000 to 2020. This suggests a continuous enhancement in the spatial dependency of ecological units, with spatial clustering becoming increasingly pronounced. Low–Low clusters were primarily distributed in construction land areas and their surroundings, showing significant expansion, which aligns with the accelerating trend of urbanization. High–High clusters were mainly found in forested areas in the northeast and water bodies in the south, exhibiting a contracting trend. Non-significant clusters were predominantly distributed in cultivated land areas, occupying most of the Northern Anhui region. These non-significant clusters contracted as the High–High clusters expanded. The paradox that the farmland protection scenario performs “best” reveals a deep-seated tension: although this scenario shows the smallest decline in HQI, its absolute value remains low, and farmland itself is assigned a low suitability weight. This implies that (1) “protecting farmland” does not equate to “protecting habitat”—traditional farmland protection policies emphasize quantity and productivity while neglecting ecological quality; and (2) improvement pathways, in addition to enhancing farmland ecological quality—such as promoting buffer strips (width ≥ 5 m), increasing crop rotation diversity (from 2 to 4–5 species), reducing chemical inputs (e.g., a 20% reduction in fertilizer use), and conserving natural and semi-natural habitats along field margins—also require policies such as returning farmland to forests.
Table 7.
Area Statistics of Habitat Quality Grades in Northern Anhui, 2030.
Figure 7.
Spatial Distribution of Habitat Quality in Northern Anhui, 2030.
3.3. Spatial Clustering Characteristics of Habitat Quality
To conduct an in-depth investigation into the spatial differentiation characteristics of habitat quality in the Northern Anhui region, a 1 km × 1 km fishing net grid was constructed. Utilizing the spatial autocorrelation analysis tool in ArcGIS 10.8 software, global and local spatial autocorrelation analyses were performed on the habitat quality of the study area from 2000 to 2020. This approach systematically analyzes the spatial distribution characteristics and clustering patterns of habitat quality.
The results of the global spatial autocorrelation analysis are presented in Table 8. From 2000 to 2020, the global Moran’s I values for habitat quality in the Northern Anhui Plain were 0.55, 0.57, and 0.60, respectively. All Z-scores exceeded 160, and all p-values were less than 0.01, indicating that habitat quality in Northern Anhui exhibits significant spatial clustering characteristics. the global spatial autocorrelation index for habitat quality in the study area demonstrated a significant increasing trend from 2000 to 2020. This suggests a continuous enhancement in the spatial dependency of ecological units, with spatial clustering becoming increasingly pronounced. Low–Low clusters were primarily distributed in construction land areas and their surroundings, showing significant expansion, which aligns with the accelerating trend of urbanization. High–High clusters were mainly found in forested areas in the northeast and water bodies in the south, exhibiting a contracting trend. Non-significant clusters were predominantly distributed in cultivated land areas, occupying most of the Northern Anhui region. These non-significant clusters contracted as the High–High clusters expanded.
Table 8.
Global Spatial Autocorrelation of Habitat Quality in Northern Anhui (2000–2020).
3.4. Analysis of Driving Factors for Habitat Quality
- (1)
- Optimal Parameter Identification
To enhance the accuracy of spatial clustering analysis using the Geographic Detector, this study established an optimal combination of spatial scale, data discretization algorithms, and the number of stratification breakpoints. Sixteen driving factors were selected across three dimensions: natural environment, socioeconomic factors, and locational factors. The explanatory power of different driving factors varies significantly across different spatial scales (Table 9). With reference to relevant literature [35], the optimal spatial scale parameter was determined by comparing the 90th percentile values of the q statistic for each driving factor across different spatial scales, selecting the scale level corresponding to the peak percentile value [35]. In ArcGIS, we created a 4 km fishnet grid, extracted values using the mean sampling method to obtain raster data for independent and dependent variables, and input them into the OPGD model, yielding Q values for each spatial scale. As the spatial scale increased, the 90th percentile of the Q statistic exhibited a fluctuating upward trend, followed by a slight decline, yet the final value remained significantly higher than the initial value, and the 90th percentile peaked at 4 km. Consequently, a spatial scale of 4 km was identified as the optimal parameter.
Table 9.
The 90th percentile of the q-statistics for different driving factors at various spatial scales.
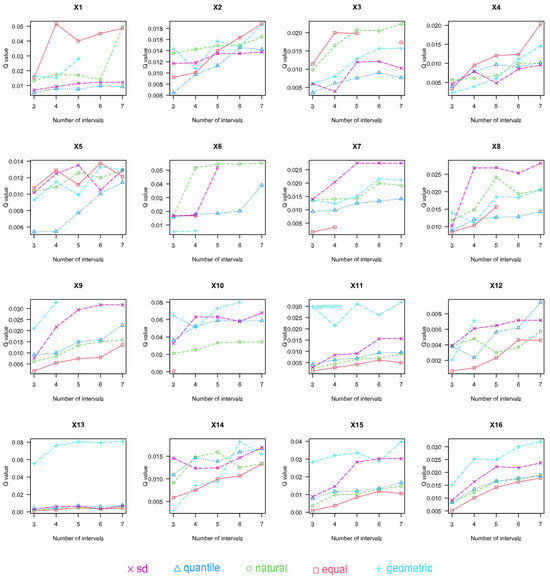
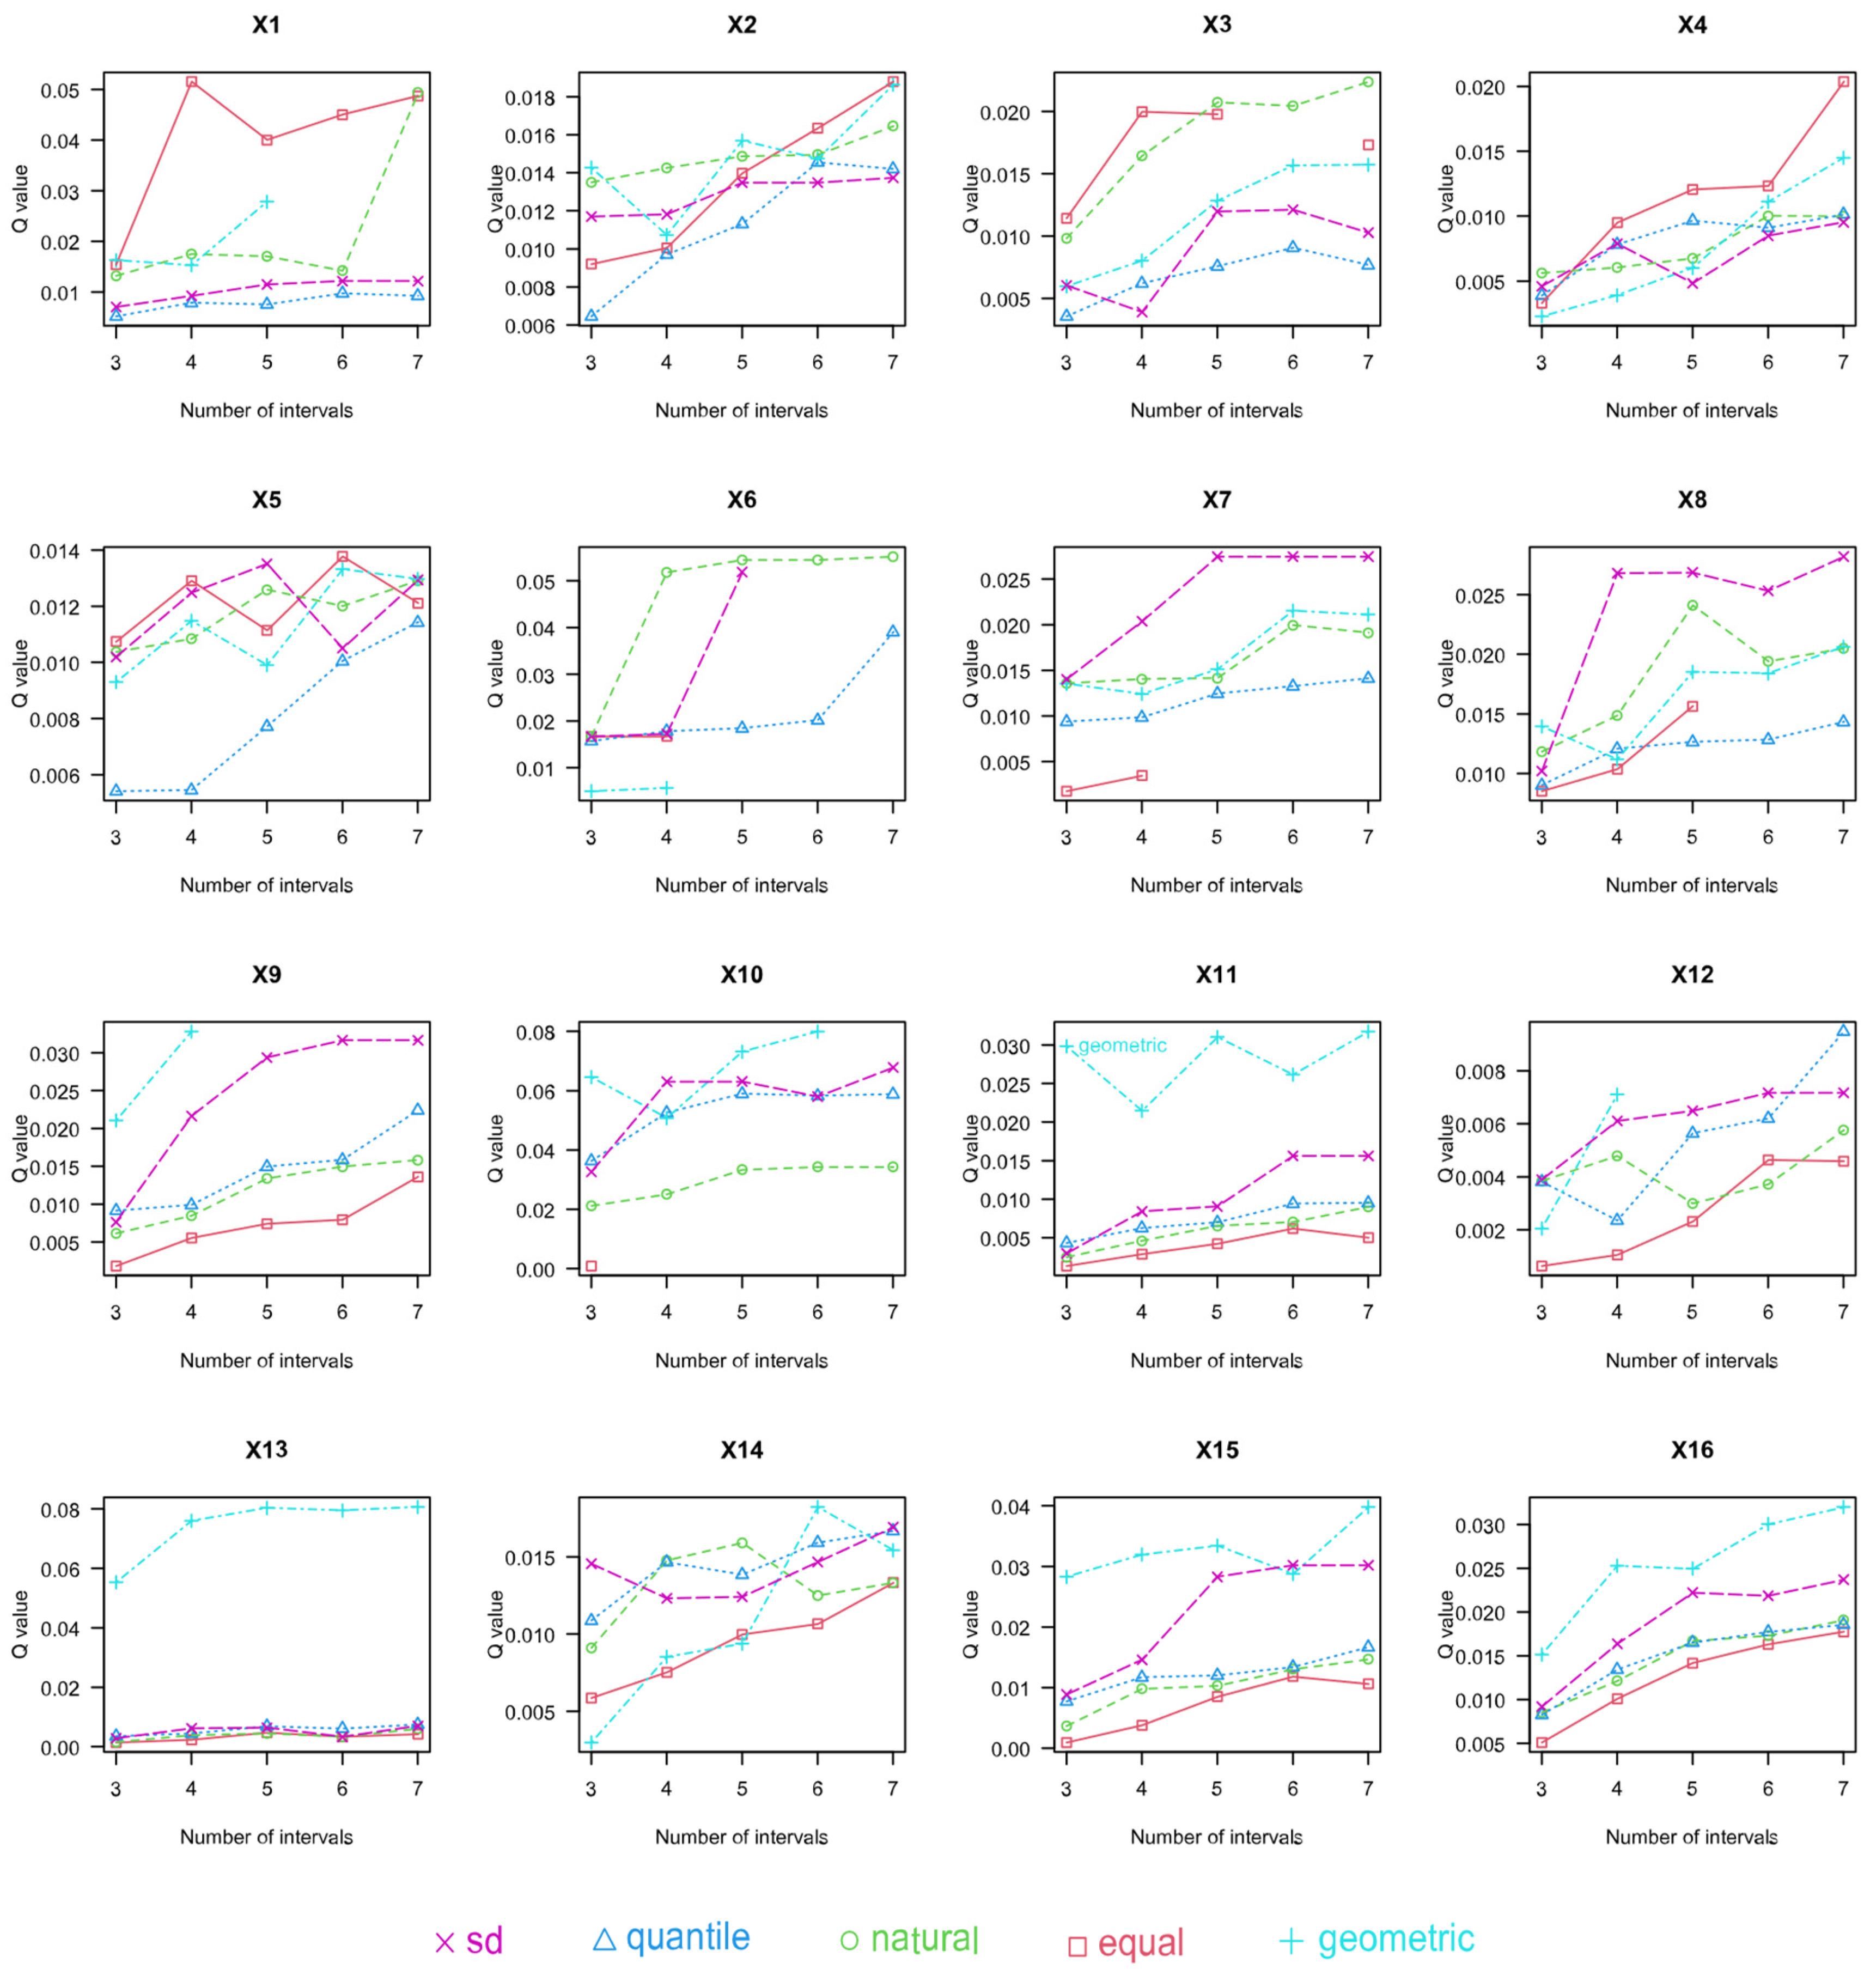
This study employed five discretization algorithms: Equal Interval (equal), Natural Breaks (natural), Quantile (quantile), Geometric Interval (geometric), and Standard Deviation (sd). By comparing the q values of these five algorithms with stratification breakpoints ranging from 3 to 7 classes, the algorithm and number of breakpoints yielding the highest q value were identified as the optimal discretization method and stratification level. As shown in Figure 8, taking NDVI (X1) as an example, the q value was maximized (0.052) under the Equal Interval classification with 4 classes—approximately five times greater than the q value (0.01) under the Quantile method. Similarly, the optimal classifications were determined as follows: using the Equal Interval method, Slope (X2) and Mean Annual Temperature (X4) were divided into 7 classes, and Mean Annual Precipitation (X5) into 6 classes; using the Natural Breaks method, DEM (X3) and Soil Type (X6) were divided into 7 classes; using the Standard Deviation method, GDP (X7) and Population (X8) were divided into 7 classes; using the Quantile method, Distance to Tertiary Roads (X12) was divided into 7 classes; using the Geometric Interval method, Distance to Secondary Roads (X11), Distance to Water Bodies (X13), Distance to County Government (X15), and Distance to Township Government (X16) were divided into 7 classes, while Distance to Primary Roads (X10) and Distance to Railways (X14) were divided into 6 classes, and Distance to Major Roads (X9) into 4 classes.
Figure 8.
Data Discretization Algorithm and Number of Classification Breaks at the 4 km Spatial Scale.
- (2)
- Analysis of Driving Forces for Habitat Quality
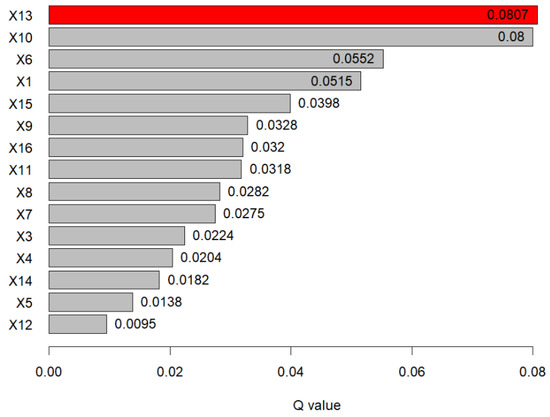
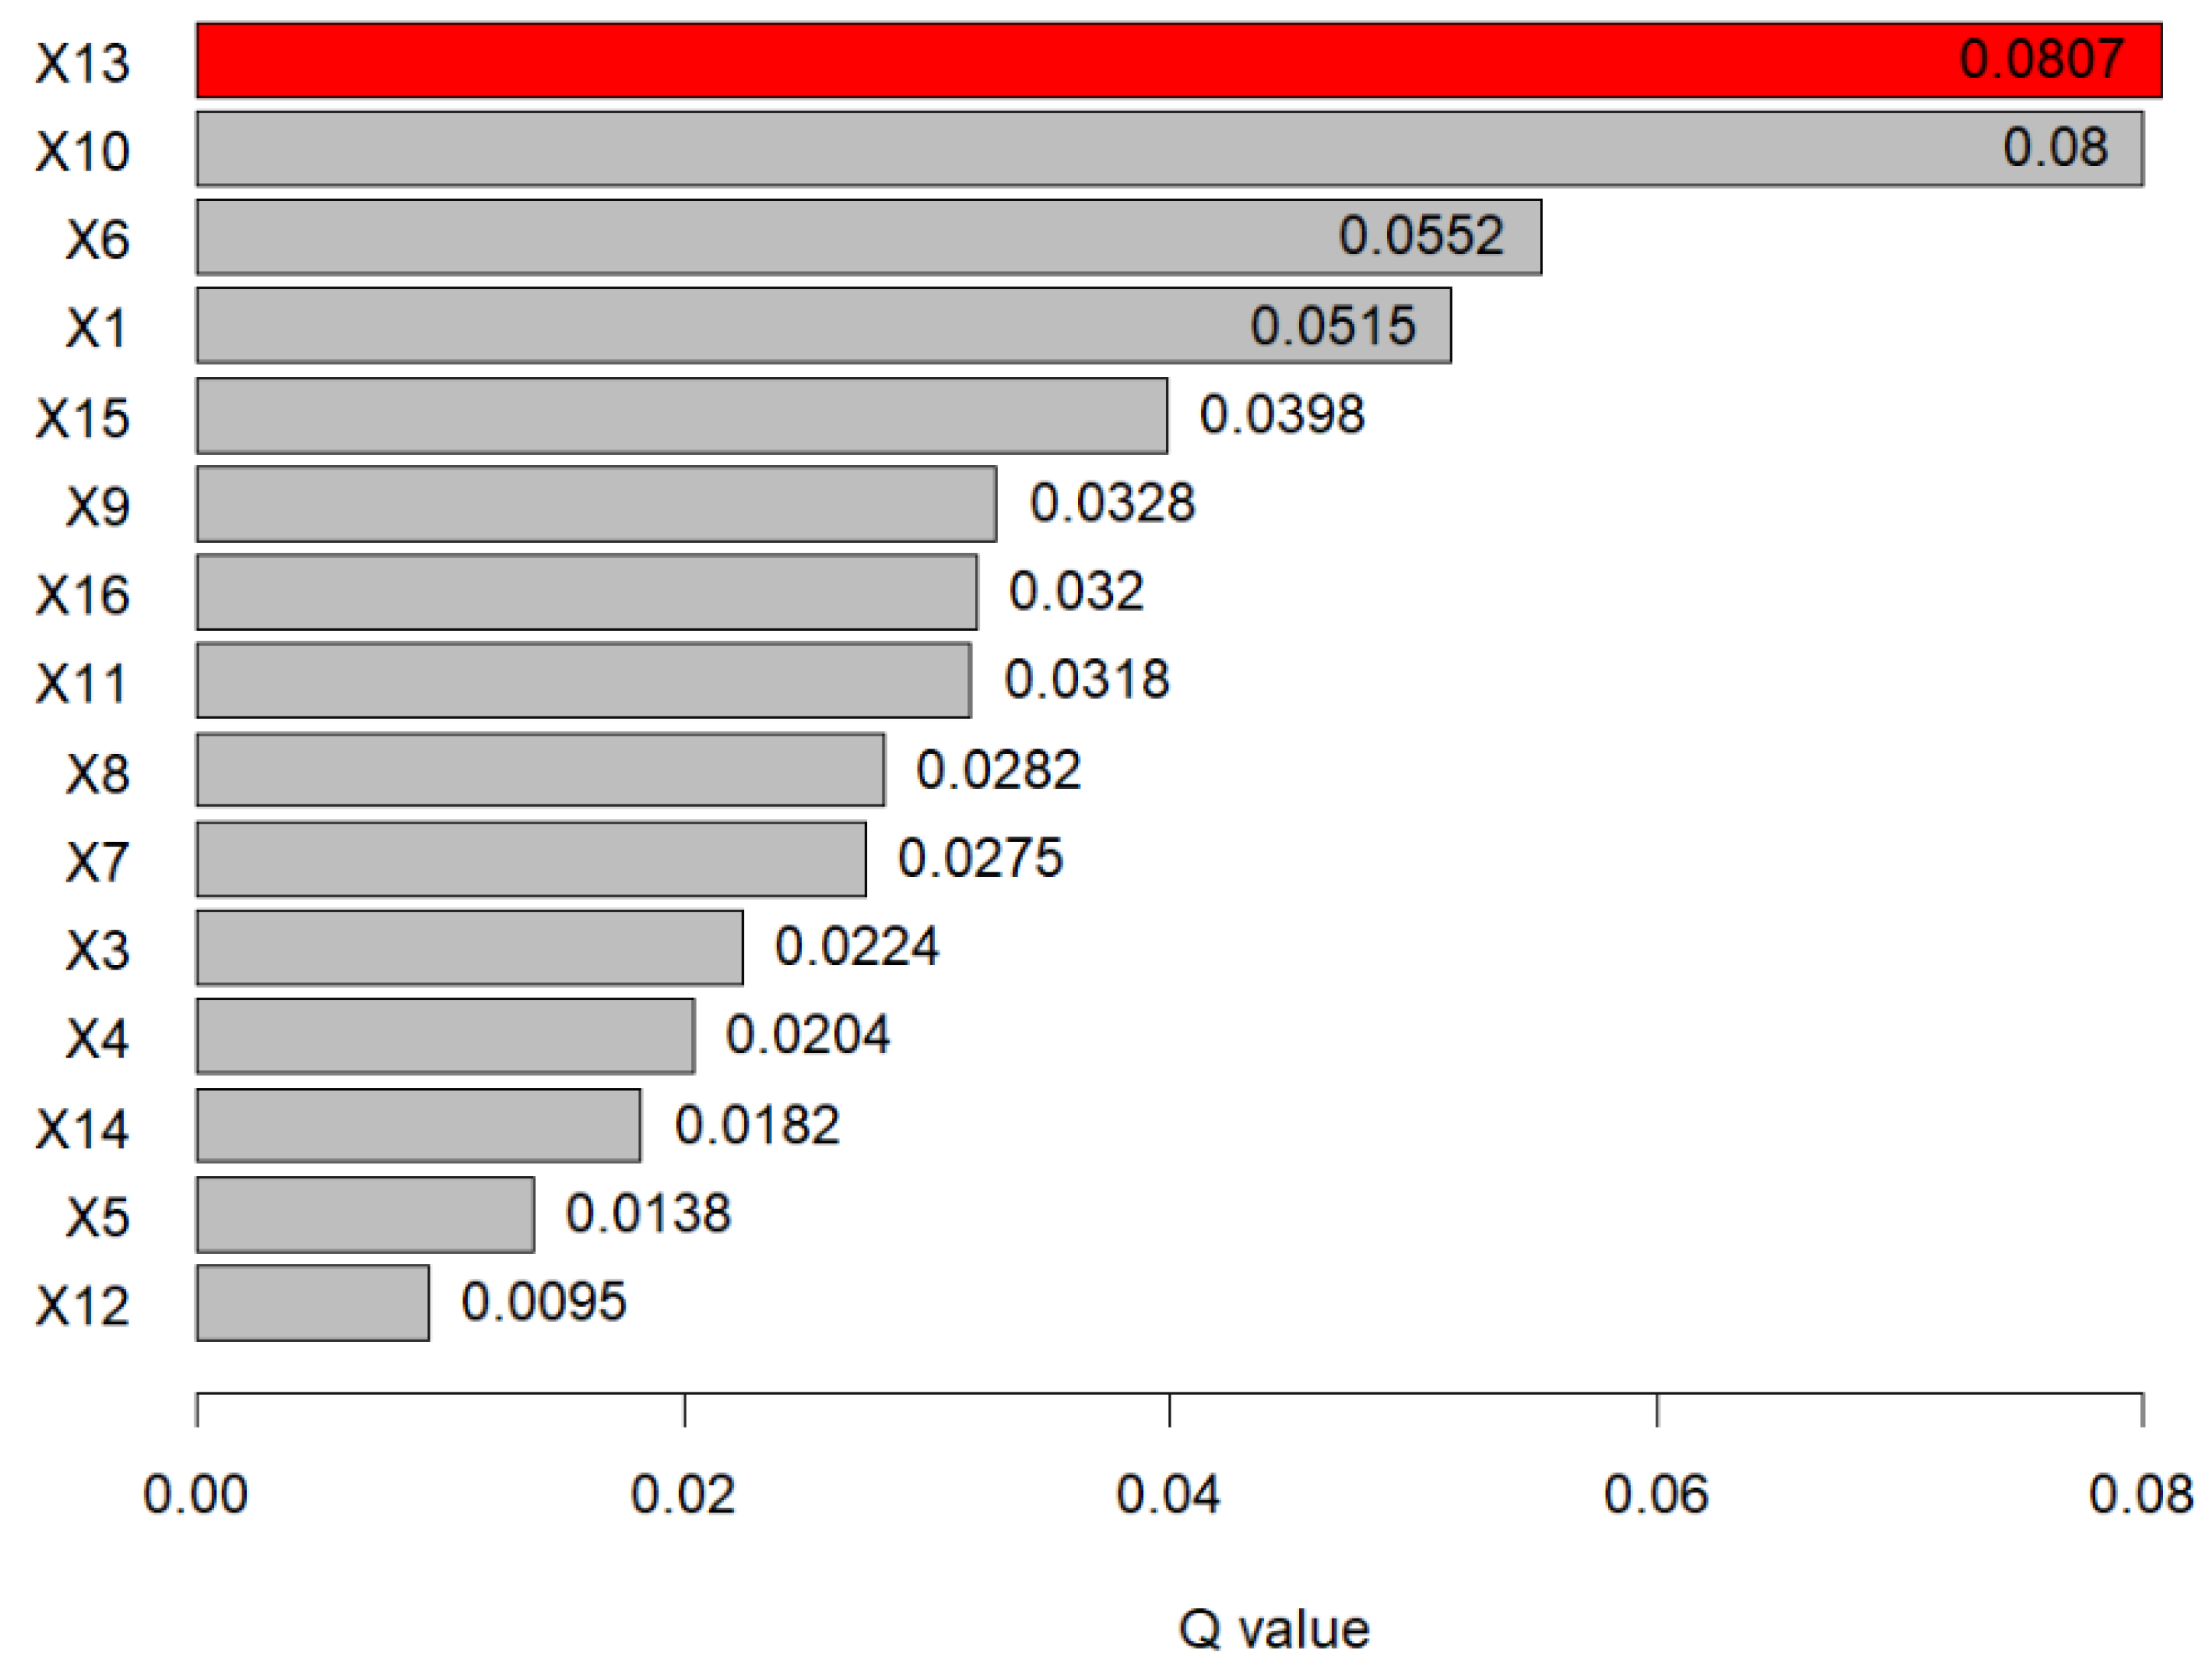
Based on the optimal parameters identified above, this study employed the Geographic Detector model to conduct an in-depth analysis of the impact of influencing factors across three dimensions—natural environment, socioeconomic conditions, and locational factors—on habitat quality in Northern Anhui. The results of the single-factor detection are shown in Figure 9. The explanatory power of different influencing factors on habitat quality in Northern Anhui varies significantly, ranked in descending order as follows: distance to water bodies > distance to secondary roads > soil type > NDVI > distance to county government > distance to primary roads > distance to township government > distance to tertiary roads > population > GDP > DEM > mean annual temperature > slope > distance to railways > mean annual precipitation > distance to quaternary roads. Among these, the factor with the greatest explanatory power is distance to water bodies (0.08), followed closely by soil type (0.08). Among the three dimensions, locational factors exert the strongest influence on the spatial distribution pattern of habitat quality in Northern Anhui, followed by soil type and NDVI within the natural environment dimension, and finally, the socioeconomic dimension. The highest single-factor Q value was 0.08 (for distance to water bodies), indicating that the explanatory power of any individual factor is limited—consistent with the highly human-modified nature of farmland-dominated plains, where habitat quality is shaped by multiple interacting factors rather than dominated by a single variable. The relative prominence of locational factors (e.g., roads and water bodies) reflects the combined constraints of human activity accessibility and water resource availability, rather than a deterministic role.
Figure 9.
Optimal Parameter Geodetector Single Factor Detection Results for Habitat Quality in Northern Anhui.
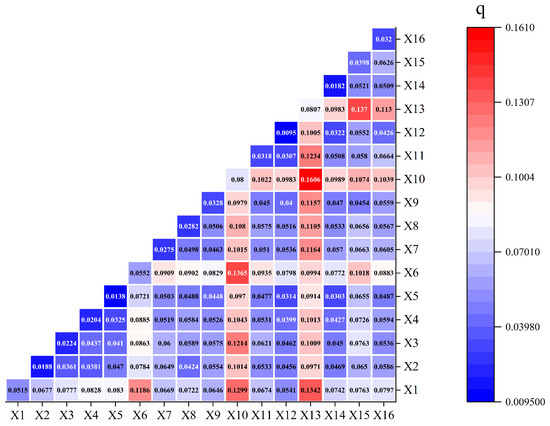
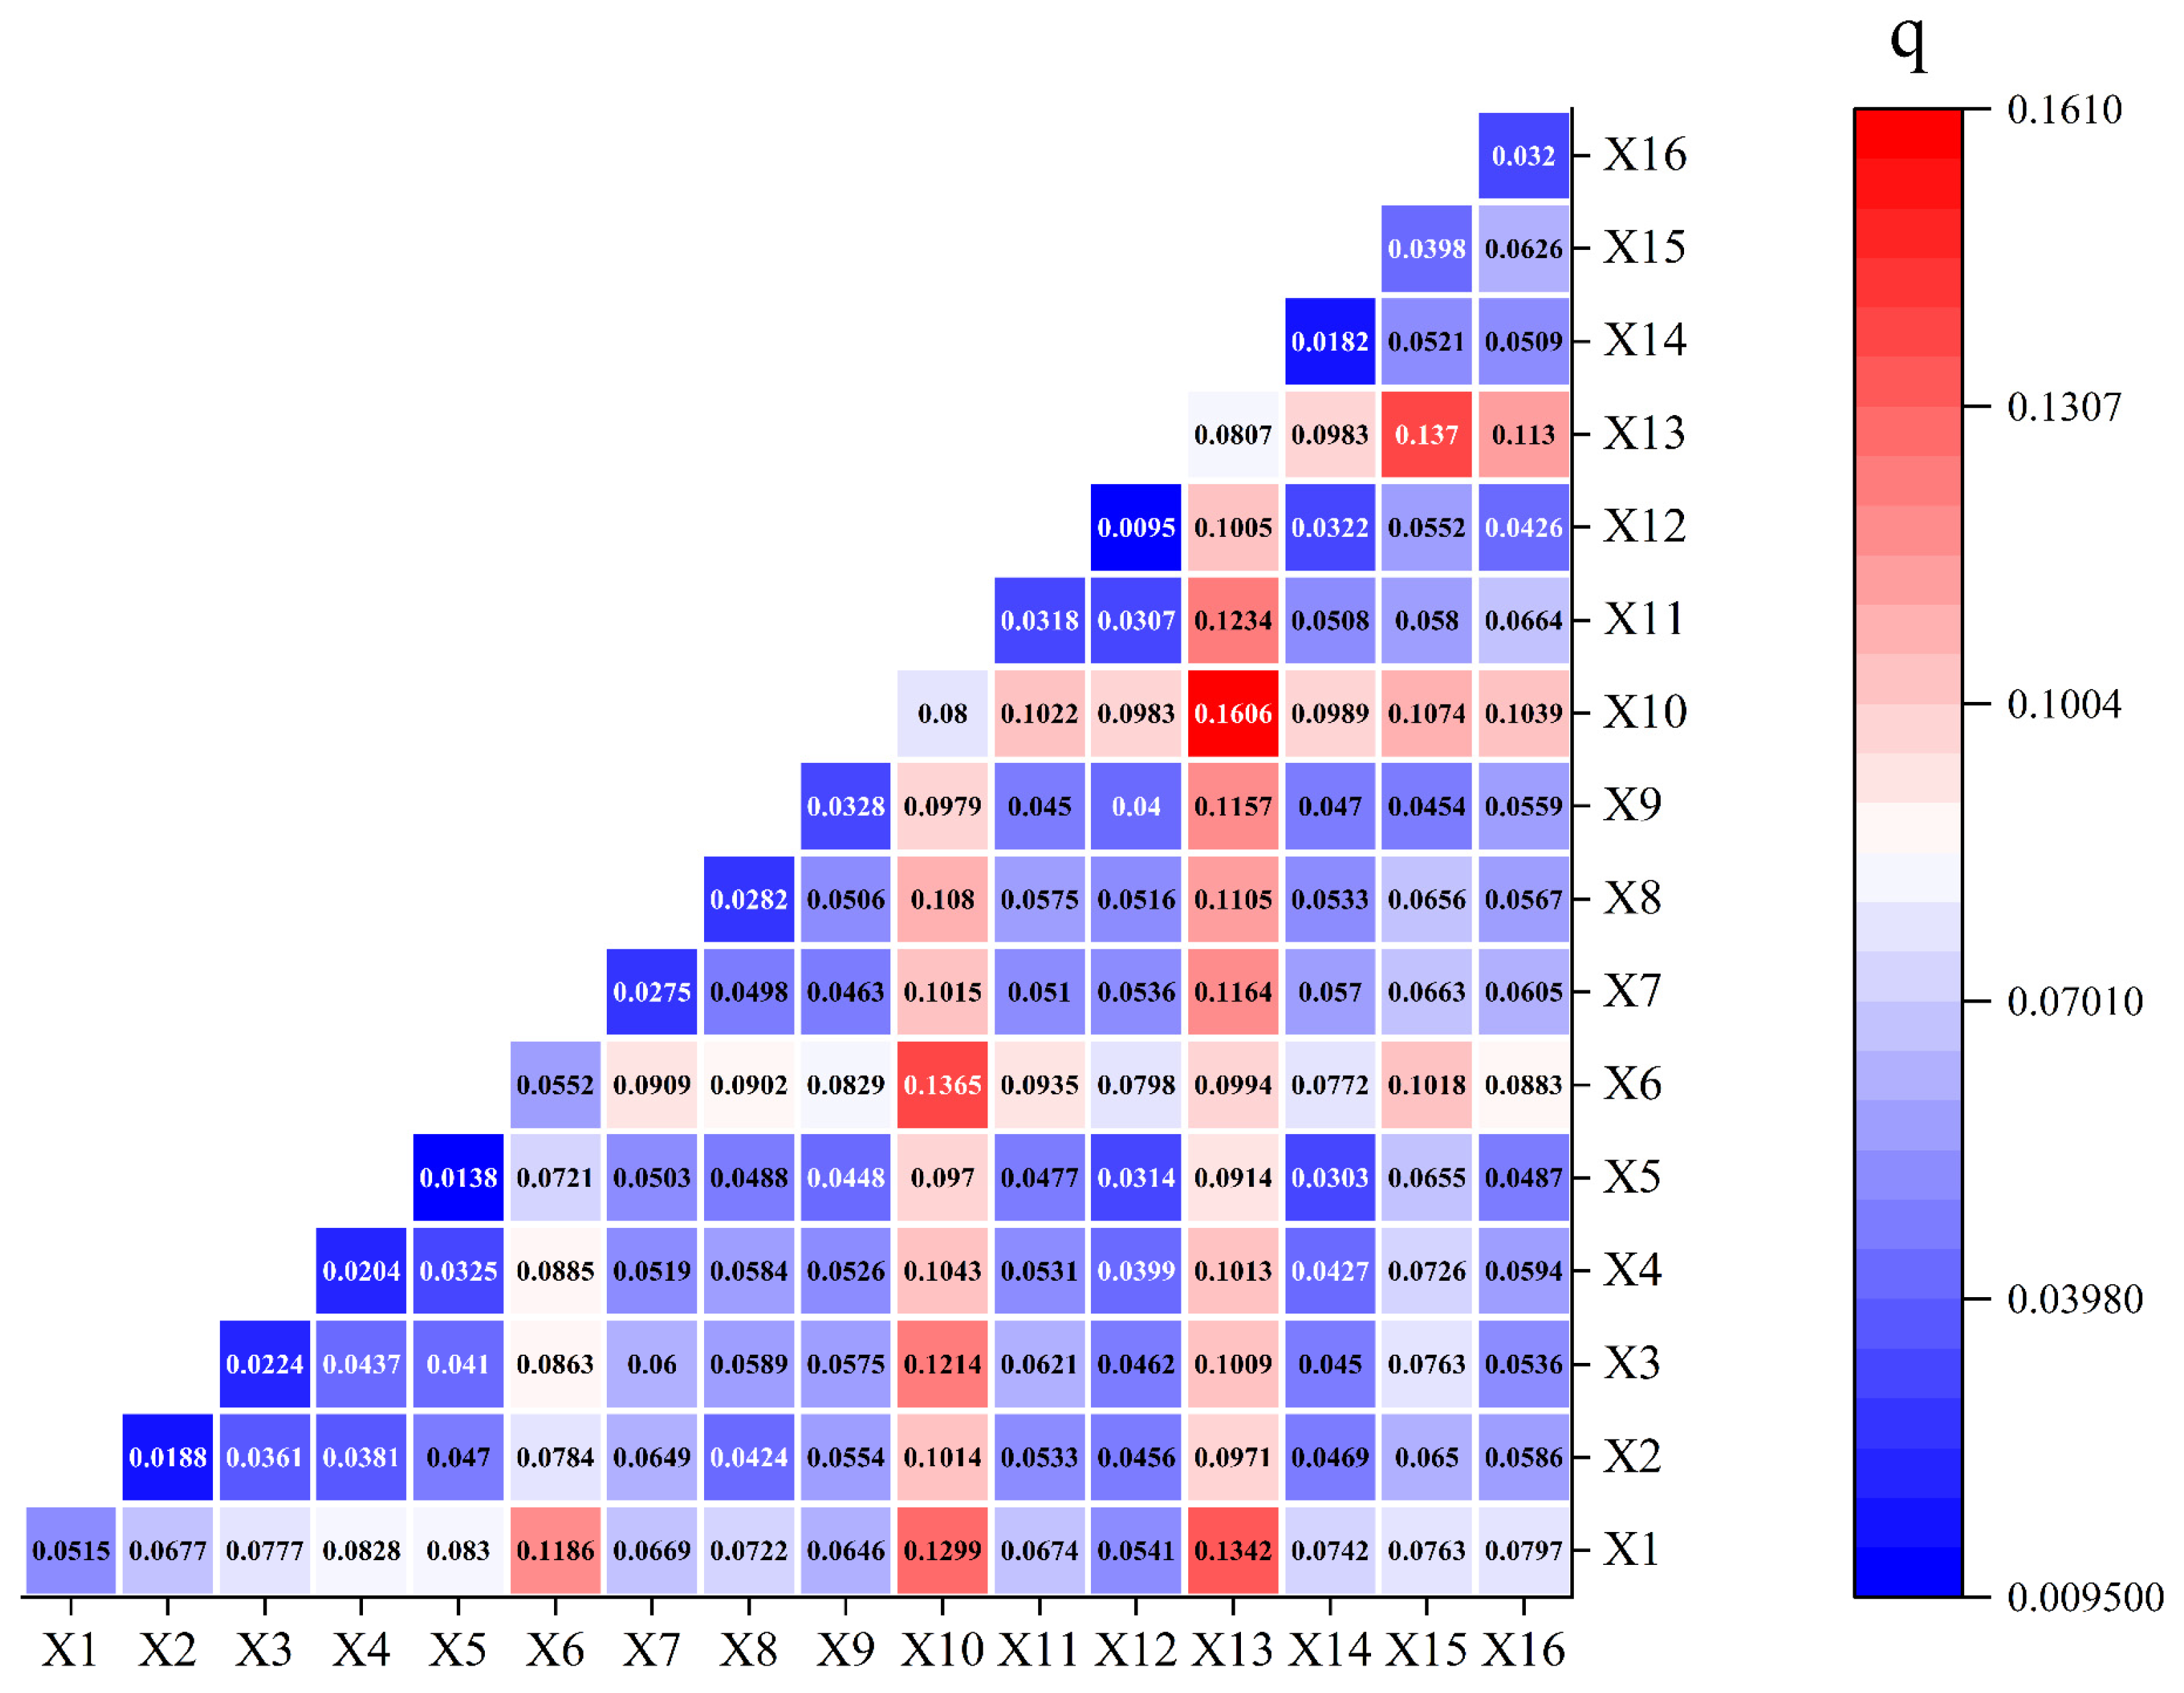
Geographical detector interactions are categorised into three types: nonlinear weakening (antagonistic), bivariate enhancement (ordinary synergy), and nonlinear enhancement (super-additive synergy, 1 + 1 > 2), with explanatory power ranking in descending order: nonlinear enhancement > bivariate enhancement > nonlinear weakening. The results of the interaction detection among influencing factors (Figure 10) indicate that, following interaction, all factors—except for the combination of X11∩X12, which showed a weakening effect—enhanced their explanatory power regarding habitat quality. Specifically, these interactions included 1 pair exhibiting non-linear weakening of a single factor, 45 pairs showing bi-factor enhancement, and 74 pairs demonstrating non-linear enhancement. The interaction factors that exerted a relatively high influence on the spatial distribution pattern of habitat quality in Northern Anhui include X1∩X6, X1∩X10, X1∩X13, X3∩X10, X6∩X10, X7∩X13, X10∩X13, X11∩X13, X13∩X15, and X15∩X16. Among all interaction factors, the combination with the greatest explanatory power was the interaction between distance to water bodies (X13) and distance to secondary roads (X10), achieving a bi-factor enhancement q-value of 0.16. This was followed by the interaction between distance to water bodies (X13) and distance to county government (X15), with a non-linear enhancement q-value of 0.14. Next was the interaction between soil type (X6) and distance to secondary roads (X10), also showing a non-linear enhancement q-value of 0.14. Subsequently, the interaction between NDVI (X1) and distance to water bodies (X13) yielded a non-linear enhancement q-value of 0.13. Among all interaction factors, the combination with the smallest explanatory power was the interaction between mean annual precipitation (X5) and distance to railways (X14), with a bi-factor enhancement q-value of 0.03, as well as the interaction between distance to tertiary roads (X11) and distance to quaternary roads (X12), which exhibited a non-linear weakening effect on a single factor with a q-value of 0.03. The low Q value may reflect the following variables not included in this study: (1) agricultural management intensity, such as chemical fertilizer and pesticide application rates, for which spatially explicit data are lacking; (2) irrigation regimes, i.e., the differential effects of well irrigation versus canal irrigation; (3) crop diversity, measured by a crop rotation complexity index; (4) field margin width; and (5) implementation intensity of ecological compensation policies. These variables are key regulating factors of habitat quality in agricultural plain areas, and future research should obtain them through household surveys or high-resolution remote sensing.
Figure 10.
Interaction Detection Results of Driving Factors for Habitat Quality in Northern Anhui.
4. Discussion
The application of InVEST in farmland-dominated areas has structural limitations: for instance, treating farmland as a threat source may underestimate the ecosystem service functions of agricultural landscapes and fails to distinguish between intensive farmland and ecological farmland. Therefore, the habitat quality index should be interpreted as a relative assessment rather than an absolute measure of ecological value.
As a key indicator for assessing regional ecosystem health, habitat quality is increasingly threatened by anthropogenic influences, particularly land use changes driven by human activities [36]. Therefore, it is essential to analyze the land use patterns within the study area prior to habitat quality assessment. Figure 3 and Table 4 reveal that since 2000, cultivated land in Northern Anhui has rapidly decreased, while construction land has expanded significantly. This trend in land use change is highly consistent with the acceleration of industrialization and urbanization in Northern Anhui, characterized by the continuous expansion of urban populations and rising urbanization rates. This study assessed habitat quality over two decades in Northern Anhui using the habitat quality module of the InVEST model. Table 5 and Figure 5 show that the overall habitat quality in the region is relatively low (areas with a habitat quality index below 0.3 account for over 97%) and has been declining year by year (the mean habitat quality index decreased from 0.2479 in 2000 to 0.2426, and further to 0.2345 in 2020). This indicates that habitat quality in Northern Anhui is lower compared to southern Anhui, and the declining trend aligns with the overall decrease in the habitat quality index observed across Anhui Province [37]. The rapid deterioration of habitat quality in Northern Anhui can be primarily attributed to two factors. First, as a typical plain region dominated by cultivated land, the flat terrain constraints lead to a highly clustered distribution of cultivated and construction land, with cultivated land occupying over 80% of the total area. This contributes to the overall low habitat quality in the region. Second, under the context of rapid urbanization, the high population density and rapid urban expansion. have led to a significant increase in construction land, which continuously encroaches on grassland and forest land. Consequently, habitat quality has deteriorated over the past two decades, with an accelerating trend in the latter decade. This poses a substantial threat of habitat degradation and reflects the worsening ecological environment. Furthermore, the habitat quality transitions from 2000 to 2020 exhibit distinct characteristics. As urbanization accelerated, cultivated land decreased substantially while urban land increased significantly, resulting in vegetation destruction and a decline in the habitat quality index. This illustrates the response relationship between land use change and habitat quality [38]. Overall, habitat quality progressively degraded from higher to lower levels, with the deterioration accelerating in the second decade compared to the first. This is linked to the acceleration of urbanization. Concurrently, a small number of areas experienced habitat quality improvement, which can be attributed to measures such as the Grain for Green Program and wetland conservation. In the Northern Anhui Plain, it is recommended to implement farmland ecological measures that do not compromise food security: (1) naturalization of field margins (occupying 3–5% of farmland, without affecting yield in core production areas); (2) winter fallow with cover crops (to increase pollinator habitat); (3) rice–wetland composite systems (applicable to the rice-growing areas of Northern Anhui); (4) biological pest control as a substitute for chemical pesticides (to reduce non-target effects); and (5) conservation tillage (no-till or reduced tillage, to enhance soil biodiversity). These measures have been successfully implemented in Europe as well as in China’s Zhejiang and Sichuan provinces, and can be piloted and extended in the Northern Anhui region.
Spatial autocorrelation results indicate that habitat quality in Northern Anhui exhibits significant spatial clustering. Low–Low clusters are primarily distributed in urban cores such as Fuyang, Huainan, and Bozhou, showing marked expansion. In a study on habitat quality in Suzhou, Jiangsu Province, Li et al. found that High–High clusters were mainly distributed around Taihu Lake, the Yangtze River Basin, and Yangcheng Lake, while Low–Low clusters were concentrated in urban areas of Suzhou and county-level urban cores. These findings are consistent with the results of this study. As urbanization accelerates, the expansion of Low–Low clusters suggests that habitat quality in Northern Anhui may continue to deteriorate in the future [39]. High–High clusters are mainly found in forested areas in the northeast and water bodies in the south, exhibiting a contracting trend. The distribution characteristics of these clusters reveal the spatial clustering patterns of habitat quality, providing important references for regional ecological conservation and land use planning. Non-significant clusters are predominantly distributed in cultivated land areas, occupying most of Northern Anhui and contracting as High–High clusters expand. Based on the clustering types, differentiated strategies are proposed as follows: ➀ Low–Low clusters: prioritize ecological reconstruction, implement total built-up land control, and carry out brownfield remediation; ➁ High–Low clusters: implement ecological buffering, delimit urban growth boundaries, and construct greenbelts around the city; ➂ Low–High clusters: strengthen corridor connections and establish a stepping-stone habitat network; ➃ High–High clusters: adopt strict protection and incorporate them into the core areas of the ecological redline.
This study finds that high-value habitat areas and low-value areas are highly solidified in space, with minimal changes. This contrasts sharply with the dynamic migration patterns of habitat quality observed in more heterogeneous hilly or mountainous regions. This “lock-in effect” primarily stems from the highly simplified land cover types and functional stability in plain areas. Under the rigid constraint of food security, high-quality arable land is strictly protected, resulting in an extremely low probability of land-use conversion, which leads to an exceptionally stable landscape pattern centered on cultivated land [40]. This stability, at a macro level, “locks in” the overall spatial framework of habitat quality. Secondly, remnant natural habitats in plain areas are typically small in size, highly isolated, and surrounded by impervious surfaces or intensive agricultural land, forming ecological islands. Our findings align with numerous studies, indicating that small, isolated habitat patches have a weak capacity to buffer against extinction risks for internal species and poor resistance to external disturbances (such as pesticide drift and human activities), resulting in the continuous decline of their ecological functions. Even if the area remains unchanged, the quality has already deteriorated [41]. This “concealed degradation” of quality caused by landscape patterns is a crucial yet easily overlooked aspect of habitat deterioration in cultivated plain regions. Urban fringe areas exhibit higher biodiversity compared to central zones, presenting opportunities for future large-scale rewilding initiatives to enhance urban biodiversity [42].
The Optimal Parameter-based Geographical Detector (OPGD) was employed to determine the explanatory power of different driving factors on habitat quality. The results indicate that locational factors have a significant impact on habitat quality. Due to the overall low habitat quality in Northern Anhui, higher-quality habitats are concentrated in the southern water bodies, making the distance to water bodies the most critical influencing factor. Simultaneously, because construction land is associated with lower habitat quality, distances to primary, secondary, and tertiary roads significantly affect habitat quality in Northern Anhui. This finding differs from Zhang and Quan’s [37] study on the driving mechanisms of habitat quality in Anhui Province, which highlighted DEM and slope as having high explanatory power. The discrepancy primarily arises from the fact that this study focuses on the Northern Anhui Plain, characterized by flat terrain and minimal elevation variation. In contrast, Anhui Province as a whole includes mountainous areas in the south, where higher elevations generally correspond to better habitat quality. Thus, elevation exhibits weaker explanatory power at the local scale (Northern Anhui Plain) but stronger explanatory power at the provincial scale. Figure 9 shows that, aside from locational conditions, soil type and NDVI within the natural environment dimension are the most significant factors influencing the spatial distribution pattern of habitat quality in Northern Anhui, a result consistent with existing research [43]. As shown in Figure 10, following interaction, all influencing factors—except for the combination X11∩X12, which weakened—enhanced their explanatory power for habitat quality. This study’s findings are highly consistent with conclusions from previous research [37]. The results indicate that locational conditions and the natural environment dimension are the primary drivers of the spatial pattern of habitat quality. Moreover, the explanatory power of combined driving factors surpasses that of individual factors. Future regional development in Northern Anhui should focus on protecting cultivated land and limiting construction land expansion, striving to balance food security with ecological diversity conservation. While ensuring that current habitat quality does not further decline, efforts should be made to gradually improve habitat quality levels, promote harmonious coexistence between humans and nature, achieve coordinated economic and ecological development, and continuously advance high-quality development in Northern Anhui.
5. Conclusions
This study takes the Northern Anhui Plain of China as the study area and employs the InVEST, PLUS, and OPGD methods to assess the spatiotemporal evolution of habitat quality from 2000 to 2020 and to analyze its driving factors. The results show that habitat quality in Northern Anhui is generally low and has continuously declined during 2000–2020, with the mean value decreasing from 0.2479 to 0.2426 and further to 0.2345. Habitat quality deteriorated successively from higher to lower grades, with accelerated degradation in the second decade compared with the first, although a small number of areas experienced improvements. Spatially, habitat quality exhibited significant differentiation: Low–Low clusters were mainly distributed in and around built-up areas and expanded notably, while High–High clusters were primarily located in the northeastern woodlands and southern water bodies and showed a shrinking trend.
Several limitations of this study should be acknowledged. First, the InVEST model evaluates habitat quality based on the distance–decay relationship between land use types and threat sources. Although effective in capturing macro-scale patterns, it insufficiently captures micro-habitat heterogeneity, such as plant diversity within farmland and soil biological conditions. Future research could integrate high-resolution remote sensing and field species survey data to locally calibrate model parameters. Second, the driver analysis focuses on natural and landscape factors, with limited consideration of micro-level agents’ behavioral decisions—e.g., farmers’ willingness to manage habitat and their motivation to adopt ecological agricultural technologies. Different policies may affect different types of farmers in varying ways and at different times [44]. Future studies should incorporate social science approaches to explore the behavioral logic and institutional causes underlying the driving mechanisms. Finally, climate change, as a long-term potential driver, and its combined effects with human activities on future habitat quality trajectories in plain areas constitute a frontier topic warranting in-depth investigation.
In summary, this study reveals that the evolution of habitat quality in farmland-dominated plains is a complex process constrained by natural endowments, shaped by landscape patterns, modulated by socioeconomic factors, and intervened by policy adjustments. Its spatial differentiation pattern results from the long-term interplay and accumulation of multiple driving forces within a specific geographic context. Understanding this mechanism holds important theoretical value and practical significance for improving ecological functions and achieving sustainable development in agricultural landscapes while ensuring food security.
Supplementary Materials
The following supporting information can be downloaded at: https://www.mdpi.com/article/10.3390/land15071265/s1, Figure S1: Methodological flowchart of this research; Table S1: Land use transition matrix; Table S2: Neighborhood weight settings for each land use type; Table S3: Land use transition matrix; Table S4: Quantitative comparison of the four 2030 scenarios.
Author Contributions
Conceptualization, J.L. and Y.Y.; methodology, Y.Y. and Y.C.; software, Y.Y. and Z.L.; validation, J.Y., Y.Y. and J.L.; formal analysis, Y.Y. and Z.L.; investigation, J.L.; resources, Y.Y. and Y.C.; data curation, Y.Y., Z.L. and J.X.; writing—original draft preparation, Y.Y.; writing—review and editing, Z.L. and J.Y.; supervision, J.L.; funding acquisition, J.L., J.Y. and Z.L. All authors have read and agreed to the published version of the manuscript.
Funding
This research was funded by the Doctoral Foundation of Fuyang Normal University, grant number 2021KYQD0014 and 2021KYQD0032; the Key Project of the Young Talent Fund at Fuyang Normal University, grant number rcxm202410; and the University Natural Science Research Project of Anhui Province, China, grant number 2023AH050397.
Data Availability Statement
The original contributions presented in the study are included in the article/Supplementary Materials. Further inquiries can be directed to the corresponding author.
Conflicts of Interest
The authors declare no conflicts of interest.
Abbreviations
The following abbreviations are used in this manuscript:
| InVEST | Integrated Valuation of Ecosystem Services and Trade-offs |
| OPGD | Optimal Parameter-based Geographic Detector |
| SolVES | Social Values for Ecosystem Services |
| PLUS | Patch-generating Land Use Simulation |
References
- Tang, F.; Fu, M.; Wang, L.; Zhang, P. Land-Use Change in Changli County, China: Predicting Its Spatio-Temporal Evolution in Habitat Quality. Ecol. Indic. 2020, 117, 106719. [Google Scholar] [CrossRef] [Scilit]
- Mengist, W.; Soromessa, T.; Feyisa, G.L. Landscape Change Effects on Habitat Quality in a Forest Biosphere Reserve: Implications for the Conservation of Native Habitats. J. Clean. Prod. 2021, 329, 129778. [Google Scholar] [CrossRef] [Scilit]
- Gao, H.; Song, X.; Xu, H.; Li, X.; Tang, J.; Zhao, G. Promoting Sustainable Development by Mitigation of Natural Habitat Quality Decline through Multifunctional Urban Land Use: Insights from a Multi-Scenario Simulation. Sustain. Cities Soc. 2024, 110, 105563. [Google Scholar] [CrossRef] [Scilit]
- Ya, Y.; Qi, Y.; Pi, Y.; Do, J.; Li, S.; Ca, J.; Xi, J. Quantitative analysis of the impact of human activities on habitat quality and their spatial relationship: Shijiazhuang as an example. J. Environ. Eng. Technol. 2024, 14, 574–582. [Google Scholar] [CrossRef] [Scilit]
- Chen, X.; Yu, L.; Cao, Y.; Xu, Y.; Zhao, Z.; Zhuang, Y.; Liu, X.; Du, Z.; Liu, T.; Yang, B.; et al. Habitat Quality Dynamics in China’s First Group of National Parks in Recent Four Decades: Evidence from Land Use and Land Cover Changes. J. Environ. Manag. 2023, 325, 116505. [Google Scholar] [CrossRef] [Scilit]
- Intergovernmental Panel on Climate Change (IPCC) Climate Change 2021—The Physical Science Basis: Working Group I Contribution to the Sixth Assessment Report of the Intergovernmental Panel on Climate Change, 1st ed.; Cambridge University Press: Cambridge, UK, 2023.
- Hu, J.; Zhang, J.; Li, Y. Exploring the Spatial and Temporal Driving Mechanisms of Landscape Patterns on Habitat Quality in a City Undergoing Rapid Urbanization Based on GTWR and MGWR: The Case of Nanjing, China. Ecol. Indic. 2022, 143, 109333. [Google Scholar] [CrossRef] [Scilit]
- Wang, B.; Cheng, W. Effects of Land Use/Cover on Regional Habitat Quality under Different Geomorphic Types Based on InVEST Model. Remote Sens. 2022, 14, 1279. [Google Scholar] [CrossRef] [Scilit]
- Yang, J.; Zhu, Y.; Song, W.; Zhang, J.; Zhang, L.; Luo, X. The Eco-environmental Evaluation Based on Habitat Quality and Ecological Response of Laizhou Bay. Acta Ecol. Sin. 2014, 34, 105–114. [Google Scholar] [CrossRef] [Scilit]
- Sherrouse, B.C.; Semmens, D.J.; Ancona, Z.H. Social Values for Ecosystem Services (SolVES): Open-Source Spatial Modeling of Cultural Services. Environ. Model. Softw. 2022, 148, 105259. [Google Scholar] [CrossRef] [Scilit]
- Zhou, L.; Guan, D.; Huang, X.; Yuan, X.; Zhang, M. Evaluation of the Cultural Ecosystem Services of Wetland Park. Ecol. Indic. 2020, 114, 106286. [Google Scholar] [CrossRef] [Scilit]
- Natural Capital Project. InVEST 0.0; Stanford University: Stanford, CA, USA; University of Minnesota: Minneapolis, MN, USA; Chinese Academy of Sciences: Beijing, China; The Nature Conservancy: Arlington, VA, USA; World Wildlife Fund: Gland, Switzerland; Stockholm Resilience Centre: Stockholm, Sweden; The Royal Swedish Academy of Sciences: Stockholm, Sweden, 2024. [Google Scholar]
- Qin, X.; Yang, Q.; Wang, L. The Evolution of Habitat Quality and Its Response to Land Use Change in the Coastal China, 1985–2020. Sci. Total Environ. 2024, 952, 175930. [Google Scholar] [CrossRef] [Scilit] [PubMed]
- Wu, J.; Li, X.; Luo, Y.; Zhang, D. Spatiotemporal Effects of Urban Sprawl on Habitat Quality in the Pearl River Delta from 1990 to 2018. Sci. Rep. 2021, 11, 13981. [Google Scholar] [CrossRef] [Scilit] [PubMed]
- Huang, G.; Feng, S.; Hu, C. A Study of the Spatiotemporal Evolution Patterns and Coupling Coordination between Ecosystem Service Values and Habitat Quality in Diverse Scenarios: The Case of Chengdu Metropolitan Area, China. Sustainability 2024, 16, 3741. [Google Scholar] [CrossRef] [Scilit]
- Xie, B.; Zhang, M. Spatio-Temporal Evolution and Driving Forces of Habitat Quality in Guizhou Province. Sci. Rep. 2023, 13, 6908. [Google Scholar] [CrossRef] [Scilit] [PubMed]
- Xue, Q.; Zhang, Y.; Zhang, Q.; Wu, Q.; Zhang, X.; Lu, L.; Qin, C. Towards Ecological Security: Two-Thirds of China’s Ecoregions Experienced a Decline in Habitat Quality from 1992 to 2020. Ecol. Indic. 2025, 172, 113275. [Google Scholar] [CrossRef] [Scilit]
- Pu, J.; Shen, A.; Liu, C.; Wen, B. Impacts of Ecological Land Fragmentation on Habitat Quality in the Taihu Lake Basin in Jiangsu Province, China. Ecol. Indic. 2024, 158, 111611. [Google Scholar] [CrossRef] [Scilit]
- Broquet, M.; Campos, F.S.; Cabral, P.; David, J. Habitat Quality on the Edge of Anthropogenic Pressures: Predicting the Impact of Land Use Changes in the Brazilian Upper Paraguay River Basin. J. Clean. Prod. 2024, 459, 142546. [Google Scholar] [CrossRef] [Scilit]
- Chen, M.; Tan, Y.; Xu, X.; Lin, Y. Identifying Ecological Degradation and Restoration Zone Based on Ecosystem Quality: A Case Study of Yangtze River Delta. Appl. Geogr. 2024, 162, 103149. [Google Scholar] [CrossRef] [Scilit]
- Yang, J.; Huang, X. The 30 m Annual Land Cover Dataset and Its Dynamics in China from 1990 to 2019. Earth Syst. Sci. Data 2021, 13, 3907–3925. [Google Scholar] [CrossRef] [Scilit]
- Chen, Y.; Yang, F.; Yang, K. Analysis of land use changes and driving factors on northern slope of Tianshan Mountains from 1990 to 2020. J. Univ. Sci. Technol. Liaoning 2025, 48, 72–80. [Google Scholar]
- Kang, P.; Wu, B.; Gao, F.; Du, M.; Wang, C.; Cao, W. Analysis of spatial and temporal changes and driving factors of land use in Changji Prefecture Plain. Yangtze River 2024, 55, 59–68. [Google Scholar]
- Liao, J.; Zhang, D.; Su, S.; Liang, S.; Du, J.; Yu, W.; Ma, Z.; Chen, B.; Hu, W. Coastal Habitat Quality Assessment and Mapping in the Terrestrial-Marine Continuum: Simulating Effects of Coastal Management Decisions. Ecol. Indic. 2023, 156, 111158. [Google Scholar] [CrossRef] [Scilit]
- Yang, Q.; Zhang, P.; Qiu, X.; Xu, G.; Chi, J. Spatial-Temporal Variations and Trade-Offs of Ecosystem Services in Anhui Province, China. Int. J. Environ. Res. Public Health 2023, 20, 855. [Google Scholar] [CrossRef] [Scilit] [PubMed]
- Dong, J.; Zhang, Z.; Liu, B.; Zhang, X.; Zhang, W.; Chen, L. Spatiotemporal Variations and Driving Factors of Habitat Quality in the Loess Hilly Area of the Yellow River Basin: A Case Study of Lanzhou City, China. J. Arid Land 2022, 14, 637–652. [Google Scholar] [CrossRef] [Scilit]
- Liu, Y.; Tian, J.; Zheng, W.; Yin, L. Spatial and Temporal Distribution Characteristics of Haze and Pollution Particles in China Based on Spatial Statistics. Urban Clim. 2022, 41, 101031. [Google Scholar] [CrossRef] [Scilit]
- Qi, Y.; Hu, Y. Spatiotemporal Variation and Driving Factors Analysis of Habitat Quality: A Case Study in Harbin, China. Land 2024, 13, 67. [Google Scholar] [CrossRef] [Scilit]
- Wang, J.; Xu, C. Geodetector: Principle and prospective. Acta Geogr. Sin. 2017, 72, 116–134. [Google Scholar]
- Song, Y.; Wang, J.; Ge, Y.; Xu, C. An Optimal Parameters-Based Geographical Detector Model Enhances Geographic Characteristics of Explanatory Variables for Spatial Heterogeneity Analysis: Cases with Different Types of Spatial Data. GIScience Remote Sens. 2020, 57, 593–610. [Google Scholar] [CrossRef] [Scilit]
- Liang, X.; Guan, Q.; Clarke, K.C.; Liu, S.; Wang, B.; Yao, Y. Understanding the Drivers of Sustainable Land Expansion Using a Patch-Generating Land Use Simulation (PLUS) Model: A Case Study in Wuhan, China. Comput. Environ. Urban Syst. 2021, 85, 101569. [Google Scholar] [CrossRef] [Scilit]
- Wu, X.Y.; Qin, M.L.; Jiang, H.B. Simulation of land use zoning optimization under multi-objective scenarios based on maximizing carbon storage: Taking Qingshui River of Xijiang River in Guangxi as an example. J. Environ. Eng. Technol. 2023, 13, 1752–1762. [Google Scholar]
- Wang, B.; Shu, X.B.; Liao, F.Q.; Li, Y.; Wan, Z.W. Spatitemporal of Land Use Conflicts and Multi-scenario Simulation in Poyang Lake Aare Based on Optimal Land Scape Scale. Res. Sil. Water Cnservation 2024, 31, 336–347. [Google Scholar]
- Mi, Y.; Li, S.; Wang, Z. Spatial Distribution and Topographic Gradient Effects of Habitat Quality in the Chang-Zhu-Tan Urban Agglomeration, China. Sci. Rep. 2024, 14, 22563. [Google Scholar] [CrossRef] [Scilit] [PubMed]
- Guang, X.; He, Y.; Chen, Z.; Yang, H.; Lu, Y.; Meng, J.; Cheng, Y.; Chen, N.; Zhou, Q.; He, R.; et al. Development and Validation of a Potential Risk Area Identification Model for Hand, Foot, and Mouth Disease in Metropolitan China. J. Environ. Manag. 2024, 371, 123064. [Google Scholar] [CrossRef] [Scilit]
- Sallustio, L.; De Toni, A.; Strollo, A.; Di Febbraro, M.; Gissi, E.; Casella, L.; Geneletti, D.; Munafò, M.; Vizzarri, M.; Marchetti, M. Assessing Habitat Quality in Relation to the Spatial Distribution of Protected Areas in Italy. J. Environ. Manag. 2017, 201, 129–137. [Google Scholar] [CrossRef] [Scilit]
- Zhang, G.; Quan, L. Impact of Habitat Quality Changes on Regional Thermal Environment: A Case Study in Anhui Province, China. Sustainability 2024, 16, 8560. [Google Scholar] [CrossRef] [Scilit]
- Zhang, G.; Roslan, S.N.A.; Quan, L.; Yuan, P. Simulation of Spatiotemporal Patterns of Habitat Quality and Driving Mechanism in Anhui Province, China. Front. Environ. Sci. 2023, 11, 1145626. [Google Scholar] [CrossRef] [Scilit]
- Li, Z.; Ma, Z.; Zhou, G. Impact of Land Use Change on Habitat Quality and Regional Biodiversity Capacity: Temporal and Spatial Evolution and Prediction Analysis. Front. Environ. Sci. 2022, 10, 1041573. [Google Scholar] [CrossRef] [Scilit]
- Verburg, P.H.; Mertz, O.; Erb, K.-H.; Haberl, H.; Wu, W. Land System Change and Food Security: Towards Multi-Scale Land System Solutions. Curr. Opin. Environ. Sustain. 2013, 5, 494–502. [Google Scholar] [CrossRef] [Scilit] [PubMed]
- Haddad, N.M.; Brudvig, L.A.; Clobert, J.; Davies, K.F.; Gonzalez, A.; Holt, R.D.; Lovejoy, T.E.; Sexton, J.O.; Austin, M.P.; Collins, C.D.; et al. Habitat Fragmentation and Its Lasting Impact on Earth’s Ecosystems. Sci. Adv. 2015, 1, e1500052. [Google Scholar] [CrossRef] [Scilit] [PubMed]
- Aznarez, C.; Svenning, J.-C.; Taveira, G.; Baró, F.; Pascual, U. Wildness and Habitat Quality Drive Spatial Patterns of Urban Biodiversity. Landsc. Urban Plan. 2022, 228, 104570. [Google Scholar] [CrossRef] [Scilit]
- Cao, Y.; Wang, C.; Su, Y.; Duan, H.; Wu, X.; Lu, R.; Su, Q.; Wu, Y.; Chu, Z. Study on Spatiotemporal Evolution and Driving Forces of Habitat Quality in the Basin along the Yangtze River in Anhui Province Based on InVEST Model. Land 2023, 12, 1092. [Google Scholar] [CrossRef] [Scilit]
- Sutherland, L.-A.; Burton, R.J.F.; Ingram, J.; Blackstock, K.; Slee, B.; Gotts, N. Triggering Change: Towards a Conceptualisation of Major Change Processes in Farm Decision-Making. J. Environ. Manag. 2012, 104, 142–151. [Google Scholar] [CrossRef] [Scilit]

Disclaimer/Publisher’s Note: The statements, opinions and data contained in all publications are solely those of the individual author(s) and contributor(s) and not of MDPI and/or the editor(s). MDPI and/or the editor(s) disclaim responsibility for any injury to people or property resulting from any ideas, methods, instructions or products referred to in the content. |
© 2026 by the authors. Licensee MDPI, Basel, Switzerland. This article is an open access article distributed under the terms and conditions of the Creative Commons Attribution (CC BY) license.