


Abstract
Unplanned urban expansion accompanied by a decline in green infrastructure poses significant challenges for sustainable land-use planning in semi-arid, water-constrained secondary cities. Quetta, Pakistan, exemplifies these challenges due to rapid population growth, ecological degradation, water scarcity, and the absence of an updated master plan. This study develops a GIS-based spatial decision-support framework to evaluate residential development and green infrastructure priorities and to identify areas of conflict, synergy, and balanced planning opportunities. Sentinel-2A imagery acquired in May 2023 was used to generate a land-use/land-cover map, while residential and green-infrastructure suitability factors were standardized using fuzzy membership functions and integrated through an AHP Weighted Linear Combination approach. The resulting Residential Suitability Index (RSI) and Green-Infrastructure Suitability Index (GSI) were normalized and combined through a rule-based Residential–Green Infrastructure Trade-off Index (RGTI). Unlike conventional suitability assessments that evaluate development and ecological priorities independently, the proposed framework explicitly identifies zones of residential dominance, ecological dominance, and shared planning potential. Five planning-priority categories were delineated, comprising Very High Green Infrastructure Priority, Moderate Green Infrastructure Priority, Shared Zone, Moderate Residential Expansion Priority, and Very High Residential Expansion Priority. A spatial consistency assessment demonstrated that the identified planning zones correspond closely with existing land-use patterns and available land resources, supporting the plausibility of the proposed framework. The results provide a practical basis for delineating ecological conservation areas, residential development zones, and integrated planning zones capable of balancing urban growth and environmental sustainability. The framework offers a transparent and transferable approach for supporting land-allocation decisions in arid, data-scarce, and rapidly urbanizing cities facing competing development and ecological pressures.
1. Introduction
Urban built-up areas have been growing rapidly since the mid-1980s. Recent analyses based on multisource datasets suggest that global urban land cover has almost tripled from 1985 to 2015, leading to dramatic changes in the structure and spatial distribution of land use [1,2]. This increasing trend of urbanization is only expected to further accelerate, with the United Nations predicting that by 2030, some 60 percent of the world’s population—5 billion people—will live in urban areas. Such growth puts the ecosystems, natural habitats, and agricultural production under mounting pressure, leading to critical challenges in sustainable urban and environmental planning [3,4]. These transformations challenged the targets of SDG11 (inclusive, safe, resilient cities) and SDG15 (sustainable use of terrestrial ecosystems), whereby mounting habitat fragmentation coupled with biodiversity loss became an increasing concern [5]. The most extreme impacts are visible in Asia and Africa, where there is a combination of weak urban governance coupled with rapid ecosystem degradation alongside explosive urban growth [6,7].
Urban green spaces (UGS), spanning from parks, urban forests, and gardens to green roofs, have important functions in mitigating the urban heat island effects through evapotranspiration and shading. This regulates stormwater runoff, preserving biodiversity, and reinforcing psychological and physical well-being [8]. However, the sharing of these green assets is extremely unequal. On average, cities in the Global South are characterized by a lower level of greenspace exposure compared to Global North counterparts [7,9]. In the capital of Nairobi, remote sensing data shows a drop of peri-urban forests and rangelands by 24–47% from 1988 to 2018, mainly because informal settlement expanded at the time of weak regulation [10]. Similar trajectories have been reported in Lagos, where satellite analysis showed close to a one-third loss of peri-urban vegetation in two decades [11]. Collectively, these findings remind us of a documented effect in growing urban cities: the decline of ecological infrastructure and green buffers, and the alarming increase in environmental inequities, for sustainability.
South Asia is observing increasing conflict between fast-paced urban growth and weak ecological systems. The region’s cities are growing at rates in excess of 2% per year, which is amongst the highest in the world [12]. In Dhaka, it also shows a 35% decrease in green space from 1990 to 2020; nature reserves such as peri-urban wetlands and agricultural belts are getting converted into residential settlements using Landsat time-series [13,14]. In Delhi, urban sprawl has steadily overwhelmed agricultural land, resulting in a loss of vegetated cover by nearly 28% in the last two decades, accompanied by enhanced susceptibility to air pollution and heat stress [15]. In Karachi, according to satellite analyses, between 2000 and 2018, wetlands and green belts have decreased by 32%, increasing the risk of floods and the urban heat island effect [16,17]. These city-level trajectories collectively demonstrate how weak enforcement of master planning and outdated zoning regulations in South Asia are accelerating ecological degradation and undermining urban resilience.
To operationalize trade-offs between urban growth and ecological quality, planners increasingly rely on GIS-based multi-criteria evaluation (MCE) with fuzzy standardization and Analytic Hierarchy Process (AHP) weights, aggregated via Weighted Linear Combination (WLC). Recent work has even automated the weight-derivation step with machine learning-aided MCE, improving transparency and reproducibility in suitability mapping (Kelowna, Canada) [18]. In China, an AHP-driven multi-criteria scheme was used to prioritize green-infrastructure interventions for flood-risk mitigation across Beijing, generating township-scale priority maps that align investment with hydrologic exposure [19]. In Spain, a province-wide green-infrastructure plan combined GIS-MCE with AHP/WLC to rank corridors and core areas under fragmentation pressure (Almería) [20]. Complementing these, an Indian Himalayan study (Shimla–Nainital–Darjeeling) applied AHP-WL cas0064C to residential suitability, finding slope, hazard exposure, and access to services as dominant signals in fragile hill towns [21]. Similar AHP-based site-selection has guided urban green-space interventions in Lilongwe, Malawi, highlighting transferability to data-scarce Southern contexts [22]. Existing GIS-based MCE efforts provide useful suitability maps. The difference between single-objective suitability mapping and trade-off analysis is clear: suitability mapping identifies where one objective is suitable, whereas RSI–GSI trade-off analysis identifies where competing objectives dominate, overlap, or require shared planning intervention. Recent spatial planning studies emphasize that land-use planning should not only support urban growth but also evaluate nature conservation efficiency and ecological outcomes [23]. Computational and GIS-based land-use approaches further support the use of multi-objective spatial evaluation for mixed-use and competing land demands [24]. UN-Habitat also highlights that future cities must be planned through compact, resilient, inclusive, and environmentally sustainable strategies [25]. Therefore, the RSI–GSI trade-off framework helps classify the study area into green infrastructure priority zones, Shared/Balanced Zones, and residential expansion priority zones, supporting integrated land-use planning instead of single-objective development decisions.
Rapidly urbanizing semi-arid cities presents a particularly relevant case for spatial planning, as rapid population growth, water scarcity, ecological degradation, limited green infrastructure, and the absence of an updated master plan have intensified competition for land resources. Rather than assessing residential and ecological suitability as separate dimensions, this study develops a planning-oriented spatial conflict assessment framework that explicitly identifies areas of residential dominance, ecological dominance, and balanced planning potential. The framework integrates remote sensing, fuzzy multi-criteria evaluation, the AHP, Weighted Linear Combination, and a rule-based-RGTI to delineate residential development zones, ecological conservation zones, and integrated planning zones. By examining the interaction between urban expansion and ecological infrastructure in a semi-arid, water-constrained setting, this study offers a transferable decision-support framework for sustainable land-use planning in rapidly urbanizing arid cities.
Key gap in planning practice: Although GIS-based MCE and AHP/WLC approaches have been widely applied in land-suitability studies, their operational use remains limited in arid, data-scarce secondary cities where rapid residential expansion, ecological degradation, water stress, and outdated master planning occur simultaneously. In such contexts, the key challenge is not simply to identify suitable residential or ecological areas separately, but to determine where these objectives dominate, conflict, or require integrated planning. Rapidly urbanizing semi-arid cities represent such a case because it combines rapid population growth, limited green infrastructure, steep terrain, water scarcity, and the absence of an updated master plan. Therefore, this study applies a remote sensing–MCE–RSI–GSI trade-off framework to examine how residential development and green infrastructure priorities can be spatially balanced under local ecological and planning constraints [26,27].
The main objective of this study is to develop a framework for residential–green infrastructure trade-off analysis for competing social and ecological objectives in rapidly urbanizing semi-arid cities in the Global South. To do so, we selected the city of Quetta to: (a) map current land-use/land-cover patterns in the city using Sentinel-2 imagery; (ii) identify areas suitable for residential development and green infrastructure provision through an integrated fuzzy–AHP–WLC framework; (iii) evaluate spatial conflicts, synergies, and balanced planning opportunities between residential expansion and green infrastructure priorities; and (iv) delineate ecological conservation zones, residential development zones, and integrated planning zones to support sustainable urban development in a semi-arid and water-constrained urban environment. This study contributes to urban planning research in three ways. First, it provides a novel approach for the integrated assessment of residential development and green infrastructure trade-offs in the rapidly urbanizing semi-arid cities facing severe ecological and planning pressures. Second, it develops a planning-oriented spatial conflict assessment framework that explicitly identifies areas of ecological dominance, residential dominance, and balanced planning opportunities. Third, the study introduces a transferable decision-support approach for balancing urban growth and green infrastructure provision in arid and water-constrained cities where ecological resources are limited and land-use conflicts are increasing.
2. Study Area and Decision Units
Quetta, the provincial capital of Balochistan, is located at 30.18° N and 67.00° E in a valley enclosed by mountain ranges rising to over 3500 m (See Figure 1). The city occupies a unique topographic basin at an elevation of about 1680 m, with a total metropolitan extent of 2650 km2, of which the urbanized footprint is approximately 265 km2. The semi-arid climate yields an annual average precipitation of 260 mm and extremes of temperature ranging from −1 °C in winter to 34 °C in summer [28]. These climatic and physiographic conditions worsen water shortage and curtail growth of vegetation, which further complicate the sustainability of cities. The 2023 census shows the population to be 2.27 million, with an overall growth rate of more than 3% every year, which is putting a strain of mammoth proportions on the land resources [29]. Critically, no comprehensive master plan has been implemented since 1984, resulting in uncontrolled residential expansion, congestion, and the degradation of green space. All spatial datasets were harmonized into a 10 m raster grid in UTM Zone 42N, consistent with Sentinel-2A resolution. This study area functions as the administrative, commercial, educational, and transport center of Balochistan. Its urban growth is concentrated along the valley floor and major road corridors, while surrounding mountains and semi-arid land conditions restrict outward expansion. The city faces increasing housing demand, congestion, limited public green space, water scarcity, drainage problems, air pollution, and heat-related environmental stress. Vegetation is mainly concentrated in irrigated valley plains, orchards, roadside plantations, parks, and scattered agricultural patches, while dry barren surfaces dominate the peripheral terrain.
Figure 1.
Location of Quetta city (Study area) in Balochistan.
The study area exemplifies the pressures faced by secondary cities in arid mountain basins: the small and medium-sized cities in the Global South remain underrepresented in applied urban sustainability research, precisely the places where governance capacity and environmental exposure collide most acutely, highlighting the need for rigorous, transferable decision-support in contexts [30,31].
3. Materials and Methods
Figure 2 shows the framework of this study. It adopted an MCE framework integrating the AHP, Fuzzy Membership Standardization, and WLC. This combination was chosen because it allows quantitative weighting of each factor, flexible handling of different data ranges, and transparent validation of logical consistency through the Consistency Ratio (CR). This approach to spatial decisions is evidence-based and flexible to the local environment in semi-arid environments of the research area (where minor changes in slope, water supply, and built-up proximity decisively affect land potential).
Figure 2.
Methodological framework for GIS-based residential and green-infrastructure suitability assessment and RSI–GSI trade-off analysis.
3.1. Data Sources and Pre-Processing
Table 1 shows the datasets and processes for this study. Sentinel-2A MSI imagery acquired in May 2023 served as the primary data source for this study. Visible and near-infrared bands at 10 m spatial resolution, along with red-edge and shortwave infrared bands at 20 m resolution resampled to 10 m, were employed for land-use/land-cover classification and the derivation of Boolean layers. Sentinel-2A imagery is widely recognized for its reliability in urban land-use mapping and vegetation analysis due to its high spectral and spatial fidelity [32,33]. Topographic information was obtained from the SRTM digital elevation model with an original spatial resolution of 30 m, which was resampled to 10 m to derive slope surfaces. Additional environmental variables, including soil moisture, were treated as continuous raster datasets. Ancillary spatial data comprising road networks, public services (schools, hospitals, mosques, government offices, and recreational points), commercial areas, hydrological features, gray-water drainage channels, and hazard buffer zones were digitized in November 2023. All vector datasets were rasterized to a common spatial resolution of 10 m, and proximity-based criteria were generated using Euclidean distance functions to represent accessibility. Categorical constraints, such as water bodies, hydrological features, drainage channels, and hazard buffers, were encoded as Boolean exclusion masks. All datasets were harmonized in terms of spatial resolution, extent, and projection to ensure spatial congruency for subsequent multi-criteria evaluation and planning-priority analysis. To improve reproducibility, all ancillary datasets were documented according to source, acquisition period, original format or scale, and processing operation. Road networks, public-service points, commercial centers, drainage channels, hydrological features, and hazard-related layers were cleaned, projected to UTM Zone 42N, rasterized to the common 10 m grid, and converted into Euclidean-distance surfaces where required. Boolean constraint layers were generated for non-allocable or high-risk areas, including water bodies, steep slopes, drainage-risk buffers, restricted areas, and existing built-up footprints. All spatial layers were aligned to the Sentinel-2A grid before the multi-criteria evaluation and land-allocation analysis.
Table 1.
Dataset and processing description.
3.2. Land-Use and Land-Cover Classification
The foundation land-use and land-cover (LULC) map was built based on Sentinel-2A imagery (2023) with the help of a supervised classifier, Random Forest (RF) (see Table 2). The RF classification was implemented in Google Earth Engine and ArcGIS Pro (v3.3) using Sentinel-2A multispectral imagery and derived spectral indices.
Table 2.
Random Forest classification parameters.
RF is an ensemble machine learning algorithm that builds multiple decision trees and combines their output through majority voting (classification) or averaging (regression). Formally, each tree is trained on a bootstrap sample of the training data; at each node split, a random subset of predictor variables is tested, and the final class is the mode of all trees’ predictions. This randomness reduces overfitting and improves generalization. RF balances accuracy, robustness, and interpretability, making it suitable for complex urban–ecological landscapes. Consequently, RF has been demonstrated to be a better classifier than traditional parametric models, especially when dealing with multispectral data in complicated land-cover structures [34]. Classifier selection was based on the similarity of landscape complexity, spectral behavior, data constraints, and planning objectives, rather than on reported accuracy metrics alone.
Training and validation samples were generated using a stratified random sampling approach based on Sentinel-2A imagery, high-resolution Google Earth imagery, and visual interpretation of major land-cover classes. Five land-cover categories, including built-up land, greenery, open land, water bodies, and other land-cover types, were represented. A total of 3200 samples were used for classifier training, and 1200 independent samples were used for accuracy assessment (See Figure 3). Training and validation samples were maintained as independent datasets. Validation samples were not used during classifier training or parameter tuning, thereby reducing potential bias in accuracy assessment.
Figure 3.
Random Forest validation.
There were five classes that were mapped, including built-up, vegetation, barren, water, and others (see description in Table 3). To improve class separability, the RF model was used with multispectral Sentinel-2A bands and derived Spectral indices, including the Normalized Difference Vegetation Index (NDVI), Normalized Difference Built-up Index (NDBI), and Normalized Difference Water Index (NDWI) in the semi-arid environment:
Table 3.
Description of land-use/land-cover classes.
Classification accuracy was assessed using an independent validation set. Performance measures included Overall Accuracy (OA) and Cohen’s Kappa (κ). Moreover, precision, recall, and F1-scores were reported effectively at the class-level to assess the reliability of the classifier [35].
3.3. Suitability Assessment and Residential–Green Infrastructure Trade-Off Framework
This study developed a methodological framework that is structured into two sequential stages. In the first stage, we used MCE for creating suitability surfaces of residential development and greenery. MCE offers a systematic process to combine heterogeneous data, normalize them on a continuous scale, assign relational weights and integrate them into overall suitability maps. This stage guarantees the clarity of the spatial logic of every land-use goal captured transparently and consistently. In the second stage, we used residential–green infrastructure trade-off analysis to maximize the distribution of land amid conflicting goals with given constraints, compactness and area goals.
3.3.1. Stage 1: Multi-Criteria Evaluation (MCE)
The initial part of the framework consisted of an MCE process, which is a well-known technique in GIS that systematically merges heterogeneous datasets into continuous appropriateness covers [36]. MCE was aimed at gauging the spatial potential of land within the study area between two competing goals: residential development and urban greenery. The MCE framework applied in the present research was defined in the following three steps: (I) identification of objectives, criteria, and constraints; (ii) standardization of raw data by use of fuzzy membership functions; (iii) weighting and aggregation of criteria by use of the AHP and WLC.
Objectives, Criteria, and Constraints
The study evaluated land suitability for two competing objectives: residential development and urban greenery. For residential suitability, seven criteria were selected: distance to roads, distance to clean water, distance to public services, distance to commercial centers, proximity to greenery, slope, and Hazard Exclusion Zones. For greenery suitability, seven criteria were considered: distance to roads, distance from built-up areas, slope, distance to water resources, Hazard Exclusion Zones, drainage and soil moisture. Constraints were imposed to exclude non-eligible areas. These included slopes exceeding 30%, water bodies, protected areas, airports and rights-of-way, and existing built-up footprints. Every constraint as represented in the form of a Boolean mask, such that only eligible cells were to be used in the suitability analysis:
where Ch is the constraint variable associated with criterion or location j. This systematic approach kept the aspect of suitability under consideration in totality in respect of ecological, topographic and planning restrictions.
Fuzzy Standardization of Criteria
To align the heterogeneous dataset expressed in meters, percentages or index values, all the criteria were put on the same continuum [0–1] through fuzzy membership functions [36]. The graded aspect of suitability with this methodology will not result in the information being lost due to crisp thresholds. It was in the form of three functional forms:
Monotonic increase, used where the higher the value, the more suitable it is (e.g., soil moisture):
where μ↑(x) represents the degree of membership of variable x in a fuzzy set where higher values are more suitable. The output range is [0, 1], where 0 is completely unsuitable and 1 is fully suitable.
Monotonic decreasing, used where the higher the value, the less suitable it is (e.g., distance to roads):
Triangular (just right), applied where intermediate values are most appropriate (e.g., distance to city center):
Fuzzy membership thresholds were defined using a combination of literature-informed planning assumptions, local terrain conditions, hydrological buffer logic, and empirical inspection of criterion-value distributions. Because formal local planning standards for several indicators were unavailable, the thresholds were treated as transparent planning assumptions rather than fixed regulatory standards. Each threshold was selected to reflect the expected direction and intensity of suitability under Quetta’s semi-arid terrain and water-stressed conditions. The fuzzy maps obtained resulted in continuous suitability maps to be used as the following weighted linear aggregation. The research consists of streamlining the AHP–Fuzzy–WLC model to capture the real-life topographic and hydrological processes of the semi-arid Quetta location. Instead of using fixed buffer distances, or linear scaling that is not based on real-life environmental behavior, fuzzy membership functions were finely tuned to reflect the behavior of the real world—for example, buffered decaying functions were used to reflect the effects of water accessibility, triangular functions were used to reflect the optimum approach to drainage routes, and decreasing functions were used to reflect the effects of steep slopes on the stability of the land. The developed methodology is superior to conventional overlay-based methods in a variety of ways: firstly, fuzzy thresholds are customized to semi-arid terrain environments; secondly, the weights generated by the AHP are justified by a low Consistency Ratio (CR < 0.1); and, lastly, the methodology is more realistic and provides a context-sensitive tool to use in spatial planning in Quetta.
Weighting Criteria by the Analytic Hierarchy Process (AHP)
To find out the relative significance of the criteria of residential and greenery suitability, the AHP was used. AHP is a comparative technique that involves the combination of both qualitative and quantitative decisions in a unified weight framework [37]. Each objective was constructed into decision matrices with element air in the comparison matrix A being the relative importance of criterion I to criterion j.
The principal eigenvector of the comparison matrix was extracted to generate the normalized weights w = (w1, w2, win), with the constraint that
The reliability of the pairwise comparisons was tested through the Consistency Index (CI) and (CR):
where λmax is the maximum eigenvalue of the matrix, n is the number of criteria, and RI is the Random Index based on matrix order. The Random Index (RI) is constantly used in AHP to measure how consistent your judgments are compared to a random matrix. It was developed through simulations of randomly generated pairwise matrices. The consistency of pairwise comparisons was evaluated using the CR proposed by Saaty (1980) [38]. A CR value of 0.10 or lower was considered acceptable, indicating satisfactory internal consistency among the expert judgments. While the CR assesses the logical consistency of pairwise comparisons, the selection of criteria, fuzzy membership functions, and weighting system was furthermore guided by established land-suitability, GIS-based multi-criteria evaluation, and the green-infrastructure planning literature (see Table 4). The AHP weights used in the suitability analysis were derived and normalized before consistency evaluation. The pairwise comparison matrices were reviewed iteratively to ensure reciprocal consistency and theoretical coherence among criteria. When inconsistency appeared in the preliminary comparisons, the judgments were re-examined and adjusted according to the relative importance of each criterion in the study area’s planning context. The final matrices were used to derive normalized weights. These final matrices produced acceptable Consistency Ratio values of 0.043 for GSI and 0.063 for RSI, both below the 0.10 threshold.
Table 4.
Suitability criteria, fuzzy standardization thresholds, and AHP weighting schemes used for RSI and GSI modeling.
The selection of suitability criteria, fuzzy membership functions, and AHP weighting schemes was guided by established land-suitability assessment, GIS-based MCE, and the green-infrastructure planning literature. Accessibility-related variables, including roads, public services, and commercial centers, were prioritized in the Residential Suitability Index (RSI) because residential development is strongly influenced by transportation accessibility, service provision, and economic opportunities. In contrast, the Green-Infrastructure Suitability Index (GSI) emphasized ecological quality, hydrological support, environmental connectivity, and vegetation requirements through the inclusion of soil moisture, drainage proximity, water availability, and distance from built-up areas. Threshold values and suitability assumptions were adapted from previous land-suitability and ecological planning studies and adjusted to reflect the environmental conditions and planning context of the study area. Hazard-prone areas were incorporated as exclusion constraints to avoid environmentally unsuitable development. The planning rationale and supporting literature for all suitability criteria are summarized in Table 4.
Aggregation by Weighted Linear Combination (WLC)
After standardizing (Section Fuzzy Standardization of Criteria) and weighting criteria (Section Weighting Criteria by the Analytic Hierarchy Process (AHP), they were aggregated by use of WLC. It is a very popular compensatory decision rule in the GIS-based land-suitability analysis as it allows trade-offs of criteria without loss of transparency [52].
The suitability of each pixel I within objective o was calculated as
The suitability of each pixel I within objective “O” was calculated in which Si(o) is the suitability score of the pixel if with objective O (residential or green), wk(o) is the weight of the criterion of objective O, uk(xik) is the fuzzy membership of the criterion at pixel I, Cij is the constraint mask (1 means pixel is eligible, 0 means it is not), mo means how many criteria there are in the objective O, and J means how many layers of constraints there are. This formulation also made sure that each criterion made a proportionate contribution to overall suitability and automatically ruled out masked areas. The final products were two uniform suitability surfaces of residential buildings and greenery. They were all rated on five levels of suitability (very low, low, moderate, high, very high) with equal intervals to create interpretable planning analysis maps.
3.3.2. Residential–Green Infrastructure Trade-Off Analysis
To identify areas of potential competition and synergy between residential development and green infrastructure provision, a Residential–Green Infrastructure Trade-off Index (RGTI) was developed by integrating the Residential Suitability Index (RSI) and Green-Infrastructure Suitability Index (GSI). Trade-off analysis has been widely used in land-use planning to evaluate competing spatial objectives and support balanced decision-making among environmental, social, and development priorities [53,54].
Before integration, the RSI and GSI suitability surfaces were normalized to a common scale ranging from 0 to 100 using min–max normalization:
where Xnorm represents the normalized suitability value, X is the original suitability score, and Xmin and Xmax are the minimum and maximum values of the respective suitability surface.
After normalization, the RGTI was calculated to quantify the relative dominance of residential development suitability and green-infrastructure suitability across the study area. The index was computed using a difference-based approach:
where (RSInorm) and (GSInorm) represent the normalized residential and green-infrastructure suitability values. Positive RGTI values indicate locations where residential development suitability exceeds green-infrastructure suitability, whereas negative values indicate areas where green-infrastructure suitability is dominant. Values approaching the neutral trade-off condition (RGTI = 0) represent locations where both objectives exhibit similar suitability and therefore constitute potential planning conflict or shared-use zones. Following normalization, a difference-based trade-off index was calculated to quantify the relative dominance of residential suitability and green-infrastructure suitability across the study area. To provide a planning-relevant interpretation of trade-off intensity, the continuous RGTI surface was classified using a rule-based threshold system centered on the neutral trade-off condition (RGTI = 0). Thresholds of ±20 and ±40 were used to distinguish moderate and strong dominance of either planning objective, resulting in five planning-priority categories: (1) Very High Green Infrastructure Priority, (2) Moderate Green Infrastructure Priority, (3) Shared/Balanced Zone, (4) Moderate Residential Expansion Priority, and (5) Very High Residential Expansion Priority. These categories were subsequently used to identify areas requiring ecological conservation, residential expansion, or integrated planning interventions.
The trade-off framework provides a spatially explicit approach for balancing urban growth and environmental sustainability by highlighting locations where development and ecological objectives converge or conflict. Rather than prioritizing a single land-use objective, the approach supports multifunctional land-use planning and contributes to the identification of sustainable urban development strategies.
4. Results
4.1. Land-Use and Land-Cover Classification
The results of the Sentinel-2A imagery classification yielded highly reliable LULC classes (see Figure 4), with an Overall Accuracy of 91.3%, an overall F1-score of 0.90, and a Kappa coefficient of 0.84 (Table 5). This indicates that the barren land is the dominant land-cover in the study area, occupying 303.57 km2 (58.2%), followed by built-up land with 97.17 km2 (18.6%). The others category covers 84.14 km2 (16.0%), while vegetation accounts for 36.05 km2 (6.9%), mainly concentrated in valley plains and irrigated agricultural areas. Water bodies represent the smallest share, covering only 1.57 km2 (0.3%), reflecting the arid climate and episodic hydrology of the study area. Class-wise accuracy also remained strong, with producer’s and user’s accuracies of 94.5% and 93.2% for barren land, 92.1% and 90.5% for built-up land, 89.7% and 91.2% for vegetation, 88.9% and 90.4% for water, and 85.6% and 89.0% for others. The results offer a solid foundation for land-suitability modeling and point to the dire necessity of sustainable development to balance residential development and the incorporation of green urban landscapes [34,35].
Figure 4.
(a) Classified image 2023 (Sentinel-2); (b) existing land-use of Quetta city in 2023.
Table 5.
Accuracy assessment of RF-based land-use/land-cover classification (2023).
4.2. Criteria and Factors
The suitability analysis incorporated criteria representing accessibility, topographic stability, and hydro-ecological conditions relevant to semi-arid environments. For residential suitability, factors such as proximity to roads, public services, and commercial centers captured infrastructural accessibility, while slope, greenery, and water access reflected environmental livability under resource-constrained conditions. For greenery suitability, greater emphasis is placed on soil moisture, drainage proximity, and distance from built-up areas to account for water scarcity, vegetation stress, and urban disturbance typical of semi-arid regions. All criteria are standardized using fuzzy membership functions to ensure continuous representation of suitability. Additionally, the applied Boolean constraints excluded hazard-prone areas, including steep slopes, drainage-risk zones, and high-altitude barren land. The integration of hydrological (soil moisture, drainage), accessibility, and exclusion-based constraints provides a context-specific planning-support framework for modeling competing land-use priorities in semi-arid urban systems.
AHP Calculations: Pairwise Comparison (aim = Wi/Wj) for Green Suitability Index (GSI)
The consistency of the AHP pairwise comparison matrices is evaluated using the CR (see Table 6 and Table 7). For the Greenery Suitability Index (GSI), the computed mix is 6.27, resulting in a CI of 0.054 and CR of 0.043. For the Residential Suitability Index (RSI), the mix is 6.39, with a CI of 0.078 and CR of 0.063. Both CR values are below the acceptable threshold of 0.1, indicating satisfactory consistency in the pairwise comparisons and confirming the reliability of the derived weights for subsequent WLC-based suitability analysis.
Table 6.
Pairwise comparison matrix, consistency vector, and consistency results for GSI.
Table 7.
Pairwise comparison matrix, consistency vector, and consistency results for RSI
4.3. Residential and Greenery Suitability Evaluation
The use of the AHP–Fuzzy–WLC framework in the study area shows that the criteria related to accessibility have the most profound effect on residential suitability (see Figure 5). Table 8 shows that the normalized weight (w = 0.304) assigned to the distance to major roads turned out to be the most influential factor, which generated the best value of the mean suitability (0.72). This indicates that access to transportation is a major factor that enhances residential growth in the study area but is limited. Slope (w = 0.145; mean = 0.64) and the vicinity to public services (w = 0.188; mean = 0.64) are also important factors, as terrain stability and the distance to services are joint determinants of possible residential development zones. The distance to greenery (w = 0.145; mean = 0.65) is in the middle of the influence, meaning that residential buildings should be developed near the already existing vegetated areas that enhance the micro-climate and living conditions. The influence of commercial-center proximity (w = 0.130; mean = 0.61) and water-access distance (w = 0.087; mean = 0.57) is less significant, though it was contextually significant and is predominantly played by zones that were peripheral or less connected. Areas that have a slope steeper than 35% or those that overlap drainage-risk areas were automatically removed by means of Boolean constraints. The total Residential Suitability Index (RSI = 0.64) represents moderate suitability, concentrated in the central corridors with the availability of accessibility and the topographic balance. The results of this study verify that accessibility and stability make the city mainly residential-suitable, which is not necessarily determined by environmental factors but represents a trade-off between physical viability and environmental sensitivity in semi-arid urbanism.
Figure 5.
Spatial criteria layers used for the residential suitability evaluation: (a) distance to roads, (b) distance to public services, (c) distance to commercial centers, (d) distance to greenery, (e) water access, (f) slope, and (g) drainage. These thematic layers represent key environmental and infrastructural determinants incorporated in the multi-criteria evaluation.
Table 8.
Residential suitability factors: fuzzy membership thresholds, AHP weights, and WLC outcomes.
Greenery suitability analysis indicates the ecological parameters responsible for vegetation potential and restoration possibility in semi-arid landscapes in the study area (see Figure 6). As per Table 9, the strongest impact was soil moisture (w = 0.197; mean = 0.75), indicating the critical nature of the availability of subsurface water in supporting urban greenery. In the second place, water access (w = 0.167; mean = 0.68) was found, and it demonstrated that the areas which are in medium proximity to the tube wells and small reservoirs have a better ecological potential because of the higher credibility of irrigation. The factors of accessibility were also not unimportant: the distance to built-up areas (w = 0.152; mean = 0.68) suggests that green infrastructure is more practicable on urban edges, where the pressure of human activities and the amount of impervious surfaces are low, and the proximity to roads (w = 0.167; mean = 0.63) implies the balancing of human access and ecological continuity. This pattern is also supported by the closeness to drains (w = 0.182; mean = 0.63), where natural runoff channels provide suitable micro-hydrological conditions of the vegetation corridors. Slope (w = 0.136; mean = 0.56), in contrast, influenced a little less, since steep gradients restrict soil retention and soils can be planted. The Boolean masking was based on hazard-prone or high-altitude barren regions above 2500 m. The total Greenery Suitability Index (GSI = 0.67) is higher than residential land, which indicates the relatively wide scope of the spatial facility of ecological restoration. Such findings validate the fact that the hydrological and moisture-absorbing parameters rule the suitability of greenery in the study area and accessibility, and the small slope serves as a facilitating factor of sustainable vegetation development and climate resilience of the urban landscape.
Figure 6.
Greenery suitability evaluation of environmental and infrastructural criteria that were employed in the suitability analysis: (a) distance to roads, (b) built-up areas (c) slope, (d) drainage, (e) water access, (f) soil moisture, (g) hazards, (h) constraints (0 is not available and 1 is available land for planning).
Table 9.
Greenery suitability factors: fuzzy membership thresholds, AHP weights, and WLC outcomes.
The suitability classification shows clear contrasts between residential and greenery potentials in the study area. The highly suitable land for residential use covers 83% of the area, mainly in the urban core and along transport corridors, while greenery suitability reaches 29%, concentrated in plains and gray-water buffers, located in peri-urban and mid-valley zones. Insufficient suitability dominates residential land at 17%, reflecting the city’s steep slopes and peripheral terrain, whereas greenery records a lower share of 29%. These patterns indicate that the study area’s landscape offers greater ecological capacity for greenery than for urban expansion.
4.3.1. Residential Suitability Assessment (RSI)
The Residential Suitability Index (RSI) was classified into five suitability levels using the Natural Breaks (Jenks) classification method. The (RSI) revealed a heterogeneous spatial distribution of residential development potential across the study area. Approximately 40.25% (209.35 km2) of the study area was classified as high to very high suitability, suggesting substantial potential for future residential development under existing accessibility, environmental, and topographic conditions. Moderate suitability represented the largest individual category (118.46 km2; 22.77%), while very low suitability areas occupied 101.95 km2 (19.60%), largely corresponding to environmentally constrained and topographically unfavorable locations (see Table 10). The results suggest that residential development opportunities are primarily concentrated in areas characterized by improved accessibility to roads, public services, commercial centers, and water resources.
Table 10.
Area distribution of residential and greenery suitability classes.
4.3.2. Green-Infrastructure Suitability Assessment (GSI)
Figure 7 shows the distribution of the Green Suitability Index (GSI), which is classified into five suitability levels using the Jenks classification. Jenks classification is extensively used in GIS-based suitability mapping as it minimizes within-class variance while maximizing between-class variance, thus identifying natural groupings within continuous suitability data [55]. It shows a relatively balanced distribution among suitability classes. Areas classified as high and very high suitability accounted for 204.79 km2 (39.38%) of the study area, while moderate suitability covered 132.99 km2 (25.56%), representing the dominant class. Low and very low suitability categories together occupied 182.36 km2 (35.06%) (see Table 10). Highly suitable green infrastructure zones were primarily associated with favorable drainage conditions, adequate soil moisture, proximity to water resources, and environmentally sensitive landscapes. These areas represent strategic locations for ecological conservation, urban greening initiatives, and enhancement of ecosystem services within the rapidly urbanizing environment of the study area.
Figure 7.
Spatial distribution of (a) Residential Suitability Index (RSI) and (b) Green-Infrastructure Suitability Index (GSI) generated using the AHP-weighted fuzzy multi-criteria evaluation framework. The maps identify areas with varying levels of suitability, ranging from very low to very high, for residential expansion and green-infrastructure development.
4.4. Model Validation Using ROC–AUC Analysis
The predictive performance of the RSI and GSI models is evaluated using Receiver Operating Characteristic (ROC) analysis and the Area Under the Curve (AUC) metric. Validation is performed by comparing suitability values extracted from model outputs against independent presence and background observations. Presence points represent locations where the target phenomenon currently exists and are used as positive reference observations, i.e., existing greenery and settlements, whereas, background points represent randomly selected locations across the study area and provide a reference sample of available environmental conditions against which the suitability models are evaluated. Existing settlement locations are used as samples for RSI validation, whereas vegetation patches extracted from the 2023 land-use classification are used as samples for GSI validation. Randomly generated background points are used as pseudo-absence observations for both models.
The ROC curves shown in Figure 8 indicate that the RSI model achieved an AUC value of 0.850 (95% CI: 0.823–0.878), indicating very good predictive accuracy and a strong capacity to distinguish suitable residential locations from unsuitable areas. This result demonstrates the robustness of the integrated fuzzy–AHP–WLC framework in identifying residential development opportunities within the study area. The GSI model produced an AUC value of 0.702 (95% CI: 0.689–0.715), indicating acceptable predictive performance. Although lower than the RSI model, the obtained AUC value exceeds the commonly accepted threshold of 0.70, confirming that the selected environmental variables effectively captured the spatial distribution of suitable green infrastructure locations. Both suitability models performed substantially better than random prediction (AUC = 0.50), confirming the reliability and practical applicability of the proposed suitability assessment framework for supporting sustainable urban planning and green-infrastructure development in the study area.
Figure 8.
Receiver Operating Characteristic (ROC) curves used to evaluate the predictive performance of the suitability models. (A) Residential Suitability Index (RSI) achieved an Area Under the Curve (AUC) of 0.850 (95% CI: 0.823–0.878), indicating very good predictive accuracy. (B) Green-Infrastructure Suitability Index (GSI) achieved an AUC of 0.702 (95% CI: 0.689–0.715), indicating acceptable predictive performance. The dashed diagonal line represents random prediction (AUC = 0.50). Both models performed substantially better than random classification, supporting the reliability of the AHP-weighted fuzzy multi-criteria evaluation framework.
The predictive performance of RSI and GSI was evaluated through ROC-AUC statistics, because the RGTI represents a planning-support framework rather than a predictive model. Therefore, the conventional predictive validation metrics are not directly applicable. Moreover, a spatial consistency assessment is conducted by overlaying the rule-based-RGTI zones with the 2023 LULC map and quantifying the distribution of existing land-cover classes within each planning-priority zone. This approach proved to be useful in evaluating the plausibility and planning relevance of the proposed trade-off zones in this study.
4.5. Spatial Consistency Assessment of RGTI Zones
Figure 9 clearly identifies areas of spatial competition and complementarity between residential development and green infrastructure by integrating the normalized RSI and GSI through the Residential–RGTI. The resulting continuous trade-off surface highlights locations where one land-use objective dominates the other. Moreover, it identifies areas where both objectives exhibit comparable suitability and therefore require balanced planning interventions. The trade-off analysis revealed substantial spatial variation across the study area. Areas with positive RGTI values indicate locations where residential suitability exceeds green-infrastructure suitability, suggesting favorable conditions for future urban expansion. Conversely, negative values indicate locations where ecological functions and environmental suitability are dominant, making them more appropriate for green infrastructure protection and enhancement. Areas with values approaching the neutral trade-off condition (RGTI = 0) represent areas where residential development and green infrastructure objectives exhibit similar suitability and therefore require balanced planning consideration.
Figure 9.
Spatial distribution of rule-based Residential–Green Infrastructure Trade-off Index (RGTI) planning zones in the study area of the valley, showing areas prioritized for green infrastructure conservation, residential expansion, and shared planning interventions.
Unlike RSI and GSI, which represent predictive suitability models validated using ROC–AUC analysis, the developed RGTI in this study serves as a spatial decision-support framework for identifying areas of potential conflict and synergy between residential development and green infrastructure objectives. Consequently, conventional predictive validation metrics are not directly applicable to the RGTI. Therefore, a spatial consistency assessment is performed by overlaying the rule-based RGTI threshold system centered on the neutral trade-off condition (details in methods Section 3.3.2) with the 2023 LULC map to evaluate the plausibility and planning relevance of the identified priority zones. The results revealed that open land constituted the dominant land-cover category across all planning zones, accounting for 50.3–67.5% of the area (Table 11). This pattern reflects the extensive availability of undeveloped land within the valley (study area) and indicates that the RGTI framework primarily identifies future planning opportunities rather than reproducing existing land-use patterns. The Strong Green Infrastructure Priority zone was largely associated with open land (51.3%) and other non-built areas (45.0%), suggesting high potential for ecological conservation, ecological restoration, and green infrastructure enhancement. Conversely, the Strong Residential Expansion Priority zone contained a greater proportion of built-up land (7.9%) than the Strong Green Infrastructure Priority zone (1.3%), indicating a stronger spatial association with existing urban development corridors and potential growth areas. The Shared/Balanced Zone exhibited the highest proportion of built-up land (29.5%) while retaining substantial open land (50.3%), highlighting areas where residential development and green infrastructure objectives overlap and require integrated planning interventions. These zones represent locations where land-allocation decisions are most critical because competing development and environmental objectives coexist. Overall, the spatial consistency assessment demonstrates that the RGTI framework successfully differentiates planning priorities across the study area and provides a practical basis for balancing urban expansion with ecological sustainability
Table 11.
Distribution of 2023 land-use/land-cover classes within the rule-based Residential–Green Infrastructure Trade-off Index (RGTI) planning zones used for spatial consistency assessment.
4.6. Conflict–Synergy–Balance Planning Zones
The rule-based-RGTI provides a planning-oriented representation of the spatial interaction between residential development suitability and green-infrastructure suitability. Rather than evaluating these objectives independently, the framework identifies areas where ecological priorities dominate, where residential development priorities dominate, and where both objectives exhibit comparable suitability. This distinction enables the delineation of conflict, synergy, and balanced planning zones that are directly relevant to sustainable urban land-allocation decisions.
Figure 9 and Table 12 show the resulting trade-off map with five priority classes for planning: Very High Green Infrastructure, Moderate Green Infrastructure, Shared/Balanced Zone, Moderate Residential Expansion, and Very High Residential Expansion. The Shared/Balanced Zone accounted for around 46.2% of the study area, showing that a significant area of the city has similar suitability for both residential build-out and provision of green infrastructure. This zone is suitable for integrated planning where development and ecological enhancement strategies can be coordinated to reduce potential future land-use conflicts. The green infrastructure priority zone, comprising the Very High and Moderate Green Infrastructure classes, is approximately 27.6% of the study area. This zone represents areas where ecological suitability exceeds residential suitability and, therefore, provides opportunities for conservation, ecological restoration, green infrastructure expansion, and climate adaptation interventions. Given the ecological fragility and water scarcity conditions of the study area, this zone plays an important role in maintaining environmental quality and ecosystem services. The residential expansion priority zone, comprising the Moderate and Very High Residential Expansion classes, accounted for approximately 26.2% of the study area. This zone indicates areas where residential suitability exceeds green infrastructure and, therefore, represents potential areas for future urban development. The spatial concentration of this zone around existing urban corridors suggests opportunities for more compact and coordinated urban growth while reducing pressure on environmentally sensitive landscapes. The conflict–synergy–balance framework demonstrates that sustainable urban development in the study area cannot be achieved through residential suitability or ecological suitability assessments alone. Instead, the results highlight the importance of identifying areas where development and environmental objectives compete, overlap, or complement one another. By explicitly distinguishing ecological conservation zones, residential development zones, and integrated planning zones, the framework provides a practical basis for balancing urban expansion and green infrastructure provision within a semi-arid and water-constrained urban environment.
Table 12.
Conflict–synergy–balance planning zones derived from the rule-based Residential–Green Infrastructure Trade-off Index (RGTI).
5. Discussion
This study is grounded in land-use conflict theory by treating residential expansion and ecological protection as competing spatial objectives. Instead of allocating land through an optimization model, the study identifies where residential suitability and green-infrastructure suitability dominate, overlap, or create balanced planning zones. The RGTI provides a transparent way to translate suitability surfaces into spatial conflict and priority categories, supporting evidence-based planning in Quetta under conditions of weak master planning, water scarcity, and ecological pressure. The Random Forest (RF) classifier in this study significantly improved classification of Sentinel-2A imagery, with a total accuracy of 91.3% and a Kappa value of 0.84. The results are in line with the findings of He, Zhu [56], who obtained 90% classification accuracy in complex urban environments, while RF classifiers outperformed traditional parametric models. These results are supported by Arca and Keskin Citiroglu [57], who asserted that machine learning classifiers are more robust in semi-arid urban areas than maximum likelihood classifiers and by Rodriguez-Galiano, Chica-Olmo [58] and Praticò, Solano [59], who confirmed the use of RF with k values of 0.82 to 0.88 in the Mediterranean landscape. Collectively, both studies prove and support that the outputs of the classification in this study are in line with the global evidence based on accuracy and reliability. The suitability assessment indicates that residential potential is driven primarily by proximity to major roads and stable slopes, whereas greenery suitability is shaped mainly by soil moisture availability and distance from built-up edges. The same weightings were found in studies of urban suitability of Indian mountain towns, in which residential areas were weighted by accessibility criteria over environmental ones [60], and ecological suitability in semi-arid regions was found to be closely related to soil moisture availability and topographic variables [61]. Similar fuzzy and AHP-based analyses in arid-region suitability studies have reported mean suitability values ranging from 0.56 to 0.68 for development-oriented land uses. Comparable studies focusing on ecological or greenery-related suitability have reported values between 0.60 and 0.73, which broadly align with the range observed in this study [62,63]. The reliability of the classification in this study is supported not only by its accuracy values, but also by the similarity between study area and other recently studied landscapes. Study area has a heterogeneous semi-arid urban structure with built-up land, barren surfaces, sparse vegetation, and mixed transitional classes, which creates the same type of classification difficulty reported in other complex urban and arid environments. Recent studies have shown that machine learning methods perform well in such settings because they are better able to capture fragmented land-cover patterns and spectral variability. For this reason, the present results are credible not only because of their numerical strength, but also because they were derived in a landscape and mapping context similar to those examined in recent studies [64,65].
To evaluate spatial competition between residential development and green infrastructure objectives, this study applied the RGTI. Instead of allocating land through an optimization model, the RGTI identifies where residential suitability dominates, where green-infrastructure suitability is stronger, and where both objectives overlap as shared or balanced planning zones. This approach is more suitable for the revised framework because it translates the Residential Suitability Index (RSI) and Green-Infrastructure Suitability Index (GSI) into clear planning-priority categories. The results show that the study area contains areas where ecological protection should be prioritized, areas where controlled residential expansion may be supported, and areas where both objectives require integrated planning intervention. Similar land-use conflict and spatial planning studies emphasize that trade-off-based evaluation can help planners identify competing development and ecological priorities without assigning fixed future land-use allocations [66,67]. This study is grounded in land-use conflict theory by treating residential expansion and ecological protection as competing spatial objectives. This perspective understands land-use conflict as a spatial tension between development demand and ecological protection that requires transparent evaluation rather than single-objective suitability mapping. The RGTI operationalizes this theory by showing where residential suitability and green-infrastructure suitability dominate, overlap, or form shared planning zones. Therefore, the present research contributes not only to empirical planning evidence for the study area but also to the practical application of land-use conflict theory in secondary cities under sustainability pressure. This is especially important because the study area has not had an updated master plan for several decades. The study provides an evidence-based framework aligned with SDG 11 and SDG 15 by supporting compact, resilient, and environmentally sensitive urban planning [68,69]. This study has several limitations. First, the analysis is based on a single-city case study and should not be interpreted as direct evidence for all Global South or secondary cities. Second, SRTM DEM and GLDAS soil-moisture data were resampled for spatial alignment, but resampling does not improve their native spatial accuracy. Third, AHP-based suitability modeling contains subjective judgment in criteria weighting and fuzzy-threshold selection, although consistency checking was applied. Fourth, the RGTI identifies spatial trade-offs between residential and green-infrastructure suitability, but it does not verify land ownership, legal availability, implementation cost, walking-network accessibility, stakeholder preference, or institutional feasibility. Fifth, the suitability and trade-off outputs require field validation, cadastral verification, and comparison with existing planning instruments before practical implementation. Future research should test the framework in multiple arid secondary cities, include stakeholder-based weighting, use higher-resolution terrain and socio-economic datasets, and validate priority zones through field surveys and planning-agency consultation.
The results reveal unique regions for ecological conservation, which support planning for new development interventions in the study area. Therefore, by identifying dominant ecological and residential zones, we designed the RGTI framework to balance planning beyond the conventional approach to suitability mapping. This conflict–synergy–balance arrangement offers a viable way to assess competing land-use goals in a rapidly urbanizing landscape and constrained environment in secondary urban cities. Other studies have highlighted the need to consider both development and ecological issues as integral parts of sustainable urban planning [46,69]; however, the present study presented a framework to do so. The balanced zone represents the largest portion of the study area that is a shared area for residential development and green-infrastructure suitability. So, instead of marking binary flags for residential or ecological areas, these shared areas demand coordinated approaches to land allocation that consider urban development, environmental protection, and long-term landscape resilience. These areas offer potential for small-scale urban development, ecological corridors, urban parks, and multifunctional green-infrastructure interventions that will mitigate future land-use conflicts and improve environmental quality [50,70]. The priority areas identified by the framework as environment-sensitive zones are particularly significant for the city’s semi-arid environment, where water scarcity, vegetation degradation, and rapid urban growth pose challenges to ecosystem functions. The maintenance and enhancement of green infrastructure in these areas can support linked ecosystem services, such as climate adaptation, urban heat mitigation, biodiversity conservation, and stormwater management [45,49,71].
Conversely, the residential priority zones indicate areas where future urban expansion may be accommodated with comparatively lower ecological conflict. The concentration of these zones around existing urban development corridors suggests opportunities for more compact and coordinated urban growth while minimizing encroachment into environmentally sensitive landscapes. Such an approach is consistent with sustainable land-use planning principles that seek to balance urban development needs with ecological protection and resource conservation [70,71]. More broadly, the proposed framework contributes to sustainable urban planning in arid and water-constrained cities where competition for land resources is becoming increasingly intense. Unlike traditional suitability assessments that evaluate development and environmental objectives separately, the conflict–synergy–balance framework explicitly recognizes that urban growth and ecological protection are interconnected planning challenges. By identifying where these objectives conflict, overlap, or complement one another, the framework provides a transparent basis for strategic land-allocation decisions and supports the development of resilient urban landscapes in rapidly growing secondary cities. The framework is particularly relevant for cities lacking updated master plans, where evidence-based spatial prioritization can support the implementation of Sustainable Development Goal (SDG) 11, Sustainable Cities and Communities, and SDG 15, Life on Land, through more integrated and environmentally informed planning practices [72,73].
6. Conclusions
In this study, we developed a GIS-based suitability framework through a trade-off analysis to optimize competing interests in residential and green infrastructure in Quetta. The framework used multi-criteria evaluation (MCE), Analytic Hierarchy Process (AHP), and Weighted Linear Combination (WLC) to produce three indices: the Residential Suitability Index (RSI), the Green-Infrastructure Suitability Index (GSI), and the Residential–Green Infrastructure Trade-off Index (RGTI). The relative importance of each criterion is determined by AHP, and WLC combined accessibility, infrastructural, topographic, and ecological factors to create suitability surfaces. Next, these outputs are normalized and summed.
The results highlight residential areas suitable for green infrastructure, and areas where planning zones overlap. By identifying zones of planning priority in the study area, it establishes a transparent spatial framework that clarifies the conflict between settlement expansion and environmental protection. Thus, trade-off-based spatial analyses help identify spaces for controlled residential development, areas to protect green infrastructure, and regions for integrated planning intervention. The sustainable zoning mechanism developed in this study applies spatial relations between residential accessibility and environmental sensitivity and, thus, offers an alternative to traditional planning in secondary urban cities. The findings indicate that urban policy should include suitability assessment, RGTI-based trade-off analysis, and participatory planning. Future research should reduce subjectivity in the weighting criteria. It should (I) incorporate dynamic and network-based accessibility processes, (ii) extrapolate the developed framework to other secondary cities, (iii) use higher-resolution socio-economic data, and (iv) verify framework performance.
The study proposed that planning for future development in the study area should use data-driven suitability and trade-off analyses. This can optimize residential development through safeguarding priority areas for green infrastructure and improving environmental quality and accessibility. Land-use policies should integrate green infrastructure to mitigate urban heat stress, flood exposure, biodiversity loss, and provide access to environmental services. Moreover, since the city under investigation lacks an updated master plan, institutional capacity becomes critical to monitoring and updating land-use laws. This approach can serve as a relocatable planning blueprint for other secondary cities in the Global South facing urban equity and sustainability challenges. The framework supports sustainable urban development and ecosystem protection, aligning with Sustainable Development Goals 11 and 15.
Author Contributions
Conceptualization, N.K. and J.Z.; methodology, N.K. and M.I.; software, N.K.; validation, N.K., M.I. and Q.L.; formal analysis, N.K. and M.I.; investigation, N.K.; resources, J.Z.; data curation, N.K.; writing—original draft preparation, N.K.; writing—review and editing, M.I.; visualization, N.K.; supervision, J.Z. and M.I.; project administration, Q.L.; funding acquisition, J.Z. All authors have read and agreed to the published version of the manuscript.
Funding
This research was supported by Fundamental and Interdisciplinary Disciplines Breakthrough Plan of the Ministry of Education of China (JYB2025XDXM111) and Shenzhen Outstanding Talents Training Fund. This research was supported by National Natural Science Foundation of China (China-Europe Cooperation Project), Contract No. 71961137003.
Data Availability Statement
The data presented in this study are available on request from the corresponding author M.I.
Conflicts of Interest
The authors declare no conflict of interest.
Abbreviations
The following abbreviations are used in this manuscript:
| Abbreviation | Full Form |
| AHP | Analytic Hierarchy Process |
| CI | Consistency Index |
| CR | Consistency Ratio |
| DEM | Digital Elevation Model |
| F1 | F1-Score |
| GIS | Geographic Information System |
| GLDAS | Global Land Data Assimilation System |
| GSI | Greenery Suitability Index |
| RGTI | Green Infrastructure Trade-off Index |
| LULC | Land-Use/Land-Cover |
| MCE | Multi-Criteria Evaluation |
| NIR | Near-Infrared |
| OA | Overall Accuracy |
| RSI | Residential Suitability Index |
| SDG | Sustainable Development Goal |
| SRTM | Shuttle Radar Topography Mission |
| SWIR | Shortwave Infrared |
| UGS | Urban Green Spaces |
| UTM | Universal Transverse Mercator |
| WLC | Weighted Linear Combination |
| κ | Cohen’s Kappa |
References
- Chakraborty, T.; Venter, Z.S.; Demuzere, M.; Zhan, W.; Gao, J.; Zhao, L.; Qian, Y. Large disagreements in estimates of urban land across scales and their implications. Nat. Commun. 2024, 15, 9165. [Google Scholar] [CrossRef] [Scilit] [PubMed]
- Taubenböck, H.; Mast, J.; Rodríguez, R.L.; Debray, H.; Wurm, M.; Geiß, C. Was global urbanization from 1985 to 2015 efficient in terms of land consumption? Habitat Int. 2025, 160, 103397. [Google Scholar] [CrossRef] [Scilit]
- Angel, S. Urban expansion: Theory, evidence and practice. Build. Cities 2023, 4, 124–138. [Google Scholar] [CrossRef] [Scilit]
- United Nations. World Urbanization Prospects 2023; United Nations: New York, NY, USA, 2023. [Google Scholar]
- Frolking, S.; Mahtta, R.; Milliman, T.; Esch, T.; Seto, K.C. Global urban structural growth shows a profound shift from spreading out to building up. Nat. Cities 2024, 1, 555–566. [Google Scholar] [CrossRef] [Scilit]
- Wu, S.; Chen, B.; Webster, C.; Xu, B.; Gong, P. Improved human greenspace exposure equality during 21st century urbanization. Nat. Commun. 2023, 14, 6460. [Google Scholar] [CrossRef] [Scilit] [PubMed]
- Derdouri, A.; Murayama, Y.; Morimoto, T.; Wang, R.; Aghasi, N.H.M. Urban green space in transition: A cross-continental perspective from eight Global North and South cities. Landsc. Urban Plan. 2025, 253, 105220. [Google Scholar] [CrossRef] [Scilit]
- Lin, H.; Li, X. The Role of Urban Green Spaces in Mitigating the Urban Heat Island Effect: A Systematic Review from the Perspective of Types and Mechanisms. Sustainability 2025, 17, 6132. [Google Scholar] [CrossRef] [Scilit]
- Chen, B.; Wu, S.; Song, Y.; Webster, C.; Xu, B.; Gong, P. Contrasting inequality in human exposure to greenspace between cities of Global North and Global South. Nat. Commun. 2022, 13, 4636. [Google Scholar] [CrossRef] [Scilit] [PubMed]
- Onyango, S.A. Land Use and Vegetation Changes Impact on Thermal Comfort in Urban Open Spaces of Nairobi City, Kenya. Ph.D. Thesis, JKUAT-CoANRE, Juja, Kenya, 2024. [Google Scholar]
- Awoniran, D.R.; Adeseye, T.A.; Agboola, S.O.; Babalola, S.O. A Multi-Temporal Satellite Data and Spectral Indices for Assessing Spatial Changes in Urban Farmlands in Lagos, Nigeria. Sustain. Sci. Resour. 2025, 7, 39–58. [Google Scholar] [CrossRef] [Scilit]
- World Bank. Urban Development Overview; World Bank: Washington, DC, USA, 2023. [Google Scholar]
- Shammi, M.; Reza, F.; Sarker, A.C.; Sakib, A.A. Prospects and challenges of achieving sustainable urban green-spaces: A case study of urban greening in Dhaka North City Corporation (DNCC), Bangladesh. PLoS Sustain. Transform. 2023, 2, e0000061. [Google Scholar] [CrossRef] [Scilit]
- Misty, M.S.; Hoque, M.A.-A.; Mukul, S.A. Assessment of Urban Green Space Dynamics in Dhaka South City Corporation of Bangladesh Using Geospatial Techniques. Land 2024, 13, 1426. [Google Scholar] [CrossRef] [Scilit]
- Nahid, S.; Kumar, R.P.; Acharya, P.; Kumar, K.; Purohit, S. Forecasting urban expansion in Delhi-NCR: Integrating remote sensing, machine learning, and Markov chain simulation for sustainable urban planning. GeoJournal 2025, 90, 72. [Google Scholar] [CrossRef] [Scilit]
- Arshad, A.; Ashraf, M.; Sundari, R.S.; Qamar, H.; Wajid, M.; Hasan, M. Vulnerability assessment of urban expansion and modelling green spaces to build heat waves risk resiliency in Karachi. Int. J. Disaster Risk Reduct. 2020, 46, 101468. [Google Scholar] [CrossRef] [Scilit]
- Waleed, M.; Sajjad, M. Warming cities in Pakistan: Evaluating spatial–temporal dynamics of urban thermal field variance index under rapid urbanization. In Climate Change and Cooling Cities; Springer: Singapore, 2023; pp. 67–82. [Google Scholar]
- Zhao, L.Q.; van Duynhoven, A.; Dragićević, S. Machine Learning for Criteria Weighting in GIS-Based Multi-Criteria Evaluation: A Case Study of Urban Suitability Analysis. Land 2024, 13, 1288. [Google Scholar] [CrossRef] [Scilit]
- Wang, Z.; Li, Z.; Wang, Y.; Zheng, X.; Deng, X. Building green infrastructure for mitigating urban flood risk in Beijing, China. Urban For. Urban Green. 2024, 93, 128218. [Google Scholar] [CrossRef] [Scilit]
- Navas González, Á.; Hewitt, R.J.; Martínez-Vega, J. Green Infrastructure Mapping in Almeria Province (Spain) Using Geographical Information Systems and Multi-Criteria Evaluation. Land 2024, 13, 1916. [Google Scholar] [CrossRef] [Scilit]
- Suthar, N.; Das, D.; Mallik, J. Land-use suitability assessment for urban development using Multi-Criteria Decision-Making Analysis in the Himalayan districts of Shimla, Nainital, and Darjeeling, India. Discov. Environ. 2024, 2, 90. [Google Scholar] [CrossRef] [Scilit]
- Bakolo, C.; Kayitete, L.; de Dieu Tuyizere, J.; Tomlinson, J.; Fawcett, J.; Alfaro, R.F. Identification of optimal locations for green space initiatives through GIS-based multi-criteria analysis and the analytical hierarchy process. Environ. Syst. Res. 2024, 13, 46. [Google Scholar] [CrossRef] [Scilit]
- Qu, S.; Hu, S.; Li, W.; Wang, H.; Zhang, C.; Li, Q. Interaction between urban land expansion and land use policy: An analysis using the DPSIR framework. Land Use Policy 2020, 99, 104856. [Google Scholar] [CrossRef] [Scilit]
- Masoudi, M.; Centeri, C.; Jakab, G.; Nel, L.; Mojtahedi, M. GIS-based multi-criteria and multi-objective evaluation for sustainable land-use planning (case study: Qaleh Ganj County, Iran) “landuse planning using mce and mola”. Int. J. Environ. Res. 2021, 15, 457–474. [Google Scholar] [CrossRef] [Scilit]
- Weng, W.; Costa, L.; Lüdeke, M.K.; Zemp, D.C. Aerial river management by smart cross-border reforestation. Land Use Policy 2019, 84, 105–113. [Google Scholar] [CrossRef] [Scilit]
- Yang, X.; Bai, Y.; Che, L.; Qiao, F.; Xie, L. Incorporating ecological constraints into urban growth boundaries: A case study of ecologically fragile areas in the Upper Yellow River. Ecol. Indic. 2021, 124, 107436. [Google Scholar] [CrossRef] [Scilit]
- Adelina, C.; Archer, D.; Johnson, O.; Opiyo, R.O. Governing Sustainability in Secondary Cities of the Global South; Stockholm Environment Institute: Stockholm, Sweden, 2020. [Google Scholar]
- Durrani, I.H.; Adnan, S.; Aftab, S.M. Daily Climate Extremes of Temperature and Precipitation Over Quetta Valley, Pakistan During 1961–2019. Int. J. Environ. 2021, 10, 20–48. [Google Scholar] [CrossRef] [Scilit]
- Pakistan Bureau of Statistics. Balochistan—Census 2023 Tables (Quetta District: Population, Growth, Households); Pakistan Bureau of Statistics: Islamabad, Pakistan, 2023. [Google Scholar]
- Youngquist, K.; Shrestha, M.; Ryan, B.; Mitra, C. A global scoping review on sustainability, climate migration, and climate resilience of small and medium-sized cities (SMSC). Urban Clim. 2023, 49, 101546. [Google Scholar] [CrossRef] [Scilit]
- Sharifi, A.; Khavarian-Garmsir, A.R.; Allam, Z.; Asadzadeh, A. Progress and prospects in planning: A bibliometric review of literature in Urban Studies and Regional and Urban Planning, 1956–2022. Prog. Plan. 2023, 173, 100740. [Google Scholar] [CrossRef] [Scilit]
- Drusch, M.; Del Bello, U.; Carlier, S.; Colin, O.; Fernandez, V.; Gascon, F.; Hoersch, B.; Isola, C.; Laberinti, P.; Martimort, P. Sentinel-2: ESA’s optical high-resolution mission for GMES operational services. Remote Sens. Environ. 2012, 120, 25–36. [Google Scholar] [CrossRef] [Scilit]
- Xu, F.; Heremans, S.; Somers, B. Urban land cover mapping with sentinel-2: A spectro-spatio-temporal analysis. Urban Inform. 2022, 1, 8. [Google Scholar] [CrossRef] [Scilit]
- Belgiu, M.; Drăguţ, L. Random forest in remote sensing: A review of applications and future directions. ISPRS J. Photogramm. Remote Sens. 2016, 114, 24–31. [Google Scholar] [CrossRef] [Scilit]
- Congalton, R.G.; Green, K. Assessing the Accuracy of Remotely Sensed Data: Principles and Practices; CRC Press: Boca Raton, FL, USA, 2019. [Google Scholar]
- Jiang, H.; Eastman, J.R. Application of fuzzy measures in multi-criteria evaluation in GIS. Int. J. Geogr. Inf. Sci. 2000, 14, 173–184. [Google Scholar] [CrossRef] [Scilit]
- Saaty, T.L. Analytic hierarchy process. In Encyclopedia of Operations Research and Management Science; Springer: New York, NY, USA, 2013; pp. 52–64. [Google Scholar]
- Gorsevski, P.V.; Jankowski, P.; Gessler, P.E. An heuristic approach for mapping landslide hazard by integrating fuzzy logic with analytic hierarchy process. Control Cybern. 2006, 35, 121–146. [Google Scholar]
- Malczewski, J. GIS-based land-use suitability analysis: A critical overview. Prog. Plan. 2004, 62, 3–65. [Google Scholar] [CrossRef] [Scilit]
- Eastman, J.R. TerrSet Geospatial Monitoring and Modeling System Manual; Clark Labs, Clark University: Worcester, MA, USA, 2016. [Google Scholar]
- Al-Shalabi, M.A.; Mansor, S.B.; Ahmed, N.B.; Shiriff, R. GIS based multicriteria approaches to housing site suitability assessment. In Proceedings of the XXIII FIG Congress, Munich, Germany, 8–13 October 2006. [Google Scholar]
- Mosadeghi, R.; Warnken, J.; Tomlinson, R.; Mirfenderesk, H. Comparison of fuzzy-AHP and AHP in a spatial multi-criteria decision making model for urban land-use planning. Comput. Environ. Urban Syst. 2015, 49, 54–65. [Google Scholar] [CrossRef] [Scilit]
- Geneletti, D. Combining stakeholder analysis and spatial multicriteria evaluation to select and rank inert landfill sites. Waste Manag. 2010, 30, 328–337. [Google Scholar] [CrossRef] [Scilit] [PubMed]
- Saaty, T.L. The Analytic Hierarchy Process; McGraw-Hill: New York, NY, USA, 1980. [Google Scholar]
- Kabisch, N.; Korn, H.; Stadler, J.; Bonn, A. Nature-Based Solutions to Climate Change Adaptation in Urban Areas: Linkages Between Science, Policy and Practice; Springer: Cham, Switzerland, 2017. [Google Scholar]
- Hansen, R.; Olafsson, A.S.; van der Jagt, A.P.N.; Rall, E.; Pauleit, S. Planning multifunctional green infrastructure for compact cities: What is the state of practice? Ecol. Indic. 2019, 96, 99–110. [Google Scholar] [CrossRef] [Scilit]
- Food and Agriculture Organization of the United Nations. A Framework for Land Evaluation; Soils Bulletin No. 32. 1976; Food and Agriculture Organization of the United Nations: Rome, Italy, 1976. [Google Scholar]
- UN-Habitat. World Cities Report 2020: The Value of Sustainable Urbanization; United Nations Human Settlements Programme: Nairobi, Kenya, 2020. [Google Scholar]
- Benedict, M.A.; McMahon, E.T. Green Infrastructure: Linking Landscapes and Communities; Island Press: Washington, DC, USA, 2006. [Google Scholar]
- Ahern, J. Urban landscape sustainability and resilience: The promise and challenges of integrating ecology with urban planning and design. Landsc. Ecol. 2013, 28, 1203–1212. [Google Scholar]
- Toure, S.I.; Stow, D.A.; Shih, H.-C.; Weeks, J.; Lopez-Carr, D. Land cover and land use change analysis using multi-spatial resolution data and object-based image analysis. Remote Sens. Environ. 2018, 210, 259–273. [Google Scholar] [CrossRef] [Scilit]
- Malczewski, J. GIS-based multicriteria decision analysis: A survey of the literature. Int. J. Geogr. Inf. Sci. 2006, 20, 703–726. [Google Scholar] [CrossRef] [Scilit]
- Eastman, J.R. IDRISI Kilimanjaro: Guide to GIS and Image Processing; Clark Labs, Clark University Worcester: Worcester, MA, USA, 2003; Volume 328. [Google Scholar]
- Dai, W.; Ratick, S.J. Integrating a raster geographical information system with multi-objective land allocation optimization for conservation reserve design. Trans. GIS 2014, 18, 936–949. [Google Scholar] [CrossRef] [Scilit]
- Jenks, G.F. The data model concept in statistical mapping. In International Yearbook of Cartography; UNESCO: Paris, France, 1967; Volume 7, pp. 186–190. [Google Scholar]
- He, S.; Zhu, L.; Li, Y.; Xia, Q.; Zheng, Q.; Wang, Z.; Zou, X. A comparative analysis of machine learning-based methods for impervious surface mapping using SAR and optical data. Geocarto Int. 2025, 40, 2521833. [Google Scholar] [CrossRef] [Scilit]
- Arca, D.; Keskin Citiroglu, H. Assessing Caves for Geotourism Development—An Example from Türkiye Using a Geographical Information Systems (GIS) Based Multi-Criteria Approach. In Geotourism in the Middle East; Springer: Cham, Switzerland, 2023; pp. 235–248. [Google Scholar]
- Rodriguez-Galiano, V.; Chica-Olmo, M.; Abarca-Hernandez, F.; Atkinson, P.M.; Jeganathan, C. Random Forest classification of Mediterranean land cover using multi-seasonal imagery and multi-seasonal texture. Remote Sens. Environ. 2012, 121, 93–107. [Google Scholar] [CrossRef] [Scilit]
- Praticò, S.; Solano, F.; Di Fazio, S.; Modica, G. Machine learning classification of mediterranean forest habitats in google earth engine based on seasonal sentinel-2 time-series and input image composition optimisation. Remote Sens. 2021, 13, 586. [Google Scholar] [CrossRef] [Scilit]
- Saha, A.; Roy, R. An integrated approach to identify suitable areas for built-up development using GIS-based multi-criteria analysis and AHP in Siliguri planning area, India. SN Appl. Sci. 2021, 3, 395. [Google Scholar] [CrossRef] [Scilit]
- Kalaiselvi, B.; Lalitha, M.; Chakraborty, R.; Dharumarajan, S.; Srinivasan, R.; Ramamurthy, V.; Karunya Lakshmi, K.; Hegde, R.; Archana, K. Promoting Agricultural Sustainability in Semi-arid Regions: An Integrated GIS–AHP Assessment of Land Suitability for Encouraging Crop Diversification. J. Indian Soc. Remote Sens. 2024, 52, 2221–2233. [Google Scholar] [CrossRef] [Scilit]
- El Behairy, R.A.; El Arwash, H.M.; El Baroudy, A.A.; Ibrahim, M.M.; Mohamed, E.S.; Rebouh, N.Y.; Shokr, M.S. Artificial intelligence integrated GIS for land suitability assessment of wheat crop growth in arid zones to sustain food security. Agronomy 2023, 13, 1281. [Google Scholar] [CrossRef] [Scilit]
- AbdelRahman, M.A.; Yossif, T.M.; Metwaly, M.M. Enhancing land suitability assessment through integration of AHP and GIS-based for efficient agricultural planning in arid regions. Sci. Rep. 2025, 15, 31370. [Google Scholar] [CrossRef] [Scilit] [PubMed]
- Jombo, S.; Adelabu, S. Evaluating Landsat-8, Landsat-9 and Sentinel-2 imageries in land use and land cover (LULC) classification in a heterogeneous urban area. GeoJournal 2023, 88, 377–399. [Google Scholar] [CrossRef] [Scilit]
- Shandu, I.D.; Xulu, S.; Gebreslasie, M. Enhancing land cover classification in the heterogeneous landscape by integrating auxiliary data with Sentinel-2 imagery using the random forest algorithm. Front. Remote Sens. 2025, 6, 1697897. [Google Scholar]
- Daunt, A.B.P.; Inostroza, L.; Hersperger, A.M. The role of spatial planning in land change: An assessment of urban planning and nature conservation efficiency at the southeastern coast of Brazil. Land Use Policy 2021, 111, 105771. [Google Scholar] [CrossRef] [Scilit]
- Cui, J.; Kong, X.; Chen, J.; Sun, J.; Zhu, Y. Spatially explicit evaluation and driving factor identification of land use conflict in yangtze river economic belt. Land 2021, 10, 43. [Google Scholar] [CrossRef] [Scilit]
- Lamson-Hall, P.; Angel, S.; Tafesse, T. Managing Migration and Urban Expansion in Secondary Cities; Report Prepared for Cities Alliance; Cities Alliance: Brussels, Belgium, 2021. [Google Scholar]
- UN-Habitat. World Cities Report 2022: Envisaging the Future of Cities; UN-Habitat: Nairobi, Kenya, 2022. [Google Scholar]
- Seto, K.C.; Güneralp, B.; Hutyra, L.R. Global forecasts of urban expansion to 2030 and direct impacts on biodiversity and carbon pools. Proc. Natl. Acad. Sci. USA 2012, 109, 16083–16088. [Google Scholar] [CrossRef] [Scilit] [PubMed]
- Güneralp, B. Global urban land expansion and sustainability challenges. Nat. Commun. 2020, 11, 2904. [Google Scholar]
- United Nations General Assembly. Transforming Our World: The 2030 Agenda for Sustainable Development; United Nations: New York, NY, USA, 2015. [Google Scholar]
- Elmqvist, T.; Bai, X.; Frantzeskaki, N.; Griffith, C.; Maddox, D.; McPhearson, T.; Parnell, S.; Romero-Lankao, P.; Simon, D.; Watkins, M. The Urban Planet: Knowledge Towards Sustainable Cities; Cambridge University Press: Cambridge, UK, 2018. [Google Scholar]
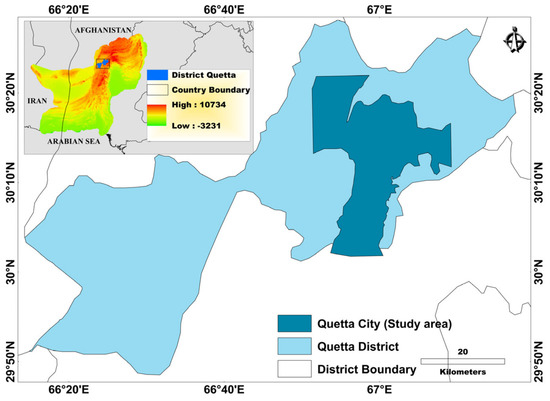
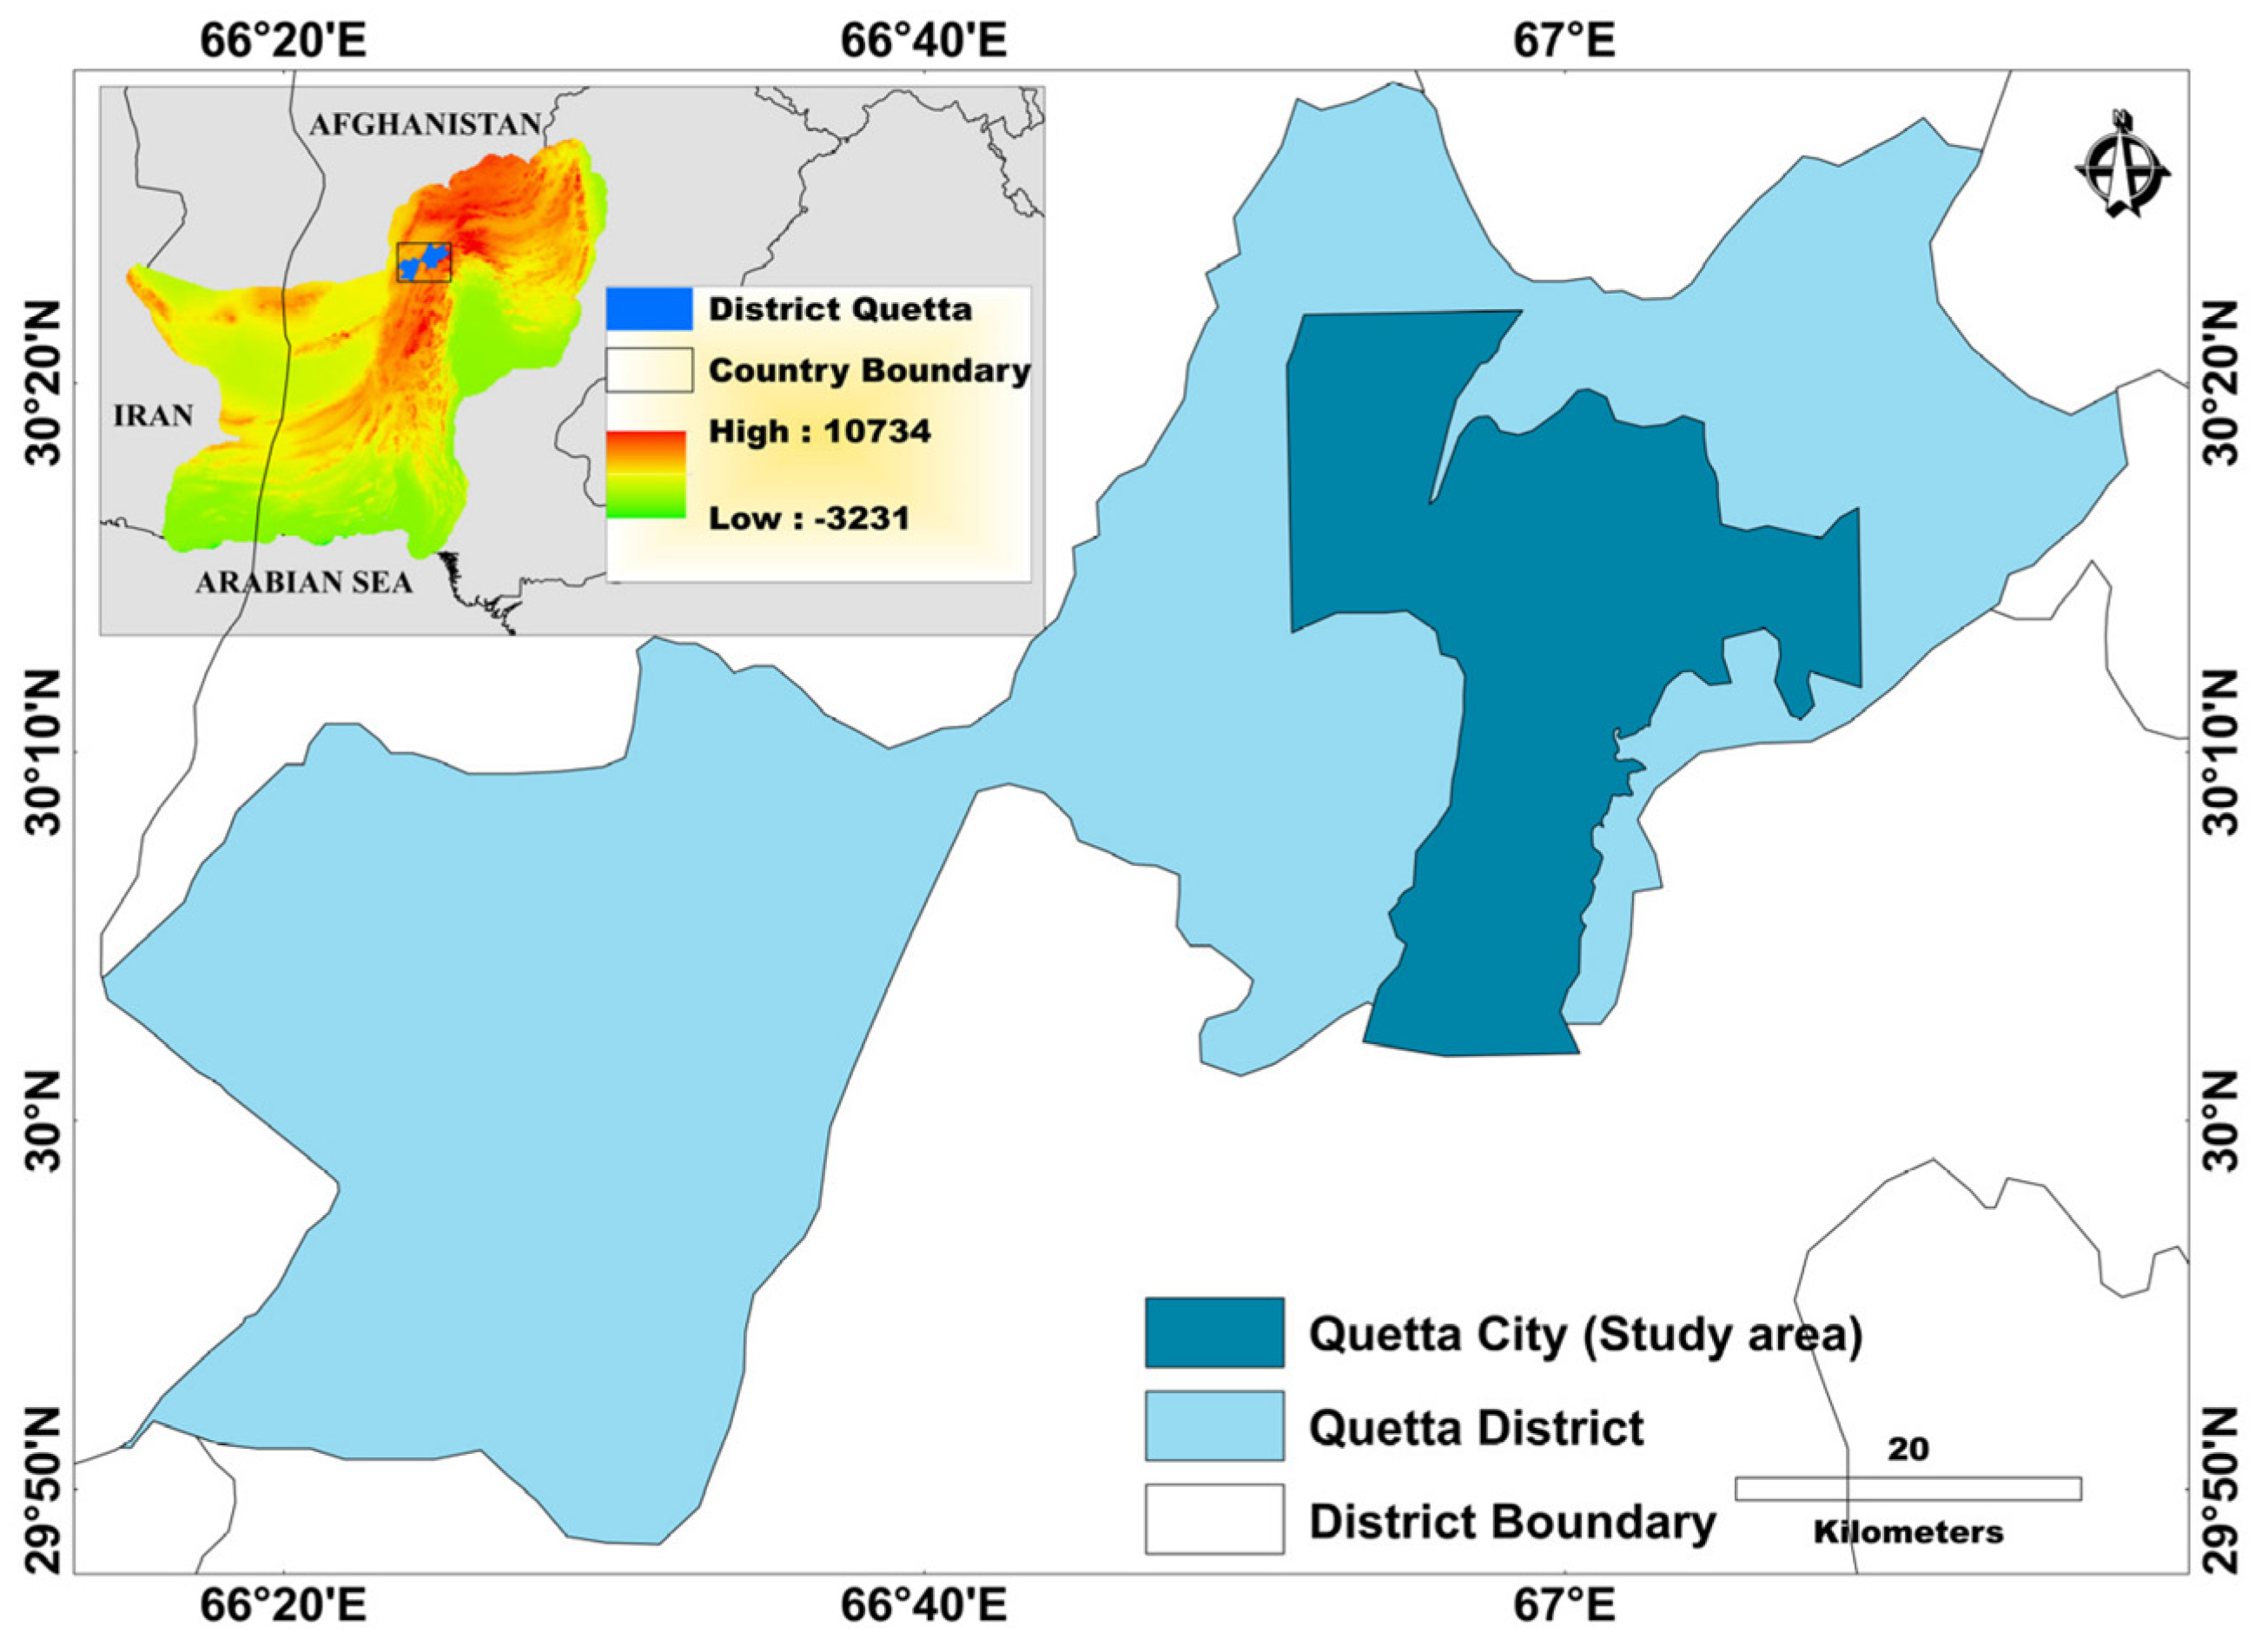
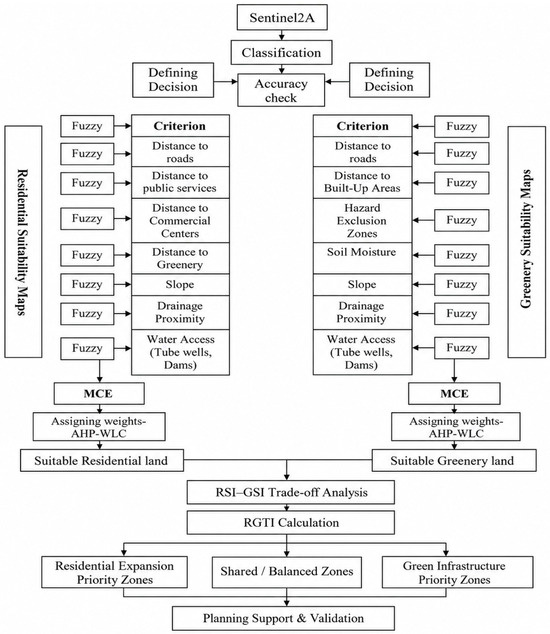
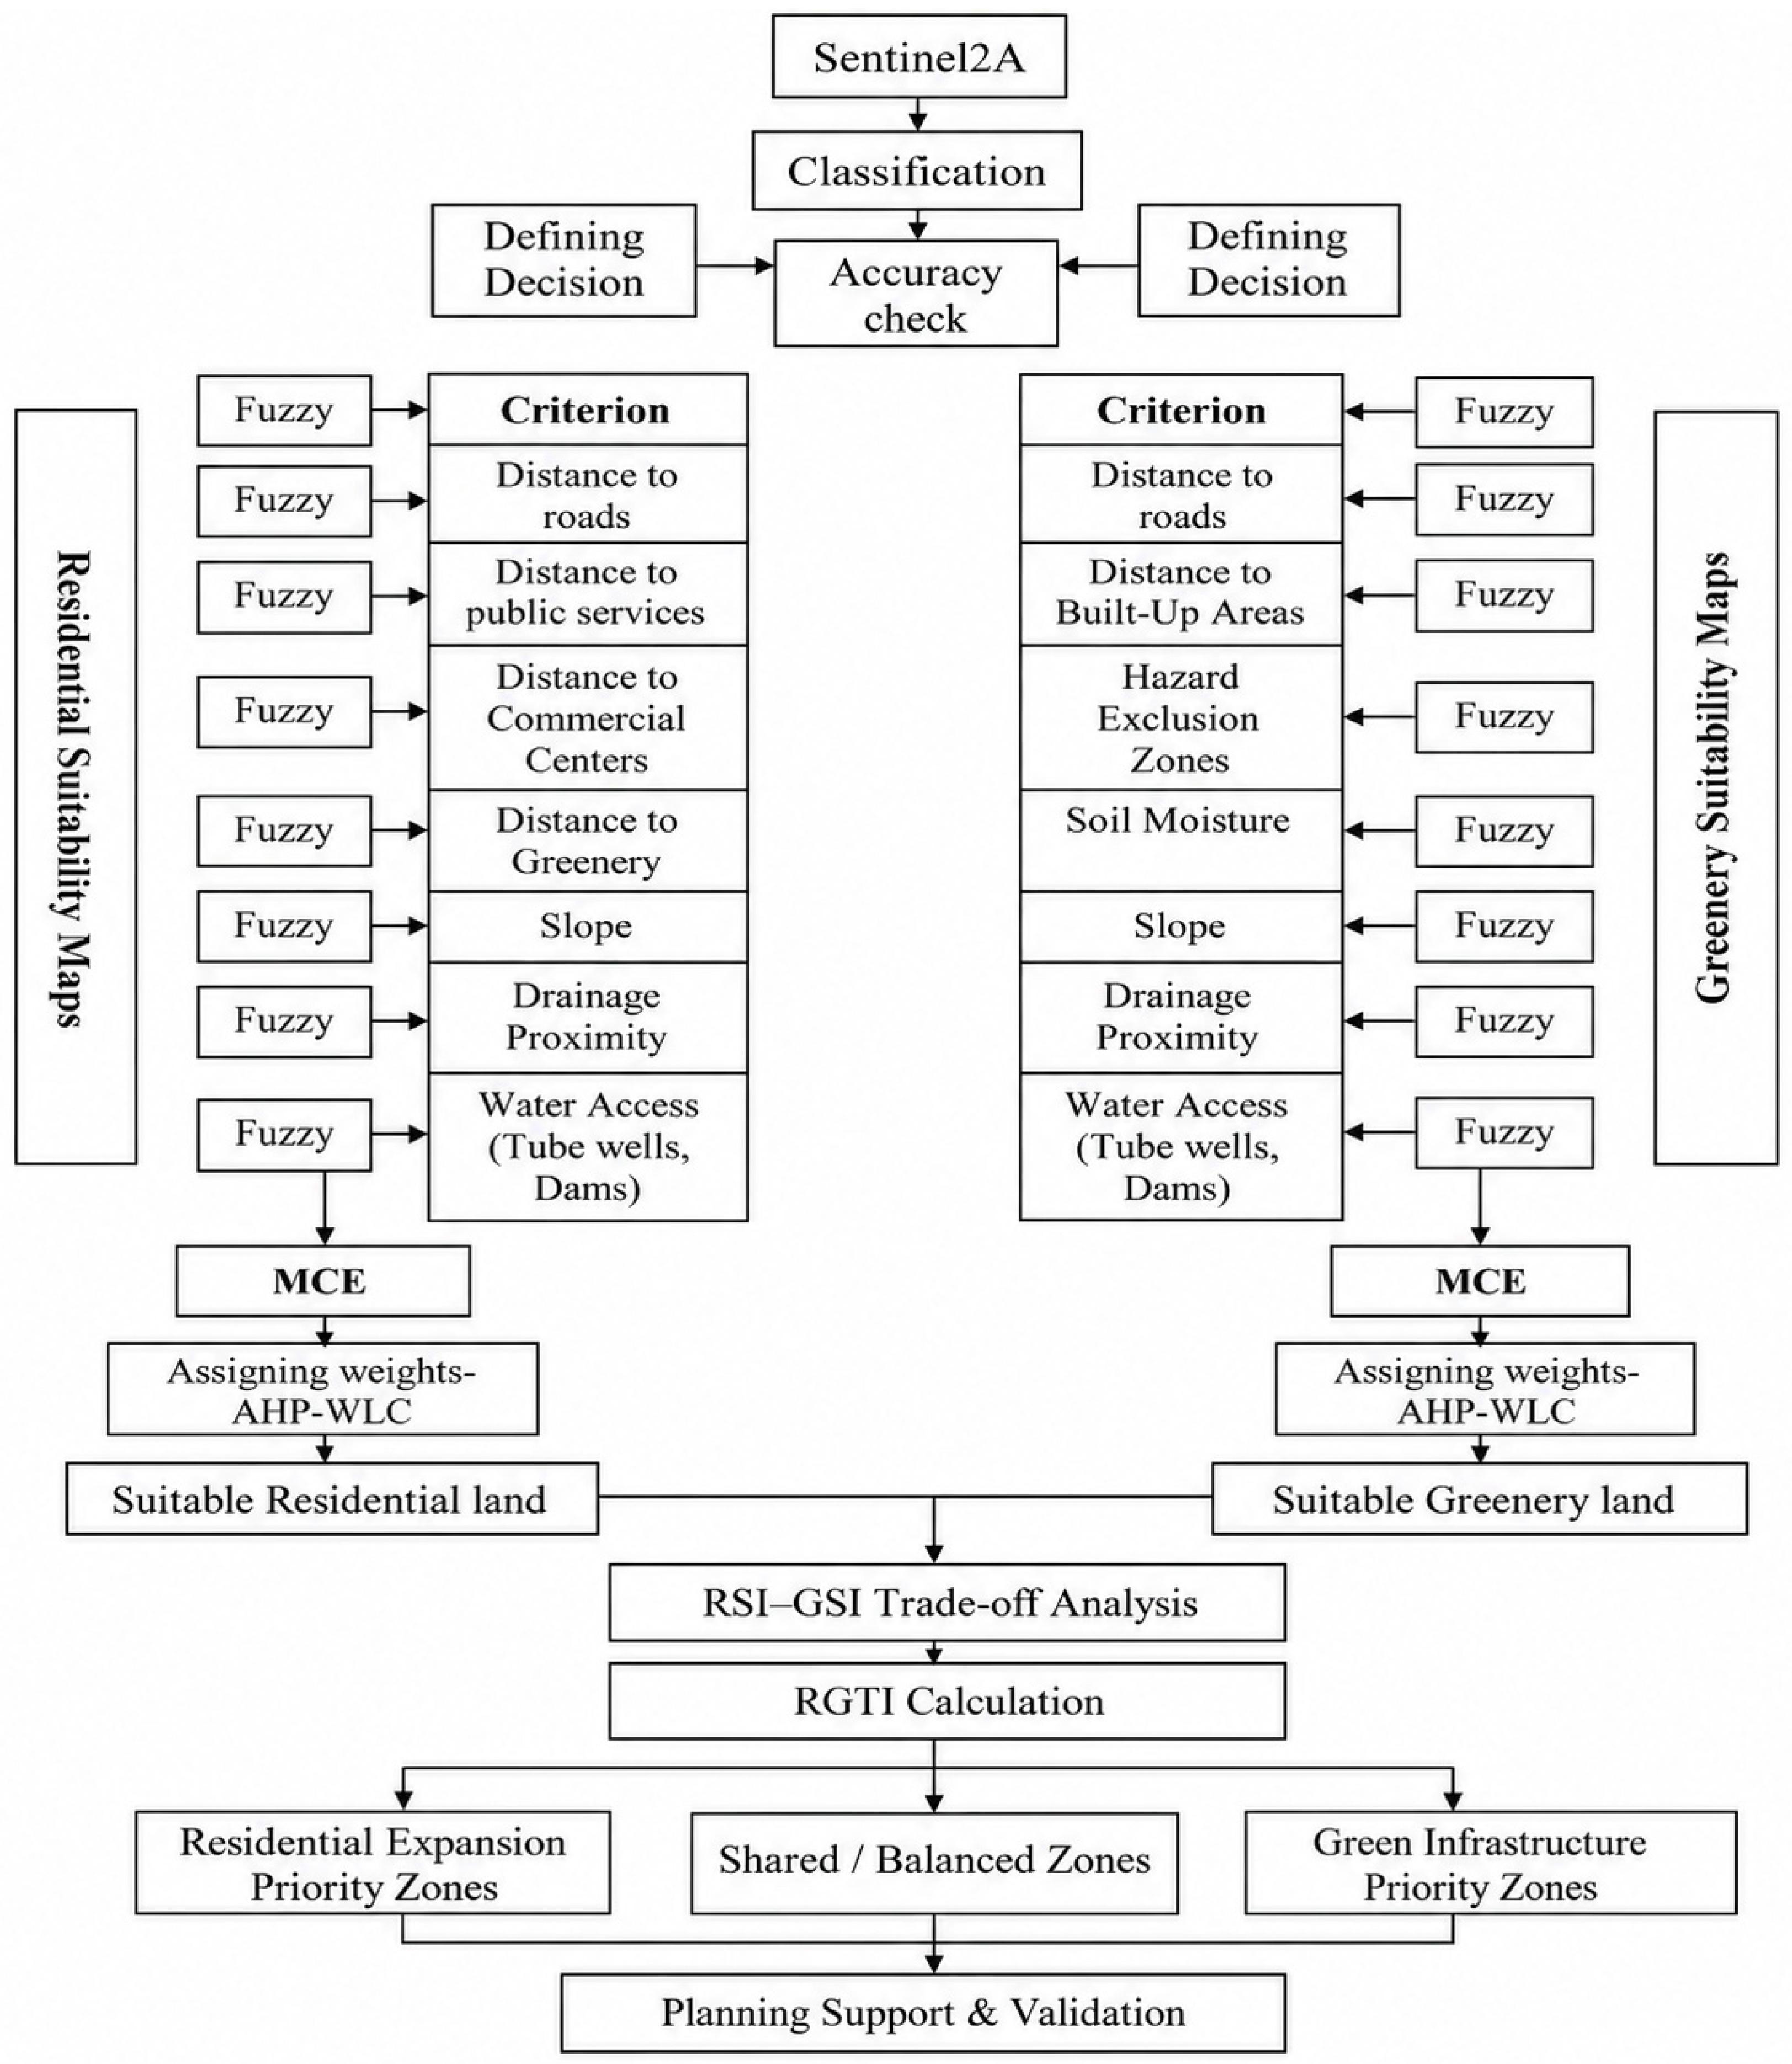
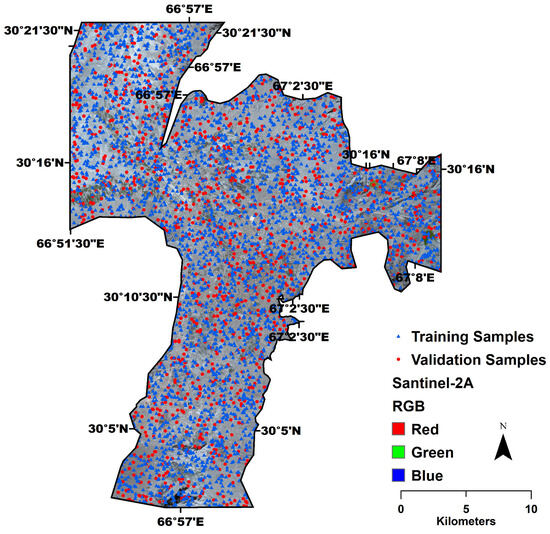
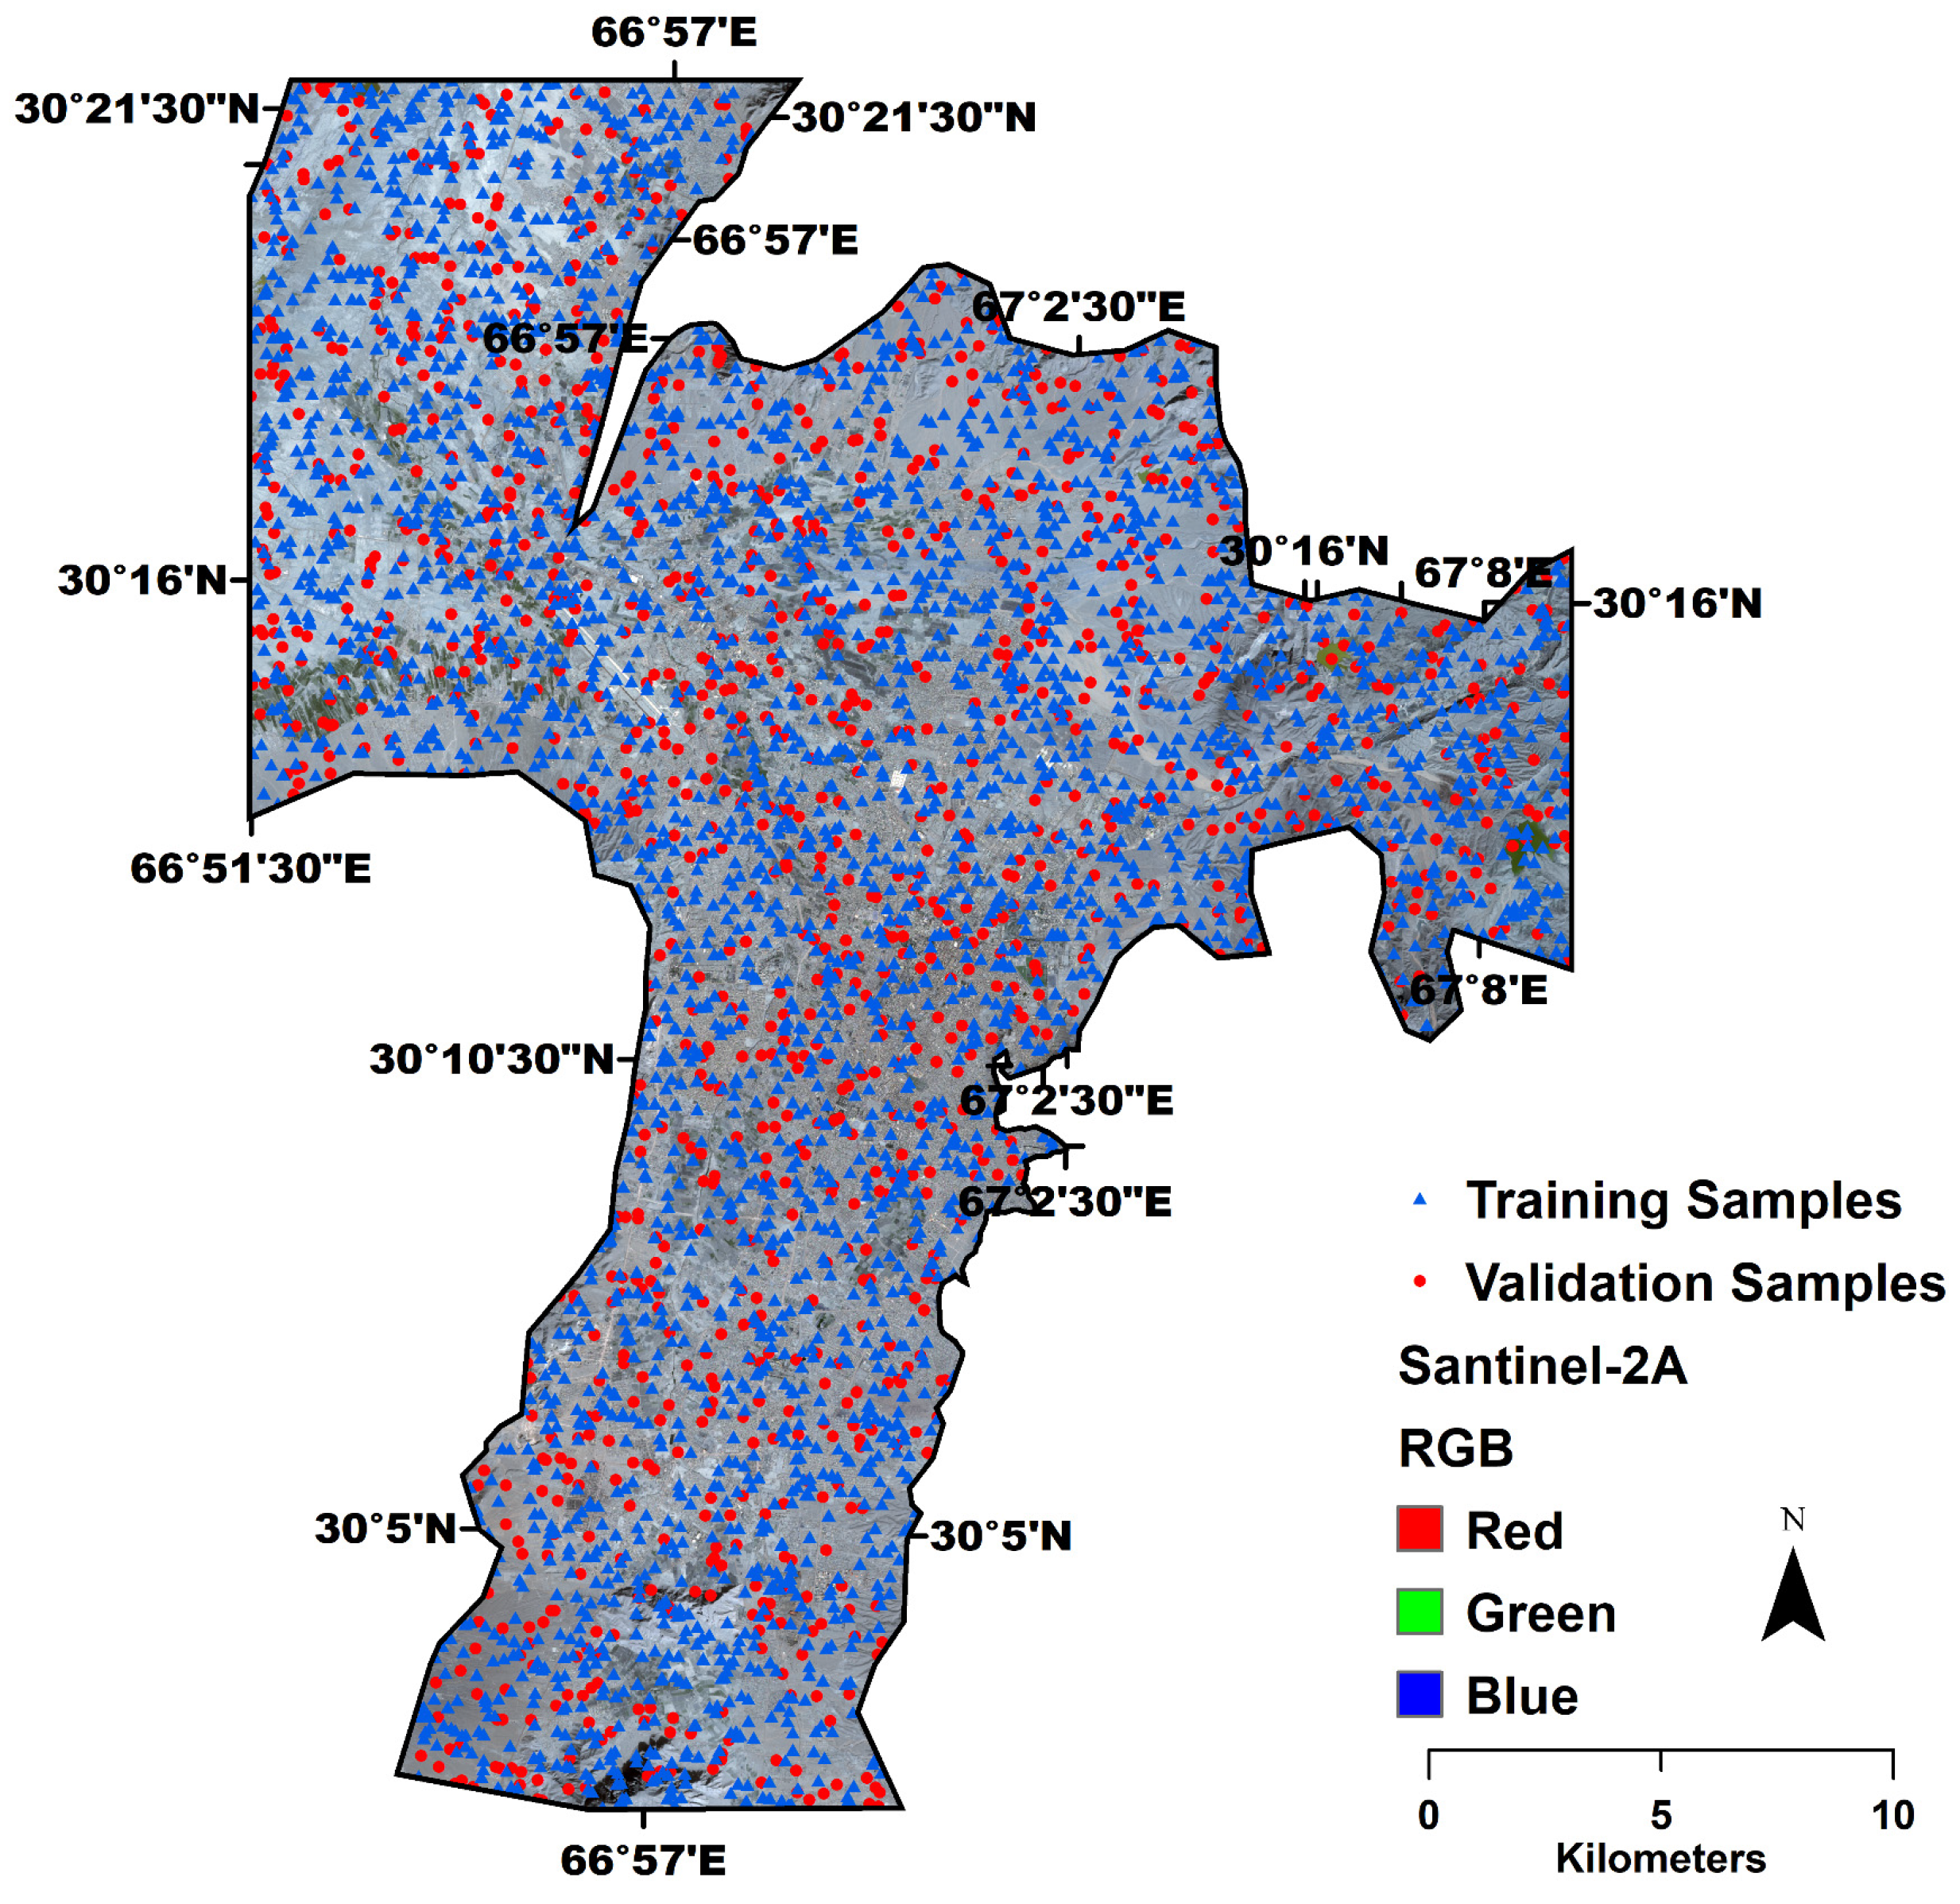
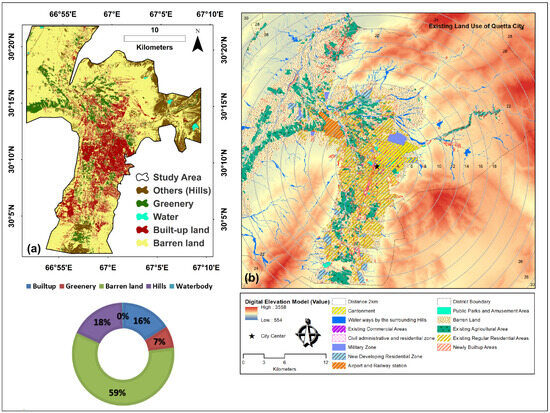
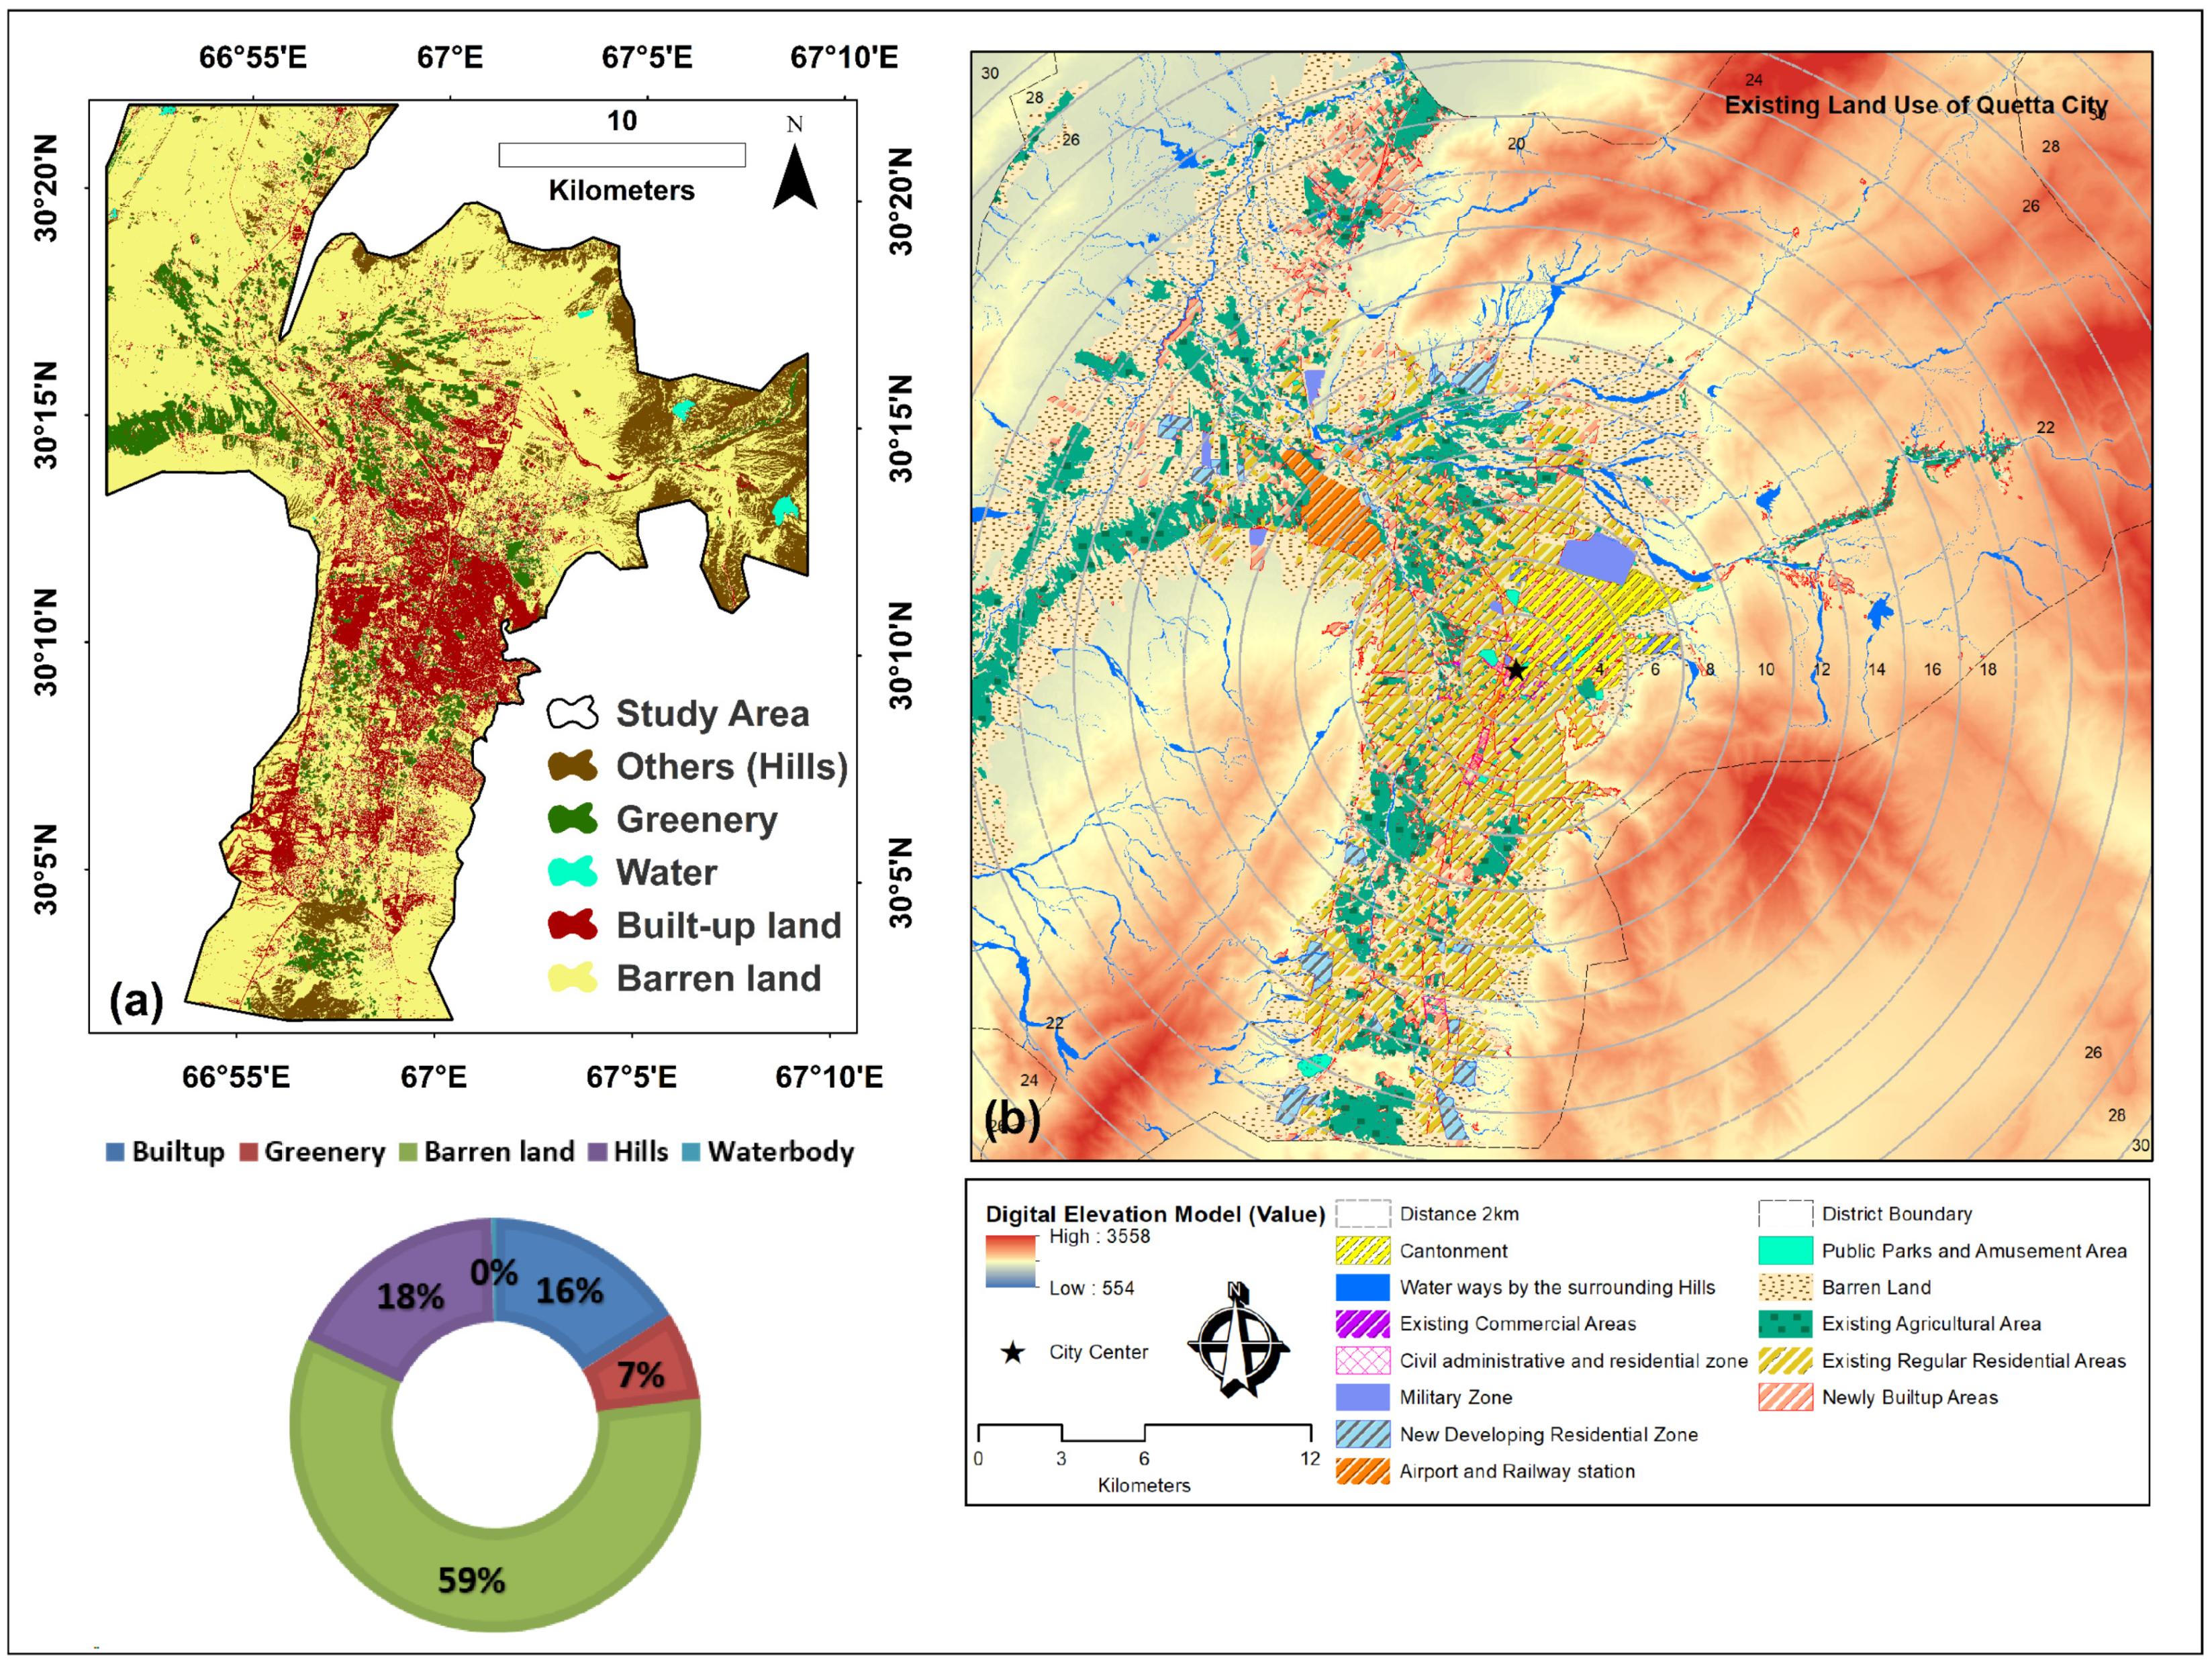
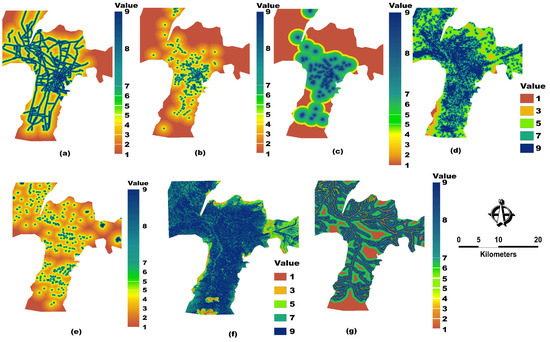
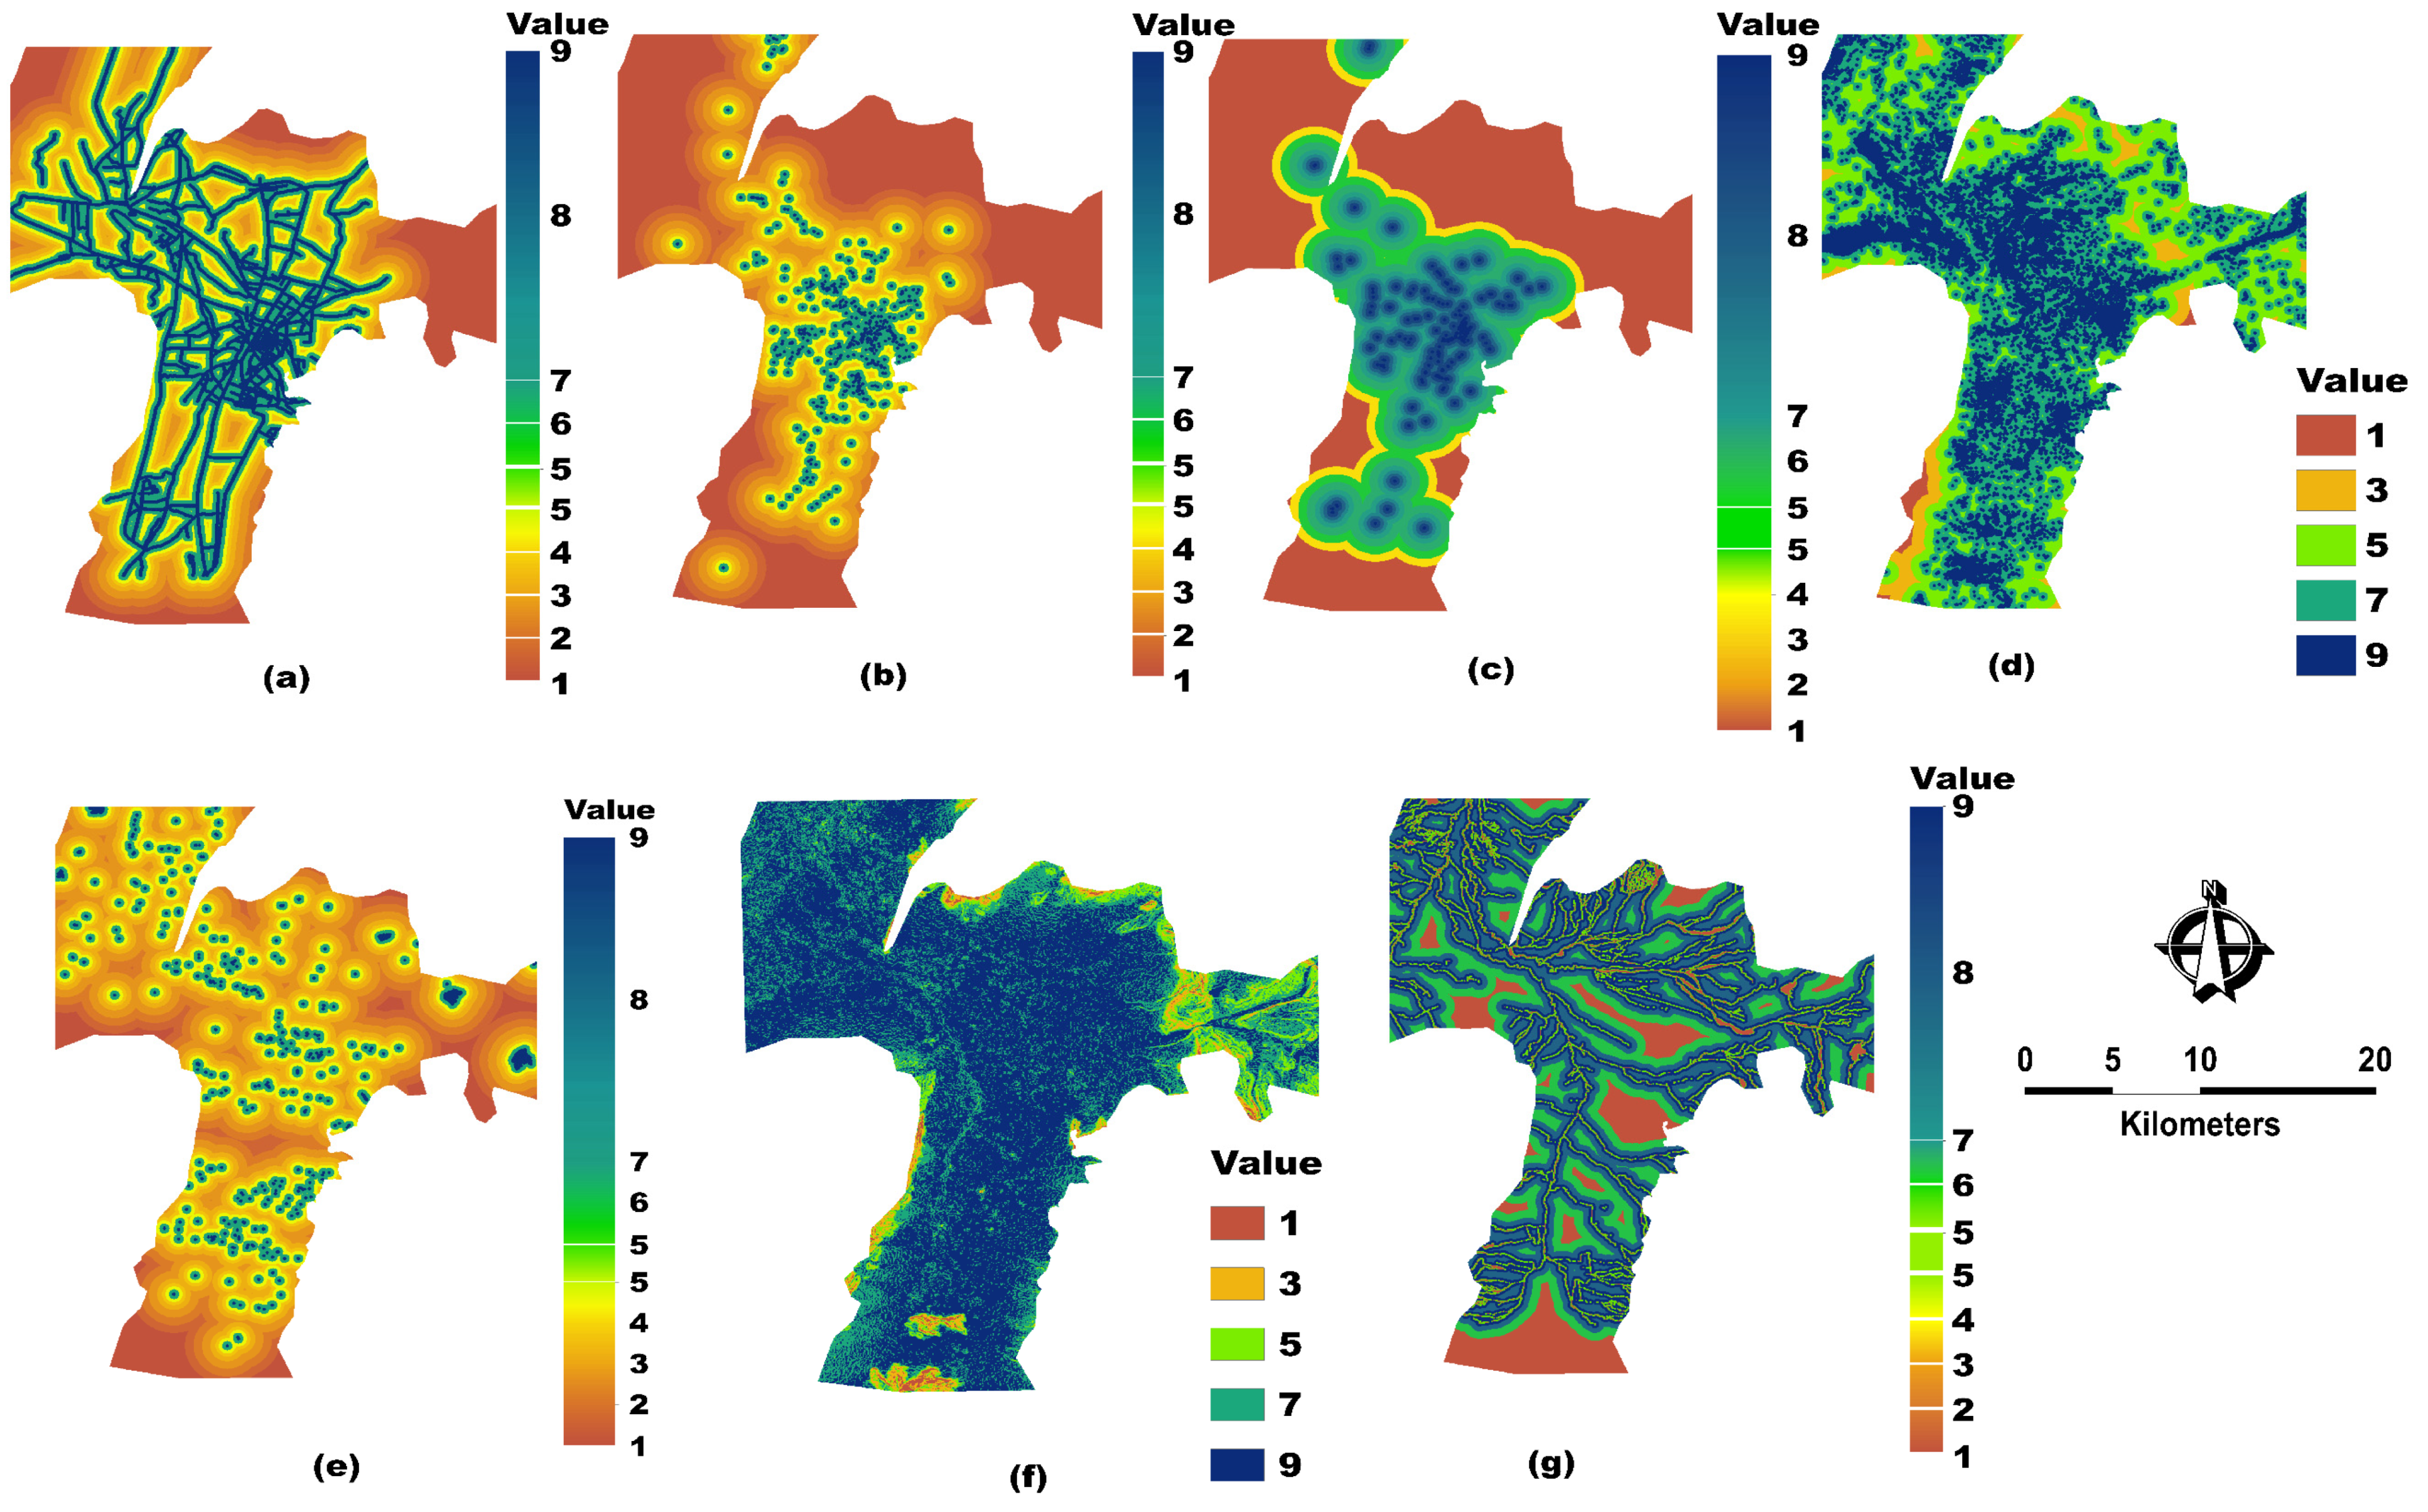
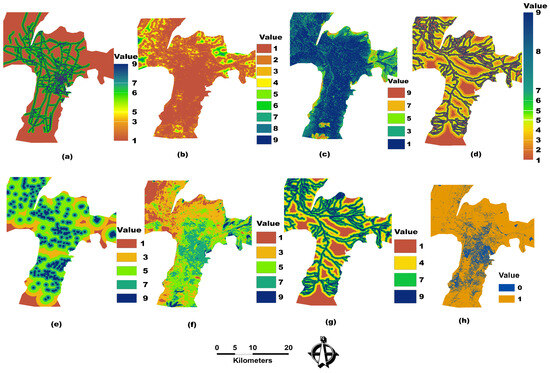
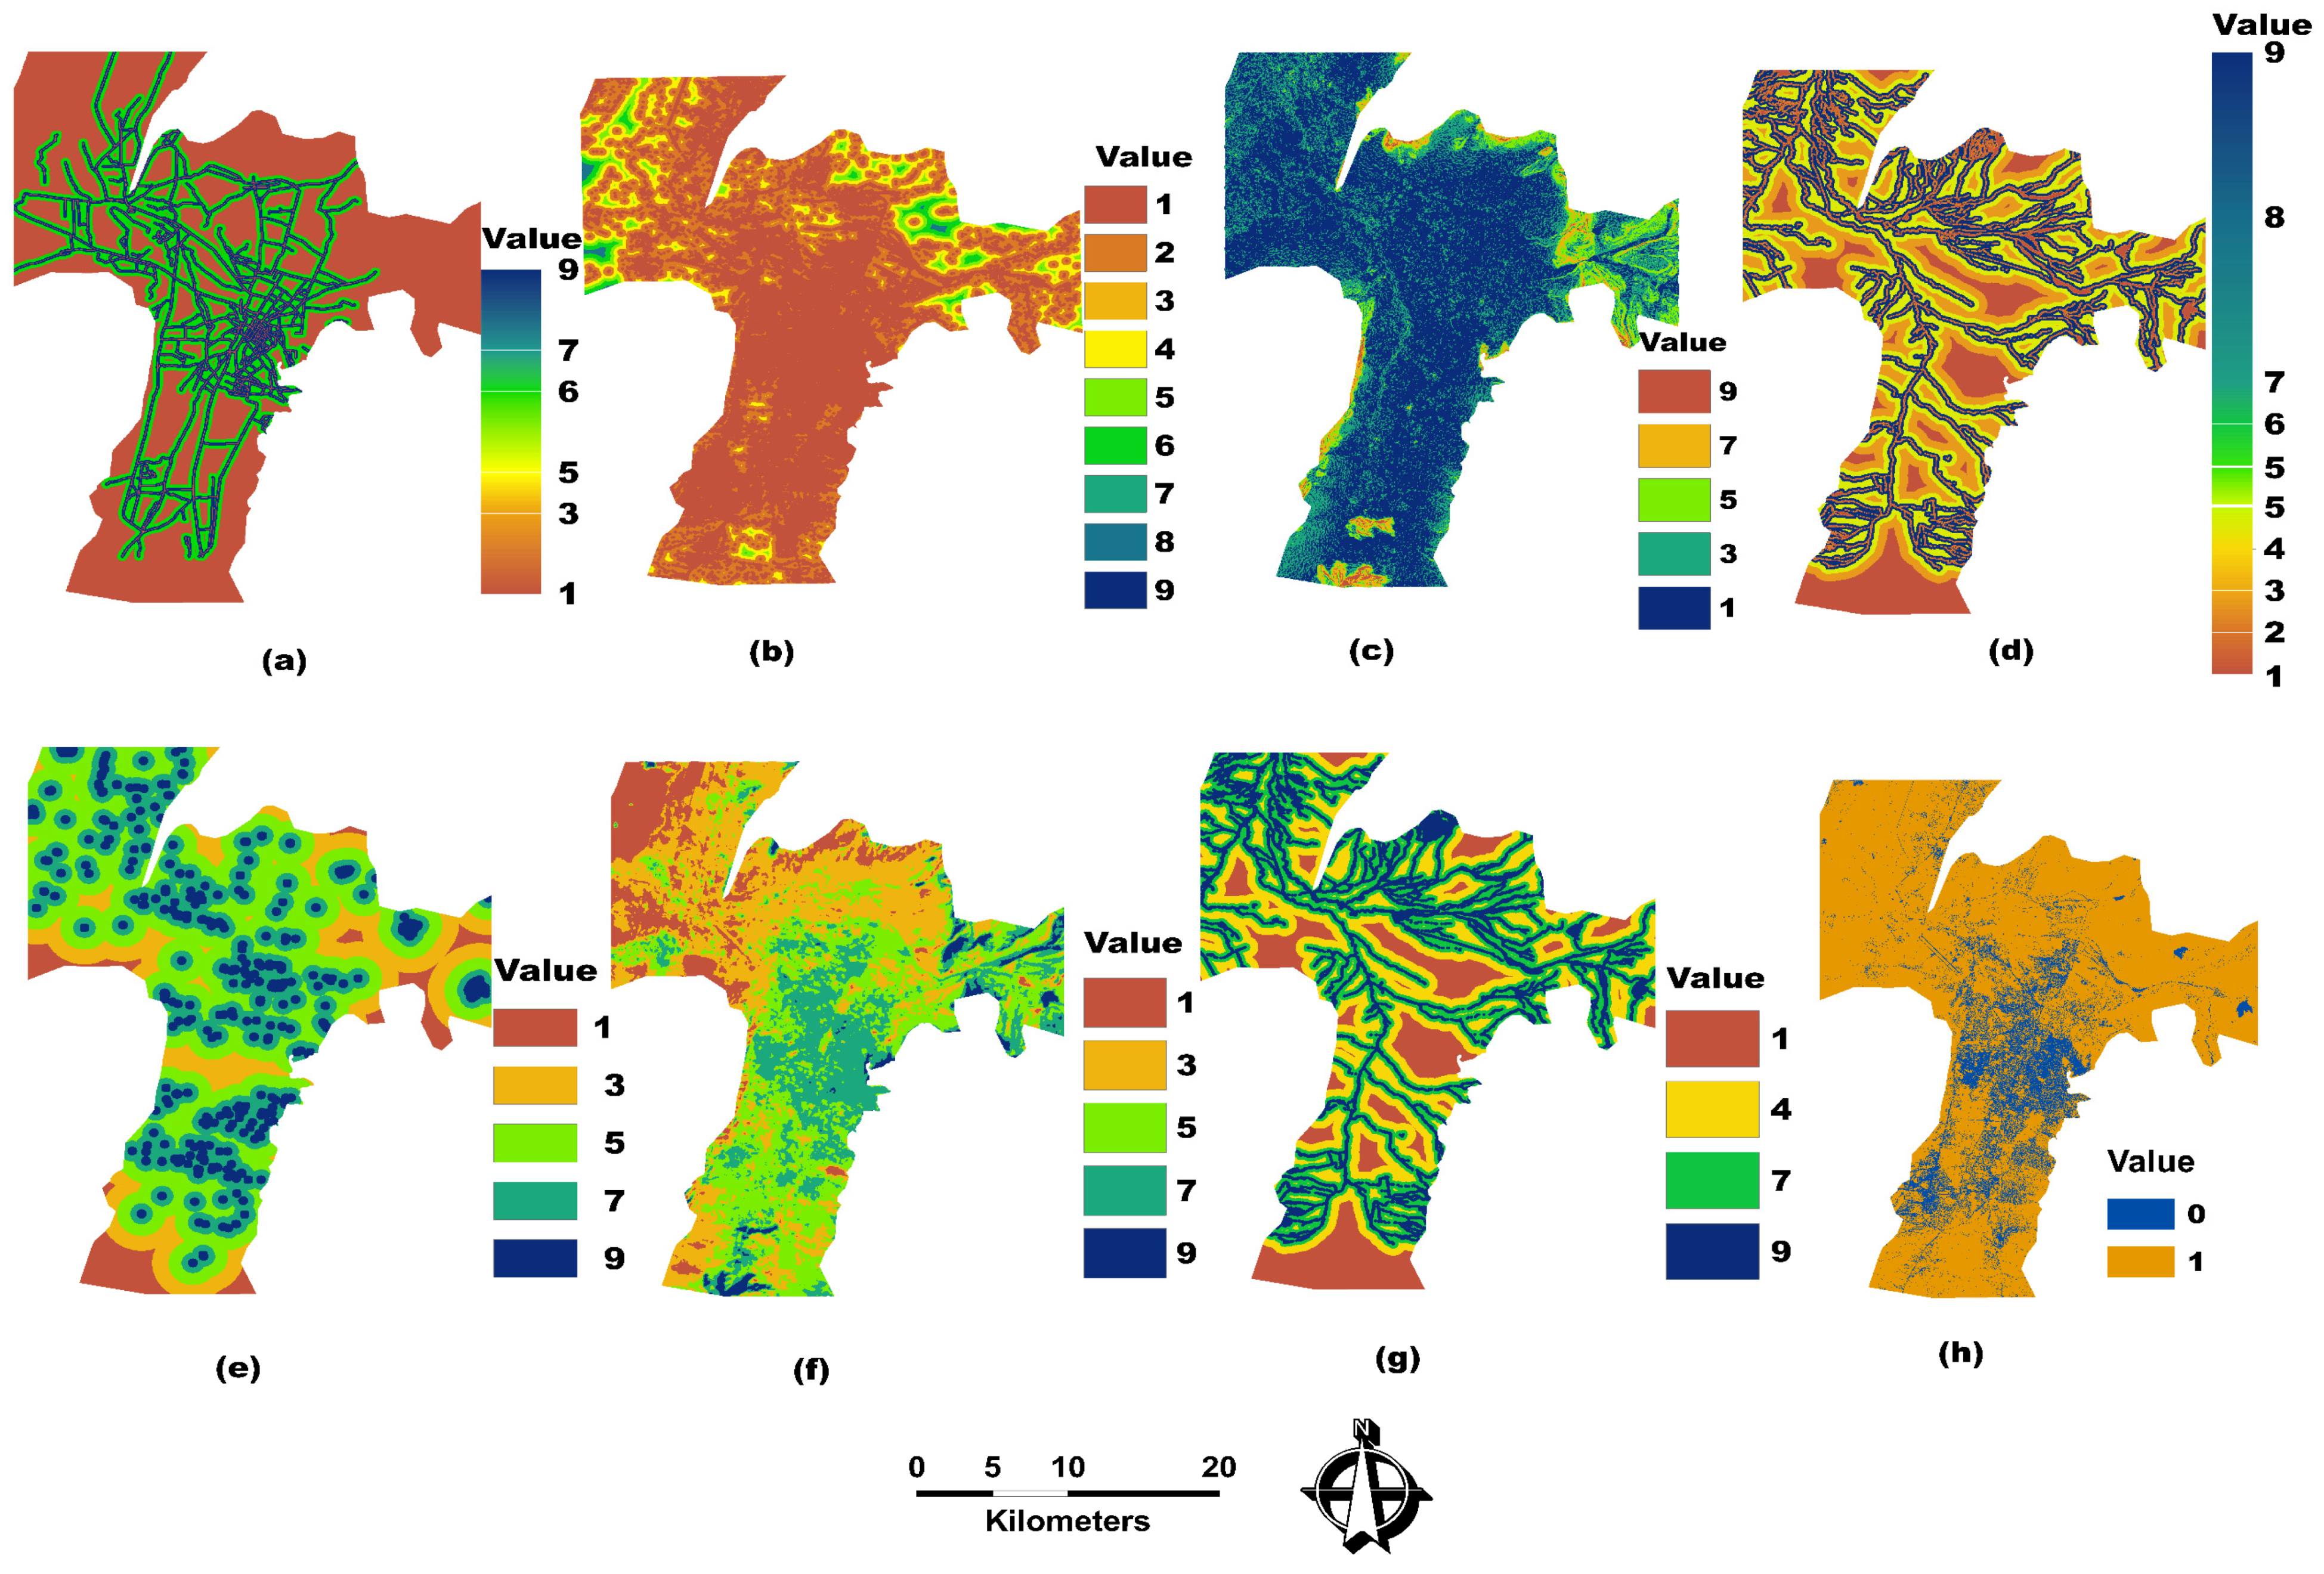
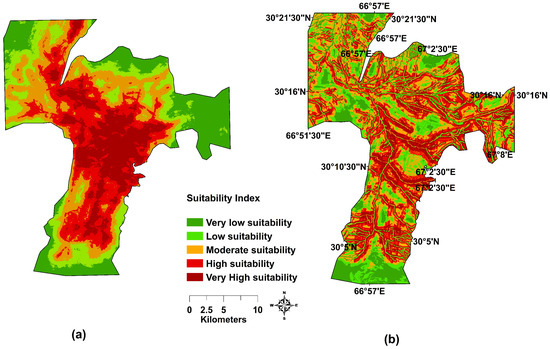
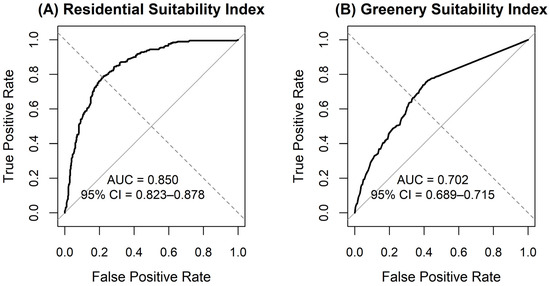
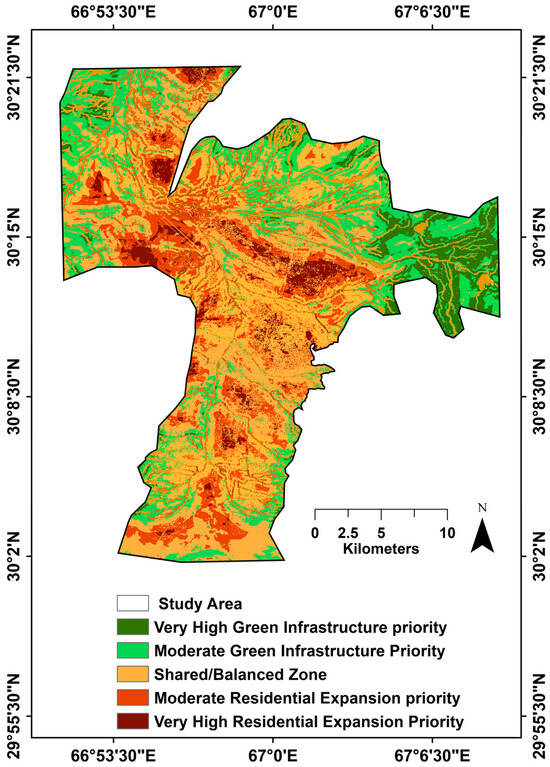
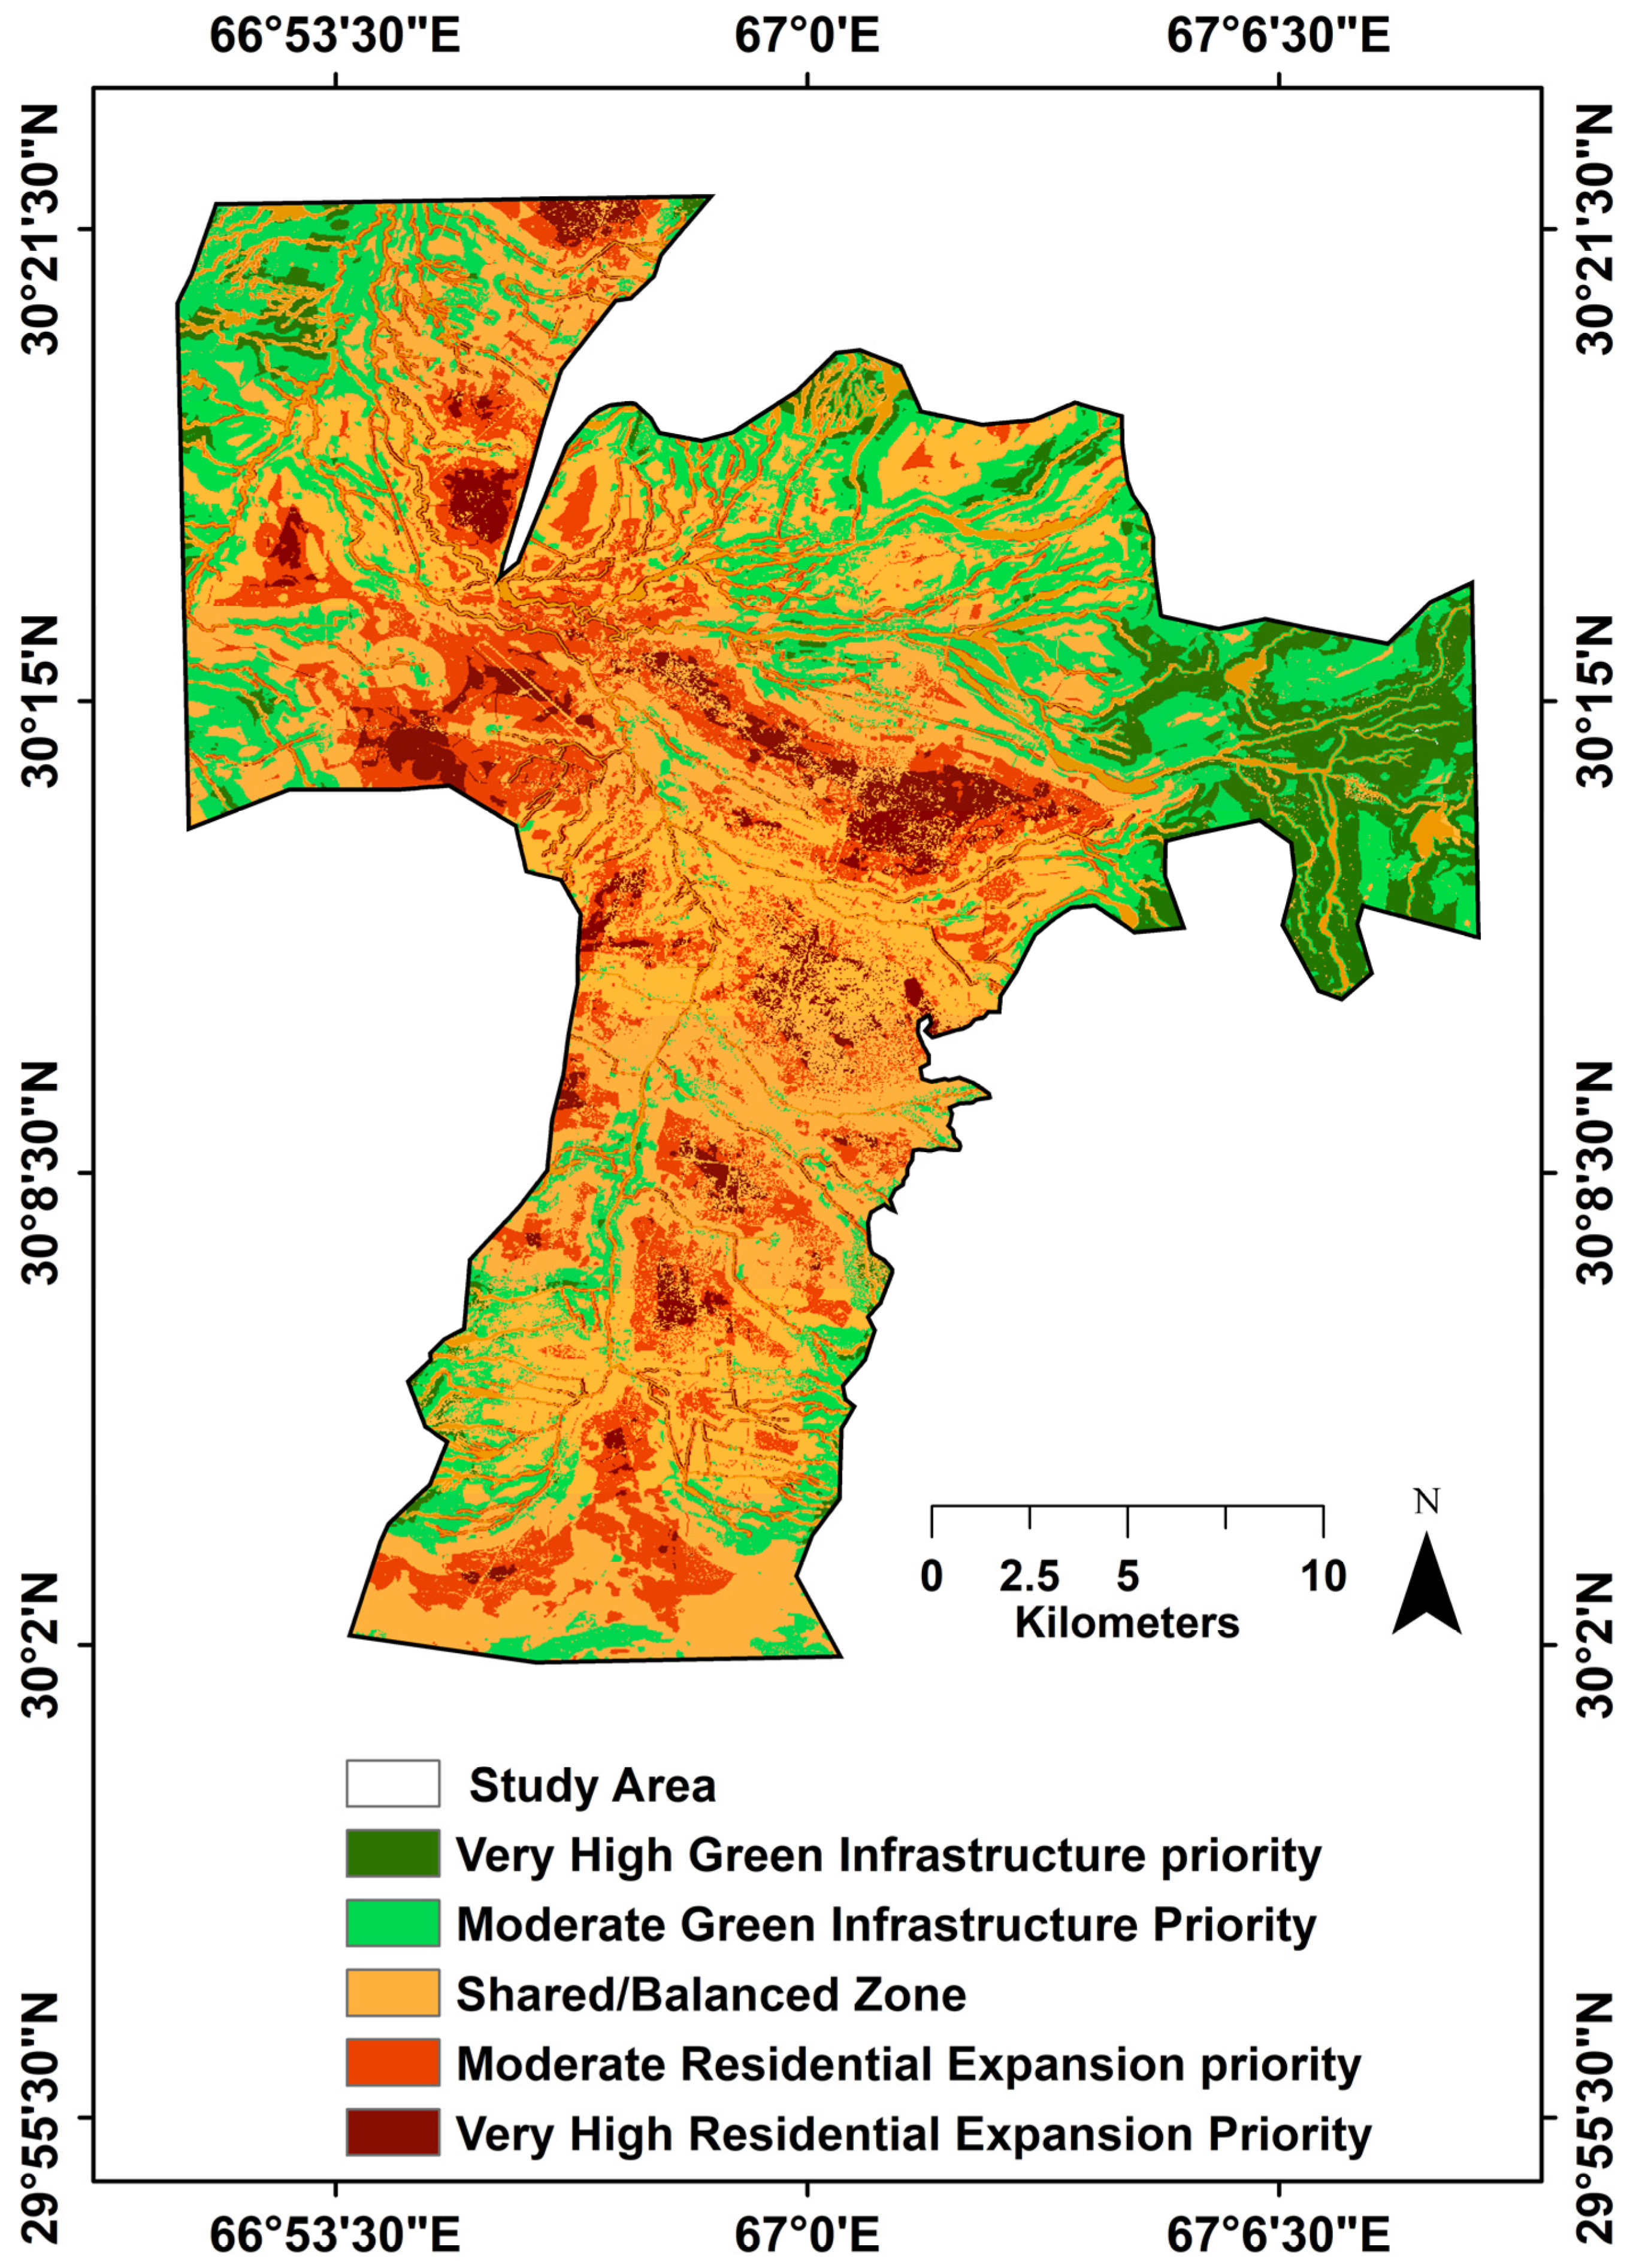

Disclaimer/Publisher’s Note: The statements, opinions and data contained in all publications are solely those of the individual author(s) and contributor(s) and not of MDPI and/or the editor(s). MDPI and/or the editor(s) disclaim responsibility for any injury to people or property resulting from any ideas, methods, instructions or products referred to in the content. |
© 2026 by the authors. Licensee MDPI, Basel, Switzerland. This article is an open access article distributed under the terms and conditions of the Creative Commons Attribution (CC BY) license.