


Abstract
Territorial space serves as a common platform for both ecosystem carbon sink functions and socioeconomic functions. Rapid urbanization has intensified the competition between carbon source and carbon sink areas, making the measurement of carbon sink conflicts critical for carbon emission reduction and land use optimization. This study takes Hangzhou as its research area and uses districts and counties as the basic evaluation units. Drawing on three dimensions—spatial carbon emission pressure, spatial carbon sequestration capacity, and spatial instability—the study develops a model to assess the intensity of territorial carbon sink conflicts. It systematically evaluates the conflict intensity across Hangzhou’s 13 districts and counties in 2020 and analyzes land use change from 2010 to 2020. The results indicate that (1) from 2010 to 2020, Hangzhou’s built-up areas expanded to some extent, leading to intensified spatial conflicts between carbon sources and carbon sinks; and (2) in 2020, light and general conflict areas were mainly distributed in outlying counties (e.g., Lin’an, Chun’an); moderate conflict areas were in the urban periphery (e.g., Fuyang, Binjiang); and intense to severe conflict areas were in central urban districts (e.g., Shangcheng, Gongshu, Xiaoshan). Overall, carbon sink conflicts exhibited a concentric pattern of “uncontrolled core—periphery on the verge—distant suburbs under control.” This study provides a scientific basis for mitigating future carbon sink conflicts in Hangzhou and offers a perspective for identifying and managing such conflicts in other rapidly urbanizing regions.
1. Introduction
Global climate change has become one of the most pressing global challenges of the 21st century. The IPCC report emphasizes that there is sufficient evidence to show that anthropogenic greenhouse gas emissions have directly caused global climate change and global warming, with excessive carbon emissions playing a major role in this process [1]. As a result, more than 130 countries worldwide have announced net-zero or carbon-neutrality targets [2]. In 2020, China set the goal of “reaching the peak of CO2 emissions by 2030 and achieving carbon neutrality by 2060.” To achieve this goal, there are two main approaches: first, continuously reducing carbon emissions, which primarily relies on deep decarbonization across all industrial sectors involved in human production and daily life; second, enhancing carbon absorption, where strengthening terrestrial carbon sinks to offset excess carbon emissions is considered the most important pathway for carbon absorption [3,4,5]. It is evident that the quantitative measurement of carbon sink levels is a major research topic in the current context of carbon neutrality development. As a shared carrier of both ecological carbon sink spaces and socio-economic spaces, the territorial space functions as follows: when natural ecosystems are converted into construction land and carbon emissions exceed carbon absorption, these areas become carbon sources; conversely, when natural ecosystems such as forests and grasslands are protected or restored, and carbon absorption exceeds emissions, they become critical carbon sinks [6]. The process of urbanization has intensified competition between these two types of spaces for limited land resources, the contradiction that is particularly pronounced in rapidly developing economies [7]. With the advancement of urbanization and the extensive development and utilization of territorial space, large amounts of ecological land with carbon sink functions have been converted into construction land [8,9]. In the competition with socio-economic space, the ecological carbon sink space within ecosystems has been at a disadvantage, leading to the balance of regional carbon budgets being disrupted, natural carbon cycles being disturbed, and conflicts regarding carbon sinks within territorial space continuing to evolve and tending toward “runaway” conditions [10]. Consequently, against the backdrop of these severe challenges and the pursuit of national and even global carbon neutrality goals, it is of great significance to study spatial conflicts regarding carbon sink benefits during the development and utilization of territorial space.
Spatial conflict is a new research direction within the scope of human-environment relations, derived from existing theoretical foundations in geography such as regional deprivation, land use conflict, and spatial competition. “Spatial conflict” refers to the competition and bargaining that arise during the development and utilization of different land areas over the allocation of limited spatial resources, stemming from the scarcity of spatial resources, their multi-suitability in utilization, and the diversity of human needs [11]; it represents a form of disharmonious and uncoordinated spatial relationship [12]. Existing research classifies spatial conflict into spatial economic conflict, spatial social conflict, and spatial ecological conflict [13]. Spatial carbon sink conflict falls within the category of spatial ecological conflict. It primarily manifests as the disruption of spatial carbon sink patterns and the degradation of ecosystem carbon sink functions, which consequently lead to an escalating ecological risk of spatial carbon emissions and the progressive destabilization of regional carbon balance patterns [14]. Currently, most existing research focuses on the field of spatial conflict, such as the competition among different land use categories for the same natural resources or ecosystem services [15,16]. Research on spatial ecological conflict has mainly looked at how ecosystem service functions change due to spatial conflict [17,18], mechanisms to protect important ecological areas [19], and how to assess environmental quality [20,21]. In contrast, research on carbon sink conflicts in territorial space remains limited. Existing carbon sink-related studies conducted at the spatial level have primarily concentrated on carbon sink estimation, dynamic characteristics, and driving mechanisms. Regarding methods for measuring spatial carbon sink conflicts, current scholars mostly draw on landscape ecological risk assessment models and employ the “risk source—risk receptor—risk effect” framework to measure territorial spatial carbon sink conflicts [14,22,23], but few integrate spatial conflicts with carbon emission effects. Therefore, this study draws on the territorial space carbon sink conflict evaluation model developed by Liang et al. [10] and constructs a carbon sink conflict evaluation model based on three dimensions: spatial carbon emission pressure, spatial carbon sequestration capacity, and spatial instability. Regarding the research scale, existing studies have primarily focused on macro-levels such as the whole country [24], urban agglomerations [14,22], and river basins [23,25], while research on carbon budgets using county-level administrative units as the basic evaluation unit remains relatively scarce [26]. County-level units serve as a crucial front for macro-level policy formulation and represent the most basic operational units for the implementation of the “dual carbon” strategic goals [27]. Identifying and measuring carbon sink conflicts at the county level helps reveal the heterogeneous factors underlying carbon sources and carbon sink spaces during land-use changes. It also provides more direct spatial decision-making evidence for formulating differentiated carbon sink management policies and coordinated emission reduction pathways at the regional level. Therefore, this study selected the 13 districts and counties of Hangzhou City as the basic evaluation units and constructed a carbon sink conflict evaluation framework at the county level.
Hangzhou is a core city in China’s Yangtze River Delta. It possesses a robust industrial base and a thriving modern service sector, particularly the digital economy, and its overall socio-economic strength has been continuously growing. As a model city for green development within the Yangtze River Economic Belt, Hangzhou plays a vital leading and driving role in advancing the regional low-carbon transition and ecological civilization. At the same time, leveraging its open economic structure and strategic location as a key node city along the “Belt and Road Initiative”, Hangzhou is increasingly demonstrating broad influence in the fields of international industrial cooperation, green technology exchange, and sustainable development. Hangzhou is one of China’s most representative cities with a high level of urbanization. The built-up area of its central urban district expanded from 198.19 km2 in 1985 to 1250.57 km2 in 2020, while the population grew from 5.43 million in 1985 to 12.37 million by the end of 2022, reflecting rapid urbanization [28]. Since the 1980s, Hangzhou’s rapid urbanization and high socioeconomic growth have attracted a large influx of migrants and industries, posing challenges to the region’s low-carbon sustainable development [29]. The Hangzhou People’s Government issued the “Implementation Plan for the National Carbon Peak Pilot (Hangzhou)” (from the Hangzhou People ‘s Government, https://www.hangzhou.gov.cn/, accessed 1 June 2025). The Plan provides a detailed explanation of the significance of Hangzhou’s role as a national carbon peak pilot, highlighting the urgency and importance of the city’s pursuit of a low-carbon sustainable development path. Therefore, assessing carbon sink conflicts at the county level in Hangzhou not only provides a scientific basis for the city’s pilot program on carbon peaking but also serves as a case study for identifying carbon sink conflicts in rapidly urbanizing regions facing similar development pressures.
Specifically, this study aims to: (1) analyze land use changes in Hangzhou from 2010 to 2020; (2) construct a model for measuring carbon sink conflicts in territorial space based on three dimensions—spatial carbon emission pressure (SCEP), spatial carbon sequestration capacity (SCSC), and spatial instability (SI)—to evaluate the spatial patterns of carbon sink conflicts across Hangzhou’s 13 districts and counties in 2020 and obtain the assessment results of conflict intensity; and (3) discuss strategies and policies for optimizing low-carbon territorial spatial planning in Hangzhou.
2. Materials and Methods
2.1. The Study Area
This study focuses on Hangzhou, Zhejiang Province. Located in Zhejiang Province, Hangzhou lies on the southern edge of the Yangtze River Delta. The city covers a total area of 16,850 km2, with flat terrain in the northeast and east, and undulating mountainous areas in the west and south. The city has a subtropical monsoon climate characterized by distinct seasons and abundant rainfall. As of the end of 2024, the city’s permanent population stood at 12.624 million, and its Gross Domestic Product (GDP) reached 2186 billion CNY (from 2024 Hangzhou Statistical Bulletin on National Economic and Social Development, https://tjj.hangzhou.gov.cn/, accessed 1 June 2025).
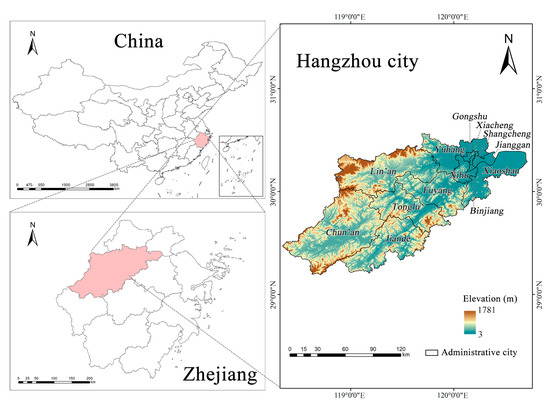
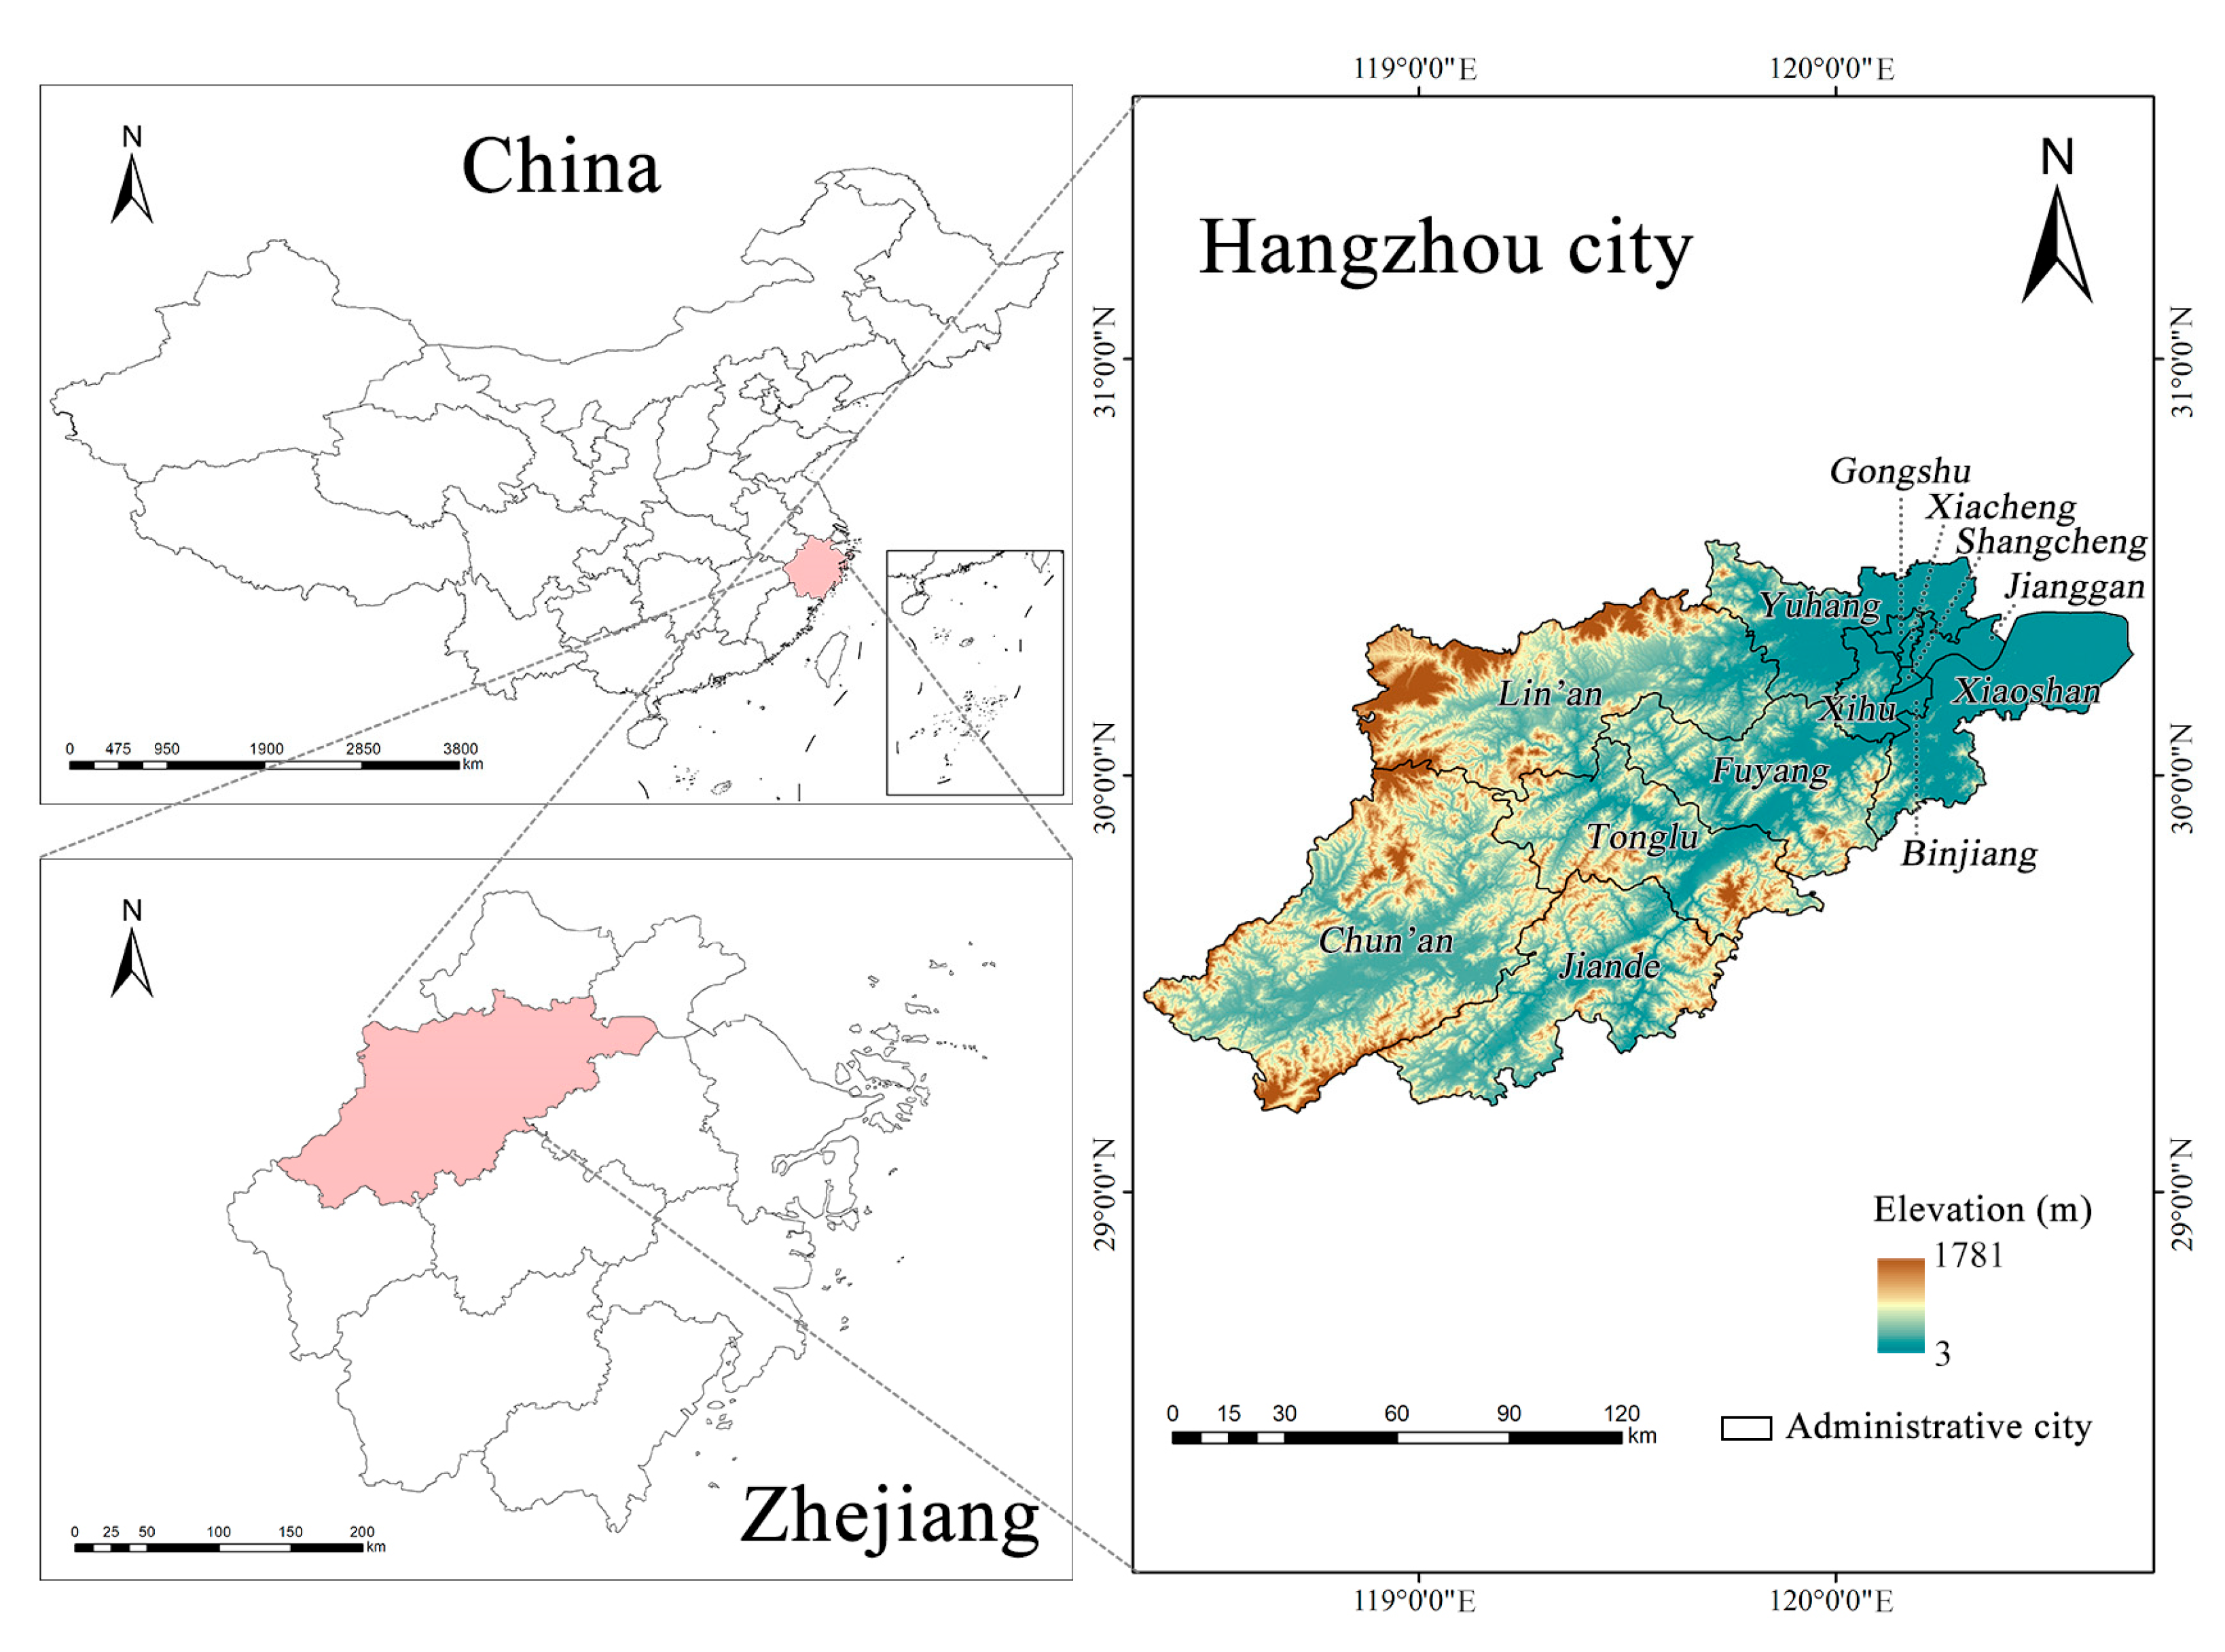
This study covers the period up to the most recent administrative boundary adjustment in Hangzhou in 2021. The study area was determined based on the 2020 administrative boundaries of Hangzhou as defined in the Hangzhou’s Comprehensive Land Use Plan (2006–2020) (from the Hangzhou Bureau of Planning and Natural Resources, https://ghzy.hangzhou.gov.cn/, accessed 2 June 2025). It includes a total of 13 districts and counties: Shangcheng district, Xiacheng district, Jianggan district, Gongshu district, Binjiang district, Xihu district, Xiaoshan district, and Yuhang district; the three county-level cities of Fuyang, Lin’an, and Jiande; and the two counties of Tonglu and Chun’an (Figure 1).
Figure 1.
Geographical location and elevation diagram of the Hangzhou city.
2.2. Data
This study examines land use changes in Hangzhou from 2010 to 2020 and territorial space carbon sink conflicts in the city in 2020. The data used in this study were obtained from publicly available databases, as summarized in Table 1.
Table 1.
Statistical table of research data sources.
The land use data were sourced from GLC_FCS30D, with a spatial resolution of 30 m × 30 m, an overall accuracy of 82.5%, and a Kappa coefficient of 0.78 [30]. To meet the needs of this study, the land categories contained in the data were reclassified into six categories: cropland, forest land, grassland, water, built-up land, and unused land. The land use conversion relationships are shown in Table 2. This study used ArcGIS (v10.6) to extract OpenStreetMap vector data and perform Euclidean distance analysis. In addition, the study utilized the 2010s China terrestrial ecosystem carbon density dataset compiled by the National Ecosystem Science Data Center [31] and adjusted it by incorporating carbon density data from neighboring regions with similar climatic conditions to derive carbon density data for the study area.
Table 2.
Table of land use conversion relationships.
2.3. Methods
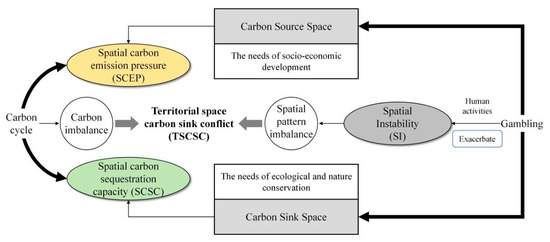
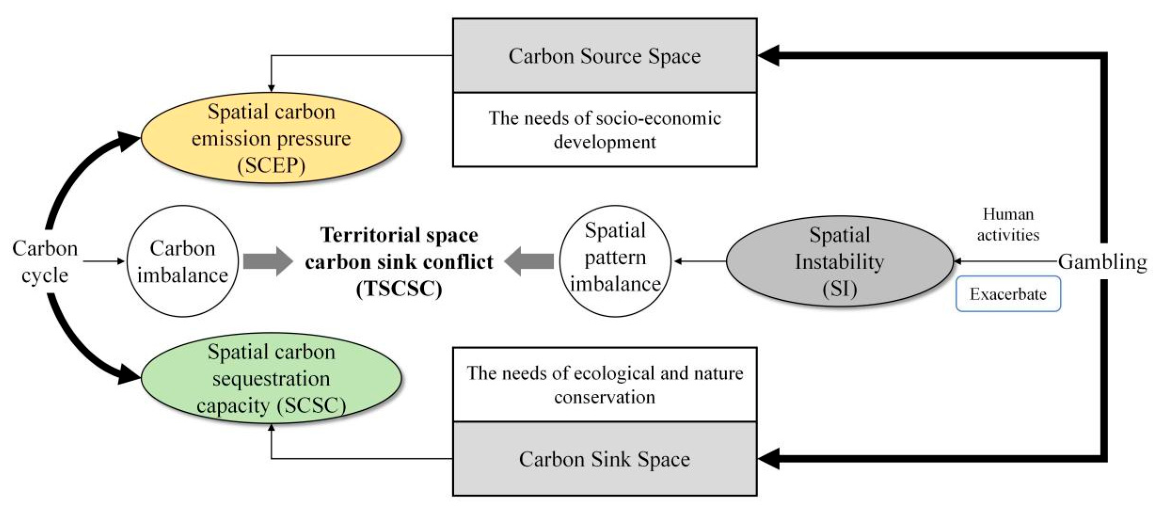
Based on the actual conditions in Hangzhou and from the perspective of land use research, this paper adopts the territorial space carbon sink conflicts evaluation model developed by Liang et al. [10]. This model comprehensively considers the interactions among land use conflicts, socio-economic development trends, and ecological carbon sink effects, thereby evaluating the intensity of carbon sink conflicts across three dimensions: spatial carbon emission pressure, spatial carbon sequestration capacity, and spatial instability. The analytical framework is shown in Figure 2.
Figure 2.
Territorial carbon sink analytical framework.
Based on the aforementioned carbon sink conflict evaluation model, this study measures carbon sink conflict in territorial space as the difference between the sum of spatial carbon emission pressure and spatial instability and spatial carbon sequestration capacity, thereby characterizing the intensity of carbon sink conflict [10]. Specifically, the difference between spatial carbon emission pressure and spatial carbon sequestration capacity characterizes the outcome of the trade-off between carbon source areas and carbon sink areas during land use—that is, the degree of carbon imbalance in national land use (direct conflict) [32]; simultaneously, spatial instability characterizes the rationality of the distribution patterns of carbon sink and carbon source areas, reflecting the resilience of land use categories to disturbances caused by human activities (indirect conflict); “Spatial instability” exacerbates carbon emission pressures in territorial space, weakens its carbon sequestration capacity, intensifies direct conflicts, and consequently triggers an “out of control” in carbon sink conflicts within territorial space [24].
The detailed formula is as follows:
where TSCSC represents the territorial space carbon sink conflict index for the evaluation unit; SCEP represents spatial carbon emission pressure; SI represents spatial instability; and SCSC represents spatial carbon sequestration capacity. The calculated values of SCEP, SI, SCSC, and TSCSC are all standardized using the min-max method, ensuring that the resulting values for SCEP, SI, SCSC, and TSCSC all fall between 0 and 1. A smaller TSCSC value indicates a lower degree of carbon sink conflict; conversely, a higher value indicates a higher degree of conflict.
2.3.1. Spatial Carbon Emission Pressure
Spatial Carbon Emission Pressure (SCEP) represents the carbon emission component of the carbon cycle and is used to measure the magnitude of carbon emissions within a given territorial space. A higher SCEP value indicates greater regional carbon emissions over a specific period and greater carbon emission pressure on the territorial space. The SCEP measurement comprises two components: the Land-Use Carbon Emission Pressure (LP) and the External Environmental Carbon Emission Pressure (ECEP). Specifically, the LP is an indicator of carbon emissions from different land-use categories within a given period. Based on existing research [33,34], the carbon emission coefficients for six major land-use categories (cropland, forest land, grassland, water, built-up land, and unused land) were determined to be 0.4689, −0.6046, −0.0206, −0.2530, 65.3000, and −0.0005 kg/m2, respectively. Calculations were then performed using the IPCC direct estimation method [35]. The ECEP is used to measure the external carbon emission pressures exerted on territorial space by various anthropogenic and socioeconomic factors. Relevant studies [36] have demonstrated significant correlations between the proportion of urban built-up land, population density, annual average GDP, and external environmental carbon emission pressure. This study selected the study area’s annual average GDP, population density, and the proportion of built-up land in the assessment unit as ECEP indicators and used the entropy weighting method to determine the weights as 0.42, 0.23, and 0.35, respectively. The calculation formula is as follows:
where represents the area of land use category i; represents the carbon emission factor for land use category i; n represents the number of evaluation units; , , and represent the average annual GDP, population density, and the proportion of built-up land in the evaluation units, respectively; , , and denote the weights of each indicator.
2.3.2. Spatial Instability
Spatial Instability (SI) measures the spatial distribution patterns of land-use categories to assess the extent to which they influence the balance between carbon sinks and sources and disrupt carbon cycling in ecosystems, thereby reflecting the extent to which human activities disrupt carbon cycling in territorial space. In the carbon cycle of ecosystems, the spatial distribution of carbon sources and sinks follows specific patterns and carbon sequestration laws [37]. When the carbon sequestration capacity of carbon sinks and the emissions from carbon sources remain constant, different spatial configurations and carbon sequestration patterns will result in variations in the actual carbon flux involved in the cycle. A rational spatial arrangement of carbon sources and sinks, coupled with a stable carbon sequestration mechanism, can help maximize the effectiveness of carbon sink areas [38]. However, the large-scale disorderly development and inefficient use of land resulting from rapid socioeconomic development have not only directly reduced the overall stock of carbon sinks but also undermined the stability of the territorial space, thereby further exacerbating spatial carbon emission pressures and limiting the maximum carbon sequestration capacity of carbon sink areas [39]. Drawing on the research of scholars such as Xiang et al. [40] and Liang et al. [16], we selected three dimensions—landscape fragility (FI), complexity (CI), and exposure (LE)—to characterize spatial instability. Among these, the CI reflects the extent to which human activities influence the spatial pattern of the territorial space and the degree of disturbance to the territorial space by neighboring units; a higher value indicates a greater degree of influence. The FI reflects the capacity of the territorial space to withstand external pressures. Different land-use categories within the territorial space play varying roles in resisting external pressures and exhibit differing levels of resilience to external disturbances; a higher value indicates that a territorial spatial unit has a weaker ability to resist disturbances. Referring to the calculation or assignment methods for the vulnerability of different land-use categories in existing studies [41,42], and taking into account the sensitivity of each land-use category to external disturbances, the vulnerability indices for each land-use category are set at 1–6, in the following order: built-up areas, forested land, grassland, cropland, water bodies, and unutilized land. The LE reflects the degree to which a territorial spatial unit is exposed to spillover effects from human-built environments or other potential risks; the likelihood of exposure increases as this value increases. Referring to the research by Wu et al. [14], landscape exposure of territorial spatial units is characterized by a weighted calculation of the Euclidean distances from the evaluation unit to four types of human-intensive activity spaces: expressways, major rivers, and provincial and municipal administrative centers. Using the Analytic Hierarchy Process (AHP) in Yaahp software (v10.3.5806.17573), weight coefficients of 0.15, 0.20, 0.35, and 0.30 were calculated, respectively. The calculation formula is as follows:
where m represents the total number of assessment units in the study area; n represents the total number of land use categories; i represents the i-th land use category; represents the area of the assessment unit; S is the total area of the study area; is the vulnerability index for land use category i; j is the j-th assessment unit; is the area of the j-th land use category within assessment unit i; is the perimeter of the land use category patch; , , , and represent the distances from the assessment unit to the expressway, major rivers, and provincial and municipal administrative centers, respectively; , , , and are the weights of each assessment factor, respectively.
2.3.3. Spatial Carbon Sequestration Capacity
Spatial Carbon Sequestration Capacity (SCSC) is used to measure the total amount of carbon that a given land area can sequester over a specific period of time, i.e., the extent of its ecological carbon sink function within the carbon cycle. Carbon sequestration capacity is directly related to the ability of a region’s ecological space to maintain carbon balance and mitigate the risks of carbon imbalance [43]. The higher the SCSC value, the greater the total amount of carbon that the target area can sequester, and the stronger its ability to alleviate spatial carbon sink conflicts and withstand risks in that area [10]. This study employs the Carbon Storage and Sequestration module of the Integrated Valuation of Ecosystem Services and Tradeoffs (InVEST) model to assess spatial carbon sequestration capacity. This module includes four basic carbon pools: the above-ground biomass carbon pool, the below-ground biomass carbon pool, the soil organic matter carbon pool, and the dead organic matter carbon pool. The calculation formula is:
where represents the comprehensive carbon density of the i-th land use category; , , , and represent the above-ground, below-ground, soil, and dead organic matter carbon densities of the i-th land use category, respectively; represents the total area of the i-th land use category within the assessment unit; and n represents the number of land use categories.
The accuracy of carbon density values directly affects the accuracy of calculations in the InVEST model. Previous studies have shown that carbon density varies little among neighboring regions with similar climates. Therefore, this study selected carbon density data for the Hangzhou Bay region [44], filtered out outliers, and assessed the data’s validity, ultimately deriving carbon pool data for the Hangzhou city (Table 3).
Table 3.
Carbon density values of different land use categories (t/hm2).
3. Results
3.1. Analysis of Land Use Trends in Hangzhou over the Past Decade
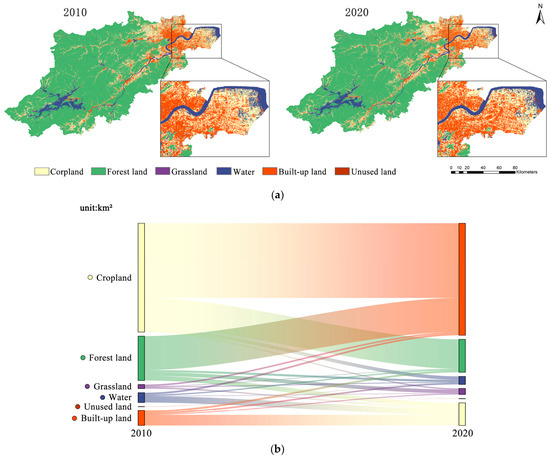
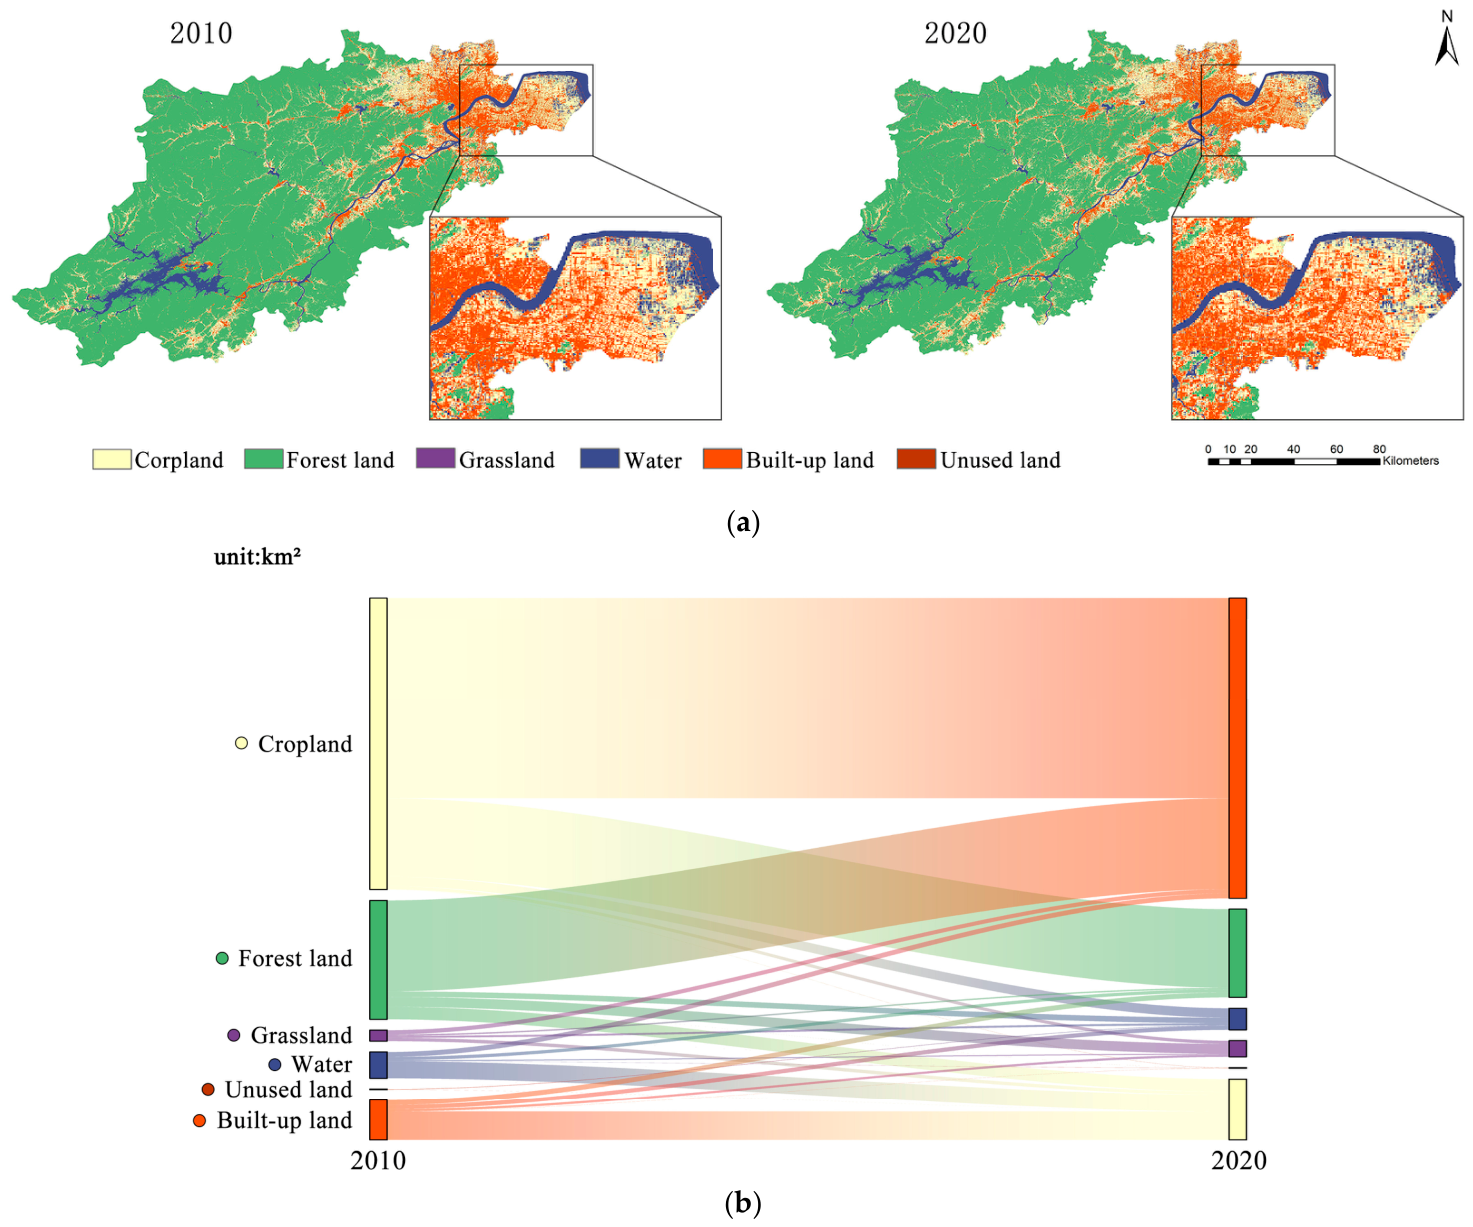
Land use in Hangzhou in 2010 is shown in Table 4 and Figure 3. In 2010, forested land accounted for a significant portion of the total land area within Hangzhou, representing 68.02% of the total; it was primarily distributed in the central and southwestern regions of the city. Cropland was distributed in scattered and branch-like patches, mostly located in the gaps between the urban suburbs and forested areas, accounting for 18.95% of the total area. Built-up land was primarily concentrated in the main urban area of the northeastern part of the city, largely coinciding with the urban development zone, accounting for 5.43% of the total area. Water primarily consists of the Qiantang River and Thousand Island Lake, along with smaller reservoirs and lakes; this land category covers an area of 885.13 km2, accounting for 5.24% of the total. Grasslands and unused land account for a small proportion, scattered throughout the municipal area, with respective shares of 2.33% and 0.04%. In Hangzhou’s 2020 land use statistics, the proportion of cropland decreased by 1.74%, the proportion of forest land decreased by 0.29%, and the area of built-up land increased to 1261.63 km2, accounting for 7.47% of the total. There were no significant changes in the areas of other land use categories. In general, land-use transfers primarily occur between cropland, forest land, and Built-up land (Figure 3b).
Table 4.
Changes in land use in Hangzhou from 2010 to 2020.
Figure 3.
(a) Spatial patterns of land use and (b) their transfer characteristics in Hangzhou from 2010 and 2020.
It can be concluded that from 2010 to 2020, Hangzhou’s socioeconomic development continued to advance, and the expansion of built-up land persisted, leading to a reduction in the area of cropland and forest land. In this process, the conflict between carbon sources and carbon sinks manifested as a spatial conflict over carbon sinks within the landscape.
3.2. Results of the Carbon Sink Conflict Intensity Assessment
The results of the 2020 Hangzhou city territorial space carbon sink conflict assessment are as follows: the calculated results for Spatial Carbon Emission Pressure (SCEP) (Table 5), Spatial Carbon Sequestration Capacity (SCSC) (Table 6), Spatial Instability (SI) (Table 7), and the assessment results for Territorial Space Carbon Sink Conflict (TSCSC) (Table 8). All of the above assessment results have been standardized.
Table 5.
Results of the 2020 SCEP assessment for Hangzhou.
Table 6.
Results of the 2020 SCSC assessment for Hangzhou.
Table 7.
Results of the 2020 SI assessment for Hangzhou.
Table 8.
Results of the 2020 TSCSC assessment for Hangzhou.
3.2.1. Classification and Structure of Conflict Levels at the County and District Levels
Based on the research by Zhou et al. [13] on the classification of conflict levels, this study classifies the conflict levels of the assessed spatial carbon sink conflict evaluation results. Using the equidistant method, the conflict levels are divided into five categories: light conflict [0.0–0.20), general conflict [0.20–0.40), moderate conflict [0.40–0.60), intense conflict [0.60–0.80), and severe conflict [0.80–1.0]. We then conducted a visual analysis of the derived evaluation indicators to identify the spatial distribution pattern of carbon sink conflicts in Hangzhou.
At the county level, the number of evaluation units across the five conflict levels is as follows: 2 units classified as “light conflict,” 2 units as “general conflict,” 2 units as “moderate conflict,” 3 units as “intense conflict,” and 4 units as “severe conflict.” These units account for 15.38%, 15.38%, 15.38%, 23.08%, and 30.77% of the total, respectively. There were 7 units with conflict levels of “intense or severe,” accounting for 53.85% of the total evaluated units. It is evident that Hangzhou’s carbon sink conflict manifests as a structure that is locally manageable but overall unbalanced.
Drawing on similar studies by Wu et al. [14] and other scholars [25], this paper presents the results of the carbon sink conflict assessment for each district and county in Hangzhou in 2020 (Table 9). The total annual carbon sink volume of assessment units at the “light and general conflict” level reached 198.3957 million tons, accounting for 73.49% of Hangzhou’s total annual carbon sink volume; the total annual carbon emissions from assessment units at the “moderate, intense, and severe conflict” levels amounted to 83.1872 million tons, accounting for 79.43% of Hangzhou’s total annual carbon emissions. This indicates a clear spatial divergence between carbon emission areas and carbon sink areas.
Table 9.
Analysis of the 2020 Hangzhou TSCSC Assessment Results.
3.2.2. Distribution Patterns of Spatial Carbon Sink Conflicts at the County Level
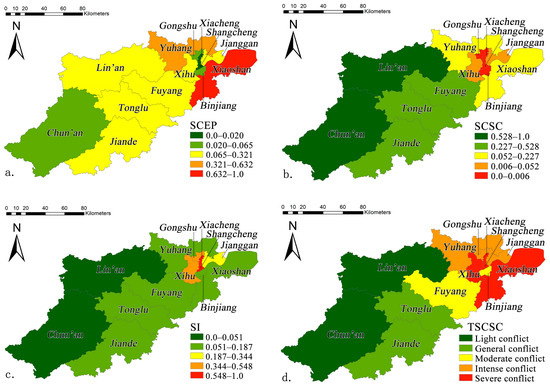
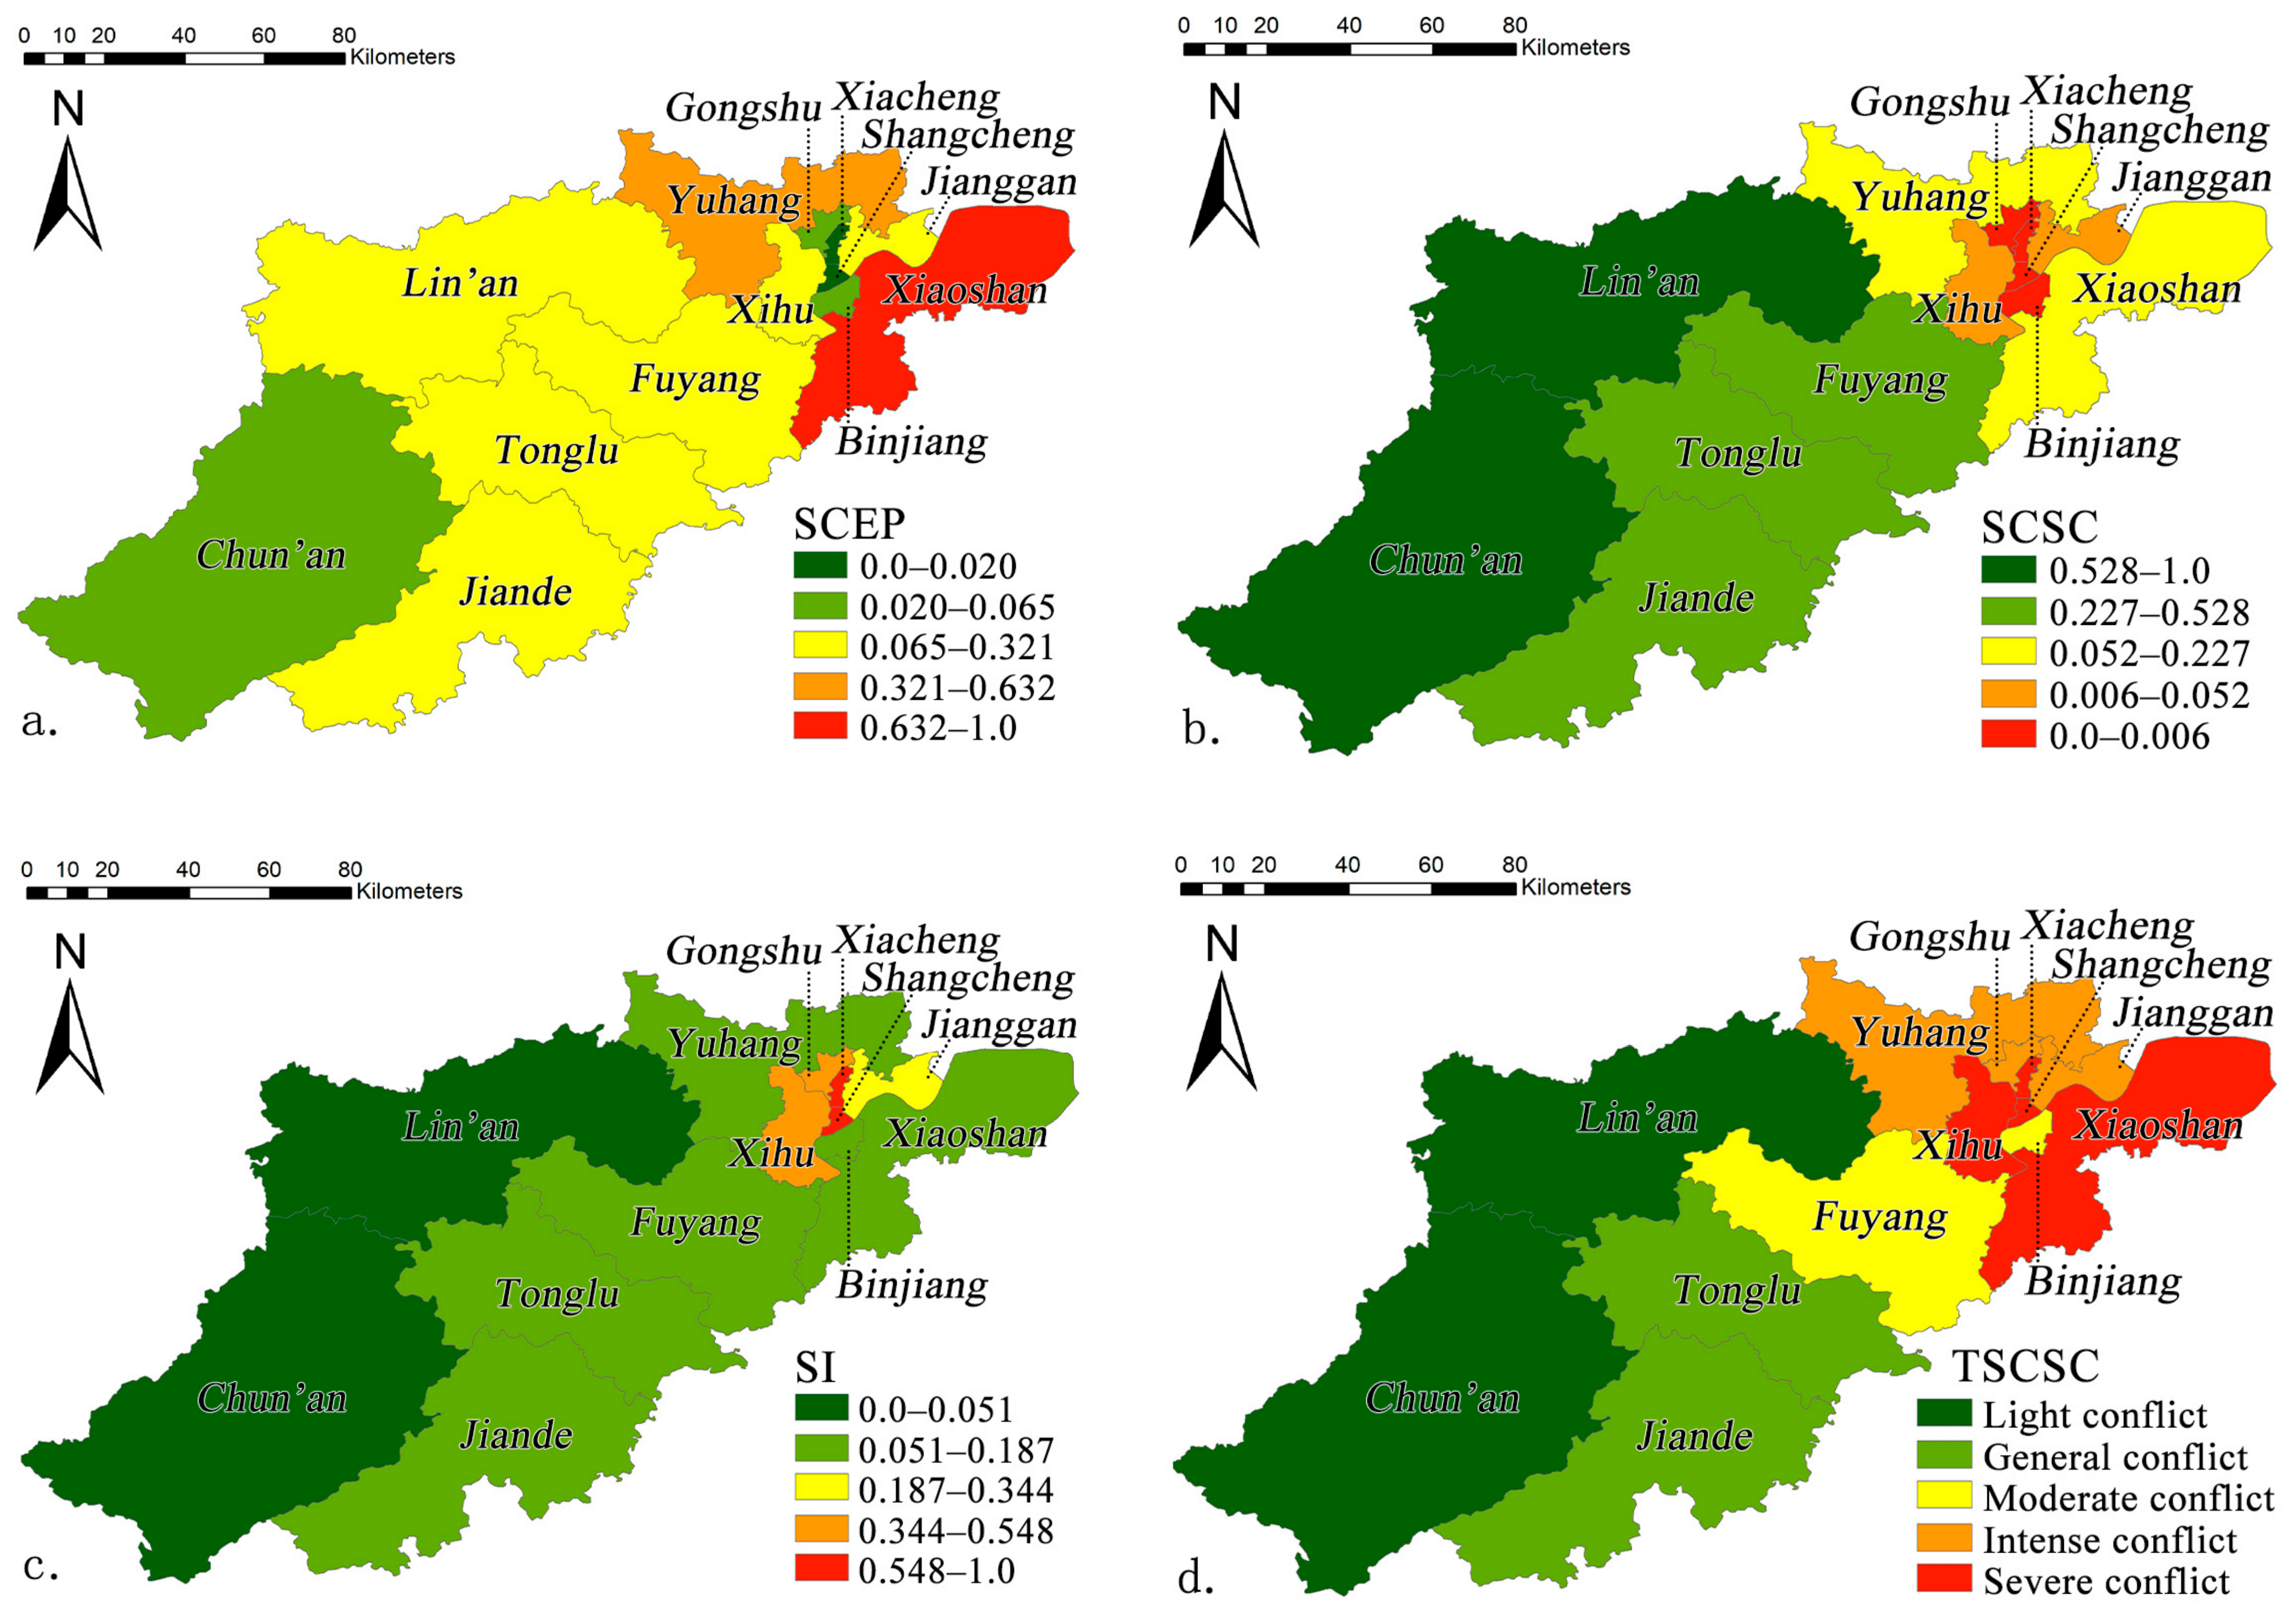
The results of the 2020 carbon sink conflict assessment for Hangzhou are shown in the figures. Figure 4a–c present the assessment results and distribution patterns of the SCEP, SCSC, and SI for Hangzhou, respectively. Figure 4 illustrates the results and distribution patterns of the 2020 carbon sink conflict (TSCSC) assessment for Hangzhou.
Figure 4.
Assessment results and distribution patterns of (a) the SCEP, (b) the SCSC, (c) the SI, and (d) the TSCSC.
In terms of SCEP, Hangzhou’s SCEP exhibits significant regional variations. The SCEP values are relatively high in the central urban area and surrounding regions, such as industrial clusters and transportation hubs. As a major hub for industrial clusters in Hangzhou, Xiaoshan generates substantial carbon emissions due to the production activities of numerous industrial enterprises and frequent transportation, making it a high-pressure area for spatial carbon emissions. In contrast, natural ecological areas such as mountainous regions and forested lands located far from the central urban area have relatively low SCEP values. For example, in most parts of Chun’an, where industrial activity is scarce and population density is low, carbon emissions are relatively low, resulting in lower spatial carbon emission pressure.
In terms of SCSC, areas with high coverage of ecologically functional land—such as forest land and grasslands—exhibit higher SCSC values. For example, in Lin’an and Chun’an, the Tianmu Mountain region within Lin’an possesses abundant forest resources, giving Lin’an a relatively strong carbon sequestration capacity; Meanwhile, Chun’an possesses the largest forested area within Hangzhou city, with forested land accounting for 83.3% of the county’s total land area, and similarly possesses strong carbon absorption and sequestration capabilities. Therefore, in terms of spatial carbon sequestration evaluation, Lin’an and Chun’an stand out. In contrast, areas with dense development land exhibit lower SCSC values. For example, Shangcheng, Xiacheng, and Binjiang within the core urban area have a high proportion of development land, extensive hard-surfaced areas, and limited vegetation cover. The land use categories in these areas have weak carbon sequestration capacity. Furthermore, the high population density and extensive human carbon emission activities generate significant carbon emissions, which further weaken the carbon sink capacity of these regions.
In terms of SI, spatial instability (SI) exhibits different characteristics across various regions. Previous studies have shown that spatial instability can be quantified through landscape fragility, complexity, and exposure [10], and these three indicators are highly correlated with the degree of land-use patch fragmentation, the degree of land-use patch dispersion, and the degree of overlap between different types of land-use patches. As demonstrated in this study, areas along the urban fringe and regions with complex and variable land-use patterns exhibit higher SI values. For example, Shangcheng, Xiacheng, Xihu, and Gongshu—as the historic urban core of Hangzhou—have undergone prolonged development, feature high levels of construction, and exhibit fragmented and mixed land-use patterns with complex land ownership relationships. In some typical plots within these districts, traditional land use types—such as farmland and villages—intermingle with emerging urban development sites. This complex land-use pattern results in high levels of landscape vulnerability, complexity, and exposure, as well as significant spatial instability. In contrast, areas with better ecological conservation and relatively homogeneous land use exhibit lower SI values. Lin’an, Chun’an, and Jiande all contain extensive natural ecological functional zones. These areas feature low landscape fragmentation, relatively stable ecosystems, and minimal impact from construction and development, resulting in lower spatial instability.
As shown in Figure 4d, carbon sink conflicts in Hangzhou in 2020 exhibited a distinct spatial distribution pattern. Areas with light conflicts were primarily located in some of Hangzhou’s outlying districts and counties. In these regions, land-use changes were relatively minor, ecosystems were relatively stable, and carbon sink functions were well maintained. Representative examples include Lin’an and Chun’an. Due to their land-use composition, which is dominated by mountainous and forested areas, and the relatively low level of human activity resulting in minimal disturbance to land use, these areas experience lower spatial carbon emission pressure, stronger spatial carbon sequestration capacity, and lower spatial instability. Consequently, carbon sink conflicts in these regions remain in a stable and controllable state.
Areas with general conflict are similarly widespread across Hangzhou, primarily encompassing districts and counties where urban development has been relatively moderate. The relatively low level of development and construction in these areas, combined with manageable levels of human carbon emissions, means that the intensity of carbon sink conflicts has not yet reached a point of uncontrollability. Taking Fuyang as an example, during its urbanization process, constraints related to economic conditions and development pace have led to a certain degree of deceleration in the expansion of construction land. This has indirectly maintained a basic balance between ecological conservation and economic development. At the same time, the district has reserved a certain proportion of ecological land during urban construction, ensuring that the carbon sink function within the region has not been severely compromised. Consequently, carbon sink conflicts in the region remain largely within a controllable range.
Areas of moderate conflict are primarily concentrated on the outskirts of city centers or in regions undergoing rapid urbanization. These areas face a sharp conflict between the rapid expansion of construction land and the protection of ecological land. For example, in some emerging development zones in Yuhang, as demand for construction land has surged, development areas have significantly encroached upon existing carbon sinks such as farmland and forest land. This has led to increased regional carbon emissions pressure, a relative decline in carbon sequestration capacity, and heightened spatial instability, ultimately pushing carbon sink conflicts to the brink of becoming unmanageable.
Areas of intense and severe conflict are primarily concentrated in Hangzhou’s central urban districts and certain key development zones, such as Gongshu and Shangcheng. Due to prolonged, high-intensity development and construction, these areas have seen a high concentration of construction land, resulting in a significant reduction in ecological land. Consequently, the carbon sink function of the regional ecosystem has been severely compromised, posing a serious threat to the regional ecological environment and carbon balance.
4. Discussion
4.1. Contributions and Limitations
Compared with previous studies, this paper adopts a three-dimensional evaluation framework that integrates Spatial Carbon Emission Pressure (SCEP), Spatial Carbon Capture Capacity (SCSC), and Spatial Instability (SI), unlike many previous studies that relied solely on the superposition of landscape-pattern indices. This framework avoids the information redundancy caused by the simple stacking of landscape indicators and can more accurately capture direct conflicts (carbon balance imbalances) and indirect conflicts (spatial instability amplification effects) in land use processes. In terms of the study scale, this research selected Hangzhou city as the study area and conducted a detailed assessment at the county level. The county is the most basic unit of action for implementing the “dual carbon” strategy, and this scale facilitates a more detailed identification of the heterogeneous characteristics between carbon source and carbon sink spaces during rapid urbanization. Furthermore, by evaluating and measuring carbon sink conflicts across Hangzhou’s 13 districts and counties, the study provides direct spatial decision-making support for local land-use planning and pilot projects aimed at achieving carbon peaking.
This study has several limitations that warrant further improvement: (1) There is room for improvement in terms of data accuracy and parameters. The carbon emission factors used in this study are primarily derived from existing literature and IPCC inventories and may not accurately reflect the local heterogeneity of land management practices, soil conditions, or industrial structures within Hangzhou. Similarly, the carbon density data used in the InVEST model are derived from regional datasets and adjusted values for climatically similar regions and lack on-site field measurements. Furthermore, the GLC_FCS30D land-use data used in this study has an overall accuracy of 82.5%. Although this level of accuracy generally has a manageable impact on the core conclusions, there is still room for improvement. Future research could further enhance the accuracy of land-use classification by integrating higher-resolution remote sensing imagery or conducting local field validation. Additionally, more locally measured carbon flux data should be incorporated to strengthen the regional representativeness of the model parameters. (2) This study has certain limitations in terms of its spatiotemporal scope. On the temporal scale, the study primarily focuses on a cross-sectional analysis of 2020 and does not provide calculations or direct comparisons of the TSCSC index for 2010 at the same level of detail; consequently, it falls short in characterizing the temporal evolution of carbon sink conflicts. On the spatial scale, this study examined carbon sink conflicts only at the county level. Although counties are key administrative units, carbon sink conflicts may exhibit different patterns and characteristics at finer (e.g., grid or township) or coarser (e.g., urban agglomeration) scales. Future research could conduct comparative analyses of multi-temporal carbon sink conflicts over extended periods with relatively stable administrative boundaries or at the local statistical scale to more comprehensively reveal their temporal evolution patterns. (3) Insufficient analysis of driving mechanisms. This study primarily identified the spatial patterns of carbon sink conflicts and linked them to land-use changes. However, it did not conduct an in-depth discussion of other factors contributing to the development of carbon sink conflicts—such as population density, GDP, and the morphology of urban built-up areas—which have been the focus of much existing literature [45,46]. Additionally, the study overlooked the combined effects of factors at the natural, social, and cultural levels [25].
4.2. Implications for Policy-Making
Based on the findings of the aforementioned carbon sink conflict assessment, and drawing on existing research on carbon sinks in the Hangzhou region [47] and studies on practical measures for reducing emissions and increasing carbon sinks in the territorial space [48,49]—particularly in light of the requirements and relevant measures outlined in the Implementation Plan for the National Carbon Peak Pilot (Hangzhou)—this paper proposes low-carbon management recommendations for Hangzhou city.
4.2.1. Differentiated Carbon Sink Management
Severe conflict and intense conflict zones: The districts and counties covered in this category include Shangcheng, Xiacheng, Gongshu, Xihu, Jianggan, Xiaoshan, and Yuhang. These districts and counties should focus on “reducing emissions and increasing carbon sinks,” implementing strict carbon emission controls and carbon sink restoration measures. Specifically, strict control over urban development boundaries should be enforced to rigorously limit the expansion of urban land use. At the same time, efforts should be made to preserve and expand green spaces within the city. Additionally, the green transformation and upgrading of high-carbon-emission industries, as well as the optimization of the energy structure, should be accelerated.
Moderate conflict zones: The districts and counties covered by this category primarily include Fuyang and Binjiang. These areas should prioritize “boundary control” to curb the encroachment of carbon sink areas by the unregulated expansion of construction land. Ecological protection red lines must be strictly demarcated and adhered to. For construction projects that genuinely require the use of farmland or forest land, ecological compensation of equal quality and quantity must be implemented in accordance with the principle of “no reduction in area or carbon sink capacity.” Compensation plots should prioritize forest land or wetlands with strong carbon sink capacity and be incorporated into long-term management and protection.
General conflict and light conflict zones: This category includes Lin’an, Chun’an, Jiande, and Tonglu. These areas should prioritize “ecological conservation and green development,” strengthen the region’s carbon sink capacity, and improve relevant ecological protection laws and policies to provide a solid foundation for the protection of regional ecological carbon sinks. At the same time, pilot programs for carbon credit trading may be explored, allowing carbon-rich areas to sell verified carbon credits to entities with emission reduction needs. Furthermore, green and low-carbon industries such as eco-tourism, forest wellness, and organic agriculture may be developed, provided that such activities do not harm the ecosystem.
4.2.2. Optimization Methods at the Territorial Spatial Planning Level
- Sustainable conservation and restoration of ecological functional areas
In accordance with the requirements for demarcating the “Three Zones and Three Lines” in territorial spatial planning, relevant departments should strictly enforce the management of ecological protection red lines to ensure that important carbon sink areas—such as forested lands, wetlands, and grasslands—are effectively protected. Development and construction activities unrelated to ecological protection are strictly prohibited within these red lines. At the same time, based on the distribution characteristics of high-carbon-sink areas identified in the carbon sink conflict assessment, regions such as Lin’an and Chun’an—which are rich in forest resources and possess strong carbon sink capacity—should further strengthen the management of ecological protection red lines and intensify efforts to protect and cultivate important carbon sink forest resources in these areas.
- 2.
- Planning Drives Land Use Optimization
This study aims to implement differentiated land-use management strategies at the planning level for regions with different levels of carbon sink conflict, based on the TSCSC results obtained from the assessment described above. It seeks to optimize land use and resolve carbon sink conflicts in Hangzhou by leveraging planning guidelines for land use planning.
In areas with severe and intense conflicts, the core objectives should be to reduce carbon source density and restore carbon sink functions. It is recommended to prioritize the following land-use optimization measures: (1) Systematically reduce the proportion of impervious surfaces. Focus on urban impervious surface resources, such as inefficient industrial land and idle vacant lots, and prioritize their conversion into permeable green spaces or parks to promote the orderly restoration and expansion of carbon sink areas; (2) Relying on planning at various levels, incorporate green space ratio improvement targets into the planning indicator systems of each district, and set reasonable quantitative targets in phases based on the actual conditions of each district to ensure a long-term increase in the green space ratio; (3) Use urban renewal and the renovation of older residential communities as the primary drivers, replacing the outward expansion of new construction land with quality improvements and functional reallocation of existing spaces.
In areas of moderate conflict, the focus should be on strengthening border controls and preventing the loss of carbon sink areas, while strictly implementing the existing “Three Zones and Three Lines” management requirements. For construction projects within these areas that involve the occupation of farmland or forest land, the principle of “no reduction in area, no decline in quality, and no reduction in carbon sink function” must be strictly enforced.
In areas of general conflict and light conflict, the goal should be to maintain the stability of the carbon sink baseline and prevent conflicts from escalating. We call for the following preventive measures: (1) Prior to large-scale development and construction, delineate urban development boundaries in advance and establish clear buffer zones between construction sites and ecologically sensitive areas; (2) Advance the consolidation of land-use categories to reduce the fragmentation of ecological lands such as farmland and forest land, thereby ensuring the continuity and integrity of carbon sink landscapes and fully leveraging their economies of scale; (3) Establish a carbon sink conflict early-warning mechanism based on TSCSC assessments, and dynamically monitor and track the conflict index for each evaluation unit on an annual basis. When the carbon sink conflict index in a given area shows a rising trend year after year, a planning response procedure should be triggered. Following a specialized assessment, a determination should be made as to whether land-use plans need to be adjusted or ecological restoration measures strengthened, thereby achieving long-term control over the severity of carbon sink conflicts.
5. Conclusions
Taking Hangzhou City in Zhejiang Province as a case study, this research evaluates the intensity of carbon sink conflicts within the city’s administrative area and explores spatial optimization of carbon sinks from a land-use perspective. By reviewing relevant theories and research findings, the study clarifies the concept of carbon sink conflicts in territorial space and their importance in achieving the “dual carbon” goals. This study covers the entire administrative area of Hangzhou and develops a carbon sink conflict intensity evaluation model (TSCSC) based on three dimensions: spatial carbon emission pressure, spatial carbon sequestration capacity, and spatial instability. The study also elaborates on the calculation methods and data sources for each dimension of the model. The study concludes that:
- An analysis of changes in land use data reveals the characteristics of land use changes in Hangzhou between 2010 and 2020: there was a significant expansion of built-up land, primarily achieved through the conversion of cropland and forest land. This process exacerbated the spatial conflict between carbon sources and carbon sinks.
- From the perspective of carbon sink conflict structures at the district and county levels, carbon sink conflicts in Hangzhou exhibit a pattern of localized controllability but overall imbalance. Specifically, the number and proportion of evaluation units classified as light conflict, general conflict, moderate conflict, intense conflict, and severe conflict were 2 (15.38%), 2 (15.38%), 2 (15.38%), 3 (23.08%), and 4 (30.77%), respectively.
- In terms of the spatial distribution of carbon sink conflicts at the district and county levels, areas classified as “light conflict” and “general conflict” are predominantly located in outlying districts and counties, while areas classified as “moderate conflict” are concentrated on the urban periphery or in rapidly urbanizing regions. Areas classified as “intense conflict” and “severe conflict” are primarily found in central urban areas and key development zones.
Author Contributions
Conceptualization, X.L. and H.Z.; methodology, X.L. and H.Z.; software, X.L. and H.Z.; validation, X.L., H.Z. and X.M.; formal analysis, X.L. and H.Z.; investigation, X.L. and H.Z.; resources, H.Z. and X.M.; data curation, H.Z. and X.M.; writing—original draft preparation, X.L., H.Z. and X.M.; writing—review and editing, X.L. and H.Z.; visualization, H.Z. and X.M.; supervision, X.L.; project administration, X.L.; funding acquisition, X.L. All authors have read and agreed to the published version of the manuscript.
Funding
This research was funded by 2026 Graduate Education and Teaching Reform Research Project (Key Project) of Central South University: A Study on Reforming the Master of Urban Planning (MUP) Program to Align Student Competencies with Industry Needs in the Context of Territorial and Spatial Planning, grant number 2026JGA013.
Data Availability Statement
The data presented in this study are available upon request from the author.
Acknowledgments
The authors are grateful to the editor and reviewers for their valuable comments and suggestions.
Conflicts of Interest
The authors declare no conflicts of interest.
References
- Pörtner, H.-O.; Roberts, D.C.; Adams, H.; Adler, C.; Aldunce, P.; Ali, E.; Begum, R.A.; Betts, R.; Kerr, R.B.; Biesbroek, R. Climate Change 2022: Impacts, Adaptation and Vulnerability; Cambridge University Press: Cambridge, UK, 2022. [Google Scholar] [CrossRef] [Scilit]
- Zhao, Y.; Su, Q.; Li, B.; Zhang, Y.; Wang, X.; Zhao, H.; Guo, S. Have those countries declaring “zero carbon” or “carbon neutral” climate goals achieved carbon emissions-economic growth decoupling? J. Clean. Prod. 2022, 363, 132450. [Google Scholar] [CrossRef] [Scilit]
- Yang, Y.; Shi, Y.; Sun, W.; Chang, J.; Zhu, J.; Chen, L.; Wang, X.; Guo, Y.; Zhang, H.; Yu, L. Terrestrial carbon sinks in China and around the world and their contribution to carbon neutrality. Sci. China Life Sci. 2022, 65, 861–895. [Google Scholar] [CrossRef] [Scilit] [PubMed]
- Qin, Z.; Deng, X.; Griscom, B.; Huang, Y.; Li, T.; Smith, P.; Yuan, W.; Zhang, W. Natural Climate Solutions for China: The Last Mile to Carbon Neutrality. Adv. Atmos. Sci. 2021, 38, 889–895. [Google Scholar] [CrossRef] [Scilit]
- Dong, M.; Liu, Z.; Ni, X.; Qi, Z.; Wang, J.; Zhang, Q. Re-Evaluating the Value of Ecosystem Based on Carbon Benefit: A Case Study in Chengdu, China. Land 2023, 12, 1605. [Google Scholar] [CrossRef] [Scilit]
- Piao, S.; Yue, C.; Ding, J.; Guo, Z. Perspectives on the role of terrestrial ecosystems in the ‘carbon neutrality’ strategy. Sci. China Earth Sci. 2022, 65, 1178–1186. [Google Scholar] [CrossRef] [Scilit]
- Tian, J.; Chang, X.; Wang, B.; Qiu, C.; Shi, K. Can efficient urban land use mitigate land use conflicts? Empirical evidence from the central Chengdu–Chongqing region, China. Land Use Policy 2025, 153, 107550. [Google Scholar] [CrossRef] [Scilit]
- Wang, G.; Wang, J.; Wang, L.; Zhang, Y.; Zhang, W. Land-use conflict dynamics, patterns, and drivers under rapid urbanization. Land 2024, 13, 1317. [Google Scholar] [CrossRef] [Scilit]
- Fan, Y.; Gan, L.; Hong, C.; Jessup, L.H.; Jin, X.; Pijanowski, B.C.; Sun, Y.; Lv, L. Spatial identification and determinants of trade-offs among multiple land use functions in Jiangsu Province, China. Sci. Total Environ. 2021, 772, 145022. [Google Scholar] [CrossRef] [Scilit] [PubMed]
- Liang, T.; He, Q.; Yang, F.; Ren, X.; Zhang, R.; Wen, C. Identification and multi-scenario simulation of county territorial carbon sink conflicts in the Chengdu-Chongqing Economic Zone. Acta Ecol. Sin. 2025, 45, 334–350. [Google Scholar] [CrossRef]
- Dong, G.; Ge, Y.; Jia, H.; Sun, C.; Pan, S. Land use multi-suitability, land resource scarcity and diversity of human needs: A new framework for land use conflict identification. Land 2021, 10, 1003. [Google Scholar] [CrossRef] [Scilit]
- Wu, M.; Zhou, F.; Cheng, J. Spatial conflict measurement in rapid urbanization areas from the perspective of ecosystem services. China Popul. Resour. Environ. 2021, 31, 12–20. [Google Scholar]
- Zhou, G.; Peng, J. The evolution characteristics and influence effect of spatial conflict: A case study of Changsha-Zhuzhou-Xiangtan urban agglomeration. Prog. Geogr. 2012, 31, 717–723. [Google Scholar]
- Wu, M.; Wang, L.; Cheng, J. Territorial carbon sink conflict measurement and its spatial pattern in the Yangtze River Delta urban agglomeration. Resour. Sci. 2022, 44, 2048–2059. [Google Scholar] [CrossRef] [Scilit]
- Brown, G.; Kangas, K.; Juutinen, A.; Tolvanen, A. Identifying environmental and natural resource management conflict potential using participatory mapping. Soc. Nat. Resour. 2017, 30, 1458–1475. [Google Scholar] [CrossRef] [Scilit]
- Liang, T.; Du, P.; Yang, F.; Su, Y.; Luo, Y.; Wu, Y.; Wen, C. Potential land-use conflicts in the urban center of Chongqing based on the “production–living–ecological space” perspective. Land 2022, 11, 1415. [Google Scholar] [CrossRef] [Scilit]
- Ren, Y.; Liu, X.; Xu, X.; Sun, S.; Zhao, L.; Liang, X.; Zeng, L. Multi-scenario simulation of land use change and its impact on ecosystem services in Beijing-Tianjin-Hebei region based on the FLUS-InVEST Model. Acta Ecol. Sin. 2023, 43, 4473–4487. [Google Scholar] [CrossRef] [Scilit]
- Hu, K.; Lin, M.; Lin, T.; Ye, H.; Zhang, G.; Sui, J.; Chen, T.; Yao, X.; Lu, X. Spatial identification and quantitative evaluation of conflict space between urban sprawl and ecological protection in the process of rapid urbanization: A case study of the Yangtze River Delta Eco-Green Integrated Development Demonstration Zone. Acta Ecol. Sin. 2022, 42, 462–473. [Google Scholar] [CrossRef] [Scilit]
- Wang, X.; Zhao, P.; Long, Y.; Song, W.; Liu, X. Identification of key areas of land space ecological protection and restoration based on the pattern of ecological security in Guangdong, Hong Kong and Macau. Acta Ecol. Sin. 2022, 42, 450–461. [Google Scholar] [CrossRef] [Scilit]
- Peng, D.; Mu, Y.; Zhu, Y. Evaluating the level of coordinated development of fisheries economic growth and environmental quality in selected Chinese regions. Environ. Impact Assess. Rev. 2021, 89, 106605. [Google Scholar] [CrossRef] [Scilit]
- Lukasiewicz, A.; Vella, K.; Mayere, S.; Baker, D. Declining trends in plan quality: A longitudinal evaluation of regional environmental plans in Queensland, Australia. Landsc. Urban Plan. 2020, 203, 103891. [Google Scholar] [CrossRef] [Scilit]
- Xiang, F.; He, F.; Huang, L.; Chen, R. Intensity evaluation and heterogeneity analysis of territorial spatial carbon sink conflicts in rapidly urbanized regions: A case study of Beijing-Tianjin-Hebei city cluster, China. Acta Ecol. Sin. 2024, 44, 10676–10687. [Google Scholar] [CrossRef]
- Xie, L.J.; Yang, P.; Yang, G.B.; Xiang, J.; Chen, P.F.; Wang, R.R.; Yang, L. Measurement of Territorial Carbon Sink Conflicts and Analysis of Spatial Patterns from A Multi-scale Perspective—A Case Study of the Yangtze River Economic Belt. Res. Environ. Yangtze Basin 2024, 33, 2451–2460. [Google Scholar] [CrossRef] [Scilit]
- Zhao, J.; Xie, H.; Ma, J.; Wang, K. Integrated remote sensing and model approach for impact assessment of future climate change on the carbon budget of global forest ecosystems. Glob. Planet. Change 2021, 203, 103542. [Google Scholar] [CrossRef] [Scilit]
- Li, W.; Wang, Y. Spatiotemporal characteristics and multi-scenario simulation of territorial space carbon sink conflicts in the Sichuan-Yunnan ecological barrier region, China. Environ. Sustain. Indic. 2025, 27, 100832. [Google Scholar] [CrossRef] [Scilit]
- Xia, S.; Yang, Y. Examining spatio-temporal variations in carbon budget and carbon compensation zoning in Beijing-Tianjin-Hebei urban agglomeration based on major functional zones. J. Geogr. Sci. 2022, 32, 1911–1934. [Google Scholar] [CrossRef] [Scilit]
- Deng, W.-P.; Zhu, W.-B.; Zhang, Z.; Li, H.-F.; Hu, J.-N.; Fu, J.-Y. Spatio-temporal Variation of Landuse Carbon Budget and Carbon Compensation Zoning at County Level in Henan Province. Huan Jing Ke Xue = Huanjing Kexue 2025, 46, 1517–1534. [Google Scholar] [CrossRef] [Scilit] [PubMed]
- Zhu, D.; Du, H.; Zhou, G.; Hu, M.; Huang, Z. The spatiotemporal dynamics and evolutionary relationship between urbanization and eco-environmental quality: A case study in Hangzhou city, China. Remote Sens. 2025, 17, 1567. [Google Scholar] [CrossRef] [Scilit]
- Huang, Z.; Du, X. Eco-environmental Effects of Land Use Change in Rapid Urbanization Area—A Case Study at Central District of Hangzhou City. Bull. Soil Water Conserv. 2015, 35, 223–229. [Google Scholar] [CrossRef]
- Zhang, X.; Zhao, T.; Xu, H.; Liu, W.; Wang, J.; Chen, X.; Liu, L. GLC_FCS30D: The first global 30 m land-cover dynamics monitoring product with a fine classification system for the period from 1985 to 2022 generated using dense-time-series Landsat imagery and the continuous change-detection method. Earth Syst. Sci. Data 2024, 16, 1353–1381. [Google Scholar] [CrossRef] [Scilit]
- Xu, L.; He, N.; Yu, G. A dataset of carbon density in Chinese terrestrial ecosystems (2010s). China Sci. Data 2019, 4, 90–96. [Google Scholar] [CrossRef] [Scilit]
- Waleed, M.; Sajjad, M.; Shazil, M.S. Urbanization-led land cover change impacts terrestrial carbon storage capacity: A high-resolution remote sensing-based nation-wide assessment in Pakistan (1990–2020). Environ. Impact Assess. Rev. 2024, 105, 107396. [Google Scholar] [CrossRef] [Scilit]
- Yuan, S.; Tang, Y. Spatial differentiation of land use carbon emission in the Yangtze River economic belt based on low carbon perspective. Econ. Geogr. 2019, 39, 190–198. [Google Scholar] [CrossRef]
- Yuan, K.; Mei, Y.; Chen, Y.; Lan, M. Temporal and spatial evolution and influencing mechanism of construction land intensive utilization on carbon emissions efficiency in China. Resour. Sci. 2017, 39, 1882–1895. [Google Scholar] [CrossRef] [Scilit]
- Hu, G.-Z.; Ganjurjav, H.; Li, M.-J.; Yu, P.-D.; Gao, Q.-Z. Study on the simulation of soil carbon sink in grassland ecological management in China—Based on IPCC inventory method. Adv. Clim. Change Res. 2023, 19, 371. [Google Scholar]
- Zhou, Y.; Chen, M.; Tang, Z.; Mei, Z. Urbanization, land use change, and carbon emissions: Quantitative assessments for city-level carbon emissions in Beijing-Tianjin-Hebei region. Sustain. Cities Soc. 2021, 66, 102701. [Google Scholar] [CrossRef] [Scilit]
- Luo, S.; Lai, Q.; Lin, B.; Zhen, J. Land Use Conflict Identification in Southeast Hilly Area from Perspective of “Productional-Living-Ecological” Space. Bull. Soil Water Conserv. 2022, 42, 148–156. [Google Scholar] [CrossRef]
- Yu, G.; Zhu, J.; Xu, L.; He, N. Technological approaches to enhance ecosystem carbon sink in China: Nature-based solutions. Bull. Chin. Acad. Sci. (Chin. Version) 2022, 37, 490–501. [Google Scholar] [CrossRef]
- Tao, Q.; Tao, Y.; Ou, W.X. Mapping the Changes in Supply and Demand of Carbon Sequestration Service in the Yangtze River Delta Under Different Carbon Emission Reduction Targets. Res. Environ. Yangtze Basin 2022, 31, 191–201. [Google Scholar]
- Xiang, F.; Huang, L.; Chen, R. Measurement and function optimization of county territorials spatial conflict based on comprehensive perspective. Bull. Soil Water Conserv. 2024, 44, 158–171. [Google Scholar] [CrossRef]
- Li, J.; Hu, D.; Wang, Y.; Chu, J.; Yin, H.; Ma, M. Study of identification and simulation of ecological zoning through integration of landscape ecological risk and ecosystem service value. Sustain. Cities Soc. 2024, 107, 105442. [Google Scholar] [CrossRef] [Scilit]
- Yang, F.; Jin, X.; Liu, J.; Zhang, X.; Song, J.; Li, Q.; Zhou, Y. Assessing landscape ecological risk in rapidly urbanized areas from the perspective of spatiotemporal dynamics. Trans. Chin. Soc. Agric. Eng. 2023, 39, 253–261. [Google Scholar]
- Chen, M.; Zang, R.; An, Y.; Yang, Y.; Fu, G.; Xu, Z.; Wu, D.; Liu, Y. Spatio-Temporal Disparity of Ecosystem Carbon Sequestration Capacity in the Region of Chengde, China. Pol. J. Environ. Stud. 2025, 34, 6121–6132. [Google Scholar] [CrossRef] [Scilit]
- Ding, Y.; Wang, L.-Z.; Gui, F.; Zhao, S.; Zhu, W.-Y. Ecosystem carbon storage in Hangzhou Bay area based on InVEST and PLUS models. Huan Jing Ke Xue = Huanjing Kexue 2023, 44, 3343–3352. [Google Scholar] [CrossRef] [Scilit] [PubMed]
- Lin, J.; Li, J.; Rao, Z.; Zeng, Y. Association Between Morphological Spatial Patterns of Built-Up Land and Carbon Emissions: Evidence from 303 Cities in China. Systems 2026, 14, 595. [Google Scholar] [CrossRef] [Scilit]
- Luo, H.; Yu, Y.; Gao, S.; Cheng, Q.; Wang, J. What land-use scenarios can improve carbon storage in the Pearl River source? A case study of Qujing City, China. Ecol. Eng. 2026, 227, 107974. [Google Scholar] [CrossRef] [Scilit]
- Zhu, H.; Pan, Y.; Chen, Y. Impact of LUCC on Carbon Storage and Its Components in Hangzhou from 2000 to 2030. Environ. Sci. Technol. 2024, 47, 22–34. [Google Scholar] [CrossRef]
- Wang, S.; Gao, S. Territorial space optimization and pathways for carbon emission reduction and carbon sink enhancement in China towards carbon neutrality. Econ. Geogr. 2024, 44, 163–173. [Google Scholar] [CrossRef]
- Wen, L.; Sun, Y.; Zhang, T.; Shen, T. Policy Transmission Mechanisms and Effectiveness Evaluation of Territorial Spatial Planning in China. Land 2026, 15, 145. [Google Scholar] [CrossRef] [Scilit]

Disclaimer/Publisher’s Note: The statements, opinions and data contained in all publications are solely those of the individual author(s) and contributor(s) and not of MDPI and/or the editor(s). MDPI and/or the editor(s) disclaim responsibility for any injury to people or property resulting from any ideas, methods, instructions or products referred to in the content. |
© 2026 by the authors. Licensee MDPI, Basel, Switzerland. This article is an open access article distributed under the terms and conditions of the Creative Commons Attribution (CC BY) license.