


Abstract
Low-carbon development (LCD) and intensive urban land use (IULU) are critical objectives for sustainable urban development. Existing studies have usually evaluated LCD or IULU separately, whereas the dynamic relationship between carbon-transition capacity and land-use intensification under rapid urbanization remains insufficiently clarified. This gap limits the ability of policymakers to design spatially differentiated and synergistic actions for achieving the Sustainable Development Goals (SDGs). This study investigates the relationship between LCD and IULU and its transformation within the sustainable development framework, using the Middle Reaches of the Yangtze River Urban Agglomeration (MRYRUA) in central China as a case study. Results indicate a strong positive correlation between LCD and IULU. Crucially, their coupling exhibited a distinct U-shape trajectory from 2005 to 2020; it decreased from 0.89 in 2005 to 0.73 in 2013 and then recovered to 0.84 in 2020, suggesting a relative weakening of the interaction followed by recoupling rather than complete decoupling. The identified U-shaped trajectory holds vital implications for other developing nations, suggesting that integrating low-carbon goals into spatial planning and land policies from the early stages of urbanization can pave the way for a faster transition to a green, intensive, and high-quality development model. Moreover, although both LCD and IULU exhibited positive trends, a widening gap was observed between provincial capitals and non-provincial cities. We, therefore, recommend integrating multi-stakeholder collaboration and implementing differentiated strategies to enhance the synergistic effects of LCD and IULU for cities at different phases of the LCD–IULU transition.
1. Introduction
The relentless growth of global carbon emissions has precipitated a climate crisis, posing severe threats to economic sustainability and ecological stability worldwide. The IPCC AR6 report emphasizes the necessity of implementing rapid, comprehensive, and systematic emission reductions and adaptation measures within the current decade [1,2,3]. In response, low-carbon development (LCD) has emerged as a global imperative. LCD transcends mere emission reduction; it represents a transformative model of socioeconomic progress that decouples economic growth from carbon intensity through industrial restructuring, technological innovation, and clean energy adoption [4]. Concurrently, the role of land use, particularly urban land, has come under intense scrutiny. Land use is a significant source of CO2 emissions, and is second only to fossil fuel combustion [5,6]. Among the land-use types, urban land is the primary carrier of socioeconomic activities [7,8]. The paradigm of intensive urban land use (IULU), which seeks to maximize the socioeconomic and ecological output per unit of land area, is increasingly recognized as a critical strategy for climate mitigation. Both LCD and IULU are intrinsically linked to the United Nations Sustainable Development Goals (SDGs), specifically targeting affordable and clean energy (SDG 7) and sustainable cities and communities (SDG 11) [9,10,11]. While their importance is acknowledged individually, the intricate interplay between them is still not fully understood.
The pursuit of LCD has gained substantial political traction globally. Policymakers recognize it as a win-win model that harmonizes urban development with environmental stewardship [12]. In European practice, low-carbon urban transformation is often embedded in regional transport, energy-efficiency, and integrated land-use-planning frameworks, emphasizing compact development, public participation, and changes in mobility and energy-consumption behavior [13,14]. Similarly, China has also formally integrated LCD into urban-development agendas and positioned it as a core pathway toward carbon peaking and carbon neutrality [15,16,17]. However, LCD implementation is challenging because it requires coordinated institutional, economic, technological, and behavioral changes [18,19]. Parallelly, IULU has evolved as a pragmatic solution to counter unsustainable urban expansion [20], which often leads to the loss of ecological and agricultural land [21,22,23]. Initially conceived in agricultural studies [24,25], the concept of intensification emphasized maximizing output through concentrated inputs of labor and technology in a certain land area [26]. In an urban context, however, much IULU research has focused on economic efficiency and construction-land control [27,28], with inadequate attention being paid to its ecological and low-carbon dimensions [29]. This narrow focus limits understanding of whether land-use intensification supports or conflicts with LCD during rapid urbanization.
LCD and IULU are not isolated strategies but exist in a dynamic, bidirectional relationship. On the one hand, LCD acts as a catalyst for IULU. The imperative to reduce energy consumption and emissions inherently promotes efficient resource utilization [30], which translates into more prudent and functional use of land. LCD can promote IULU by encouraging compact urban spatial organization, green infrastructure, energy-efficient buildings, and the protection of ecological and agricultural land [31,32]. Furthermore, the LCD principle of enhancing environmental quality necessitates that land-use planning incorporates ecological protection [33]. These actions improve the quality of land development rather than relying only on land expansion [34,35]. On the other hand, IULU provides the spatial foundation and implementation mechanism for LCD. Compact and efficient land use can reduce travel distances [36], support public transport and district energy systems, protect carbon sinks [37], and create the density necessary for renewable-energy facilities, green buildings, and public service networks [38,39]. Nevertheless, the relationship is not always synergistic. In the early stage of urbanization, intensive land development may also be accompanied by industrial agglomeration, infrastructure construction, and rising energy demand. Therefore, LCD and IULU may experience a temporary mismatch before moving toward coordination.
Despite these potential synergies and tensions, the precise nature of the relationship between low-carbon development (LCD) and intensive urban land use (IULU) under increasing carbon and resource constraints remains unclear. Existing studies have made substantial progress in terms of linking land use, urban form, and carbon emissions, and this has included research on land-use efficiency and carbon emissions, urban spatial structure and transport-related emissions, and the coupling coordination among ecological, economic, and land-use subsystems [40,41]. Nevertheless, several limitations remain. First, many studies have treated carbon reduction and intensive land use as parallel evaluation targets, with limited attention being given to how their interaction evolves during rapid urbanization. Such a siloed approach poses a significant challenge for policymakers seeking to foster synergistic actions to achieve the SDGs [42]. Second, although coupling-coordination models have been widely applied, the policy contexts and urbanization mechanisms underlying nonlinear evolutionary trajectories are often insufficiently discussed. Emerging evidence on sustainability interactions suggests that different goals may decouple and subsequently recouple as development progresses [43]. However, few studies have examined whether a similar nonlinear transition exists between LCD and IULU in rapidly urbanizing urban agglomerations. These gaps make it difficult for policymakers to determine whether land-use intensification and carbon mitigation should be governed as independent targets or integrated through spatial planning and differentiated city strategies.
To address these research gaps, this study investigates the interaction and evolutionary trajectory between LCD and IULU, using the Middle Reaches of the Yangtze River Urban Agglomeration (MRYRUA) in China as an empirical case. Specifically, this study aims to: (1) quantify the coupling relationship between LCD and IULU; (2) identify the spatiotemporal transition patterns of their interaction; and (3) clarify the stage-specific mechanisms underlying the LCD–IULU relationship. By examining the dynamics of the interactions between LCDs and IULUs, this study seeks to clarify its stage-specific mechanism, and to link the empirical findings to differentiated spatial-planning and low-carbon policy instruments, thereby providing policy implications for regions at different stages of urbanization.
2. Materials and Methods
2.1. Study Area
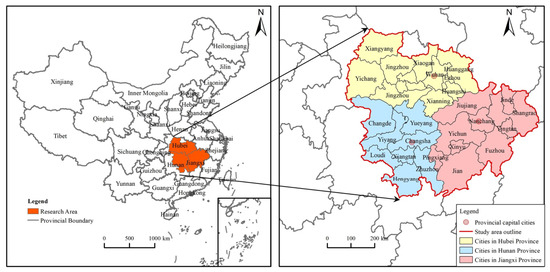
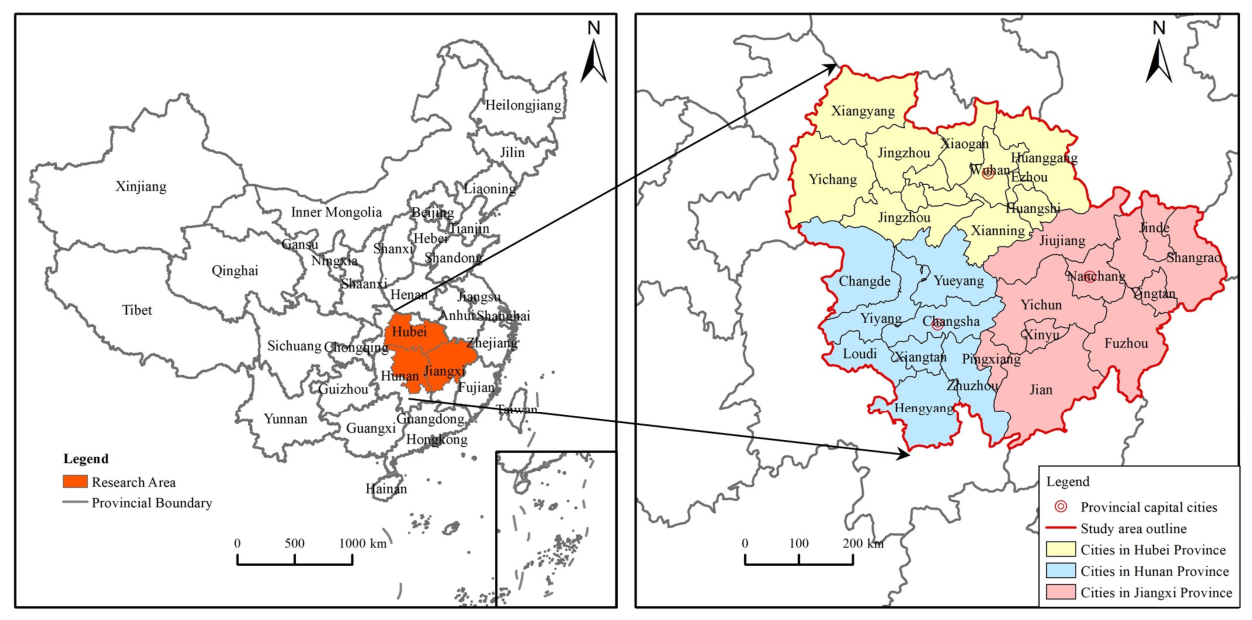
This study used the MRYRUA, an important urban agglomeration in central China, as the study area (Figure 1). It comprises 28 prefecture-level cities across Hubei, Hunan, and Jiangxi provinces. From 2005 to 2020, the MRYRUA experienced rapid urbanization, large-scale infrastructure construction, industrial transformation, and continuous expansion of urban construction land. These processes created a typical tension between land-development demand and low-carbon transition. Provincial capitals such as Wuhan, Changsha, and Nanchang have promoted cleaner energy use, technological innovation, public transport improvement, and land-use efficiency enhancement more actively than many non-provincial cities. Given its rapid urbanization and internal developmental diversity, the MRYRUA serves as a highly representative case for investigating the relationship between low-carbon development and intensive land use in China’s urban agglomerations. Insights gained from this region can inform sustainable development pathways for other urbanizing areas.
Figure 1.
Study area covering the MRYRUA in China.
2.2. Data Sources
This study selected 28 prefecture-level cities in the MRYRUA and researched population, economy, energy, ecology, and other aspects, including the urbanization rate. The data are based on the scope of municipal districts and are derived from the “China City Statistical Yearbook (2011–2020)” and “China Urban Construction Statistical Yearbook (2011–2020)”.
The study period of 2005–2020 was selected for three reasons. First, it covers the major stage of rapid urbanization and construction-land expansion in the MRYRUA, during which the tension between urban growth, land-use intensification, and carbon-emission control became increasingly evident. Second, although China formally proposed the dual-carbon strategic goal in 2020, low-carbon development had, in fact, been incorporated into national and local policy agendas much earlier. For example, China began to promote energy conservation, emission reduction, circular economy development, and low-carbon pilot city construction before 2020. Therefore, the period from 2005 to 2020 enables us to examine how LCD and IULU interacted under the gradual strengthening of low-carbon and ecological policies, rather than only after the announcement of the dual-carbon goal. Third, the period includes the years before and after the strengthening of China’s ecological civilization strategy around 2013, which provides an important policy turning point for observing the transition in LCD–IULU interaction. In this sense, 2020 is not treated as the starting point of low-carbon policy, but as a key baseline year before the full implementation of the dual-carbon strategy. Extending the analysis beyond 2020 would be valuable; however, comparable post-2020 indicators for all cities were not yet sufficiently consistent when this study was designed.
2.3. Methods
2.3.1. Measurement of LCD and IULU
A comprehensive evaluation method was used to measure the levels of LCD and IULU. In this study, LCD refers to the low-carbon development level or low-carbon-transition capacity of a city rather than being a direct carbon-emission inventory or a direct measure of carbon efficiency. Accordingly, the LCD index should be interpreted as a proxy-based index of the socioeconomic, energy-service, technological, environmental-governance, and living-condition capabilities that support low-carbon transition. The LCD indicator system was developed with reference to low-carbon-city indicator systems and related studies [42,43,44], and was adjusted according to data availability at the prefecture-city scale. It includes four dimensions. Economic Growth indicators (A1: secondary industry value added as a proportion of GDP; A2: tertiary industry value added as a proportion of GDP; A3: investment in real estate development; and A4: urbanization rate) reflect the economic and urbanization structure associated with carbon emissions pressure and transition conditions. A1 captures the potential pressure of manufacturing and energy-intensive activities, whereas A2 reflects the shift toward service-oriented activities with generally lower direct carbon intensity. A3 was included because real-estate development is closely related to construction activities, building energy demand, land-development intensity, and urban expansion; it therefore serves as a proxy for the carbon pressure generated by construction-led urban growth rather than as a purely economic-growth indicator. A4 captures the urbanization process that changes both energy consumption and land-development demand. Energy Consumption indicators (A5: per capita residential domestic water consumption; A6: gas supply per capita; and A7: LPG household usage per 10,000 people) capture household resource consumption and cleaner fuel substitution. A5 is not treated as a direct carbon-emission variable; rather, it is a proxy for urban living-resource intensity and municipal infrastructure demand, both of which are associated with energy use in terms of water supply, treatment, and daily consumption. A6 and A7 represent different clean-fuel service dimensions, namely pipeline-gas supply and LPG household use. Low-Carbon Technology indicators (A8: land average domestic waste harmless treatment capacity; A9: science and technology expenditures; and A10: number of employees in scientific research, technical services, and geological exploration) reflect environmental technology application and innovation capacity. Low-Carbon Living Standard indicators (A11: urban sewage treatment rate; A12: city gas penetration rate; A13: greening coverage of built-up areas; and A14: parkland area per 10,000 people) reflect the improvement of environmental services and living conditions. A12, the city gas penetration rate, further reflects the coverage of cleaner urban energy infrastructure. Although A6, A7, and A12 are related, they measure scale, household usage, and service accessibility, respectively, and were retained to avoid omitting the energy-service transition. Indicators for photovoltaic and wind power were not included because city-level data with consistent definitions were unavailable for all 28 cities from 2005 to 2020. Similarly, the industrial-structure indicators A1–A4 cannot fully distinguish carbon-emission differences among detailed manufacturing subsectors, which is recognized as a limitation of this study.
With reference to the existing studies, the evaluation index system of IULU is established, which includes three levels [38,45]. Land Input (B1: local average financial expenditure; B2: labor input per land; and B3: bus input volume) focuses on the city’s financial investment in land resources, labor input, and public transportation expenditure. Land Use (B4: urban construction land-use rate; B5: population density; and B6: urban road area per capita) focuses on the efficiency of urban construction land use, population density, and urban transportation road planning. The Economic Benefits of Land (B7: gross regional product per land; B8: average land revenue; and B9: total sales of social consumer goods per land) reflect the economic returns and social benefits of land use. This structure is consistent with the input-use-output logic of intensive land-use evaluation and links land-development intensity with socioeconomic efficiency.
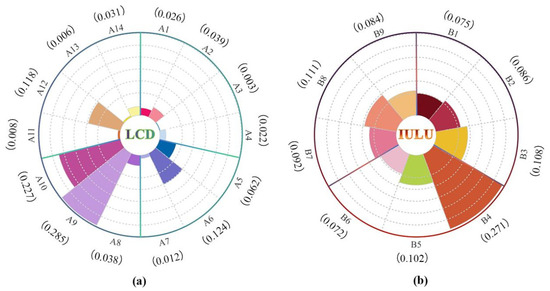
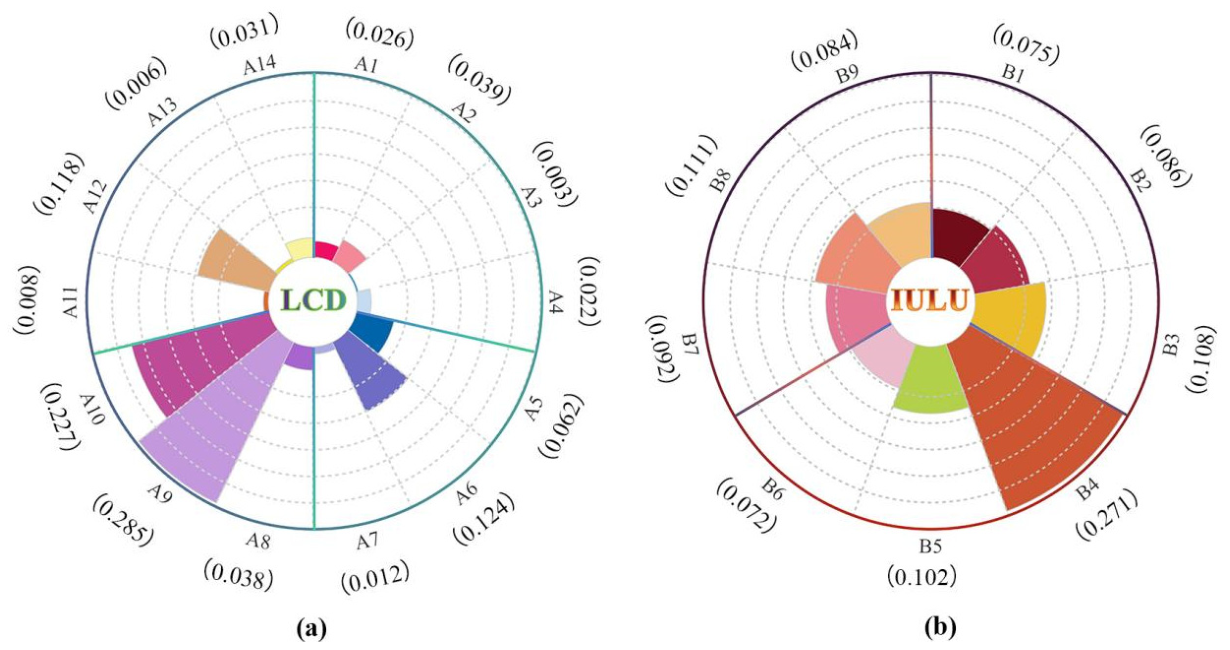
The entropy method was used to calculate the weights of each indicator. The weight allocation results show that A9 and A10 have the highest importance in LCD, indicating that science and technology expenditure and research personnel are key differentiating factors for low-carbon transition in the MRYRUA. This result is consistent with the role of technological innovation in improving energy efficiency, environmental governance, and green industrial transformation. B4 has the highest importance for IULU, highlighting that the utilization rate of urban construction land is the most direct factor distinguishing intensive from extensive land use in the study area (Figure 2). Because entropy weighting is data-driven, these weights mainly reflect the degree of cross-city and temporal variation in the selected indicators and should not be interpreted as fixed normative weights. The evaluation value for each index layer was calculated using a linear weighting method.
Figure 2.
Weighting of LCD (a) and IULU (b) evaluation indicators.
2.3.2. Methods for Analyzing the Relationship Between LCD and IULU
- (1)
- Coupling-coordination-degree model
The degree of coupling is used to describe the degree of mutual influence and coordination between the subsystems in a system [45]. In this study, it was used to reflect the strength of the interconnection between the LCD and IULU systems. The coupling degree equation is as follows:
where C is the coupling degree value, and its range is (0, 1]. A larger value of C corresponds to a higher degree of coupling between the two systems (Table 1). S1 and S2 denote the evaluation values of LCD and IULU, respectively. The adjustment coefficient k is determined by the number of subsystems. Since this study includes two subsystems, namely LCD and IULU, k is set to 2. α and β are undetermined coefficients, and α + β = 1. Because LCD and IULU are considered equally important subsystems for sustainable urban development, α = β = 0.5 in this study.
Table 1.
Evaluation criteria of coupling degree.
The coupling degree (C) reflects the strength of interaction between LCD and IULU, but it does not indicate whether the two systems are developing at a high or low level. For example, two subsystems with similarly low development levels may still show a high coupling degree. Therefore, this study also uses the coupling-coordination degree D to evaluate whether the interaction occurs on the basis of balanced and improved development. In other words, C measures interaction intensity, whereas D measures coordinated-development quality by combining the coupling degree with the comprehensive development level of the two systems. The formula is as follows:
where D is the coupling-coordination degree and its value range is (0, 1]. The larger the value of D, the higher the coordinated development of the two systems. The evaluation criteria in Table 2 are adapted from commonly used coupling-coordination studies [45] and adjusted to the distribution of the present sample so that disorder, transitional coordination, and high-quality coordination can be distinguished clearly. These thresholds are used for comparative classification rather than as absolute policy standards.
Table 2.
Evaluation criteria of coupling coordination degree.
- (2)
- Relative-development-degree model
The relative-development-degree model can be used to evaluate the relative development status of LCD and IULU. The formula is as follows:
where E represents the relative degree of development, and S1 and S2 represent the evaluation values of the LCD and IULU, respectively.
The evaluation criteria of relative development degree are shown in Table 3.
Table 3.
Evaluation criteria of relative degree of development.
2.3.3. Coefficient of Variation
The coefficient of variation (CV) is a dimensionless statistical measure that quantifies the relative variability of a dataset, which is defined as the ratio of the standard deviation (SD) to the mean (μ) of the dataset, expressed as a percentage. Mathematically, it can be formulated as follows:
where SD represents the degree of dispersion of individual data points around the mean, and μ denotes the arithmetic mean of the dataset. A higher CV value indicates higher variability and lower consistency.
3. Results
3.1. The Dynamic of LCD in MRYRUA
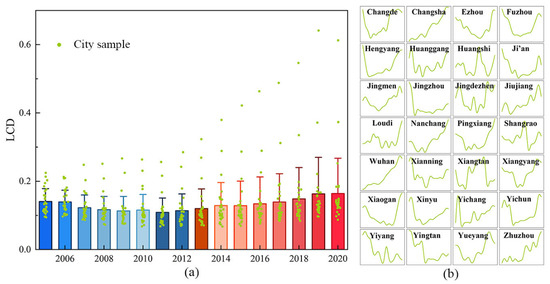
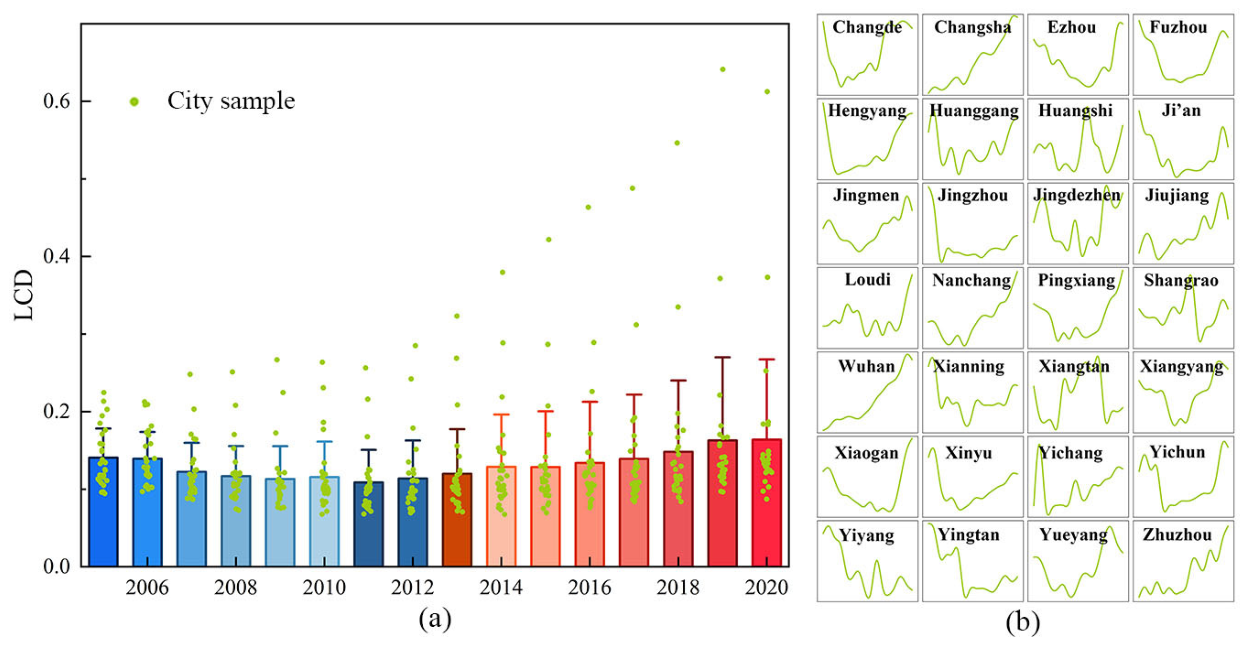
The evaluation of LCD reveals a distinct U-shaped trajectory at the regional level (Figure 3). The average LCD initially declined from 0.141 in 2005, reaching a trough of 0.109 in 2011, before embarking on a sustained recovery to 0.164 by 2020. This U-shaped pattern was not only observed for the region as a whole but was also the predominant trend for the majority of its constituent cities, which may be related to the gradual strengthening of low-carbon-transition policies and environmental governance during the later stage.
Figure 3.
LCD changes in the MRYRUA from 2005 to 2020. (a) Bar chart of LCD in MRYRUA; (b) Evolution of LCD in each city.
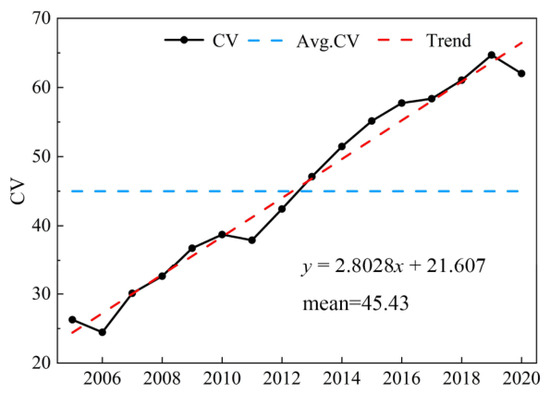
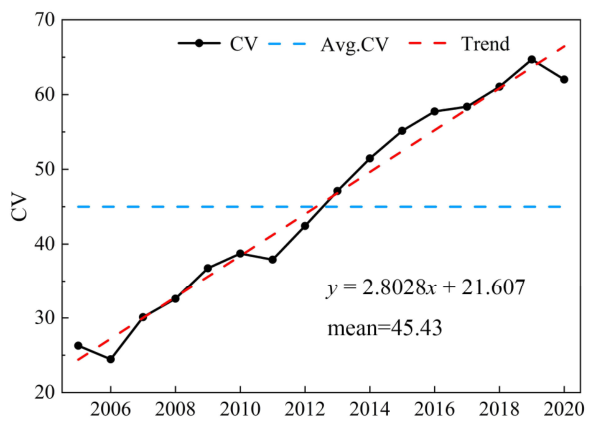
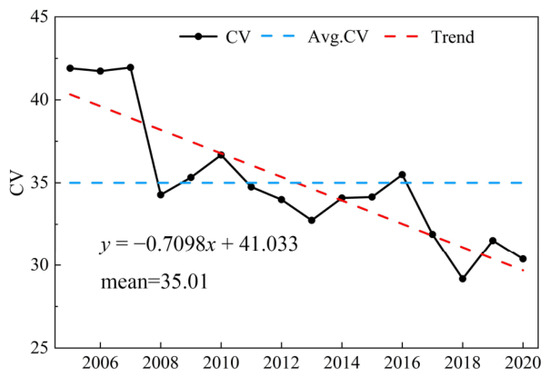
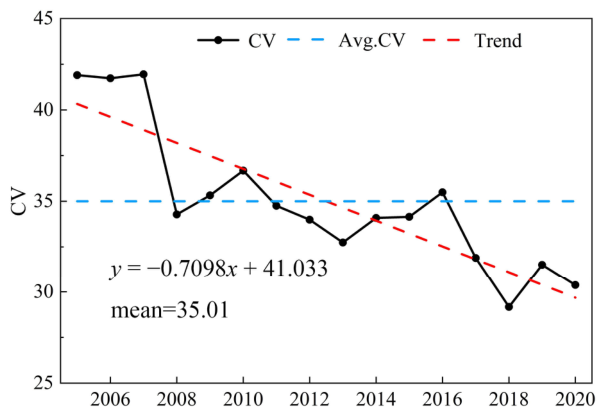
Despite this common U-shaped pattern, significant disparities persisted among cities. A few, notably the provincial capitals Wuhan and Changsha, along with Nanchang, exhibited a fluctuating yet overall upward trajectory throughout the entire period. This divergence led to a widening gap among cities over time. Specifically, the CV of LCD shows a sustained upward trend (Figure 4). It was 0.27 in 2005 and surged to 0.63 by 2020.
Figure 4.
CV of LCD in the MRYRUA from 2005 to 2020.
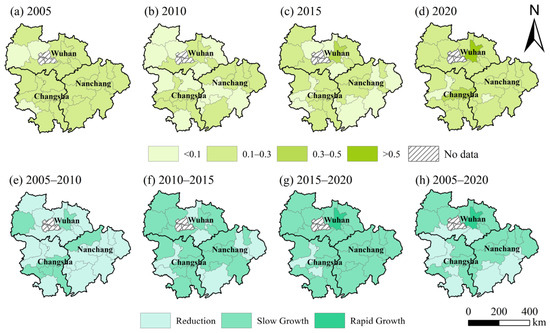
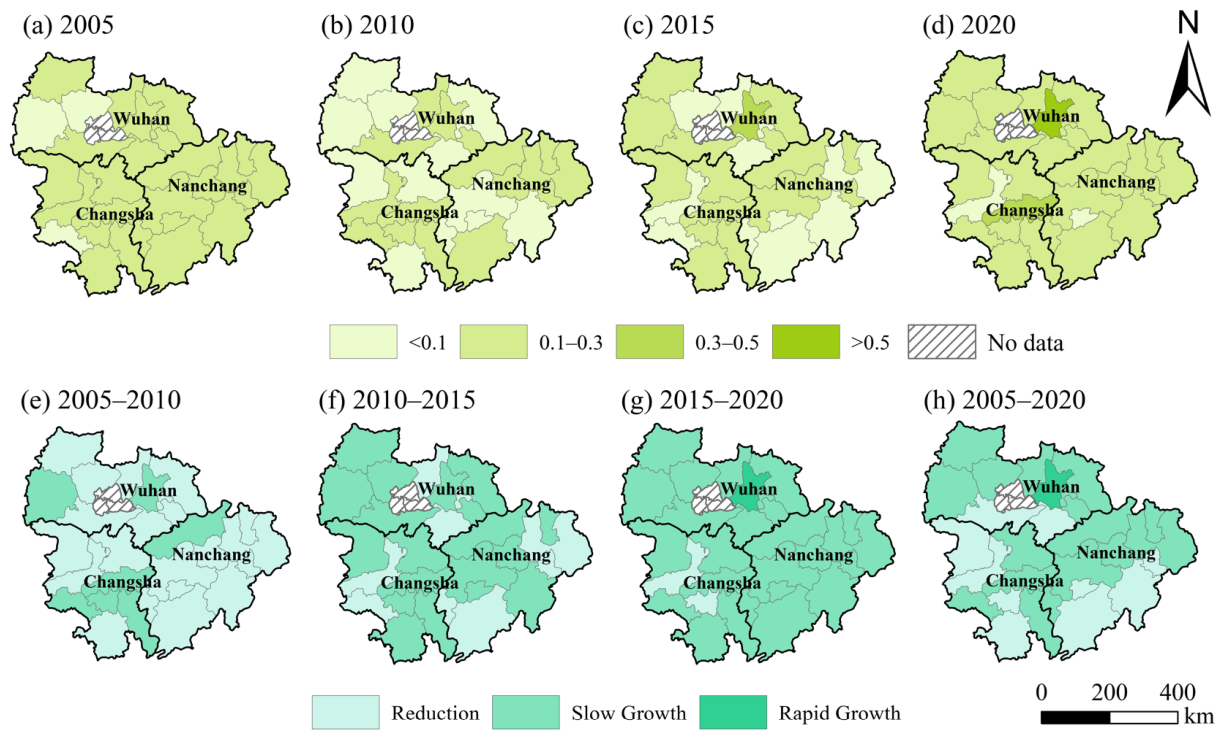
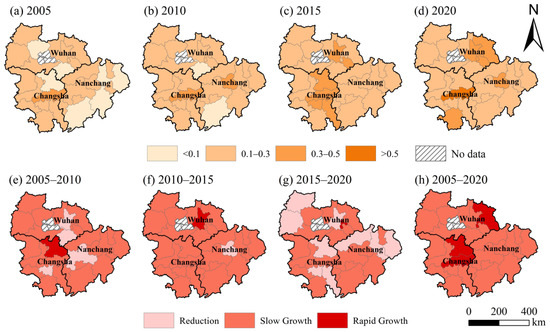
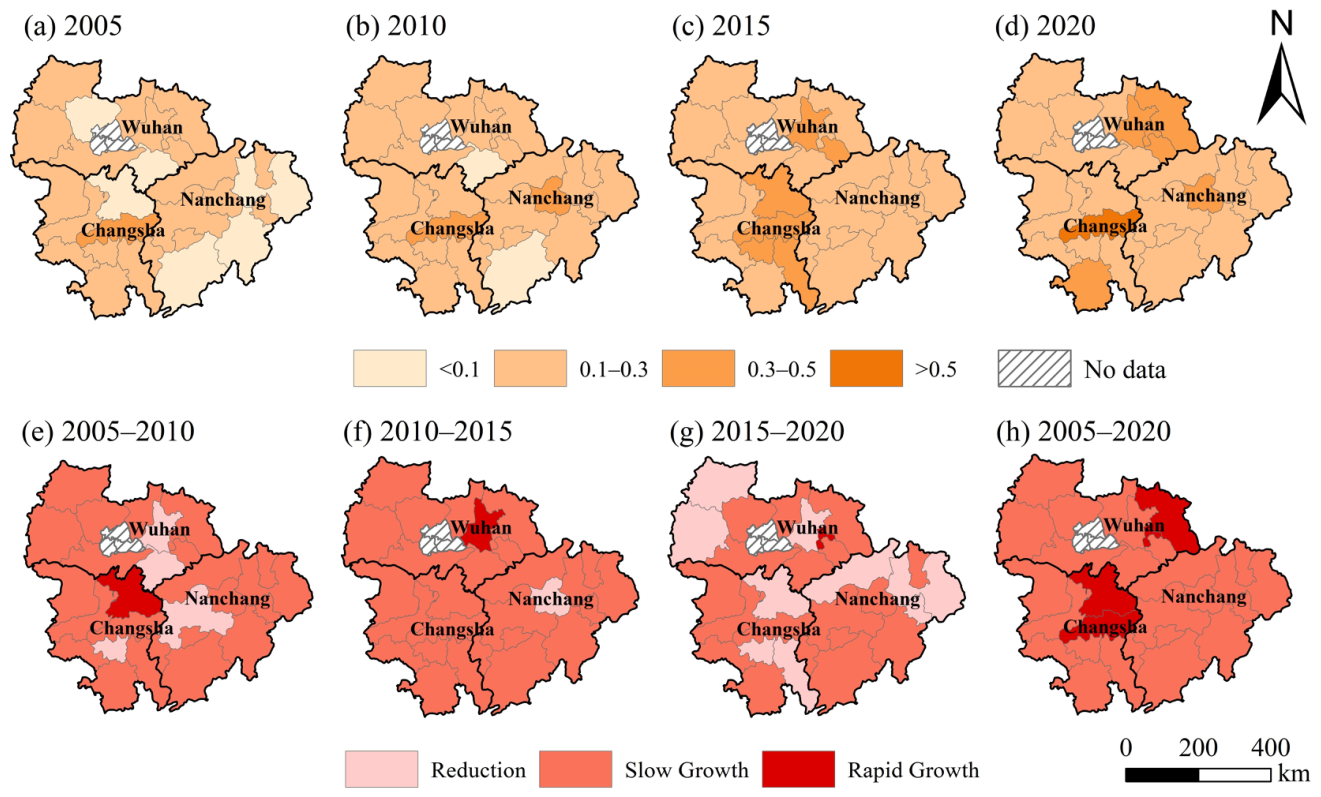
Spatially, high-LCD cities were concentrated in the northeast and southwest (Figure 5). Wuhan and Changsha stood out, with their LCDs rising from 0.185 to 0.613 and from 0.195 to 0.373, respectively, between 2005 and 2020. Although the LCD has shown a positive trend in most cities, some cities, such as Yingtan and Shangrao, experienced declining trends even during the recovery phase. This underscores the need for more targeted and coordinated policy implementation across the region.
Figure 5.
LCD levels of MRYRUA in China from 2005 to 2020, and changes.
3.2. The Dynamic of IULU in MRYRUA
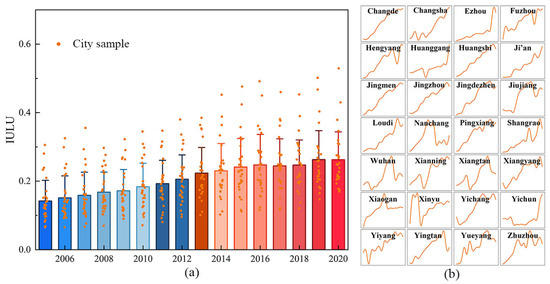
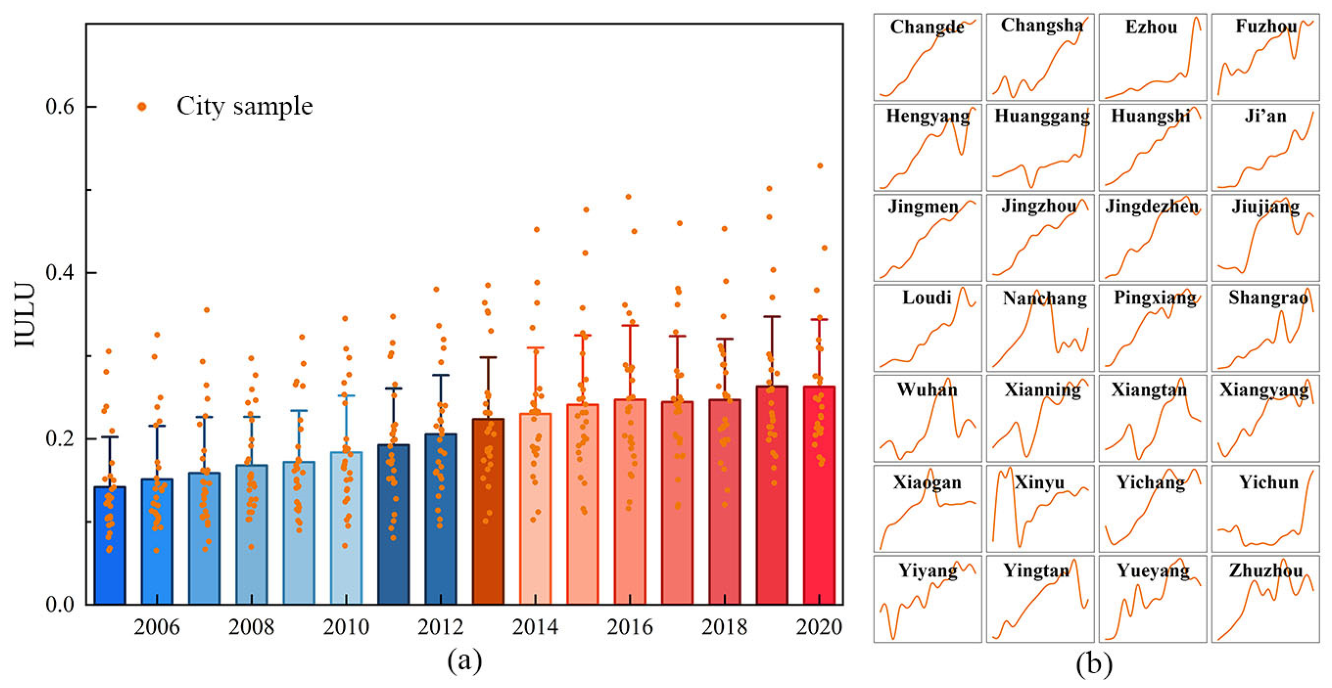
From 2005 to 2020, the average IULU value in the MRYRUA cities was consistently below 0.3, indicating the extensive use of urban land in this area (Figure 6). However, coinciding with China’s ecological civilization strategy and the policy orientation toward economical and intensive land use, the IULU has increased against the background of rapid urban land expansion in the MRYRUA. The increased IULU in process in the MRYRUA can be broadly divided into two stages, that is, the rapid growth stage before 2015 and the stable stage after 2015. In the first stage, the average IULU increased from 0.14 to 0.24, with an average annual growth of 0.9%. In the second stage, the average IULU was consistently around 0.25.
Figure 6.
IULU in the MRYRUA from 2005 to 2020. (a) Bar chart of IULU in MRYRUA; (b) Evolution of IULU in each city.
Figure 7 shows the spatial pattern of IULU. Cities with high IULU levels show a significant regional agglomeration feature, mainly concentrating in areas with a relatively high urbanization level. Among them, the IULU levels of the Wuhan Metropolitan and the Changsha-Zhuzhou-Xiangtan Urban Agglomeration are prominent, significantly higher than those of other regions, especially higher than the cities in the southeast with relatively underdeveloped economic development and infrastructure construction, such as Fuzhou, Ji’an and Yichun. Similar to the distribution pattern of LCD, the IULU levels of provincial capital cities are generally relatively high. Taking Wuhan, a core provincial capital city, as an example, its IULU level increased steadily from 0.281 to 0.346 during 2005–2020, showing a continuous growth trend (Figure 6).
Figure 7.
Spatial distribution of IULU in MRYRUA from 2005 to 2020.
From the perspective of regional balance, the CV of IULU levels among cities shows a gradual downward trend, indicating that the gap in IULU among different cities is constantly narrowing (Figure 8). However, it should be noted that, affected by factors such as differences in urban-development stages, the problem of unbalanced IULU development in the region still exists objectively. In the follow-up, targeted policy adjustments and controls are needed in the MRYRUA.
Figure 8.
CV of IULU in the MRYRUA from 2005 to 2020.
3.3. Coupling Relationship Between LCD and IULU
3.3.1. Coupling Degree Between LCD and IULU
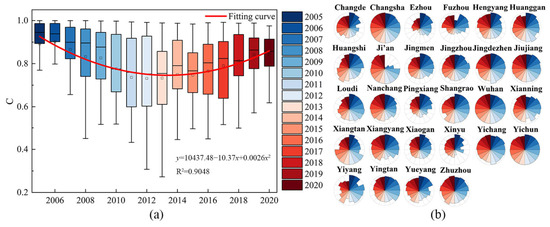
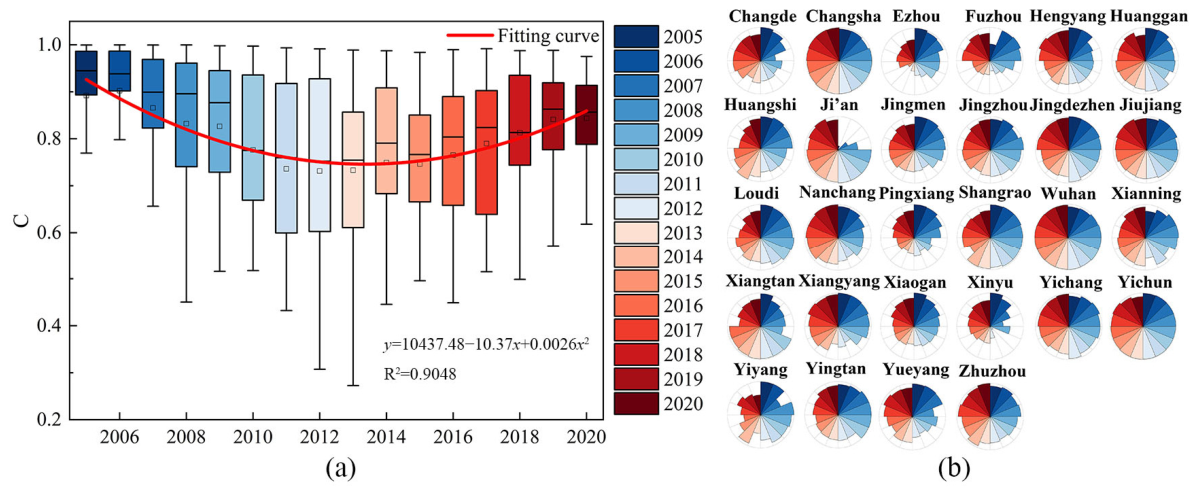
The coupling degree between LCD and IULU in the MRYRUA exhibited a clear U-shaped trajectory (Figure 9). The average coupling degree declined from 0.89 in 2005 to 0.73 in 2013, before increasing to 0.84 in 2020. To further verify whether this U-shaped pattern was statistically supported, we conducted additional tests using quadratic trend modeling and piecewise regression. The quadratic trend model showed a high goodness of fit (R2 = 0.9048), indicating that the U-shaped trajectory was statistically robust. The estimated turning point occurred around 2013. This transition was further confirmed by the piecewise regression results. When 2013 was used as the breakpoint, the slope before 2013 was significantly negative (−0.0238), whereas the slope after 2013 was significantly positive (0.0187). The change in slope was also statistically significant, indicating a structural shift in the evolution of the coupling degree.
Figure 9.
Coupling degree between LCD and IULU in the MRYRUA in China from 2005 to 2020. (a) Boxplot of coupling degree in MRYRUA; (b) Evolution of coupling degree in each city.
This timing coincides with the elevation of ecological civilization construction to a national strategy, which strengthened environmental regulation, resource-use control, and low-carbon governance. However, because this study did not directly include institutional variables or identify causal policy effects, the policy interpretation should be regarded as contextual rather than causal. Moreover, because the coupling degree remained within the high-coupling interval throughout the study period, this shift should not be interpreted as complete decoupling. Rather, it reflects a relative weakening of the interaction between LCD and IULU during 2005–2013, followed by a process of policy-driven recoupling after 2013. The early decline suggests that rapid land development and infrastructure expansion were not matched by equivalent improvements in low-carbon development. The subsequent increase indicates that ecological civilization policies, green innovation, and stricter land-use regulation gradually reinforced the linkage between the two systems.
3.3.2. Coordination Degree Between LCD and IULU
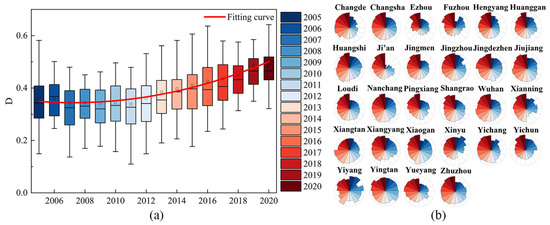
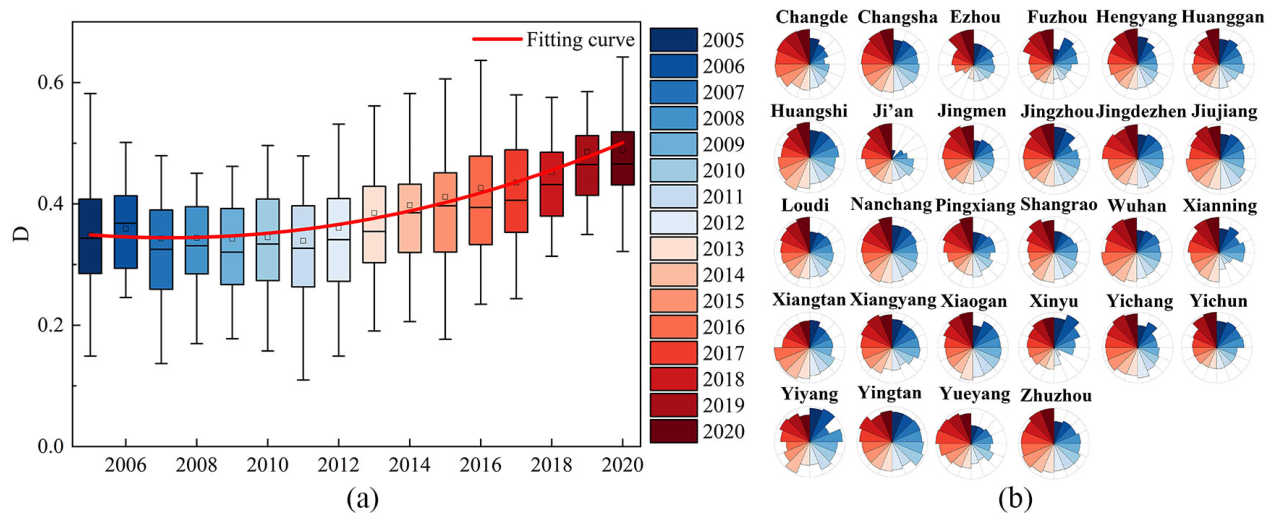
Regarding the degree of coordination, most cities in the MRYRUA were below 0.4 and belonged to the mild disorder level. This indicates that although LCD and IULU were strongly connected, their coordinated-development quality remained insufficient. A few cities had coordination degrees larger than 0.5, indicating that they had reached a relatively better coordination level and could provide examples for other cities (Figure 10).
Figure 10.
Coordination of LCD and IULU in the MRYRUA in China from 2005 to 2020. (a) Boxplot of coordination degree in MRYRUA; (b) Evolution of coordination degree in each city.
Notably, the coordination degree showed a significant positive trend during the study period. The average coordination degree increased from 0.35 in 2005 to 0.49 in 2020. This pattern differs from the U-shaped coupling degree. The reason is that C measures the relative strength of interaction between two subsystems, whereas D also incorporates the comprehensive development level. Therefore, even when the interaction intensity weakened before 2013, continuous improvement in IULU and later recovery in LCD could still raise the overall coordination degree. This result indicates that the relationship between C and D is not simply linear and that policy evaluation should consider both indicators simultaneously.
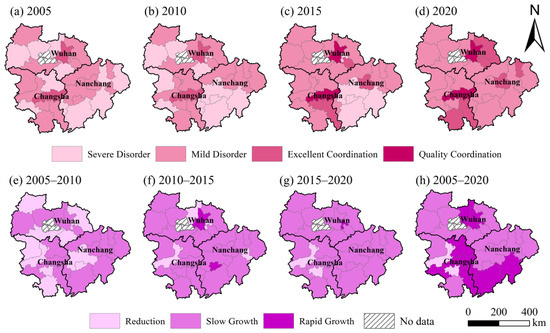
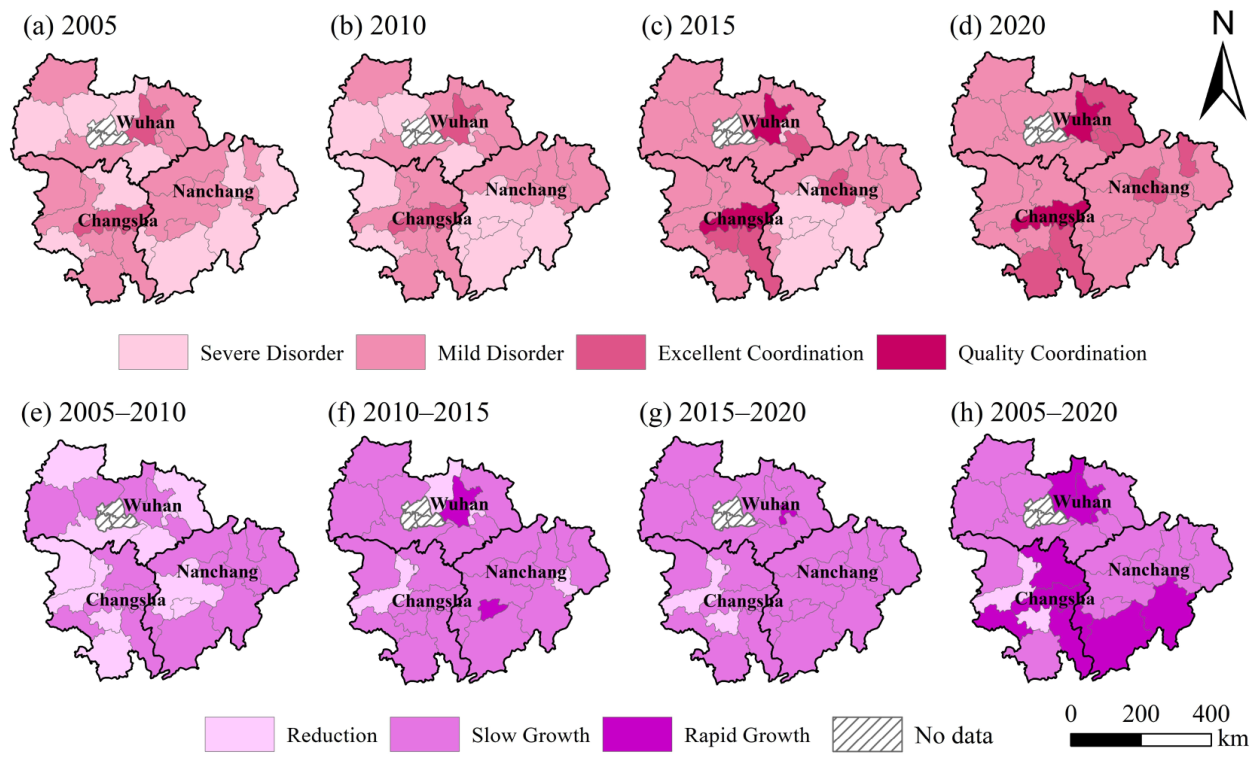
The spatial pattern of the coupling-coordination degree indicates that regions with a higher level of urbanization tend to have a higher coupling-coordination degree. Specifically, Wuhan, Changsha, Nanchang, and their surrounding cities exhibit a relatively higher level of coupling coordination. This confirms the positive impact of urbanization on both dimensions. In 2005, most cities were at a disorder level except for Wuhan and Changsha. In 2020, the number of cities with severe disorders decreased to 0. Moreover, we observed slow growth in the degree of coordination of cities in the MRYRUA. This indicates that LCD and IULU development still need to be improved, especially in cities with less economic development (Figure 11).
Figure 11.
Spatial distribution of coordination type in MRYRUA.
3.4. Relative Degree Between IULU and LCD
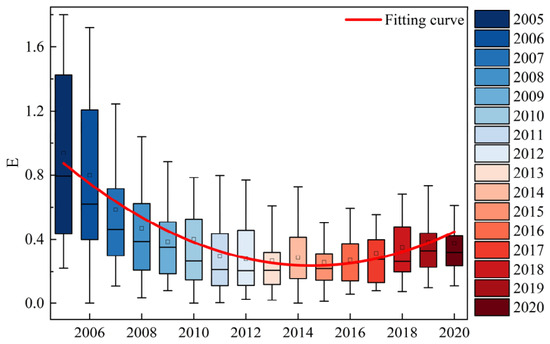
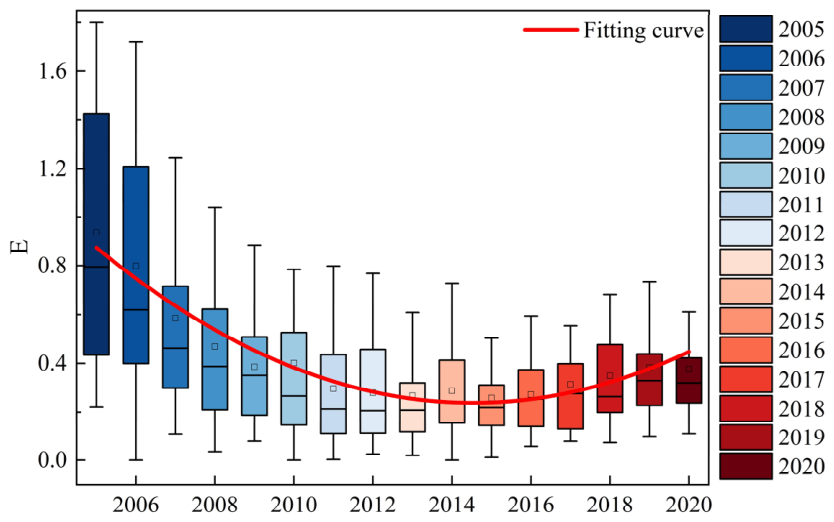
The average value of the relative development degree between LCD and IULU from 2005 to 2020 was below 0.8, indicating that LCD lagged behind IULU in the MRYRUA. The relative development degree also showed a U-shaped trend (Figure 12). It decreased from 2005 to 2015 and then increased from 2015 to 2020. This means that the lag of LCD was initially exacerbated and then gradually alleviated. During 2010–2015, rapid urban expansion and infrastructure construction promoted IULU, while low-carbon technological capacity and cleaner industrial transformation improved more slowly. After 2015, the improvement of the relative development degree may be related to a series of low-carbon and ecological civilization policies that promoted clean energy use, industrial energy-efficiency improvement, environmental governance, and green innovation [46]. Therefore, the overall coupling-coordination degree could continue to rise even while LCD remained relatively lagging: both systems improved, but the pace of IULU improvement was faster in the early stage, and LCD gradually caught up later.
Figure 12.
Relative development levels in the MRYRUA from 2005 to 2020.
4. Discussion
4.1. The Transition Mechanism of the Relationship Between LCD and IULU in MRYRUA
The relatively low but overall increasing levels of LCD and IULU indicate that the MRYRUA was still in an early stage of coordinated low-carbon and intensive land-use development. The observed U-shaped coupling trajectory can be understood within China’s evolving policy and urbanization context [47,48]. During 2005–2013, rapid industrialization, infrastructure investment, and construction-land expansion promoted land-use intensity through higher economic output, population concentration, and infrastructure density [49]. However, LCD improved more slowly because industrial upgrading, energy restructuring, technological innovation, and carbon-emission control had not yet become dominant drivers of urban development. Although the strictest farmland protection system constrained the scale and boundary of land conversion, it mainly functioned as a land-use control instrument and had not yet been fully integrated with low-carbon governance. This policy and functional mismatch may help explain the weakened interaction between LCD and IULU that formed the declining segment of the U-shaped trajectory.
After 2013, the elevation of ecological civilization construction to a national strategy may have gradually changed the institutional environment of urban development. Environmental regulation, resource-use control, low-carbon-pilot-city policies, and innovation-driven development gradually strengthened the links among industrial upgrading, energy efficiency, green transport, environmental infrastructure, and compact land use [50,51,52]. At the same time, the strictest farmland-protection system, together with strengthened land-use regulation and economical and intensive land-use policies, increased constraints on extensive construction-land expansion and encouraged more efficient redevelopment, compact spatial organization, and higher land-use efficiency. These policy adjustments gradually transformed IULU from a land-output-oriented process into a more resource- and environment-constrained development process. The timing of these changes coincides with the observed shift from relative weakening to recoupling in the LCD–IULU relationship. This transition is reflected in the recovery of LCD, the continuous improvement of coupling coordination, and the narrowing of the relative-development gap after 2015. These findings suggest that, in rapidly urbanizing regions, land-management and environmental policies may initially operate in parallel, but can become increasingly synergistic when ecological civilization, low-carbon governance, and intensive land-use regulation are jointly embedded in urban-development strategies.
We also found that, unlike the U-shaped variation pattern of C, D shows a sustained upward trend. This suggests that a weakening interaction intensity does not necessarily imply a deterioration in coordination quality; therefore, policymakers should evaluate both indicators simultaneously. Cities in the declining phase require early warning and stronger low-carbon constraints, whereas those in the rising phase should further consolidate recoupling through integrated land-use and carbon-reduction policies.
4.2. Spatial Heterogeneity of the Relationship Between LCD and IULU
There is an uncoordinated relationship between LCD and IULU in the MRYRUA, dominated by LCD lag. At an early stage of urban development, the economy generally relies heavily on the significant consumption of resources, leading to a low level of LCD [52]. This also directly leads to an uncoordinated link between the LCD and IULU. Differences in the economy and infrastructure lead to spatial variations in the uncoordinated relationship between cities [53,54]. The spatial gap between provincial capitals and non-provincial cities can be explained through four mechanisms. First, provincial capitals have stronger fiscal capacity and can invest more continuously in public transport, environmental infrastructure, green technology, and urban renewal, which improves both LCD and IULU [55]. Second, technology diffusion is uneven. Wuhan, Changsha, and Nanchang concentrate universities, research institutes, high-tech enterprises, and skilled labor, making it easier to transform innovation resources into low-carbon industries and energy-efficiency improvements [56]. Third, policy-implementation capacity differs across cities. Provincial capitals usually receive earlier policy pilots and have stronger administrative coordination, while smaller cities face constraints in project financing, cross-department coordination, and monitoring [57,58]. Fourth, industrial absorption capacity varies. Core cities can absorb producer services, digital industries, and green manufacturing, whereas some non-provincial cities remain more dependent on resource-intensive or construction-led growth [59]. These mechanisms jointly explain why provincial capitals show advantages in both LCD and IULU and why the LCD gap continued to widen even though IULU became more balanced at the regional level.
Beyond the core-periphery differences described above, the spatial maps also suggest the possibility of spatial diffusion in LCD and IULU. Core cities may influence surrounding cities through transport corridors, industrial linkages, technology transfer, cross-city environmental governance, and regional land-use coordination. For example, improvements in public transport networks, green infrastructure, and innovation capacity in Wuhan, Changsha, and Nanchang may create spillover opportunities for nearby cities, while peripheral cities may also face dependence on the industrial restructuring and policy diffusion of these core areas.
4.3. Policy Implications
China has entered a stage of high-quality development, and its economy is undergoing a transition toward a green development paradigm. Against this background, the findings of this study offer important policy implications for promoting the coordinated advancement of low-carbon development (LCD) and intensive urban land use (IULU). Specifically, the MRYRUA still faces challenges of inadequate and uncoordinated LCD–IULU development, which are mainly reflected in three empirical findings: the lag of LCD behind IULU, the U-shaped trajectory of the coupling relationship, and the widening spatial gap between provincial capitals and non-provincial cities. Therefore, policy interventions should respond directly to these findings by improving low-carbon development capacity, strengthening the stage-specific coordination between LCD and IULU, and formulating differentiated governance strategies for provincial capitals and non-provincial cities.
- (1)
- Correcting LCD lag through land-use planning instruments. Because LCD lagged behind IULU for most of the study period, land planning should not only control construction-land scale but also directly incentivize low-carbon behavior. Cities can use floor-area-ratio incentives, mixed-use-development requirements, transit-oriented development, green-building standards, and ecological-space protection to connect land-development rights with carbon-reduction performance. Industrial land renewal should prioritize low-energy, low-emission, and high-value-added activities, thereby preventing intensive land use from becoming high-density carbon lock-in.
- (2)
- Establishing early-warning and reinforcement measures for different phases of the U-shaped trajectory. For cities in the declining phase of coupling, planning evaluation should monitor whether land-use intensification is being achieved at the cost of higher energy demand, construction emissions, or industrial carbon pressure. Early-warning indicators can include the LCD–IULU relative development degree, carbon-related infrastructure indicators, and changes in green-technology investment. For cities in the rising phase, policies should consolidate recoupling by integrating low-carbon pilot policies with urban renewal, public transport investment, compact spatial structure, and ecological restoration.
- (3)
- Narrowing spatial gaps through regional compensation and cooperation mechanisms. The widening gap between provincial capitals and non-provincial cities indicates that differentiated strategies are necessary. Provincial capitals should act as innovation and service hubs by exporting technology, management experience, and green-finance resources to surrounding cities. Non-provincial cities should receive targeted support through cross-city industrial cooperation, ecological compensation, carbon-credit mechanisms, and land-credit trading where institutionally feasible. Such mechanisms can help compensate cities that undertake ecological protection and farmland-preservation responsibilities while guiding them toward low-carbon and intensive land-use pathways.
4.4. Research Limitations
This study has several limitations. First, the LCD indicator system is constrained by the availability and comparability of prefecture-level data from 2005 to 2020. In this study, LCD measures low-carbon-development level or transition capacity rather than direct carbon emissions or carbon efficiency. Some indicators, such as real-estate investment, domestic water consumption, gas supply, and gas penetration, are proxy variables for carbon pressure, resource-use intensity, cleaner energy-service provision, and low-carbon-transition conditions. Although these proxies are theoretically meaningful, they cannot fully replace direct carbon-emission inventories, sectoral energy-consumption data, or carbon-productivity indicators. Indicators for photovoltaic power, wind power, and detailed industrial energy consumption were not available for all 28 cities across the full study period, and future research should integrate direct emission inventories and more detailed energy data when they become comparable. Second, the entropy-weighting method is sensitive to the sample structure, indicator dispersion, normalization procedure, and study period. Therefore, the weights obtained in this study mainly reflect relative variation in the present dataset. Future studies could conduct robustness checks using equal weights, principal-component analysis, the analytic hierarchy process, or combined weighting methods. Third, the coupling-coordination model and trend tests are useful for identifying interaction patterns but cannot by themselves establish causality. Because this study did not include institutional variables or a quasi-experimental design, the discussion of ecological civilization and low-carbon governance should be regarded as contextual interpretation rather than direct policy-effect identification. Future studies could combine panel econometric models, causal inference, breakpoint tests, or spatial spillover models to further test the mechanisms behind the U-shaped transition. Fourth, this study focuses on one rapidly urbanizing urban agglomeration in central China. Comparative studies across different urban agglomerations and international regions would help assess the generality of the findings.
5. Conclusions
In the context of rapid urbanization and low-carbon transition in the MRYRUA, this study examined the relationship between LCD and IULU from 2005 to 2020 within a sustainable development framework. The results show that LCD and IULU are strongly related but do not evolve in a simple linear manner. The coupling degree followed a U-shaped trajectory, decreasing from 2005 to 2013 and increasing after 2013, while the coupling-coordination degree continued to improve from 0.35 to 0.49. This indicates that the interaction intensity and coordinated-development quality of LCD and IULU should be evaluated together. The relative development degree further shows that LCD lagged behind IULU, although this lag gradually eased after 2015. Spatially, provincial capitals such as Wuhan, Changsha, and Nanchang performed better than many non-provincial cities, leading to a widening gap in low-carbon development capacity. Theoretically, the U-shaped relationship may suggest a conflict-then-coordination phase in the urbanization process of developing countries: land-use intensification and economic growth may initially outpace carbon-transition capacity, but integrated spatial planning, ecological civilization policies, and green innovation can gradually promote recoupling. The findings provide a scientific reference for integrating low-carbon goals into land-use governance and for designing differentiated strategies to achieve the SDGs in rapidly urbanizing regions.
Author Contributions
Conceptualization, Q.T. and S.Q.; methodology, Q.T. and J.C.; software, Q.T. and J.C.; validation, Q.T. and J.C.; formal analysis, Q.T.; investigation, J.C.; resources, Q.T., J.C. and X.C.; data curation, Q.T., J.C. and X.C.; writing—original draft preparation, Q.T. and J.C.; writing—review and editing, Q.T. and S.Q.; visualization, Q.T., J.C. and X.C.; supervision, S.Q.; project administration, S.Q.; and funding acquisition, S.Q. All authors have read and agreed to the published version of the manuscript.
Funding
This research was funded by the National Natural Science Foundation of China, grant number 42101217.
Data Availability Statement
The original contributions presented in the study are included in the article. Further inquiries can be directed to the corresponding author.
Conflicts of Interest
The authors declare no conflicts of interest.
Abbreviations
The following abbreviations are used in this manuscript:
| MRYRUA | Middle Reaches of the Yangtze River Urban Agglomeration |
| LCD | Low-carbon development |
| IULU | Intensive urban land use |
| CV | Coefficient of Variation |
References
- IPCC. Climate Change 2023: Synthesis Report. In Contribution of Working Groups I, II and III to the Sixth Assessment Report of the Intergovernmental Panel on Climate Change; Core Writing Team, Lee, H., Romero, J., Eds.; IPCC: Geneva, Switzerland, 2023; 184p. [Google Scholar] [CrossRef] [Scilit]
- Wang, H.N.; Tang, L.N.; Qiu, Q.Y.; Chen, H.X. Assessing the Impacts of Urban Expansion on Habitat Quality by Combining the Concepts of Land Use, Landscape, and Habitat in Two Urban Agglomerations in China. Sustainability 2020, 12, 4346. [Google Scholar] [CrossRef] [Scilit]
- Li, X.Y.; Lu, Z.H. Quantitative measurement on urbanization development level in urban Agglomerations: A case of JJJ urban agglomeration. Ecol. Indic. 2021, 133, 12. [Google Scholar] [CrossRef] [Scilit]
- Pan, J.; Chen, X.; Luo, X.; Zeng, X.; Liu, Z.; Lai, W.; Xu, Y.; Lu, C. Analysis of the impact of China’s energy industry on social development from the perspective of low-carbon policy. Energy Rep. 2022, 8, 14–27. [Google Scholar] [CrossRef] [Scilit]
- Yang, X.; Liu, X. Path analysis and mediating effects of influencing factors of land use carbon emissions in Chang-Zhu-Tan urban agglomeration. Technol. Forecast. Soc. Change 2023, 188, 122268. [Google Scholar] [CrossRef] [Scilit]
- Wang, Q.; Yang, C.-h.; Wang, M.-l.; Zhao, L.; Zhao, Y.-c.; Zhang, Q.-p.; Zhang, C.-y. Decoupling analysis to assess the impact of land use patterns on carbon emissions: A case study in the Yellow River Delta efficient eco-economic zone, China. J. Clean. Prod. 2023, 412, 137415. [Google Scholar] [CrossRef] [Scilit]
- Adam, A.R.; Takyi, S.A.; Amponsah, O.; Kyei, K.O.B. Rethinking sustainable urban management: Effects of urbanization on the socio-spatial structure of the Tamale Metropolis. Urban Gov. 2023, 3, 292–303. [Google Scholar] [CrossRef] [Scilit]
- Ruan, L.; He, T.; Xiao, W.; Chen, W.; Lu, D.; Liu, S. Measuring the coupling of built-up land intensity and use efficiency: An example of the Yangtze River Delta urban agglomeration. Sustain. Cities Soc. 2022, 87, 104224. [Google Scholar] [CrossRef] [Scilit]
- Luo, L.; Wang, Y.; Liu, Y.; Zhang, X.; Fang, X. Where is the pathway to sustainable urban development? Coupling coordination evaluation and configuration analysis between low-carbon development and eco-environment: A case study of the Yellow River Basin, China. Ecol. Indic. 2022, 144, 109473. [Google Scholar] [CrossRef] [Scilit]
- Peng, K.; Feng, K.; Chen, B.; Shan, Y.; Zhang, N.; Wang, P.; Fang, K.; Bai, Y.; Zou, X.; Wei, W.; et al. The global power sector’s low-carbon transition may enhance sustainable development goal achievement. Nat. Commun. 2023, 14, 3144. [Google Scholar] [CrossRef] [Scilit] [PubMed]
- Albaker, A.; Abbasi, K.R.; Haddad, A.M.; Radulescu, M.; Manescu, C.; Bondac, G.T. Analyzing the Impact of Renewable Energy and Green Innovation on Carbon Emissions in the MENA Region. Energies 2023, 16, 6053. [Google Scholar] [CrossRef] [Scilit]
- Zhao, C.; Dong, K.; Wang, K.; Taghizadeh-Hesary, F. How can Chinese cities escape from carbon lock-in? The role of low-carbon city policy. Urban Clim. 2023, 51, 101629. [Google Scholar] [CrossRef] [Scilit]
- Peskett, L.; Metzger, M.J.; Blackstock, K. Regional scale integrated land use planning to meet multiple objectives: Good in theory but challenging in practice. Environ. Sci. Policy 2023, 147, 292–304. [Google Scholar] [CrossRef] [Scilit]
- Webb, J.; van der Horst, D. Understanding policy divergence after United Kingdom devolution: Strategic action fields in Scottish energy efficiency policy. Energy Res. Soc. Sci. 2021, 78, 102121. [Google Scholar] [CrossRef] [Scilit]
- Zhao, Z.-Y.; Gao, L.; Zuo, J. How national policies facilitate low carbon city development: A China study. J. Clean. Prod. 2019, 234, 743–754. [Google Scholar] [CrossRef] [Scilit]
- Wang, Z.; Liang, F.; Li, C.; Xiong, W.; Chen, Y.; Xie, F. Does China’s low-carbon city pilot policy promote green development? Evidence from the digital industry. J. Innov. Knowl. 2023, 8, 100339. [Google Scholar] [CrossRef] [Scilit]
- Cai, B.; Geng, Y.; Yang, W.; Yan, P.; Chen, Q.; Li, D.; Cao, L. How scholars and the public perceive a “low carbon city” in China. J. Clean. Prod. 2017, 149, 502–510. [Google Scholar] [CrossRef] [Scilit]
- Shen, Y.-S.; Lin, Y.-C.; Cheah, W.; Lin, J.; Xu, L.; Li, Y. Influences and pathways of urban form and lifestyle on carbon emission reduction. Urban Clim. 2022, 46, 101325. [Google Scholar] [CrossRef] [Scilit]
- Nie, Y.; Zhang, G.; Duan, H.; Su, B.; Feng, Y.; Zhang, K.; Gao, X. Trends in energy policy coordination research on supporting low-carbon energy development. Environ. Impact Assess. Rev. 2022, 97, 106903. [Google Scholar] [CrossRef] [Scilit]
- Shang, Y.; Xu, J.; Zhao, X. Urban intensive land use and enterprise emission reduction: New micro-evidence from China towards COP26 targets. Resour. Policy 2022, 79, 103158. [Google Scholar] [CrossRef] [Scilit]
- Kazemi, F.; Hosseinpour, N. GIS-based land-use suitability analysis for urban agriculture development based on pollution distributions. Land Use Policy 2022, 123, 106426. [Google Scholar] [CrossRef] [Scilit]
- Lv, H.; Wu, Z.; Guan, X.; Meng, Y.; Wang, H.; Zhou, Y. Threshold effect of data amount and grid size on urban land use type identification using multi-source data fusion. Sustain. Cities Soc. 2023, 98, 104855. [Google Scholar] [CrossRef] [Scilit]
- Tian, J.; Wang, B.; Zhang, C.; Li, W.; Wang, S. Mechanism of regional land use transition in underdeveloped areas of China: A case study of northeast China. Land Use Policy 2020, 94, 104538. [Google Scholar] [CrossRef] [Scilit]
- Liang, X.; Jin, X.; Sun, R.; Han, B.; Liu, J.; Zhou, Y. A typical phenomenon of cultivated land use in China’s economically developed areas: Anti-intensification in Jiangsu Province. Land Use Policy 2021, 102, 105223. [Google Scholar] [CrossRef] [Scilit]
- Tian, K.; Li, M.; Hu, W.; Fan, Y.n.; Huang, B.; Zhao, Y. Environmental capacity of heavy metals in intensive agricultural soils: Insights from geochemical baselines and source apportionment. Sci. Total Environ. 2022, 819, 153078. [Google Scholar] [CrossRef] [Scilit] [PubMed]
- Ma, S.; He, L.; Fang, Y.; Liu, X.; Fan, Y.; Wang, S. Intensive land management through policy intervention and spatiotemporal optimization can achieve carbon neutrality in advance. J. Clean. Prod. 2023, 385, 135635. [Google Scholar] [CrossRef] [Scilit]
- Zhang, S.; Zhang, J.; Sha, A.; Zhang, Y.; Zhang, D. How to recognize the role of policy clusters in built-up land intensity: An empirical case of the Yangtze River Economic Belt of China. Land Use Policy 2023, 134, 106909. [Google Scholar] [CrossRef] [Scilit]
- Cao, Y.; Kong, L.; Zhang, L.; Ouyang, Z. The balance between economic development and ecosystem service value in the process of land urbanization: A case study of China’s land urbanization from 2000 to 2015. Land Use Policy 2021, 108, 105536. [Google Scholar] [CrossRef] [Scilit]
- Cheng, Z.; Li, X.; Zhang, Q. Can new-type urbanization promote the green intensive use of land? J. Environ. Manag. 2023, 342, 118150. [Google Scholar] [CrossRef] [Scilit] [PubMed]
- Li, L.; Huang, X.; Yang, H. Optimizing land use patterns to improve the contribution of land use planning to carbon neutrality target. Land Use Policy 2023, 135, 106959. [Google Scholar] [CrossRef] [Scilit]
- Cao, B.; Meng, F.; Li, B. Spatial effects of innovation ecosystem development on low-carbon transition. Ecol. Indic. 2023, 157, 111277. [Google Scholar] [CrossRef] [Scilit]
- Ma, L.; Xu, W.; Zhang, W.; Ma, Y. Effect and mechanism of environmental regulation improving the urban land use eco-efficiency: Evidence from China. Ecol. Indic. 2024, 159, 111602. [Google Scholar] [CrossRef] [Scilit]
- Wang, B.; Oguchi, T.; Liang, X. Evaluating future habitat quality responding to land use change under different city compaction scenarios in Southern China. Cities 2023, 140, 104410. [Google Scholar] [CrossRef] [Scilit]
- Wang, Y.; Fan, H.; Wang, H.; Che, Y.; Wang, J.; Liao, Y.; Lv, S. High-carbon expansion or low-carbon intensive and mixed land-use? Recent observations from megacities in developing countries: A case study of Shanghai, China. J. Environ. Manag. 2023, 348, 119294. [Google Scholar] [CrossRef] [Scilit] [PubMed]
- Wei, L.; Zhou, L.; Sun, D.; Yuan, B.; Hu, F. Evaluating the impact of urban expansion on the habitat quality and constructing ecological security patterns: A case study of Jiziwan in the Yellow River Basin, China. Ecol. Indic. 2022, 145, 109544. [Google Scholar] [CrossRef] [Scilit]
- Zhang, M.; He, J.; Liu, D.; Huang, J.; Yue, Q.; Li, Y. Urban green corridor construction considering daily life circles: A case study of Wuhan city, China. Ecol. Eng. 2022, 184, 106786. [Google Scholar] [CrossRef] [Scilit]
- Qi, T.; Li, Y.; Huang, M.; Luo, B.; Peng, Z.; Wang, W.; Li, S.; Degen, A.A.; Shang, Z. Land intensification use scenarios based on urban land suitability assessment of the national park. Sust. Cities Soc. 2024, 102, 105229. [Google Scholar] [CrossRef] [Scilit]
- Qiu, M.; Liu, D. Assessing spatial heterogeneous response of ecosystem service relationships to land use intensification. Ecol. Indic. 2023, 154, 110721. [Google Scholar] [CrossRef] [Scilit]
- Zhang, L.; Wu, J.; Xu, Y.; Yeh, C.-H.; Zhou, P.; Fang, J. A data-driven approach to objective evaluation of urban low carbon development performance. J. Clean. Prod. 2022, 368, 133238. [Google Scholar] [CrossRef] [Scilit]
- Lan, J.; Li, Q.; Zheng, Y.; Liu, Z. The impact of the Low-Carbon City Pilots programme on industrial land transfer by local governments in China. Econ. Anal. Policy 2023, 77, 824–842. [Google Scholar] [CrossRef] [Scilit]
- Zhang, Q.; Li, J.; Li, Y.; Huang, H. Coupling analysis and driving factors between carbon emission intensity and high-quality economic development: Evidence from the Yellow River Basin, China. J. Clean. Prod. 2023, 423, 138831. [Google Scholar] [CrossRef] [Scilit]
- Lin, J.; Jacoby, J.; Cui, S.; Liu, Y.; Lin, T. A model for developing a target integrated low carbon city indicator system: The case of Xiamen, China. Ecol. Indic. 2014, 40, 51–57. [Google Scholar] [CrossRef] [Scilit]
- Wu, X.; Fu, B.; Wang, S.; Song, S.; Li, Y.; Xu, Z.; Wei, Y.; Liu, J. Decoupling of SDGs followed by re-coupling as sustainable development progresses. Nat. Sustain. 2022, 5, 452–459. [Google Scholar] [CrossRef] [Scilit]
- Wang, Y.; Feng, Y.; Zuo, J.; Rameezdeen, R. From “Traditional” to “Low carbon” urban land use: Evaluation and obstacle analysis. Sust. Cities Soc. 2019, 51, 101722. [Google Scholar] [CrossRef] [Scilit]
- Hui, E.C.M.; Wu, Y.; Deng, L.; Zheng, B. Analysis on coupling relationship of urban scale and intensive use of land in China. Cities 2015, 42, 63–69. [Google Scholar] [CrossRef] [Scilit]
- Han, B.; Jin, X.; Zhao, Q.; Chen, H. Spatiotemporal patterns and mechanisms of land-use conflicts affecting high-quality development in China. Appl. Geogr. 2023, 155, 102972. [Google Scholar] [CrossRef] [Scilit]
- Wang, N.; Chang, Y.-C. The evolution of low-carbon development strategies in China. Energy 2014, 68, 61–70. [Google Scholar] [CrossRef] [Scilit]
- Dai, X.; Wang, L.; Huang, C.; Fang, L.; Wang, S.; Wang, L. Spatio-temporal variations of ecosystem services in the urban agglomerations in the middle reaches of the Yangtze River, China. Ecol. Indic. 2020, 115, 106394. [Google Scholar] [CrossRef] [Scilit]
- Li, Z.; Luan, W.; Zhang, Z.; Su, M. Relationship between urban construction land expansion and population/economic growth in Liaoning Province, China. Land Use Policy 2020, 99, 105022. [Google Scholar] [CrossRef] [Scilit]
- Geng, Q.; Lo, K. Global ecological civilization: An analysis of macro-level policies of the Belt and Road Initiative. Res. Glob. 2023, 7, 100141. [Google Scholar] [CrossRef] [Scilit]
- Xu, L.; Wang, C.; Ba, N.; Hao, Y. On the urban resource and environment carrying capacity in China: A sustainable development paradigm. J. Environ. Manag. 2023, 342, 118212. [Google Scholar] [CrossRef] [Scilit] [PubMed]
- Tu, D.; Cai, Y.; Liu, M. Coupling coordination analysis and spatiotemporal heterogeneity between ecosystem services and new-type urbanization: A case study of the Yangtze River Economic Belt in China. Ecol. Indic. 2023, 154, 110535. [Google Scholar] [CrossRef] [Scilit]
- Song, Y.; Zhu, J.; Yue, Q.; Zhang, M.; Wang, L. Industrial agglomeration, technological innovation and air pollution: Empirical evidence from 277 prefecture-level cities in China. Struct. Change Econ. Dyn. 2023, 66, 240–252. [Google Scholar] [CrossRef] [Scilit]
- Wei, C.; Meng, J.; Zhu, L.; Han, Z. Assessing progress towards sustainable development goals for Chinese urban land use: A new cloud model approach. J. Environ. Manag. 2023, 326, 116826. [Google Scholar] [CrossRef] [Scilit] [PubMed]
- Chen, J.; Zhao, D.; He, B.; Stanojevic, S. How do fiscally created one-city monopolies cause intra-provincial inequality in China? Land Use Policy 2022, 120, 106228. [Google Scholar] [CrossRef] [Scilit]
- Zeng, J.; Ning, Z.; Lassala, C.; Ribeiro-Navarrete, S. Effect of innovative-city pilot policy on industry–university–research collaborative innovation. J. Bus. Res. 2023, 162, 113867. [Google Scholar] [CrossRef] [Scilit]
- Zhang, Z. China’s carbon market: Development, evaluation, coordination of local and national carbon markets, and common prosperity. J. Clim. Financ. 2022, 1, 100001. [Google Scholar] [CrossRef] [Scilit]
- Li, Y.; Zhang, X.; Xia, C. Towards a greening city: How does regional cooperation promote urban green space in the Guangdong-Hong Kong-Macau Greater Bay Area? Urban For. Urban Green. 2023, 86, 128033. [Google Scholar] [CrossRef] [Scilit]
- Di, K.; Chen, W.; Zhang, X.; Shi, Q.; Cai, Q.; Li, D.; Liu, C.; Di, Z. Regional unevenness and synergy of carbon emission reduction in China’s green low-carbon circular economy. J. Clean. Prod. 2023, 420, 138436. [Google Scholar] [CrossRef] [Scilit]

Disclaimer/Publisher’s Note: The statements, opinions and data contained in all publications are solely those of the individual author(s) and contributor(s) and not of MDPI and/or the editor(s). MDPI and/or the editor(s) disclaim responsibility for any injury to people or property resulting from any ideas, methods, instructions or products referred to in the content. |
© 2026 by the authors. Licensee MDPI, Basel, Switzerland. This article is an open access article distributed under the terms and conditions of the Creative Commons Attribution (CC BY) license.