


Abstract
Taking 563 national key rural tourism villages across 12 provinces, autonomous regions, and municipalities in western China as the research object, this study integrates multi-source data on physical geography, transportation location, socioeconomic conditions, and historical culture based on the ArcGIS platform. It comprehensively applies kernel density analysis, spatial autocorrelation analysis, buffer analysis, Spearman correlation analysis, Geodetector, and the relative enrichment index to examine the spatial distribution characteristics of these villages and their associated spatial factors. The results show that key rural tourism villages in western China exhibit an overall clustered and uneven distribution, forming a spatial pattern characterized by “high concentration in core areas, extension along secondary corridors, and sparse distribution across vast hinterlands.” The core agglomeration areas are mainly located in the Sichuan Basin, the Chongqing metropolitan area, and the Guanzhong Plain. In terms of physical geography, the distribution of key villages shows certain spatial associations with major river basins, low-slope areas, and low-relief terrain. In terms of human factors, population density and road network density are important associated factors, and the combined population–transportation conditions have strong explanatory power for the spatial differentiation of key village density. With regard to historical culture, folk-custom inheritance villages and red-culture heritage villages account for relatively high proportions, while different cultural types show certain regional agglomeration or corridor-like distribution characteristics. The findings can provide references for zoned optimization, transportation connectivity, cultural resource integration, and coordinated regional development of key rural tourism villages in western China.
1. Introduction
The Plan for the Development of Rural Industries in China (2020–2025) states that, by 2025, China’s rural tourism market should reach RMB 1.5 trillion and become an important pillar of the rural economy [1]. The 2026 No. 1 Central Document of the CPC Central Committee and the State Council further emphasizes the need to “deepen the integration of agriculture, culture, and tourism, and promote the upgrading of rural tourism,” thereby encouraging rural tourism to develop toward normalization and higher quality. Against this policy background, rural tourism, owing to its capacity to absorb employment, stimulate industrial linkages, and generate spatial spillover effects, has gradually become an important pathway for promoting rural industrial upgrading and coordinated regional development [2].To guide high-quality development, between 2019 and 2022, the Ministry of Culture and Tourism, together with the National Development and Reform Commission, selected four batches comprising 1399 national key rural tourism villages and 198 key rural tourism towns and townships, thereby establishing a hierarchical demonstration system.
However, national key rural tourism villages are not ordinary tourism resource sites; rather, they are demonstrative rural spatial units formed through the combined effects of policy selection, resource endowments, market accessibility, and local development capacity [3]. Whether their spatial distribution is balanced is directly related to the allocation of public resources for rural tourism, coordinated regional development, and the targeted implementation of rural revitalization policies.
For western China, examining this issue is particularly necessary. On the one hand, the region spans diverse geomorphic units, including the Qinghai–Tibet Plateau, the Yunnan–Guizhou Plateau, the Loess Plateau, the Sichuan Basin, and inland arid areas, resulting in pronounced differences in natural conditions. On the other hand, population density, transportation networks, economic foundations, and cultural resources are highly unevenly distributed within the region. These conditions may lead key rural tourism villages to cluster around a limited number of urban agglomerations, river valleys, and transportation corridors, while vast alpine, arid, and remote areas remain relatively sparse. Without a systematic identification of their spatial differentiation characteristics and associated factors, subsequent policy support, infrastructure construction, and cultural tourism resource integration may face spatial mismatches.
Western China is vast in territory and rich in resources. It is both a multi-ethnic settlement area and a region with relatively lagging development. With the continued advancement of the Western Development Strategy, regional development is shifting from poverty alleviation toward common prosperity. The 563 key rural tourism villages in western China possess notable advantages in ecological environment, cultural resources, and characteristic industries, and are undergoing a functional transition from single agricultural production toward the integrated functions of production, living, and ecology [4]. However, constrained by natural conditions and a relatively weak development foundation, western China still faces problems such as uneven spatial distribution, insufficient resource integration, and a low level of coordinated development. Systematic research is therefore urgently needed to provide decision-making support for the formulation of differentiated development strategies.
Spatial differentiation not only reflects resource endowments and locational conditions, but also reveals regional disparities in development [5]. Existing studies have shown that rural tourism and its related elements often exhibit evident spatial agglomeration and uneven distribution. The associated factors mainly include physical geographical conditions, transportation accessibility, and socioeconomic development, and relevant research has commonly relied on GIS-based spatial analysis and spatial statistical methods. However, most existing studies have focused on eastern China or on single administrative regions, while integrated cross-provincial analyses of western China remain relatively limited. Moreover, quantitative examination of the combined effects and interactions among multiple factors still needs to be strengthened.
On this basis, this study takes 563 national key rural tourism villages across 12 provinces, autonomous regions, and municipalities in western China as the research object. By comprehensively applying GIS-based spatial analysis, spatial autocorrelation analysis, buffer analysis, correlation analysis, and Geodetector, this study aims to address the following questions. First, what spatial distribution patterns do key rural tourism villages in western China exhibit at the provincial, prefecture-level, and village-point scales? Second, what spatial associations exist between their distribution and terrain and landforms, river-basin conditions, population density, economic level, transportation accessibility, and historical–cultural types? Third, how strong is the explanatory power of different natural and human factors for the spatial differentiation of key villages, and do interaction enhancement effects exist among these factors? Compared with existing studies, the marginal contributions of this study are mainly reflected in three aspects. First, in terms of the study area, this research takes the 12 provinces, autonomous regions, and municipalities of western China as an integrated research unit, thereby addressing the limitations of previous studies that have mainly focused on national-level macro patterns, eastern China, or single-province cases. Second, in terms of explanatory dimensions, this study incorporates physical geography, population and economy, transportation accessibility, and historical–cultural types into a unified analytical framework, identifying the compound associated factors of the spatial differentiation of key rural tourism villages in western China. Third, in terms of cultural attributes, this study codes the dominant cultural types of the 563 key villages, further revealing the regional agglomeration and corridor-like distribution characteristics of cultural resources, including folk-custom inheritance, red-culture heritage, ancient architecture and agricultural heritage, ancient trade-route heritage, and frontier garrison heritage. The findings can provide references for zoned guidance, resource integration, transportation connectivity, and coordinated regional development of key rural tourism villages in western China.
2. Literature Review
2.1. Research Progress on the Spatial Distribution of National Key Rural Tourism Villages
In recent years, rural tourism has become an important vehicle for promoting rural revitalization and integrated urban–rural development. Its spatial layout and regional differentiation have therefore become important topics in tourism geography and rural development studies. Research objects have gradually expanded from individual rural tourism sites, agritainment businesses, and traditional villages to more diverse spatial carriers, such as rural tourism destinations, characteristic rural tourism villages, and national key rural tourism villages [5]. Existing studies generally indicate that rural tourism spatial carriers are not evenly distributed, but instead show evident spatial agglomeration and regional differentiation.
In terms of research scale, previous studies have covered national-level macro patterns, cross-regional meso-scale analyses, and single-province case studies. National-scale studies help identify the overall distribution trends and regional disparities of key rural tourism villages, but they tend to obscure the complex internal differences in landforms, transportation conditions, and cultural resources within western China. Studies on eastern coastal and developed regions have paid greater attention to the effects of urban agglomerations, market accessibility, and transportation networks on the spatial layout of rural tourism. For example, studies of regions such as the Yangtze River Delta have shown that transportation conditions, economic foundations, and the agglomeration of tourism resources play important explanatory roles in the spatial distribution of rural tourism [6]. Meanwhile, single-province case studies, such as those on Henan, can reveal how physical geography, transportation location, and socioeconomic factors shape rural tourism spatial patterns at the local scale. However, their findings still have certain limitations when explaining the overall pattern of western China, which spans multiple geomorphic units, ethnic–cultural regions, and transportation corridors [7].
Overall, existing studies have explored the spatial distribution of rural tourism from the perspectives of national patterns, developed eastern regions, and single-province cases, and have generally found that rural tourism exhibits spatial agglomeration and regional imbalance. However, three limitations remain. First, existing research has mainly focused on national-level macro patterns or single provinces in eastern and central China, while insufficient attention has been paid to western China, where natural geographical conditions are complex, transportation accessibility varies greatly, and ethnic–cultural resources are highly concentrated. Second, some studies emphasize the description of spatial agglomeration, but provide insufficient discussion of the compound relationships among natural constraints, transportation accessibility, population markets, and cultural resources [8]. Third, previous research has often relied on spatial overlay analysis or single-factor correlation analysis, with limited consideration of variable collinearity, scale differences, and interactions among different factors. Therefore, it is necessary to take western China as an integrated study area and systematically analyze the spatial distribution of national key rural tourism villages and their associated factors.
2.2. Spatial Distribution of Key Rural Tourism Villages and Influencing Factors
The spatial differentiation of key rural tourism villages is the result of long-term and complex interactions between the natural geographical environment and the socioeconomic system.
Natural geographical conditions constitute an important foundation shaping the spatial distribution of rural tourism. Du et al. [7] pointed out that elevation, slope, and ecological environmental conditions significantly affect the accessibility and landscape attractiveness of tourism villages, with high-altitude areas usually exhibiting a spatial pattern of “local agglomeration and overall dispersion.” Meanwhile, areas with abundant ecological resources and high landscape heterogeneity are more likely to form tourism hotspot clusters. In their study of the spatial distribution of rural homestays in Beijing, Hei et al. [9] found that vegetation coverage and natural landscape resources are key factors influencing the spatial heterogeneity of rural tourism.
In terms of socioeconomic drivers, market accessibility and economic capacity serve as key forces for transforming resource endowments into tourism value. The empirical study by Feng et al. [10] showed that transportation network density significantly reduces tourists’ time costs, thereby inducing tourism-related elements to cluster in an “axis-belt” pattern along major transport corridors. Meanwhile, Yang et al. [11] argued that the growth of regional per capita GDP and the improvement of urbanization levels provide the necessary tourist-source support and capital feedback for rural tourism, becoming important driving forces for the transformation of villages from traditional residential and production functions toward leisure and consumption functions.
In addition, for western China, cultural resources are not only manifested as individual heritage sites, but also often form corridor-like or regionalized distributions along the Silk Road, the Tea Horse Road, red-culture routes, and ethnic settlement areas. Therefore, incorporating cultural types into spatial analysis helps explain cultural agglomeration phenomena that are difficult to account for using only natural and economic variables.
From the perspective of international research, rural tourism studies not only focus on resource distribution and spatial patterns, but also gradually attach importance to tourist satisfaction, sustainability, and regional development prospects. Taking rural tourism along the Danube River as an example, Boros and Korcsmáros pointed out that tourist satisfaction and sustainable development factors have important influences on the development prospects of rural tourism [12]. This indicates that research on the spatial layout of rural tourism should not remain only at the level of resource-site distribution, but also needs to be comprehensively understood in combination with regional development capacity, tourist experience, and sustainable utilization.
2.3. Application of Spatial Analysis Methods in Rural Tourism Research
With the increasing penetration of computational technologies and geographic information systems (GIS) into rural studies, spatial analysis in rural tourism research has shifted from early static and qualitative description toward multidimensional quantitative spatial measurement. In characterizing spatial patterns, scholars have widely employed tools such as the nearest neighbor index (NNI), kernel density estimation (KDE), and the geographic concentration index (GCI) to identify the agglomeration patterns of point-based elements. Yuan et al. [13] used these methods to reveal the hierarchical agglomeration patterns of tourism destinations at the macro scale and their evolutionary trends over time. In identifying spatial autocorrelation and heterogeneity, Fu et al. [14] applied global and local Moran’s I indices, including local indicators of spatial association (LISA), to accurately identify “cold spot” and “hot spot” areas of rural tourism development as well as contiguous agglomeration patterns across administrative boundaries, thereby providing a geographical basis for the formulation of regional coordinated development policies. In exploring driving mechanisms, the combination of multidimensional statistical models and spatial econometric models has become increasingly mainstream. The integrated application of these quantitative analytical tools enables rural tourism research to move beyond the limitations of a single scale, shifting from the description of surface-level spatial distributions to the logical interpretation of underlying mechanisms.
2.4. Limitations of Existing Spatial Research on Rural Tourism in Western China and the Focus of This Study
Western China is not only an ecological security barrier and a multi-ethnic cultural agglomeration area in China, but also one of the regions with the most complex types of rural tourism resources. Compared with the eastern plains and coastal areas, rural tourism development in western China is simultaneously influenced by factors such as high elevation, strong terrain relief, arid and alpine environments, corridor-like transportation distribution, sparse population, and the multiple overlapping of cultural resources [15]. This means that the spatial layout of key rural tourism villages in western China cannot simply apply the explanatory framework commonly used for eastern China, namely “economic development level–transportation convenience–tourism agglomeration.”
Although existing studies have examined the spatial agglomeration of key rural tourism villages, traditional villages, and tourist attractions, comprehensive discussion remains insufficient regarding the coupled relationships among different geomorphic units, river-basin systems, transportation networks, and historical–cultural types at the cross-provincial scale in western China [16]. In particular, historical–cultural resources such as ethnic culture, red culture, ancient trade-route culture, and frontier garrison culture show evident corridor-like and regional distribution characteristics in western China, and may play an important role in shaping the formation and distribution of key rural tourism villages. Therefore, this study analyzes the spatial distribution characteristics and associated factors of key rural tourism villages in western China from three dimensions: physical geography, human socioeconomic conditions, and historical culture. It further discusses the implications of these findings for coordinated regional development and zoned optimization.
3. Materials and Methods
3.1. Overview of the Study Area
The study area is western China as defined by the National Development and Reform Commission, including 12 provinces, autonomous regions, and municipalities: Inner Mongolia, Guangxi, Chongqing, Sichuan, Guizhou, Yunnan, Tibet, Shaanxi, Gansu, Qinghai, Ningxia, and Xinjiang. Covering approximately 6.91 million km2, or about 72% of China’s total land area, this region is an important zone for China’s westward opening-up, cross-regional connectivity, and ethnic–cultural interaction [17]. The study area is characterized by complex terrain and landforms, with an overall pattern of higher elevation in the west and lower elevation in the east, descending in a stepped manner. It encompasses multiple geomorphic units, including the Qinghai–Tibet Plateau, Inner Mongolia Plateau, Yunnan–Guizhou Plateau, Loess Plateau, and Sichuan Basin [18]. Marked elevation differences and extensive river systems are found across the region. The Yangtze River, Yellow River, Lancang River, and numerous inland rivers jointly provide important spatial foundations for population distribution, settlement development, and tourism activities.
Western China is also a multi-ethnic settlement area and a region rich in historical and cultural resources. It contains diverse heritage resources, including ethnic villages, traditional agricultural remains, former revolutionary sites, and relics of ancient trade routes, which together provide a diversified resource base for rural tourism development. In recent years, with the continued implementation of the Western Development Strategy and the sustained improvement of infrastructure, the conditions for rural tourism development in western China have been continuously optimized. However, problems such as uneven resource distribution, significant disparities in accessibility, and insufficient coordinated development still exist within the region. Accordingly, this study focuses on key rural tourism villages in western China and analyzes their spatial distribution patterns and associated factors (Figure 1).
Figure 1.
Number of key rural tourism villages in western China.
3.2. Data Sources and Processing
The data used in this study mainly include the directory data of national key rural tourism villages, geospatial data, and data on the natural environment and socioeconomic conditions. The specific sources and processing procedures are as follows.
(1) Directory data of key rural tourism villages: This study selected 563 villages located in 12 provinces, autonomous regions, and municipalities in western China from the first to fourth batches of the “National Key Rural Tourism Villages” lists released by the Ministry of Culture and Tourism, and established an attribute database of key rural tourism villages in western China.
To further identify the historical–cultural attributes of key rural tourism villages, this study adopted a “dominant cultural attribute” classification method to classify the 563 key villages. The classification materials were mainly derived from the lists of key rural tourism villages released by the Ministry of Culture and Tourism, publicly available introductions from local governments and culture and tourism departments, descriptions of village tourism resources, materials on famous historical and cultural villages, intangible cultural heritage materials, and the main tourism display contents of the villages [19]. Based on the most representative cultural resources, tourism themes, and external images of the villages, this study classified them into five types: Folk-custom inheritance, Red-culture heritage, Ancient architecture and agricultural heritage, Ancient trade-route heritage, and Frontier garrison heritage. The specific type definitions, identification criteria, and typical identification contents are shown in Appendix A Table A1.
Considering that some villages have multiple cultural attributes, this study adopted a mutually exclusive dominant-type coding principle. Specifically, the primary type was determined according to the core recommendation reasons for a village’s selection as a key rural tourism village, its main tourism products, and the cultural themes repeatedly emphasized in public promotional materials. For villages with multiple attributes, secondary cultural attributes were recorded; however, only the dominant cultural type was used in statistical analysis and cartographic representation to ensure consistency in classification criteria. For villages with unclear attribute boundaries or inconsistent descriptions across sources, the research team determined the dominant type after cross-checking multiple sources.
(2) Spatial geographic coordinate information: The 1:4,000,000 vector map of China’s administrative divisions provided by the National Geomatics Center of China was used as the base map. The geographic coordinates, namely longitude and latitude, of the selected key villages were collected and corrected by combining the Baidu Maps API with image verification in Google Earth Pro. Coordinate formats were then standardized, coordinate transformation was completed, and a point-based vector dataset was established.
(3) Multidimensional driving factor data:
Natural geographical data: Digital elevation model (DEM) data were obtained from the Geospatial Data Cloud (GSCloud), with a spatial resolution of 30 m, and were used to extract indicators such as elevation, slope, and terrain relief. River and water system data were obtained from the National Catalogue Service for Geographic Information Resources [20].
Transportation-location data: Transportation network data, including railways, expressways, and national highways, were obtained from the National Catalogue Service for Geographic Information Resources. Length statistics and area-standardized calculations were then conducted in the GIS platform to characterize road density.
Socioeconomic data: Socioeconomic data, including the 2023 gross domestic product (GDP) and permanent resident population of prefecture-level cities and prefectures in western China, were collected from statistical yearbooks and statistical bulletins on national economic and social development published by local governments between 2024 and 2025.
(4) Data projection and standardization: This study adopted the China Geodetic Coordinate System 2000 (CGCS2000) as the unified spatial reference. To reduce projection distortion in large-scale spatial analysis and ensure the geometric accuracy of area and distance measurements, the Albers equal-area conic projection was used for projection transformation. The central meridian, first standard parallel, and second standard parallel were specifically set according to the geographical location characteristics of the study area used for statistical analysis and spatial measurement. To ensure consistency in analytical scale for correlation analysis, the density of key rural tourism villages, GDP, population density, road density, and relevant natural factors were further aggregated to the prefecture-level city and prefecture scale for statistical analysis. The data sources, indicator types, data formats, and descriptions of the driving factors are summarized in Table 1.
Table 1.
Data sources for driving factors.
3.3. Research Framework
This study constructs a methodological framework that progresses from spatial pattern identification to associated-factor analysis and then to policy implication. First, the spatial distribution characteristics of 563 key rural tourism villages in western China are examined through the average nearest neighbor index, geographic concentration index, kernel density estimation, and spatial autocorrelation analysis, so as to identify their overall clustering pattern, provincial concentration, hotspot areas, and local spatial differentiation. Second, multi-source data on terrain and landforms, river basins, population density, economic conditions, road network density, and historical–cultural types are integrated to examine the natural, socioeconomic, transportation, and cultural factors associated with the distribution of key villages. Third, spatial overlay analysis, Spearman correlation analysis, Geodetector, and road-buffer relative enrichment analysis are used to further reveal the relationships between key village density and different explanatory factors. On this basis, the study summarizes the spatial structure and associated factors of key rural tourism villages in western China and proposes optimization recommendations for regional coordination, transportation connectivity, cultural resource integration, and differentiated development (Figure 2).
Figure 2.
Technology roadmap (maps were drawn by authors).
3.4. Analytical Methods
To systematically identify the spatial distribution patterns and influencing factors of key rural tourism villages in western China, this study conducted a quantitative analysis of 563 key rural tourism villages in the region based on the ArcGIS 10.8 platform. Specifically, it employed a combination of methods, including the average nearest neighbor index, geographic concentration index, kernel density analysis, spatial overlay analysis, global and local spatial autocorrelation analysis, and Spearman correlation analysis.
3.4.1. Average Nearest Neighbor Index
This index was used to determine whether the spatial distribution of key rural tourism villages in the study area was clustered or dispersed. The formula is as follows:
where is the observed mean nearest-neighbor distance; is the expected mean nearest-neighbor distance under a random distribution; di is the distance between the i-th point and its nearest neighboring point; n is the number of sample points; and A is the area of the study region. If R < 1, the point features are clustered; if R = 1, the point features follow a random distribution; and if R > 1, the point features show a dispersed or uniform distribution [21].
3.4.2. Geographic Concentration Index
This index is an important indicator used to measure the degree of concentration of key rural tourism villages. Its calculation formula is as follows:
where G denotes the geographic concentration index; represents the number of key rural tourism villages in the i-th province, autonomous region, or municipality; T is the total number of key rural tourism villages; and n is the number of spatial units. A larger value indicates a more concentrated distribution of key rural tourism villages. If all key villages are completely evenly distributed across the spatial units, the theoretical reference value is G0 = 100/.
3.4.3. Kernel Density Estimation
The KDE method assumes that geographical events may occur at any location within continuous space, while their probabilities of occurrence vary significantly across different locations. Specifically, areas with a higher density of point features are associated with a greater probability of event occurrence. This method can intuitively and effectively reveal the spatial agglomeration characteristics of point features [22]. The calculation formula is as follows:
where f(x) denotes the kernel density estimate at location x; n is the number of sample points; h is the search radius or bandwidth; K(·) denotes the kernel function estimate; and x − xi represents the spatial distance between location x and the i-th key rural tourism village point xi. In this study, the kernel density analysis tool in ArcGIS 10.8 was used for calculation, and the bandwidth was set to the default search radius in ArcGIS.
3.4.4. Global Moran’s I
Global Moran’s I was used to determine whether the density of key rural tourism villages exhibits significant overall positive or negative spatial autocorrelation within the study area. Local Moran’s I was further used to identify the clustering types of local spatial units and their spatial differentiation characteristics. The calculation formulas are as follows:
where I denotes the value of the global Moran’s I statistic; n is the number of spatial units; and represent the observed distribution density values of key rural tourism villages in spatial units i and j, respectively; denotes the mean distribution density of key villages in the study area; denotes the spatial weight between spatial units i and j; and is the sum of all weight values in the spatial weight matrix. The value of Moran’s I ranges from −1 to 1. When I > 0, the spatial distribution shows positive spatial correlation, indicating that similar attribute values tend to cluster in space; when I < 0, the spatial distribution shows negative spatial correlation, indicating that similar attribute values tend to be dispersed in space; and when I approaches 0, the key villages are randomly distributed in space. In this study, global spatial autocorrelation analysis was conducted using ArcGIS 10.8. The spatial weight matrix adopted the default parameter settings of the spatial autocorrelation analysis tool in ArcGIS 10.8, and significance was tested using the Z-score and p-value.
3.4.5. Local Moran’s I
Local Moran’s I, also known as LISA cluster analysis, was used to identify the clustering types and boundary characteristics between specific spatial units and their neighboring units. The calculation formula is as follows:
The meanings of all variables in the formula are consistent with those in the global Moran’s I formula.
3.4.6. Geodetector
Geodetector was used to identify the explanatory power of independent variables for the spatial differentiation of rural tourism village density (RVD), mainly through factor detection and interaction detection. The (q)-statistic of the factor detector is calculated as follows:
where (q) denotes the explanatory power of an independent variable for the spatial differentiation of RVD, with a value range of [0, 1]; h denotes the stratified category of the independent variable; Lis the number of strata of the independent variable; Nh is the number of spatial units in stratum h; N is the total number of spatial units in the study area;σh2 is the variance of RVD in stratum h; and σ2 is the overall variance of RVD in the study area. The closer the q value is to 1, the stronger the explanatory power of the independent variable for the spatial differentiation of RVD. Interaction detection was used to compare the q value generated by the joint effect of two independent variables with the q values of individual factors, thereby determining whether interaction enhancement or weakening effects exist between different factors [23].
3.4.7. Location Quotient
The location quotient (LQ) was used to measure the relative concentration of key rural tourism villages within specific road buffer zones. By comparing the proportion of key villages located within a buffer zone with the proportion of the buffer-zone area, the LQ indicates whether key villages are relatively enriched in areas close to roads. The calculation formula is as follows:
where Ni denotes the number of key villages in the i-th category area; N denotes the total number of key rural tourism villages in the study area; Ai denotes the area of the i-th road buffer zone; and A denotes the total area of the study area. Ni/N represents the proportion of key villages within the buffer zone relative to the total number of key villages, while Ai/A represents the proportion of the buffer-zone area relative to the total area of the study area.
4. Results
4.1. Spatial Distribution Pattern of Key Rural Tourism Villages in Western China
4.1.1. The Spatial Distribution of the 563 Key Rural Tourism Villages Shows Evident Clustering Characteristics
The results of the average nearest neighbor analysis show that the observed mean nearest-neighbor distance of the 563 key rural tourism villages in western China is = 0.035, while the expected mean nearest-neighbor distance under a random distribution is = 0.055. The average nearest neighbor ratio is therefore R = = 0.035/0.055 ≈ 0.64 < 1. This indicates that key rural tourism villages in western China exhibit an overall clustered distribution rather than a random or uniform distribution. It should be noted that Euclidean distance under a unified projected coordinate system was used to calculate nearest-neighbor distances in this study, so as to avoid distance bias caused by direct calculation using longitude and latitude coordinates [24].
4.1.2. The Spatial Distribution of Key Rural Tourism Villages in Western China Is Uneven
As shown in Table 2, the total number of key rural tourism villages in western China is T = 563, and the number of provinces, autonomous regions, and municipalities is n = 12. According to the formula for the geographic concentration index, the calculated value is G = 29.58. Under a completely even distribution, the theoretical reference value is G0 = 100/ = 100/ = 28.87. Since G is slightly higher than G0, the distribution of key rural tourism villages in western China shows a certain degree of concentration and imbalance at the provincial scale. Combined with the structure shown in Table 1, Xinjiang has 78 villages, accounting for 13.85%; Guizhou has 52 villages, accounting for 9.24%; and Yunnan has 50 villages, accounting for 8.88%, indicating relatively high proportions in these provinces and autonomous regions. By contrast, Inner Mongolia, Qinghai, and Ningxia account for relatively low proportions. Interprovincial differences are therefore relatively evident. Overall, the spatial pattern shows a gradient characterized by relative agglomeration in the southeast and relative sparsity in the northwest.
Table 2.
Statistics on the number of key rural tourism villages in western provinces (Batches 1–4).
4.2. Spatial Agglomeration and Autocorrelation Analysis of Key Rural Tourism Villages in Western China
4.2.1. Spatial Agglomeration Hotspot Characteristics Based on Kernel Density Analysis
This study conducted kernel density analysis on 563 key rural tourism villages across 12 provinces, autonomous regions, and municipalities in western China using ArcGIS 10.8, and generated a spatial kernel density distribution map, as shown in Figure 3. The results indicate that the spatial agglomeration pattern exhibits clear hierarchical characteristics.
Figure 3.
Kernel density distribution of key rural tourism villages in Western China.
The Sichuan Basin, the Chongqing metropolitan area, and the Guanzhong Plain together constitute the core agglomeration areas with the highest kernel density. In these areas, key rural tourism villages are highly concentrated, demonstrating strong spatial attraction and advantages in resource endowment. Northwestern Yunnan, southeastern Guizhou, and parts of southern Gansu form secondary agglomeration belts, showing a distribution pattern along major tourism corridors and ethnic–cultural corridors. By contrast, key villages are extremely sparse in northeastern Inner Mongolia, the hinterland of the Qinghai–Tibet Plateau, and the areas surrounding the Tarim Basin in southern Xinjiang, showing evident “cold spot” characteristics.
Overall, the spatial distribution of key rural tourism villages in western China presents a significantly uneven pattern characterized by “high concentration in core areas, extension along secondary corridors, and sparse distribution across vast hinterlands.” This spatial structure provides an important geographical basis for optimizing the allocation of regional rural tourism resources and implementing differentiated development strategies.
4.2.2. Spatial Autocorrelation and Local Agglomeration Differentiation Characteristics
Using the density of key rural tourism villages at the prefecture-level city and prefecture scale as the attribute value, this study applied global Moran’s I and local Moran’s I, namely local indicators of spatial association (LISA), to analyze their spatial autocorrelation characteristics.
(1) Global spatial autocorrelation. The results of global Moran’s I show that the Moran’s I value for the density of key villages is 0.2294, with p < 0.001 and Z = 8.524. This indicates a significant positive spatial autocorrelation at the prefecture-level city and prefecture scale, suggesting that the overall distribution exhibits a certain degree of spatial clustering. Meanwhile, the Moran’s I values of variables such as elevation, slope, terrain relief, road network density, permanent resident population density, and GDP are all greater than 0, indicating that these factors themselves also display varying degrees of spatial clustering [25]. It should be noted that the Moran’s I values of these explanatory variables mainly reflect their own spatial distribution characteristics, while their associations with the density of key villages need to be further interpreted in combination with the subsequent spatial overlay analysis and Spearman correlation analysis(Table 3).
Table 3.
Global Moran’s I results of key rural tourism village density and related variables in Western China.
(2) Local spatial autocorrelation. The local spatial differentiation characteristics of key village density were further identified using the LISA cluster map (Figure 4). The results show that the “high–high (H–H)” clusters of key village density are mainly distributed in the adjoining areas of the eastern Sichuan Basin, central and northern Guizhou, and southern Shaanxi. This indicates that key rural tourism villages in these areas exhibit strong contiguous spatial agglomeration and have preliminarily formed rural culture–tourism industrial cluster belts that cross administrative boundaries.
Figure 4.
LISA cluster maps of key rural tourism village density and related variables in Western China.
By contrast, in the vast arid areas and alpine regions of northwestern China, key villages are relatively dispersed and do not form significant local spatial associations, appearing mostly as “not significant” areas. Overall, the density of key rural tourism villages in western China presents a markedly differentiated pattern of local spatial agglomeration, characterized by the coexistence of localized hotspot clusters and extensive areas with insignificant spatial association.
4.3. Influencing Factors of the Spatial Distribution of Key Rural Tourism Villages in Western China
4.3.1. Overall Correlation Analysis and Factor Identification
The spatial differentiation of key rural tourism villages in western China is not determined by a single factor, but rather results from the combined effects of natural geographical conditions and human socioeconomic factors. To further identify the associations between different factors and the density of key villages, this study selected six variables at the unified prefecture-level city and prefecture scale, namely elevation, slope, terrain relief, per capita GDP, population density, and road network density. These variables, together with the distribution density of key villages, were used to construct a correlation matrix, and Spearman correlation analysis was conducted (Figure 5).
Figure 5.
Spearman correlation matrix between key rural tourism village density and influencing factors in western China: *, **, and *** indicate significance at p < 0.05, p < 0.01, and p < 0.001, respectively.
The results show that human socioeconomic factors are positively associated with the spatial distribution of key villages. Specifically, both population density and road network density show significant positive correlations with the distribution density of key villages. However, a high correlation also exists between these two variables (ρ = 0.87), indicating that areas with higher population agglomeration are often accompanied by more developed transportation networks. Therefore, this study does not simply interpret population density and road network density as two mutually independent driving factors; instead, they are understood as the spatial representation of “population–transportation combined conditions.” In other words, key rural tourism villages in western China are more likely to be distributed in areas with larger local tourist-source markets, more sufficient labor supply, and better external accessibility. These combined conditions jointly enhance the basic capacity of villages to apply for, construct, and operate as national key rural tourism villages. It is worth mentioning that the results show that human socioeconomic factors exert a significant positive driving effect. Specifically, population density (ρ = 0.70, p < 0.001) and road network density (ρ = 0.67, p < 0.001) both show highly significant positive correlations with the distribution density of key villages. This indicates that market demand generated by population agglomeration and convenient transportation accessibility constitute the core supporting forces shaping the spatial layout of key villages in western China. Notably, the correlation between per capita GDP and key village density is extremely weak and fails to pass the significance test (ρ = −0.07). This suggests that, at the prefecture-level scale, the level of economic development is not a direct determinant of the distribution of key villages, but rather functions more as a potential supporting condition.
In terms of natural geographical factors, elevation shows a significant negative correlation with key village density (ρ = −0.27, p < 0.01), indicating that as elevation increases, the distribution density of key villages shows a clear attenuation effect. This reflects the constraints imposed by high-altitude environments on rural tourism development. By contrast, slope (ρ = 0.14) and terrain relief (ρ = 0.16) show only weak and statistically insignificant positive correlations with key village density.
In addition, clear synergistic relationships exist among the variables. Population density and road network density exhibit very strong collinearity (ρ = 0.87), and both are significantly negatively correlated with elevation, with correlation coefficients of −0.56 and −0.47, respectively. This indicates that the spatial differentiation of key rural tourism villages in western China results from the coupled interaction of “population–transportation–resources” under elevation constraints. Low-altitude areas, by concentrating larger populations and denser transportation networks, provide a more favorable socioeconomic environment for the integration and designation of rural tourism resources.
4.3.2. Identification of Factor Explanatory Power and Interaction Effects Based on Geodetector
To further identify the explanatory power of different factors for the spatial differentiation of rural tourism village density and their interaction effects, this study used rural tourism village density (RVD) at the prefecture-level city and prefecture scale as the dependent variable. Elevation (ELE), slope (SLP), terrain relief (TR), road density (RD), population density (PD), and per capita GDP (PGDP) were selected as explanatory variables. The factor detector and interaction detector in Geodetector were then applied for analysis.
The factor detection results (Figure 6) show clear differences in the explanatory power of the selected variables for the spatial differentiation of RVD. Among them, population density (PD) and road density (RD) have the highest (q) values, at 0.222 and 0.209, respectively, and both pass the significance test at the 0.05 level. This indicates that population agglomeration and transportation accessibility are the main associated factors explaining differences in the density of key rural tourism villages in western China. By contrast, terrain relief (TR) and slope (SLP) have relatively low (q) values, at 0.023 and 0.012, respectively, and do not pass the significance test. The single-factor (q) values of elevation (ELE) and per capita GDP (PGDP) are close to 0, suggesting that their independent explanatory power is limited under the current prefecture-level city and prefecture scale and variable stratification conditions. Combined with the Spearman correlation results showing a high correlation between population density and road density, this study interprets PD and RD as the spatial representation of “population–transportation combined conditions,” rather than as two completely independent driving factors.
Figure 6.
Results of factor detection and interaction detection for the spatial differentiation of rural tourism village density. Note: ↑ indicates bivariate enhancement, meaning that the interaction q value is greater than the larger q value of the two individual factors but does not exceed their sum; ↑↑ indicates nonlinear enhancement, meaning that the interaction q value is greater than the sum of the q values of the two individual factors.
The interaction detection results further show that the explanatory power of some factor combinations is substantially higher than that of individual factors. The interaction between population density (PD) and road density (RD) has the highest (q) value, reaching 0.428. This indicates that the superposition of population agglomeration and transportation accessibility can significantly enhance the explanatory power for the spatial differentiation of RVD. In addition, the interaction (q) value between elevation (ELE) and population density (PD) reaches 0.379, suggesting that although natural terrain conditions have limited independent explanatory power, they may indirectly participate in shaping the spatial differentiation of key villages by influencing the pattern of population agglomeration. After interaction with population density (PD) and road density (RD), the (q) values of per capita GDP (PGDP) increase to 0.285 and 0.257, respectively. This indicates that the level of economic development is more likely to play a supporting role through its coupling with population and transportation conditions, rather than independently determining the spatial layout of key villages. Overall, the spatial differentiation of key rural tourism village density in western China is not determined by a single factor, but results from the combined effects of population agglomeration, transportation accessibility, economic support conditions, and natural geographical constraints. Among these factors, the population–transportation combined conditions constitute the most important explanatory dimension, while natural terrain factors mainly function as basic constraints or moderating conditions.
4.3.3. Natural Factors Influencing the Distribution of Key Rural Tourism Villages
As fundamental drivers of the spatial differentiation of key rural tourism villages in western China, natural geographical conditions are mainly reflected in terrain, landforms, hydrology, and climate. From a regional perspective, this study used ArcGIS 10.8 to spatially overlay village locations with data on elevation, terrain relief, and related factors, thereby identifying the spatial distribution characteristics of key villages across different elevation zones, river systems, and surface-relief conditions.
(1) Elevation. Western China spans the first and second topographic steps of China, and the distribution of key rural tourism villages shows clear vertical differentiation, with a tendency to cluster in middle- and high-elevation areas [26]. A total of 104 key villages, accounting for 18.47%, are distributed below 500 m above sea level. These villages are mainly concentrated in traditional agricultural areas with favorable climatic conditions and well-developed road networks, such as Guangxi, the Sichuan Basin, and the Guanzhong Plain. The 500–1000 m elevation zone contains 123 villages, accounting for 21.85%, which are widely distributed in the Qinba Mountains, the Hanzhong Basin, and oases in Xinjiang. This zone represents a tourism-intensive belt transitioning from plains to plateaus. The number of key villages increases to 159, or 28.24%, in the 1000–1500 m elevation zone. These villages are mainly concentrated in the main body of the Yunnan–Guizhou Plateau and the Loess Plateau. With a cool climate and strong ethnic–cultural characteristics, this zone serves as a favorable area for summer retreat and health-oriented tourism. In high-elevation areas above 1500 m, there are 177 key villages, accounting for 31.44%. Although these areas are characterized by harsh natural conditions, they exhibit a significant “atypical” agglomeration pattern by relying on high-quality landscapes such as snow mountains and alpine meadows, as well as the distinctive cultural appeal of Tibetan and Qiang communities [27].
In summary, the elevation distribution of key rural tourism villages in western China shows vertical differentiation dominated by middle- and high-elevation areas. Villages located above 1000 m account for more than 60% of the total. This pattern is consistent with the natural geographical background of western China, where plateaus and mountainous areas are widely distributed. It also indicates that some key villages have formed relatively concentrated distribution patterns in middle- and high-elevation areas by relying on distinctive landscape resources and ethnic–cultural resources (Figure 7, Table 4).
Figure 7.
Relation between spatial distribution of key rural tourism villages in Western China and elevation.
Table 4.
Statistics on geographic spatial distribution of Key Rural Tourism Villages in Western China.
(2) River basin factors. The hydrological environment is not only an important constraint on settlement location, but also a key element shaping the landscape characteristics of rural tourism. An overlay analysis of key rural tourism villages in western China and major river basins shows that their spatial distribution exhibits a significant tendency toward proximity to water, while different river systems exert clearly hierarchical agglomeration effects on key villages.
The Yangtze River Basin contains 166 key villages, accounting for 29.48% of the total, and covers major rural tourism agglomeration areas in southwestern China, including the Sichuan Basin, the Yunnan–Guizhou Plateau, and surrounding mountainous areas. In the Sichuan Basin and its surrounding mountainous areas, tributary systems such as the Jialing River system (32 villages) and the Minjiang River system (29 villages) have, together with the favorable agricultural foundation of the “Land of Abundance” and distinctive wharf culture, fostered a high-density belt of beautiful rural settlements in the Bashu region. The Yellow River Basin contains 137 key villages, accounting for 24.33% of the total. The Mainstream of the Yellow River system (101 villages) and the Weihe River system (36 villages) connect the plains and river valleys of Gansu, Shaanxi, and Ningxia. Rural settlements in these areas are mostly distributed in belt-like patterns along river valley terraces, reflecting the historical prosperity of agricultural irrigation and commercial trade activities [28]. The Northern inland and Xinjiang river basins contain 101 key villages, accounting for 17.94% of the total. Constrained by an arid climate, key villages in these areas are highly dependent on oasis water sources and show a pronounced pattern of “settling along water.” The Xijiang River system of the Pearl River Basin contains 76 key villages, accounting for 13.50%, and flows through the karst landform areas of Guangxi, where distinctive mountain-and-water landscapes have promoted the agglomeration of sightseeing-oriented rural tourism. By contrast, marginal river basins such as the Haihe River Basin (2 villages, 0.36%) and the Northeastern river basins (16 villages, 2.84%) have relatively limited tourism resources and therefore show extremely sparse distributions.
In summary, key rural tourism villages in western China are mainly distributed in the Yangtze River Basin and Yellow River Basin, while relatively concentrated distribution patterns are also found in the Pearl River Basin and some inland river basins. This indicates that large basin spaces, water-resource conditions, and composite landscape resources provide important support for the spatial layout of key villages (Figure 8, Table 5).
Figure 8.
Relation between spatial distribution of key rural tourism villages in Western China and river basins.
Table 5.
Statistics on distribution of Key Rural Tourism Villages related to river systems in Western China.
(3) Terrain relief. Terrain relief is a key indicator characterizing the degree of surface fragmentation, and is directly associated with regional transportation accessibility and the construction costs of tourism development. The terrain relief data extracted through spatial analysis in ArcGIS indicate that key rural tourism villages in western China show a pronounced tendency toward relatively flat micro-locations. The specific distribution characteristics are as follows. The 0–50 m terrain relief zone, namely the low-relief zone, is the dominant area for the distribution of key villages, containing 551 key villages, or 97.87% of the total. Although such areas may be located within plateaus or mountainous regions at the macro scale, they are relatively flat and open at the local micro-scale. As a result, they involve lower land development difficulty, controllable road network construction costs, and favorable conditions for forming large-scale tourism reception facilities and visitor distribution centers, making them the preferred geomorphic type for rural tourism agglomeration [9].
By contrast, only 11 key villages, accounting for 1.95%, are distributed in the 50–100 m terrain relief zone, namely the medium-relief zone. These areas are mainly located in terrain transition zones or on the gentle slopes of low mountains. Although they possess a certain degree of vertical landscape layering and are often sightseeing-oriented villages relying on mountain terrain, their number decreases significantly due to construction difficulty and transportation constraints.
The distribution of key villages in areas with terrain relief greater than 100 m, namely high-relief zones, is extremely sparse. No key villages are found in the 100–150 m zone, and only one village, accounting for 0.18%, is located in the extremely high-relief zone above 150 m. This indicates that deeply dissected areas with steep terrain and dense gullies, despite their distinctive natural scenery, are constrained by geological hazard risks and poor accessibility, making it difficult to support the cultivation and development of national key rural tourism villages.
In summary, key rural tourism villages in western China are characterized by a “low-relief dominance” pattern. Although western China is generally high in elevation, village site selection strictly follows the micro-geomorphic rule of “finding small valleys within great mountains,” with villages mainly concentrated in gentle areas where terrain relief is below 50 m. By constraining the expansion of transportation networks and the comfort of the human settlement environment, terrain relief becomes a key limiting condition for identifying suitable spaces for rural tourism development (Figure 9, Table 4).
Figure 9.
Relation between spatial distribution of key rural tourism villages in Western China and relief amplitude.
(4) Slope. As a key topographic factor affecting land-use patterns and engineering construction costs, slope directly constrains the spatial agglomeration form of rural tourism [29]. The slope selection of key rural tourism villages in western China shows a highly significant pattern of “low-slope agglomeration.” A total of 353 key villages, accounting for 62.70% of the total, are concentrated in gentle areas with slopes of 0–5°. This slope range covers the Sichuan Basin, the Guanzhong Plain, and the Bazi areas of the Yunnan–Guizhou Plateau. Owing to flat terrain, low costs for transportation network construction, and suitability for large-scale facility layout, these areas have become the dominant spatial carriers for rural tourism development. The gentle-slope zone of 5–15° contains 142 villages, accounting for 25.22%. These areas are mostly located in hilly transition zones or shallowly incised river valleys. Their slight micro-topographic variation is conducive to drainage and flood prevention, while also creating three-dimensional agricultural landscapes such as terraced fields and orchards, thereby balancing production functions with landscape aesthetics. By contrast, the moderately steep slope zone of 15–25° contains only 43 villages, accounting for 7.64%, while steep and very steep slope zones above 25° contain a total of 25 villages, accounting for 4.44%. These villages are the sparsest in distribution and are mainly scattered in alpine valleys or ecologically fragile areas. Constrained by geological hazard risks and limited transportation accessibility, only a small number of villages with special landscape value, such as cliff villages, or unique historical functions are located in these areas.
Overall, key rural tourism villages in western China are dominated by gentle and low-slope areas below 15°, which together account for 87.92% of the total, indicating a strong tendency toward relatively flat terrain. This pattern is consistent with the high requirements of modern mass tourism for transportation comfort and facility convenience. By setting the “engineering threshold” and “safety boundary” for land development, slope conditions profoundly shape the vertical differentiation pattern of key rural tourism villages in western China (Figure 10, Table 4).
Figure 10.
Relation between spatial distribution of key rural tourism villages in Western China and slope.
4.3.4. Human Factors Influencing the Distribution of Key Rural Tourism Villages
Human factors are mainly reflected in the combined effects of population agglomeration, economic development, historical–cultural resources, and transportation accessibility on the spatial layout of key rural tourism villages [30]. Among these factors, population and transportation provide the basic market conditions and accessibility support for the formation and agglomeration of key villages. The level of economic development provides material support for infrastructure improvement and tourism development investment, while historical–cultural resources influence the typological distribution and spatial pattern of key villages by enhancing local distinctiveness and cultural identity.
(1) Population density. Based on the correlation analysis between population density at the prefecture-level city and prefecture scale and the spatial distribution of key rural tourism villages, population density in western China generally shows a pronounced pattern of being “dense in the southeast and sparse in the northwest.” This pattern broadly follows the Hu Huanyong Line and forms a three-tier stepped decline from the Sichuan Basin and Guanzhong Plain, to the Yunnan–Guizhou Plateau and Loess hilly areas, and then to the Qinghai–Tibet Plateau and northwestern desert areas. Among these areas, the Chengdu–Chongqing urban agglomeration and the Guanzhong Plain urban agglomeration show particularly strong population agglomeration effects due to their flat terrain, high urbanization levels, and dense transportation networks. From the perspective of resource distribution, areas with higher population density have a significantly larger stock of key rural tourism villages than low-density areas. For example, Chongqing Municipality, with 41 villages, Chengdu, with 11 villages, and their surrounding areas are mostly located in zones with population densities above 500 persons/km2, where key villages are most densely distributed, forming a prominent rural tourism agglomeration core in western China. By contrast, in the Ali Prefecture of Tibet, with 2 villages, Nagqu City, with 3 villages, and the desert areas of the northwestern arid region, population densities are mostly below 10 persons/km2.
Constrained by harsh natural living conditions, key villages in these areas are extremely sparse and mostly scattered as isolated points.
Overall, the number of key rural tourism villages shows a significant positive correlation with population density. The large local tourist market and abundant tourism labor force in high-density areas provide a solid social foundation for the large-scale development of rural tourism [31]. In contrast, low-density areas face the dual challenges of insufficient market demand and high operating costs due to sparse populations and excessively large service radii (Figure 11).
Figure 11.
Relation between the spatial distribution of key rural tourism villages in Western China and population density at the city (prefecture) scale.
(2) Regional economic factors. The level of regional economic development constitutes the material foundation and driving force for the industrial transformation of rural tourism. Macro-scale spatial overlay analysis shows that the distribution of key rural tourism villages in western China is generally consistent with the GDP pattern at the prefecture-level city and prefecture scale. As a modern service-oriented sector, rural tourism is highly dependent on regional economic capacity for capital investment in transportation, infrastructure, public services, and the improvement of human settlement environments in transforming “original ecological resources” into “high-quality tourism products.” Such investment provides strong support for the cultivation, upgrading, and branded operation of key villages.
Based on the 2023 GDP statistics and spatial distribution characteristics of prefecture-level cities and prefectures in western China, economic highlands such as the Chengdu–Chongqing Economic Circle and the Guanzhong Plain urban agglomeration are relatively dense areas for key village distribution. Taking Chengdu as an example, its GDP exceeded RMB 2.2 trillion in 2023. Relying on strong fiscal capacity and social capital, Chengdu has actively implemented the industrial orientations set out in the Catalogue of Encouraged Industries in Western China (2025 Edition), particularly those concerning the “development of characteristic agricultural and forestry products” and “tourism infrastructure construction.” Through capital reinvestment in rural areas, these regions have promoted the contiguous development of a number of benchmark villages with improved facilities and diversified business formats, such as Zhanqi Village and Mingyue Village, thereby achieving an efficient transformation from “lucid waters and lush mountains” into “invaluable assets.”
By contrast, economically lagging areas in the peripheral parts of western China, such as the hinterland of the Qinghai–Tibet Plateau, the oasis margins of the northwestern desert regions, and the deep areas of the Qinba Mountains, possess high-quality natural and folk-cultural resources but are constrained by insufficient funding and “last-mile” accessibility bottlenecks. As a result, key villages in these areas are sparsely distributed and depend heavily on national fiscal transfer payments or paired assistance for point-based cultivation.
Overall, the distribution of key rural tourism villages in western China shows a certain degree of coupling with the spatial pattern of GDP. The level of economic development plays an important supporting role in infrastructure improvement, public service enhancement, and tourism development investment. However, according to the Spearman correlation analysis, the correlation between GDP and key village density (ρ = −0.07) is weaker than those of population density and road network density. This indicates that, at the prefecture-level scale, economic development mainly plays an indirect supporting role rather than functioning as a single dominant factor. The spatial differentiation of key villages is still shaped by the combined effects of multiple factors, including the natural geographical background, population agglomeration, and transportation accessibility (Figure 12).
Figure 12.
Relation between the spatial distribution of key rural tourism villages in Western China and GDP at the city (prefecture) scale.
(3) Historical–cultural factors. Based on the dominant cultural attribute classification method described in Section 3.2 and the cultural-type classification criteria presented in Appendix A Table A1, this study identified the dominant historical–cultural types of the 563 key rural tourism villages. It should be noted that this classification does not deny the composite nature of village cultural resources. Rather, villages were categorized according to their dominant resources, core tourism display themes, and cultural images repeatedly emphasized in publicly available materials, so as to identify the spatial distribution differences among different historical–cultural types from an overall perspective [32]. Different types of key villages show evident regional agglomeration and corridor-like distribution characteristics in space (Table 6). Folk-custom inheritance villages are highly concentrated in the Yunnan–Guizhou Plateau, the Tibetan–Qiang–Yi cultural corridor, and the hilly areas of Guangxi in southwestern China, forming large contiguous distribution areas [33]. Red-culture heritage villages are clearly connected in belt-like patterns along the routes of the Red Army’s Long March and around revolutionary base areas, with high concentrations in old revolutionary areas such as Zunyi, Yan’an, and Bazhong. Ancient architecture and agricultural heritage villages are mainly distributed in the Sichuan Basin, including western Sichuan Linpan settlements, and the hinterland of the Guanzhong Plain, showing a clustered high-density distribution and reflecting the deep accumulation of traditional agricultural civilization in areas with favorable natural conditions. Ancient trade-route heritage villages are distributed linearly along the Hexi Corridor, particularly the Silk Road section, and along the Sichuan–Yunnan–Tibet Tea Horse Road, connecting historical post stations and commercial market towns [34]. Frontier garrison heritage villages, mostly evolved from ancient military forts and strongholds, are scattered along the Great Wall in northern Shaanxi and in border counties of Xinjiang and Tibet. These findings indicate that ethnic migration and integration, revolutionary struggles, the continuity of traditional agricultural civilization, and ancient commercial and military activities constitute important historical–cultural factors shaping the formation, evolution, and spatial differentiation of key rural tourism villages in western China.
Table 6.
Types and spatial distribution characteristics of Key Rural Tourism Villages in Western China.
(4) Transportation network factors. Transportation accessibility is an important basic condition for key rural tourism villages to connect with external tourist-source markets, improve service provision, and enhance operational efficiency [35]. The spatial overlay results (Figure 13) show a relatively clear spatial proximity relationship between key villages and major road networks, including expressways, national highways, and provincial roads. In terms of spatial morphology, key villages show strong characteristics of “road-network dependence” and “axis-belt orientation,” with many villages distributed in a “beaded” pattern along major transportation corridors. In areas with dense road networks, such as the Chengdu–Chongqing Economic Circle and the Guanzhong Plain, key villages exhibit a “network-filling” pattern supported by the road network. By contrast, in the northwestern arid region and the Qinghai–Tibet Plateau, where transportation networks are sparse, key villages are closely aligned with transportation axes, showing a distinct “road-derived” spatial pattern.
Figure 13.
Relation between spatial distribution of key rural tourism villages in Western China and transportation network.
To further determine whether the distribution of key villages in road-adjacent areas is higher than would be expected based on the regional area background, this study established 1 km, 3 km, and 5 km buffer zones around expressways and major roads, respectively, and calculated the location quotient (Figure 13; Table 7). The results show that 65, 167, and 237 key villages are located within the 1 km, 3 km, and 5 km expressway buffer zones, respectively, accounting for 11.55%, 29.66%, and 42.10% of the total. The corresponding buffer-zone areas account for 2.36%, 6.70%, and 10.27% of the study area, with location quotient values of 4.89, 4.43, and 4.10, respectively. Road proximity is even more evident for major roads. A total of 184, 324, and 395 key villages are located within the 1 km, 3 km, and 5 km major-road buffer zones, respectively, accounting for 32.68%, 57.55%, and 70.16% of the total. The corresponding buffer-zone areas account for 3.86%, 11.47%, and 17.11% of the study area, with location quotient values of 8.46, 5.02, and 4.10, respectively. These results indicate that key villages are not simply distributed evenly in road-adjacent areas according to the area background, but instead show evident relative enrichment near major roads.
Table 7.
Distribution of key rural tourism villages within road buffer zones and location quotient (LQ).
It should be noted that the road-buffer analysis mainly reveals the spatial proximity relationship and relative enrichment characteristics between key villages and the transportation network, and cannot by itself prove a direct causal effect of roads on the formation of key villages. In combination with the preceding Spearman correlation analysis and Geodetector results, road density is more appropriately understood as a component of “population–transportation combined conditions.” In other words, areas with more developed transportation networks often also have higher population density, stronger public service capacity, and better market accessibility, thereby providing more favorable basic conditions for the application, construction, and operation of key rural tourism villages.
5. Discussion
5.1. Spatial Pattern and Driving Mechanisms of Key Rural Tourism Villages in Western China
This study finds that key rural tourism villages in western China show a significant clustered distribution overall, and relatively prominent agglomeration cores are formed in the Sichuan Basin, the Chongqing metropolitan area, the Guanzhong Plain, and Guizhou. This indicates that the spatial pattern of key rural tourism villages is not randomly generated, but gradually formed under the joint effects of the natural geographical background, transportation accessibility conditions, population agglomeration, and historical–cultural resources. Compared with the overall macro-geomorphic background of western China, which is characterized by high elevation and strong terrain relief, key villages are more concentrated in local flat spaces with gentler slopes, lower terrain relief, and proximity to major river basins, indicating that village site selection still clearly follows the basic rule of “suitability for construction, ease of access, and availability of resources” [36].
At the same time, it should be noted that this study conducts correlation analysis at the prefecture-level city and prefecture scale. Although this helps reveal the overall rules at the regional level, it may also produce a certain scale-averaging effect. Some natural factors may have stronger effects at the micro village scale, but may be weakened by intra-regional differences at the prefecture-level city and prefecture scale; the effects of socioeconomic variables may also be jointly influenced by factors such as urbanization level, policy support intensity, and tourism market maturity. Therefore, future research can further introduce county-level scale or village-point scale, and combine multi-scale models, accessibility measurement, and policy variables to deepen the explanation of the formation mechanism of key rural tourism villages in western China [37].
There is strong collinearity between population density and road density, indicating that the two do not play their roles completely independently. Population agglomeration areas in western China are usually also areas with relatively complete transportation networks, stronger public service supply, and higher market consumption capacity. Therefore, the agglomeration of key villages cannot be simply attributed to a single population factor or transportation factor, but should be understood as a composite development condition jointly formed by population, roads, markets, and public services. Conversely, in areas with sparse population and low road-network density, such as the hinterland of the Qinghai–Tibet Plateau and the margins of desert oases in northwestern China, even if they have unique natural landscapes or ethnic–cultural resources, it may still be difficult to form a continuous agglomeration because of high operating costs, large service radius, and insufficient market transformation capacity.
In addition, this study mainly conducts static spatial analysis based on the lists of the first four batches of national key rural tourism villages, focusing on distribution patterns and major influencing factors, while the investigation of temporal evolution processes, dynamic policy effects, and village operation quality remains relatively limited. Future research can combine more time-series data and micro-level operation data to further reveal the staged evolutionary characteristics of key villages from “selection” to “development quality improvement” [38].
5.2. Recommendations for the Optimized Development of Key Rural Tourism Villages in Western China
Based on the spatial structure of “core agglomeration–corridor extension–sparse hinterland” of key rural tourism villages in western China, as well as the compound associations among physical geography, population and transportation, and historical–cultural factors, this study proposes the following optimization recommendations:
5.2.1. Implement Classified Guidance for Core Areas, Corridor Areas, and Sparse Areas Based on the Spatial Agglomeration Pattern
For high-density agglomeration areas of key villages, such as the Sichuan Basin, the Chongqing metropolitan area, the Guanzhong Plain, and central and northern Guizhou, the focus should shift from “quantitative expansion” to “quality improvement,” promoting the upgrading of rural tourism products, the improvement of public services, and the integration of regional brands, so as to avoid homogeneous competition [39]. For secondary corridor areas such as northwestern Yunnan, southeastern Guizhou, southern Gansu, the Hexi Corridor, and the Sichuan–Yunnan–Tibet transportation corridor, cross-county and cross-provincial route organization should be strengthened, and the overall attractiveness should be enhanced through tourism scenic byways, cultural corridors, and the connection of node villages. For the hinterland of the Qinghai–Tibet Plateau, the northwestern arid region, and sparsely distributed border areas, large-scale and high-intensity development should be avoided, and small-scale, low-disturbance, and community-participatory development paths should be prioritized.
5.2.2. Follow the Micro-Geomorphic Rule of Low Slope and Low Terrain Relief, and Control the Development Intensity of Ecologically Fragile Areas
The study finds that although key rural tourism villages in western China are distributed within macro-geomorphic backgrounds such as plateaus and mountains, their micro-level site selection clearly tends toward local flat spaces with relatively small slopes and low terrain relief. Therefore, the subsequent cultivation of key villages and infrastructure construction should give priority to river valleys, Bazi areas, terraces, and basin-margin areas with relatively low geological risks, controllable construction costs, and convenient transportation organization. For areas with large slopes, fragmented terrain, and ecological fragility, disaster risk assessment and ecological carrying-capacity constraints should be strengthened, and high-intensity tourism facilities should be avoided in areas sensitive to landslides, debris flows, and soil erosion [40]. For middle- and high-elevation areas, the general expression of “health tourism” should not be used indiscriminately. Instead, low-intensity products such as summer leisure, mountain sightseeing, ecological experience, and ethnic–cultural experience should be developed cautiously according to elevation, climate comfort, and tourist adaptability, and health-risk warnings for special groups in high-elevation areas should be clearly provided.
5.2.3. Build a Cross-Regional Cultural Corridor Coordination Mechanism Based on Differences in Historical–Cultural Types
Folk-custom inheritance villages and red-culture heritage villages account for relatively high proportions, indicating that cultural resources are an important support for key rural tourism villages in western China. For folk-custom inheritance villages, intangible cultural heritage displays, traditional festivals, ethnic architecture, and everyday-life landscapes should be taken as the core, and a development mechanism of “village authenticity protection–cultural display–community benefit sharing” should be established. For red-culture heritage villages, cross-county study-tour routes and a shared red-tourism brand should be developed around Long March routes, revolutionary base areas, and red education bases. For ancient trade-route heritage villages, cross-regional route alliances should be established in combination with the Silk Road, the Tea Horse Road, ancient post roads, and river-valley commercial nodes, with unified signage systems, interpretation systems, and marketing platforms, so as to avoid isolated development of individual villages [41].
5.2.4. Improve the Accessibility Network of “Main Roads–Node Villages–Surrounding Villages” According to Population–Transportation Combined Conditions
The study shows that key villages have an evident spatial proximity relationship with major roads, while population density and road density are highly correlated. Therefore, transportation optimization should not only emphasize road construction itself, but should also be combined with tourist-source markets, public services, and tourism route organization. For areas around urban agglomerations and densely populated regions, weekend leisure transportation, public transport connections, park-and-ride facilities, and slow-traffic systems should be improved to enhance the experience of suburban rural tourism. For sparsely connected areas such as northwestern China and the Qinghai–Tibet region, trunk transportation corridors such as G318, G30, and G213 should be used to construct service stations, viewing nodes, supply facilities, and safety rescue systems, transforming transit traffic into tourism scenic byways. For villages far from main roads but with distinctive resources, reservation systems, small-group tourism, digital guiding, and community reception should be prioritized to avoid blind large-scale infrastructure investment.
5.2.5. Strengthen Regional Coordination and Benefit Sharing to Avoid Spatial Polarization in Key Village Construction
The distribution of key rural tourism villages in western China is evidently uneven, and policy support should consider both the quality improvement of high-density core areas and the basic shortcoming supplementation of low-density peripheral areas. Core agglomeration areas should drive surrounding villages through regional branding, joint route construction, and industrial-chain extension. Sparse areas should improve basic operational capacity through fiscal subsidies, paired assistance, digital marketing, and talent training. At the same time, community participation and benefit-distribution mechanisms should be established to ensure that local residents can participate in tourism operations, cultural display, and public affairs decision-making, so as to avoid the problem that rural tourism development is dominated by external capital while community benefits remain limited [42].
6. Conclusions
Taking 563 national key rural tourism villages across 12 provinces, autonomous regions, and municipalities in western China as the research object, this study comprehensively applies GIS-based spatial analysis and statistical methods to examine their spatial distribution characteristics and natural and human influencing factors. The main conclusions are as follows:
(1) Spatial agglomeration and positive spatial autocorrelation are significant. Key rural tourism villages in western China exhibit an overall clustered distribution, with an average nearest neighbor index of (R = 0.64), indicating that their spatial layout has an evident tendency toward agglomeration. Meanwhile, the global Moran’s I of key village density is 0.229408 and reaches a significant level, indicating obvious positive spatial autocorrelation at the prefecture-level city and prefecture scale. Overall, key rural tourism villages in western China present a spatial structure characterized by “high concentration in core areas, extension along secondary corridors, and sparse distribution across vast hinterlands,” among which the Sichuan Basin, the Chongqing metropolitan area, and the Guanzhong Plain constitute high-density core agglomeration areas.
(2) There is a certain spatial association between the natural geographical environment and the distribution of key villages. Natural factors constitute an important environmental background for the spatial differentiation of key rural tourism villages in western China, and key villages generally show distribution characteristics of “proximity to water, gentle slopes, and low terrain relief.” In terms of river systems, key villages are mainly distributed in major river basins such as the Yangtze River and Yellow River basins, forming a spatial distribution pattern supported by major water systems. In terms of micro-topography, key villages are more concentrated in relatively gentle areas with slopes below 15° and terrain relief below 50 m, indicating that local terrain conditions with low slope and low relief are conducive to village construction, transportation organization, and the allocation of tourism reception facilities [43]. It should be noted that, influenced by the overall plateau–mountain geomorphic background of western China, approximately 60% of key villages are distributed in areas above 1000 m, reflecting the spatial relationship between rural tourism resources in western China and plateau–mountain landscapes and ethnic–cultural resources. However, correlation analysis also shows a negative association between increasing elevation and decreasing key village density. Therefore, natural factors are more appropriately understood as basic constraints and environmental background for the spatial distribution of key villages, rather than as a single direct causal factor.
(3) Human and socioeconomic factors show compound association characteristics. Population density and road density are both positively correlated with key village density, but there is also a high correlation between them, indicating that population agglomeration areas often also have better transportation accessibility, public services, and market foundations [44]. The Geodetector results further show that population density and road density have relatively high single-factor explanatory power, and the explanatory power for the spatial differentiation of key village density is enhanced after their interaction. The location quotient of road buffer zones also shows that key villages are relatively enriched in areas close to major roads. Therefore, transportation conditions should be understood together with population foundations, market access, and public service capacity, rather than as a separate decisive factor. In terms of historical culture, folk-custom inheritance villages and red-culture heritage villages account for relatively high proportions, while ancient architecture and agricultural heritage villages, ancient trade-route heritage villages, and frontier garrison heritage villages show certain spatial associations with traditional agricultural regions, historical trade routes, and frontier garrison history, respectively, indicating that historical–cultural resources are an important dimension for understanding the spatial differences of key rural tourism villages in western China. It should be noted that this study adopts the principle of dominant cultural attributes for classification, and the multiple cultural attributes of some villages may be simplified. Future research can further adopt multi-label classification, field interviews, and coding consistency tests to improve classification accuracy.
Author Contributions
Conceptualization, M.L.; Data Curation, M.L., Y.Z., Z.T. and Y.B.; Methodology, M.L.; Software, Y.Z.; Writing—Original Draft, M.L.; Writing—Review and Editing, Y.Z., Z.T., Y.B. and Y.T.; M.L. and Y.Z. performed the data analysis and wrote the manuscript; M.L., Y.Z., Z.T., Y.B., Y.T. and C.S. corrected our manuscript drafts; supervision, C.S. All authors have read and agreed to the published version of the manuscript.
Funding
This work was supported by Annual Project of National Social Science Fund Arts Project for Western Regions: Research on the Evaluation of Yellow River Cultural Heritage Value and the Construction of Cultural Tourism Brands (grant No. 25EH283).
Data Availability Statement
The data used to support the findings of this study are available from the corresponding author upon request.
Conflicts of Interest
The authors declare no conflicts of interest.
Appendix A
Table A1.
Classification criteria for the cultural types of key rural tourism villages.
References
- Gao, Y.; Zhang, H.; Shi, X. Sustainable Spatial Distribution and Determinants of Key Rural Tourism Villages in China: Promoting Balanced Regional Development. Sustainability 2024, 16, 8572. [Google Scholar] [CrossRef] [Scilit]
- Zhu, L.; Hu, J.; Xu, J.; Li, Y.; Liang, M. Spatial Distribution Characteristics and Influencing Factors of Pro-Poor Tourism Villages in China. Sustainability 2022, 14, 15953. [Google Scholar] [CrossRef] [Scilit]
- Niu, J.; Guo, H.; He, W.; Xu, F.; Zhang, G. The spatial distribution characteristics and influencing factors of key villages in rural tourism in China. PLoS ONE 2025, 20, e0330486. [Google Scholar] [CrossRef] [Scilit] [PubMed]
- Cao, H.; Kim, E. Analysis of Influencing Factors on Spatial Distribution Characteristics of Traditional Villages in the Liaoxi Corridor. Land 2025, 14, 1572. [Google Scholar] [CrossRef] [Scilit]
- Zhu, L.; Hu, J.; Xu, J.; Li, Y.; Xie, T.; Liang, M. Spatial distribution patterns and factors influencing rural tourism destinations: An empirical study of China’s agritainment resorts. PLoS ONE 2024, 19, e0308415. [Google Scholar] [CrossRef] [Scilit] [PubMed]
- Zhao, H.; Zheng, J.; Ma, S.; Zhao, L.; Xu, P.; Li, J. Spatial distribution and influencing factors analysis of national key rural tourism villages in the Yangtze River Delta region based on geographically weighted regression. PLoS ONE 2023, 18, e0291614. [Google Scholar] [CrossRef] [Scilit] [PubMed]
- Du, J.; Zhao, B.; Feng, Y. Spatial distribution and influencing factors of rural tourism: A case study of Henan Province. Heliyon 2024, 10, e29039. [Google Scholar] [CrossRef] [Scilit] [PubMed]
- Zhang, Z.; Cui, Z.; Fan, T.; Ruan, S.; Wu, J. Spatial distribution of intangible cultural heritage resources in China and its influencing factors. Sci. Rep. 2024, 14, 4960. [Google Scholar] [CrossRef] [Scilit] [PubMed]
- Hei, Y.; Sui, Y.; Gao, W.; Zhao, M.; Hu, M.; Gao, M. Geodetector-Based Analysis of Spatiotemporal Distribution Characteristics and Influencing Mechanisms for Rural Homestays in Beijing. Land 2025, 14, 997. [Google Scholar] [CrossRef] [Scilit]
- Feng, X.-B. Coupling and coordinated development of traffic accessibility and regional tourism economy. Res. Transp. Bus. Manag. 2023, 49, 101010. [Google Scholar] [CrossRef] [Scilit]
- Yang, J.; Ma, H.; Weng, L. Transformation of Rural Space under the Impact of Tourism: The Case of Xiamen, China. Land 2022, 11, 928. [Google Scholar] [CrossRef] [Scilit]
- Boros, A.K.; Korcsmáros, E. Development Prospects of Rural Tourism Along the Danube: Key Factors of Satisfaction and the Role of Sustainability. Folia Geogr. 2024, 66, 5–35. [Google Scholar] [CrossRef]
- Yuan, X.; Li, Y.; Song, Y.; Lu, H.; Wang, Y.; Ge, B.; Wang, J. Spatial Distribution Characteristics and Driving Factors of 777 Traditional Villages in Yunnan Province: A Study Based on GWR Model and Geodetector. Land 2024, 13, 2004. [Google Scholar] [CrossRef] [Scilit]
- Fu, Y.; Cai, Z.; Fang, C. Hotspot Identification and Causal Analysis of Chinese Rural Tourism at Different Spatial and Temporal Scales Based on Tourism Big Data. Sustainability 2024, 16, 1165. [Google Scholar] [CrossRef] [Scilit]
- Demkova, M.; Sharma, S.; Mishra, P.; Dahal, D.R.; Pachura, A.; Herman, G.; Kostilnikova, K.; KolesÁrovÁ, J.; Matlovičová, K. Potential for sustainable development of rural communities by community-based ecotourism a case study of rural village pastanga, sikkim himalaya, india. Geoj. Tour. Geosites 2022, 43, 964–975. [Google Scholar] [CrossRef] [Scilit]
- Li, Z.; Yang, M.; Zhou, X.; Li, Z.; Li, H.; Zhai, F.; Zhang, Y.; Zhang, Y. Research on the spatial correlation and formation mechanism between traditional villages and rural tourism. Sci. Rep. 2023, 13, 8210. [Google Scholar] [CrossRef] [Scilit] [PubMed]
- Dang, P.; Ren, L.; Li, J. Livelihood Resilience or Policy Attraction? Factors Determining Households’ Willingness to Participate in Rural Tourism in Western China. Int. J. Environ. Res. Public Health 2022, 19, 7224. [Google Scholar] [CrossRef] [Scilit] [PubMed]
- Lobsang, T.; Zhao, M.; Zeng, Y.; Zhang, J.; Liu, Z.; Li, P. Spatial Layout Optimization of Rural Tourism Destinations in Mountainous Areas Based on Gap Analysis Method: A Case Study in Southwest China. Land 2025, 14, 1357. [Google Scholar] [CrossRef] [Scilit]
- Chang, B.; Ding, X.; Xi, J.; Zhang, R.; Lv, X. Spatial-Temporal Distribution Pattern and Tourism Utilization Potential of Intangible Cultural Heritage Resources in the Yellow River Basin. Sustainability 2023, 15, 2611. [Google Scholar] [CrossRef] [Scilit]
- Wu, K.; Su, W.; Ye, S.a.; Li, W.; Cao, Y.; Jia, Z. Analysis on the geographical pattern and driving force of traditional villages based on GIS and Geodetector: A case study of Guizhou, China. Sci. Rep. 2023, 13, 20659. [Google Scholar] [CrossRef] [Scilit] [PubMed]
- Zhang, Y.; Tian, Z.; Du, J.; Bi, S. Multidimensional Evaluation of Traditional Villages in Jiangnan Region, China: Spatial Pattern, Accessibility and Driving Factors. Buildings 2024, 14, 823. [Google Scholar] [CrossRef] [Scilit]
- Ding, F.; Zhang, S.; Dai, L. Spatial distribution characteristics and influencing factors of tourism resources based on point of interest data. PLoS ONE 2024, 19, e0310487. [Google Scholar] [CrossRef] [Scilit] [PubMed]
- Liao, C.; Zuo, Y.; Law, R.; Wang, Y.; Zhang, M. Spatial Differentiation, Influencing Factors, and Development Paths of Rural Tourism Resources in Guangdong Province. Land 2022, 11, 2046. [Google Scholar] [CrossRef] [Scilit]
- Yang, J.; Fang, Y.; Jiang, N. Rural Tourism Agglomeration Characteristics in Jilin Province and Their Influencing Factors. Sustainability 2025, 17, 8028. [Google Scholar] [CrossRef] [Scilit]
- Wang, Q.; Yu, S.; Li, X.; Wang, S. Investigating Spatial Distribution Characteristics and Influencing Factors of Traditional Villages in Southwest China from the Perspective of Human–Land Relationship. Sustainability 2026, 18, 1894. [Google Scholar] [CrossRef] [Scilit]
- Zeng, J.; Guan, X.; Zhang, X.; Li, Y.; Wei, S.; Chen, Y.; Yin, J.; Yang, Y. Multidimensional Spatial–Cultural Clustering of Traditional Villages in Northwestern Yunnan Based on a Four-Dimensional Analytical Framework for Sustainable Conservation. Sustainability 2026, 18, 3818. [Google Scholar] [CrossRef] [Scilit]
- Li, Q.; Ai, M.; Luo, J.; Sun, Y.; Tian, L. Three-step optimization based on a multi-model of rural tourism sites. PLoS ONE 2025, 20, e0332878. [Google Scholar] [CrossRef] [Scilit] [PubMed]
- Bao, W.; Liu, Y. Spatial Characteristics and Influencing Factors of Traditional Villages Distribution in the Yellow River Basin. Sustainability 2025, 17, 4834. [Google Scholar] [CrossRef] [Scilit]
- Song, M.; Kim, J.-E. Spatial Distribution Characteristics and Driving Factors of Traditional Villages in Henan Province: A Multi-Method Comprehensive Analysis. Sustainability 2025, 17, 10825. [Google Scholar] [CrossRef] [Scilit]
- Liu, H.; Shi, G.; Xiao, W. Who Drives Rural Spatial Commodification? A Case Study of a Village in the Mountainous Region of Southwest China. Land 2025, 14, 1351. [Google Scholar] [CrossRef] [Scilit]
- Liu, Y.; Liao, H.; Qiu, J.; Liu, Y. Characteristics of Spatiotemporal Variations and Driving Factors of Land Use for Rural Tourism in Areas That Eliminated Poverty. Land 2023, 12, 910. [Google Scholar] [CrossRef] [Scilit]
- Zhang, Y.; Cai, T.; Liu, Z.; Shu, Y. Construction of Production-Living-Ecological Space Pattern Languages for Traditional Villages in Enshi Prefecture Based on Spatial Distribution Characteristics. Land 2025, 14, 1624. [Google Scholar] [CrossRef] [Scilit]
- Luo, X.; Zhang, J. A Quantitative Method for Characterizing the Spatial Layout Features of Ethnic Minority Rural Settlements in Southern China. Land 2025, 14, 1144. [Google Scholar] [CrossRef] [Scilit]
- Zeng, Z.; Shen, C.; Xu, M. Historical Insights into Sustainable Development: Analyzing the Spatiotemporal Dynamics of Ancient Trade and Settlements. Land 2024, 13, 701. [Google Scholar] [CrossRef] [Scilit]
- Liao, Z.; Zhang, L. Accessibility and influencing factors of leisure agriculture demonstration sites in Guangdong Province based on GWR model. Sci. Rep. 2025, 15, 23422. [Google Scholar] [CrossRef] [Scilit] [PubMed]
- Li, Z.; Wang, T.; Sun, S. Research on Quantitative Analysis Methods for the Spatial Characteristics of Traditional Villages Based on Three-Dimensional Point Cloud Data: A Case Study of Liukeng Village, Jiangxi, China. Land 2024, 13, 1261. [Google Scholar] [CrossRef] [Scilit]
- Duan, Y.; Chen, S.; Zhang, L.; Wang, D.; Liu, D.; Hou, Q. Spatial Distribution Characteristic and Type Classification of Rural Settlements: A Case Study of Weibei Plain, China. Sustainability 2023, 15, 8736. [Google Scholar] [CrossRef] [Scilit]
- Zhou, Y.; Lei, H. What Makes a Sustained Rural Tourism Development?—A Strategy Optimization Proposal Based on Stakeholder Simulation of an Evolutionary Game. Land 2025, 14, 2308. [Google Scholar] [CrossRef] [Scilit]
- Xia, J.; Deng, M.; Zhu, L. Assessing the location potential for tourism development of traditional villages in Sichuan province, China. Sci. Rep. 2025, 15, 28239. [Google Scholar] [CrossRef] [Scilit] [PubMed]
- Huang, S.; Sheng, D.; Wang, P.; Xiao, J.; Li, Q.; Liu, H. Assessment of ecotourism suitability in Qilian mountain National park. Sci. Rep. 2025, 15, 19529. [Google Scholar] [CrossRef] [Scilit] [PubMed]
- Dong, B.; Zhang, M.; Wang, H.; Wu, J. Study on the interaction mechanism among spatial patterns of traditional villages and tourism attractiveness and accessibility in Guizhou province. Sci. Rep. 2025, 15, 10365. [Google Scholar] [CrossRef] [Scilit] [PubMed]
- Brooks, C.; Waterton, E.; Saul, H.; Renzaho, A. Exploring the relationships between heritage tourism, sustainable community development and host communities’ health and wellbeing: A systematic review. PLoS ONE 2023, 18, e0282319. [Google Scholar] [CrossRef] [Scilit] [PubMed]
- Liu, Y.; Zhang, Y.; Genovese, P.V. An Integrated Geographical-Disaster Factor Approach for Sustainable Management: Case Study of Traditional Villages in Karst Mountains. Land 2025, 14, 2219. [Google Scholar] [CrossRef] [Scilit]
- Yue, Z.; Zheng, X.; Zhong, L.; Zhang, W. Urbanization, Rural E-Commerce Villages, and Regional Solutions for Urban–Rural Coordinated Development in China. Land 2025, 14, 2049. [Google Scholar] [CrossRef] [Scilit]
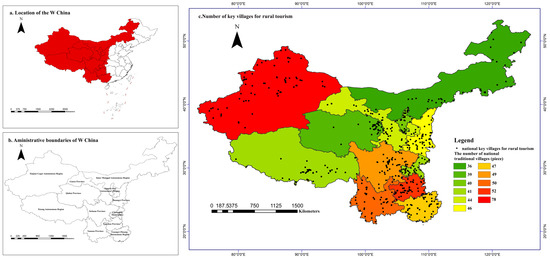
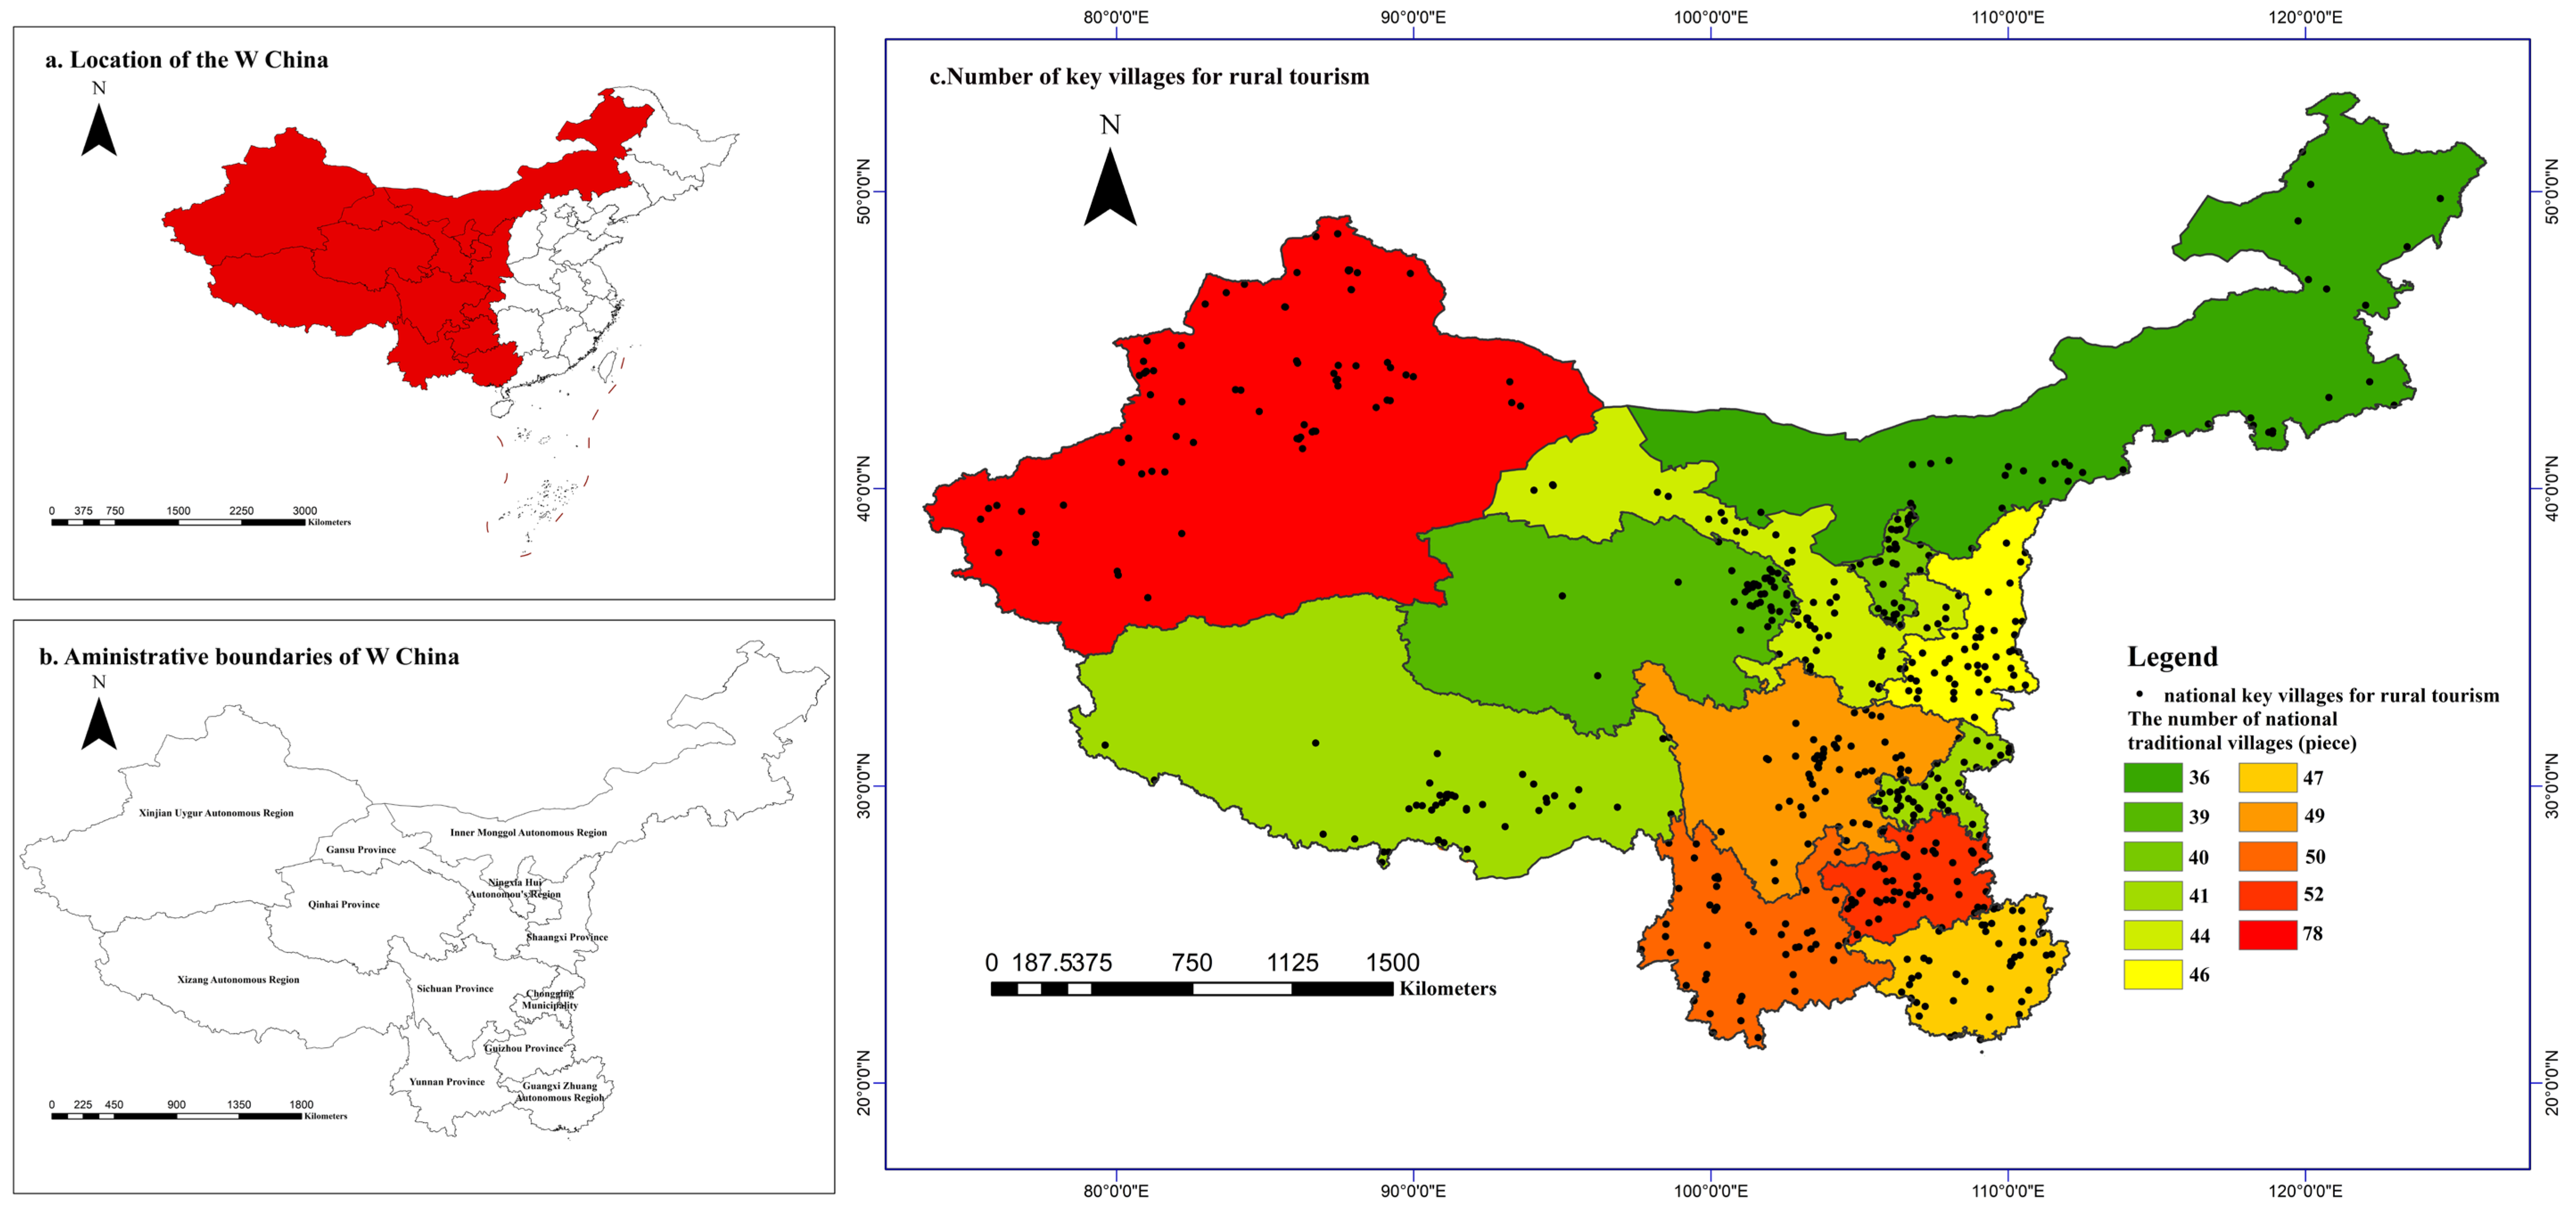
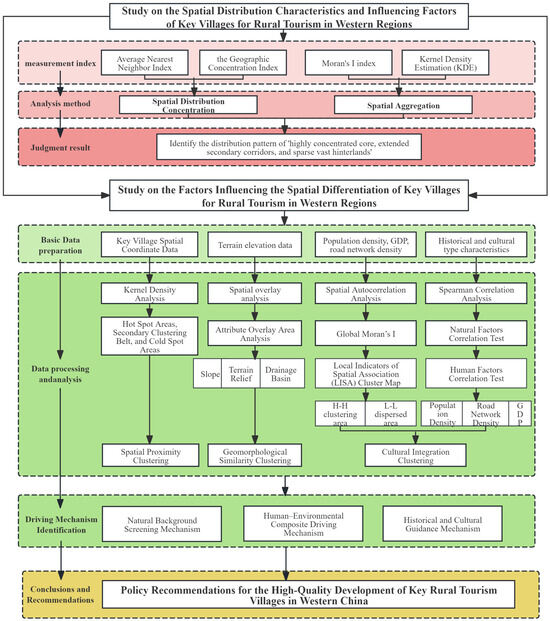
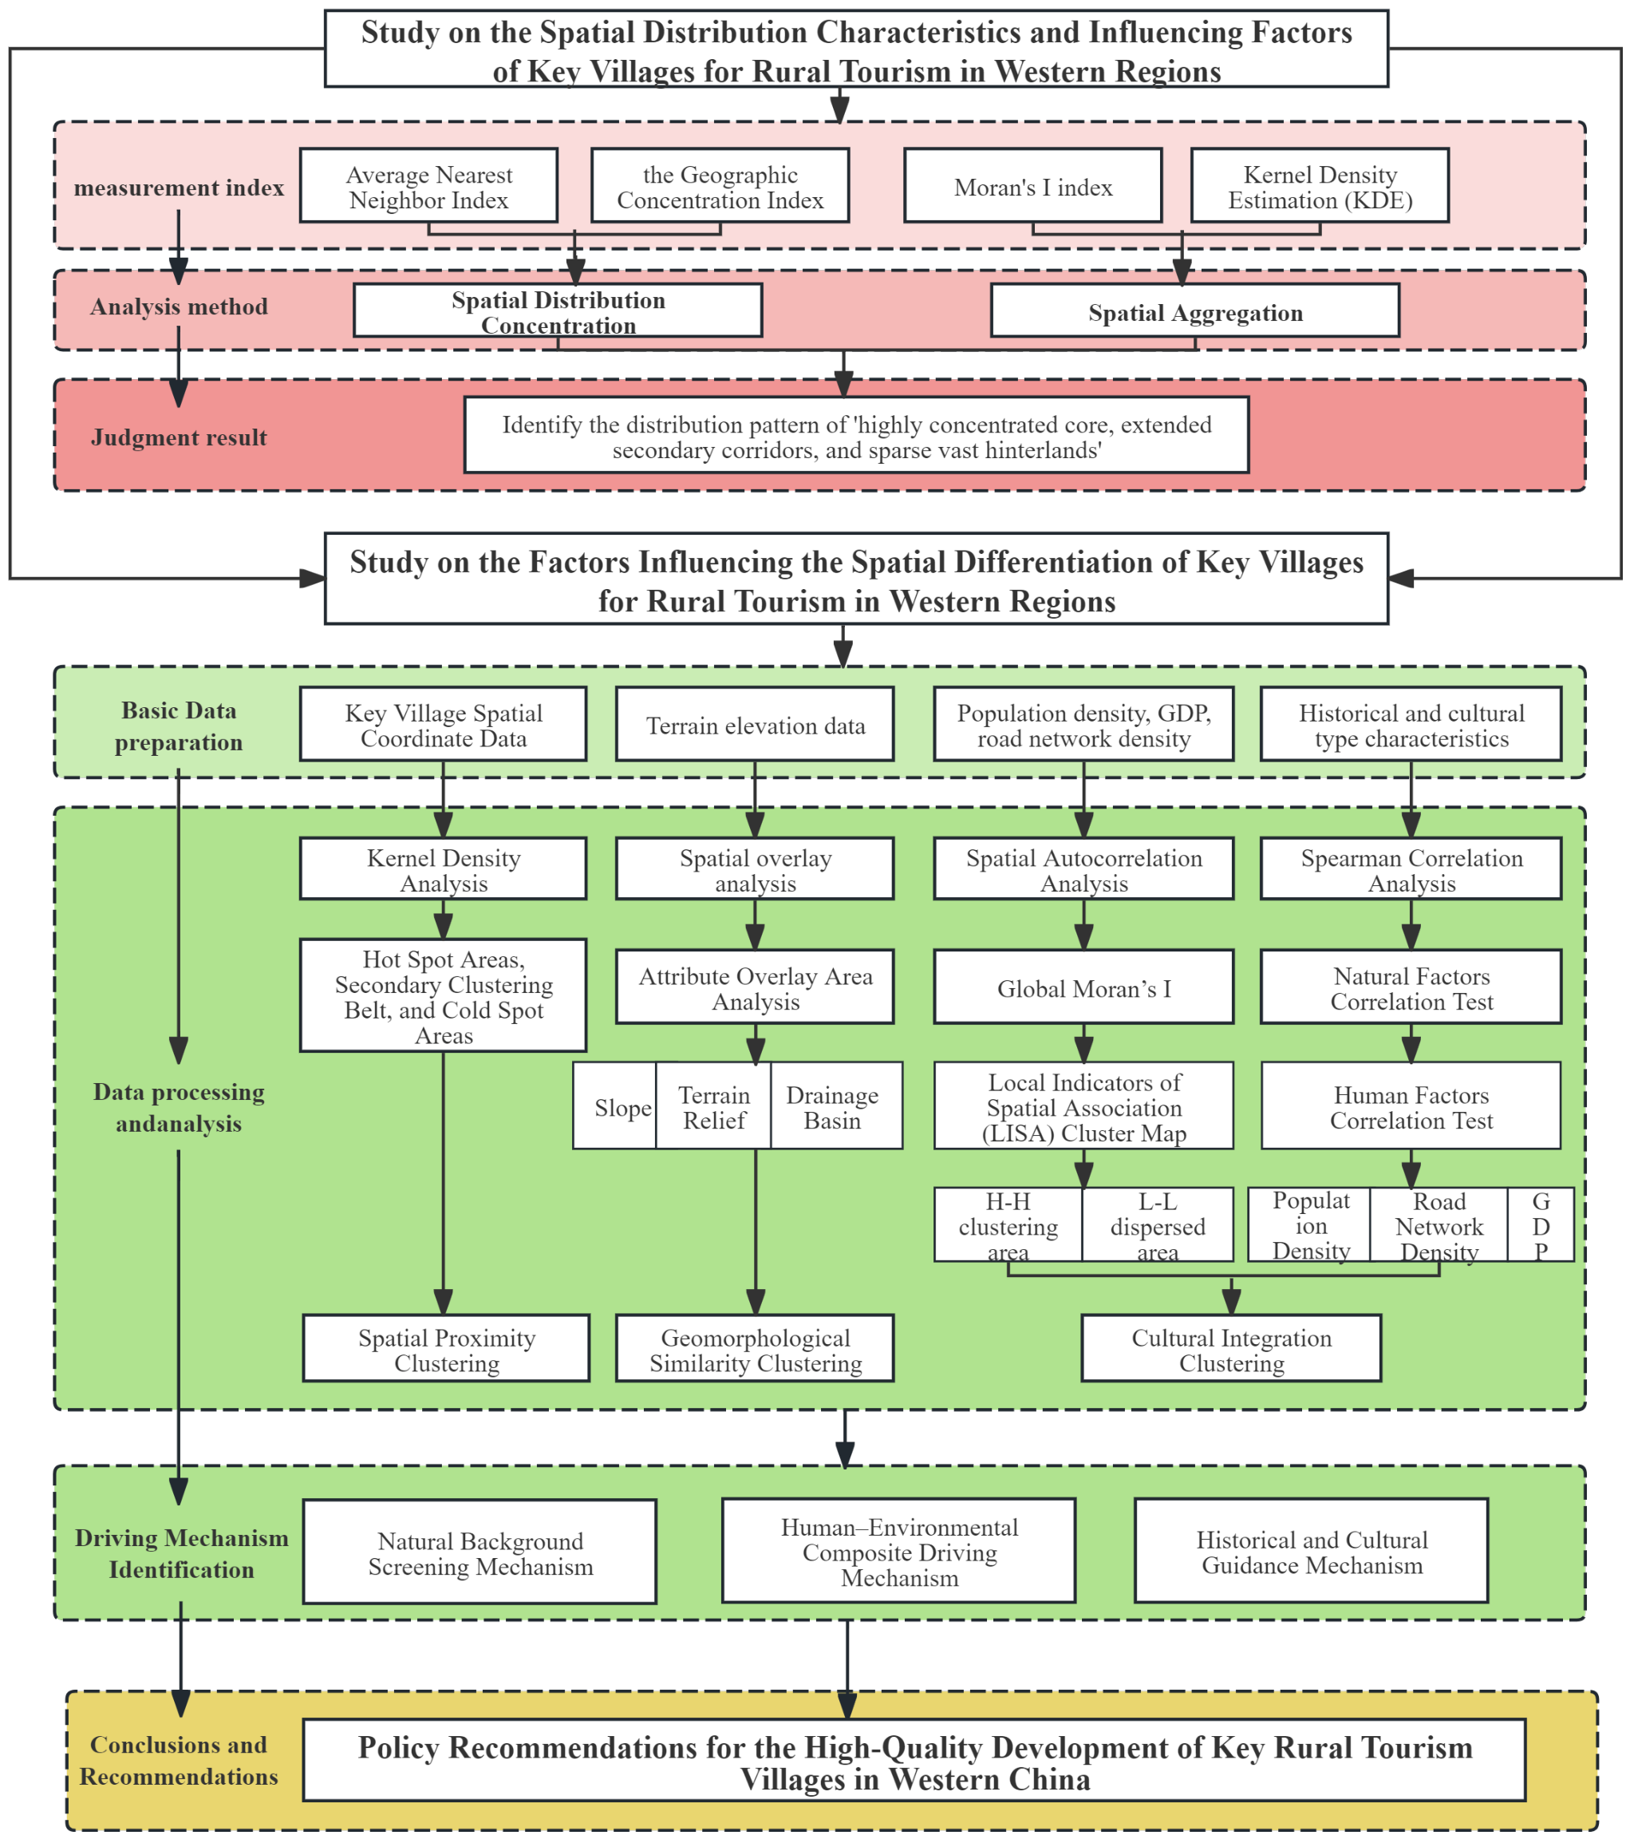
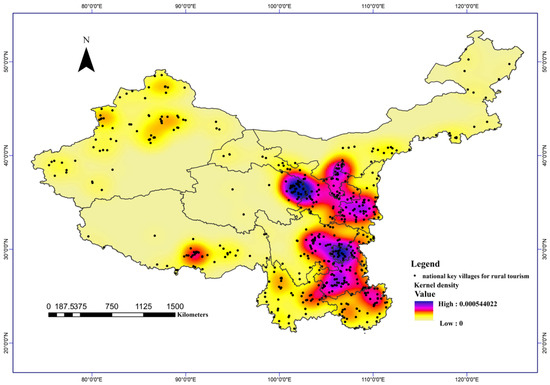
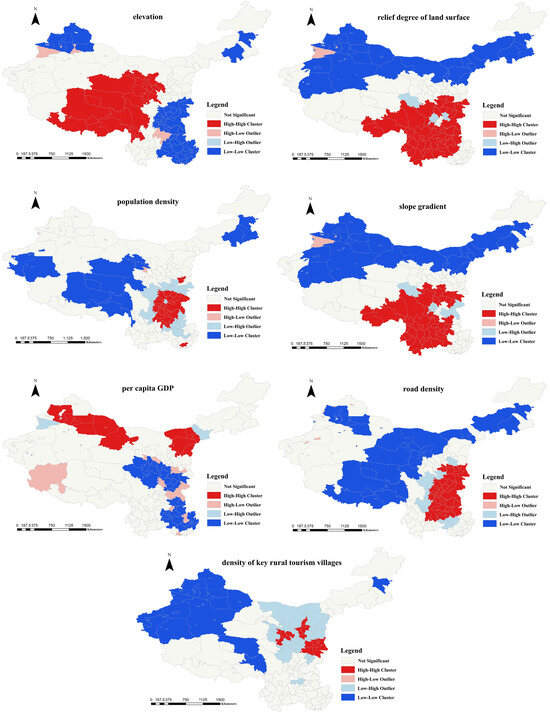
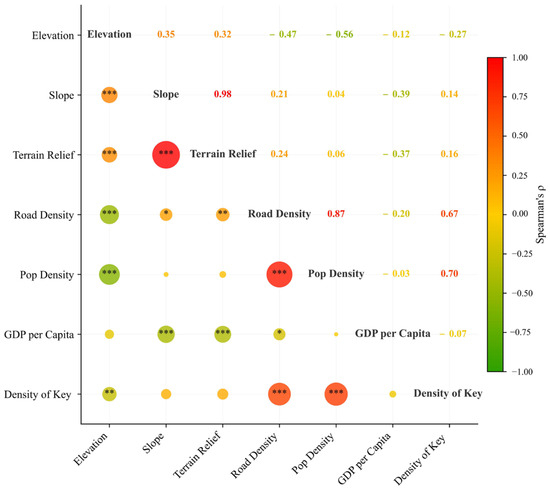
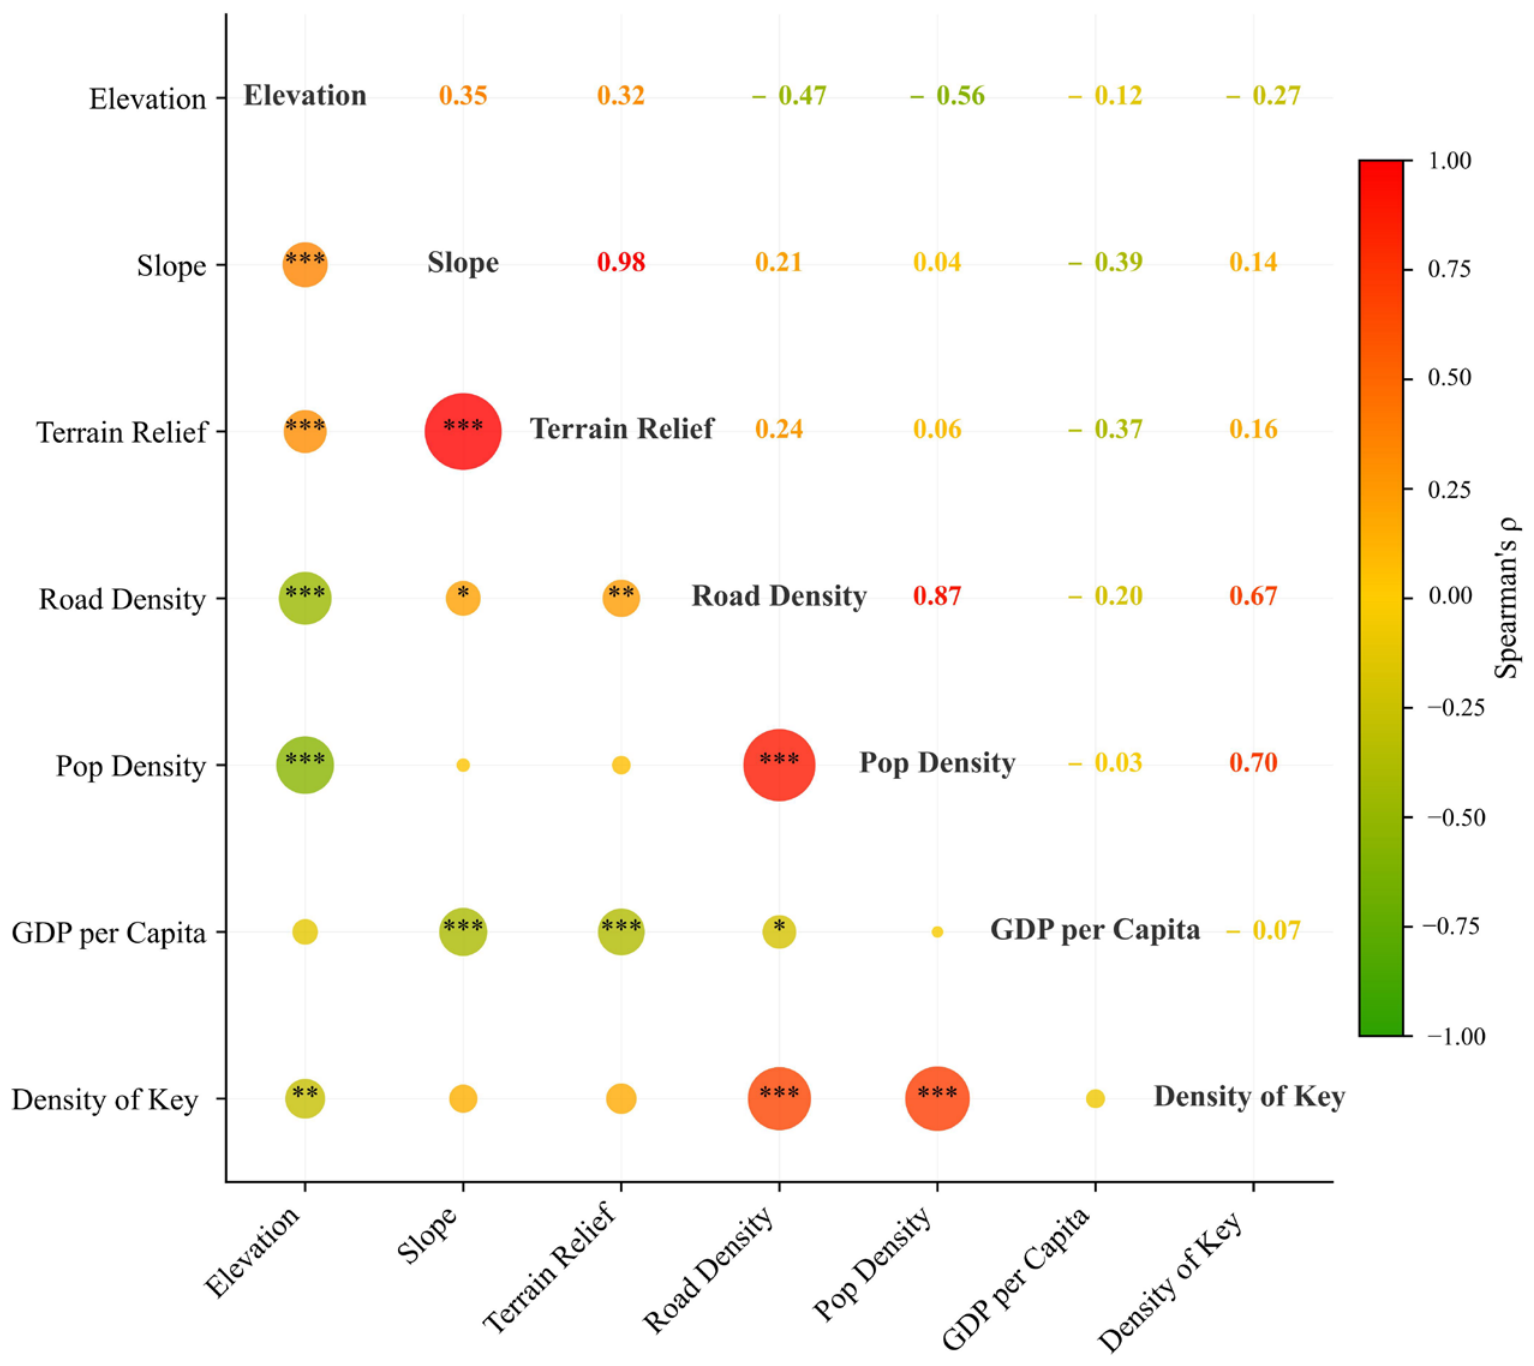
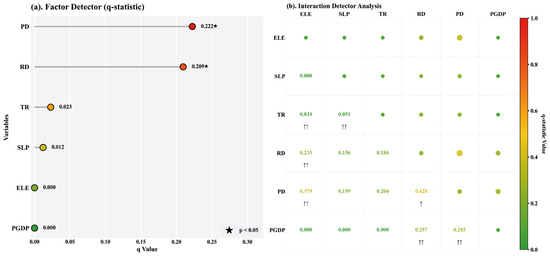
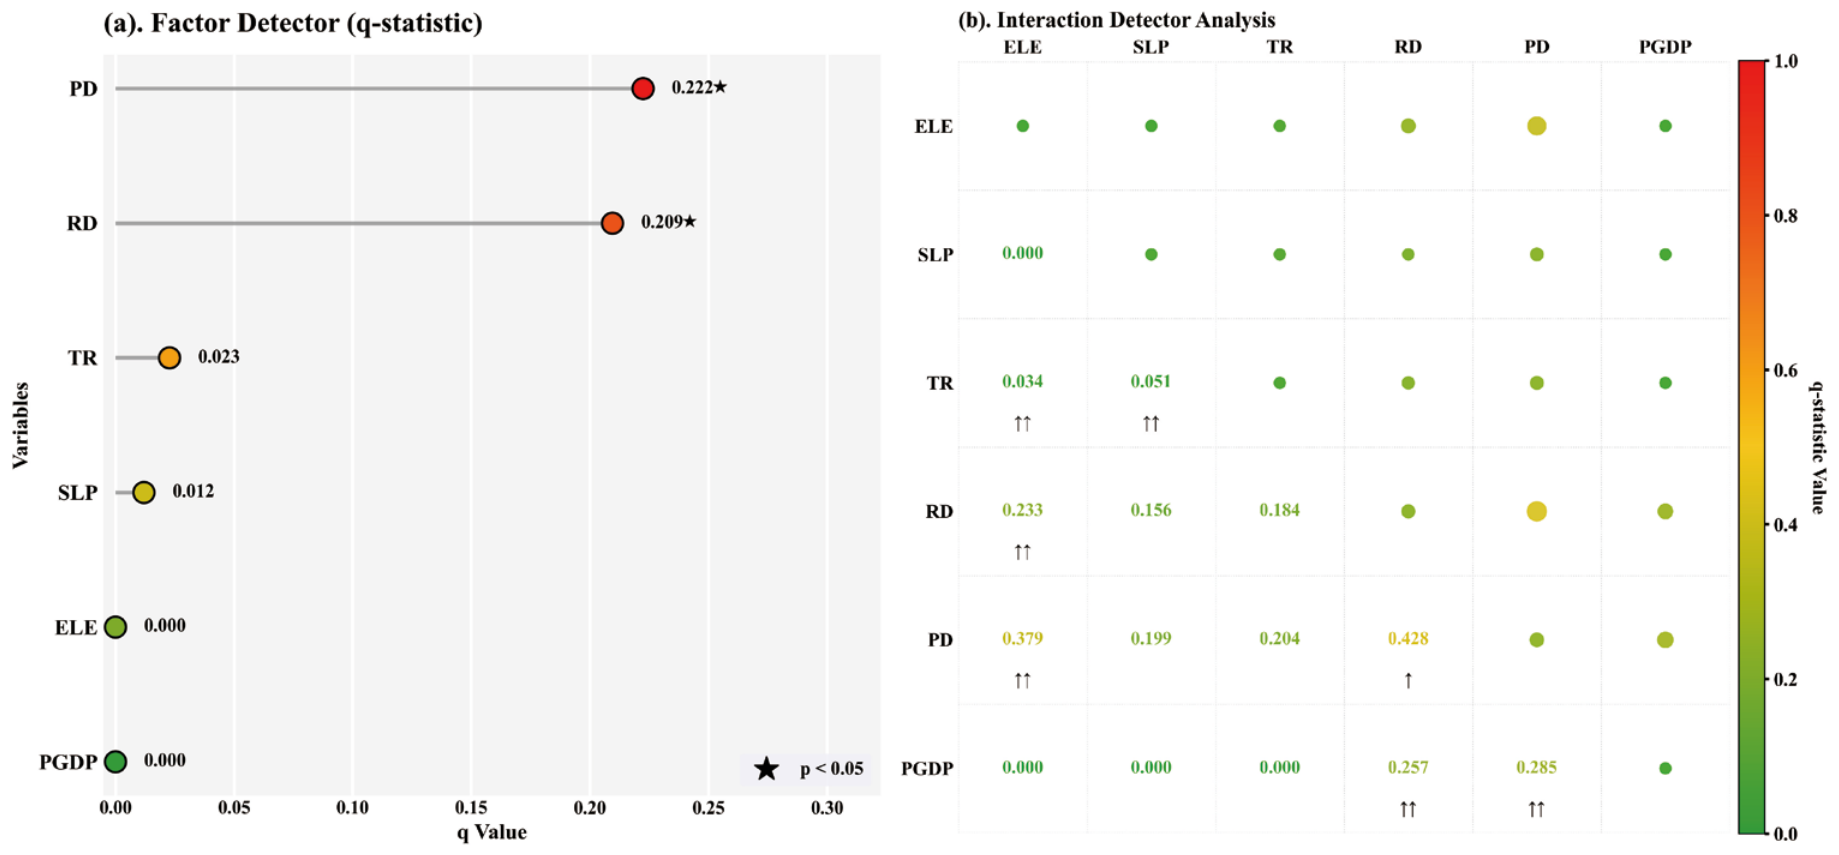
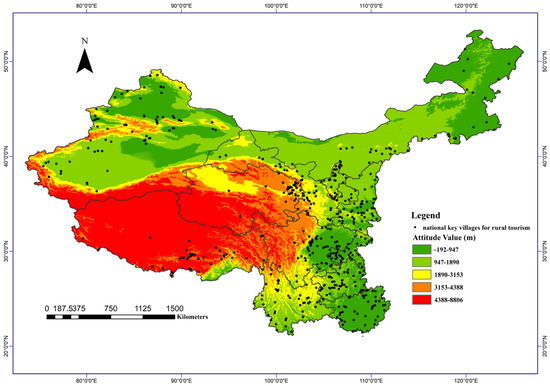
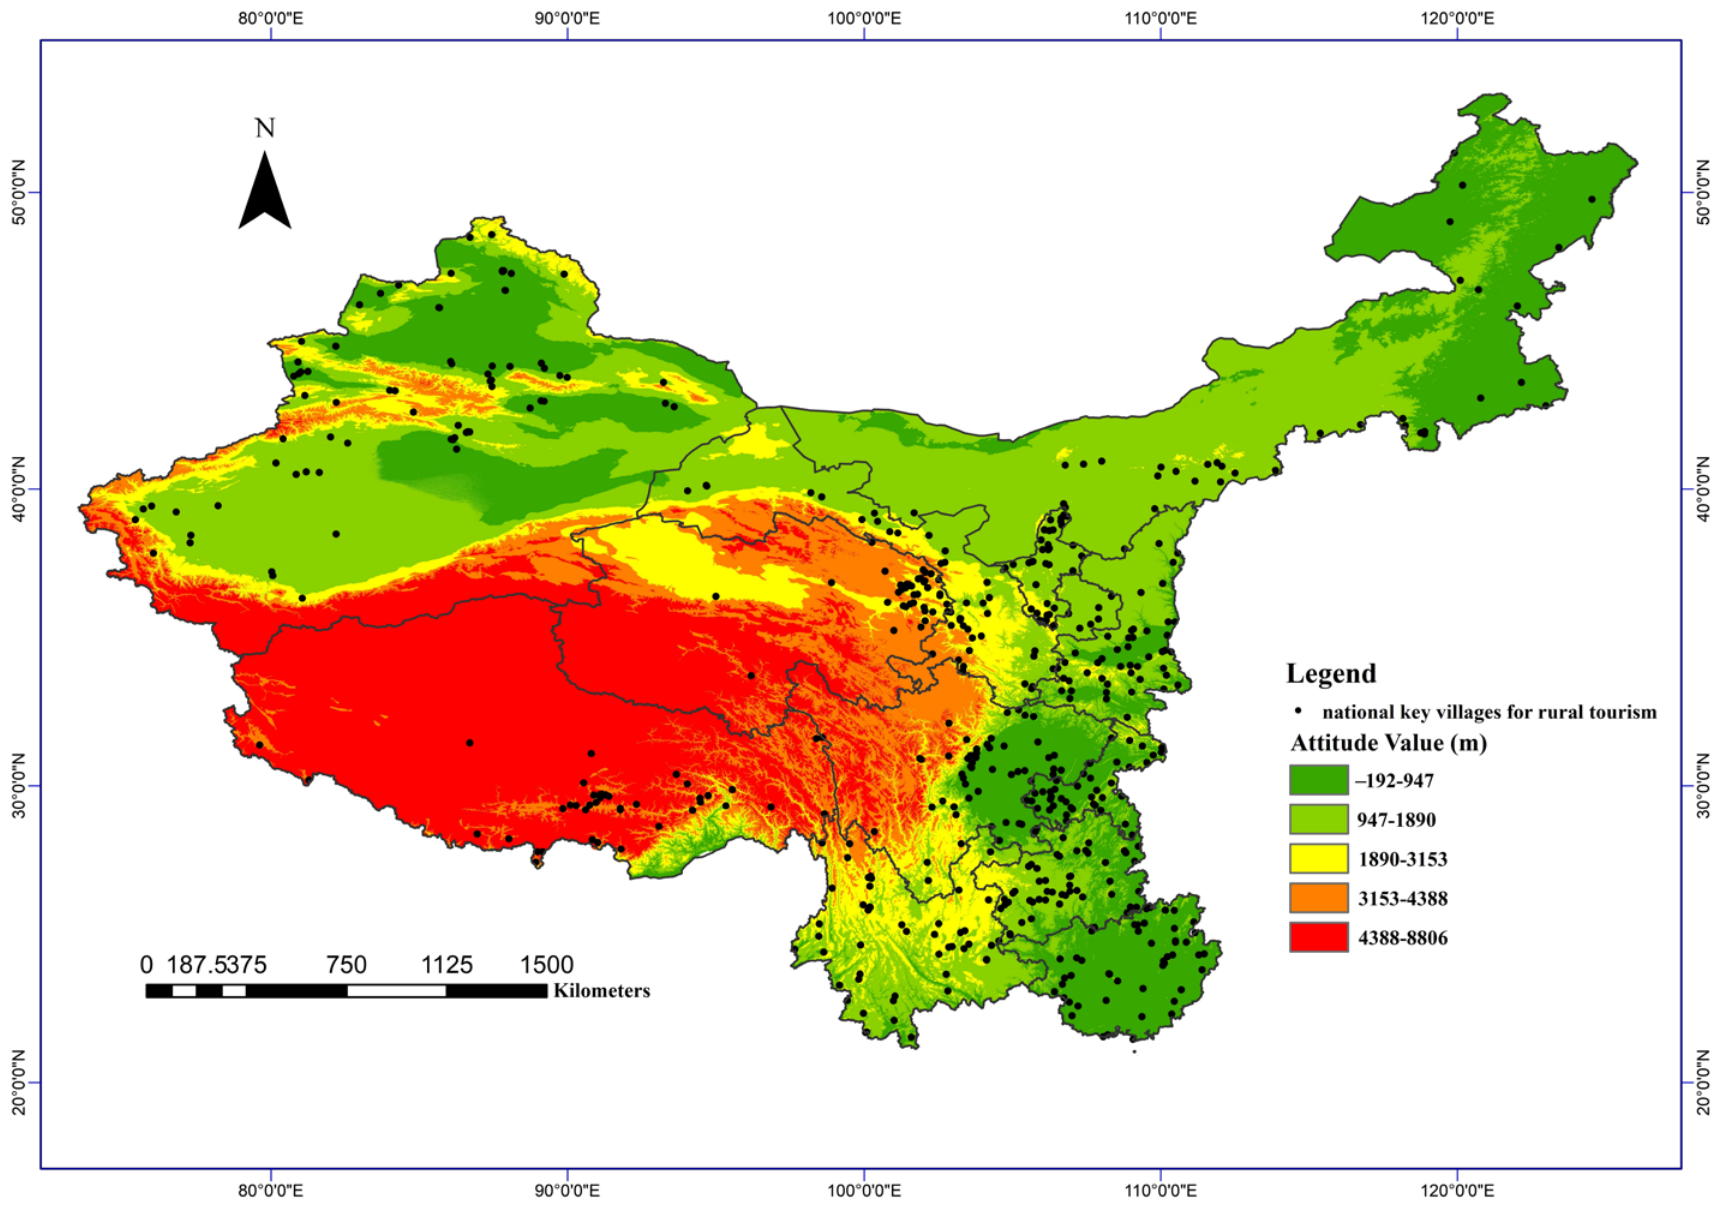
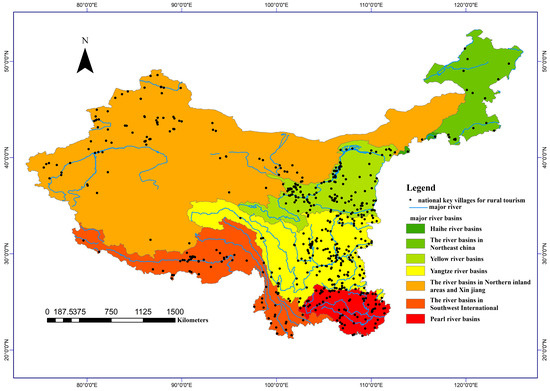
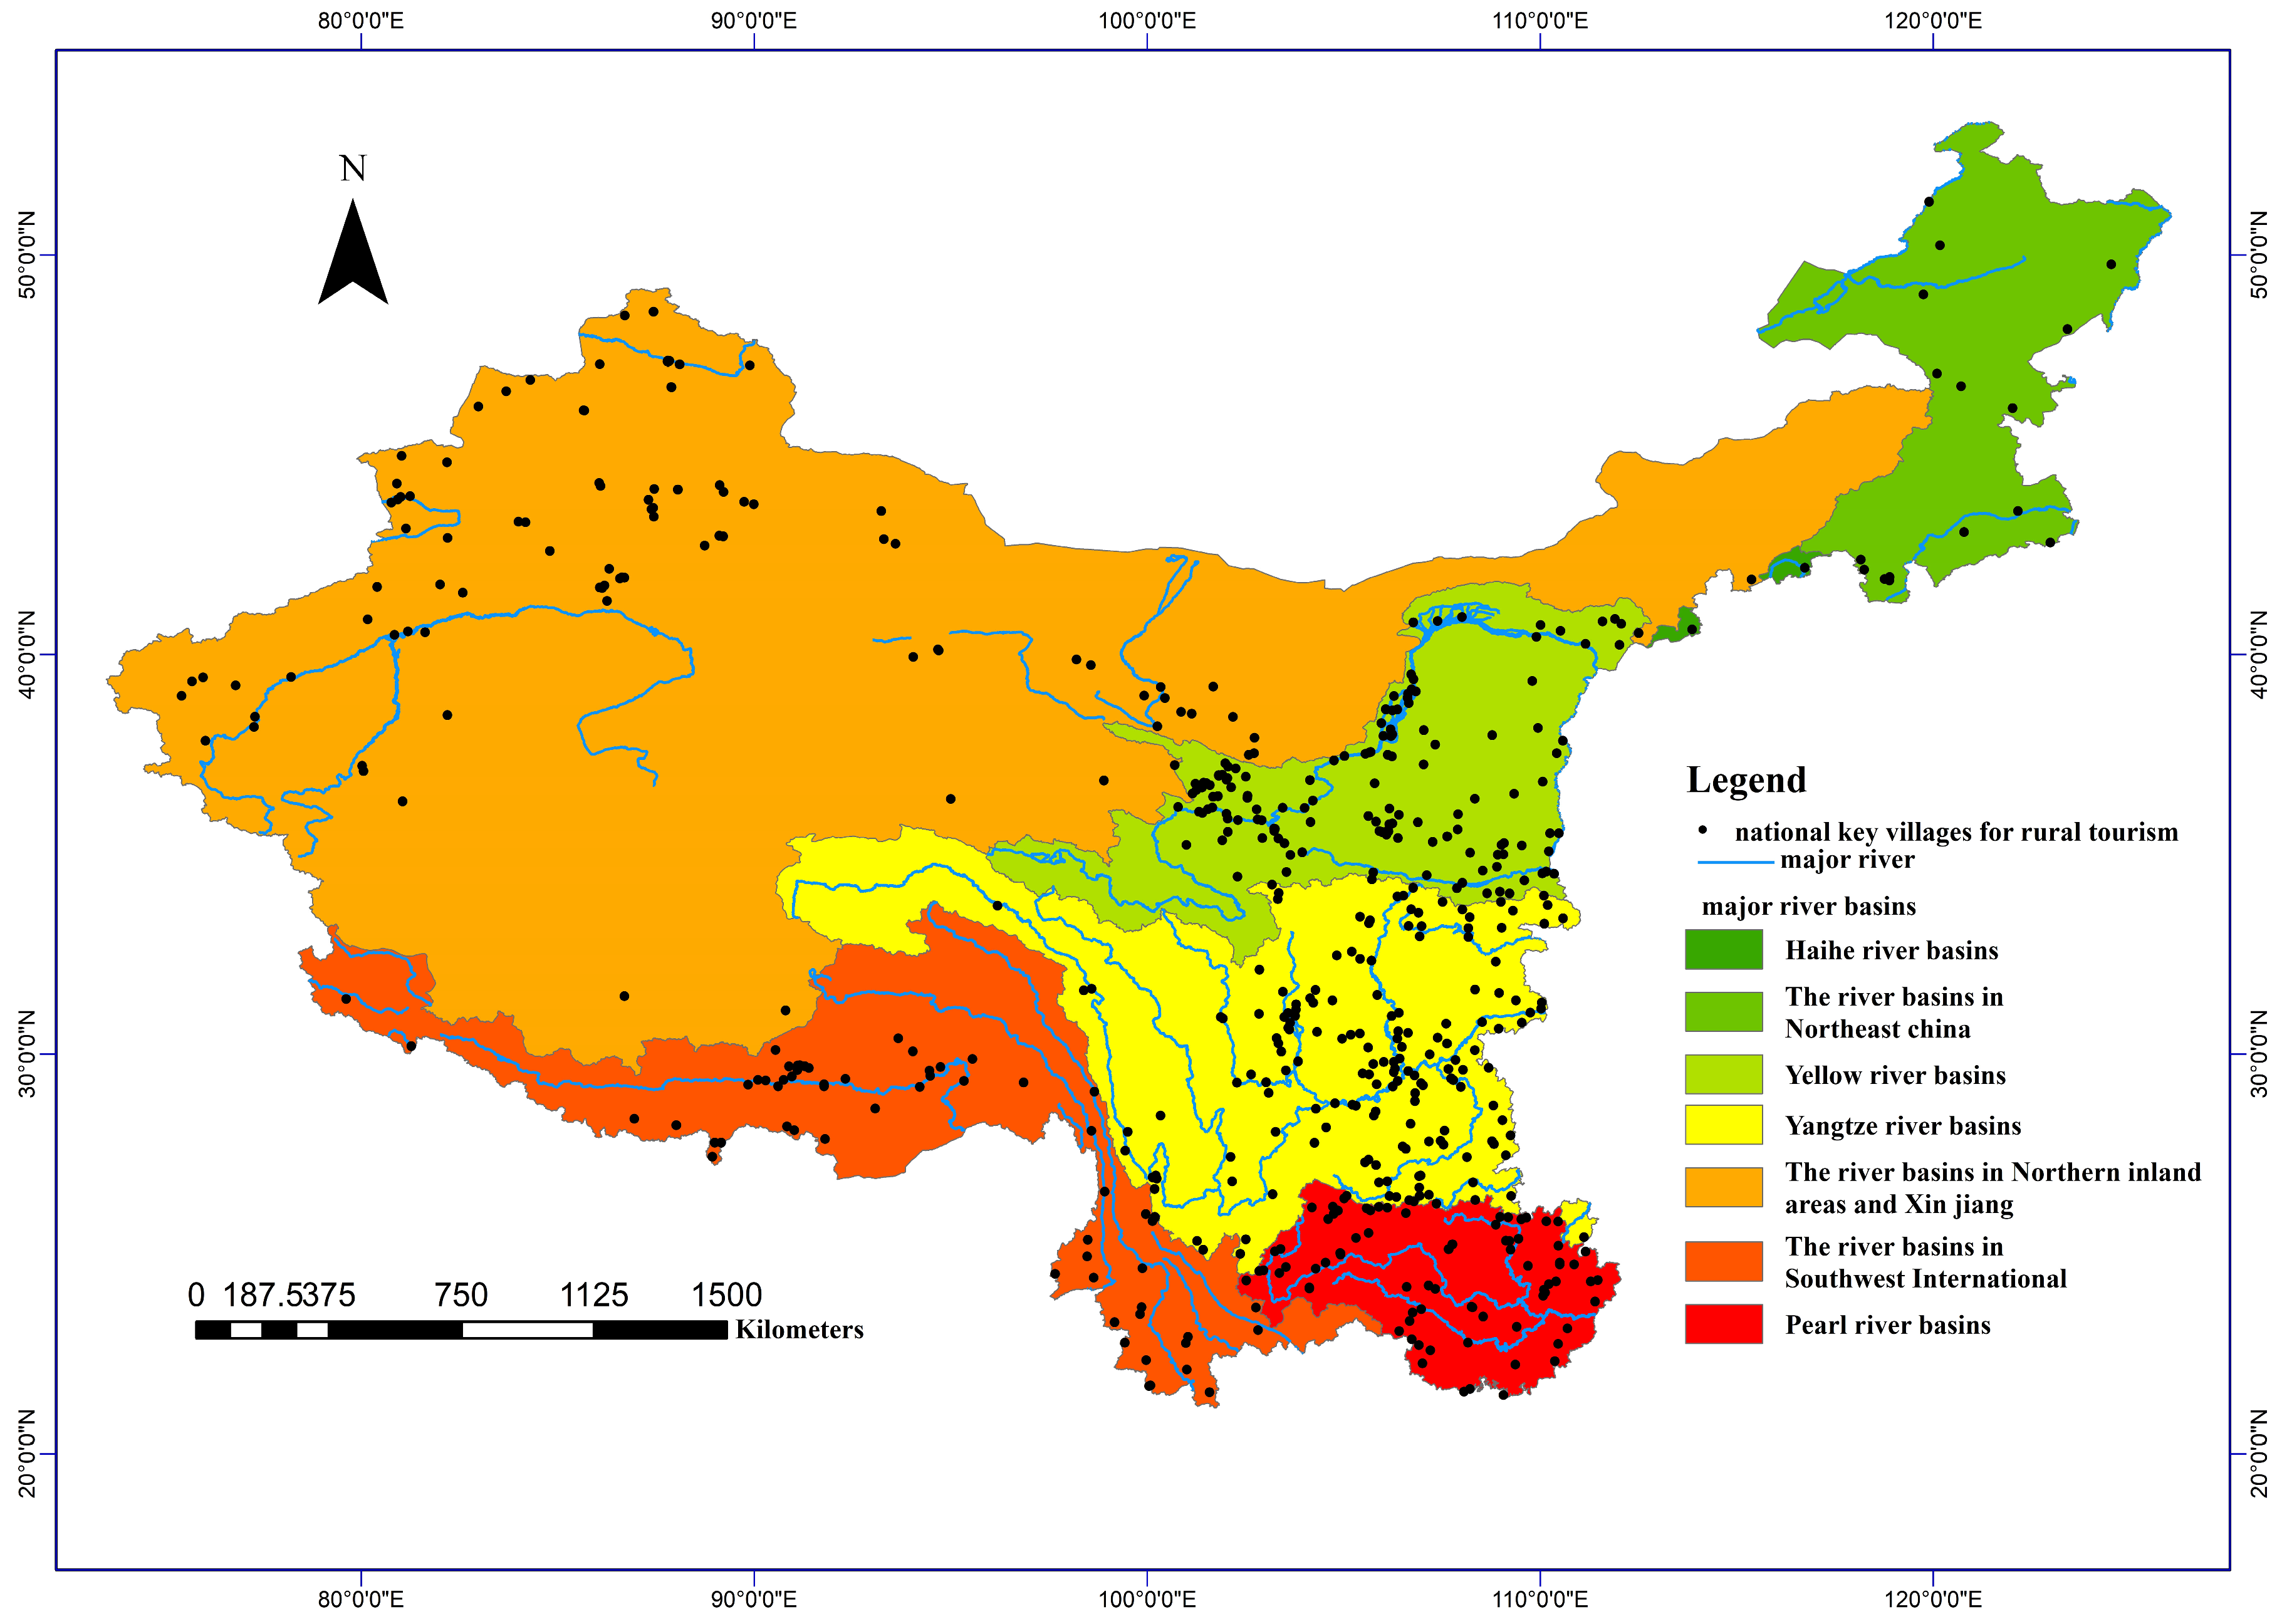
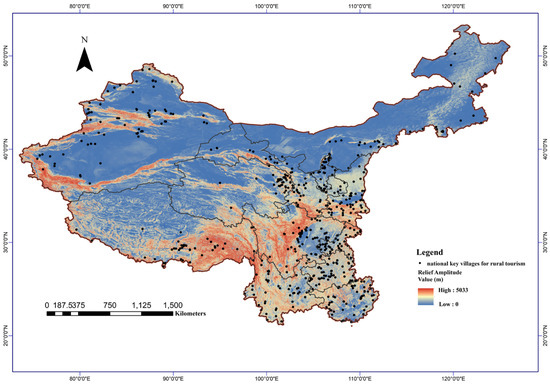
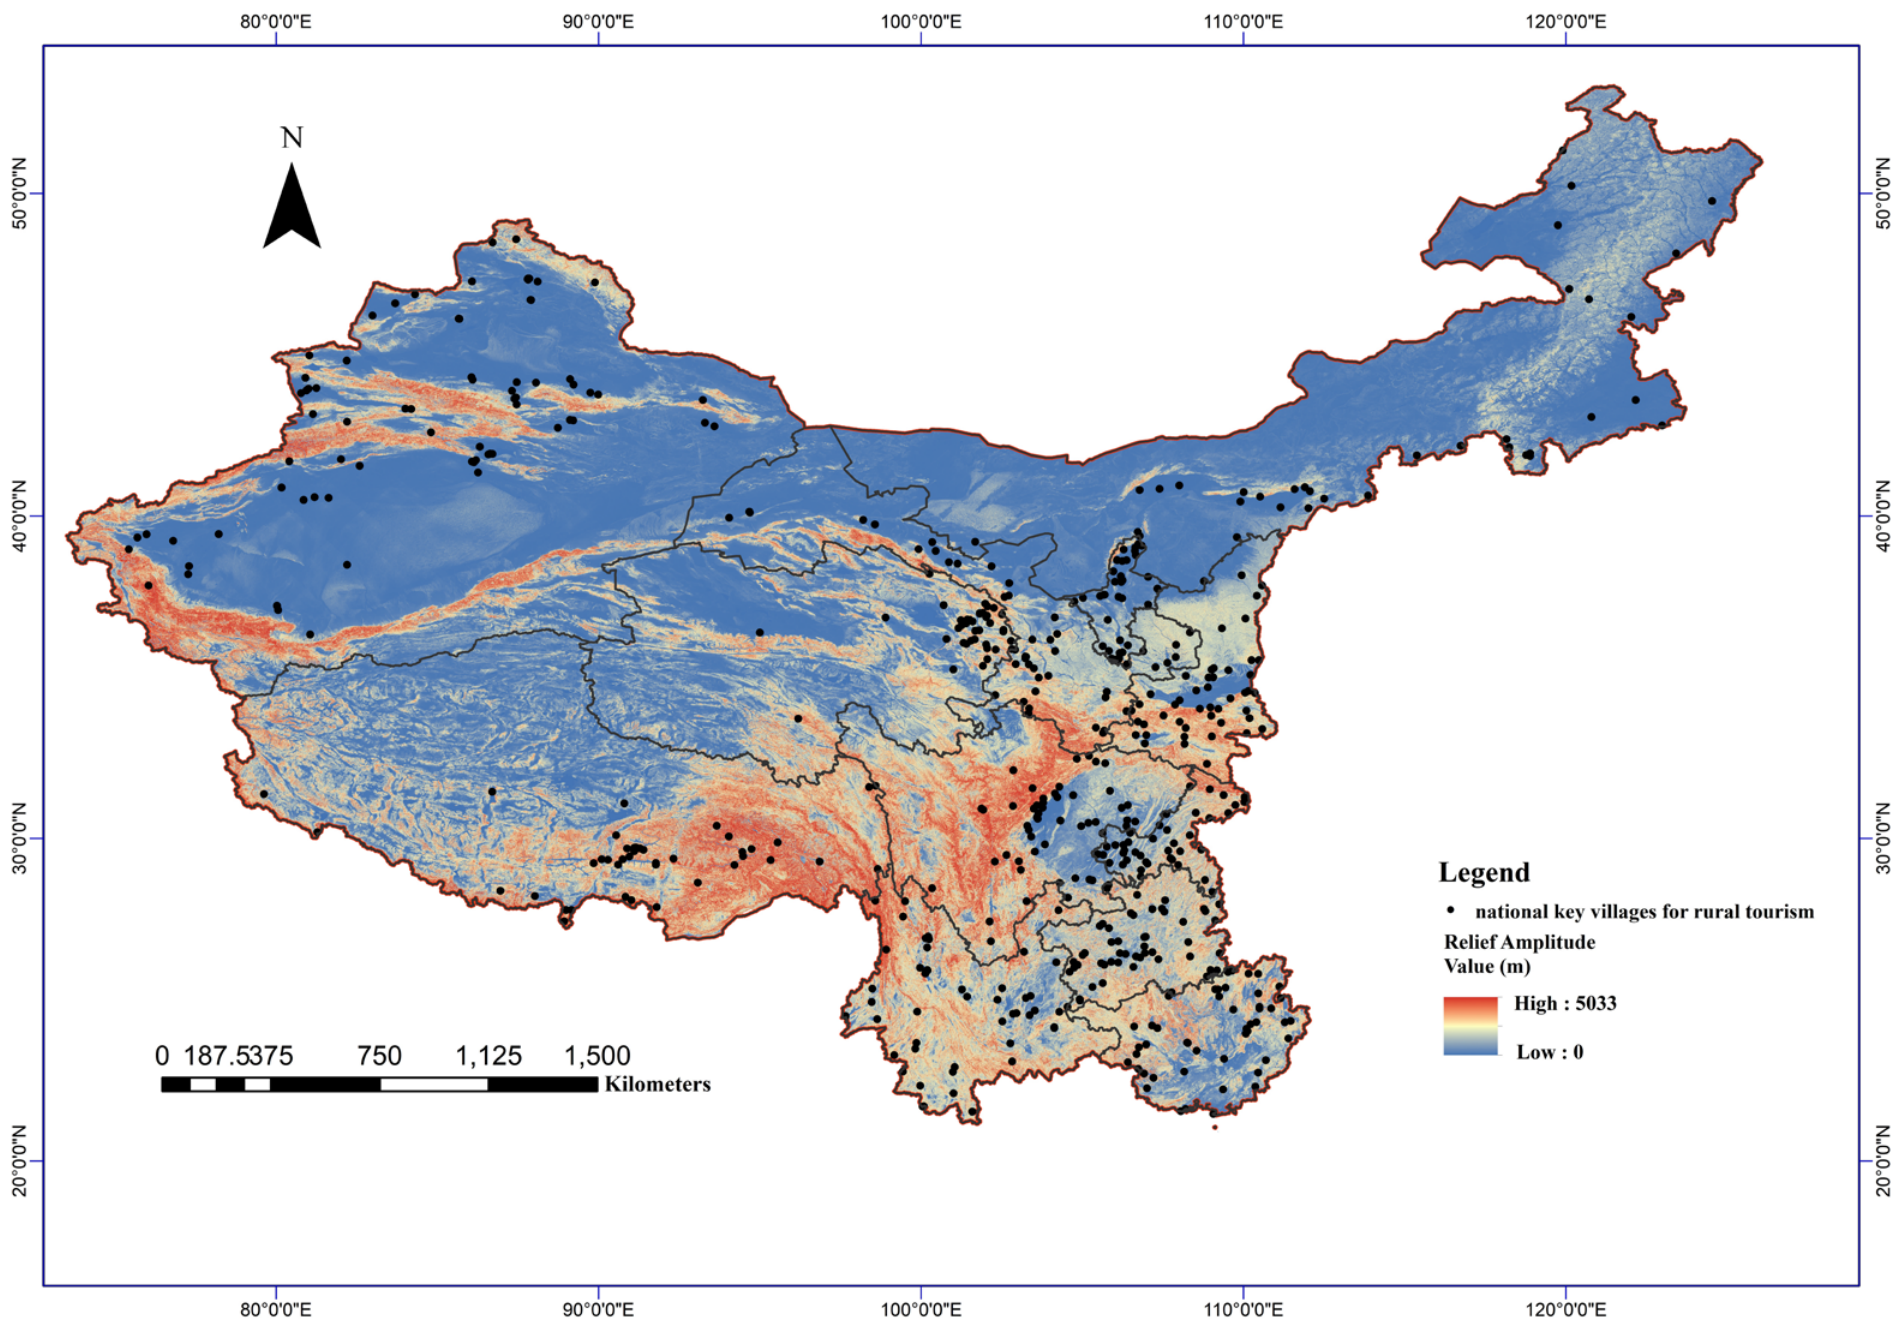
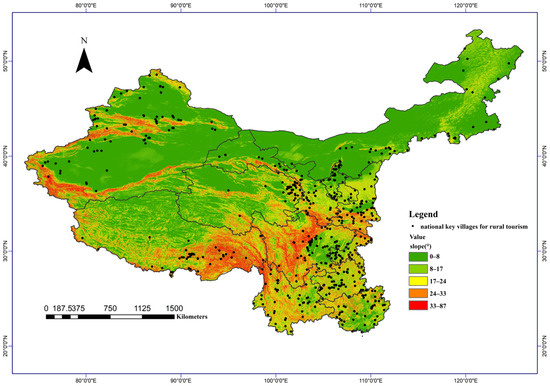
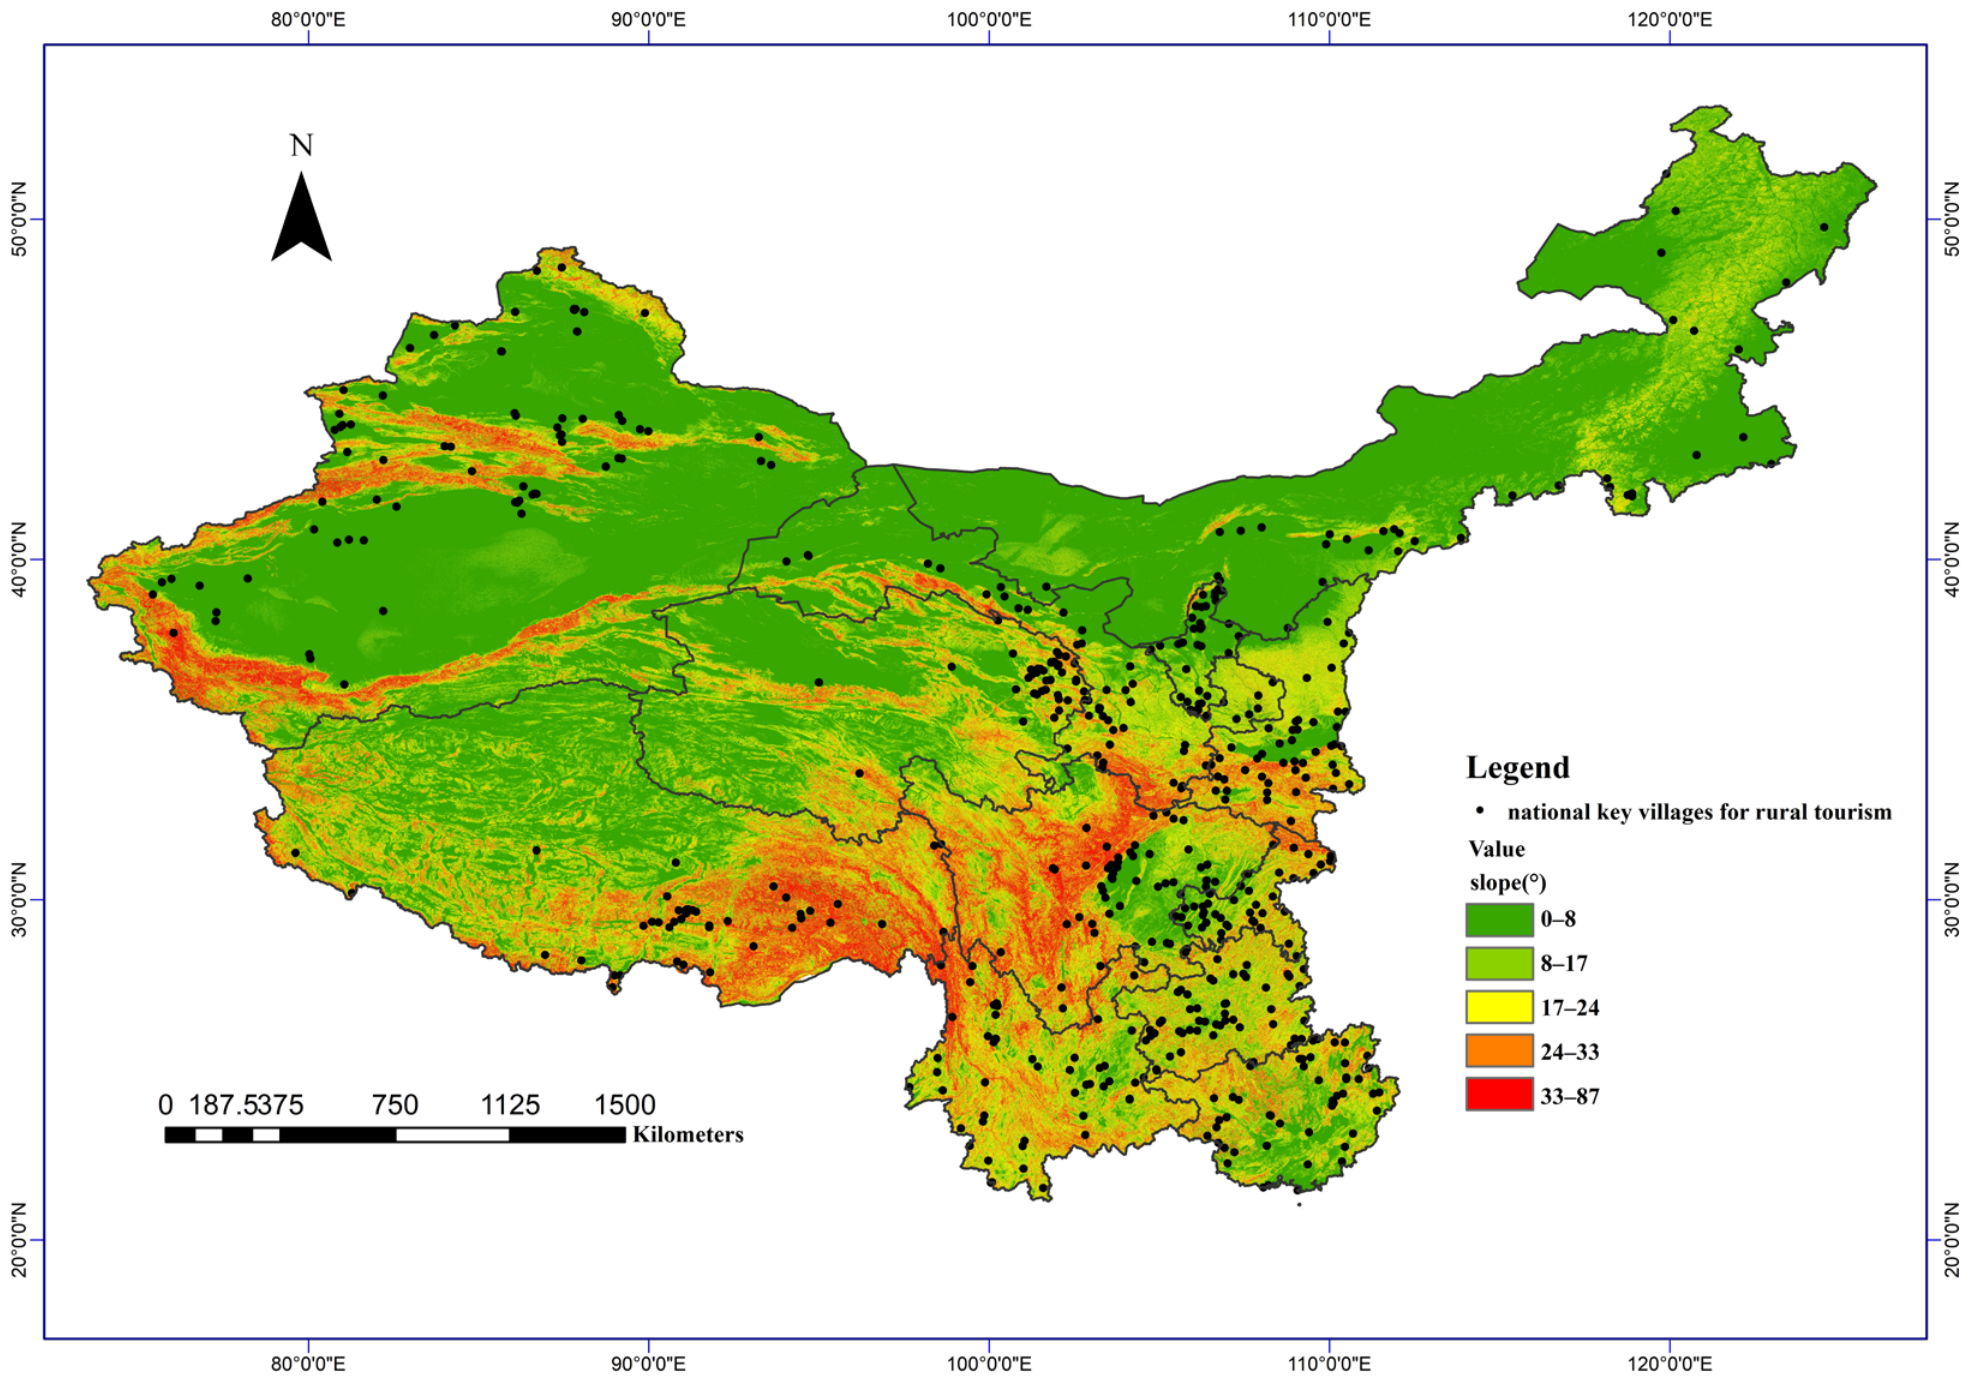
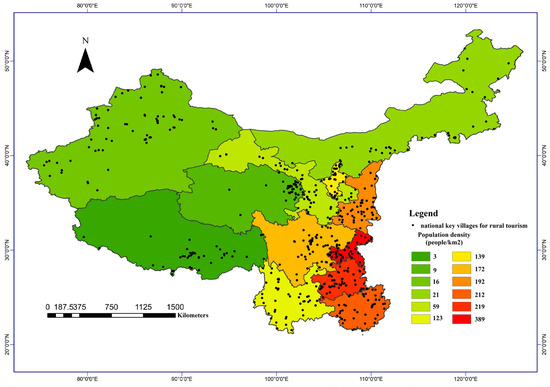
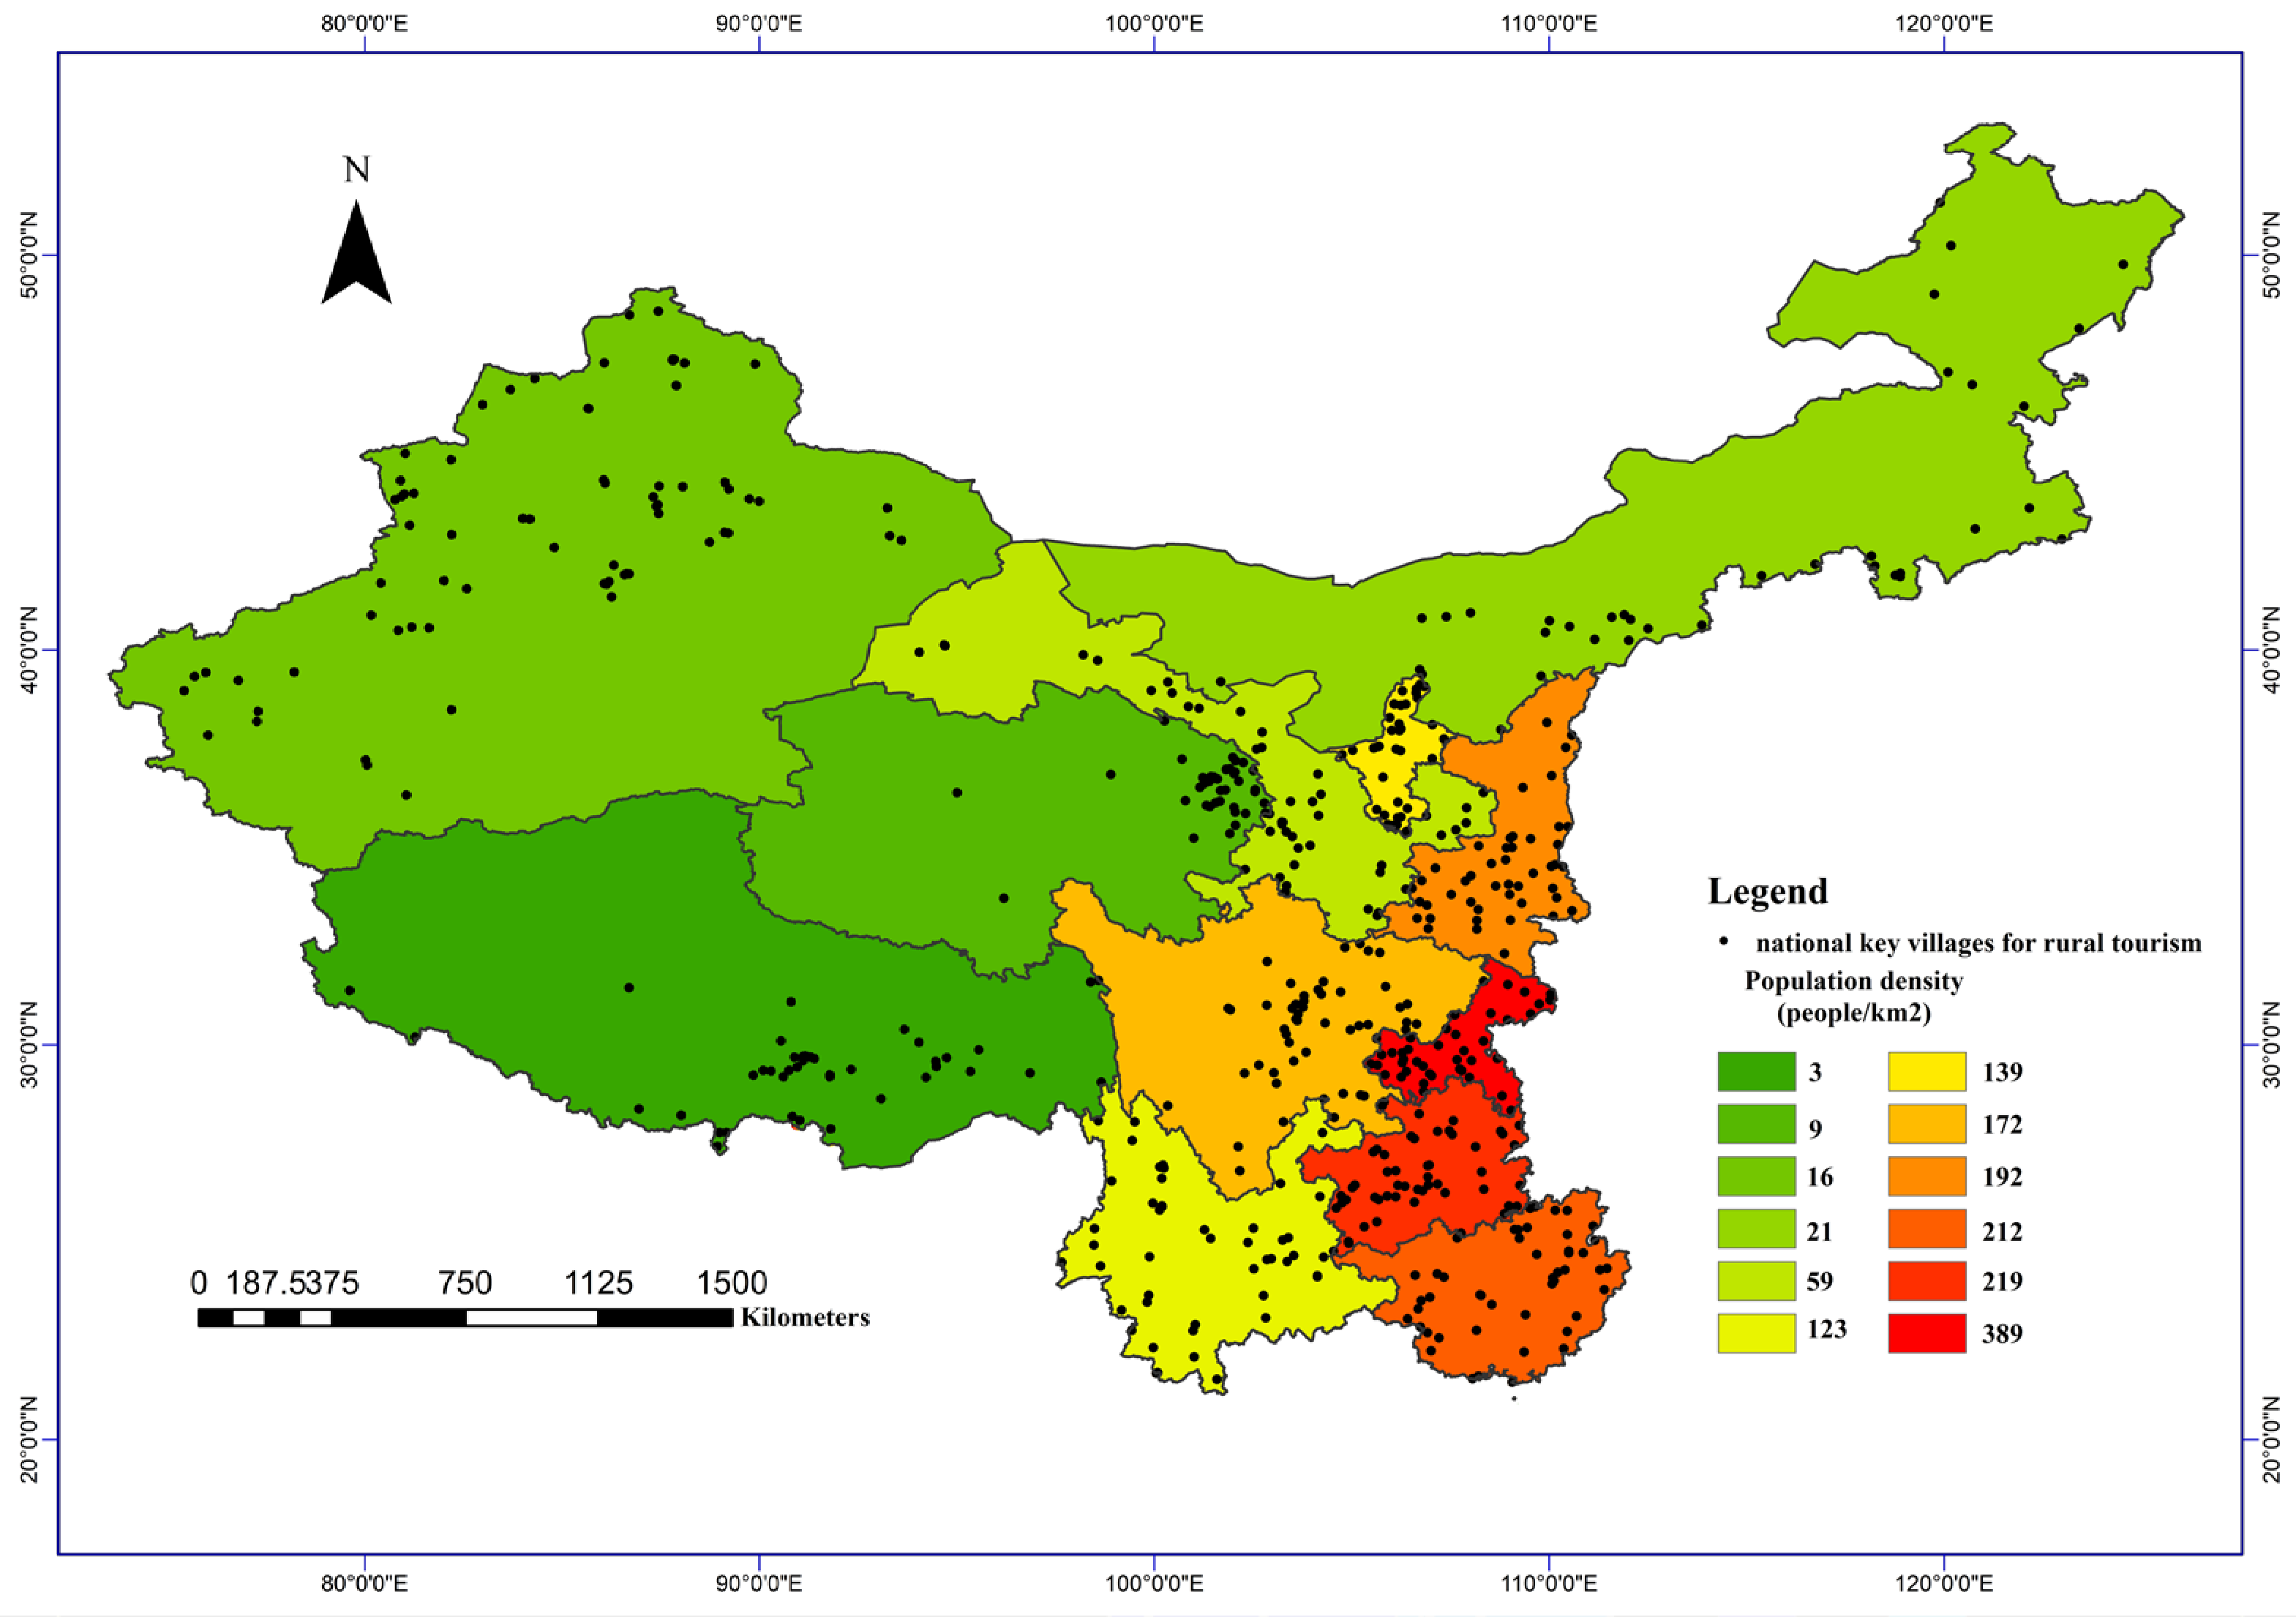
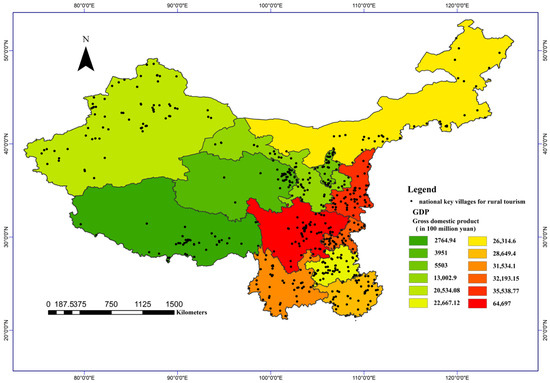
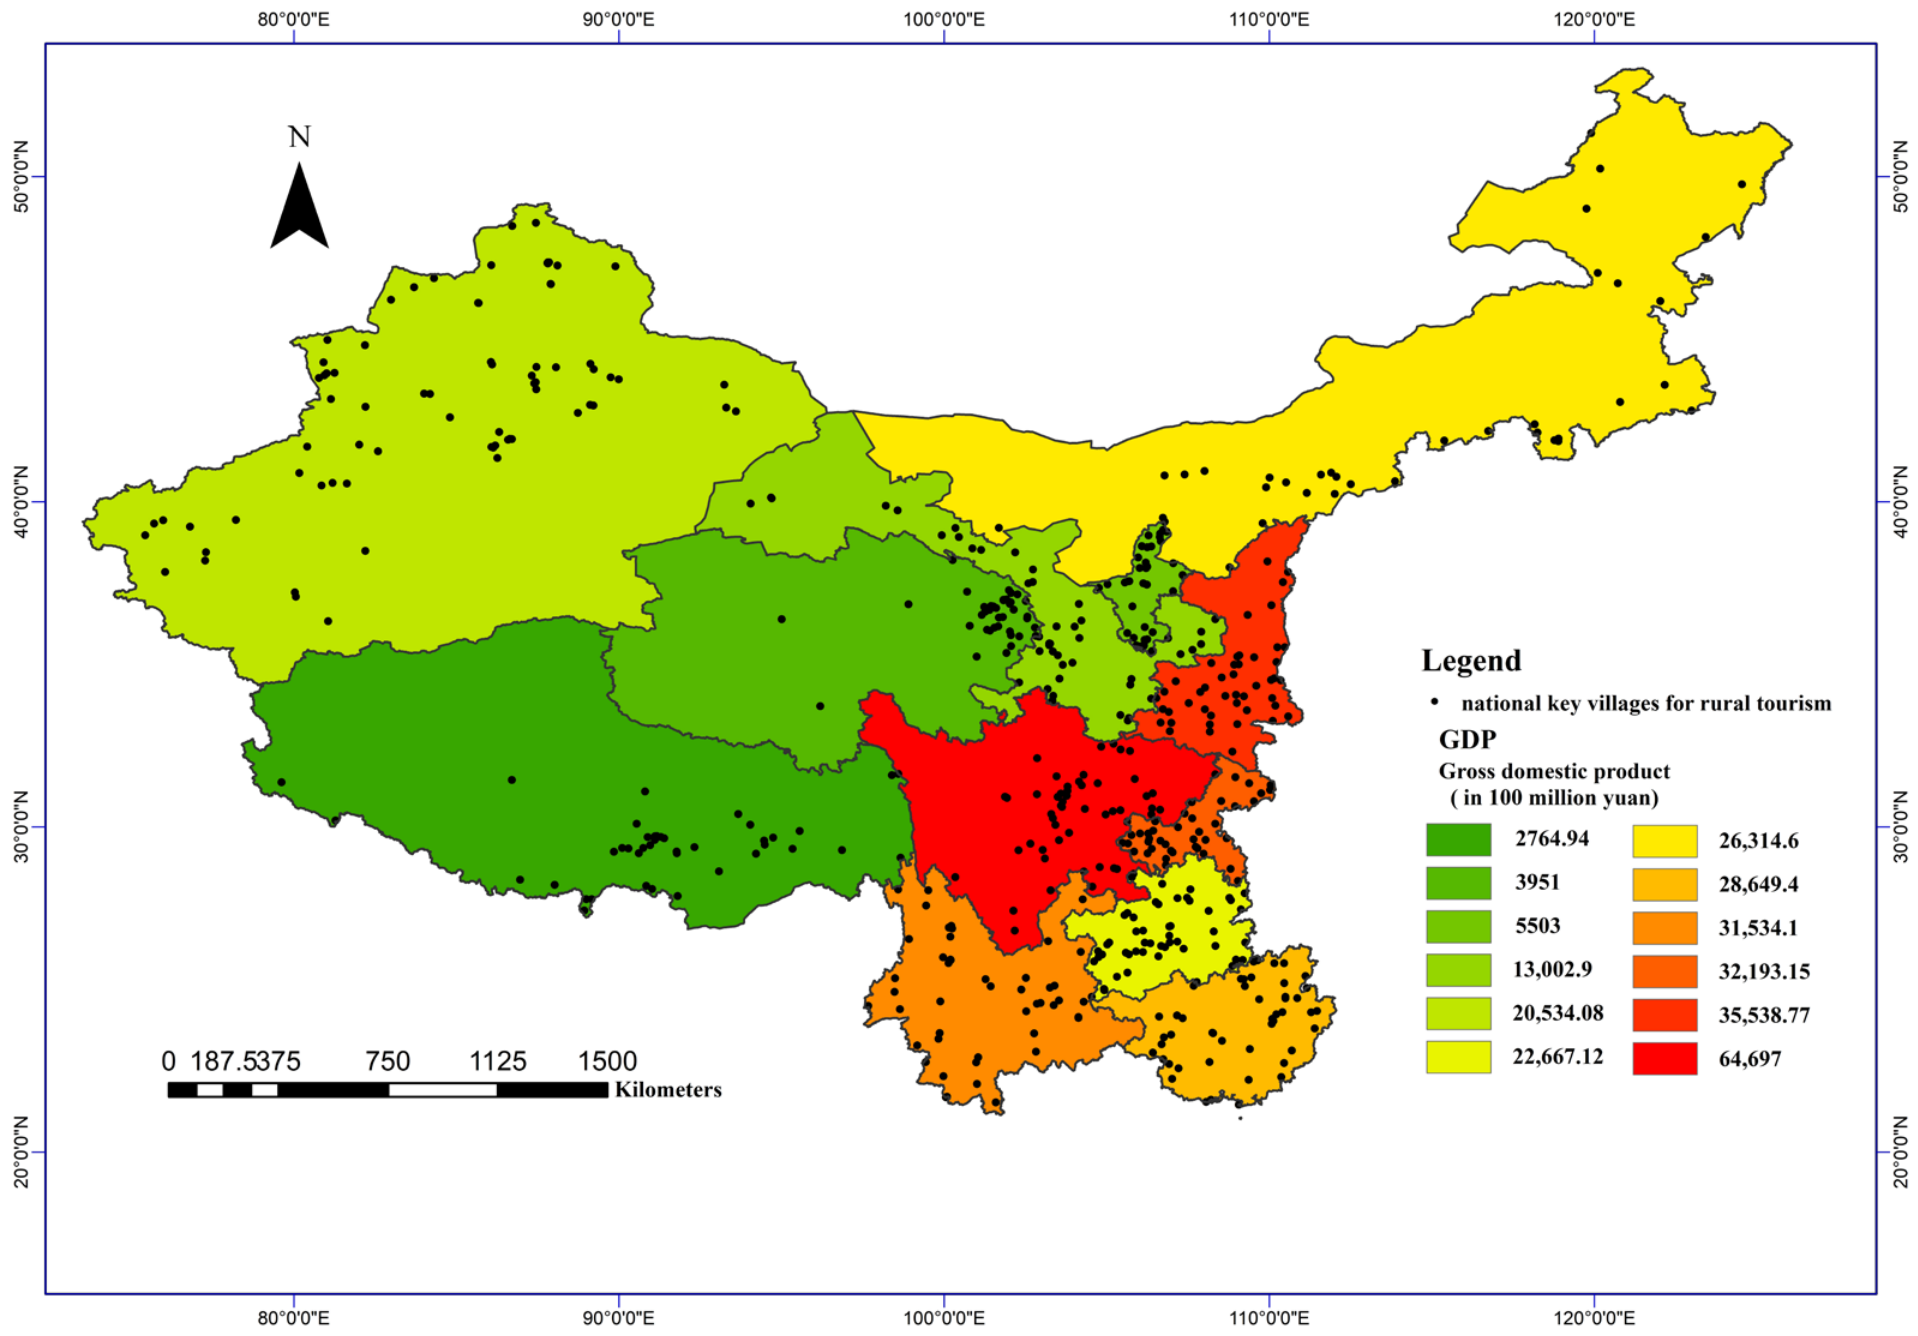
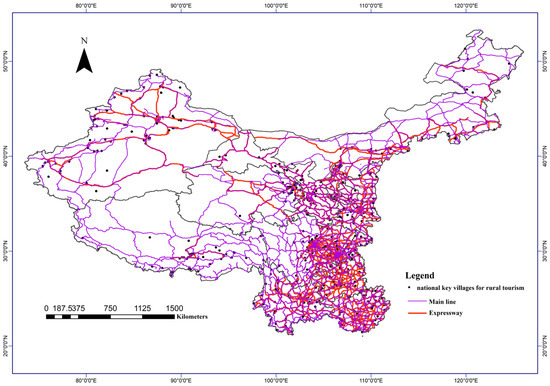
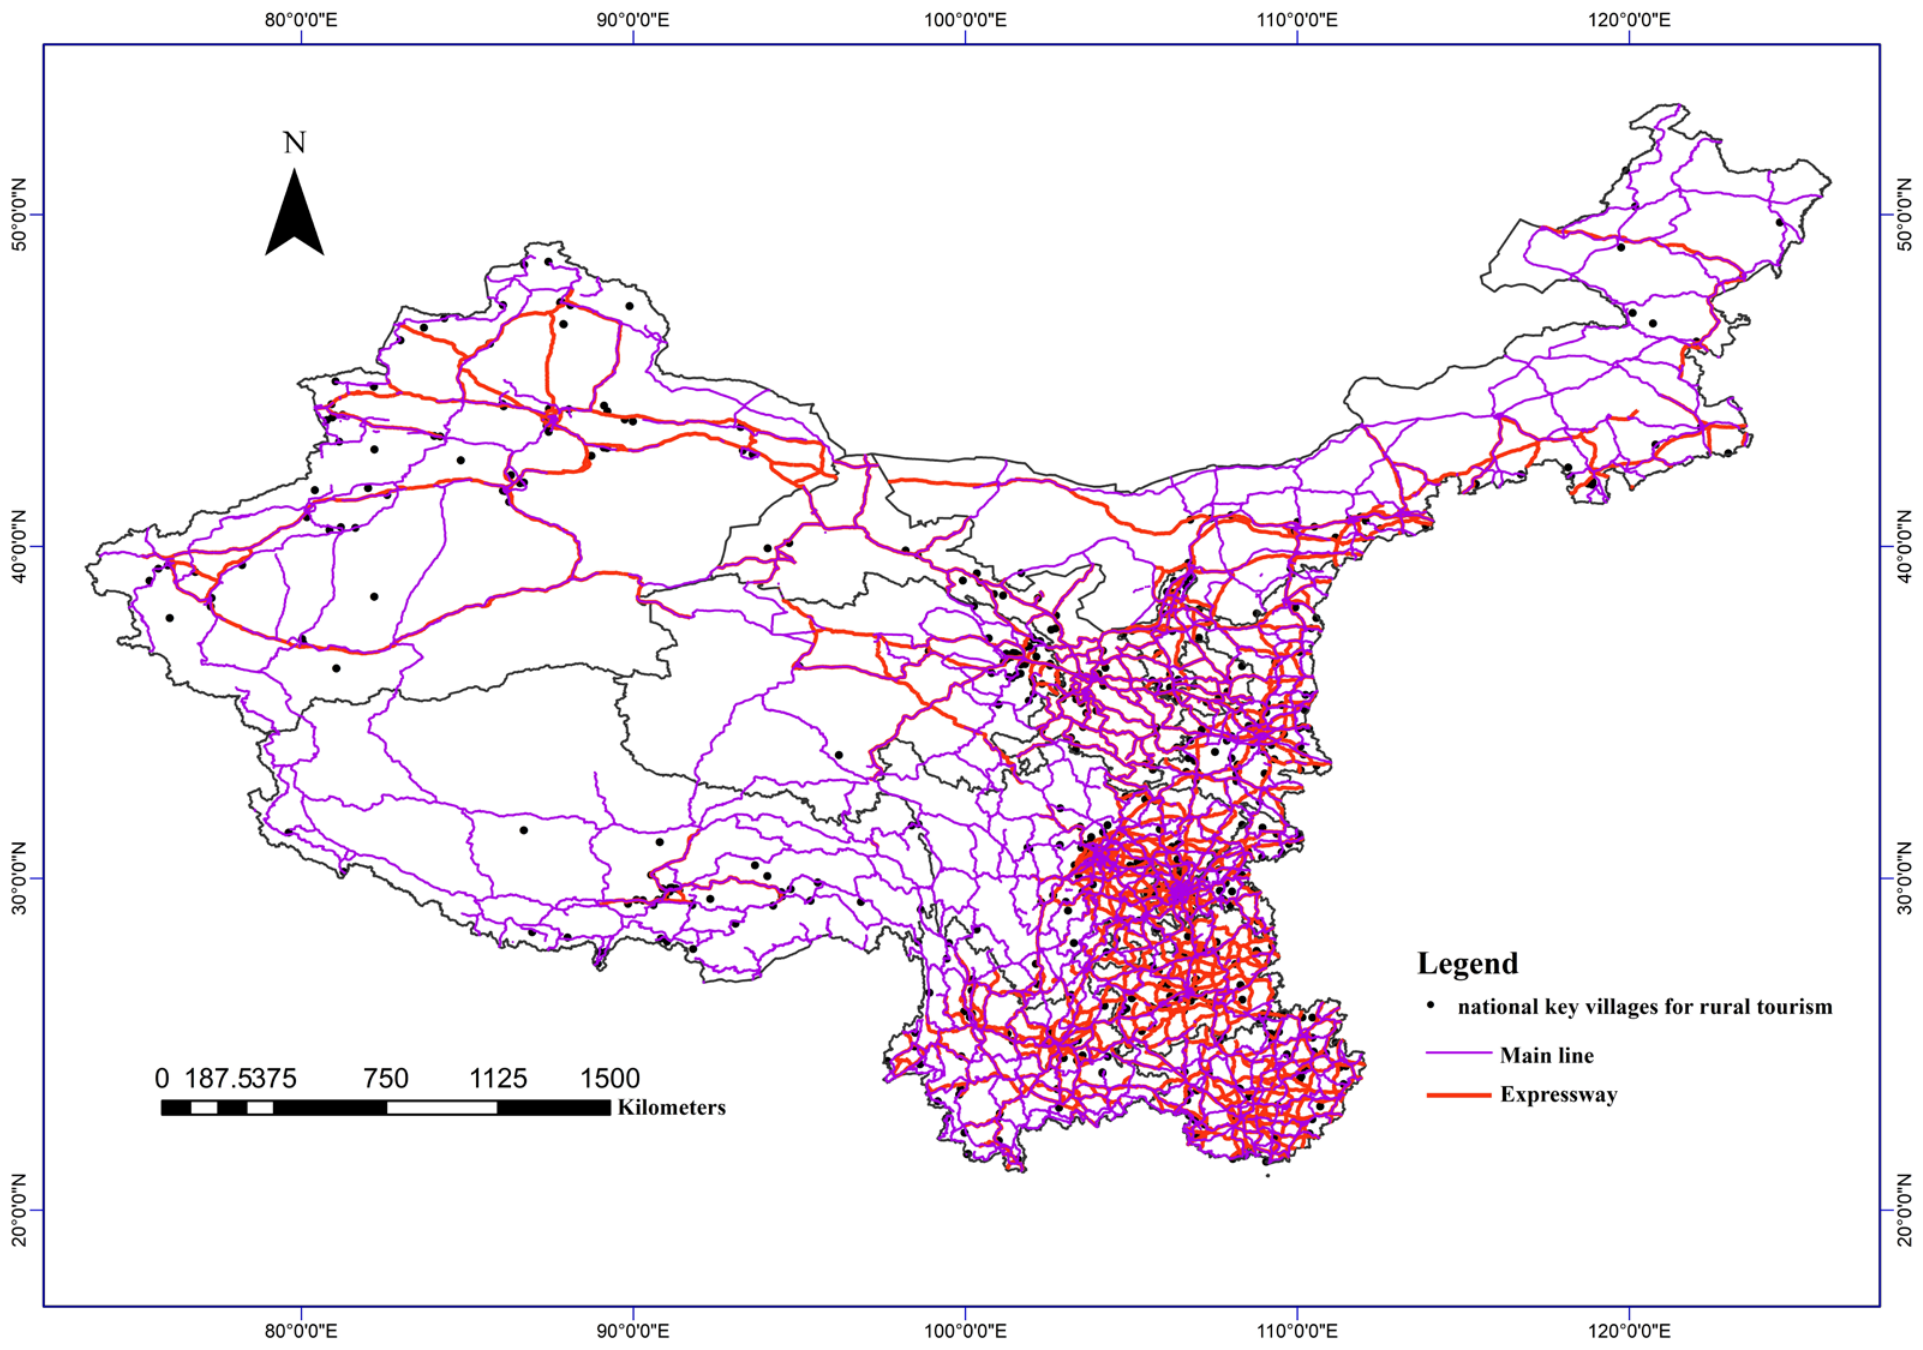

Disclaimer/Publisher’s Note: The statements, opinions and data contained in all publications are solely those of the individual author(s) and contributor(s) and not of MDPI and/or the editor(s). MDPI and/or the editor(s) disclaim responsibility for any injury to people or property resulting from any ideas, methods, instructions or products referred to in the content. |
© 2026 by the authors. Licensee MDPI, Basel, Switzerland. This article is an open access article distributed under the terms and conditions of the Creative Commons Attribution (CC BY) license.