


Abstract
Photovoltaic desert control (PVDC), an innovative model integrating clean energy development and desertification control, faces complex coordination challenges among local governments, local communities, and photovoltaic enterprises. This study constructs a tripartite evolutionary game model to identify the conditions that drive PVDC toward coordinated governance. The model defines a three-dimensional strategy space: government regulatory intensity (Strong vs. Lax), community willingness to cooperate (Active Cooperation vs. Passive Resistance), and enterprise ecological integration (Active Ecological Integration vs. Passive Land Occupation). Replicator dynamic equations are derived to characterize nonlinear interactions, and the stability conditions of eight pure-strategy equilibrium points are identified through Jacobian matrix eigenvalue analysis. Numerical simulations are conducted using a baseline parameter set that satisfies the Evolutionary Stable Strategy conditions for the ideal equilibrium E8, namely Strong Regulation, Active Cooperation, and Active Ecological Integration. The results show that the system can converge to E8 when higher-level rewards cover government regulation, subsidy, and community-support costs; when community cooperation benefits exceed livelihood opportunity costs and compensation incentives from resistance; and when enterprises’ effective ecological integration costs are lower than the combined benefits of subsidies, avoided fines, and long-term returns. Sensitivity analysis further indicates that government subsidies, fines, community support, cooperation income, and enterprise long-term benefits are key drivers of system evolution, while excessive regulation costs, high opportunity costs, and high ecological integration costs may hinder coordination. Qualitative evidence from four PVDC-related cases in Xinjiang provides practical illustrations broadly consistent with the model mechanisms. This study offers a dynamic analytical framework for designing incentive-compatible governance mechanisms in PVDC and similar multi-stakeholder ecological restoration projects.
1. Introduction
In the global low-carbon transition, utility-scale renewable energy deployment has become central to climate mitigation strategies [1,2,3]. China’s pledge to peak carbon emissions by 2030 and achieve carbon neutrality by 2060 has catalyzed a national strategy to construct massive wind and photovoltaic bases in deserts, Gobi, and degraded lands [4,5]. Xinjiang Uygur Autonomous Region, endowed with vast desertified land and exceptional solar irradiance, serves as a critical implementation zone for this strategy [6,7]. Yet the region faces acute ecological stress from land desertification, vegetation degradation, and water scarcity, creating an inherent tension between energy development and environmental preservation [8,9]. The fragility of the ecosystem and the huge potential of energy development form a sharp contrast here, which also constitutes a key crux for regional sustainable development.
Photovoltaic desert control (PVDC) has emerged as a promising land-use paradigm to reconcile these objectives [10,11,12]. By blocking direct surface irradiance and reducing wind speed and soil evaporation, PV arrays create favorable microclimates for herbaceous restoration and drought-tolerant cultivation beneath and between panels [13,14]. This dual-use model—electricity generation aloft and ecological restoration below—is expected to simultaneously yield clean energy output, carbon sequestration, windbreak stabilization, and land value appreciation [10,15]. Early pilots from the Hexi Corridor to the Kubuqi Desert have demonstrated measurable vegetation greening, prompting rapid policy diffusion across Northwest China [15,16].
However, this vision of coordinated development faces practical challenges arising from the diverse demands and strategic interactions of multiple stakeholders [1,17,18]. The construction and operation of photovoltaic bases involve not only land-use transformation, but also the reconfiguration of local socio-economic relations and ecological services [2,19]. Local governments must balance economic growth, new energy targets, ecological protection requirements, and social stability [5,20,21]. Their strategic choices are therefore shaped by the tension between investment promotion, environmental performance assessment, and grassroots governance pressures. Local communities, whose traditional livelihoods are closely tied to land rights and resource use [22], are concerned not only with land leasing and compensation, but also with whether PVDC projects can provide sustainable livelihood alternatives, such as employment in under-panel planting and power station operation, while avoiding negative impacts on grassland quality, grazing rights, and community structure. Photovoltaic enterprises, as investors and operators, seek to maximize project returns by controlling land, operation, and maintenance costs, and may have limited willingness to invest in long-cycle ecological governance with uncertain direct returns [4,23]. Therefore, understanding the strategic interactions among these actors is essential for identifying the governance conditions that can steer PVDC toward sustainable coordination.
Existing PVDC research can be grouped into three relatively separate streams. First, ecological studies show that PV panels can improve arid microhabitats by changing shade, soil moisture, and surface conditions, thereby promoting vegetation recovery [24]. Satellite-based evidence further suggests that desert PV deployment in China has generated measurable greening and welfare benefits [15]. Field investigations also indicate that ecological construction modes, including sand-control measures, artificial planting, and agro-pastoral integration, can enhance vegetation coverage and ecosystem service values, although their effectiveness is constrained by water scarcity, ecological construction costs, and policy support [25]. Second, risk-oriented studies emphasize that PVDC projects face medium-to-high life-cycle risks related to investment pressure, construction difficulty, technical complexity, and environmental uncertainty [26]. Third, renewable-energy governance research highlights the importance of social acceptance, trust, community identity, and participation in local energy transitions [27,28,29]. Although evolutionary game studies have examined how subsidies, subsidy withdrawal, information asymmetry, and incentive–penalty mechanisms shape stakeholder strategies in photovoltaic adoption and value-chain collaboration [30,31,32], they rarely embed multi-agent interaction in the ecological and institutional context of desert control. Moreover, most existing models focus on bilateral relationships rather than the simultaneous three-way interdependence among governments, enterprises, and communities. As a result, the equilibrium stability conditions and critical parameter boundaries that drive PVDC toward sustainable coordination remain insufficiently understood.
To address this gap, this study poses the following research questions: (1) How do the strategic interactions among local governments, photovoltaic enterprises, and local communities dynamically evolve under the PVDC model? (2) What parameter conditions and policy configurations determine the stability of coordinated governance equilibrium? (3) How do empirical cost–benefit configurations from Xinjiang validate the theoretical predictions?
This study makes four distinct contributions. First, we develop a tripartite evolutionary game model that captures simultaneous three-way interactions among government, enterprise, and community actors, extending the predominantly bilateral focus of prior EGT applications in energy governance. Second, we parameterize the model using empirically grounded data from four PVDC projects in Xinjiang (Yutian, Minfeng, Shaya, and Ruoqiang), ensuring that the payoff structure reflects real-world behavioral logics rather than stylized assumptions. Third, through rigorous stability analysis and numerical simulation, we derive explicit equilibrium stability conditions and critical parameter boundaries that offer actionable quantitative guidance for incentive design and regulatory intensity. Fourth, by revealing the complementarity between community cooperation and the other two agents’ strategies, we demonstrate that active community participation acts as a catalyst that amplifies the efficacy of government regulation and enterprise ecological investment, rather than merely an independent welfare outcome.
The remainder of this paper is organized as follows. Section 2 reviews the evolutionary game-theoretic methodology. Section 3 presents the model design, including the problem description, assumptions, and payoff matrix construction, followed by equilibrium analysis and numerical simulation. Section 4 validates the theoretical predictions through an empirical case study of the four Xinjiang PVDC projects. Section 5 discusses theoretical contributions, practical implications, and limitations. Section 6 concludes with key findings and future research directions.
2. Methods and Materials
2.1. Methods
Evolutionary Game Theory (EGT) is a mathematical framework modeling strategy selection among bounded rational agents who learn and adapt through repeated interactions, making it particularly suitable for analyzing complex socio-economic systems [33,34]. Unlike classical game theory assuming perfect rationality, EGT captures the dynamic, path-dependent nature of stakeholder behaviors under uncertainty. In environmental governance, EGT has been applied to examine regulator–polluter interactions under schemes and the evolution of cooperative behaviors in environmental protection the energy sector, EGT has been utilized to investigate stakeholders’ strategic choices in distributed photovoltaic adoption [31], the impacts of subsidy withdrawal policies on solar energy development [30], and the cooperative mechanisms shaped by new energy vehicle policies [35]. In land use management, researchers have focused on stakeholder relationships in farmland abandonment and land governance [36,37], revealing how incentive structures shape long-term land use patterns.
Therefore, this study constructs a tripartite evolutionary game model to systematically analyze the interest demands and behavioral logic of photovoltaic enterprises, local communities, and local governments in the PVDC model. Through replicator dynamic equations and stability analysis of equilibrium points, the model simulates the dynamic evolution of each agent’s strategy under different policy scenarios and parameter settings, revealing the key conditions that drive the system toward the ideal coordinated governance equilibrium.
2.2. Materials
The materials employed in this study comprise two categories: parameterized model inputs and empirical case data from the field. The parameter inputs are derived from a synthesis of prior literature [14,16,19,26], official policy documents from Xinjiang’s PVDC projects, and stakeholder interviews conducted during fieldwork. These sources provide the empirical basis for defining the cost, benefit, and incentive parameters in the tripartite payoff matrix. The empirical case materials consist of four representative PVDC projects located in Xinjiang, China—Yutian County, Minfeng County, Shaya County, and Ruoqiang County. These cases were selected based on their geographic distribution across the Taklamakan Desert fringe, their varying cooperation models, and their documented ecological and socioeconomic outcomes. Data for these cases was collected from government reports, news reports, and published case studies, providing grounded reference points for model calibration and validation.
3. Model Design and Analysis
3.1. Problem Description
The successful implementation of the PVDC model is not only a technical challenge, but also a complex socio-economic game process involving multiple stakeholders, especially photovoltaic enterprises, local communities, and local governments. This study simplifies this complex reality into a three-party game model.
Local Government: As the regional manager and regulator, the government aims to maximize its comprehensive performance, which is a composite utility function including multiple goals such as economic growth, ecological improvement, and social stability [30]. It acts as a coordinator and supervisor between photovoltaic enterprises and communities. Its strategy set includes: (1) Strong Regulation: The government formulates and strictly implements high standards for ecological restoration and community benefit sharing. It actively supervises the behaviors of photovoltaic enterprises, provides targeted subsidies for positive performance, and imposes severe penalties for violations. This requires a large amount of administrative and financial resources, but ensures the long-term sustainability and legitimacy of the project. (2) Lax Regulation: To attract investment and reduce its own administrative burden, the government may adopt a more laissez-faire approach. It sets low entry thresholds, conducts non-regular inspections, and imposes light penalties. This may accelerate initial investment, but risks long-term ecological degradation and social conflicts, and may be held accountable by higher-level governments accordingly.
Local Community: As the original land users whose livelihoods are directly affected by the project, the community aims to maximize its interests and well-being [31]. Its strategy set includes: (1) Active Cooperation: The community accepts the project, signs land lease contracts through fair negotiations, and actively participates in new economic opportunities provided by the project, such as employment in construction and maintenance, or developing under-panel planting and breeding industries. This strategy represents adaptation to the new economic reality. (2) Passive Resistance: When the community perceives threats to traditional livelihoods, unfair compensation, or lack of respect, it may adopt resistance strategies, ranging from non-cooperation and excessive compensation demands to organizing protests to disrupt project construction or operation. This strategy aims to force concessions or protect existing rights, but also entails risks and opportunity costs.
Photovoltaic Enterprise: As the project developer and operator, its main goal is profit maximization [23]. It faces a fundamental strategic choice between long-term value creation and short-term cost minimization. Its strategy set includes: (1) Active Ecological Integration: This strategy means photovoltaic enterprises not only meet the minimum compliance requirements, but also make additional investments, such as scientifically selecting and planting vegetation, hiring local labor, sharing benefits with communities, and promoting technological innovation. This path has high upfront costs, but may bring long-term benefits such as enhanced brand reputation, improved operational stability due to community support, and access to green finance or additional government subsidies. (2) Passive Land Occupation: This strategy focuses on maximizing power generation benefits at the lowest cost. Photovoltaic enterprises only fulfill the most basic contractual obligations regarding land use and environmental standards, minimizing investment in ecological public welfare and community development. This approach maximizes short-term profits, but faces risks of future conflicts, regulatory penalties, and reputational damage.
The strategic choices of each game player are interdependent. Photovoltaic enterprises’ ecological investment decisions are influenced by the government’s regulatory stance and the community’s expected response; the community’s willingness to cooperate depends on photovoltaic enterprises’ plans and the government’s ability to protect its interests; the government’s regulatory intensity is the result of trade-offs between attracting investment and preventing social and environmental problems. This dynamic interaction forms the basis of our evolutionary game model.
3.2. Model Assumptions
Building on the problem description above, the following assumptions ensure both tractability and realism in the model.
Assumption 1: Bounded Rationality and Asymmetric Information. Photovoltaic enterprises, local communities, and local governments are not perfectly rational and possess incomplete knowledge of others’ true costs and benefits. They continuously adjust behaviors by imitating strategies yielding higher perceived payoffs, with dynamics captured by replicator equations. All costs and benefits are defined as short-term constant positive parameters.
Assumption 2: Probabilistic Strategy Selection. Let x, y, and z denote the proportions of governments choosing Strong Regulation, communities choosing Active Cooperation, and enterprises choosing Active Ecological Integration, respectively, with (1 − x), (1 − y), and (1 − z) representing alternative strategies, where x, y, z ∈ [0, 1].
Assumption 3: Cost–Benefit Structure of Local Governments. Basic tax revenue is TG; AEI generates additional tax ΔT. Ecological restoration yields political gain RG and higher-level reward RH (e.g., performance recognition in ecological governance assessments or preferential policy allocation). Strong Regulation incurs administrative cost CS; community resistance generates social stability cost CW (e.g., dispute mediation and project downtime). Project failure or environmental degradation triggers higher-level penalty PH (e.g., environmental audit accountability or project suspension mandates).
Assumption 4: Cost–Benefit Structure of Local Communities. Basic land lease income is RL. Active Cooperation yields additional income RC (e.g., under-panel agro-pastoral revenue, employment in panel cleaning and maintenance, and targeted ecological compensation) but entails opportunity cost LH from lost traditional livelihoods (e.g., foregone grazing or farming income). Passive Resistance incurs cost CD. Strong Regulation provides additional support B. Enterprise AEI generates spillover benefit coefficient γ (γ > 1) for community cooperation, capturing improved microclimates and infrastructure (e.g., roads, shelterbelts) that raise the marginal return of community-led restoration activities.
Assumption 5: Cost–Benefit Structure of Photovoltaic Enterprises. The basic electricity-sale profit of photovoltaic enterprises is PE. Active Ecological Integration (AEI) incurs an additional cost CA but generates long-term benefits RA, such as reduced dust-induced equipment losses, enhanced corporate reputation, and access to green financing, as well as government subsidy S. In contrast, Passive Land Occupation triggers government fine F. When the community adopts Passive Resistance, enterprises bear additional compensation cost M and suffer profit damage measured by coefficient δ (0 < δ < 1), reflecting delays or operational disruptions. When the community adopts Active Cooperation, the effective AEI cost borne by enterprises is reduced to β CA, where β (0 < β < 1) reflects the cost-reduction effect of shared local labor, infrastructure support, or community coordination.
Assumption 6: Constant Positive Parameters. Following standard practice in evolutionary game-theoretic analyses of infrastructure and environmental governance [38,39], all payoff parameters are treated as strictly positive constants. This simplification is widely adopted in the literature, as the EGT framework primarily examines directional impacts and qualitative behavioral equilibrium stability conditions rather than precise point estimates. This assumption does not compromise the validity of equilibrium analysis, as sensitivity analysis systematically varies each parameter across plausible ranges to examine its marginal effects on equilibrium stability and convergence paths.
Based on the problem description and model assumptions, the parameters constituting each party’s payoff are defined (Table 1).
Table 1.
Parameter definitions.
3.3. Payoff Matrix
Based on the above assumptions and parameter definitions, we construct the tripartite payoff matrix shown in Table 2. Each payoff item represents the net benefit of the corresponding agent under a specific strategy combination, including direct economic returns, ecological governance costs, policy incentives, regulatory constraints, compensation payments, and social-stability costs.
Table 2.
Three-party evolutionary game payoff matrix.
To clarify the economic rationale of the payoff matrix, we take the strategy combination of Government Strong Regulation strategy, Community Active Cooperation strategy, and Enterprise Active Ecological Integration strategy as an example. Under this scenario, the government obtains the basic tax revenue TG and the additional tax increment ΔT generated by enterprise ecological integration, as well as the political/reputational gain RG and the higher-level reward RH resulting from successful ecological restoration. Meanwhile, it bears the administrative cost of Strong Regulation CS, provides the enterprise subsidy S, and offers community support B. Therefore, the government payoff is expressed as TG + ΔT + RG − CS − S + RH − B.
For the local community, Active Cooperation brings the basic land-lease income RL and additional cooperation income RC. Since enterprise Active Ecological Integration further enhances the value of community cooperation, RC is multiplied by the incentive coefficient γ. The community also receives government support B, while bearing the opportunity cost of livelihood transition LH. Thus, the community payoff is RL + γ RC − LH + B.
For the photovoltaic enterprise, Active Ecological Integration allows it to obtain the basic electricity-sale profit PE, the long-term ecological integration benefit RA, and the government subsidy S. At the same time, community Active Cooperation reduces the enterprise’s actual AEI cost from CA to β CA, where β represents the effective cost coefficient under community cooperation. Therefore, the enterprise payoff is PE − β CA + RA + S.
The payoffs under other strategy combinations are constructed following the same logic by adding the corresponding benefits and subtracting the relevant costs, subsidies, fines, compensation payments, resistance costs, and higher-level rewards or penalties. This setting reflects the institutional incentive, constraint, compensation, and benefit-sharing mechanisms observed in PVDC governance practices.
3.4. Stable Equilibrium Analysis
3.4.1. Stability Analysis of Government Strategy Evolution
Let UG1 be the expected payoff of the government choosing the Strong Regulation strategy, UG2 the expected payoff of choosing the Lax Regulation strategy, and UG the average expected payoff of the government group.
Replicator dynamics equation of the government F(x):
3.4.2. Stability Analysis of Community Strategy Evolution
Let UC1 be the expected payoff of the community choosing the Active Cooperation strategy, UC2 the expected payoff of choosing the Passive Resistance strategy, and UC the average expected payoff of the community group.
Replicator dynamics equation of the community F(y):
3.4.3. Stability Analysis of Photovoltaic Enterprise Strategy Evolution
Let UE1 be the expected payoff of photovoltaic enterprises choosing the Active Ecological Integration strategy, UE2 the expected payoff of choosing the Passive Land Occupation strategy, and UE the average expected payoff of the photovoltaic enterprise group.
Replicator dynamics equation of photovoltaic enterprises F(z):
3.4.4. Stability Analysis of System Equilibrium Points
This three-party evolutionary game system contains eight pure-strategy equilibrium points: E1(0,0,0), E2(0,0,1), E3(0,1,0), E4(0,1,1), E5(1,0,0), E6(1,0,1), E7(1,1,0), E8(1,1,1). The local stability of each equilibrium point can be judged by the eigenvalues of the Jacobian Matrix. An equilibrium point is an Evolutionary Stable Strategy (ESS) if all its corresponding eigenvalues are negative. The Jacobian Matrix J of the system is:
At pure-strategy equilibrium points, the eigenvalues (λ) of the Jacobian Matrix are the elements on the diagonal:
The eigenvalues of each equilibrium point are presented in Table 3. According to the local stability criterion, an equilibrium point is asymptotically stable if and only if all three eigenvalues are negative. The corresponding stability conditions and economic interpretations are given as follows.
Table 3.
Stable equilibrium strategies and their conditions.
It should be noted that these eight equilibria are not simultaneously stable under a single parameter configuration. Rather, each equilibrium may become asymptotically stable under its corresponding parameter conditions.
For E1 = (0,0,0), the stable strategy combination is Lax Regulation, Passive Resistance, and Passive Land Occupation. Its stability conditions are F < CS, LH > CD + RC, and RA < CA + M. This indicates that when the fine imposed on enterprises is lower than the administrative cost of Strong Regulation, the government tends to choose Lax Regulation. Meanwhile, the community prefers Passive Resistance when the opportunity cost of Active Cooperation exceeds the cooperation income and the cost of resistance. Enterprises choose Passive Land Occupation when the long-term return from AEI cannot cover the additional ecological integration cost and compensation burden.
For E2 = (0,0,1), the stable strategy combination is Lax Regulation, Passive Resistance, and Active Ecological Integration. The required conditions are RH < CS + S, LH + M > CD + γ RC, and RA > CA + M. In this case, the government maintains Lax Regulation because the higher-level reward is insufficient to offset the costs of Strong Regulation and enterprise subsidies. The community remains resistant because the avoided livelihood loss and compensation obtained under Passive Resistance outweigh the enhanced cooperation benefits. However, enterprises still adopt AEI when its long-term benefits exceed ecological integration and compensation costs.
For E3 = (0,1,0), the stable strategy combination is Lax Regulation, Active Cooperation, and Passive Land Occupation. Its stability conditions are F < B + CS, LH < CD + RC, and RA < β CA. This means that the government lacks sufficient incentive to adopt Strong Regulation when the fine is lower than the combined cost of regulation and community support. The community chooses Active Cooperation because cooperation income exceeds livelihood opportunity cost relative to Passive Resistance. However, enterprises still choose Passive Land Occupation when the long-term benefits of AEI are lower than the effective AEI cost under community cooperation.
For E4 = (1,0,0), the stable strategy combination is Strong Regulation, Passive Resistance, and Passive Land Occupation. The stability conditions are F > CS, LH > B + CD + RC, and CA + M > F + RA + S. Here, the government chooses Strong Regulation because the fine collected from enterprises can compensate for regulatory costs. Nevertheless, the community still chooses Passive Resistance when the opportunity cost of cooperation exceeds the combined benefits of government support, cooperation income, and avoided resistance costs. Enterprises continue Passive Land Occupation because AEI costs exceed the combined value of subsidies, avoided fines, and long-term ecological benefits.
For E5 = (1,1,0), the stable strategy combination is Strong Regulation, Active Cooperation, and Passive Land Occupation. The conditions are F > B + CS, LH < B + CD + RC, and β CA > F + RA + S. This suggests that the government maintains Strong Regulation when fines are sufficient to cover regulatory and community-support costs. The community chooses Active Cooperation because government support and cooperation income are enough to offset livelihood opportunity costs. However, enterprises still adopt Passive Land Occupation when the effective cost of AEI remains higher than the sum of subsidies, avoided fines, and long-term AEI benefits.
For E6 = (1,0,1), the stable strategy combination is Strong Regulation, Passive Resistance, and Active Ecological Integration. The required conditions are RH > CS + S, LH + M > B + CD + γ RC, and RA + F + S > CA + M. In this scenario, the government adopts Strong Regulation because higher-level rewards exceed the costs of regulation and subsidies. The community remains resistant because compensation and avoided livelihood losses outweigh the benefits of Active Cooperation. Enterprises adopt AEI because the combined value of long-term benefits, subsidies, and avoided fines is greater than the ecological integration cost and compensation cost.
For E7 = (0,1,1), the stable strategy combination is Lax Regulation, Active Cooperation, and Active Ecological Integration. Its stability conditions are RH < B + CS + S, LH + M < CD + γ RC, and RA > β CA. This equilibrium shows that even under Lax Regulation, enterprises and communities may form a cooperative relationship. The community chooses Active Cooperation because the enhanced cooperation income generated by enterprise AEI exceeds the opportunity cost and compensation benefits associated with Passive Resistance. Enterprises adopt AEI because its long-term benefits are higher than the effective AEI cost after community cooperation.
For E8 = (1,1,1), the stable strategy combination is Strong Regulation, Active Cooperation, and Active Ecological Integration. The stability conditions are RH > B + CS + S, LH + M < B + CD + γ RC, and β CA < F + RA + S. This is the most desirable collaborative governance equilibrium. It emerges when higher-level rewards are sufficient to cover government regulation, subsidies, and community support; when community cooperation benefits exceed opportunity costs and compensation incentives from resistance; and when enterprises’ effective AEI cost is lower than the combined benefits of subsidies, avoided fines, and long-term ecological returns.
4. Numerical Simulation
To intuitively demonstrate the dynamic evolution of the tripartite game and examine how key parameters affect the system’s evolutionary path, this section conducts numerical simulations of the replicator dynamic equations. Python 3.10 is used as the simulation platform. The initial state is set as x0 = y0 = z0 = 0.5, representing a neutral state in which none of the three agents has an initial strategic preference. The simulation interval is set as t = [0, 5], which is sufficient for observing whether the system converges to a stable equilibrium under the given parameter configuration.
The parameter setting follows a three-step protocol. First, all parameters are normalized payoff values rather than direct monetary estimates, which is a common treatment in evolutionary game simulation when the purpose is to examine strategic evolution and threshold effects rather than to predict exact financial returns. Second, the benchmark values are calibrated to satisfy the ESS conditions of the ideal coordinated governance equilibrium E8, namely Strong Regulation, Active Cooperation, and Active Ecological Integration. Specifically, the benchmark scenario must satisfy the following three conditions: the higher-level reward should exceed the total cost of government regulation, enterprise subsidy, and community support; the total benefit of community cooperation should exceed the opportunity cost and compensation incentive associated with Passive Resistance; and the comprehensive return of enterprise ecological integration should exceed its effective implementation cost. Third, the relative magnitudes of key parameters are determined with reference to the institutional logic and practical characteristics observed in Xinjiang PVDC-related cases, including government infrastructure support, community income from sand industries and employment, and enterprise benefits from ecological integration and compound land use.
Accordingly, the benchmark parameter set is designed as follows. For photovoltaic enterprises, the basic electricity-sale profit is set as PE = 30, the additional cost of Active Ecological Integration is CA = 20, and the additional long-term benefit generated by AEI is RA = 8. The government subsidy and fine are set as S = 4 and F = 6, respectively, reflecting the combined incentive and constraint mechanism for guiding enterprises away from Passive Land Occupation. Community Passive Resistance causes a 30% damage to enterprises’ basic profit, namely δ = 0.3. Under community Active Cooperation, the effective AEI cost coefficient is set as β = 0.6, meaning that enterprises bear 60% of the original AEI cost after receiving local cooperation, labor support, or coordination assistance.
For local communities, the basic land-lease income is set as RL = 10, the additional income from Active Cooperation is RC = 6, and the opportunity cost of livelihood transition is LH = 10. Government support for community cooperation is set as B = 6, and the incentive coefficient generated by enterprise AEI for community cooperation benefits is γ = 1.5. This reflects the situation in which ecological integration by enterprises can enhance community income through planting, employment, industrial participation, and related sand-economy activities. For local governments, the administrative cost of Strong Regulation is set as CS = 6, and the higher-level reward for successful coordinated governance is RH = 26. Other parameters are set as follows: M = 4, CD = 2, TG = 10, ΔT = 3, RG = 10, CW = 10, and PH = 20.
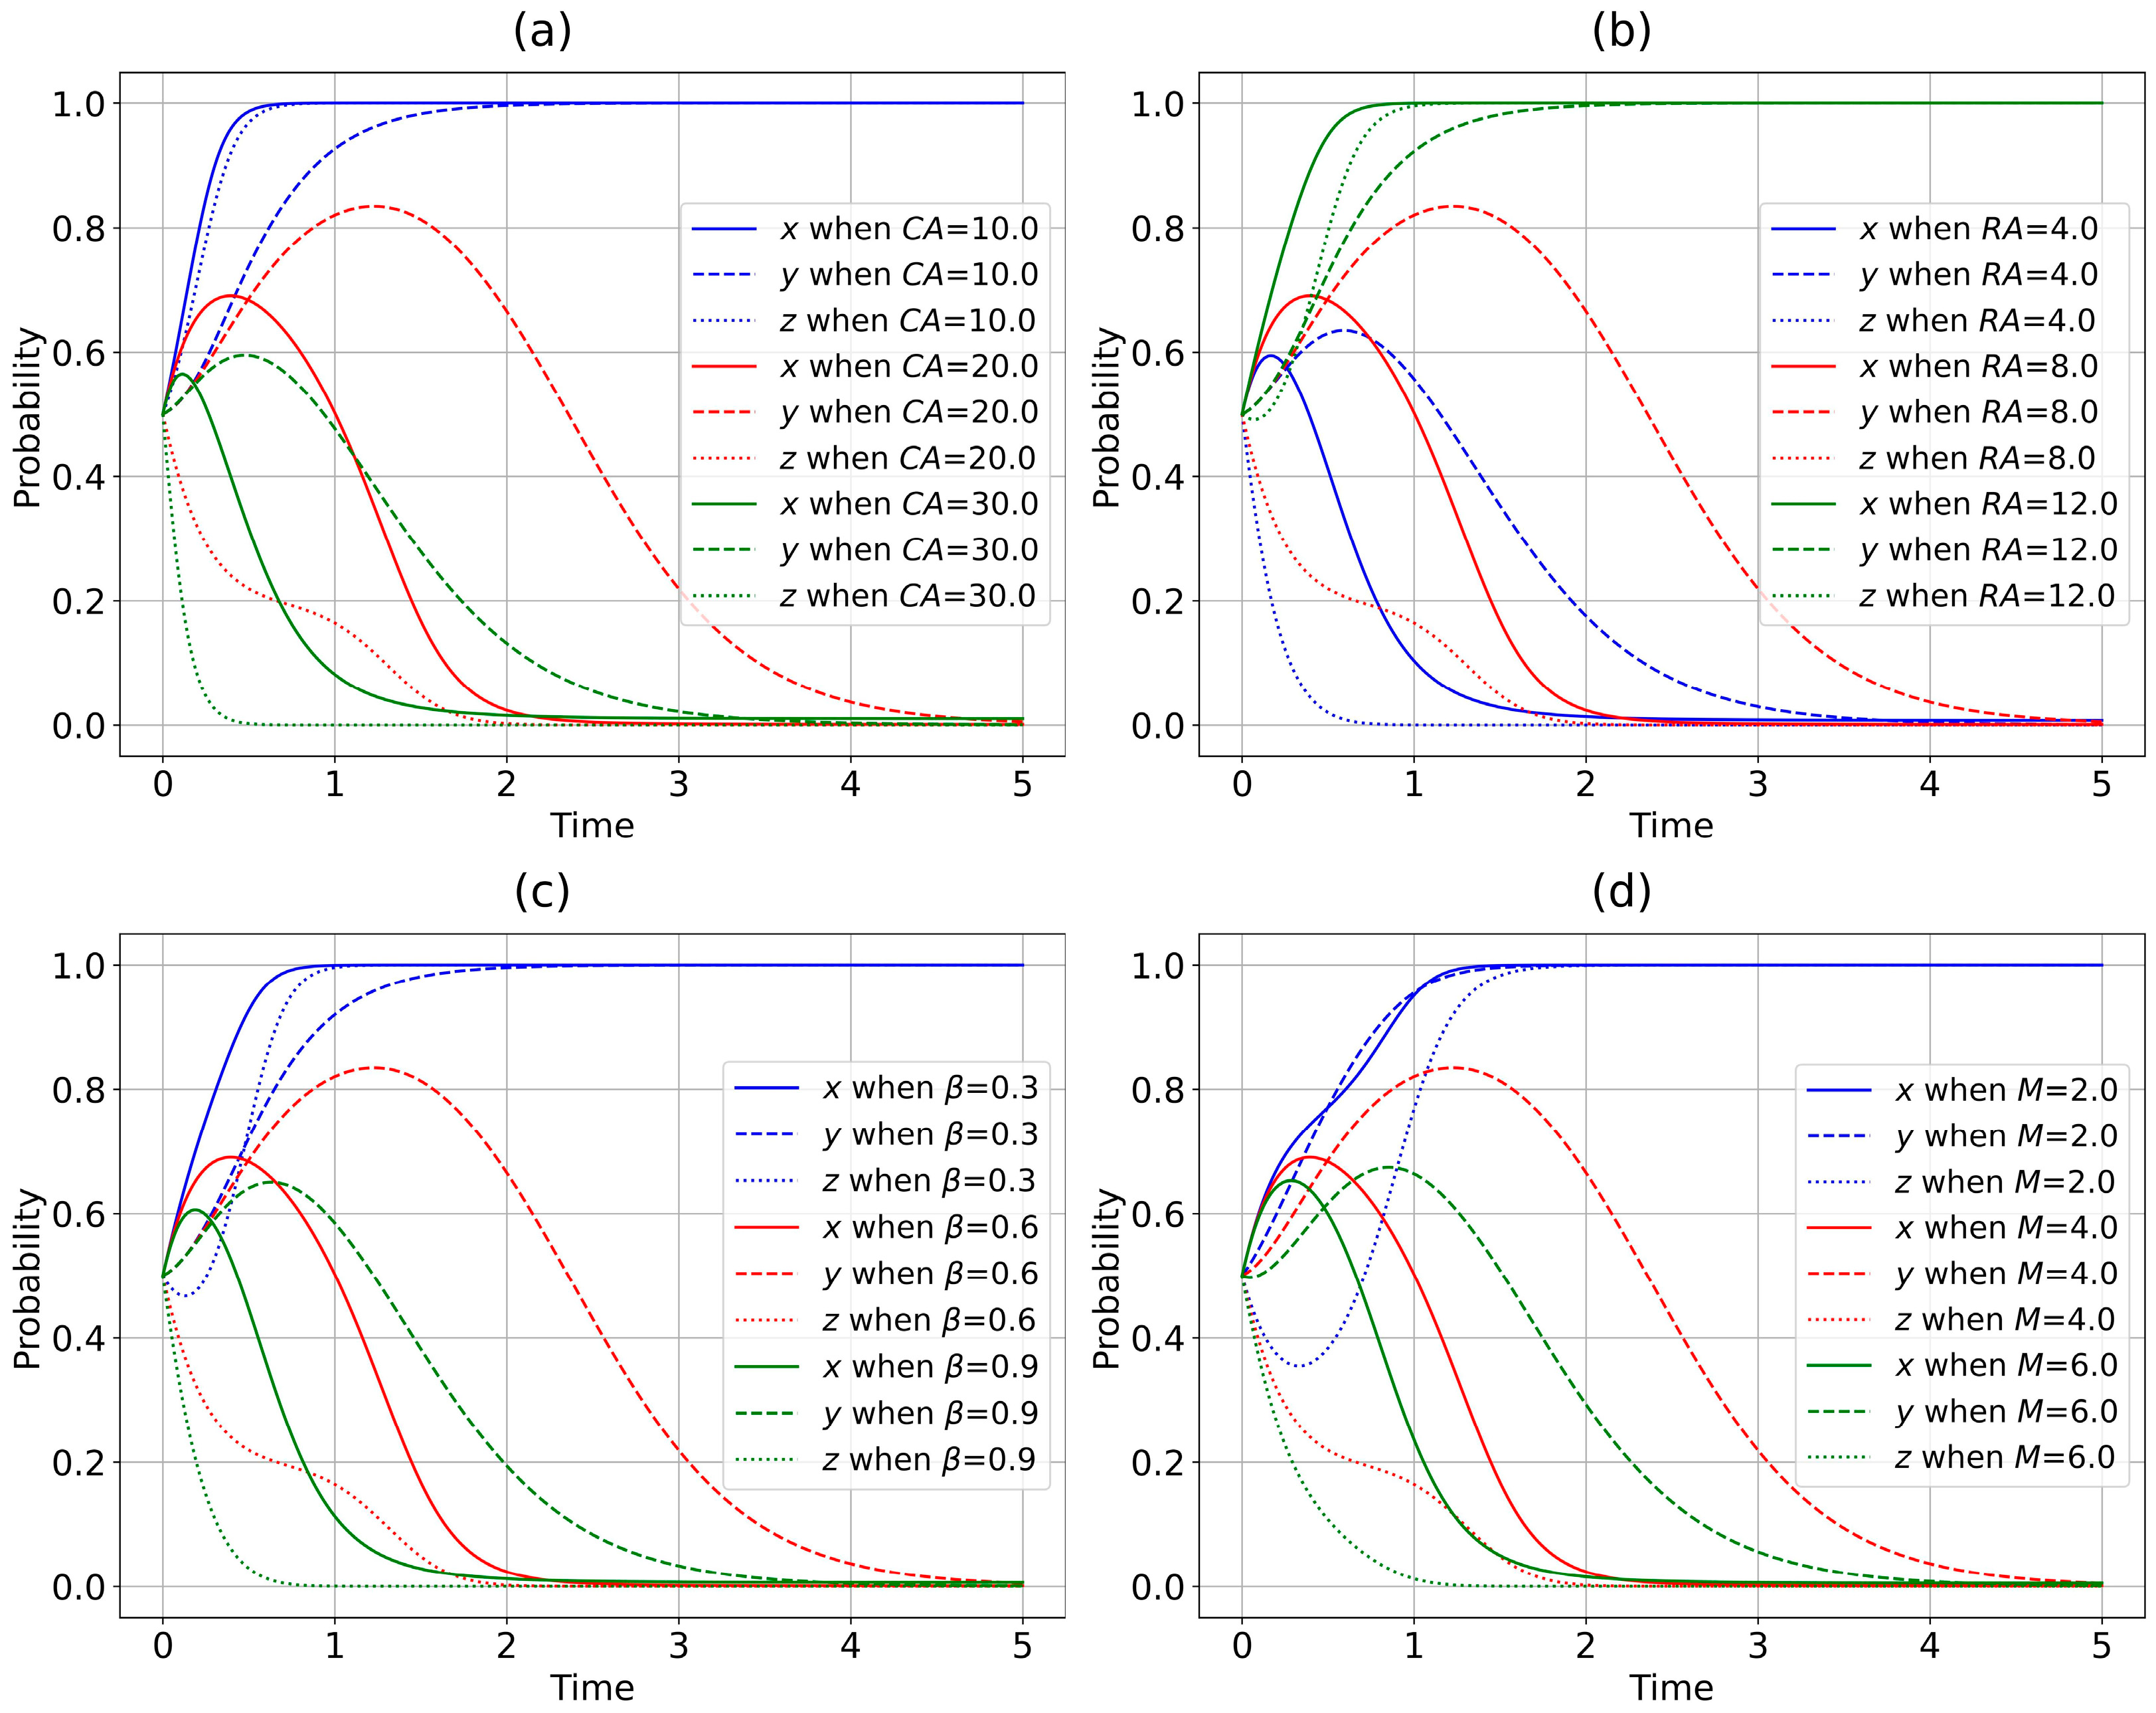
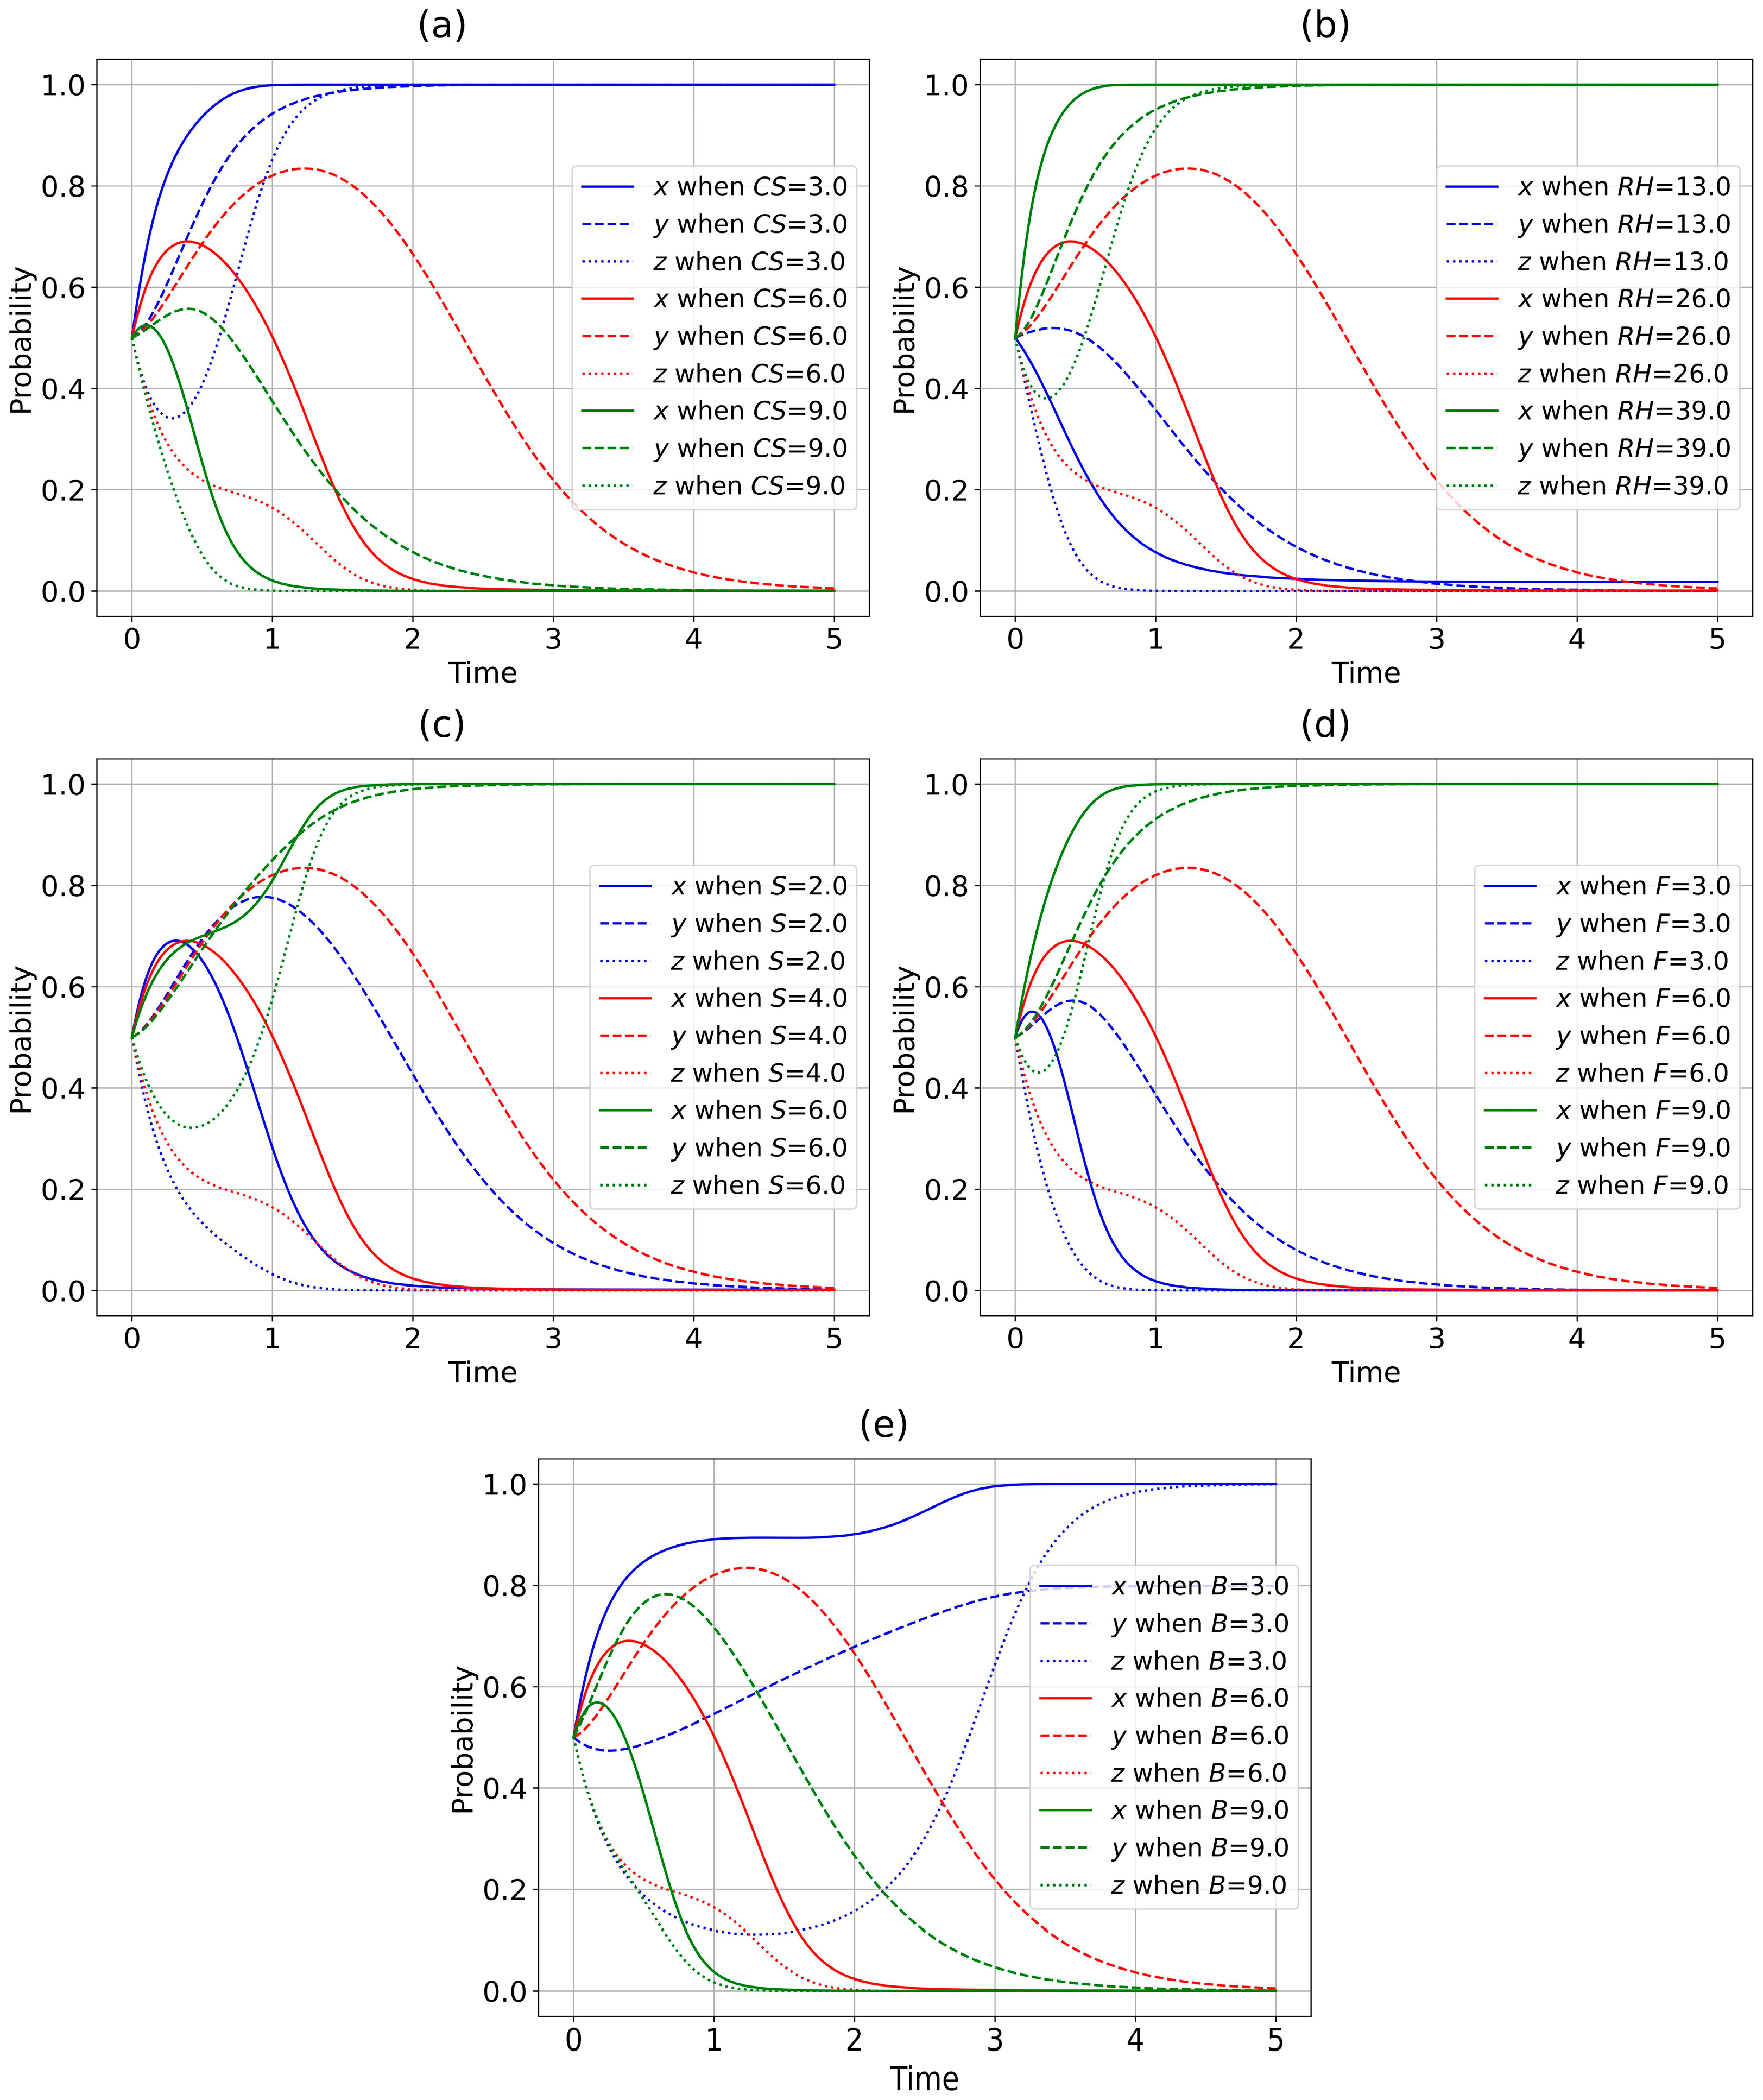
Based on the benchmark scenario, sensitivity analyses are conducted by varying one key parameter at a time while keeping the remaining parameters unchanged. The parameter ranges in Figure 1, Figure 2 and Figure 3 are designed to cover both sides of the relevant stability thresholds, rather than representing statistical confidence intervals. Specifically, incentive-related parameters, such as subsidies, fines, community support, cooperation benefit coefficients, and long-term enterprise benefits, are varied from relatively low to relatively high levels to examine whether stronger incentives accelerate convergence toward cooperative strategies. Cost- and risk-related parameters, such as opportunity costs, compensation burdens, regulation costs, and the effective AEI cost coefficient, are varied around the benchmark values to examine whether higher costs or weaker cost-reduction effects hinder the evolution toward the ideal equilibrium. The specific values corresponding to different curves are marked in the figure legends of Figure 1, Figure 2 and Figure 3.
Figure 1.
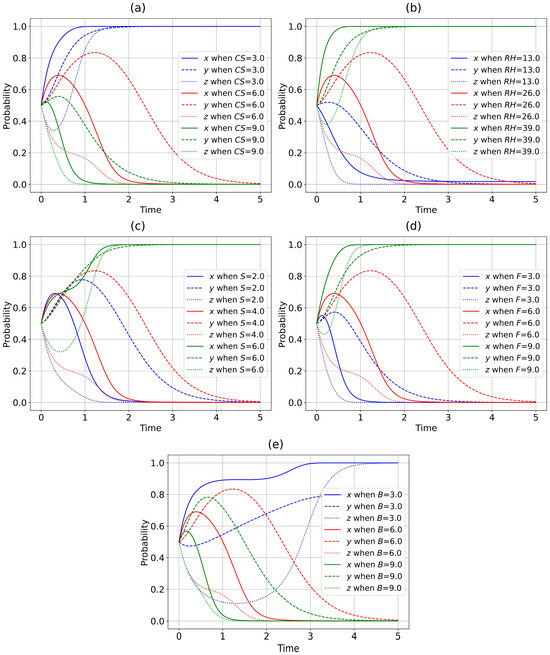
Impacts of local government behavioral parameters on evolutionary game. (a) CS = 3, 6, 9; (b) RH = 13, 26, 39; (c) S = 2, 4, 6; (d) F = 3, 6, 9; (e) B = 3, 6, 9. Other parameters are set to baseline values.
4.1. Impacts of Local Government Behavioral Parameters on Evolutionary Game
The numerical simulation results in Figure 1 reveal the significant impacts of local government behavioral parameters on the tripartite evolutionary game equilibrium of PVDC projects. Specifically, in Figure 1a, as the cost CS of implementing Strong Regulation increases, the probability x of local governments adopting Strong Regulation shows a downward trend and may rapidly decay to zero. Meanwhile, the probability y of communities adopting Active Cooperation and the probability z of photovoltaic enterprises adopting Active Ecological Integration also decline accordingly. This indicates that excessively high regulatory implementation costs weaken the government’s willingness to regulate, thereby reducing the external incentives for enterprises and communities to adopt positive strategies.
Figure 2.
Impacts of community behavioral parameters on evolutionary game. (a) RC = 3, 6, 9; (b) LH = 5, 10, 15; (c) CD = 1, 2, 3; (d) γ = 0.8, 1.5, 2.2. Other parameters are set to baseline values.
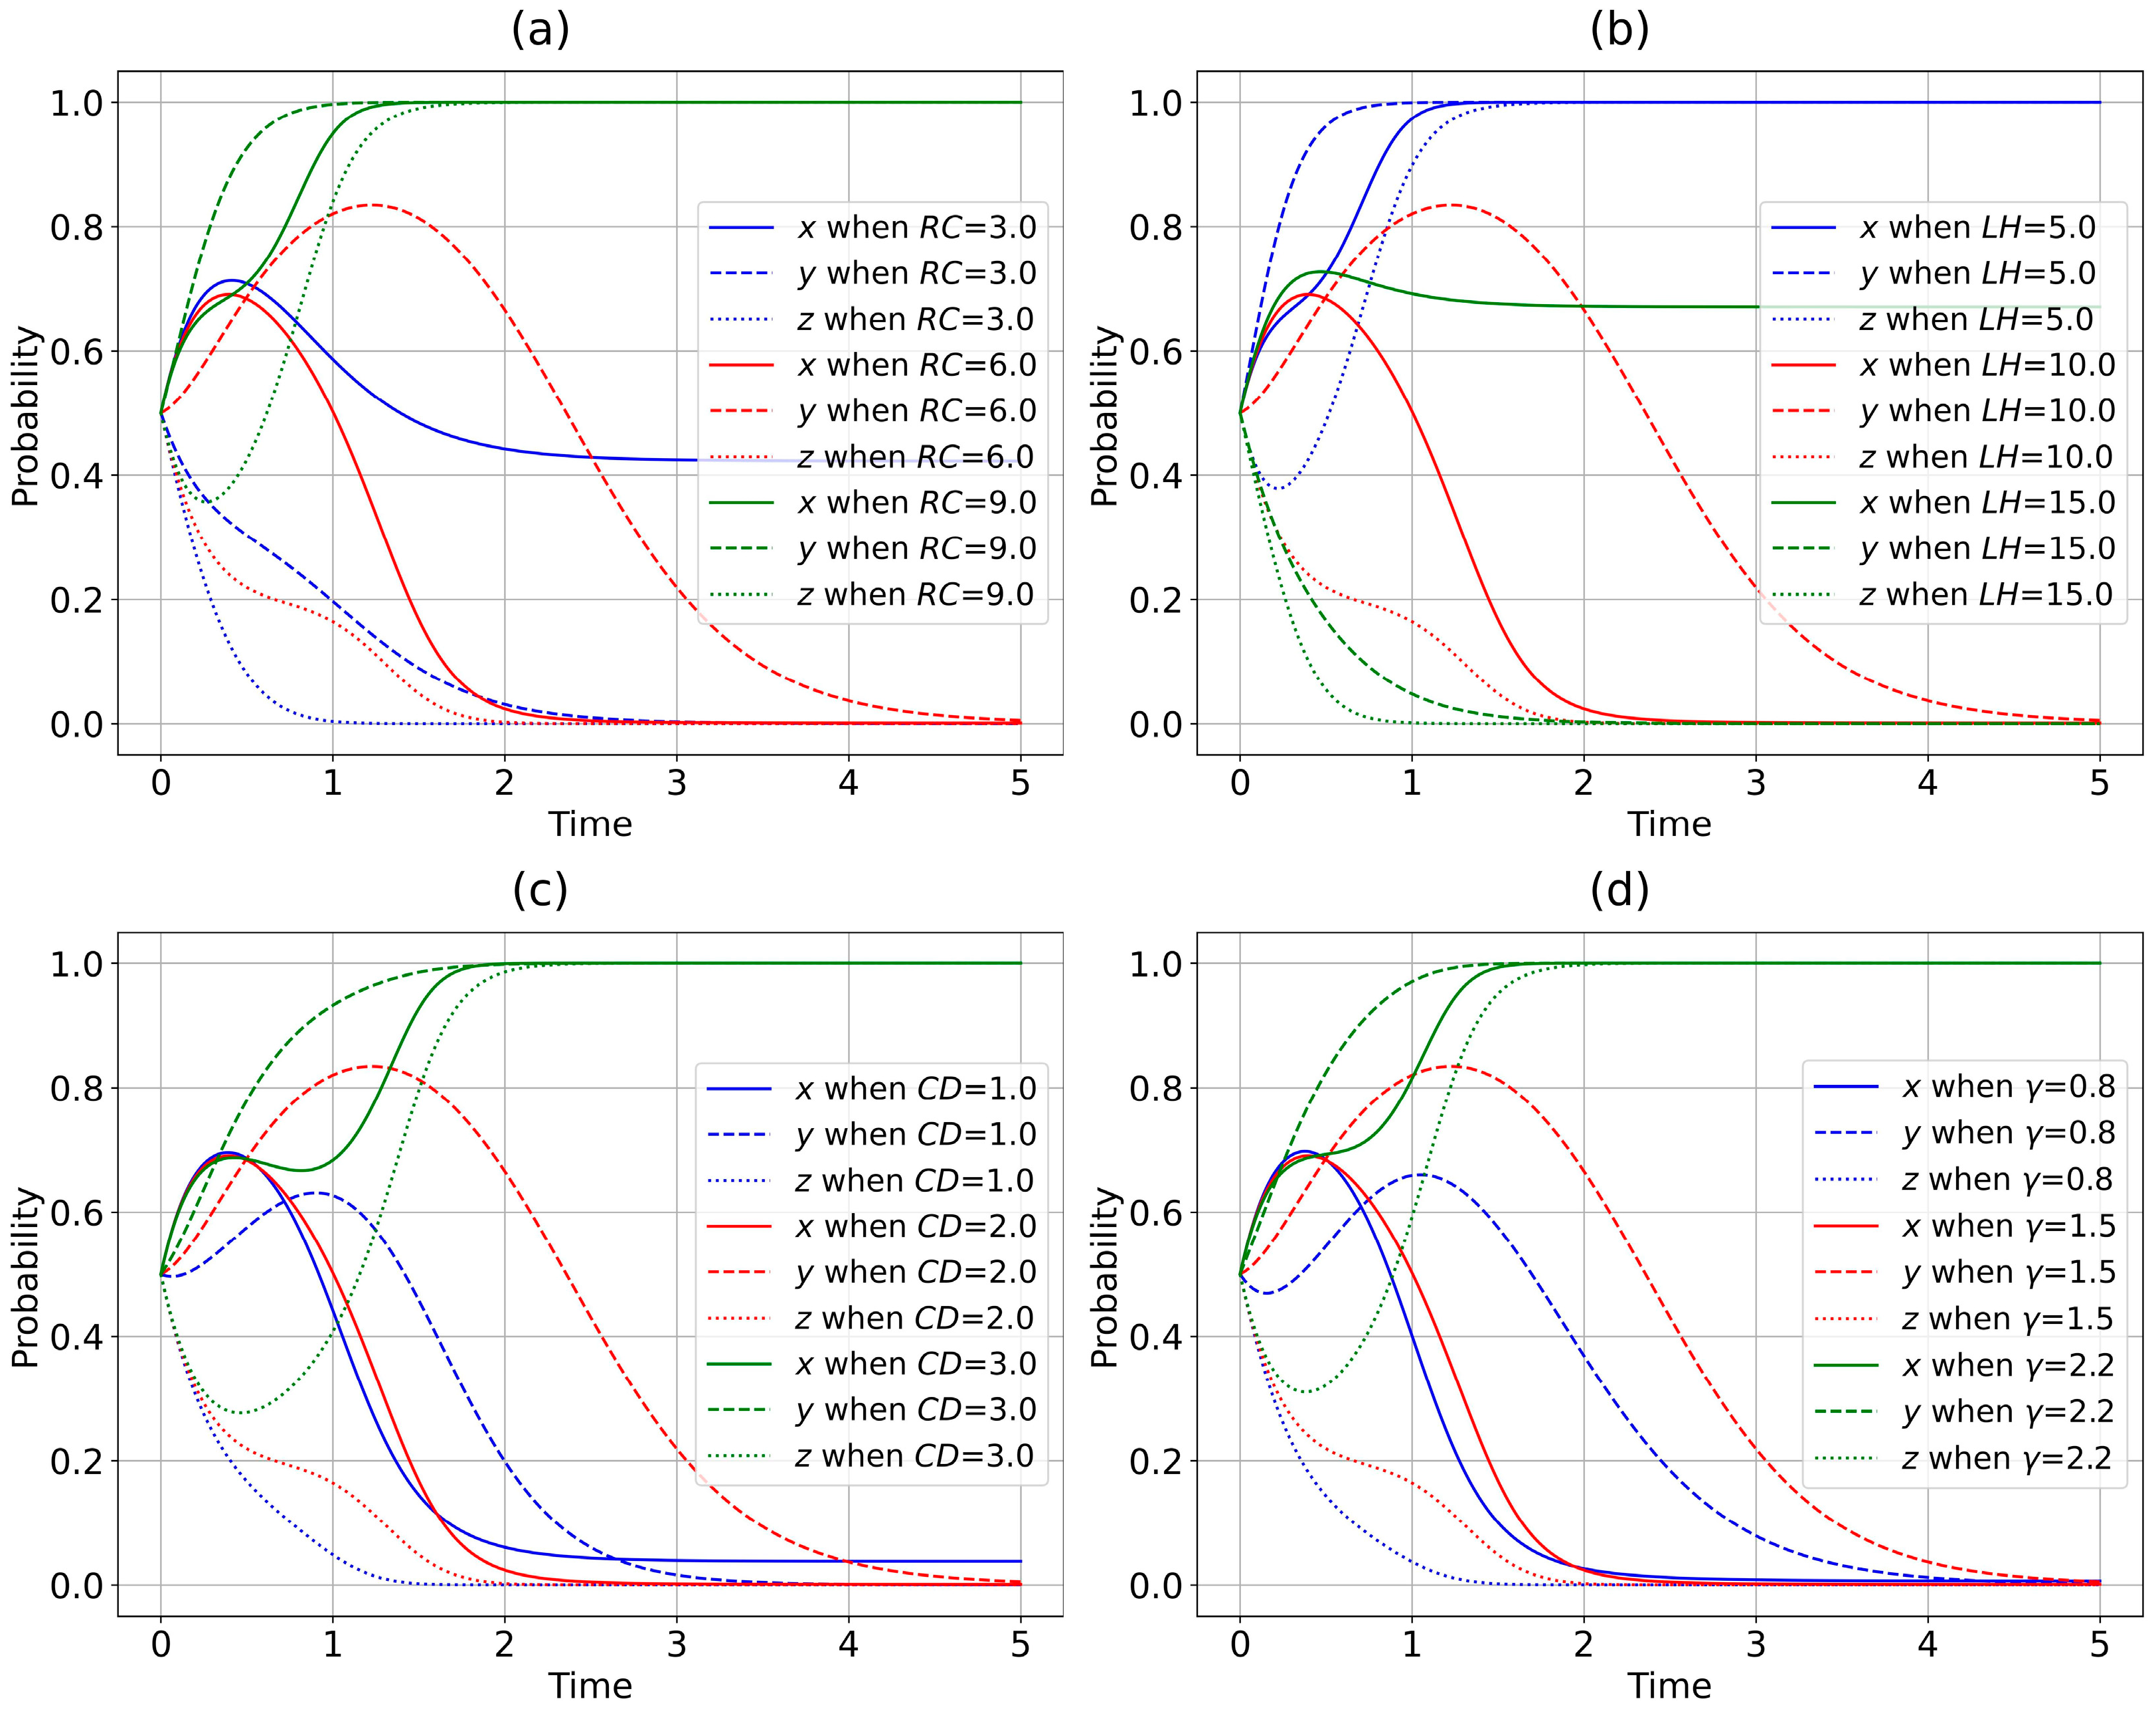
Figure 3.
Impacts of photovoltaic enterprise behavioral parameters on evolutionary game. (a) CA = 10, 20, 30; (b) RA = 4, 8, 12; (c) β = 0.3, 0.6, 0.9; (d) M = 2, 4, 6. Other parameters are set to baseline values.
In Figure 1b, the role of higher-level rewards RH is the opposite. When RH is low, local governments lack sufficient motivation to maintain Strong Regulation, and the three-party strategies tend to evolve toward negative choices, with x, y, and z approaching 0. When RH is sufficiently high, the government’s regulatory incentive is strengthened, and the strategies of the three agents rapidly converge toward the positive equilibrium, with x, y, and z approaching 1. This suggests that higher-level rewards can motivate local governments to adopt Strong Regulation and further promote benign interactions among governments, communities, and enterprises.
Figure 1c,d examine the impacts of government subsidies S and fines F on enterprise behavior. Under low values of S and F, the probability z of enterprises adopting Active Ecological Integration tends to approach 0, indicating that enterprises are more likely to choose Passive Land Occupation when policy incentives and penalties are insufficient. By contrast, higher subsidies or fines can significantly increase z, thereby encouraging enterprises to adopt Active Ecological Integration. Through the improvement of enterprise behavior, the probability y of community Active Cooperation may also increase due to stronger ecological and economic spillover effects.
Figure 1e simulates the effect of government support B for communities. According to the payoff matrix, B has a dual effect: it increases the payoff of community Active Cooperation, but also increases the fiscal burden of local governments under Strong Regulation. Therefore, moderate support can promote community cooperation and help the system move toward a positive equilibrium. However, if B becomes excessively high, it may increase government regulatory expenditure and weaken the sustainability of Strong Regulation, especially when the condition B + CS + S < RH is no longer satisfied. In this case, x may decline, and the weakening of government regulation may further reduce y and z. This indicates that community support should be maintained within a reasonable range: it must be high enough to encourage community cooperation, but not so high that it undermines the government’s long-term regulatory incentives.
4.2. Impacts of Community Behavioral Parameters on Evolutionary Game
The numerical simulation results in Figure 2 reveal the key impacts of community behavioral parameters on the tripartite evolutionary game equilibrium of PVDC projects. Specifically, Figure 2a shows that the additional benefit RC from community Active Cooperation is a core factor determining system evolution. When RC is low, the probability y of community Active Cooperation cannot be sustained and eventually tends to 0. As community cooperation weakens, the probability z of enterprises adopting Active Ecological Integration also declines, and the government’s willingness to maintain Strong Regulation, represented by x, gradually weakens. When RC is sufficiently high, communities are strongly motivated to cooperate, and enterprises are more likely to adopt Active Ecological Integration due to the positive spillover effects of community participation. As a result, x, y and z rapidly converge to 1, forming a cooperative equilibrium.
Figure 2b shows that the opportunity cost LH of community cooperation has a nonlinear impact on the system. When LH is low, communities face fewer livelihood transition barriers and are more likely to choose Active Cooperation, which further encourages enterprises to adopt Active Ecological Integration and supports the government’s regulatory effectiveness. In this case, x, y, and z tend to evolve toward positive strategies. However, when LH is medium or high, the opportunity cost of cooperation suppresses community participation, causing y to approach 0. The decline in community cooperation then weakens enterprise incentives for ecological integration, leading z to decrease, and eventually reduces the necessity and effectiveness of government Strong Regulation, causing x to decline.
Figure 2c shows that the cost CD of community Passive Resistance has a significant deterrent effect. When CD is low, Passive Resistance imposes little burden on communities, making it difficult to sustain Active Cooperation. As a result, y declines, and the weakening of community cooperation further reduces z, the probability of enterprise Active Ecological Integration. By contrast, when CD is high, Passive Resistance becomes more costly, encouraging communities to shift toward Active Cooperation. This promotes enterprise ecological integration through improved community support and lower conflict risks, leading y and z to approach 1. The government strategy x may also remain at a relatively high level when regulatory support is still needed to stabilize cooperation.
Figure 2d emphasizes the positive feedback effect of enterprises’ ecological behavior on community cooperation. A higher incentive coefficient γ means that enterprise Active Ecological Integration can generate greater marginal benefits for community cooperation, such as higher income from under-panel planting, employment, ecological restoration, and related sand-industry participation. Therefore, as γ increases, the stable level of community cooperation probability y rises, and the enterprise Active Ecological Integration probability z also increases. This reinforces the positive interaction between communities and enterprises and makes the system more likely to evolve toward a coordinated equilibrium.
4.3. Impacts of Photovoltaic Enterprise Behavioral Parameters on Evolutionary Game
The numerical simulation results in Figure 3 reveal the decisive impacts of photovoltaic enterprise behavioral parameters on the tripartite evolutionary game equilibrium. Specifically, Figure 3a shows that the additional cost CA of enterprises adopting Active Ecological Integration is a critical threshold for system evolution. When CA is low, the probability z of enterprises adopting Active Ecological Integration and the probability y of community Active Cooperation can both rapidly converge to 1.0. In this situation, enterprise–community coordination becomes strong, and the government’s Strong Regulation probability x may gradually decline if autonomous cooperation can be sustained. However, as CA increases, z and y may rise briefly but then rapidly decay to 0, indicating that excessively high ecological integration costs severely inhibit enterprises’ willingness to adopt Active Ecological Integration. This subsequently weakens community cooperation and reduces the effectiveness or necessity of government Strong Regulation.
Figure 3b shows that the additional benefit RA obtained by enterprises from Active Ecological Integration has a significant incentive effect. When RA is sufficiently high, enterprises are more willing to adopt Active Ecological Integration, so z tends to converge to 1.0. The improvement in enterprise ecological behavior also strengthens community cooperation incentives, causing y to increase. If government support and regulatory incentives remain effective, x may also stabilize at a high level, forming a coordinated state of Strong Regulation, Active Cooperation, and Active Ecological Integration. By contrast, when RA is medium or low, the long-term return from AEI is insufficient to offset ecological integration costs, making it difficult to maintain the positive equilibrium of the system.
Figure 3c,d jointly show how community behavior affects enterprise incentives through β and M. In this model, β represents the effective AEI cost coefficient under community cooperation rather than a direct cost-saving coefficient; therefore, a lower β means stronger cost-reduction effects from community cooperation, whereas a higher β means that enterprises still bear a relatively high ecological integration cost. Meanwhile, a lower M indicates a limited compensation burden caused by community resistance. When both β and M are low, enterprises are more willing to adopt Active Ecological Integration, so z is more likely to increase. This can further promote community Active Cooperation y and help the system reach a positive equilibrium. In contrast, high β and high M weaken enterprise incentives, reduce z, and may further suppress community cooperation and government regulatory effectiveness, eventually driving the system toward passive strategies.
5. Case Study
Multiple PVDC-related cases in Xinjiang, China, provide qualitative triangulation and practical illustrations of the tripartite coordinated governance mechanism revealed by the numerical simulations. Rather than serving as systematic empirical validation, these cases are used to show how specific governance practices correspond to the theoretical mechanisms of the model. They suggest that the system is more likely to move toward the coordinated co-governance state when government policy support is appropriately designed, community interests are effectively addressed, and photovoltaic enterprises balance economic rationality with ecological responsibility. The following presents a qualitative case-based analysis of PVDC-related practices in Xinjiang (Table 4).
Table 4.
Typical cases and stakeholder cooperation models.
First, local governments play a key role in reducing institutional and participation barriers. In Yutian County, the government clarified land-use rights by allocating state-owned sandy land to village collectives and contracting to households, while also providing infrastructure such as water, electricity, and roads. These measures effectively reduced the governance and participation costs faced by communities and enterprises. In the language of the model, government support can be understood as increasing the community support parameter B and reducing the practical burden associated with LH, the opportunity cost of community cooperation. Similarly, public infrastructure and policy coordination reduce the initial pressure of ecological investment for enterprises, making Active Ecological Integration more attractive. The Minfeng case further illustrates the role of government coordination in enabling large-scale enterprise-led ecological investment. By participating in the large-scale PVDC project cluster along the Taklamakan Desert and integrating large-scale biological sand control with photovoltaic deployment, local authorities provided the institutional and resource foundations necessary to align enterprise profitability with ecological restoration. These practices are consistent with the simulation result that appropriate government support and institutional facilitation can accelerate the convergence of the system toward a cooperative equilibrium.
Second, community participation depends on whether the net benefits of Active Cooperation exceed the opportunity costs of maintaining traditional livelihoods or engaging in Passive Resistance. The Yutian, Shaya, and Minfeng cases show that when PVDC is combined with local industries, communities are more likely to shift from passive recipients to active participants. In Yutian, farmers were guided to plant desert roses and other sand-adapted crops under the “enterprise + base + cooperative + farmer” industrial chain, demonstrating how regional industrial organization can diversify community income. In Shaya, photovoltaic power was used to support brackish water treatment and irrigation for Haloxylon ammodendron forests, while Cistanche deserticola cultivation and deep-processing industries further expanded income opportunities, showing how technological innovation in resource-constrained environments creates new value chains. In Minfeng, biological sand-fixation programs combined with PV deployment create sustained employment in vegetation maintenance, sand-fixation patrols, and under-panel husbandry, directly reducing the opportunity cost of livelihood transition. These arrangements increase RC, the additional income from Active Cooperation, and reduce the relative attractiveness of Passive Resistance. Employment opportunities created by photovoltaic projects and sand industries also strengthen communities’ expected returns. Therefore, the cases are consistent with the model’s implication that increasing cooperation benefits and reducing opportunity costs are essential for promoting Active Cooperation.
Third, photovoltaic enterprises’ strategic choices depend on whether the long-term benefits of ecological integration can compensate for additional ecological investment costs. The Shaya and Ruoqiang cases are typical examples. Shaya’s “photovoltaic + brackish water treatment + sand economy” model transforms photovoltaic power generation into an integrated ecological–industrial system. Ruoqiang explores the model of “power generation on panels, planting under panels, and breeding between panels,” extending enterprise returns from electricity sales to ecological agriculture and related industries. These practices increase RA, the long-term benefit of Active Ecological Integration, and help enterprises internalize ecological restoration as part of their business strategy. At the same time, when communities provide land, labor, and local management support—as seen in Yutian’s cooperative model and Minfeng’s integrated workforce engagement—the effective cost coefficient of AEI, β, can be reduced, meaning that community cooperation helps enterprises bear lower actual ecological integration costs. This corresponds to the numerical simulation result that a lower β significantly improves enterprises’ willingness to adopt Active Ecological Integration.
Overall, the Xinjiang PVDC cases provide practical illustrations and qualitative triangulation for the theoretical logic of the tripartite evolutionary game. Government support and institutional design help improve the external governance environment; community participation increases local cooperation benefits and reduces resistance incentives; and enterprise ecological integration transforms ecological responsibility into long-term commercial value. These cases are broadly consistent with the model and simulation results, suggesting that the coordinated equilibrium is more likely to emerge when government incentives and support are sufficient, community cooperation benefits outweigh opportunity costs, and enterprises can obtain long-term returns from ecological integration. Therefore, sustainable PVDC requires not only technical feasibility, but also a governance mechanism that aligns policy incentives, community interests, and enterprise profitability.
6. Discussion
6.1. From Technical Integration to Tripartite Socio-Ecological Governance
This study shows that PVDC should not be understood merely as a technical combination of photovoltaic power generation and desert control, but as a tripartite socio-ecological governance process involving local governments, photovoltaic enterprises, and communities. The evolutionary game results indicate that a stable coordinated equilibrium does not emerge automatically; it depends on whether institutional incentives can align government regulation, enterprise ecological investment, and community participation. This extends previous studies that mainly focus on policy evaluation or techno-economic performance [10,13,20], but lack dynamic characterization of the continuous and strategic interactions of various stakeholders after project implementation.
Community participation is particularly important because PVDC directly affects land use, livelihood transformation, employment opportunities, and local ecological benefits. This finding is consistent with renewable energy social acceptance studies, which emphasize that public support depends on socio-political acceptance, community acceptance, market acceptance, trust, perceived benefits, community identity, and participation opportunities [27,28,29]. It also echoes research on place attachment and energy justice, which suggests that energy projects may trigger resistance when they threaten local identity or distribute costs and benefits unfairly [40,41].
Compared with conventional renewable energy projects, PVDC has a stronger land-livelihood linkage: communities are not only nearby residents, but also land stakeholders, labor providers, and potential participants in sand industries. Therefore, mechanisms such as land-use rights clarification, employment priority, ecological compensation, cooperative participation, and income sharing are essential for reducing resistance and transforming desert control from an external ecological task into a local development opportunity.
6.2. Comparison with Similar PVDC and International Desert Solar Cases
The findings of this study are broadly consistent with evidence from similar desert photovoltaic cases in China and international desert solar projects. In China, the Qinghai Gonghe Photovoltaic Park shows that large-scale photovoltaic development in desert areas can improve local ecological conditions, including microclimate, soil properties, vegetation, and microbial communities, when combined with systematic environmental management [42]. This supports our argument that PVDC should not be treated as a purely engineering project, but as a coordinated socio-ecological governance process.
International cases provide useful comparisons, although most are primarily renewable energy projects rather than explicit desertification-control models. In Chile’s Atacama Desert, photovoltaic projects benefit from excellent solar resources but face serious dust-soiling and operation-maintenance challenges, with some sites reporting annual energy losses of up to 39% [43]. In India’s Thar Desert, studies on the Bhadla and Pokhran solar areas have raised concerns about land-use change, biodiversity conservation, and local livelihood systems [44]. The Benban Solar Park in Egypt and the NOOR 1 solar project in Morocco further indicate that large-scale desert solar projects require institutional coordination and environmental–social impact assessment [45].
Compared with many international desert solar projects, Xinjiang’s PVDC model is distinctive because it explicitly links renewable energy development with desertification control, ecological restoration, sand-industry development, and livelihood improvement. This comparison reinforces the central argument that sustainable PVDC requires the joint alignment of government incentives, community participation, and enterprise ecological integration.
6.3. Policy Implications for PVDC Governance
The findings provide actionable guidance for PVDC governance by linking policy instruments to the model’s key parameters and stability conditions. First, government regulation should be dynamic rather than permanently high-intensity. In the early stage, subsidies, fines, ecological performance assessment, and higher-level accountability are needed to prevent enterprises from choosing Passive Land Occupation. In model terms, ecological compensation and regulatory incentives correspond to S, B, and RH, and should be calibrated so that B + CS + S < RH, ensuring that Strong Regulation is institutionally worthwhile for local governments.
Second, community benefit-sharing should be treated as a core governance mechanism. Communities are more likely to choose Active Cooperation when visible and continuous benefits are created through land-use security, employment priority, cooperative participation, ecological compensation, and income sharing from sand industries. These mechanisms correspond to RC, RL, and LH. Policy design should raise cooperation income and land-related benefits while reducing livelihood opportunity costs, so that LH + M < B + CD + γ RC.
Third, enterprise ecological integration should be supported by long-term policy expectations and market mechanisms. Enterprises are more likely to adopt Active Ecological Integration when they can obtain stable returns from electricity generation, ecological agriculture, carbon-related benefits, green finance, reputation improvement, and reduced conflict risks. Intelligent monitoring and enforcement should reduce regulatory costs while strengthening fines and accountability, helping satisfy β CA < F + RA + S. Thus, PVDC governance should combine engineering standards with incentive-compatible social governance mechanisms.
7. Conclusions and Outlook
This study constructs a tripartite evolutionary game model involving local governments, local communities, and photovoltaic enterprises to reveal the coordinated governance mechanism of PVDC. Through stability analysis, numerical simulation, and qualitative evidence from Xinjiang PVDC-related cases, this study identifies the key conditions and governance drivers that promote the system toward the ideal equilibrium of Strong Regulation–Active Cooperation–Active Ecological Integration.
The results show that the ideal equilibrium E8 can be achieved only when three threshold conditions are simultaneously satisfied. First, government incentives and higher-level rewards must be sufficient to cover regulation, subsidy, and community-support costs, expressed as B + CS + S < RH. Second, community cooperation benefits must exceed the opportunity cost and compensation incentives associated with resistance, expressed as LH + M < B + CD + γ RC. Third, enterprises’ effective ecological integration cost must be lower than the combined benefits of subsidies, avoided fines, and long-term returns, expressed as β CA < F + RA + S. These conditions provide the theoretical basis for identifying whether PVDC governance can move from fragmented coordination to stable co-governance.
The system evolution is mainly driven by three mechanisms. The first is the government incentive and constraint mechanism, in which ecological compensation, subsidies, fines, and higher-level accountability correspond to B, S, F, RH, and PH. The second is the community benefit-sharing mechanism, in which land income, cooperation income, and livelihood opportunity cost correspond to RL, RC, and LH. The third is the enterprise cost–benefit reconfiguration mechanism, in which ecological integration cost, long-term benefit, subsidies, fines, and the effective AEI cost coefficient correspond to CA, RA, S, F, and β. These mechanisms explain why policy design must simultaneously address government regulation, community participation, and enterprise ecological investment.
The numerical simulations and Xinjiang cases further suggest that PVDC should not be treated merely as a technical combination of photovoltaic power generation and desert control. Rather, it should be understood as an integrated governance process that aligns clean energy production, ecological restoration, and local livelihood improvement. In practical terms, differentiated ecological compensation, community equity-sharing, and intelligent monitoring should be designed in direct correspondence with the above mechanisms, so as to improve the stability and sustainability of PVDC governance.
Several limitations remain, and they provide useful directions for future researchers in this field. First, this study adopts relatively stable parameters for theoretical modeling and sensitivity analysis, while real PVDC projects are affected by project scale, land ownership, ecological sensitivity, financing conditions, and local institutional arrangements. Future researchers are encouraged to conduct region-specific parameter calibration using field surveys, project-level cost–benefit data, remote-sensing monitoring, and expert evaluation. Second, the Xinjiang cases in this study are used mainly as qualitative triangulation and practical illustrations rather than systematic empirical validation. Future studies could expand the sample of PVDC projects across different arid and semi-arid regions and adopt comparative case studies, questionnaire surveys, interviews, and longitudinal tracking to test the robustness of the conclusions. Third, future research should further incorporate external uncertainties, including climate change risks, extreme weather events, water-resource constraints, market fluctuations, photovoltaic component recycling, and cross-regional ecological compensation. In particular, integrating dynamic modeling, spatial heterogeneity, intelligent monitoring, and whole-life-cycle governance would help deepen understanding of how PVDC can evolve into a more adaptive and sustainable governance paradigm that balances energy production, ecological restoration, and community welfare.
Author Contributions
Conceptualization, X.Z. and A.B.; methodology, X.Z. and S.C. (Siyu Chen); software, X.Z.; validation, X.Z., A.B. and S.C. (Shaobo Cai); formal analysis, X.Z.; investigation, X.Z. and S.C. (Siyu Chen); resources, A.B. and S.C. (Shaobo Cai); data curation, X.Z.; writing—original draft preparation, X.Z.; writing—review and editing, A.B., S.C. (Siyu Chen) and S.C. (Shaobo Cai); visualization, X.Z.; supervision, A.B. and S.C. (Shaobo Cai); project administration, A.B. and S.C. (Shaobo Cai); funding acquisition, A.B. All authors have read and agreed to the published version of the manuscript.
Funding
This research was funded by Key R&D Project in Xinjiang (grant number 2024B03024-3).
Data Availability Statement
Data is available on request from the authors.
Acknowledgments
We would like to thank Xu Wenqiang from the Xinjiang Institute of Ecology and Geography, Chinese Academy of Sciences, for his data support for this paper.
Conflicts of Interest
The authors declare no conflicts of interest.
References
- Bidwell, D. Thinking through Participation in Renewable Energy Decisions. Nat. Energy 2016, 1, 16051. [Google Scholar] [CrossRef] [Scilit]
- Davidson, D.J. Exnovating for a Renewable Energy Transition. Nat. Energy 2019, 4, 254–256. [Google Scholar] [CrossRef] [Scilit]
- Cho, H.H.; Strezov, V.; Evans, T.J. A Review on Global Warming Potential, Challenges and Opportunities of Renewable Hydrogen Production Technologies. Sustain. Mater. Technol. 2023, 35, e00567. [Google Scholar] [CrossRef] [Scilit]
- Lyu, X.; Li, X.; Zhang, C.; Dang, D.; Wang, K.; Lou, A. Mapping the Carbon Mitigation Potential of Photovoltaic Development in the Gobi and Desert Regions of China. Energy 2024, 308, 132936. [Google Scholar] [CrossRef] [Scilit]
- Wu, J.; Xiao, J.; Hou, J.; Lyu, X. Development Potential Assessment for Wind and Photovoltaic Power Energy Resources in the Main Desert-Gobi-Wilderness Areas of China. Energies 2023, 16, 4559. [Google Scholar] [CrossRef] [Scilit]
- Jiang, J.; Du, H.; Yin, H.; Su, H. Study on the Impact of Large-Scale Photovoltaic Systems on Key Surface Parameters in Desert Area Regions of Xinjiang, China. Energies 2025, 18, 3170. [Google Scholar] [CrossRef] [Scilit]
- Li, N.; Yu, W.; Liu, K.; Zhou, Y.; Zhang, H.; Zhang, H. Reveal the Deployable Solar Energy Potential and Emission Reduction Benefits in the Arid Areas of Xinjiang. Sci. Rep. 2026, 16, 10437. [Google Scholar] [CrossRef] [Scilit]
- Yu, X.; Lei, J.; Gao, X. An over Review of Desertification in Xinjiang, Northwest China. J. Arid. Land 2022, 14, 1181–1195. [Google Scholar] [CrossRef] [Scilit]
- Zhao, Y.; Li, S.; Yang, D.; Lei, J.; Fan, J. Spatiotemporal Changes and Driving Force Analysis of Land Sensitivity to Desertification in Xinjiang Based on GEE. Land 2023, 12, 849. [Google Scholar] [CrossRef] [Scilit]
- Liu, Y.; Wang, D.; Chang, X.; An, J.; Mu, R.; Li, X.; Xu, T.; Yang, B. Research Progress in the Impact of Photovoltaic Power Station Construction on the Ecological Environment of the Desert Region of Northwest China. Sci. Soil Water Conserv. 2025, 23, 9–17. [Google Scholar] [CrossRef]
- Dilixiati, B.; Wang, H.; Gong, L.; Wei, J.; Lei, C.; Dang, L.; Zhang, X.; Gu, W.; Zhang, H.; Zhang, J. Land Use Dynamics and Ecological Effects of Photovoltaic Development in Xinjiang: A Remote Sensing and Geospatial Analysis. Land 2025, 14, 1294. [Google Scholar] [CrossRef] [Scilit]
- Ito, M.; Kato, K.; Sugihara, H.; Kichimi, T.; Song, J.; Kurokawa, K. A Preliminary Study on Potential for Very Large-Scale Photovoltaic Power Generation (VLS-PV) System in the Gobi Desert from Economic and Environmental Viewpoints. Sol. Energy Mater. Sol. Cells 2003, 75, 507–517. [Google Scholar] [CrossRef] [Scilit]
- Wu, X.; Li, H.; Sang, S.; He, A.; Re, Y.; Xu, H. Performance Analysis and Selection of Chinese Solar Greenhouses in Xinjiang Desert Area. Agriculture 2023, 13, 306. [Google Scholar] [CrossRef] [Scilit]
- Devitt, D.A.; Apodaca, L.; Bird, B.; Dawyot, J.P.; Fenstermaker, L.; Petrie, M.D. Assessing the Impact of a Utility Scale Solar Photovoltaic Facility on a Down Gradient Mojave Desert Ecosystem. Land 2022, 11, 1315. [Google Scholar] [CrossRef] [Scilit]
- Xia, Z.; Li, Y.; Zhang, W.; Chen, R.; Guo, S.; Zhang, P.; Du, P. Solar Photovoltaic Program Helps Turn Deserts Green in China: Evidence from Satellite Monitoring. J. Environ. Manag. 2022, 324, 116338. [Google Scholar] [CrossRef] [Scilit]
- Li, L.; Quan, W.; Lyu, K.; Jiang, B.; Chen, B.; Cheng, H.; Duan, C. The Ecological and Social Benefits of Desert Photovoltaics: A Case Study of the Kubuqi Desert. Ecol. Indic. 2026, 182, 114602. [Google Scholar] [CrossRef] [Scilit]
- Abutaleb, S.; El-Bassiouny, N. Assessing Sustainability Marketing from Macromarketing Perspective: A Multistakeholder Approach. World J. Entrep. Manag. Sustain. Dev. 2020, 16, 287–305. [Google Scholar] [CrossRef] [Scilit]
- Ahzi, S.; Aly, S.P.; Barth, N.; Abdallah, A. Modeling and Simulation of the Longtime Behavior and Fatigue Failure of Photovoltaic Modules under Desert Environment. In Proceedings of the 2019 7th International Renewable and Sustainable Energy Conference (IRSEC), Agadir, Morocco, 27–30 November 2019; ElHibaoui, A., Essaaidi, M., Zaz, Y., Eds.; IEEE: Piscataway, NJ, USA, 2019; pp. 52–56. [Google Scholar]
- Song, Z.; Zhou, J.; Yang, C.; Wu, S.; Chen, Z.; Sun, J.; Wu, Y. “Photovoltaic +” Multi-Industry Integration for Sustainable Development in “Desert-Gobi-Wilderness” Region: Geospatial Suitability Simulation and Dynamic Site Selection Decision Optimization. Land 2025, 14, 1410. [Google Scholar] [CrossRef] [Scilit]
- Krupa, J. Energy from the Desert: Very Large Scale Photovoltaic Power—State of the Art and into the Future. Energy Policy 2013, 61, 1608–1609. [Google Scholar] [CrossRef] [Scilit]
- Wang, G.; Chao, Y.; Jiang, T.; Lin, J.; Peng, H.; Chen, H.; Chen, Z. Analyzing the Effects of Government Policy and Solar Photovoltaic Hydrogen Production on Promoting CO2 Capture and Utilization by Using Evolutionary Game Analysis. Energy Strateg. Rev. 2023, 45, 101044. [Google Scholar] [CrossRef] [Scilit]
- Sun, Y.; Du, H.; Liu, B.; Kanchanaroek, Y.; Zhang, J.; Zhang, P. Evolutionary Game Analysis for Grassland Degradation Management, Considering the Livelihood Differentiation of Herders. Land 2022, 11, 1776. [Google Scholar] [CrossRef] [Scilit]
- Li, N.; Lv, T.; Guo, Y.; Xu, J.; Zang, X.; Guo, J.; Li, M. Can Government Supervision Ensure Compliance by Photovoltaic Enterprises? An Evolutionary Game Analysis. Energy Policy 2025, 206, 114740. [Google Scholar] [CrossRef] [Scilit]
- Liu, Y.; Zhang, R.-Q.; Huang, Z.; Cheng, Z.; Lopez-Vicente, M.; Ma, X.-R.; Wu, G.-L. Solar Photovoltaic Panels Significantly Promote Vegetation Recovery by Modifying the Soil Surface Microhabitats in an Arid Sandy Ecosystem. Land Degrad. Dev. 2019, 30, 2177–2186. [Google Scholar] [CrossRef] [Scilit]
- Wang, Y.; Liu, B.; Xing, Y.; Peng, H.; Wu, H.; Zhong, J. Ecological Construction Status of Photovoltaic Power Plants in China’s Deserts. Front. Environ. Sci. 2024, 12, 1406546. [Google Scholar] [CrossRef] [Scilit]
- Li, X.; Cheng, F.; Yang, Y.; Zhang, Z.; He, C.; Liu, S. Research on Comprehensive Risk Assessment Model of Photovoltaic Desertification Control Projects Based on the Whole Life Cycle—A Case Study of China. Pol. J. Environ. Stud. 2025, 34, 5655–5668. [Google Scholar] [CrossRef] [Scilit]
- Wuestenhagen, R.; Wolsink, M.; Buerer, M.J. Social Acceptance of Renewable Energy Innovation: An Introduction to the Concept. Energy Policy 2007, 35, 2683–2691. [Google Scholar] [CrossRef] [Scilit]
- Rogers, J.C.; Simmons, E.A.; Convery, I.; Weatherall, A. Public Perceptions of Opportunities for Community-Based Renewable Energy Projects. Energy Policy 2008, 36, 4217–4226. [Google Scholar] [CrossRef] [Scilit]
- Kalkbrenner, B.J.; Roosen, J. Citizens’ Willingness to Participate in Local Renewable Energy Projects: The Role of Community and Trust in Germany. Energy Res. Soc. Sci. 2016, 13, 60–70. [Google Scholar] [CrossRef] [Scilit]
- Chen, Z.; Wang, T. Photovoltaic Subsidy Withdrawal: An Evolutionary Game Analysis of the Impact on Chinese Stakeholders’ Strategic Choices. Sol. Energy 2022, 241, 302–314. [Google Scholar] [CrossRef] [Scilit]
- Tao, B.; Wang, C. Promoting Distributed Photovoltaic Adoption: An Evolutionary Game Model Approach for Stakeholder Coordination. PLoS ONE 2024, 19, e0302241. [Google Scholar] [CrossRef] [Scilit] [PubMed]
- Yu, J.; Liu, J.; Sun, J.; Shi, M. Evolutionary Game of Digital-Driven Photovoltaic-Storage-Use Value Chain Collaboration: A Value Intelligence Creation Perspective. Sustainability 2023, 15, 3287. [Google Scholar] [CrossRef] [Scilit]
- Brown, J.; Vincent, T. A Theory for the Evolutionary Game. Theor. Popul. Biol. 1987, 31, 140–166. [Google Scholar] [CrossRef] [Scilit]
- Ahmad, F.; Shah, Z.; Al-Fagih, L. Applications of Evolutionary Game Theory in Urban Road Transport Network: A State of the Art Review. Sustain. Cities Soc. 2023, 98, 104791. [Google Scholar] [CrossRef] [Scilit]
- Liao, D.; Tan, B. An Evolutionary Game Analysis of New Energy Vehicles Promotion Considering Carbon Tax in Post-Subsidy Era. Energy 2023, 264, 126156. [Google Scholar] [CrossRef] [Scilit]
- Sun, Y.; Miao, Y.; Xie, Z.; Jiang, X. Address the Challenge of Cultivated Land Abandonment by Cultivated Land Adoption: An Evolutionary Game Perspective. Land Use Policy 2025, 149, 107412. [Google Scholar] [CrossRef] [Scilit]
- Sun, Y.; Jiang, H.; Zhu, X. Drivers, Constraints, and Policy Regulation Strategies for the Abandonment of Farmland: Insights from China. Land 2024, 13, 2096. [Google Scholar] [CrossRef] [Scilit]
- Cheng, L.; Huang, H.; Sun, Y.; Li, Z.; Du, H. The Evolutionary Game in Regulating Non-Agricultural Farmland Use within the Integrated Development of Rural Primary, Secondary, and Tertiary Industries. Land 2024, 13, 1600. [Google Scholar] [CrossRef] [Scilit]
- Xu, L.; Di, Z.; Chen, J. Evolutionary Game of Inland Shipping Pollution Control under Government Co-Supervision. Mar. Pollut. Bull. 2021, 171, 112730. [Google Scholar] [CrossRef] [Scilit]
- Devine-Wright, P. Rethinking NIMBYism: The Role of Place Attachment and Place Identity in Explaining Place-Protective Action. J. Community Appl. Soc. Psychol. 2009, 19, 426–441. [Google Scholar] [CrossRef] [Scilit]
- Sovacool, B.K.; Dworkin, M.H. Energy Justice: Conceptual Insights and Practical Applications. Appl. Energy 2015, 142, 435–444. [Google Scholar] [CrossRef] [Scilit]
- Wu, W.; Chen, H.; Li, C.; Lu, G.; Ye, D.; Ma, C.; Ren, L.; Li, G. Assessment of the Ecological and Environmental Effects of Large-Scale Photovoltaic Development in Desert Areas. Sci. Rep. 2024, 14, 22456. [Google Scholar] [CrossRef] [Scilit] [PubMed]
- Cordero, R.R.; Damiani, A.; Laroze, D.; MacDonell, S.; Jorquera, J.; Sepulveda, E.; Feron, S.; Llanillo, P.; Labbe, F.; Carrasco, J.; et al. Effects of Soiling on Photovoltaic (PV) Modules in the Atacama Desert. Sci. Rep. 2018, 8, 13943. [Google Scholar] [CrossRef] [Scilit] [PubMed]
- Vyas, D.; Rao, C.; Parihar, G. Analyzing the Influence of Solar Panel Deployment on Land Use and Biodiversity Patterns in the Bhadla and Pokhran Regions of the Thar Desert: A Comparative Study with Oran Landscape. J. Environ. Bio-Sci. 2024, 38, 45–49. [Google Scholar] [CrossRef] [Scilit]
- Laaroussi, A.; Laaroussi, O.; Bouayad, A. Environmental Impact Study of the NOOR 1 Solar Project on the Southern Region of Morocco. Renew. Energy Environ. Sustain. 2023, 8, 9. [Google Scholar] [CrossRef] [Scilit]

Disclaimer/Publisher’s Note: The statements, opinions and data contained in all publications are solely those of the individual author(s) and contributor(s) and not of MDPI and/or the editor(s). MDPI and/or the editor(s) disclaim responsibility for any injury to people or property resulting from any ideas, methods, instructions or products referred to in the content. |
© 2026 by the authors. Licensee MDPI, Basel, Switzerland. This article is an open access article distributed under the terms and conditions of the Creative Commons Attribution (CC BY) license.