


Abstract
Mangrove ecosystems provide critical coastal protection, biodiversity support, and carbon storage, yet they remain vulnerable to degradation caused by coastal development, pollution, and climate-related pressures. This study monitors mangrove dynamics in Al-Birk, Asir Region, Saudi Arabia, using Google Earth Engine (GEE), multi-temporal Landsat imagery, spectral indices, and Random Forest (RF) classification. Landsat imagery from 2016 to 2021 was processed to derive NDVI, MSAVI2, EVI, and NDWI, and supervised RF classification was applied to map annual mangrove extent and associated land-cover classes. The RF classifier achieved an overall accuracy of 92.5% and a Kappa coefficient of 0.89. Results indicate that classified mangrove extent increased from approximately 1069 ha in 2016 to 1540 ha in 2021, representing a net gain of 471 ha and a 44% increase over the study period. A localized decline was detected between 2020 and 2021, indicating spatially uneven vegetation dynamics. The findings provide a spatial baseline for monitoring mangrove change and supporting coastal conservation planning in Saudi Arabia. While the detected expansion is temporally consistent with ongoing restoration initiatives, the study does not establish direct causality between policy interventions and observed spatial changes.
1. Introduction
Mangroves are among the most valuable coastal ecosystems, providing shoreline protection, biodiversity habitat, fisheries support, and long-term carbon storage [1,2,3]. Despite these ecological and socioeconomic functions, mangrove ecosystems have undergone substantial degradation at the global scale due to coastal development, aquaculture expansion, pollution, and climate-related stressors [4,5,6,7,8,9]. The rate and intensity of degradation vary geographically and depend on local development pressures, environmental conditions, and the effectiveness of protection and restoration frameworks. At the global scale, monitoring initiatives such as the Global Mangrove Watch have documented measurable changes in mangrove extent over recent decades, while regional studies have shown that degradation patterns differ across Latin America, Africa, the Middle East, and arid coastal environments [7,10].
In Saudi Arabia, mangrove ecosystems are mainly distributed along the Red Sea and Arabian Gulf coasts, where they are spatially fragmented and vulnerable to coastal development, industrial encroachment, and pollution [10,11]. Previous studies have reported a 10–15% reduction in mangrove cover in selected developed coastal areas of Saudi Arabia over the last two decades, based on multi-temporal satellite-image analysis used to quantify land-cover conversion and degradation [10,11]. In response to these pressures, several national conservation and restoration initiatives have been launched, including the Saudi Green Initiative and related coastal rehabilitation programs [12,13,14]. However, the effectiveness of such initiatives can be constrained by limited spatial information on degraded areas, insufficient monitoring of restoration outcomes, logistical challenges, limited community engagement, and the absence of consistent long-term datasets on mangrove density and extent [15,16,17]. These limitations highlight the need for reliable, repeatable, and spatially explicit monitoring methods that can identify changes in mangrove distribution and support evidence-based restoration planning.
In this context, geospatial data have been widely used to quantify climate- and development-related indicators affecting coastal ecosystems, including deforestation rates, vegetation stress, surface moisture, and sea-level-related changes [4,15,18,19]. For mangrove environments, multi-temporal satellite imagery and vegetation indices are particularly useful for detecting recovery, degradation, and spatial redistribution of vegetation cover [2,20,21,22]. Remote sensing provides a systematic and operationally repeatable means of monitoring coastal ecosystems that are structurally complex, spatially fragmented, or logistically inaccessible for field-based surveys [23,24]. In the context of mangrove ecosystems, this capability is particularly critical, as tidal dynamics, dense root networks, and remote coastal settings impose severe constraints on ground-based data collection at ecologically meaningful temporal frequencies [25]. Consequently, remote sensing has become an essential instrument for a great variety of uses, which include, but are not limited to, biodiversity conservation, environmental monitoring, geological/mineral exploration, and disaster control. The recent developments in sensor technologies, data resolution, and computing power have further increased the capabilities of remote sensing and have added thermal, infrared, and radar technologies [16,26,27,28].
Recent studies have demonstrated that high-performance cloud computing platforms, such as Google Earth Engine (GEE), enable the processing of decadal Landsat and Sentinel archives with high efficiency [25,29]. Similarly, machine learning ensembles, including Random Forest (RF) and Support Vector Machine (SVM), have significantly improved the discrimination of mangrove species and the detection of small patches [30]. The methodological opportunity being exploited here is the convergence of mature multi-decadal archives, such as the Landsat program, which has been operational since 1972, with cloud-based processing infrastructure like GEE, rather than relying solely on novel sensor technologies [16,28,29,30].
Overall, remote sensing information is crucial in modeling, impact assessment, and evidence-based global policy response formulation [31]. These technologies also facilitate the monitoring and evaluation of city development strategies for climate change adaptation and mitigation [32]. Mangrove ecosystems can be successfully identified, mapped, and tracked through remote sensing, which is useful for assessing the spatial expanse, structural attributes, health state, and temporal variation in these systems [2,33]. Remote sensing can be used to detect the changes in the mangrove cover, such as recovery, degradation, and deforestation [9]. Since mangroves are very sensitive to climatic changes, a rise in sea level, and human activities, conservation activities should be monitored frequently and effectively to ensure mangroves are conserved. Advanced remote sensing methods can map the biomass, canopy structure, and species distributions with high precision and track the impact of coastal development and natural hazards. However, there are still difficulties concerning the validity of traditional remote sensing methods to ensure the distinction between mangrove species, especially in intertwined vegetation societies, considering that the plants are highly connected.
Computer vision and pattern recognition, as well as artificial intelligence (AI) technology, have experienced some recent advances resulting in the creation of new machine learning methods to distinguish mangrove species more precisely than previously used methods of classification. Supervised classification algorithms are essential when the need arises to identify and classify labeled data using machine learning algorithms [33,34]. Recent advances in explainable artificial intelligence (XAI) and deep learning have led to the creation of models that accurately capture spatial dependencies among pixels [35,36]. In supervised classification models, machine learning algorithms have found more uses where correct identification and classification of labeled data are required. Algorithms that are used frequently are Support Vector Machine (SVM), decision trees (DT), also known as Classification and Regression Trees (CART), and Random Forest (RF) [1,37]. Such techniques allow the production of very precise thematic maps, with pixels being allocated to predetermined land-cover groups, e.g., forest, urban, or water. Ensemble techniques like Random Forest are particularly robust to training data noise and have shown superior performance in complex coastal landscapes compared to single decision trees [38].
This combination of machine learning algorithms and remote sensing data in mapping mangroves has led to several new publications that have illuminated many of the aspects of the mangrove ecosystem, particularly those with high-dimensional data [16,39]. As examples, research performed in the western Arabian Gulf of Saudi Arabia used change detection based on remote sensing and various machine learning algorithms to measure the changes in the mangroves between 2000 and 2018 [40]. On the same note, ref. [41] pointed out that research on remote sensing and machine learning to analyze mangroves and model their biomass has developed at an astounding rate. In another paper, ref. [42] have used an object-based modeling technique coupled with machine learning algorithms on SPOT images over the period of 2000 to 2011 as a means of tracking changes in mangrove biomass in Vietnam, reporting a significant growth of about 820,136 tons of mangrove forest. These results indicate the usefulness of remote sensing and machine learning in the monitoring of mangrove resilience and growth over time. While this study highlights the usefulness of remote sensing and machine learning in monitoring mangrove resilience, the application of such frameworks to arid regions using 30 m Landsat data remains methodologically distinct.
Although recent studies have demonstrated the value of remote sensing and machine learning for mangrove monitoring in the region (e.g., [43,44,45]), limited attention has been given to arid Red Sea coastal environments where mangroves are spatially fragmented, exposed to high salinity, and influenced by rapid coastal development. These previous studies highlight unresolved challenges regarding classification accuracy and spectral confusion between mangrove canopies and adjacent halophyte vegetation using 30 m resolution data.
To address these monitoring gaps, this study applies a cloud-based Earth observation framework integrating multi-temporal Landsat 7 ETM+ and Landsat 8 OLI imagery within the Google Earth Engine platform to map and quantify mangrove extent in Al-Birk, southwestern Saudi Arabia. Spectral indices sensitive to mangrove canopy structure were combined with Random Forest supervised classification to produce spatially explicit land-cover maps for 2016 and 2021, enabling quantitative assessment of net change in mangrove distribution over a period marked by intensified coastal development pressures. The resulting spatial evidence is intended to support site-specific conservation prioritization and evidence-based restoration planning within the Saudi Green Initiative framework.
2. Materials and Methods
This section describes the sequential analytical workflow that was adopted for mangrove deforestation monitoring using Google Earth Engine (Google LLC, Mountain View, CA, USA) and Random Forest machine learning classification. The methodology combines multi-source satellite information, preprocessing, and spectral attribute extraction for extended accuracy in classification. A supervised RF model is used to create land-cover maps in order to apply multi-temporal change detection and quantify the loss of mangroves. Finally, the classification performance is evaluated through statistical analysis, and the spatial and temporal patterns are interpreted. The methodological workflow began with the construction of a Landsat imagery dataset within GEE covering the period 2016–2021. Images were selected from the summer season to reduce seasonal variability and improve interannual comparability. After preprocessing and cloud masking, the selected imagery was used to derive spectral indices and support supervised machine learning classification for mapping mangrove extent and assessing temporal change. RF was selected because of its robustness in handling multi-dimensional spectral data, its resistance to overfitting, and its strong performance in coastal land-cover mapping [23,46,47].
2.1. Study Area
The mangrove forests of Saudi Arabia are the only ones that have unique habitats, especially along the Red Sea and the Arabian Gulf, where two major species are found, the Avicennia marina (also referred to as gray or white mangrove) and Rhizophora mucronata (red mangrove) [1,48,49,50]. Avicennia marina is renowned for its exceptional tolerance to hypersalinity (>40 ppt) and extreme aridity, often appearing as stunted stands of 2–4 m in height [51,52]. In contrast, Rhizophora mucronata, known locally as Qandal, is rarer and has more complex hydrological requirements, acting as a primary nursery for fish and crustaceans [53]. Global Mangrove Watch reported that the size of mangrove habitat in Saudi Arabia was 77.10 km 2 in 2020, which is a linear coverage of 11.86 of the 7141.54 km of coastline [25]. They have embarked on mangrove conservation and reforestation expansion that will enable the Kingdom to reach its goal of protecting and restoring its natural resources and reducing environmental degradation.
Al-Birk represents an important case for evaluating whether cloud-based Earth observation and supervised machine learning classification can provide a reproducible framework for monitoring mangrove change in Saudi Arabia. Therefore, this study uses multi-temporal Landsat 7 and 8 imagery within Google Earth Engine, combined with spectral indices and Random Forest classification, to quantify mangrove extent, assess temporal change from 2016 to 2021, and provide spatial evidence to support conservation and restoration planning.
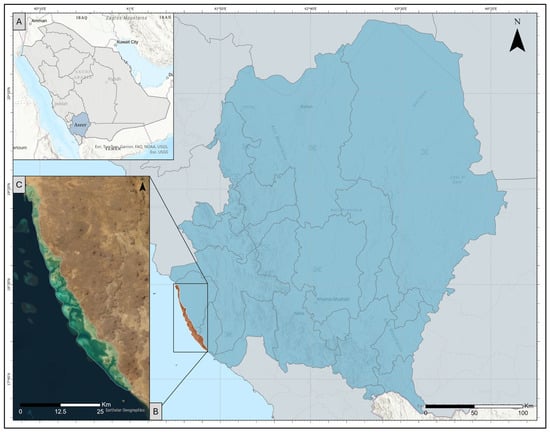
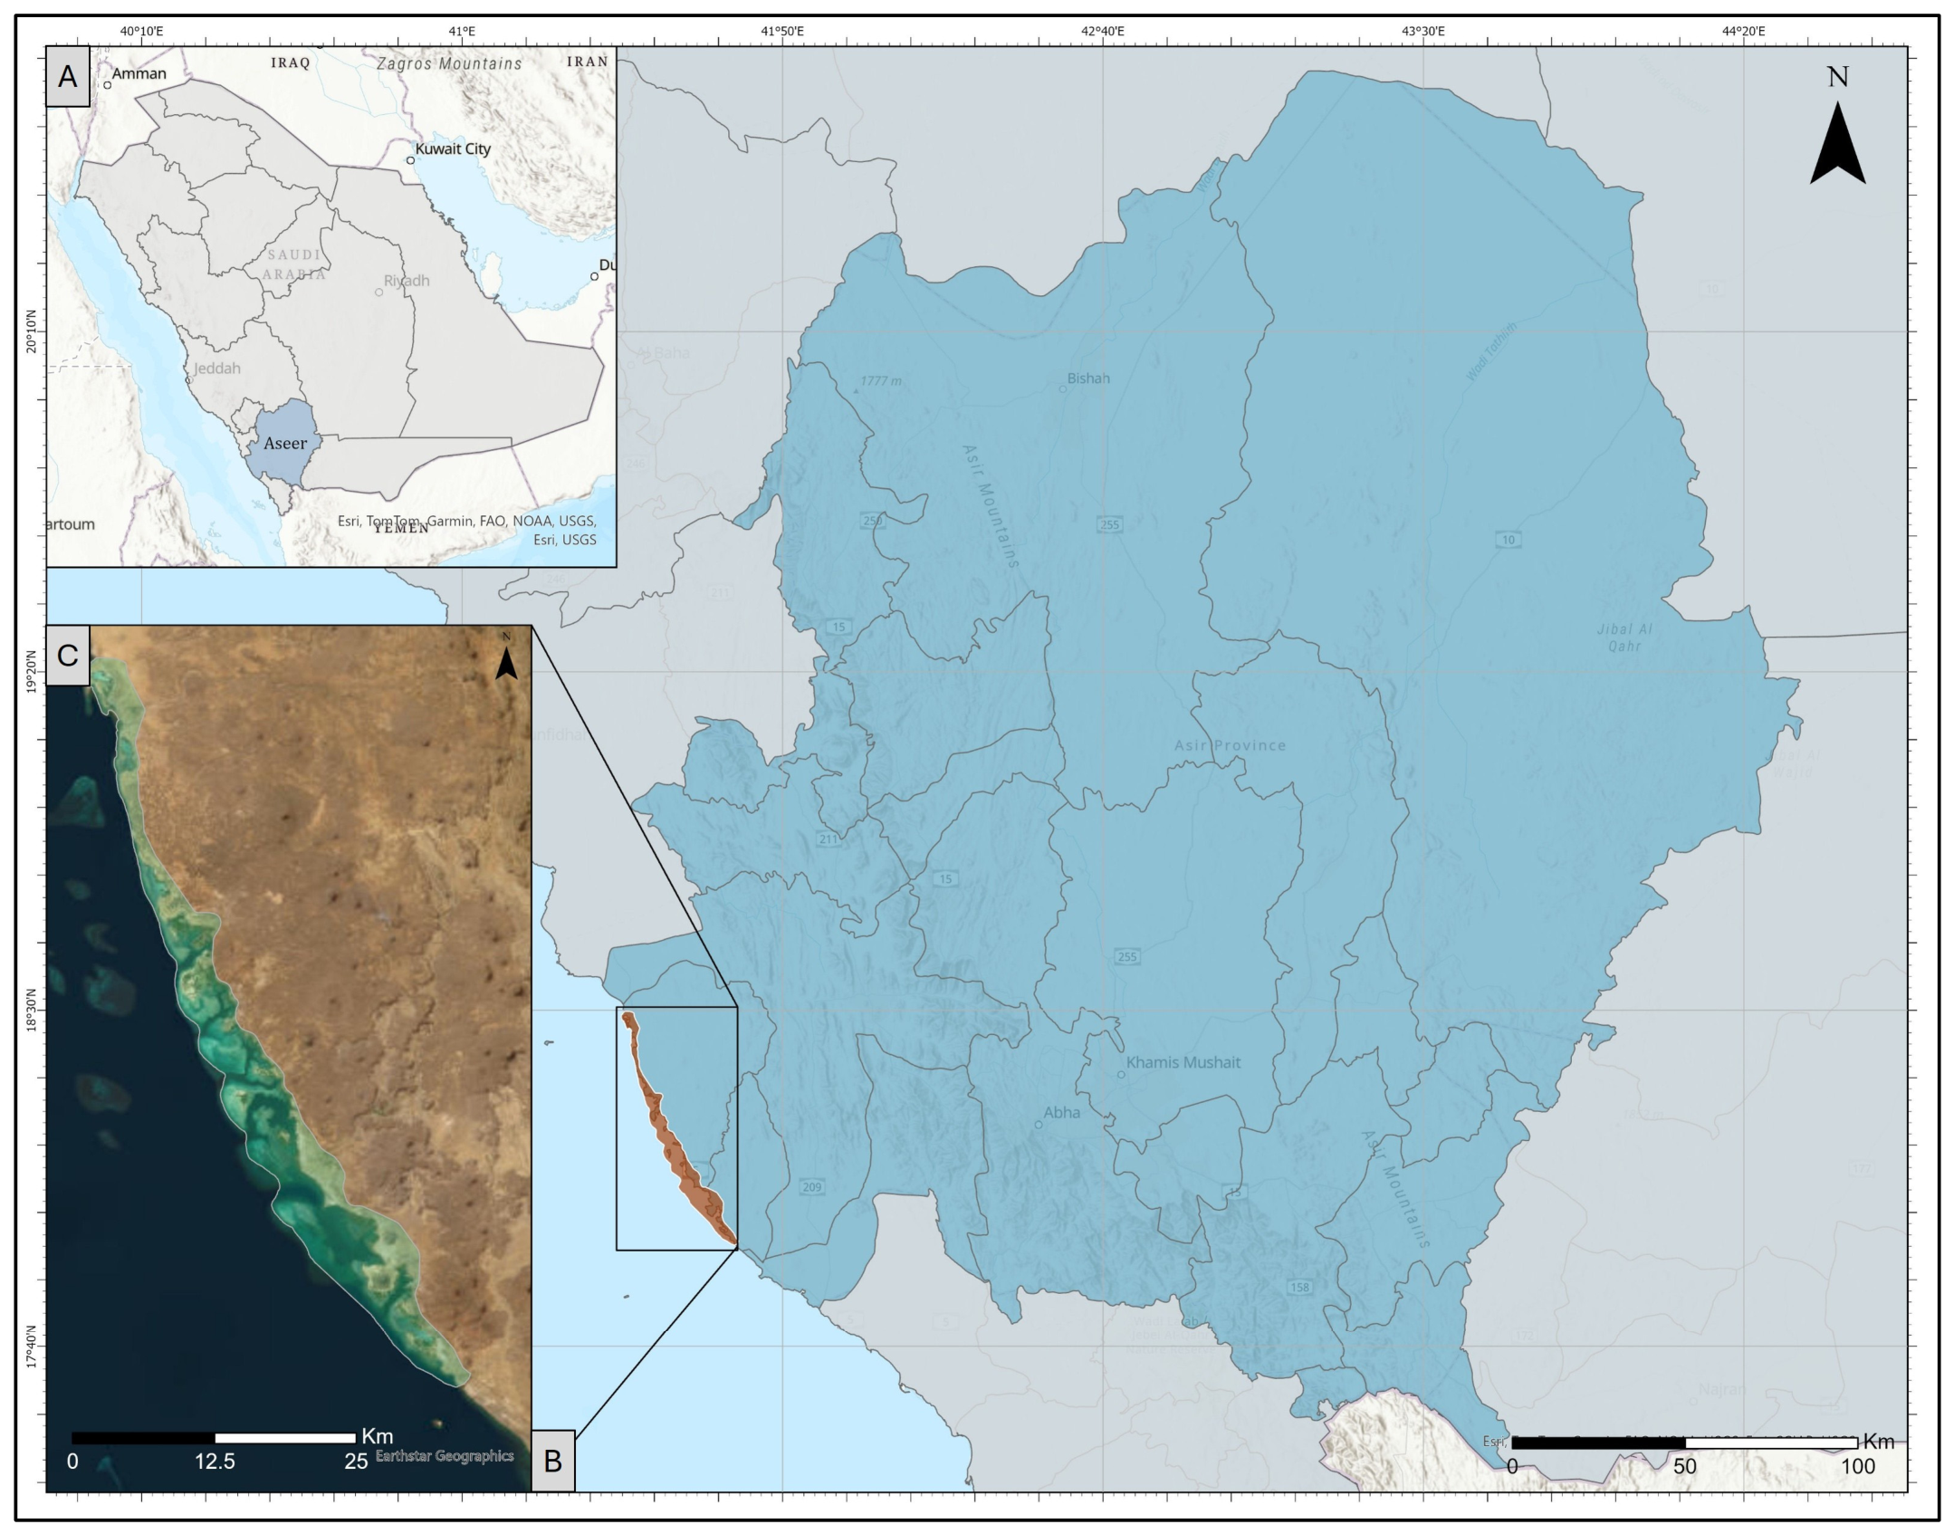
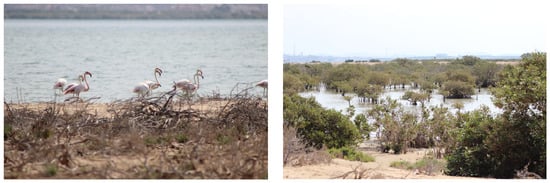
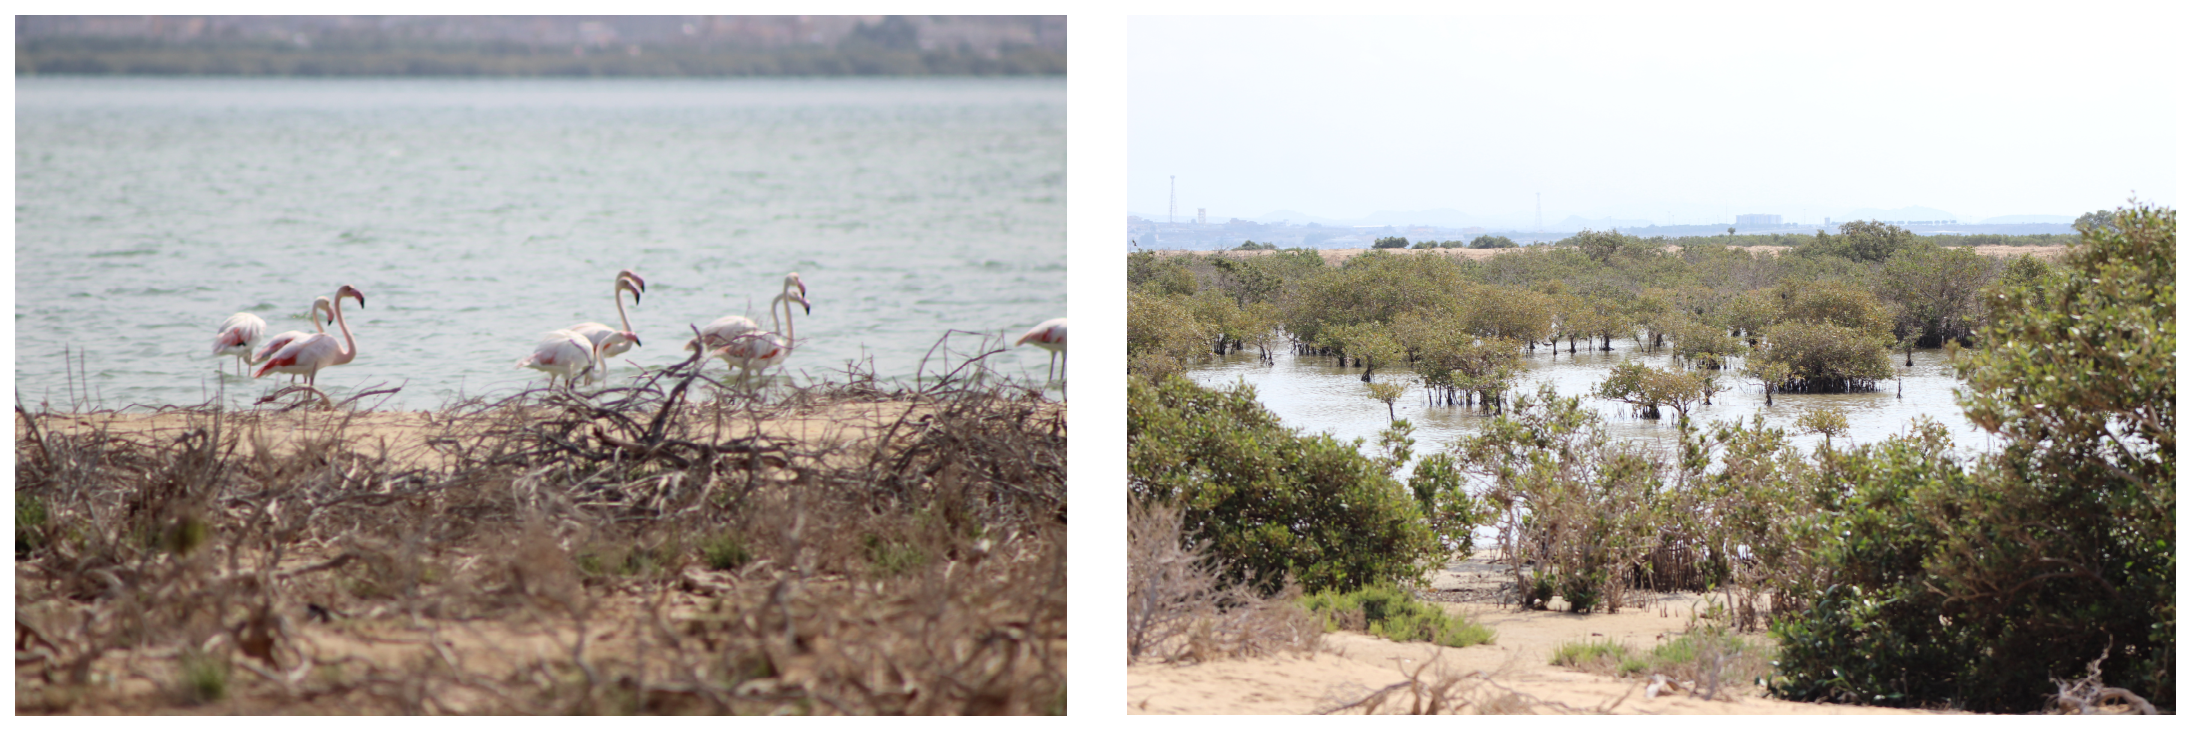
Al-Birk is a southern coastal town in Saudi Arabia and is located on the Red Sea, at 18 N and 41 E, in the Asir region, as indicated in Figure 1. The study area map (Figure 1) shows (A) the Asir region, (B) the governorate context, and (C) the specific Al-Birk study site, characterized by coastal plains and lava fields [25]. The location of the study is some 130 km south of the city of Abha and is home to clean beaches, clear waters, and scenic views. It belongs to a naturally abundant setting that comprises coastal plains, mangrove forests, and coral reefs that support various sea and bird life [54]. The region is dominated by Udipsamment soils that remain wet due to tidal cycles, with surface salinity levels peaking at the interface between land and sea [25]. It is arguably one of the largest mangrove forests in Saudi Arabia, as Al-Birk covers an area of about 50 km2 and is scattered all over the region in various-sized plots, as indicated in Figure 2.
Figure 1.
A map of the study area. (A) Location of the Asir region within Saudi Arabia, (B) the selected governorate/location highlighted in brown within the Asir region; and (C) The study area in Al-Birk. The blue shaded area indicates the Asir region, while the brown shaded area indicates the selected coastal study zone.
Figure 2.
Mangrove habitat in Al-Birk, Saudi Arabia. Credit: Hamza Badawood.
2.2. Data Processing Workflow
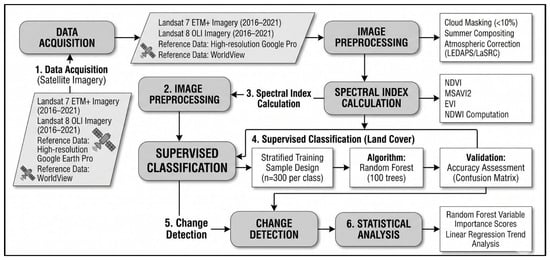
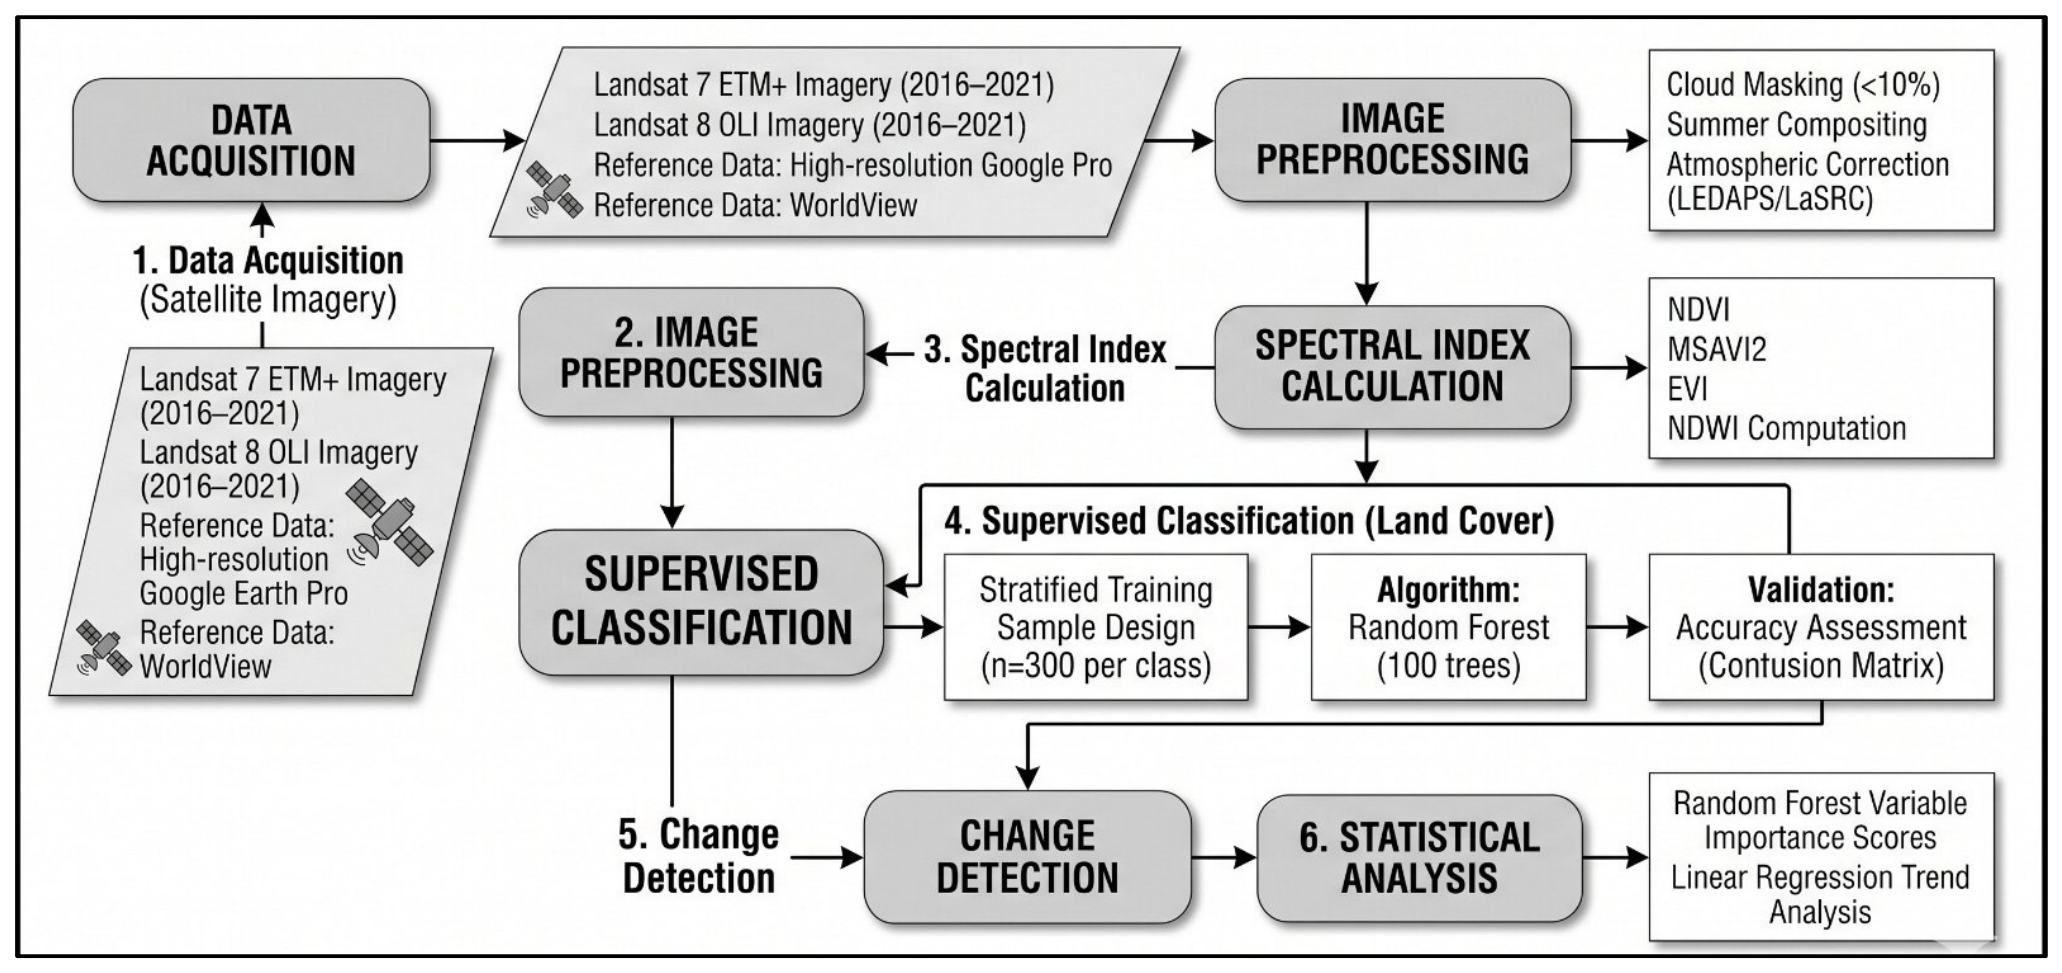
This work applies the Google Earth Engine (GEE) platform to process satellite archives and execute machine learning classifications. The analytical workflow consists of sequential stages: data acquisition, image preprocessing, spectral index calculation, supervised classification, change detection, and statistical analysis (Figure 3). The analyses were conducted using the Earth Engine Code Editor version available in 2025, which corresponded to the last modified release at the time of data processing. Because Earth Engine is a web-based platform that receives continuous updates, the interface and some functions may have changed in later releases.
Figure 3.
Methodology workflow for quantifying mangrove area gain and loss using GEE and ArcGIS Pro environment.
This work applies the Google engine platform Earth Engine Code Editor (web-based IDE), which uses the Google Earth Engine platform to undertake the processing and collection of data. The analyses were conducted using the Earth Engine Code Editor version available in 2025, which corresponded to the last modified release at the time of data processing. Because Earth Engine is a web-based platform that receives continuous updates, the interface and some functions may have changed in later releases. GEE is an application cloud computing engine that utilizes remote sensing data using JavaScript to retrieve, process, and deliver this data. GEE was used to measure the change in mangrove over time and cross the results with high-accuracy images to compute the accuracy of the results, as shown in Figure 3.
2.3. Data Sources
2.3.1. Landsat 7 ETM+ and Landsat 8 OLI Imagery
Remote sensing imagery used in this study was acquired by Landsat 7 ETM+ and 8 OLI/TIRS sensors (Collection 2, Tier 1, Level 2). The 2016–2021 period was selected to align with the intensification of local conservation initiatives and the availability of consistent Landsat 8 surface reflectance observations. The imagery was filtered for summer months (June–August) to minimize seasonal phenological variations, with a cloud cover threshold set to <10% [55]. The analysis used the relevant Landsat spectral bands required for calculating the selected vegetation and water indices [56].
These data are derived from Landsat satellite images of over 1000 scenes acquired at the USGS Earth Resources Observation and Science Center (EROS). A summer acquisition window was selected for the satellite imagery dataset to represent the study area under peak vegetative conditions and to minimize cloud contamination, thereby improving image consistency and supporting subsequent processing. This dataset (LANDSAT/MANGROVE_FORESTS) provided a comprehensive global assessment at 30 m resolution and served as the historical baseline for identifying potential mangrove regions [57].
2.3.2. Reference and Ancillary Datasets
The mangrove dataset used in this study is the USGS Global Mangrove Forest Distribution 2000. The year-2000 baseline was utilized strictly as an initial geographical stratification mask to confine the sampling area to known historical coastal habitats, rather than as a temporal comparative baseline. For accuracy validation, high-spatial-resolution imagery from Google Earth Pro and WorldView was utilized to generate independent reference data.
2.4. Image Preprocessing
For each study year, cloud-filtered summer scenes were composited within GEE to generate annual representative images for subsequent spectral-index calculation and classification. This annual compositing step was used to improve temporal comparability and reduce the influence of residual cloud contamination and short-term seasonal variability. GEE furnished the surface reflectance data. Images were atmospherically corrected; Landsat 7 ETM+ data were processed using the Landsat Ecosystem Disturbance Adaptive Processing System (LEDAPS) algorithm and have a per-pixel saturation mask and a cloud, shadow, water, and snow mask produced with the C Function of mask (CFMASK), while Landsat 8 OLI data utilized the Land Surface Reflectance Code (LaSRC) algorithm [55].
2.5. Spectral Indices
In this research, spectral indices were used to derive surface properties using the Landsat imagery. These specific indices (NDVI, MSAVI2, EVI, and NDWI) were selected for their documented efficacy in arid coastal environments, where MSAVI2 mitigates high soil background reflectance and EVI compensates for atmospheric aerosol interference. All the indices applied in the analysis, with their mathematical expression, definitions of parameters, and references, are summarized in Table 1. Such indices are the basis of the preprocessing and feature-extraction steps mentioned in the methodology. For the Landsat 7 and 8 OLI sensors, NIR corresponds to Band 5, Red to Band 4, and Blue to Band 2 [56,58].
Table 1.
Spectral indices used for mangrove change detection. NIR, Red, Blue, and Green refer to the corresponding Landsat surface reflectance bands used in this study.
The most popular vegetation index (VI) is the Normalized Difference Vegetation Index (NDVI). Since the NDVI is computed by a normalization technique, the index values vary between 0 and 1, with a high sensitivity to green vegetation even in low-density vegetation cover. Consequently, NDVI has found widespread use in vegetation assessment studies locally and globally. In mangrove studies, NDVI values between 0.43 and 1.00 often indicate healthy, bushy vegetation [55]. In this study, NDVI was used primarily as a relative indicator of temporal vegetation change rather than as a stand-alone threshold-based classifier. The interpretation of change was supported by the multi-temporal classification results and the joint behavior of the spectral indices, rather than by a single fixed NDVI threshold.
The Modified Soil Adjusted Vegetation Index 2 (MSAVI2) is mainly used to evaluate the growth of plants and the condition of vegetation. MSAVI2 was developed by Qi et al. (1994) as a recursive refinement of the original MSAVI, replacing the soil-line slope with an inductive function that minimizes background effects in areas with high substrate reflectance [61,64]. It has also found its use in desertification research, grassland yield determination, and LAI measurement. Moreover, MSAVI2 is also commonly used in the analysis of soil organic matter, drought, and soil erosion [56,65].
The Enhanced Vegetation Index (EVI) was created to overcome the problem of soil background and atmospheric impacts [30,66]. Standard coefficients used for EVI in Landsat 7 and 8 areas are shown in Table 1. Following [67], the coefficients applied in the EVI algorithm are L = 1, C1 = 6, C2 = 7.5, and G (gain factor) = 2.5. These specific values were originally adopted for the NASA MODIS-EVI algorithm and are now standard for Landsat 8–9 and Sentinel-2 calculations. The researchers noticed that it might be unintentional that a decrease in the effects of one factor might boost the effects of the other. To address this problem, EVI is fitted with a feedback mechanism by incorporating an extra parameter that is used to correct both the soil and atmospheric influence [68].
The Normalized Difference Water Index (NDWI) is an inexpensive spectral index that is intended to improve the appearance of open water in multispectral satellite images [39]. It is primarily applied to detect water bodies and differentiate water and non-water surfaces. Moreover, NDWI minimizes the errors of confusion with developed or green lands, increasing the effectiveness of classification [1].
2.6. Supervised Classification
2.6.1. Training Sample Design
Training samples (n = 300 pixels per class) were selected through stratified random sampling, utilizing high-resolution Google Earth Pro imagery and the 2000 USGS baseline for validation [40]. These findings were correlated with the Normalized Difference Water Index (NDWI) to gain insight into the relationship between changes in moisture levels over the years and the growth and health of mangrove forests. To evaluate the statistical significance of the observed trends reported in the results, Pearson’s correlation coefficient Dwas used to assess the relationship between spectral indices and classified mangrove areas.
2.6.2. Random Forest Algorithm and Parameterization
To map the mangrove stands, this study utilized the Random Forest (RF) machine learning algorithm implemented within the GEE platform. Random Forest is a robust ensemble learning method that constructs a multitude of decision trees during the training phase and outputs the mode of the classes for classification tasks [47]. Unlike single decision trees, RF mitigates the risk of overfitting by aggregating multiple independent trees, making it highly effective for complex, multi-dimensional remote sensing data such as coastal land-cover mapping [25]. The RF classifier was parameterized with standard configurations: the number of trees was set to 100, and variables per split were based on the square root of the input features.
For this analysis, the RF classifier was parameterized with standard configurations optimized for Landsat 7–8 imagery: the number of trees (numberOfTrees) was set to 100 to balance computational efficiency with model stability, and the variables per split were based on the square root of the number of input features. The maximum tree depth was left unconstrained, and out-of-bag (OOB) error was utilized to evaluate variable importance internally. Feature selection relied on the combination of multi-temporal spectral indices and surface reflectance bands extracted during preprocessing. The stratified training samples (n = 300 pixels per class) were then used to train the RF model, partitioning the feature space into the defined target categories.
2.6.3. Accuracy Assessment
To evaluate classification performance, an independent validation dataset (n = 200 pixels) was used to calculate producer’s accuracy, user’s accuracy, overall accuracy, and the Kappa coefficient for the 2021 land-cover map. In addition, model performance was assessed through a randomized hold-out validation procedure, in which two-thirds of the samples were used for training and one-third for validation. This approach provides an estimate of classification reliability and generalizability while reducing the likelihood of overfitting [37,67,69,70].
2.7. Change Detection
Change detection analysis was conducted to measure the spatial and temporal changes in vegetation conditions, mapping area gain and loss between 2016 and 2021.
2.8. Statistical Analysis
Rather than relying solely on inter-index correlation matrices—which exhibit mathematically predetermined collinearity due to shared spectral input bands—variable importance scores produced internally by the Random Forest model were extracted. This approach objectively quantifies the relative contribution of each spectral index and band to the classification performance. Simple linear regression trend analysis was applied to determine the statistical significance of the spatial expansion over time.
3. Results
The study findings illustrate the time change and the spatial patterns that are found among the acquired spectral indices and classification outputs. The temporal pattern of each of the indices is first explored, with a correlation being analyzed to explore the association between the indices. The spatial properties are then given in terms of classification maps and annual distribution summary, and later, the findings of the change detection analysis show which of these land-cover changes have been the most significant during the study period. These findings provide an exhaustive perspective of the dynamics of the surface within the area of investigation.
3.1. Temporal Trends of Spectral Indices
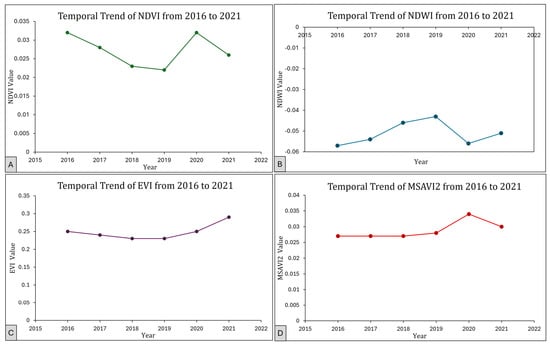
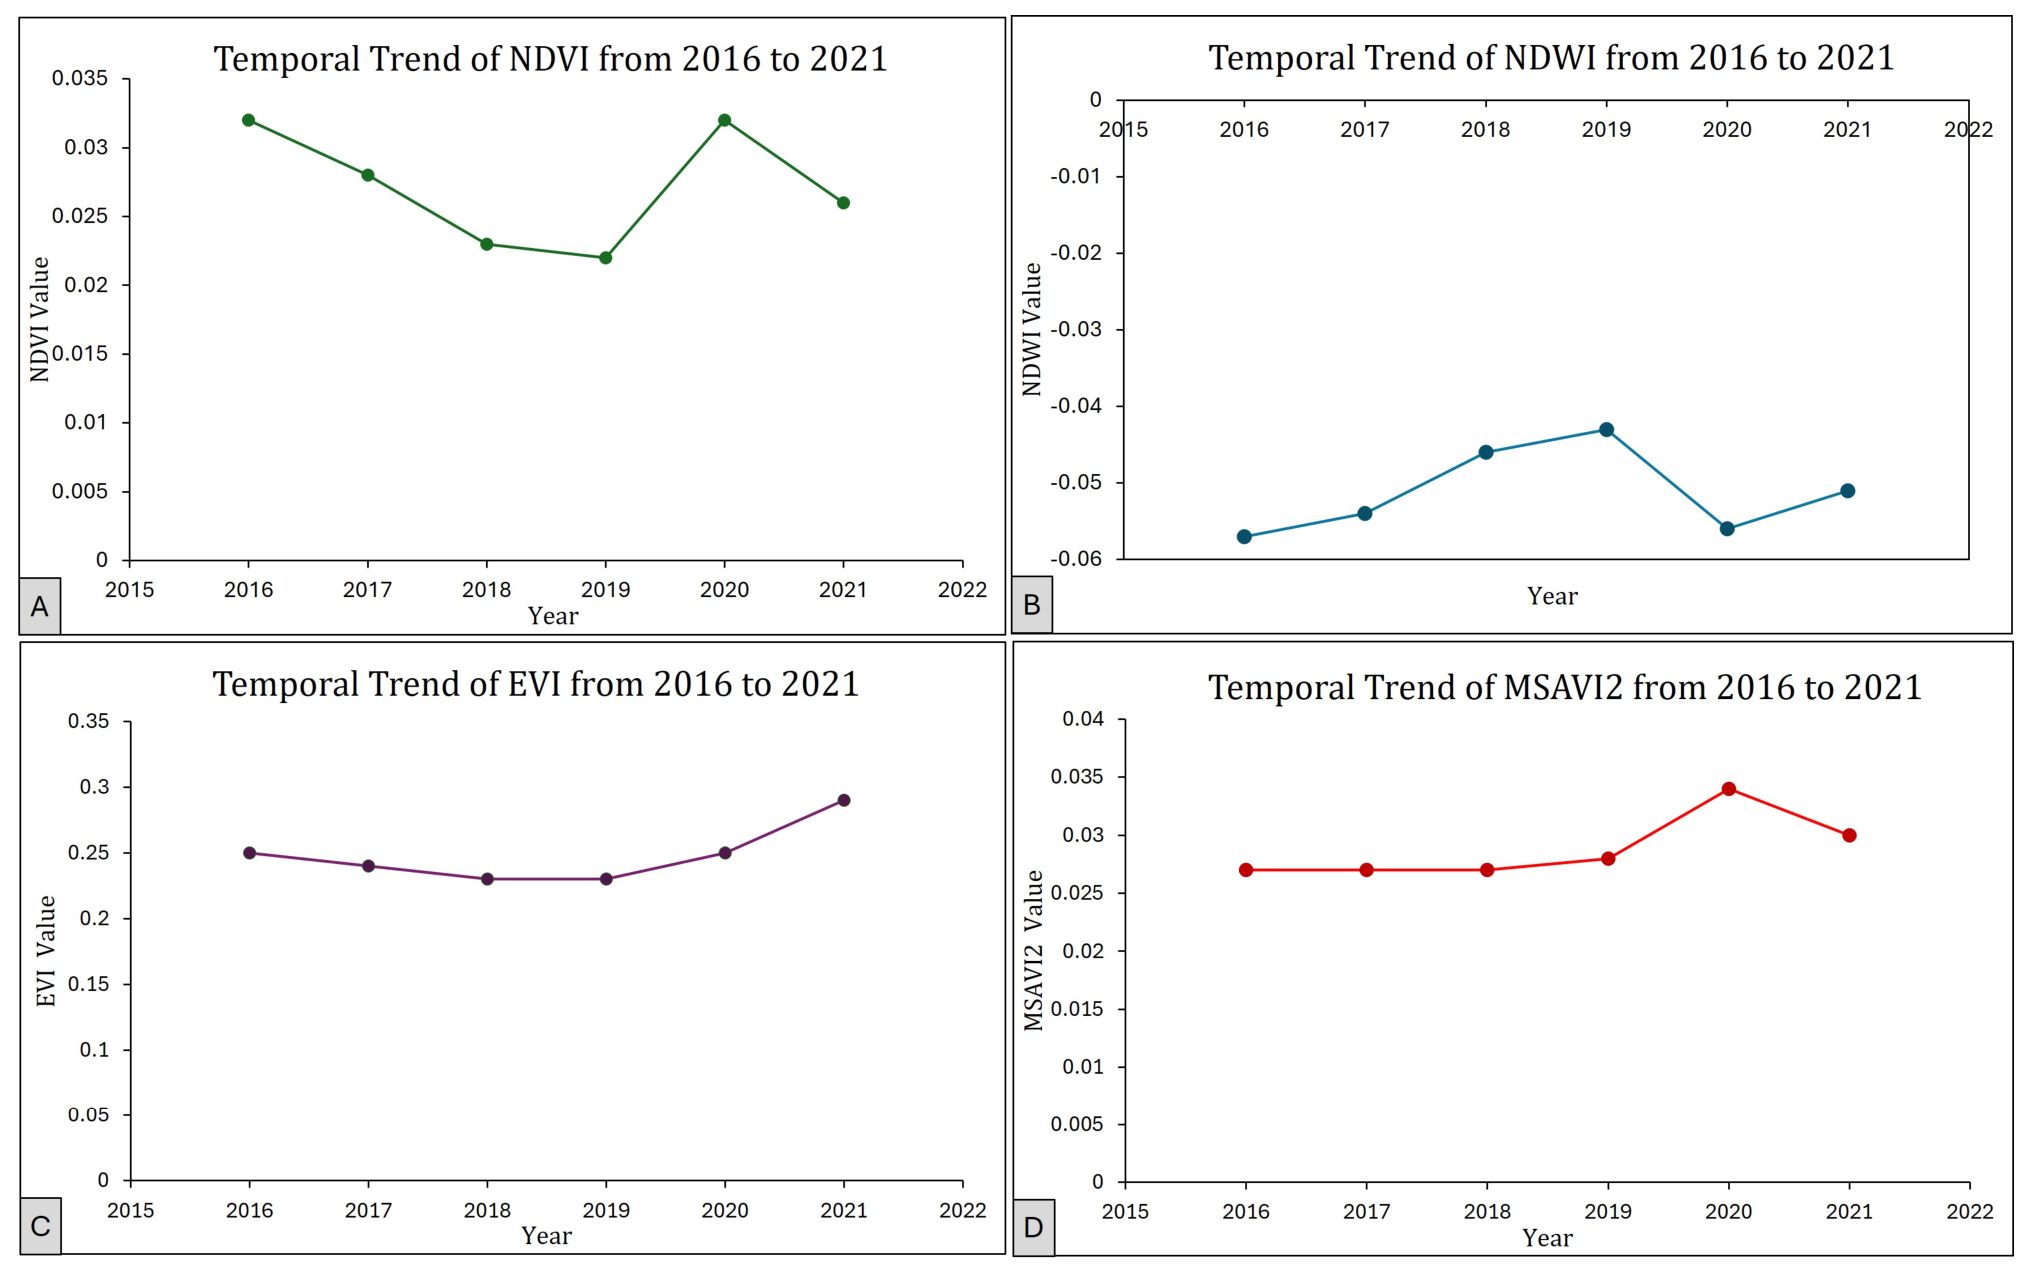
To evaluate long-term surface patterns, the temporal patterns of the four selected spectral indices—NDVI (Normalized Difference Vegetation Index), NDWI (Normalized Difference Water Index), EVI (Enhanced Vegetation Index), and MSAVI2 (Modified Soil-Adjusted Vegetation Index 2)—were analyzed. All these indices reflect the greenness of vegetation, the structure of the canopies, the availability of moisture, and the interactions between soil and vegetation. The trend of every spectral index with time is represented in Figure 4. The values presented represent the mean index values across the classified mangrove pixels.
Figure 4.
Temporal trends of spectral indices for mangrove health and area change assessment. Panels show the annual variation of (A) NDVI, (B) NDWI, (C) EVI, and (D) MSAVI2 from 2016 to 2021.
The temporal profiles of the indices demonstrate varied dynamic patterns. NDVI demonstrates a decrease in the first 3 years, then a significant recovery with a minor decrease toward the end of the investigation period, which is related to the changes in vegetation vigor. NDWI (B) presents significant interannual variation, which identifies the changes in moisture states across the study period. EVI (C) illustrates a positive trend that is constant over time with oscillations of seasons, which are described as a phenological cycle. MSAVI2 (D) is relatively constant, and there are moderate variations that indicate variation in the vegetation density and soil background effects.
3.2. Feature Importance for Classification
To objectively evaluate the discriminative value of the spectral features used in the Random Forest model, variable importance scores (Mean Decrease in Impurity) were extracted from the GEE environment. The analysis demonstrated that MSAVI2 and NDVI provided the highest relative contributions to the classification accuracy. Because MSAVI2 effectively suppresses the high background reflectance of the arid sandy soils characteristic of the Al-Birk coast, its high variable importance score empirically justifies its inclusion in distinguishing mangrove canopies from adjacent halophyte vegetation and bare soil. NDWI also maintained a high importance score for effectively delineating the intertidal boundary.
3.3. Spatial Distribution of Classes
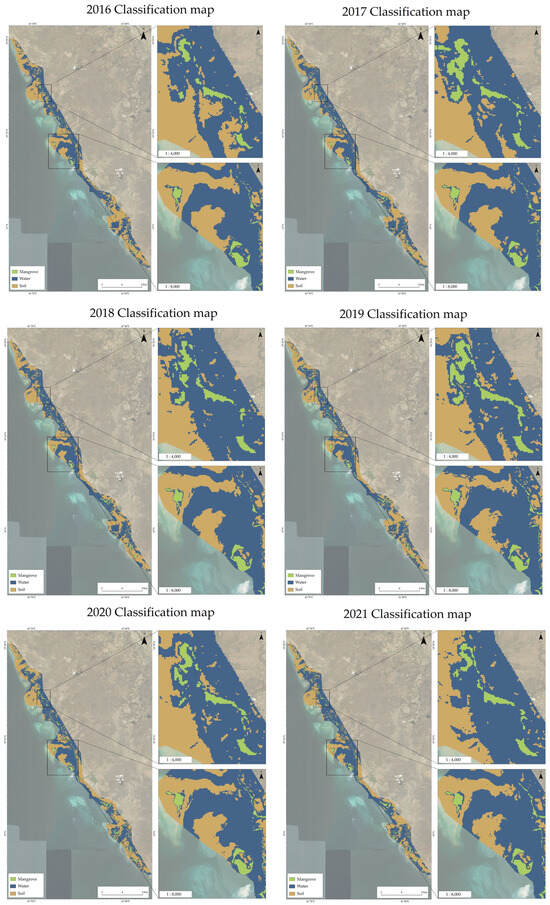
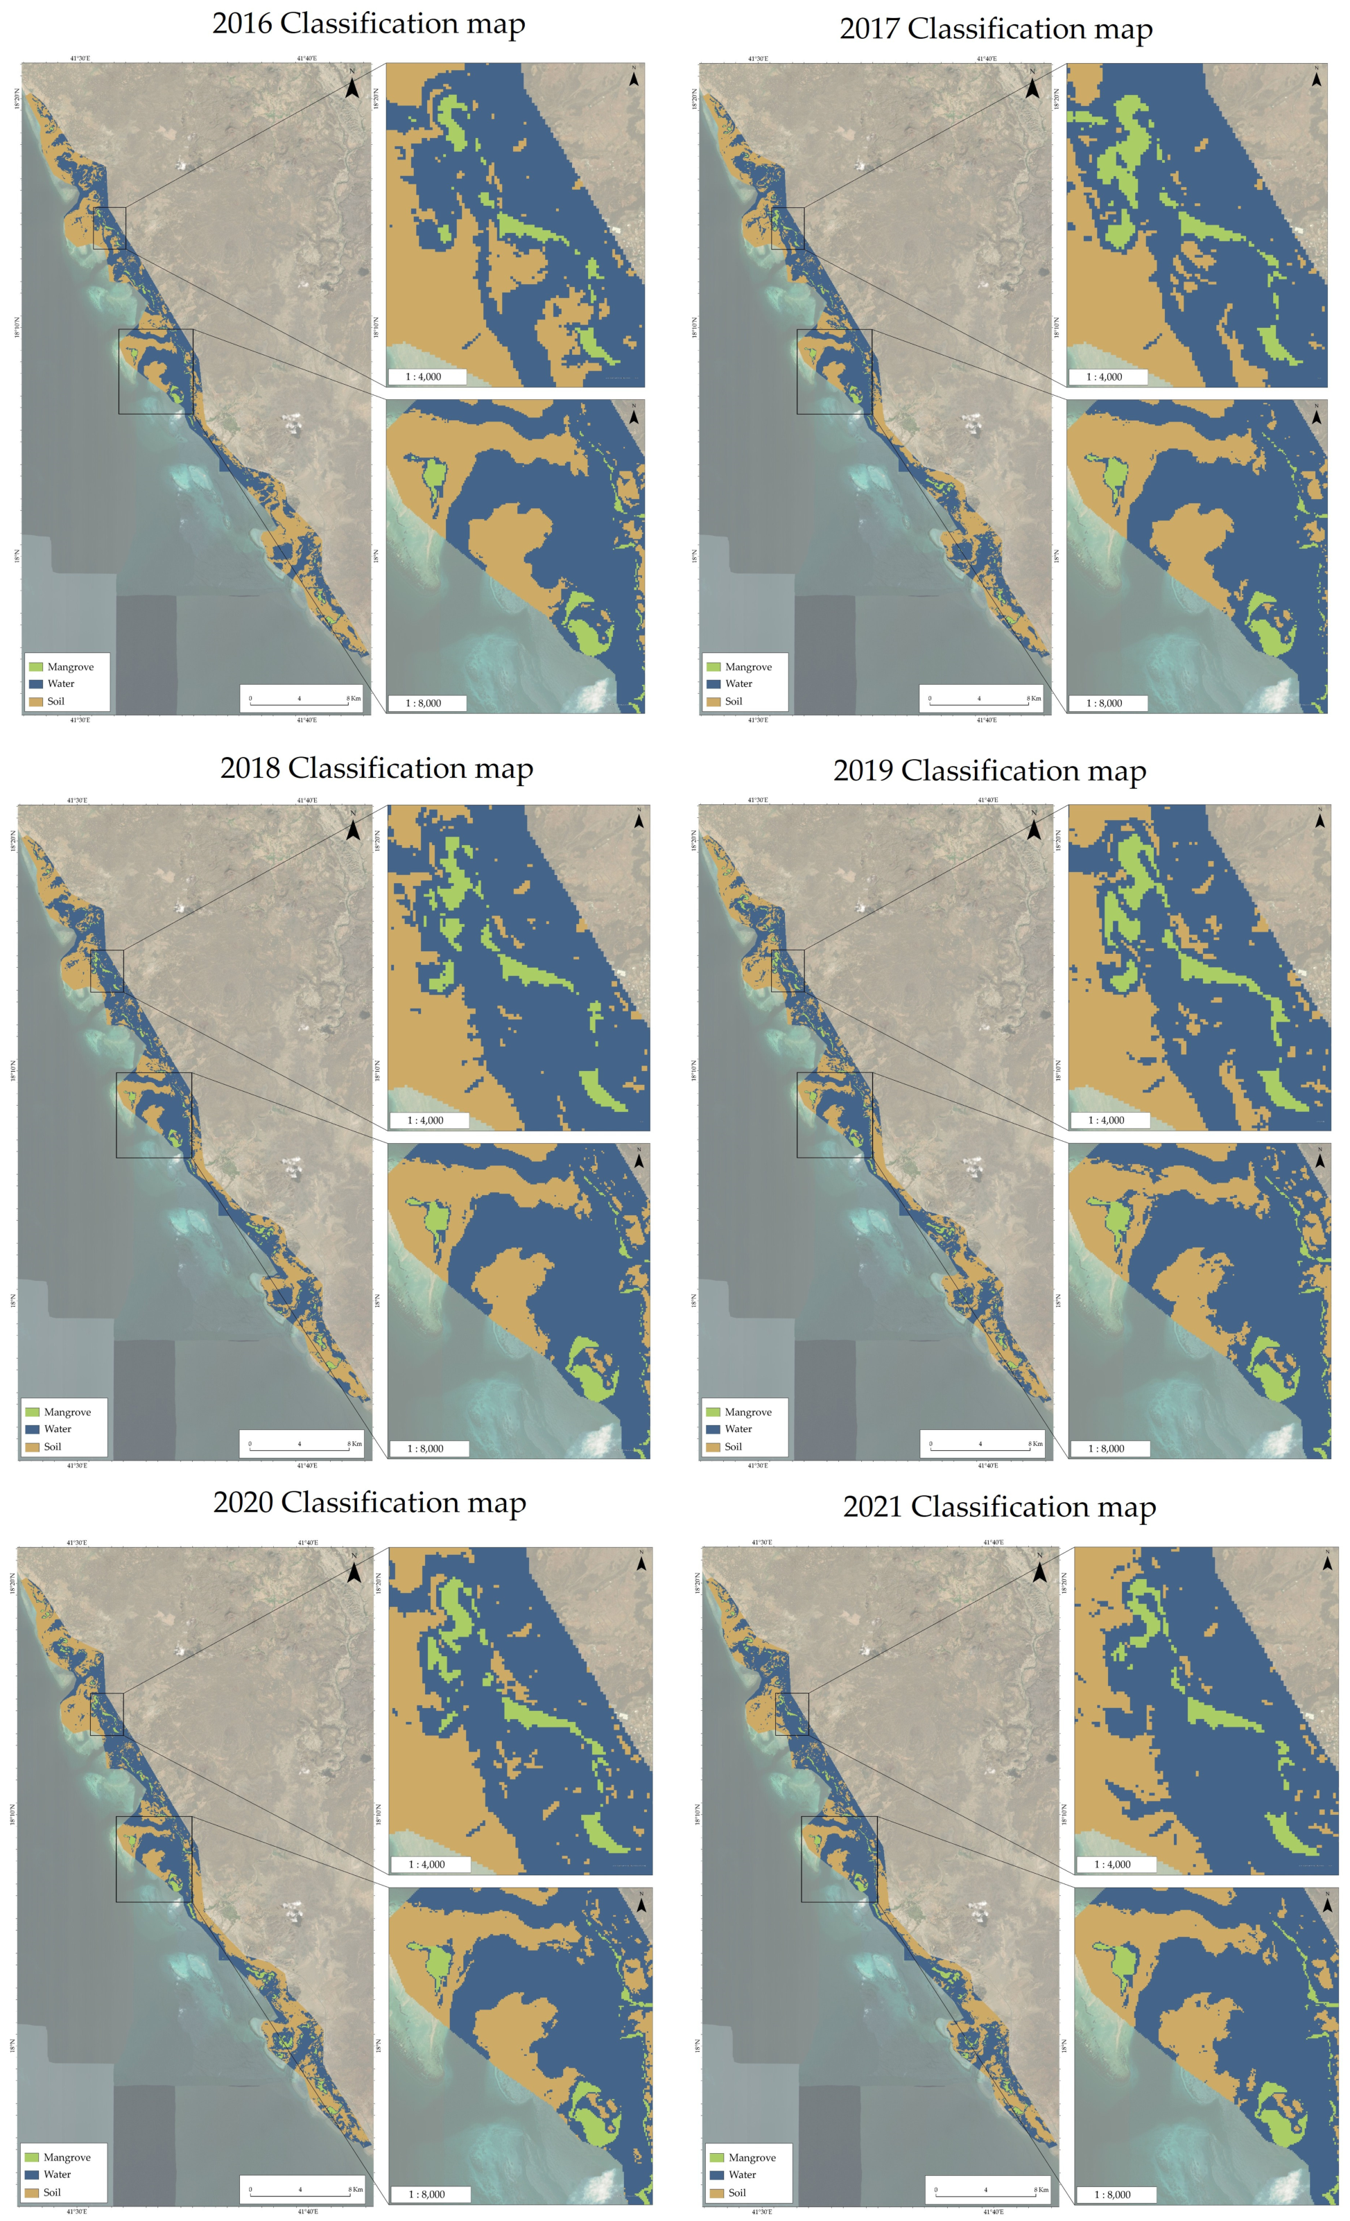
A supervised classification was performed to assess the spatial distribution in the study area by using the spectral indices derived from multispectral imagery. The classification scheme included three major categories of land cover: mangrove and vegetated coastal area, soil (i.e., bare ground and non-vegetated surface), and water (i.e., water bodies and saturated surfaces). The reason behind the selection of this scheme is to highlight the major ecological and physical features relevant to the aims of the study, particularly the distribution of mangrove habitats and the related ecological environment. In Figure 5, the classification maps of the study area are presented in each year (2016–2021).
Figure 5.
Multi-temporal classification maps of the study area from 2016 to 2021 depicting mangrove extent and land-cover changes.
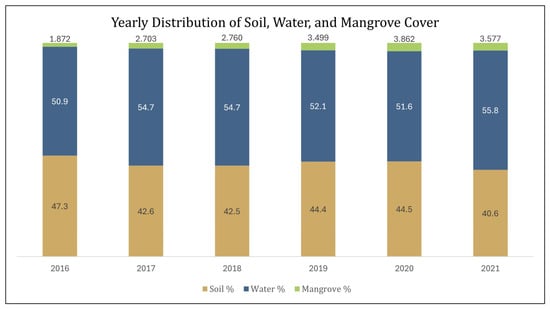
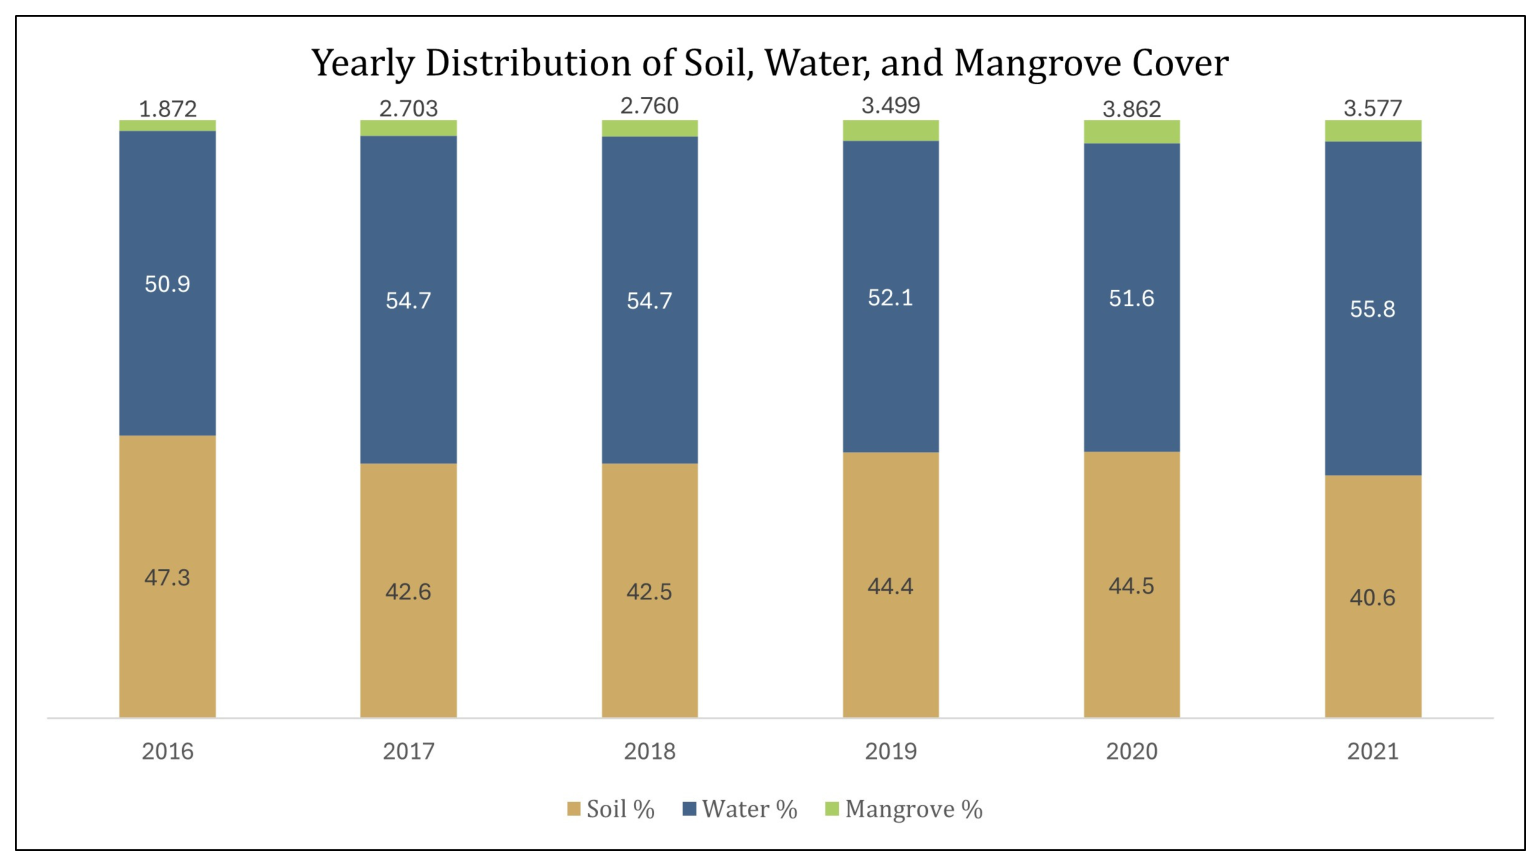
The annual classification outputs show clear changes in the mapped land-cover classes between 2016 and 2021. Classified mangrove extent increased from approximately 1069 ha in 2016 to 1540 ha in 2021, representing a net gain of 471 ha and a 44% increase over the study period. This increase was derived from the supervised Random Forest classification outputs rather than from spectral-index values alone. Figure 5 presents the multi-temporal classification maps, while Figure 6 summarizes the annual area estimates for mangrove, soil, and water classes.
Figure 6.
Yearly distribution of soil, water, and mangrove cover (area in hectares).
The annual area estimates confirm a net increase in classified mangrove cover during the study period. Mangrove extent increased by approximately 471 ha between 2016 and 2021. Expressed relative to the 2016 baseline, this corresponds to a 44% increase over five years, equivalent to an average annual increase of approximately 94 ha yr−1. Soil-covered areas decreased over the same period, while the water class showed moderate interannual variation. Because statistical significance was evaluated separately using correlation and linear trend analyses, the area-distribution results are reported here as classified area estimates rather than as inferential statistical tests.
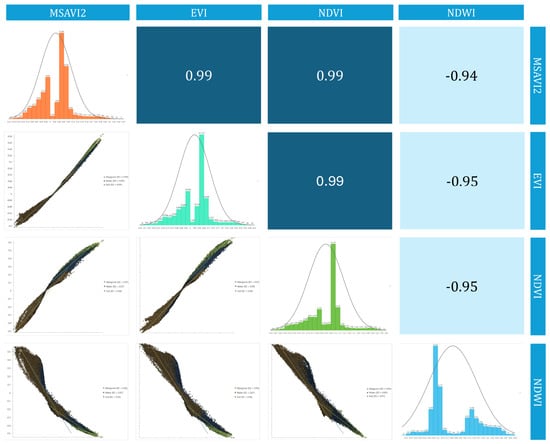
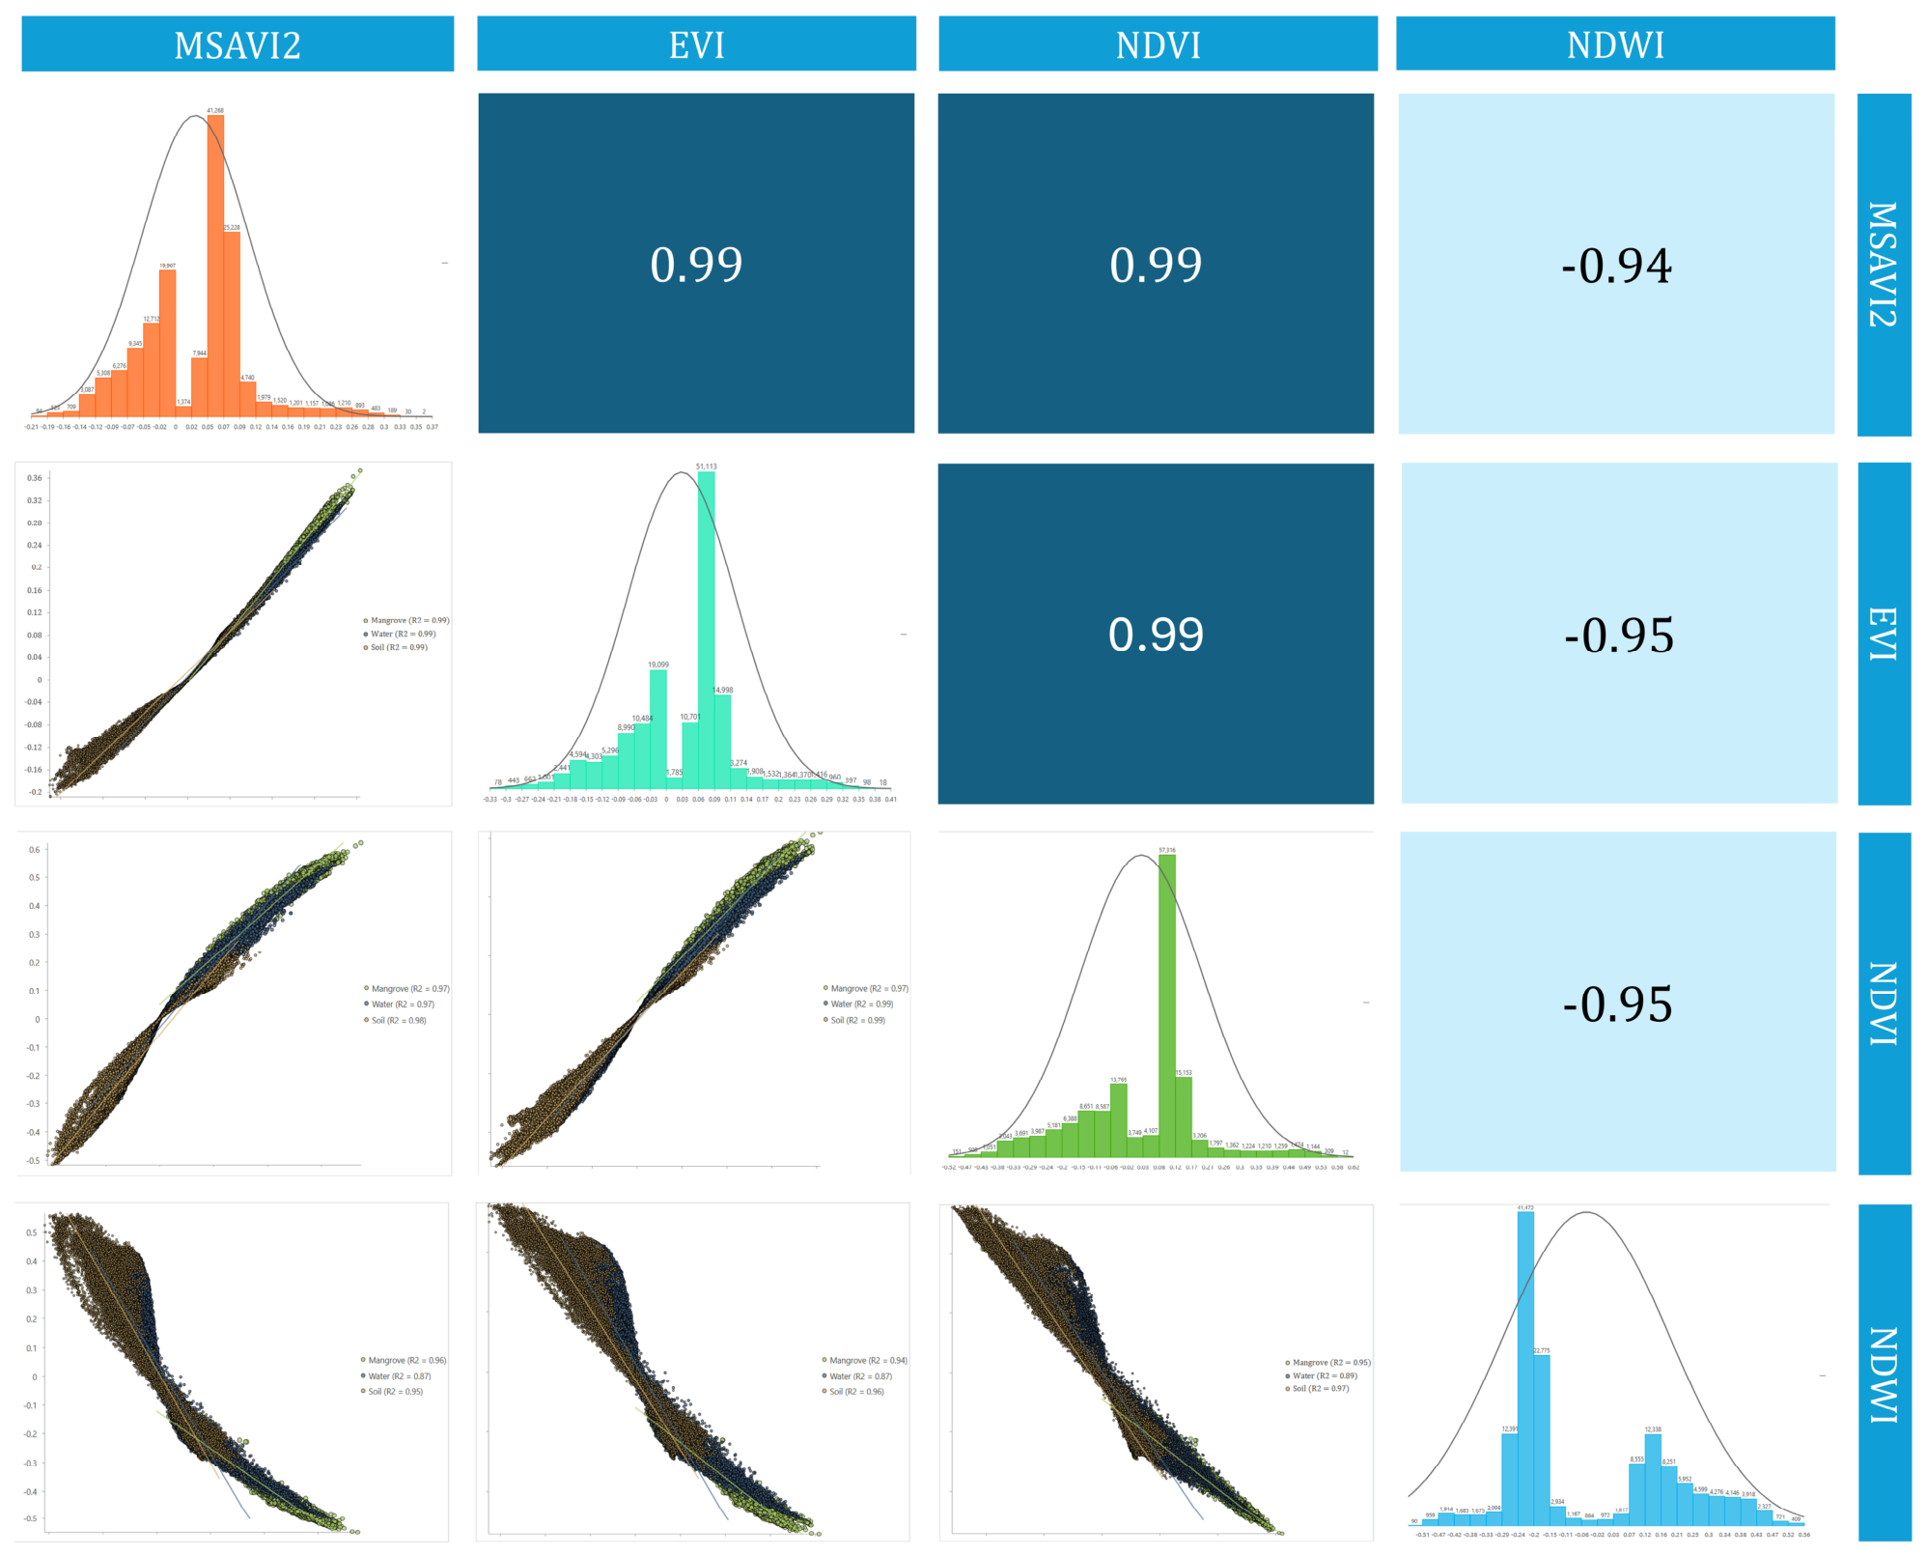
To investigate the relationships between spectral indices, a Pearson correlation matrix was created (Figure 7). This matrix provides a standardized statistical measure of the linear strength and direction of association between each pair of variables. The Pearson correlation coefficient, denoted as r, ranges from −1 to 1, where a value of 1 represents a perfect positive correlation (as one variable increases, the other increases), −1 indicates a perfect negative or inverse correlation (as one variable increases, the other decreases), and 0 suggests no linear relationship. There is a strong positive correlation between NDVI and EVI (r = 0.99), which can be attributed to the fact that both are equally sensitive to vegetation greenness and canopy structure. MSAVI2 is also positively correlated with NDVI (r = 0.99) and EVI (r = 0.99), which means that the vegetation dynamics after adjusting to the soil follow the general vegetation patterns. Conversely, NDWI shows negative relationships with the vegetation indices (NDVI: r = −0.95; EVI: r = −0.95), which show the inverse relationship between surface moisture and vegetation density at the research location. These correlation signals prove that the indices reflect complementary factors of surface conditions.
Figure 7.
Pearson correlation matrix illustrating the relationships among the spectral indices (MSAVI2, EVI, NDVI, and NDWI). Positive correlations are observed among vegetation-related indices, whereas NDWI shows negative correlations with NDVI and EVI. The strongest positive relationship observed in the analysis was r = 0.99 (p < 0.001).
3.4. Change Detection Mapping
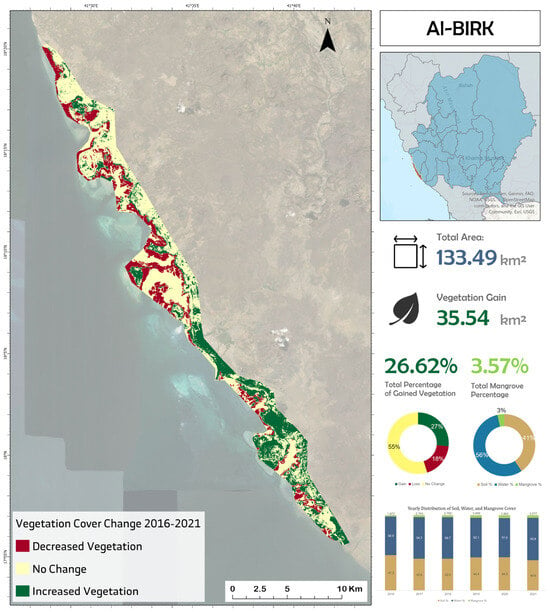
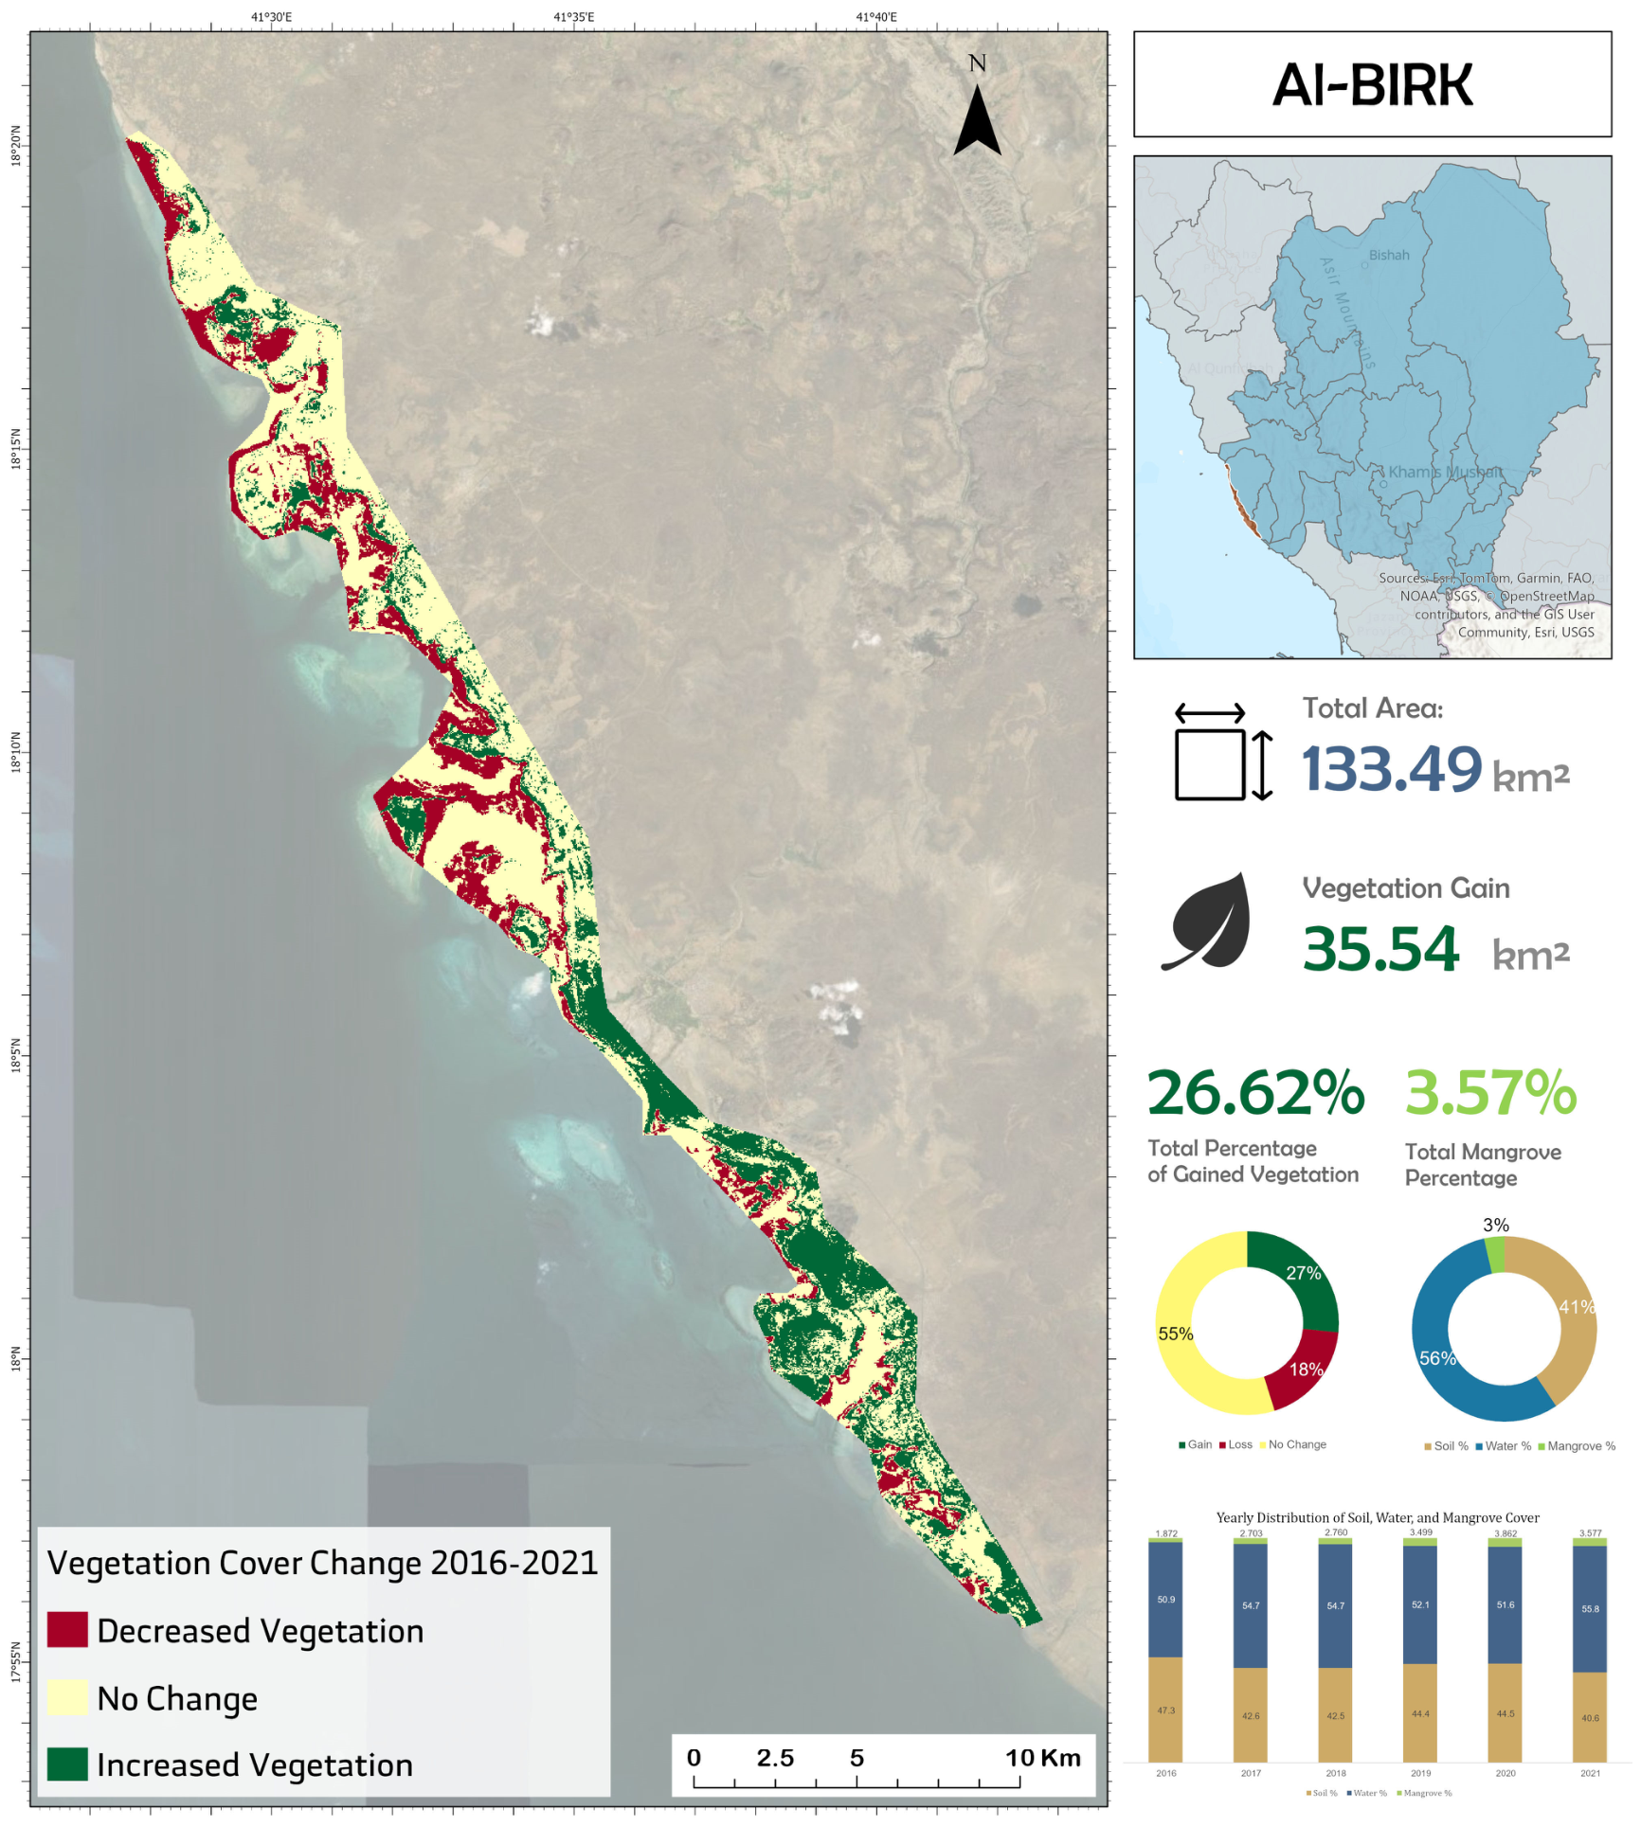
Change detection analysis was performed based on NDVI to measure the spatial and temporal changes in vegetation conditions within the study area. The results of the NDVI-based change detection, illustrated in Figure 8, prove that the spatial distributions of vegetation growth and decline can be observed in the entire study area. The exceptionally high intensification of NDVI is concentrated in the southern part, which reflects a significant increase in vegetation vitality and growth throughout the time interval of the research. Conversely, the lower parts show the highest decrease in NDVI, which shows localized loss of vegetation or the loss of its greenness. Areas that have been labeled undisturbed are mainly found in the northern and central areas, and this shows that there are constant vegetation conditions in these areas. These changes depict a clear geographical gradient in the vegetation processes, with massive accumulations in the south and losses in the north.
Figure 8.
Change detection map showing the prosperity in mangrove land cover and decline from 2015 to 2021.
Such spatial distributions of NDVI change are in line with the temporal patterns and annual distribution outcomes. The high vegetation cover observed in the southern area seems to match the overall increment of the mangrove cover between the years 2016 and 2021, and the recovery of the high vegetation indices after their downward trend. In line with this, the decrease in the NDVI in the north was accompanied by times when vegetation indices were lower, and soil proportions were also rather high. The stability of the middle and northern area is also reflected in the relatively stable areas of mangrove cover; a progressive decrease in the size of soil areas also occurred over the period of the study. Taken together, the NDVI-based change map is consistent with the classified area estimates and helps identify where vegetation gains and localized declines occurred within the study area.
Thus, the results show a clear pattern in the temporal trends, correlation results, spatial classifications, and change detection results, which show continuous improvement with time, with strong correlation among the measures of vegetation and the steady expansion of mangrove areas observed throughout the classification maps. Coverage of water increases over the course of the study, but the coverage of soil decreases, meaning that changes in the surface conditions are broader. The increase in vegetation is mainly found in the southern part of the study area, and the losses are greater in the northern region, which is in accordance with the temporal distributions of the spectral indices and annual distribution trends. The net effect of these results is that there are regions of the landscape that are slowly increasing in ecological richness, and others are experiencing local declines. These spatial patterns indicate that the mangrove change in Al-Birk was not uniform, with expansion concentrated in selected zones and localized decline occurring elsewhere.
3.5. Accuracy Assessment
To evaluate the classification performance of mangrove monitoring, an independent validation dataset was used to generate a confusion matrix. The quantitative metrics reported include producer’s accuracy, user’s accuracy, overall accuracy, and the Kappa coefficient, as shown in Table 2 and Figure 7.
Table 2.
Classification accuracy metrics for 2021 land-cover map.
4. Discussion
The observed expansion may be associated with several interacting ecological and management-related factors, including natural recruitment, tidal stability, local protection measures, and restoration activities. However, the available remote-sensing data do not allow these drivers to be isolated or quantified independently.
4.1. Interpretation and Mechanisms
The 44% increase in Al-Birk indicates that the environmental factors in the region and the maintenance of the mangrove have reached synergistic levels that are conducive to the growth of the mangroves. Mangroves on the Red Sea coast, which is arid and hypersaline, are under great physiological pressure. In extreme environments, high salinity (>40 ppt) often induces ion toxicity and disrupts osmotic balance [10,30,55]. The rationale of this expansion can be described by a number of biophysiological and social processes. Recent studies highlight that balanced NPK fertilization can boost A. marina biomass by 35–60%, potentially explaining the high growth observed in managed clusters [52].
The growth seems to be biologically instigated by the intrinsic strength of Avicennia marina, which has been observed to be salinity-tolerant and can grow in low-nutrition substrates [69,70]. The fact that MSAVI2 is moving in the positive direction is especially informative. In semi-arid areas in Saudi Arabia, coastal sandy soils are usually very bright and reflective, thus distorting the normal vegetation indices such as NDVI. The spectral noise of the desert shoreline is specifically compensated by MSAVI2, and the consistent increase indicates that the new growth is strong enough to overcome it. This aligns with findings by [20,71,72], who emphasized the sensitivity of VIs to substrate brightness in hyper-arid environments. The high correlation (0.9) implies that as the horizontal area was becoming larger, the vertical complexity and the leaf area index of the forest were also improving, which indicated a maturing ecosystem and not a mere sparse distribution of young saplings.
In the physical sense, the distinctive tidal activities of the Red Sea and the rather secure lagoons of the Al-Birk area offer a perfect nurturing habitat. The success of the propagules in the intertidal zone during the period of the study may have been due to the stability of the same. Tidal cycles act as a vital hydrological recharge mechanism for these coastal forests [73]. Nonetheless, this minor decline in the period between 2020 and 2021 warrants more attention. This reduction could be a reaction to local environmental stresses, e.g., periodic surges of sea-level rise or water salinity that temporarily pushed the physiological threshold of younger trees above that threshold. Cumulative rainfall variations drive mangrove phenology, with decreased precipitation reducing net primary production [74].
The observed mangrove expansion is temporally consistent with ongoing restoration and greening initiatives in Saudi Arabia, including national programs such as the Saudi Green Initiative and related coastal rehabilitation efforts [14]. These programs provide an important policy context for interpreting the positive trend identified in Al-Birk. However, the present remote-sensing framework does not establish a direct causal relationship between these initiatives and the detected spatial expansion. Therefore, such programs are discussed here as plausible contributing factors rather than confirmed drivers. In addition to policy support, local protection measures and favorable environmental conditions may also have contributed to seedling establishment, survival, and gradual canopy expansion over the study period [14].
4.2. Comparison to the Existing Literature
The results of this work make a strong contribution to the world and regional conversation of mangrove dynamics that often stands against the narrative of global degradation of mangroves. Most areas of the globe are recording catastrophic losses on account of aquaculture and urbanization, but the Al-Birk area exhibits an opposite trend of healthy recuperation. Contrastingly, Red Sea mangroves have exhibited decadal stability, with a slight increase of 0.29% annually between 1972 and 2013 [10]. As an illustration, ref. [27] carried out a 35-year investigation of the Sundarbans, the largest mangrove forest in the world, and indicated that the material was shrinking by an average of 1.42 percent, despite the high conservation efforts. The 44% growth that we recorded in seven years points to a far faster growth rate in the Red Sea than the relative stability or contraction in South Asia. This variation is probably explained by the fact that the Sundarbans are experiencing very strong pressure due to the increase in sea levels and anthropogenic encroachment, whereas in the Al-Birk region, the forces of change may already be positive because of the active restoration and a decreased concentration of coastal aquaculture.
The success of the Random Forest algorithm on the GEE platform is an established pattern in recent literature. A comparable framework was used by [39] when mapping the Hara protected area in Iran, with an overall accuracy of 93.23. Their results are supported by our research, and they may indicate that RF is the most suitable tool for working with mangroves due to its ability to work with multi-dimensional spectral data. GEE-based tools like MANGLEE have successfully tracked over 2900 hectares of mangrove change, highlighting the platform’s potential [75]. References [1,34] also observed that machine learning methods, i.e., pixel-based classifications, offer a high level of reliability to track deforestation in the areas where ground-truth information may be challenging to collect regularly.
Nevertheless, object-based and pixel-based classification is a subject of scholarly discussion. As [76] compared the two methods, object-based classification yielded a higher degree of accuracy (83.6 percent) than pixel-based approaches (78.1 percent) because the former method considers both the spatial context and texture. Although our pixel-based RF method showed good results, the literature proposes that adding object-based features might further enhance the process of detecting fragmented mangrove patches [39,77].
It is hard to overestimate the role of cloud computing in this research. Reference [78] highlights the fact that GEE has transformed remote sensing, eliminating the processing limits of complex software, which can now analyze an entire planet in time. This can be reflected in the viewpoint of [79], who emphasized the use of GEE in monitoring agroforestry and forest cover over time in the form of time-series data that is impractical and too large to be processed. This technological change made it possible to conduct our annual analysis of Al-Birk in 2015–2021, and we were able to identify the 2020–2021 dip that a less frequent monitoring cycle would have overlooked. There is also adequate support for the use of indices of mangrove health. Fusion of Landsat-8 and Sentinel-1 SAR data improves canopy height estimation accuracy, achieving a root mean square error (RMSE) of 1.9 m [80]. The study by [81] showed that a combination of such indices as EVI and MSAVI2 is more effective in describing the distribution of forests because it eliminates the shortcomings of individual indices. This is corroborated by our results because inclusion of MSAVI2 was critical in the reduction in high soil reflectance of the Saudi coast. Moreover, ref. [78] discovered that the indices are necessary in identifying land-cover changes in coastal areas, whereby water and vegetation spectra tend to overlap.
Although the optical data (Landsat-8) were the priority of this research, ref. [82] indicate that Synthetic Aperture Radar (SAR) data associated with the Sentinel-1 satellite can also be considered of great benefit in increasing the accuracy of the monitoring, particularly in the cloudy areas. Though Al-Birk is comparatively dry, the inclusion of SAR data in subsequent versions of this research could be used to give the structural information of the mangrove biomass that cannot be detected by the optical sensors. This is one of the areas that we disagree on, where our research, which is mainly grounded in optical indices, can be enhanced with the multi-sensor fusion methods that have been suggested in the literature [42].
Lastly, the phenological approach to mangrove mapping by [40] implies that seasonal differences may be included in the classification to identify mangrove species. We classified mangroves as one class in our study; however, the literature suggests that, as these forests spread, the next challenge in Red Sea geomatics will be discriminating between A. marina and R. mucronata when using dense time-series data.
Implications
These findings of this research paper have immense theoretical and practical implications for geomatics and coastal management. Theoretically, the study illustrates the fact that the GEE-RF framework is highly efficient in tracking ecosystems in extreme environments. The relationship between indices and classified area is high, indicating that in arid areas, spectral indices may be used as a proxy of physical area, which may simplify future monitoring procedures [30,81].
In real life, the observed 44% increase provides a useful spatial indicator for assessing areas where restoration and protection efforts may be monitored in future studies. The cooling effect associated with increased mangrove cover (LST reductions of up to 44.1 °C) further underscores climate regulation benefits [55]. The findings provide regional planners with a point of reference to see where growth has been successful and where it has failed. The methodology developed here is very extensible; it can be extended to other coastal areas along the Red Sea and the Arabian Gulf to develop a countrywide system of monitoring mangroves. In addition, the research provides emphasis on the significance of employing soil-adjusted indices in desert settings. We offer a methodological roadmap to other researchers working in arid high-reflectance coastal areas by emphasizing the validity of MSAVI2. The discovery of the 2020–2021 decrease acts as a black box, indicating that despite a prosperous ecosystem, it must be followed, and the effects of local stressors should be identified and addressed to avoid considerable deforestation.
4.3. Future Scope and Recommendations
This study successfully demonstrates the utility of the GEE-RF framework in an arid Red Sea setting; however, several methodological and interpretive limitations must be acknowledged to guide future research.
First, the study relies exclusively on optical Landsat imagery (30 m resolution), which limits the detection of highly fragmented or nascent mangrove patches and introduces potential spectral confusion between mangrove canopies and adjacent halophyte vegetation. While the integration of Sentinel-1 Synthetic Aperture Radar (SAR) data [22] was noted in the broader literature as effective for mangrove monitoring, it was not adopted in the present framework, as the primary objective was to establish a long-term historical baseline using optical spectral indices. Future studies must prioritize Multi-Sensor Fusion (e.g., Landsat 8/9, Sentinel-2 red-edge, and Sentinel-1 SAR) to resolve these spectral ambiguities and capture structural biomass attributes that optical sensors cannot detect [18].
Second, this analysis mapped mangroves at a single-class level. Expanding the Red Sea geomatics framework to achieve species-level discrimination (differentiating A. marina from R. mucronata) remains a critical next step, which will require High-Resolution Mapping using commercial datasets (e.g., WorldView-2) or dense temporal phenological profiling [80].
Third, the absence of ground-validation data and fine-scale topographical metrics limits the interpretation of localized vulnerabilities. Integrating LiDAR and UAV-derived Canopy Height Models (CHMs) is highly recommended. For the Al-Birk region specifically, integrating these 3D structural metrics could facilitate the creation of operational early-warning systems capable of detecting localized die-back events, addressing the spatial heterogeneity (southern expansion versus northern decline) observed in our 2020–2021 findings.
Finally, while the observed 44% spatial expansion is temporally aligned with the initiation of national greening programs, the most scientifically consequential limitation of this remote sensing framework is that it cannot establish a direct causal link between policy interventions (such as the Saudi Green Initiative) and the detected ecological changes. Future research should address this by incorporating socioeconomic surveys, carbon-stock assessments, and direct integration with the National Center for Vegetation Cover (NCVC) monitoring programs. By applying spatial and temporal transfer learning techniques, the methodology developed here can be scaled into a national, evidence-based operational monitoring system that directly supports policy evaluation and localized restoration prioritization.
5. Conclusions
This study demonstrated the usefulness of Google Earth Engine and Random Forest classification for monitoring mangrove dynamics in Al-Birk, Saudi Arabia, using multi-temporal Landsat imagery and spectral indices. The results indicate that classified mangrove extent increased from approximately 1069 ha in 2016 to 1540 ha in 2021, representing a net gain of 471 ha, a 44% increase relative to the 2016 baseline, and an average annual increase of approximately 94 ha yr−1. Despite this overall positive trend, a localized decline was detected between 2020 and 2021, indicating that mangrove dynamics were spatially uneven. The Random Forest classification achieved an overall accuracy of 92.5% and a Kappa coefficient of 0.89, with producer’s and user’s accuracy values reported for the mapped classes.
Analysis of the Random Forest variable importance scores empirically demonstrated that MSAVI2 and NDVI were the most critical features for accurate classification, confirming their necessity in mitigating the high background soil reflectance inherent to arid coastal environments. These findings provide a spatially explicit baseline for future mangrove monitoring, restoration assessment, and coastal conservation planning in Saudi Arabia. The study does not establish direct causality between the observed expansion and restoration policies or programs. Future research should strengthen this framework by integrating higher-resolution Sentinel-2 data, Sentinel-1 SAR, LiDAR or UAV-derived structural information, and field-based validation. These additions would support species-level discrimination, improve structural characterization, and enhance interpretation of the ecological mechanisms underlying mangrove change.
This study demonstrated the usefulness of Google Earth Engine and Random Forest classification for monitoring mangrove dynamics in Al-Birk, Saudi Arabia, using multi-temporal Landsat imagery and spectral indices. The results indicate that classified mangrove extent increased from approximately 1069 ha in 2016 to 1540 ha in 2021, representing a net gain of 471 ha, a 44% increase relative to the 2016 baseline, and an average annual increase of approximately 94 ha yr−1. Despite this overall positive trend, a localized decline was detected between 2020 and 2021, indicating that mangrove dynamics were spatially uneven.
Author Contributions
Conceptualization, A.F., A.A. and A.H.; methodology, A.F., A.A., R.S. and A.M.; software, A.F.; validation, A.F., Y.A., A.A. and M.E.; formal analysis, A.F., A.A., R.S. and A.M.; investigation, A.F., A.A., R.S., A.M., A.B., Y.A. and A.H.; resources, A.F.; data curation, A.F., A.A. and R.S.; writing—original draft preparation, A.F., A.A., A.H. and M.E.; writing—review and editing, A.F. and A.A.; visualization, A.F., M.E. and R.S.; supervision, A.F., A.A. and Y.A.; project administration, A.F.; funding acquisition, A.F. All authors have read and agreed to the published version of the manuscript.
Funding
The Deanship of Scientific Research (DSR) at King Abdulaziz University (KAU), Jeddah, Saudi Arabia, has funded this project under grant number IPP: 496-137-2025.
Data Availability Statement
The data used in this study are available in the Google Earth Engine Code Editor (web-based IDE), accessed in July 2025.
Acknowledgments
The authors have reviewed and edited the output and take full responsibility for the content of this publication.
Conflicts of Interest
The authors declare no conflicts of interest.
References
- Al-Huqail, A.A.; Islam, Z.; Al-Harbi, H.F. An ML-Based Ensemble Approach for the Precision Classification of Mangroves, Trend Analysis, and Priority Reforestation Areas in Asir, Saudi Arabia. Sustainability 2024, 16, 10355. [Google Scholar] [CrossRef] [Scilit]
- Pham, T.; Yokoya, N.; Bui, D.; Yoshino, K.; Friess, D. Remote Sensing Approaches for Monitoring Mangrove Species, Structure, and Biomass: Opportunities and Challenges. Remote Sens. 2019, 11, 230. [Google Scholar] [CrossRef] [Scilit]
- Alongi, D.M. Carbon Cycling and Storage in Mangrove Forests. Annu. Rev. Mar. Sci. 2014, 6, 195–219. [Google Scholar] [CrossRef] [Scilit] [PubMed]
- Akram, H.; Hussain, S.; Mazumdar, P.; Chua, K.O.; Butt, T.E.; Harikrishna, J.A. Mangrove Health: A Review of Functions, Threats, and Challenges Associated with Mangrove Management Practices. Forests 2023, 14, 1698. [Google Scholar] [CrossRef] [Scilit]
- Deborde, J.; Marchand, C.; Molnar, N.; Patrona, L.D.; Meziane, T. Concentrations and Fractionation of Carbon, Iron, Sulfur, Nitrogen and Phosphorus in Mangrove Sediments Along an Intertidal Gradient (Semi-Arid Climate, New Caledonia). J. Mar. Sci. Eng. 2015, 3, 52–72. [Google Scholar] [CrossRef] [Scilit]
- Whitchurch, A. Titan’s dry lakebeds. Nat. Geosci. 2011, 4, 658. [Google Scholar] [CrossRef] [Scilit]
- Sandilyan, S.; Kathiresan, K. Mangrove conservation: A global perspective. Biodivers. Conserv. 2012, 21, 3523–3542. [Google Scholar] [CrossRef] [Scilit]
- Hagger, V.; Worthington, T.A.; Lovelock, C.E.; Adame, M.F.; Amano, T.; Brown, B.M.; Friess, D.A.; Landis, E.; Mumby, P.J.; Morrison, T.H.; et al. Drivers of global mangrove loss and gain in social-ecological systems. Nat. Commun. 2022, 13, 6373. [Google Scholar] [CrossRef] [Scilit]
- Worthington, T.; Spalding, M. Mangrove Restoration Potential: A Global Map Highlighting a Critical Opportunity; The Nature Conservancy (TNC): Arlington, VA, USA, 2018. [Google Scholar]
- Almahasheer, H.; Aljowair, A.; Duarte, C.M.; Irigoien, X. Decadal stability of Red Sea mangroves. Estuar. Coast. Shelf Sci. 2016, 169, 164–172. [Google Scholar] [CrossRef] [Scilit]
- Moatamed, A. Degradation of mangrove forests and coral reefs in the coastal area of the southwestern region of Saudi Arabia. Biogeogr.–J. Integr. Biogeogr. 2019, 35, 71–89. [Google Scholar] [CrossRef] [Scilit]
- Wirabuana, P.Y.A.P.; Baskorowati, L.; Pamungkas, B.; Mulyana, B.; South, J.; Purnobasuki, H.; Andriyono, S.; Hasan, V. Mangroves, fauna compositions and carbon sequestration after ten years restoration on Flores Island, Indonesia. Sci. Rep. 2025, 15, 4866. [Google Scholar] [CrossRef] [Scilit]
- Lovelock, C.E.; Barbier, E.; Duarte, C.M. Tackling the mangrove restoration challenge. PLoS Biol. 2022, 20, e3001836. [Google Scholar] [CrossRef] [Scilit]
- SGI. Saudi Green Initiative. Available online: https://www.vision2030.gov.sa/en/explore/projects/saudi-green-initiative (accessed on 15 March 2026).
- Waleed, T.A.; Abdel-Maksoud, Y.K.; Kanwar, R.S.; Sewilam, H. Mangroves in Egypt and the Middle East: Current status, threats, and opportunities. Int. J. Environ. Sci. Technol. 2025, 22, 1225–1262. [Google Scholar] [CrossRef] [Scilit]
- Al-Huqail, A.A.; Islam, Z.; Al-Harbi, H.F. Ecological Stress Modeling to Conserve Mangrove Ecosystem Along the Jazan Coast of Saudi Arabia. Land 2025, 14, 70. [Google Scholar] [CrossRef] [Scilit]
- Al-Absi, R.; Vethamony, P.; Aboobacker, V.M.; Rajendran, S.; Al-Kuwari, H.A.-S.; Al-Khayat, J.A. Mangroves in the State of Qatar: Influences and adaptations of climate change. Plant Stress 2025, 18, 100999. [Google Scholar] [CrossRef] [Scilit]
- Hu, T.; Zhang, Y.; Su, Y.; Zheng, Y.; Lin, G.; Guo, Q. Mapping the Global Mangrove Forest Aboveground Biomass Using Multisource Remote Sensing Data. Remote Sens. 2020, 12, 1690. [Google Scholar] [CrossRef] [Scilit]
- Alongi, D.M. The impact of climate change on mangrove forests. Curr. Clim. Change Rep. 2015, 1, 30–39. [Google Scholar] [CrossRef] [Scilit]
- Alikhanova, S.; Tarantino, C.; Bull, J.W. Tracking Vegetation Dynamics in Drylands with MSAVI: Insights from the South Aral Sea. Earth Syst. Environ. 2026, 10, 1687–1699. [Google Scholar] [CrossRef] [Scilit]
- Wei, S.; Zhang, H.; Ling, J. A review of mangrove degradation assessment using remote sensing: Advances, challenges, and opportunities. GISci. Remote Sens. 2025, 62, 2491920. [Google Scholar] [CrossRef] [Scilit]
- Mai, X.; Li, Q.; Xu, W.; Deng, S.; Wang, W.; Wu, W.; Zhang, W.; Wang, Y. Estimation of Mangrove Aboveground Carbon Using Integrated UAV-LiDAR and Satellite Data. Sustainability 2025, 17, 8211. [Google Scholar] [CrossRef] [Scilit]
- Fallatah, A.; Imam, A. Detecting Land Surface Temperature Variations Using Earth Observation at the Holy Sites in Makkah, Saudi Arabia. Sustainability 2023, 15, 13355. [Google Scholar] [CrossRef] [Scilit]
- Almahasheer, H. Spatial coverage of mangrove communities in the Arabian Gulf. Environ. Monit. Assess. 2018, 190, 85. [Google Scholar] [CrossRef] [Scilit]
- Ghorbanian, A.; Zaghian, S.; Asiyabi, R.M.; Amani, M.; Mohammadzadeh, A.; Jamali, S. Mangrove Ecosystem Mapping Using Sentinel-1 and Sentinel-2 Satellite Images and Random Forest Algorithm in Google Earth Engine. Remote Sens. 2021, 13, 2565. [Google Scholar] [CrossRef] [Scilit]
- Sun, Z.; Jiang, W.; Ling, Z.; Zhong, S.; Zhang, Z.; Song, J.; Xiao, Z. Using Multisource High-Resolution Remote Sensing Data (2 m) with a Habitat–Tide–Semantic Segmentation Approach for Mangrove Mapping. Remote Sens. 2023, 15, 5271. [Google Scholar] [CrossRef] [Scilit]
- Zhang, Z.; Ahmed, M.R.; Zhang, Q.; Li, Y.; Li, Y. Monitoring of 35-Year Mangrove Wetland Change Dynamics and Agents in the Sundarbans Using Temporal Consistency Checking. Remote Sens. 2023, 15, 625. [Google Scholar] [CrossRef] [Scilit]
- Janga, B.; Asamani, G.P.; Sun, Z.; Cristea, N. A Review of Practical AI for Remote Sensing in Earth Sciences. Remote Sens. 2023, 15, 4112. [Google Scholar] [CrossRef] [Scilit]
- Foggia, C.; Attorre, F.; Bourgeois, C.; Candeago, E.; Ramoni-Perazzi, P.; Malatesta, L. Shields of the shore: Mangrove ecosystem shifts and climate vulnerability in Mozambique. Front. For. Glob. Change 2025, 8, 1648754. [Google Scholar] [CrossRef] [Scilit]
- Tran, T.V.; Reef, R.; Zhu, X. A Review of Spectral Indices for Mangrove Remote Sensing. Remote Sens. 2022, 14, 4868. [Google Scholar] [CrossRef] [Scilit]
- Shekede, M.D.; Dube, T. Chapter 1—Remote sensing of climate variability: An introduction. In Remote Sensing of Climate; Dube, T., Shekede, M.D., Shoko, C., Mushore, T.D., Eds.; Elsevier: Amsterdam, The Netherlands, 2024; pp. 1–16. [Google Scholar]
- Milesi, C.; Churkina, G. Measuring and Monitoring Urban Impacts on Climate Change from Space. Remote Sens. 2020, 12, 3494. [Google Scholar] [CrossRef] [Scilit]
- Loiola, T.; Fantinel, R.; Santos, F.; de Bastos, F.; Schuh, M.; Fernandes, P.; Simões, B.; Soares Pereira, R. Use of Machine Learning Algorithms in the Classification of Forest Species. Anuário Do Inst. Geociências 2023, 46, 50490. [Google Scholar] [CrossRef] [Scilit]
- Ullah, S.; Ilniyaz, O.; Eziz, A.; Ullah, S.; Fidelis, G.D.; Kiran, M.; Azadi, H.; Ahmed, T.; Elfleet, M.S.; Kurban, A. Multi-Temporal and Multi-Resolution RGB UAV Surveys for Cost-Efficient Tree Species Mapping in an Afforestation Project. Remote Sens. 2025, 17, 949. [Google Scholar] [CrossRef] [Scilit]
- Cheng, Z.; Wu, Y.; Li, Y.; Cai, L.; Ihnaini, B. A Comprehensive Review of Explainable Artificial Intelligence (XAI) in Computer Vision. Sensors 2025, 25, 4166. [Google Scholar] [CrossRef] [Scilit]
- Khokhar, P.B.; Pentangelo, V.; Palomba, F.; Gravino, C. Towards transparent and accurate diabetes prediction using machine learning and explainable artificial intelligence. arXiv 2025, arXiv:2501.18071. [Google Scholar] [CrossRef] [Scilit]
- Fallatah, A.; Jones, S.; Wallace, L.; Mitchell, D. Combining Object-Based Machine Learning with Long-Term Time-Series Analysis for Informal Settlement Identification. Remote Sens. 2022, 14, 1226. [Google Scholar] [CrossRef] [Scilit]
- Purwanto, A.D.; Wikantika, K.; Deliar, A.; Darmawan, S. Decision Tree and Random Forest Classification Algorithms for Mangrove Forest Mapping in Sembilang National Park, Indonesia. Remote Sens. 2023, 15, 16. [Google Scholar] [CrossRef] [Scilit]
- Ghorbanian, A.; Ahmadi, S.A.; Amani, M.; Mohammadzadeh, A.; Jamali, S. Application of Artificial Neural Networks for Mangrove Mapping Using Multi-Temporal and Multi-Source Remote Sensing Imagery. Water 2022, 14, 244. [Google Scholar] [CrossRef] [Scilit]
- Li, W.; El-Askary, H.; Qurban, M.A.; Li, J.; ManiKandan, K.P.; Piechota, T. Using multi-indices approach to quantify mangrove changes over the Western Arabian Gulf along Saudi Arabia coast. Ecol. Indic. 2019, 102, 734–745. [Google Scholar] [CrossRef] [Scilit]
- Jachowski, N.R.A.; Quak, M.S.Y.; Friess, D.A.; Duangnamon, D.; Webb, E.L.; Ziegler, A.D. Mangrove biomass estimation in Southwest Thailand using machine learning. Appl. Geogr. 2013, 45, 311–321. [Google Scholar] [CrossRef] [Scilit]
- Tien Bui, D.; Pham, B.T.; Nguyen, Q.P.; Hoang, N.-D. Spatial prediction of rainfall-induced shallow landslides using hybrid integration approach of Least-Squares Support Vector Machines and differential evolution optimization: A case study in Central Vietnam. Int. J. Digit. Earth 2016, 9, 1077–1097. [Google Scholar] [CrossRef] [Scilit]
- Aljahdali, M.O.; Munawar, S.; Khan, W.R. Monitoring Mangrove Forest Degradation and Regeneration: Landsat Time Series Analysis of Moisture and Vegetation Indices at Rabigh Lagoon, Red Sea. Forests 2021, 12, 52. [Google Scholar] [CrossRef] [Scilit]
- Khawfany, A.; Aref, M.; Matsah, M.; Taj, R. Utilizing Landsat-8 data in mapping of sabkha, mangroves, and land covers in Jizan coastal plain, southwestern Saudi Arabia. Arab. J. Geosci. 2017, 10, 103. [Google Scholar] [CrossRef] [Scilit]
- Abdel-Hamid, A.; Dubovyk, O.; Abou El-Magd, I.; Menz, G. Mapping Mangroves Extents on the Red Sea Coastline in Egypt using Polarimetric SAR and High Resolution Optical Remote Sensing Data. Sustainability 2018, 10, 646. [Google Scholar] [CrossRef] [Scilit]
- Bittencourt, H.R.; Clarke, R.T. Use of Classification and Regression Trees (CART) to Classify Remotely-Sensed Digital Images. In Proceedings of the IGARSS 2003. 2003 IEEE International Geoscience and Remote Sensing Symposium. Proceedings (IEEE Cat. No. 03CH37477); IEEE: Toulouse, France, 2003; Volume 6, pp. 3751–3753. [Google Scholar]
- Breiman, L. Random Forests. Mach. Learn. 2001, 45, 5–32. [Google Scholar] [CrossRef] [Scilit]
- Baltiur, M.; Tawfik, R.; Elsebaei, M. Evaluation of the mangrove ecosystem in Saudi Arabia. Basic Appl. Sci.-Sci. J. King Faisal Univ. 2023, 24, 1–7. [Google Scholar] [CrossRef] [Scilit]
- Almansoori, A.; Macintosh, D.; Almahasheer, H.; Suarez, E. IUCN red list of ecosystems, mangroves of the Arabian (Persian) Gulf. EcoEvoRxiv 2024. [Google Scholar] [CrossRef] [Scilit]
- Alzahrani, D.A.; Selim, E.M.; El-Sherbiny, M.M. Ecological assessment of heavy metals in the grey mangrove (Avicennia marina) and associated sediments along the Red Sea coast of Saudi Arabia. Oceanologia 2018, 60, 513–526. [Google Scholar] [CrossRef] [Scilit]
- Anton, A.; Almahasheer, H.; Delgado Huertas, A.; Garcias-Bonet, N.; Carrillo de Albornoz, P.; Marba, N.; Hendriks, I.; Krause-Jensen, D.; Saderne, V.; Baldry, K.; et al. Stunted Mangrove Trees in the Oligotrophic Central Red Sea Relate to Nitrogen Limitation. Front. Mar. Sci. 2020, 7, 597. [Google Scholar] [CrossRef] [Scilit]
- Dhawi, F. Mastering resilience: Avicennia marina’s survival in hypersaline arid zones. Front. Sustain. Food Syst. 2025, 9, 1598548. [Google Scholar] [CrossRef] [Scilit]
- Red Sea Global. Our Approach. Available online: https://www.redseaglobal.com/en/ (accessed on 19 June 2025).
- Carlson, R.R.; Evans, L.J.; Foo, S.A.; Grady, B.W.; Li, J.; Seeley, M.; Xu, Y.; Asner, G.P. Synergistic benefits of conserving land-sea ecosystems. Glob. Ecol. Conserv. 2021, 28, e01684. [Google Scholar] [CrossRef] [Scilit]
- Al-Huqail, A.A.; Islam, Z.; Al-Harbi, H.F. Mangroves trend and their impact on surface temperature in Al-Wajh Lagoon: A study aligned with Saudi Arabia’s vision 2030. Front. Environ. Sci. 2024, 12, 1439425. [Google Scholar] [CrossRef] [Scilit]
- USGS. Landsat Data. Available online: https://earthexplorer.usgs.gov/ (accessed on 9 April 2026).
- Giri, C.; Ochieng, E.; Tieszen, L.L.; Zhu, Z.; Singh, A.; Loveland, T.; Masek, J.; Duke, N. Status and distribution of mangrove forests of the world using earth observation satellite data. Glob. Ecol. Biogeogr. 2011, 20, 154–159. [Google Scholar] [CrossRef] [Scilit]
- Roy, D.P.; Wulder, M.A.; Loveland, T.R.; Woodcock, C.E.; Allen, R.G.; Anderson, M.C.; Helder, D.; Irons, J.R.; Johnson, D.M.; Kennedy, R.; et al. Landsat-8: Science and product vision for terrestrial global change research. Remote Sens. Environ. 2014, 145, 154–172. [Google Scholar] [CrossRef] [Scilit]
- Ren, Z.; Pu, R.; Zheng, H.; Zhang, D.; He, X. Spatiotemporal analyses of urban vegetation structural attributes using multitemporal Landsat TM data and field measurements. Ann. For. Sci. 2017, 74, 54. [Google Scholar] [CrossRef] [Scilit]
- López-Serrano, P.M.; López-Sánchez, C.A.; Álvarez-González, J.G.; García-Gutiérrez, J. A Comparison of Machine Learning Techniques Applied to Landsat-5 TM Spectral Data for Biomass Estimation. Can. J. Remote Sens. 2016, 42, 690–705. [Google Scholar] [CrossRef] [Scilit]
- Qi, J.; Chehbouni, A.; Huete, A.R.; Kerr, Y.H.; Sorooshian, S. A modified soil adjusted vegetation index. Remote Sens. Environ. 1994, 48, 119–126. [Google Scholar] [CrossRef] [Scilit]
- Khaled, A.; Hereher, M.; El-Shater, A. GIS-based assessment of mangrove degradation in the Red Sea coast of Saudi Arabia. Ocean Coast. Manag. 2018, 158, 95–104. [Google Scholar]
- McFeeters, S.K. The use of the Normalized Difference Water Index (NDWI) in the delineation of open water features. Int. J. Remote Sens. 1996, 17, 1425–1432. [Google Scholar] [CrossRef] [Scilit]
- Baugh, W.M.; Groeneveld, D.P. Broadband vegetation index performance evaluated for a low-cover environment. Int. J. Remote Sens. 2006, 27, 4715–4730. [Google Scholar] [CrossRef] [Scilit]
- Griffith, D.; Hay, G. Integrating GEOBIA, Machine Learning, and Volunteered Geographic Information to Map Vegetation over Rooftops. ISPRS Int. J. Geo-Inf. 2018, 7, 462. [Google Scholar] [CrossRef] [Scilit]
- Samanta, S.; Hazra, S.; Mondal, P.P.; Chanda, A.; Giri, S.; French, J.R.; Nicholls, R.J. Assessment and Attribution of Mangrove Forest Changes in the Indian Sundarbans from 2000 to 2020. Remote Sens. 2021, 13, 4957. [Google Scholar] [CrossRef] [Scilit]
- Huete, A.; Didan, K.; Miura, T.; Rodriguez, E.P.; Gao, X.; Ferreira, L.G. Overview of the radiometric and biophysical performance of the MODIS vegetation indices. Remote Sens. Environ. 2002, 83, 195–213. [Google Scholar] [CrossRef] [Scilit]
- Xue, J.; Su, B. Significant Remote Sensing Vegetation Indices: A Review of Developments and Applications. J. Sens. 2017, 2017, 1353691. [Google Scholar] [CrossRef] [Scilit]
- Elhag, M.; Hegazy, A.K.; Alatar, A.A.; Faisal, M.; El-Bana, M.; Bahrawi, J.A.; Al-Ghamdi, A.A.M. Population demography and global sensitivity analysis of Avicennia marina on the eastern and western coasts of Saudi Arabia. Koedoe 2015, 57, a1317. [Google Scholar] [CrossRef] [Scilit]
- Shaltout, K.H.; Ahmed, M.T.; Alrumman, S.A.; Ahmed, D.A.; Eid, E.M. Standing crop biomass and carbon content of mangrove Avicennia marina (Forssk.) vierh. Along the red sea coast of Saudi Arabia. Sustainability 2021, 13, 13996. [Google Scholar] [CrossRef] [Scilit]
- Bannari, A.; Morin, D.; Bonn, F.; Huete, A.R. A review of vegetation indices. Remote Sens. Rev. 1995, 13, 95–120. [Google Scholar] [CrossRef] [Scilit]
- Calvão, T.; Palmeirim, J.M. A comparative evaluation of spectral vegetation indices for the estimation of biophysical characteristics of Mediterranean semi-deciduous shrub communities. Int. J. Remote Sens. 2011, 32, 2275–2296. [Google Scholar] [CrossRef] [Scilit]
- Kimera, F.; Sobhi, B.; Omara, M.; Sewilam, H. Impact of Salinity Gradients on Seed Germination, Establishment, and Growth of Two Dominant Mangrove Species Along the Red Sea Coastline. Plants 2024, 13, 3471. [Google Scholar] [CrossRef] [Scilit] [PubMed]
- Hickey, S.M.; Radford, B. Turning the Tide on Mapping Marginal Mangroves with Multi-Dimensional Space–Time Remote Sensing. Remote Sens. 2022, 14, 3365. [Google Scholar] [CrossRef] [Scilit]
- Caiza-Morales, L.; Gómez, C.; Torres, R.; Nicolau, A.P.; Olano, J.M. MANGLEE: A Tool for Mapping and Monitoring MANgrove Ecosystem on Google Earth Engine—A Case Study in Ecuador. J. Geovisualization Spat. Anal. 2024, 8, 17. [Google Scholar] [CrossRef] [Scilit]
- Jhonnerie, R.; Oktorini, Y.; Darlis, V.V.; Pebriandi, P.; Prianto, E.; Fatmawati, R.; Nofrizal, N.; Ramses, R.; Miswadi, M.; Rahmatdillah, R. Integration of generative artificial intelligence and Google Earth Engine for mangrove land cover mapping. In Proceedings of the BIO Web of Conferences; EDP Sciences: Les Ulis, France, 2024; p. 03002. [Google Scholar]
- Valero-Jorge, A.; González-Lozano, R.; González-De Zayas, R.; Matos-Pupo, F.; Sorí, R.; Stojanovic, M. An Innovative Tool for Monitoring Mangrove Forest Dynamics in Cuba Using Remote Sensing and WebGIS Technologies: SIGMEM. Remote Sens. 2024, 16, 3802. [Google Scholar] [CrossRef] [Scilit]
- Habibullah, I.; Sanjaya, H.; Nyoman Giri Putra, I. Utilization of the indices to detect and monitor the landcover changes of Mangroves. In Proceedings of the IOP Conference Series: Earth and Environmental Science; IOP Publishing: Bristol, UK, 2023; p. 012033. [Google Scholar]
- Sunkur, R.; Kantamaneni, K.; Bokhoree, C.; Rathnayake, U.; Fernando, M. Mangrove mapping and monitoring using remote sensing techniques towards climate change resilience. Sci. Rep. 2024, 14, 6949. [Google Scholar] [CrossRef] [Scilit] [PubMed]
- Zhang, B.; Gann, D.; Wdowinski, S.; Lin, C.; Hestir, E.; Lamb-Wotton, L.; Ishtiaq, K.S.; Smith, K.; Li, Y. Space-Based Mapping of Pre- and Post-Hurricane Mangrove Canopy Heights Using Machine Learning with Multi-Sensor Observations. Remote Sens. 2024, 16, 3992. [Google Scholar] [CrossRef] [Scilit]
- Rahmawati, A.; Asy’Ari, R.; Destia, R.A.; Ananda, R.; Faridah, D.; Dzulfigar, A.; Adila, J.; Firmansyah, L.; Marfi, K.P.; Puspitasari, R.; et al. Agricultural and Fishery Activities on Mangrove Ecosystem Area, Bekasi Regency: Exploration Studies of Land Use Conditions in The Coastline Buffer Area. SSRS J. A Agro-Environ. Res. 2024, 2, 48–69. [Google Scholar]
- Sari, I.L.; Weston, C.J.; Newnham, G.J.; Volkova, L. Mapping Land Cover Time Series Using Landsat-8 and Sentinel-1 in South Kalimantan. Int. Arch. Photogramm. Remote Sens. Spat. Inf. Sci. 2023, 48, 319–325. [Google Scholar] [CrossRef] [Scilit]

Disclaimer/Publisher’s Note: The statements, opinions and data contained in all publications are solely those of the individual author(s) and contributor(s) and not of MDPI and/or the editor(s). MDPI and/or the editor(s) disclaim responsibility for any injury to people or property resulting from any ideas, methods, instructions or products referred to in the content. |
© 2026 by the authors. Licensee MDPI, Basel, Switzerland. This article is an open access article distributed under the terms and conditions of the Creative Commons Attribution (CC BY) license.