


Abstract
Improving the cultivated land use eco-efficiency (CLUE) is crucial to achieving sustainable land use and the green transformation of agriculture. This study is based on the data from 353 prefecture-level cities in China from 2013 to 2021. The slacks-based measurement (SBM)-undesirable model, the social network analysis (SNA), and the fuzzy set qualitative comparative analysis (fsQCA) are adopted to measure and analyze the spatial patterns, network characteristics, and multiple driving pathways of inefficiency in the cultivated land use eco-efficiency in prefecture-level administrative units. Results show the following: (1) From 2013 to 2021, CLUE in the study areas shows spatial heterogeneity, with most efficiency values at a moderate level and showing a fluctuating downward trend over time. (2) The nine major agricultural regions have formed a complex association network, with the overall network connectivity being weak but efficiency relatively high. The hierarchical structure is gradually flattening, and inter-regional cooperation is increasing. (3) There are significant differences in influence, control, and accessibility within individual networks, and the collaborative network is developing into a “multi-core-hierarchical” structure. (4) The formation of inefficiency involves multiple concurrent mechanisms. Four typical inefficiency paths were identified, with significant heterogeneity across different agricultural regions. In the future, differentiated land use and ecological protection policies should be implemented based on the spatial network characteristics and inefficiency driving pathways of each agricultural region to promote the coordinated improvement of CLUE.
1. Introduction
Efficient use of cultivated land is a fundamental guarantee for food security and social production development [1,2]. Due to limitations in land quality, quantity, and natural resource conditions [3], the use of cultivated land in China remains in a state of high intensity [4] and low efficiency [5]. In recent years, although there has been an increase in food production and agricultural output value in China, the process of cultivated land use has also resulted in significant carbon emissions [6,7], impacting the construction of ecological civilization in land use [8]. Therefore, the concepts of “promoting rural green development” and “strengthening the construction of ecological civilization in cultivated land” have been proposed in China, emphasizing ecological protection of cultivated land and efforts to improve its utilization efficiency. As a result, scientifically measuring the CLUE, revealing its spatial patterns and network associations, clarifying its driving pathways, and exploring how to achieve the joint improvement of ecology and efficiency are all crucial. By investigating the aforementioned issues, this study can provide a scientific basis for optimizing cropland resource allocation, improving regional ecological performance. At the same time, it contributes to the theoretical development of cropland ecological efficiency and advances spatial network analytical methodologies, offering significant implications for promoting the coordinated development of food security and ecological security in China.
Current research on CLUE primarily focuses on three aspects: the construction of evaluation indicator systems [9,10] and the measurement of efficiency values [11,12], analysis of spatial differentiation patterns [13,14], and identification of influencing factors [15,16]. Regarding the measurement and evaluation of efficiency, early studies mainly employed an input–output perspective of land use to select relevant indicators. Later studies have enriched the concept of CLUE by constructing indicator systems encompassing three dimensions: input, expected output, and unexpected output [17]. The mainstream methods for measuring efficiency include the stochastic frontier approach (SFA) [18], data envelopment analysis (DEA) [19], super-efficiency SBM model [20], and hybrid super-efficiency SBM–DEA model [21]. Additionally, some scholars have used methods such as the Dagum [22] Gini coefficient and the Malmquist index [23] to decompose efficiency values for further analysis. In terms of spatial differentiation, most studies first examine the dynamic evolution of CLUE over long time series [24], along with its spatial correlation and agglomeration patterns [25]. Research then typically follows two directions: one investigates spatial effects [26] to analyze spatial imbalances [27], while the other explores spatial convergence to assess convergence trends [28]. Concerning influencing factors, research mainly focuses on their driving mechanisms and intensity. One approach selects representative individual factors to explore their coupling and coordination with CLUE, including factors such as urbanization [29], cultivated land fragmentation [30], and comprehensive land consolidation [31]. The other approach considers multiple factors across economic [32], social [33], and resource [34] dimensions to examine spatial heterogeneity or to analyze the complex configurational paths and evolution of efficiency improvements [35].
The “multi-dimensional and dynamic” complex spatial network structure of CLUE constitutes a vital component of socio-economic development [36]. Existing studies have extensively examined spatial relationships based on geographic proximity; however, research on long-distance interregional network collaboration and zonal differentiation remains limited. On one hand, advancements in transportation and network infrastructure have weakened the role of geographic proximity, highlighting the need to focus on complex cross-regional network connections [37]. On the other hand, CLUE may exhibit distinct network characteristics across different regions, making it necessary to investigate its spatial network properties through regional differentiation [38].
In summary, this study focuses on all 353 prefecture-level administrative units in China (including prefecture-level cities, autonomous prefectures, regions, leagues, and provincially administered cities, but excluding Hong Kong, Macao, and Taiwan) during the period 2013–2021, with evaluations conducted at two-year intervals. An evaluation indicator system is constructed by selecting appropriate factors across three dimensions: input, expected output, and unexpected output. Efficiency values are measured using the SBM-undesirable model. The study area is divided into nine regions according to agricultural zoning in China, and SNA is employed to investigate the spatial association characteristics of efficiency values within each region. Furthermore, the fsQCA method is applied to examine the impact pathways of network characteristics on efficiency values.
This study contributes to the CLUE literature in three ways. First, it moves beyond conventional spatial analyses based on geographic proximity by employing social network analysis (SNA) to capture cross-regional linkages and spillover pathways of CLUE. By further dividing China into nine major agricultural zones, this study provides a network-based perspective that better reflects regional heterogeneity and policy contexts. Second, the integration of SNA and fsQCA enables a multidimensional investigation of the mechanisms underlying city-level CLUE. This combined framework links network characteristics with internal driving factors, reveals multiple configurational pathways associated with low efficiency, and identifies four distinct development patterns. Third, while most existing CLUE studies focus on the provincial level [39] or selected representative regions [40], few have investigated the nationwide city-level scope (including autonomous prefectures, regions, leagues, and directly administered cities). This fine-grained analytical scale allows for a more nuanced examination of spatial heterogeneity, network interactions, and development pathways, generating policy-relevant insights for differentiated cultivated land use management.
2. Materials and Methods
2.1. Research Framework
This study is primarily conducted from the following three aspects (Figure 1).
Figure 1.
Research theoretical framework.
(1) First, an evaluation indicator system is constructed based on a clear definition of CLUE, and efficiency values are calculated using the undesirable super-efficiency SBM model.
Eco-efficiency emphasizes the unity of economic efficiency and environmental benefits, effectively integrating sustainable development goals at the macro level into development planning and management at the micro and meso levels. In 1990, Schaltegger et al. defined eco-efficiency as “the ratio of economic growth to environmental impact” [41]. However, due to the absence of product-related factors in this definition, the World Business Council for Sustainable Development (WBCSD) expanded the concept in 1996, defining eco-efficiency as “the provision of competitively priced goods and services that satisfy human needs and improve quality of life, while reducing ecological impacts to within the carrying capacity of the Earth” [42]. Ecological efficiency assessment has been widely applied in fields such as agricultural production and energy utilization [43]. The evolution of the definition of eco-efficiency reflects the gradual establishment of the guiding philosophy of ecological civilization construction.
Although no universally accepted definition of eco-efficiency has yet been reached, broad consensus has emerged regarding its core connotation and essential attributes. Most studies define the CLUE as maximizing agricultural output—grain yield and economic value—while minimizing resource inputs and environmental pollution.
(2) Second, this study analyzed the mechanisms of network formation, and the spatial association network characteristics of CLUE are examined.
The CLUE exhibits pronounced spatial heterogeneity, forming clusters of varying efficiency (e.g., low–high, high–low) [44] and generating potential gradients between regions. Geographic connectivity among prefecture-level cities provides a framework for spatial transmission, wherein both mobile factors (labor, capital, technology) and immobile factors (land, ecological resources, climate) [45] flow and reorganize across regions under the influence of resource endowments, economic development, and policy interventions. These flows give rise to a complex, multi-scalar network of nodes, links, and spatial surfaces. This network is inherently dynamic, characterized by continuous feedback loops [46]: factor movements create new clusters and dispersed nodes, reshaping interregional potential differences and driving the iterative optimization and restructuring of network connectivity. Such dynamics reinforce interregional interactions, resulting in a CLUE spatial association network that is multidimensional, adaptive, cyclic, and feedback-driven.
Because of similarities in climate and topography, information, technologies, and policy resources related to cultivated land use tend to circulate predominantly within regions or between adjacent areas, with limited long-distance interregional connections. Zonal analysis therefore provides a more accurate assessment of how network positions within each agricultural region affect CLUE while minimizing interference from cross-regional heterogeneity. In this study, China is divided into nine agricultural regions: the Northern Arid and Semi-Arid Region, the Northeast Plain Region, the South China Region, the Huang-Huai-Hai Plain Region, the Loess Plateau Region, the Qinghai–Tibet Plateau Region, the Sichuan Basin and Surrounding Areas, the Yunnan–Guizhou Plateau Region, and the Middle and Lower Yangtze River Region.
The SNA are then analyzed using UCINET. Both overall network metrics (number of ties, network density, network efficiency, network hierarchy) and individual node metrics (in-degree, out-degree, degree centrality, betweenness centrality, closeness centrality) are employed to reveal the structural features of the spatial association network [47].
(3) Finally, this study selected appropriate independent and dependent variables to explore the driving pathways of non-high efficiency with fsQCA.
The selection of explanatory variables in this study is grounded in social network analysis and regional development theory. Specifically, the network position of a node is widely regarded as a key determinant of its ability to access, control, and disseminate resources. Therefore, three classical individual network indicators (degree centrality, betweenness centrality, and closeness centrality) are employed to capture the structural characteristics of cities from different dimensions within the network. Degree centrality reflects the strength of a city’s direct connections with other cities [48]. A higher degree centrality indicates that a city can access a greater volume of information, capital, and knowledge flows, thereby enhancing its development advantages. Betweenness centrality measures the extent to which a city acts as a bridge within network pathways [49]. Cities with higher betweenness centrality are better positioned to connect otherwise disconnected groups and influence resource flows, thus exerting greater influence on regional coordination and resource allocation processes. Closeness centrality reflects the average distance between a city and all other nodes in the network [50]. A higher level of closeness centrality suggests that a city can access network resources more efficiently and at lower costs, thereby strengthening its overall competitiveness.
In addition to network structural characteristics, this study further incorporates provincial capital status as an explanatory variable. Provincial capitals generally serve as regional political, economic, and administrative centers and tend to possess significant advantages in resource concentration, infrastructure development, public service provision, and policy support. These institutional and functional advantages may lead provincial capitals to exhibit distinct patterns of network connectivity and regional development compared with non-capital cities. Therefore, including provincial capital status in the model helps identify the heterogeneous effects arising from institutional factors and further examine whether the impacts of network structure vary across different types of cities.
2.2. Data Sources and Preprocessing
The basic data used in this study were primarily obtained from the China Rural Statistical Yearbook, as well as statistical yearbooks and statistical communiqués on national economic and social development published annually by Chinese provinces (including municipalities and autonomous regions) and prefecture-level cities (prefectures, regions, and leagues).
For a small number of prefecture-level cities with missing data on pesticide and agricultural plastic film use, the missing values were approximated using a weighted allocation method based on cultivated land area. Missing data on effective irrigated area for certain prefecture-level cities were estimated according to the provincial proportion of effective irrigated area. Missing data on agricultural employment in some prefecture-level cities were supplemented using the number of employees in the agriculture, forestry, animal husbandry, and fishery sectors multiplied by the ratio of gross agricultural output value to the gross output value of agriculture, forestry, animal husbandry, and fishery.
2.3. Research Methodology
2.3.1. Index Selection
Drawing upon the perspectives of existing studies [51], this study defines CLUE as the achievement of synergistic development between socio-economic benefits and ecological–environmental effects through rational expected inputs and minimized unexpected inputs during cultivated land use, thereby maximizing expected output and minimizing unexpected output. Based on the conceptual definition and previous studies [52], this study constructs the following evaluation index system (Table 1).
Table 1.
Evaluation index system of cultivated land use eco-efficiency.
In this study, the input indicators selected for measuring CLUE include cultivated land, labor, pesticides, chemical fertilizers, plastic film, effective irrigated, and agricultural machinery, representing key production inputs. The rationale for selecting these indicators is threefold. First, they cover the fundamental dimensions of agricultural production “land, labor, and capital”, consistent with the classical production function framework. Second, all indicators are commonly used proxy variables in publicly available statistics, ensuring data accessibility and consistency. Third, pesticides, chemical fertilizers, plastic film, irrigation, and agricultural machinery not only directly reflect agricultural production intensity but also constitute the primary sources of agricultural carbon emissions, facilitating integration with the measurement of undesired outputs, namely carbon emissions.
Regarding outputs, total agricultural output value is set as the economic output to measure the level of agricultural economic growth, while total grain output value is defined as the social output to reflect the core societal function of ensuring food security. The undesired output is defined as agricultural carbon emissions. Following the coefficient method in the relevant literature, carbon emissions are weighted and calculated based on cropland area, effective irrigated area, agricultural machinery power, chemical fertilizers, pesticides, and plastic film, ; E indicates the total agricultural carbon emissions, Ei indicates the emissions from different agricultural carbon sources. Ti and δi indicate the original quantities and carbon emission coefficients of each carbon source. The carbon emission coefficients for each source and their calculation formulas are based on the relevant literature [53], with the specific coefficients provided in Table 2.
Table 2.
Carbon emission coefficients of various carbon sources of cultivated land use [40].
2.3.2. The Slacks-Based Measurement (SBM)-Undesirable Model
The CLUE is measured using an SBM-undesirable model under the assumption of constant returns to scale (CRS). This model can effectively address the bias in evaluation results caused by ignoring undesirable outputs, and it can assess the ecological effects and their impacts in cropland utilization, as well as measure the inputs and outputs involved in CLUE [54]. This study focuses on overall technical efficiency rather than variations in returns to scale. The assumption of constant returns to scale (CRS) is more appropriate for evaluating and comparing the overall input–output efficiency across cities, whereas the variable returns to scale (VRS) assumption introduces a decomposition of scale efficiency, which may increase the complexity of interpretation.
In the formula, indicates the CLUE of the evaluated unit; and denote the inputs, expected outputs, and unexpected outputs of CLUE; , and , respectively, indicate the slack variables for inputs, expected outputs, and unexpected outputs of CLUE; , respectively, indicate the -th input, -th desirable output, and -th undesirable output of the -th decision-making unit, respectively; are the matrices of inputs, expected outputs, and unexpected outputs, respectively; and is the weight vector.
2.3.3. Social Network Analysis (SNA)
The VAR Granger causality approach may fail to produce a proper binary matrix when the efficiency value of a region remains constantly at 1, potentially leading to an almost singular matrix. To address this issue, this study constructs a spatial association matrix using a modified gravity model based on geographic and economic distances. This matrix represents the strength of spatial linkages between different geographic units [55].
In the formula, represents the strength of the spatial association of cultivated land use ecological efficiency between prefecture-level cities i and j; denote the CLUE values of cities i and j, respectively; is the calculated gravitational coefficient; is the geographic distance between the two cities; represents the per capita GDP difference between cities i and j, serving as the measure of economic distance. Using the row mean of the matrix as a threshold, a gravity value greater than the threshold is assigned a value of 1, indicating a spatial association of CLUE between the two cities, while values below the threshold are assigned 0, indicating no association [56]. This procedure produces the spatial association matrix of CLUE.
2.3.4. Fuzzy-Set Qualitative Comparative Analysis (fsQCA)
This study employs fsQCA to examine the causal relationships between changes in the CLUE and explanatory variables. The independent variables include changes in three major individual network characteristics and whether a city serves as a provincial capital. Based on Boolean algebra and set-theoretic relations, fsQCA effectively addresses the limitations of traditional regression approaches and enhances the explanatory power of driving factors and causal pathways [57].
A direct calibration method is used, with calibration anchors based on quartiles: full membership (values above the 95th percentile), crossover point (around the 50th percentile), and full non-membership (values below the 5th percentile). Necessity tests indicate that the consistency of each individual condition and its negation does not exceed 0.9, suggesting that changes in CLUE are not driven by single factors alone but rather by the combination of multiple conditions. To ensure robustness, a sensitivity analysis is conducted using alternative calibration anchors (70-50-20 and 80-50-20), yielding stable results. Following Fiss’s recommendations [58], a consistency threshold of 0.8 and a frequency threshold of 1 are applied for necessity analysis, and configurational analysis is conducted to identify the mechanisms driving regional variations in CLUE. fsQCA 4.1 software is used to calculate the simplified, intermediate, and complex solutions, and the relationships between simplified and intermediate solutions are analyzed.
In this study, non-high CLUE is selected as the outcome variable for several reasons. First, this approach aligns with the QCA principle of causal asymmetry [59], which asserts that the conditions leading to the presence of an outcome are not simply the inverse of those leading to its absence. Consequently, the pathways leading to high efficiency may differ fundamentally from those leading to non-high efficiency, necessitating separate analyses. Second, fsQCA analyses using high efficiency as the outcome variable reveal limitations: in South China, the solution consistency for high efficiency is only 0.605, far below the acceptable threshold of 0.8 (to examine whether this inconsistency is related to the selection of calibration anchors, this study further conducted robustness checks using three alternative sets of calibration thresholds (70-50-20, 75-50-25, and 80-50-20). However, the solution consistency for high efficiency remains well below 0.8 across all specifications), indicating that achieving high efficiency likely requires stricter combinations of conditions and higher threshold levels, which cannot be fully explained by the dynamic characteristics of current regional network structures. Moreover, the national coverage of high efficiency is only 0.227, meaning it explains merely 22.7% of high-efficiency cases, reflecting insufficient explanatory power. In contrast, the formation mechanisms for non-high efficiency exhibit higher consistency and coverage, making them more identifiable. Finally, from a policy perspective, identifying the configurations that lead to low efficiency allows for a more precise understanding of the barriers to improving CLUE, providing actionable insights for tailored interventions across regions and informing differentiated policy design.
3. Results
3.1. Spatiotemporal Evolution of CLUE in Chinese Cities
The CLUE in Chinese cities exhibits pronounced spatiotemporal differentiation (Figure 2). Spatially, the overall distribution from 2013 to 2021 largely corresponds with the nine major agricultural regions. High-efficiency areas are concentrated in the Northeast Plain, South China, and the middle and lower reaches of the Yangtze River, benefiting from favorable soil and topographic conditions as well as relatively high grain productivity.
Figure 2.
Distribution map of CLUE in various prefecture-level cities.
Medium-efficiency areas are scattered across the Sichuan Basin, Huang-Huai-Hai Plain, and parts of the middle and lower Yangtze regions, including cities such as Huanggang, Yongzhou, and Anqing, etc. These areas are constrained by mountainous and hilly terrain as well as water and heat conditions, leading to highly fragmented farmland and relatively low levels of mechanization and scale farming. Cities such as Zhengzhou and Weifang, etc., as major grain production centers, face environmental pressures—including soil degradation, water scarcity, and non-point source pollution—arising from intensive cultivation, which limits improvements in ecological efficiency.
Low-efficiency areas are primarily located in Xinjiang, Qinghai, and Gansu, etc., where adverse climatic conditions, poor soil quality, and economic underdevelopment constrain CLUE. Additionally, sporadic low-efficiency zones appear in Zhejiang, Guangdong, and Fujian, reflecting the neglect of agricultural and ecological protection during the industrialization process.
From a temporal perspective, the national average CLUE in Chinese cities declined from 0.550 in 2013 to 0.409 in 2021. This trend reflects a transformation in farmland use from labor-intensive to mechanized practices amid urbanization. While mechanization has improved expected outputs, it has simultaneously increased unexpected outputs, such as carbon emissions, placing additional pressure on the ecological environment.
Between 2013 and 2017, most cities maintained stable or slightly increasing efficiency levels, including Suzhou, Nanjing, Jixi, and Shuangyashan, etc. This pattern illustrates a positive interaction between agricultural modernization and ecological conservation, highlighting the benefits of scale effects. However, after 2017, particularly from 2019 to 2021, a marked decline in CLUE was observed in the majority of cities. High-efficiency areas such as Shenzhen, Nanjing, and Suzhou, etc., experienced significant decreases, likely due to the combined effects of inefficient land use, rapid urbanization, and carbon emissions from intensive agricultural practices exceeding gains from technological and managerial improvements. Cities that were already low-efficiency, such as Shaoyang and Xingtai, etc., experienced further declines, possibly constrained by industrial restructuring that reduced space for agricultural development. Conversely, some regions, including Guizhou and Gansu, etc., exhibited improved efficiency, potentially benefiting from enhanced agricultural mechanization, intensification, and coordinated approaches to land use and ecological protection.
3.2. Overall Network Characteristics of CLUE in Chinese Cities
Based on the constructed spatial association matrix, the results are presented in Figure 3. This study examines the evolution of the national and regional CLUE networks across four dimensions: network density, number of ties, hierarchy, and efficiency. Overall, the network of cultivated land use ecological efficiency exhibits relatively weak connectivity but high efficiency, with a gradually flattening hierarchical structure and enhanced interregional collaboration. Certain regions display significant temporal variations, suggesting potential effects of policy interventions and regional cooperation.
Figure 3.
The global spatial autocorrelation index of CLUE.
First, at the national level, network efficiency remains consistently high. National efficiency was 0.803 in 2013, 0.801 in 2015, 0.837 in 2017, 0.844 in 2019, and 0.831 in 2021, all above 0.80, indicating efficient and robust information transmission at the national level. Regionally, all nine regions range between 0.65 and 0.82, and network efficiency across regions remains relatively stable and relatively high, indicating effective transmission of information and resources within the network. Interactions between cities are convenient, and the network demonstrates overall stability. This feature coexists with low network density and a decline in average degree, which may appear contradictory but is in fact reasonable. A sparse yet efficient network can consist of several “small-world” clusters, where internal connections are direct and cross-cluster links, though few, are strategically important. Future policies should aim to strengthen connections across weak interregional links (e.g., between the Qinghai–Tibet Plateau and the eastern plains) in order to enhance overall network density while maintaining high efficiency.
Second, the network density is the ratio of actual ties to the maximum possible ties, and higher density implies closer interdependence of CLUE among regions. At the national level, network density remains relatively low with some fluctuations. National density increased slightly from 0.134 in 2013 to 0.138 in 2015 then dropped to 0.088 in 2017 and 0.084 in 2019 and rose back to 0.091 in 2021, always staying below 0.14. The network density across nine major agricultural regions remains below 0.30, indicating that CLUE has yet to form a highly connected network and leaving substantial room for optimization. The Huang-Huai-Hai Plain and the Loess Plateau regions show relatively higher densities, whereas the Sichuan Basin and surrounding areas, along with the Qinghai–Tibet Plateau, display the most pronounced temporal fluctuations. The increasing density from 2013 to 2021 may be associated with strategic policies such as the National Western Development initiative, which strengthened intercity connections and facilitated the cross-regional flow of resources, labor, and other factors.
Third, at the national level, the number of ties is large but first increased and then decreased. The actual number of national ties rose from 16,607 in 2013 to 17,081 in 2015, then fell sharply to 10,955 in 2017, 10,521 in 2019, and recovered to 11,355 in 2021. However, compared to the theoretical maximum number of ties, n(n − 1), there remains a substantial gap, reflecting relatively low overall ecological efficiency and indicating that the network structure requires further improvement. Regionally, the Middle and Lower Yangtze Plain has the highest and steadily increasing number of ties, it indicated these areas has established dense CLUE linkages with surrounding cities; followed by the Huang-Huai-Hai Plain and the Northern Arid and Semi-Arid Region. By contrast, the Qinghai–Tibet Plateau (44–58 ties) and Loess Plateau (82–101 ties) have very few ties, belonging to the periphery with weak spillover effects of ecological efficiency.
Finally, at the national level, network hierarchy remains extremely low. National hierarchy was 0.006 in 2013, 0 in 2015, 0.006 in 2017, and 0.011 in both 2019 and 2021, indicating no rigid hierarchical dominance at the national level and a clear flattening trend. Regionally, network hierarchy is higher in the Qinghai–Tibet Plateau and South China (approximately 0.5), yet most regions show a declining trend. This suggests a decrease in the concentration of power and resources within the network, intensified competition among prefecture-level cities, and a flattening of the hierarchical structure. The network is becoming more dispersed, lacking tightly connected cohesive subgroups, which accelerates the flow of factors and aligns with the observed increase in the number of ties.
Based on the spatial network analysis of CLUE constructed using Gephi-0.11.2 (Figure 4), China’s CLUE network has transcended geographic proximity constraints, forming a complex and dynamically evolving structure. Overall, the network exhibits spatial characteristics of “multi-core, hierarchical, and cross-regional linkages”, with network connectivity strengthening over time.
Figure 4.
Spatial correlation network of CLUE based on agricultural zoning. Note: Going from red to blue shows that centrality is increasing. For the abbreviations in the figure, see Appendix A.
Specifically, the Northern Arid and Semi-Arid Region, the Loess Plateau, and the Qinghai–Tibet Plateau display a clear transition from single-core or dual-core structures to multi-centered configurations. The number of core cities has increased, while peripheral cities have gradually integrated into the network, reflecting the positive effects of ecological construction and regional collaboration. In the Northeast Plain and the Sichuan Basin and surrounding areas, the hierarchical positions of core cities have fluctuated significantly, likely due to the introduction of technology, the expansion of large-scale farming, and the rapid development of emerging core cities, which enhanced the influence of existing core nodes.
The Huang-Huai-Hai Plain and the Middle and Lower Yangtze River regions exhibit the densest network structures, with evenly distributed core cities and strong interregional linkages, forming high-density, multi-level networks. In South China, a multi-city collaborative network centered on Shenzhen has emerged, exemplifying coordinated development within the Pearl River Delta. In the Yunnan–Guizhou Plateau, the core city focus has shifted toward Guizhou, while previously central nodes have declined in network prominence due to ecological pressures.
3.3. Individual Network Characteristics of CLUE in Chinese Cities
The individual network characteristics of CLUE for each region from 2013 to 2021 were calculated, with results summarized. Overall, there are significant differences in influence, control, and accessibility among regions within the network. Over time, structural adjustments are evident: the connectivity of some traditional agricultural regions has declined, while the influence of cities in the western and southern regions has increased. These patterns suggest that China’s collaborative network of cultivated land use ecological efficiency is transitioning from a “core–periphery” structure toward a multi-polar linkage system.
Indegree and outdegree are used to reflect the extent to which a node is influenced by other nodes and the extent to which it influences others, respectively. Based on the dynamic analysis from 2013 to 2021 (Figure 5), cities in the Yangtze River Delta, such as Shanghai, Suzhou, Nanjing, and Wuxi, etc., consistently exhibit high indegree and outdegree values, indicating that they simultaneously enjoy significant benefits from other cities while exerting strong spillover effects, maintaining a core and dominant position within the network. In contrast, cities in central and western regions or remote areas, such as Huanggang, Huaihua, and the Ali Prefecture. Etc., have remained at the network periphery for an extended period, with some cities showing near-zero outdegree, reflecting a clear pattern of unidirectional dependency. Some cities have experienced notable shifts in network roles over time. Shenzhen, for example, transitioned from an early stage characterized by high indegree and low outdegree to a node that is actively involved in both directions, demonstrating a shift from being a “net beneficiary” to a “net contributor”. Zhoushan, which initially had a high outdegree in 2013, has seen a gradual decline over the years, reflecting adjustments in its regional functional positioning. Conversely, cities such as Yulin and Chengdu have exhibited continuously increasing indegree values, indicating a growing capacity to aggregate resources and strengthen their roles as regional centers.
Figure 5.
Distribution of indegree and outdegree of individual network nodes based on agricultural zoning.
Degree centrality reflects a region’s direct influence within the network, the specific results are shown in Table 3. At the national level, the mean degree centrality decreased slightly from 20.08 in 2013 to 17.35 in 2021, indicating a reduction in the number of connections per node and a trend toward a more dispersed network structure. The data show diverging trends across regions. The Sichuan Basin experienced a notable increase to 35.49 in 2021, reflecting a significant enhancement of its control within the network, likely driven by population concentration and agricultural demand. The Northern Arid and Semi-Arid Region and South China exhibited a “rise-then-fall” pattern, reaching a peak in 2017 before declining, suggesting that the marginal benefits of early resource investments gradually diminished. In contrast, the Northeast Plain, Huang-Huai-Hai Plain, and Loess Plateau experienced continuous contraction in connectivity due to black soil degradation, urban expansion, and the implementation of the “returning farmland to forest” policy, intensifying interregional competition. Degree centrality in the Qinghai–Tibet Plateau, Yunnan–Guizhou Plateau, and the Middle and Lower Yangtze River regions steadily increased over time. The latter, benefiting from agricultural modernization and economic advantages, has gradually become a network core, reflecting a clear resource aggregation effect.
Table 3.
The results of the degree centrality index of CLUE.
Betweenness centrality measures a region’s ability to control the flow of resources within the network, the specific results are shown in Table 4. Higher betweenness centrality indicates stronger control over information or resource transfers between other regions, but excessively high values may also turn the region into a potential bottleneck. At the national level, China’s betweenness centrality remained extremely low (all below 0.24), stable and far below regional values. This indicates that no node has significant intermediary control at the national level; resource flow paths are highly diversified, and no single region can monopolize cross-regional factor flows. Regionally, the South China region and the Huang-Huai-Hai Plain have exhibited a long-term upward trend, indicating strong control over interregional factor flows, though they may also act as potential bottlenecks within the network. In contrast, the Northern Arid and Semi-Arid Region and the Northeast Plain have maintained relatively low and stable betweenness centrality values, reflecting limited intermediary functions. The Loess Plateau, Qinghai–Tibet Plateau, Sichuan Basin, and Yunnan–Guizhou Plateau show declining betweenness centrality over time, suggesting a weakening of their bridging roles, possibly due to resource constraints and regional policy implementation differences. The Middle and Lower Yangtze River region, with balanced multi-centered internal development, demonstrates a more dispersed intermediary function, reflecting a decentralized network structure.
Table 4.
The results of the betweenness index of CLUE.
Closeness centrality reflects the ease with which a region can access information and resources within the network, the specific results are shown in Table 5. Higher closeness centrality means the region can quickly reach others without excessive control by intermediate nodes. At the national level, China’s closeness centrality continues to decline from 55.959 in 2013 to 55.114 in 2021, showing a slow downward trend overall, indicating that average information transmission efficiency across regions has declined and network accessibility has weakened. At the regional level, the Loess Plateau, Yunnan–Guizhou Plateau, and the Middle and Lower Yangtze River regions exhibit an overall upward trend, indicating improved connectivity and efficiency in interactions with other regions, likely driven by ecological governance and the promotion of irrigated agriculture. The Sichuan Basin and the Qinghai–Tibet Plateau show slight increases amid fluctuations, suggesting that their core positions within the network have strengthened, though they remain susceptible to external environmental influences. In contrast, the Northern Arid and Semi-Arid Region, South China, and the Huang-Huai-Hai Plain display declining closeness centrality, indicating reduced overall influence, increased regional independence, and potential impacts from resource constraints and policy regulation.
Table 5.
The results of the closeness index of CLUE.
3.4. Driving Pathways of Non-High CLUE in Chinese Cities
The configurational analysis results for non-high CLUE across regions are presented in Table 6. At the national level, four configurational pathways leading to non-high efficiency are identified, while the number of pathways across agricultural regions ranges from one to four. The individual consistency and overall consistency of all pathways exceed 0.75, indicating strong explanatory power for regional case samples. Based on the combinations of core conditions, these pathways can be classified into four typical types: the Network Marginalization Pathway, the Over-Connected Pathway, the Local Hub Pathway, and the Central Failure Pathway.
Table 6.
Configuration analysis results of non-high-level CLUE in various regions.
The Network Marginalization Pathway is characterized by non-provincial capital cities simultaneously lacking closeness centrality or degree centrality. Its defining feature is weak network connectivity, which constrains access to information and resources and limits the ability to benefit from external knowledge spillovers and technological diffusion, thereby placing the city at the edge of the network in the observed efficiency results. Representative pathways include National P1 and P2, Northern Region N1 and N3, Northeast Plain NE1, and Yangtze River Region YR1 and YR2. The consistency of this pathway ranges from 0.78 to 0.88, with generally high coverage values (0.68–0.73), indicating that network marginalization is a commonly associated configuration feature with non-high CLUE.
The Over-Connected Pathway is characterized by the coexistence of high degree centrality and low betweenness centrality. Cities under this pathway maintain dense direct connections yet lack effective control over information and resource flows. Consequently, extensive connections fail to translate into actual intermediary functions, instead generating redundant investment and homogeneous competition. Representative pathways include National P3, South China S1, Sichuan Basin SC1 and SC3, Yunnan–Guizhou Plateau YG1, and Northeast Plain NE3. The consistency of this pathway ranges from 0.86 to 0.93, while coverage ranges from 0.54 to 0.70, suggesting that in economically developed or highly connected regions, the imbalance between extensive connectivity and insufficient intermediary capacity is relatively common in non-high CLUE cases.
The Local Hub Pathway is characterized by the combination of high betweenness centrality with low degree centrality and low closeness centrality. Cities following this pathway function as important bridges within local subnetworks yet maintain relatively few overall connections and remain distant from the network core, limiting the diffusion of local advantages to the broader system. Representative pathways include National P4, Huang-Huai-Hai Plain HH1, and Qinghai–Tibet Plateau Q2. The consistency of this pathway ranges from 0.83 to 0.92, with moderate coverage values (0.48–0.62). This finding suggests that in regions with pronounced topographic barriers, fragmented network structures are often related to the fact that being in an intermediary position does not necessarily improve overall ecological efficiency.
The Central Failure Pathway is characterized by the coexistence of provincial capital status with low closeness centrality or low betweenness centrality. Although these regional central cities possess administrative advantages, geographical barriers or insufficient network coordination capacity hinder their ability to generate effective spillover effects to surrounding areas, resulting in either isolated or overloaded central nodes. Representative pathways include Loess Plateau LP1, Yunnan–Guizhou Plateau YG3, and Qinghai–Tibet Plateau Q3. This pathway exhibits the highest consistency (0.86–1.00) but relatively low coverage (0.03–0.56), indicating that central failure is not a universal phenomenon but rather a region-specific mechanism shaped by the unique geographical conditions of areas such as the Loess Plateau and Yunnan–Guizhou Plateau, requiring context-specific identification and policy responses.
4. Discussion
4.1. Discussion of the Results
4.1.1. Analysis of Spatially Associated Network Characteristic
This study reveals that the spatial association network of CLUE across China has generally exhibited a low-density configuration. Crucially, the national network density remains relatively lower than that within most individual agricultural regions. This finding suggests the pervasive assumption in the existing spatial econometric literature that regional efficiency disparities spontaneously trigger significant spatial spillovers. Instead, our SNA indicates that the coexistence of high- and low-efficiency regions does not necessarily imply robust cross-regional linkages; rather, empirical inter-regional connections appear to remain fragile and fragmented. Although He et al. [36] reported a similarly low network density for CLUE in the Upper Yangtze River Basin—suggesting that a loose network structure may represent a common vulnerability across China’s major agricultural zones—this study further shows that the national network’s looseness is generally greater than that of intra-regional networks. This disparity may indicate that administrative boundaries and geographic barriers exert relatively stronger constraint on cross-regional efficiency flows than previously acknowledged. Furthermore, this constraint appears to exhibit scale dependence: it is less evident at the provincial or urban agglomeration scale and becomes more apparent at the national, prefecture-level city scale. This structural characteristic across scales is broadly consistent with the findings of Wang and Wang [38] within the Changchun metropolitan area, providing additional evidence for low network stability and high hierarchy in diverse regional contexts.
Regarding egocentric network characteristics, we identify a systematic mismatch among degree, betweenness, and closeness centralities across different agricultural regions. This insight complements and extends traditional exploratory spatial data analysis (ESDA) approaches [22], which excel at identifying high-value efficiency clusters but may be less effective in capturing the heterogeneous roles nodes play within a network. Our egocentric network analysis suggests that regions with elevated degree centrality (e.g., the Huang-Huai-Hai Plain and the Northeast Plain) possess dense direct contacts; however, their lower betweenness centrality may indicate limited capacity to coordinate or mediate these connections, potentially resulting in parallel redundancies rather than efficient synergies. Conversely, regions characterized by high betweenness but low closeness centrality (e.g., the Qinghai–Tibet Plateau) may suggest that while a few nodes function as local bridges, geographic friction could constrain their ability to extend this intermediary advantage globally. Such multi-dimensional centrality decoupling has received relatively limited attention in the previous SNA literature, and this study offers an additional perspective for distinguishing more influential network nodes from peripheral ones.
The regional divergence between network hierarchy and network efficiency constitutes another notable finding. In carbon emission networks, prior research, e.g., Liu et al. [60], observed that a reduction in network hierarchy to zero was associated with improved network accessibility. In stark contrast, our findings suggest a different pattern: the Huang-Huai-Hai Plain exhibits a hierarchy of zero, yet its network efficiency remains relatively low. This may imply that, within the CLUE network, a flattened structure does not necessarily correspond to high efficiency. If parallel linkages lack the information integration and regulatory functions typically provided by intermediary nodes, they may be associated with homogeneous competition and resource redundancy. Hence, structural optimization in agricultural production may benefit from moving beyond a simplistic pursuit of “de-layering” and placing greater emphasis on the development of intermediary hubs. Additionally, the persistently high network hierarchy in South China and the Sichuan Basin differs from the “dual-core to multi-polar” evolution observed in urban carbon emission networks [60], which may indicate that the network evolution of CLUE networks follows a distinct developmental trajectory or progresses at a different pace.
4.1.2. Analysis of Network Structural Archetypes
The theoretical significance of the four network structural archetypes identified in this study—namely, the Network-Peripheral Type, Over-Connected Type, Localized-Hub Type, and Center-Malfunctioned Type—lies in their capacity to help characterize node role differentiation and structural constraints within the spatial association network of cultivated land use eco-efficiency (CLUE). Distinct from the existing literature that predominantly focuses on overall network density or isolated centrality metrics, this study employs a multidimensional centrality bundling framework. By doing so, we identify the specific structural bottlenecks hindering different regions, thereby offering an additional analytical perspective for understanding regional agricultural spatial governance.
The Network Marginalization Pathway (represented by the Northern Arid/Semi-Arid Region and the Yunnan–Guizhou Plateau) is characterized by a “dual-low” configuration of degree and closeness centralities. This archetype demonstrates that the primary barrier to efficiency gains in peripheral zones may be related to limited integration into core network channels rather than being solely attributable to local resource endowments or input levels. Consequently, policy recommendations from previous studies [22] advocating a simplistic transition from “Low-Low clusters to High-High clusters” may benefit from considering an additional prerequisite: unless the degree and closeness centralities of peripheral nodes are preferentially enhanced, external technological spillover may be less likely to be effectively incorporated into the broader network.
The Over-Connected Pathway (represented by the Huang-Huai-Hai Plain) exhibits high network density and degree centrality alongside depressed betweenness centrality and network efficiency. This finding suggests that the commonly held assumption that “higher network density inherently denotes superior performance may not always apply in the context of CLUE networks”. While conventional SNA studies often conflate high density with network maturity, our results indicate that in the absence of regulatory intermediary nodes, excessive density may be accompanied by redundant linkages and homogeneous competition—a phenomenon we term the “over-connectivity trap”. This aligns with Fang et al. [61], who argued in their study of national high-tech zones that connectivity quantity does not equate to connectivity quality, suggesting that agricultural networks are equally susceptible to stability risks induced by redundant connections.
The Local Hub Pathway (represented by the Qinghai–Tibet Plateau and the Loess Plateau) features elevated betweenness centrality coupled with low closeness centrality. The value of this archetype lies in its ability to distinguish between “localized intermediation” and “global intermediation”. While Hu et al. [30] demonstrated at the micro-farmer scale how operational scale mitigates land fragmentation, our study extends this discussion to the inter-city macro-network level. We suggest that nodes performing intermediary functions locally do not automatically trigger global spillovers. Consequently, even if a robust internal coordination mechanism is established within localized hubs, these local advantages may not readily translate into systemic efficiency gains if channels connecting them to extra-regional core networks remain blocked.
The Central Failure Pathway (represented by South China and the Sichuan Basin) is characterized by high network hierarchy but low closeness centrality, typically dominated by provincial capitals. This archetype differs from the “single-center radiation” structure observed by Wang and Wang [38] in the Changchun metropolitan area. While their study validates the outward radiation of core cities, our national-scale analysis suggests that when the spatial scope expands nationally, administrative hierarchy premiums do not spontaneously convert into network power. Severe geographic friction (e.g., the mountainous topography surrounding basins) or weak industrial linkages may contribute to situations in which administrative centers decouple into “structural islands”, whose empirical closeness and betweenness centralities fall drastically short of their predetermined administrative status. This divergence highlights the possibility that network regularities observed at the metropolitan scale cannot be simplistically extrapolated to the national scale; the radiative capacity of regional centers may need to be assessed through empirical network metrics rather than administrative mandates.
Synthetically, the four network structural archetypes identified herein suggest that the spatial stratification of CLUE is not merely a deterministic outcome of regional resource endowments or economic affluence. Rather, it may also be related to the structural positions and functional roles regions occupy within the network. Compared with traditional linear regression models that capture only the average effects of isolated variables, this study provides additional insights into structural heterogeneity from a network configuration perspective, thereby offering a complementary framework for understanding spatial differences in China’s green agricultural development.
4.2. Policy Implications
The above research offers the following insights for enhancing CLUE at the prefecture-level administrative units in China:
Targeted management in core regions: In core areas such as the Huang-Huai-Hai Plain and the middle and lower Yangtze River region, implement differentiated controls on fertilizer and pesticide intensity, setting emission reduction targets based on network density and redundancy of connections. In the Northeast Plain, promote conservation tillage to reduce the loss of black soil. On the Loess Plateau, expand organic agriculture demonstration projects, guide ecological recycling practices through technological subsidies, and establish agricultural film recycling mechanisms to facilitate resource recovery from agricultural waste. In addition to environmental management measures, policy efforts in core agricultural regions should place greater emphasis on improving network quality rather than simply expanding network scale. For regions characterized by the over-connected pathway, priority should be given to reducing redundant intercity linkages and strengthening the coordinating role of intermediary cities within the network. For over-connected pathway regions, reduce inefficient parallel investments and cultivate intermediary cities (e.g., Xuzhou, Shangqiu) to assume cross-city functions such as machinery scheduling, centralized fertilizer procurement, and carbon trading. This may help improve information integration and resource allocation efficiency within the network, shifting attention from simply increasing the number of connections to enhancing intermediary coordination and governance capacity.
Cross-regional technology diffusion and network integration: Leverage core regions such as the Yangtze River Delta to establish stable cross-regional technology diffusion channels and collaborative innovation mechanisms, promoting the transfer of low-carbon agricultural technologies from high-efficiency cores to peripheral areas. For peripheral regions like the Qinghai–Tibet Plateau and the Yunnan–Guizhou Plateau, improve ecological compensation mechanisms, incorporating carbon sequestration into compensation standards to enhance network accessibility and overcome geographic constraints on intermediary functions. In emerging core regions such as the Sichuan Basin, establish demonstration zones to optimize factor allocation and alleviate issues of central isolation or functional overload in provincial capitals. For regions characterized by the Local Hub and Central Failure pathways, improving physical connectivity alone may be insufficient. Equal attention should be paid to strengthening institutional linkages and information-sharing mechanisms among cities. For local hub pathway and central failure pathway regions, increase investment in transportation infrastructure to reduce spatiotemporal distance between hub cities and high-efficiency cores; encourage hub cities to establish technical collaborations with external universities and research institutes and participate in interregional agricultural innovation alliances, thereby enhancing their ability to access and disseminate external knowledge resources, introducing external knowledge and diffusing it to surrounding areas through intermediary functions. Simultaneously, reduce one-way administrative dependence on provincial capitals and develop market-based intercity agricultural cooperation platforms to facilitate regular exchanges of agricultural technologies, ecological governance experiences, and green production resources across administrative boundaries. such as provincial-level agricultural big data sharing systems or cropland protection compensation funds, enabling provincial capitals to transition from managers to service providers and coordinators.
Strengthening peripheral networks: For network marginalization pathway regions, priority should be given to improving the network position of non-capital cities by enhancing their connectivity, accessibility, and capacity to absorb external knowledge and technologies, prioritizing the establishment of basic conditions for access to the core network. This can be achieved by setting up regional agricultural technology transfer centers, cross-regional extension networks, and digital agricultural service platforms to strengthen linkages between peripheral cities and high-efficiency regions in the Huang-Huai-Hai Plain or middle and lower Yangtze River region, introducing mature technologies such as water-saving irrigation and soil-testing-based fertilization, thereby improving the ability of peripheral cities to participate in broader network spillover processes and benefit from interregional knowledge exchange. Alongside improvements in network connectivity, region-specific ecological management measures should continue to be implemented according to local resource and environmental conditions. In the arid and semi-arid northern regions, invest in water infrastructure and promote drought-tolerant crop varieties. In the Yunnan–Guizhou Plateau, develop terrace farming and specialty cash crops adapted to local topography, gradually reducing reliance on high-input, high-pollution production models.
More broadly, the findings suggest that policies aimed at improving CLUE should move beyond conventional resource-based management and incorporate a network-governance perspective. Given that different regions occupy distinct positions within the spatial association network and face different structural constraints, policy interventions should be differentiated according to network roles. In particular, efforts should simultaneously promote network connectivity, intermediary coordination capacity, and cross-regional knowledge diffusion, thereby enhancing the overall resilience and effectiveness of the CLUE network.
4.3. Limitations and Future Work
This study examines the spatial network characteristics of 353 prefecture-level cities in China and explores configurations associated with suboptimal efficiency. But the following shortcomings still exist:
(1) The analysis of urban network structure reveals a relatively low average clustering coefficient, indicating an absence of pronounced “small-world” properties. Accordingly, small-world scenarios were not considered, limiting this study’s capacity to capture more nuanced patterns of spatial interaction. While this choice reflects a cautious interpretation of the empirical data, it also highlights the potential for deeper investigation into specific propagation dynamics within local clusters.
(2) Due to the scale and complexity of the macro-level data, this study did not employ methods such as QAP regression to disentangle the specific “natural–social–economic” factors shaping spatial associations. Consequently, micro-level mechanisms underpinning efficiency improvements, including technical pathways and policy instruments, remain unexplored. Future research could identify relevant influencing factors based on theoretically grounded analyses of spatial association mechanisms and attempt to generalize replicable elements across regions, thereby informing strategies for cross-regional collaborative efficiency enhancement.
(3) Since this study employs multi-year cross-sectional data, fsQCA identifies stable network structure patterns and associations with non-high CLUE rather than strict causal relationships. As a result, the findings should be interpreted as descriptive of typical configurational characteristics across regions rather than causal mechanisms. Future research could adopt dynamic social network analysis or panel QCA approaches to examine temporal changes in network structures and further validate the stability and generalizability of the observed configurational patterns.
5. Conclusions
This study empirically applies the CLUE evaluation framework and employs a combination of the slacks-based measurement (SBM)-undesirable models, gravity models, social network analysis, and fuzzy-set qualitative comparative analysis to measure the efficiency of 353 prefecture-level cities. It further examines the spatial association network structure of CLUE and identifies the driving paths of suboptimal efficiency. Based on the analysis, this study draws the following major conclusions:
(1) The CLUE is at a moderate level, exhibiting a spatial pattern of “high in the east, low in the west; superior in the north, dispersed in the south”, which largely aligns with the nine major agricultural zones in China. Under carbon emission constraints, overall efficiency declines, reflecting persistent tensions between arable land utilization and ecological protection, indicating that coordination has not yet been fully achieved.
(2) The efficiency spatial network demonstrates characteristics of high efficiency and structural flattening, with regional collaboration extending beyond geographic limitations. The network structure is transitioning from a “core–periphery” configuration toward a “multi-core, interconnected” model. Cities within the Yangtze River Delta continue to dominate in terms of influence and control, while western and southern regions exhibit significantly improved accessibility to information and resources.
(3) The configurational paths of low ecological efficiency in arable land use are notably heterogeneous. The peripheral network type is the most prevalent, encompassing most non-capital cities. The over-connected type is concentrated in economically dense areas, whereas the local hub and central failure types are constrained by specific geographic conditions, necessitating targeted, differentiated policy interventions.
Author Contributions
Y.Z. collected and analyzed the data and wrote most of the manuscript; C.X. and J.Z. provided the research direction and conception for the research; J.Z. and J.Y. provided advice and check the manuscript. All authors have read and agreed to the published version of the manuscript.
Funding
This study was supported by the National Natural Science Foundation of China, grant number 42571314 and 42361039 and Provincial Natural Science Foundation of Hainan, grant number 725MS059) and the Provincial Natural Science Foundation of Hubei, China, grant number 2023AFB651.
Data Availability Statement
The data presented in this study are available on request from the first author.
Conflicts of Interest
The authors declare no conflicts of interest.
References
- Duro, J.A.; Lauk, C.; Kastner, T.; Erb, K.H.; Haberl, H. Global inequalities in food consumption, cropland demand and land-use efficiency: A decomposition analysis. Glob. Environ. Change-Hum. Policy Dimens. 2020, 64, 102124. [Google Scholar] [CrossRef] [Scilit]
- Viana, C.M.; Freire, D.; Abrantes, P.; Rocha, J.; Pereira, P. Agricultural land systems importance for supporting food security and sustainable development goals: A systematic review. Sci. Total Environ. 2022, 806, 150718. [Google Scholar] [CrossRef] [Scilit]
- Fan, M.S.; Shen, J.B.; Yuan, L.X.; Jiang, R.F.; Chen, X.P.; Davies, W.J.; Zhang, F.S. Improving crop productivity and resource use efficiency to ensure food security and environmental quality in China. J. Exp. Bot. 2012, 63, 13–24. [Google Scholar] [CrossRef] [Scilit]
- Cao, W.; Zhou, W.; Wu, T.; Wang, X.C.; Xu, J.H. Spatial-temporal characteristics of cultivated land use eco-efficiency under carbon constraints and its relationship with landscape pattern dynamics. Ecol. Indic. 2022, 141, 109140. [Google Scholar] [CrossRef] [Scilit]
- Zhou, Y.; Yang, Z. Temporal and spatial characteristics of China’s provincial green total factor productivity of grains from the ecological value perspective. Chin. J. Eco-Agric. 2021, 29, 1786–1799. [Google Scholar]
- Cui, H.; Wang, B.; Zhou, M. Spatiotemporal evolution and driving factors of China’s agricultural carbon emissions. Chin. J. Eco-Agric. 2024, 32, 1097–1108. [Google Scholar]
- Yang, J.H.; Ma, R.; Yang, L. Spatio-temporal evolution and its policy influencing factors of agricultural land-use efficiency under carbon emission constraint in mainland China. Heliyon 2024, 10, e25816. [Google Scholar] [CrossRef] [Scilit]
- Zhang, K.C.; Tian, Y. Research on the spatio-temporal coupling relationship between agricultural green development efficiency and food security system in China. Heliyon 2024, 10, e31893. [Google Scholar] [CrossRef] [Scilit]
- Kuang, B.; Lu, X.H.; Zhou, M.; Chen, D.L. Provincial cultivated land use efficiency in China: Empirical analysis based on the SBM-DEA model with carbon emissions considered. Technol. Forecast. Soc. Change 2020, 151, 119874. [Google Scholar] [CrossRef] [Scilit]
- Xie, H.L.; Chen, Q.R.; Wang, W.; He, Y.F. Analyzing the green efficiency of arable land use in China. Technol. Forecast. Soc. Change 2018, 133, 15–28. [Google Scholar] [CrossRef] [Scilit]
- Lu, X.; Qu, Y.; Sun, P.L.; Yu, W.; Peng, W.L. Green Transition of Cultivated Land Use in the Yellow River Basin: A Perspective of Green Utilization Efficiency Evaluation. Land 2020, 9, 475. [Google Scholar] [CrossRef] [Scilit]
- Gai, Z.; Wang, Z.; Zhao, Y. Eco-efficiency and zoning of cultivated land use in three northeast provinces from perspective of low carbon. Southwest China J. Agric. Sci. 2024, 37, 622–632. [Google Scholar]
- Fan, S.B.; Lin, H.Y.; Luo, N.; Sima, H.; Liu, Y.P. Spatial temporal trends and inequality in agricultural eco-efficiency under carbon constraints in China. Sci. Rep. 2025, 15, 21557. [Google Scholar] [CrossRef] [Scilit]
- Liu, Q.; Qiao, J.J.; Han, D.; Li, M.J.; Shi, L.X. Spatiotemporal Evolution of Cultivated Land Use Eco-Efficiency and Its Dynamic Relationship with Landscape Pattern Change from the Perspective of Carbon Effect: A Case Study of Henan, China. Agriculture 2023, 13, 1350. [Google Scholar] [CrossRef] [Scilit]
- Liu, C.Y. Spatiotemporal evolution and influencing factors of coordinated development between cultivated land use eco-efficiency and new-type urbanization: Insights from Henan Province, China. Front. Environ. Sci. 2025, 13, 1633927. [Google Scholar] [CrossRef] [Scilit]
- Zeng, K.; Duan, X.; Chen, B.; Jia, L.X. Spatiotemporal Heterogeneity of Eco-Efficiency of Cultivated Land Use and Its Influencing Factors: Evidence from the Yangtze River Economic Belt, China. Sustainability 2025, 17, 3070. [Google Scholar] [CrossRef] [Scilit]
- Yang, B.; Wang, Y.; Li, Y.; Mo, L.Z. Empirical Investigation of Cultivated Land Green Use Efficiency and Influencing Factors in China, 2000–2020. Land 2023, 12, 1589. [Google Scholar] [CrossRef] [Scilit]
- Den, X.Z.; Gibson, O. Sustainable land use management for improving land eco-efficiency: A case study of Hebei, China. Ann. Oper. Res. 2020, 290, 265–277. [Google Scholar] [CrossRef] [Scilit]
- Peng, J.C.; Wen, L.; Fu, L.N.; Yi, M. Total factor productivity of cultivated land use in China under environmental constraints: Temporal and spatial variations and their influencing factors. Environ. Sci. Pollut. Res. 2020, 27, 18443–18462. [Google Scholar] [CrossRef] [Scilit]
- Ma, L.; Zhang, R.; Pan, Z.; Wei, F. Analysis of the Evolution and Influencing Factors of Temporal and Spatial Pattern of Eco-efficiency of Cultivated Land Use among Provinces in China: Based on Panel Data from 2000 to 2019. China Land Sci. 2022, 36, 74–85. [Google Scholar]
- Wang, S.X.; Jiang, H.L.; Li, R.; Yu, H.L.; Sun, X.H.; Feng, X.H. Research on the Coupling and Coordinated Evolution of Cultivated Land Use Efficiency and Ecological Safety: A Case Study of Jilin Province (2000–2023). Agriculture 2025, 16, 94. [Google Scholar] [CrossRef] [Scilit]
- Fan, Y.T.; Ning, W.J.; Liang, X.Y.; Wang, L.Z.; Lv, L.G.; Li, Y.; Wang, J.X. Spatial-Temporal Characteristics and Influencing Factors of Eco-Efficiency of Cultivated Land Use in the Yangtze River Delta Region. Land 2024, 13, 219. [Google Scholar] [CrossRef] [Scilit]
- Feng, L.; Lei, G.P.; Nie, Y. Exploring the eco-efficiency of cultivated land utilization and its influencing factors in black soil region of Northeast China under the goal of reducing non-point pollution and net carbon emission. Environ. Earth Sci. 2023, 82, 94. [Google Scholar] [CrossRef] [Scilit]
- Han, X.; Liu, Y. Spatial-temporal Evolution and Influencing Factors of Green Utilization Efficiency of Cultivated Land in Lower Liaohe Plain. J. Shenyang Agric. Univ. 2025, 56, 156–165. [Google Scholar]
- Tian, T.; Yang, J.W.; Zheng, N.; Tang, J.Q. Spatiotemporal evolution characteristics and influencing factors of eco-efficiency of cultivated land use in southern mountainous regions of China. Front. Sustain. Food Syst. 2026, 9, 1760810. [Google Scholar] [CrossRef] [Scilit]
- Lyu, T.; Fu, S.; Hu, H.; Geng, C. Spatiotemporal Differentiation Characteristics and Spatial Effects of Ecological Efficiency of Cultivated Land Use Based on the Constraints of Agricultural Green Transformation. Res. Soil Water Conserv. 2024, 31, 269–279+289. [Google Scholar]
- Zang, J.; Tang, C.; Wang, Q.; Li, K.; Li, L. Research on Spatial Imbalance and Influencing Factors of Cultivated Land Use Efficiency in Guangdong Province Based on Super-SBM Model. China Land Sci. 2021, 35, 64–74. [Google Scholar]
- Yu, H.; Wei, Y.Z. Measurement, Dynamic Evolution, and Spatial Convergence of the Efficiency of the Green and Low-Carbon Utilization of Cultivated Land Under the Goal of Food and Ecological “Double Security”: Empirical Evidence from the Huaihe River Ecological Economic Belt of China. Sustainability 2025, 17, 7242. [Google Scholar] [CrossRef] [Scilit]
- Zhang, Z.; Zhang, D.; Chen, L.; Gong, Z.; Zhang, Q. Coupling coordination evaluation, spatiotemporal characteristics and driving factors between urbanization and cultivated land use ecological efficiency in the Yellow River Basin. Trans. Chin. Soc. Agric. Eng. 2024, 40, 240–250. [Google Scholar]
- Hu, X.H.; Lin, X.X.; Wen, G.H.; Zhou, Y.; Zhou, H.; Lin, S.Q.; Yue, D.Y. The Impact of Cultivated Land Fragmentation on Farmers’ Ecological Efficiency of Cultivated Land Use Based on the Moderating and Mediating Effects of the Cultivated Land Management Scale. Land 2024, 13, 1628. [Google Scholar] [CrossRef] [Scilit]
- Wu, S.; Ding, R.; Kuang, B.; Cheng, P.; Zhu, H.; Li, Z. Impact of Comprehensive Land Consolidation on Ecological Efficiency of Cultivated Land Use: Empirical Analysis Based on the Micro Survey Data of Farmers. China Land Sci. 2023, 37, 95–105. [Google Scholar]
- Ma, Y.; Wang, X.Y.; Zhong, C.L. Spatial and Temporal Differences and Influencing Factors of Eco-Efficiency of Cultivated Land Use in Main Grain-Producing Areas of China. Sustainability 2024, 16, 5734. [Google Scholar] [CrossRef] [Scilit]
- Jiao, X.Y.; Ma, J.T.; Liu, G.X.; Li, Y.C.; Li, C.G.; Wang, X. Spatial-temporal evolution and influencing factors of the eco-efficiency of cultivated land-use in the Beijing-Tianjin-Hebei region in the context of food security. Front. Sustain. Food Syst. 2024, 8, 1462031. [Google Scholar] [CrossRef] [Scilit]
- Li, S.T.; Mu, N.; Ren, Y.J.; Glauben, T. Spatiotemporal characteristics of cultivated land use eco-efficiency and its influencing factors in China from 2000 to 2020. J. Arid Land 2024, 16, 396–414. [Google Scholar] [CrossRef] [Scilit]
- Wu, X.; Cui, J. Measurement of eco-efficiency of cultivated land use and influencing factors in northeast China based on dynamic QCA. J. Agric. Resour. Environ. 2025, 42, 1624–1635. [Google Scholar]
- He, W.; Wang, F.F.; Feng, N. Research on the characteristics and influencing factors of the spatial correlation network of cultivated land utilization ecological efficiency in the upper reaches of the Yangtze River, China. PLoS ONE 2024, 19, e0297933. [Google Scholar] [CrossRef] [Scilit]
- Liu, T.; Kong, Y.H.; Weng, F.L.; Li, J.X. Spatial correlation network characteristics and driving factors of carbon emissions from cultivated land use in the yellow river basin. Sci. Rep. 2025, 15, 42611. [Google Scholar] [CrossRef] [Scilit]
- Wang, X.J.; Wang, D.Y. Breaking Spatial Constraints: A Dimensional Perspective-Based Analysis of the Eco-Efficiency of Cultivated Land Use and Its Spatial Association Network. Land 2024, 13, 2221. [Google Scholar] [CrossRef] [Scilit]
- Lu, Y.; Liu, Y.; Meng, Y.; Wei, Y.; Liang, Y.; Zhang, L. Spatiotemporal pattern and influencing factors of green use efficiency of cultivated land in Guangxi Zhuang Autonomous Region. Bull. Soil Water Conserv. 2025, 45, 325–336+396. [Google Scholar]
- Xie, L.; Yang, F.; Sun, J.; Deng, L.; Luo, J.; Chen, X. Spatiotemporal evolution characteristics and influencing factors of cultivated land use efficiency in Karst mountainous areas. Res. Agric. Mod. 2025, 46, 753–766. [Google Scholar]
- Schaltegger, S.; Sturm, A. Öologische rationalität (German/in English: Environmental rationality). Die Unternehm. 1990, 4, 117–131. [Google Scholar]
- WBCSD. Eco-Efficiency: Leadership for Improved Economic and Environmental Performance; WBCSD: Geneva, Switzerland, 1996. [Google Scholar]
- Yin, Y.Q.; Hou, X.H.; Liu, J.M.; Zhou, X.; Zhang, D.J. Detection and attribution of changes in cultivated land use ecological efficiency: A case study on Yangtze River Economic Belt, China. Ecol. Indic. 2022, 137, 108753. [Google Scholar] [CrossRef] [Scilit]
- Xue, X.; Xie, Y. The Spatial-Temporal Differences and Spatial Convergence of Ecological Efficiency in Cultivated Land Utilization in the Main Grain-Producing Areas of The Yellow River Basin evidence from 60 Prefecture-Level Cities. J. China Agric. Resour. Reg. Plan. 2024, 45, 52–65. [Google Scholar]
- Zhang, M.; Liu, X.; Peng, S.; Zhang, Y.; Chen, Y.; Wen, L. Evolution Characteristics and Formation Mechanism of Spatial Correlation Network of Provincial Land Use Carbon Emission Efficiency in China. China Land Sci. 2023, 37, 91–101. [Google Scholar]
- Yang, L.P.; Liu, Y.S.; Wang, Q.; Ou, C.; Zhang, Q.X. Spatial-temporal assessment and optimization of ecological cropland utilization: A case study of China’s Huang-Huai-Hai region. Environ. Impact Assess. Rev. 2026, 119, 108383. [Google Scholar] [CrossRef] [Scilit]
- Zhou, D.; Li, S.; Li, H.; Ding, Q.; Pan, S.; Wang, Y. Green Use Efficiency of Cultivated Land in 267 Cities of China under Remote Coupling: Spatial Correlation Network Characteristics and Control Strategies. China Land Sci. 2025, 39, 113–126. [Google Scholar]
- Zhao, Y.; Jiang, X.; Lu, X.H.; Wang, H.Z. Spatial convergence and its determinants of green urban land use efficiency: Empirical evidence from 284 cities in China. Environ. Dev. Sustain. 2026, 28, 2195–2223. [Google Scholar] [CrossRef] [Scilit]
- An, J.J.; Su, Q.J.; Yuan, X.F. The Impact of New Urbanization on Urban Land Green Use Efficiency in the Middle and Lower Yellow River, China: An Analysis Based on Spatial Correlation Networks. Land 2025, 14, 625. [Google Scholar] [CrossRef] [Scilit]
- Wei, X.; Chen, B.H. Spatial association network structure of agricultural carbon emission efficiency in Chinese cities and its driving factors. Sci. Rep. 2024, 14, 31810. [Google Scholar] [CrossRef] [Scilit]
- Yang, B.; Wang, Z.Q.; Zou, L.; Zou, L.L.; Zhang, H.W. Exploring the eco-efficiency of cultivated land utilization and its influencing factors in China’s Yangtze River Economic Belt, 2001–2018. J. Environ. Manag. 2021, 294, 112939. [Google Scholar] [CrossRef] [Scilit]
- Zhang, P.; Li, Y.X.; Yuan, X.F.; Zhao, Y.H. Effects of Off-Farm Employment on the Eco-Efficiency of Cultivated Land Use: Evidence from the North China Plain. Land 2024, 13, 1538. [Google Scholar] [CrossRef] [Scilit]
- Guan, J.; Guan, Y.; Liu, X.; Zhang, S. Spatial correlation and carbon balance zoning of agricultural carbon emissions in China. Acta Ecol. Sin. 2025, 45, 11357–11373. [Google Scholar]
- Zhang, R.T.; Lu, J.F. Spatial-Temporal Pattern and Convergence Characteristics of Provincial Urban Land Use Efficiency under Environmental Constraints in China. Int. J. Environ. Res. Public Health 2022, 19, 10729. [Google Scholar] [CrossRef] [Scilit]
- Cheng, H.; Xu, Q.; Zhao, M. Research on spatial correlation network structure of China’s tourism ecoefficiency and its influencing factors. Ecol. Sci. 2020, 39, 169–178. [Google Scholar]
- Sun, Y.; Zhang, Y.; Zhao, Y. Spatial Correlation Network Structure of Carbon Emission Efficiency in Urban Agglomerations of the Yellow River Basin and Its Influencing Factors. Econ. Geogr. 2025, 45, 77–84. [Google Scholar]
- Liu, J.; Cai, R. How can the green transformation of production and lifestyles jointly drive green development?a study of the configuration effect based on fsQCA. China Popul. Resour. Environ. 2024, 34, 114–127. [Google Scholar]
- Peer, C.F. Building Better Causal Theories: A Fuzzy Set Approach to Typologies in Organization Research. Acad. Manag. J. 2011, 54, 393–420. [Google Scholar] [CrossRef] [Scilit]
- Dul, J. Necessary Condition Analysis (NCA). Organ. Res. Methods 2016, 19, 10–52. [Google Scholar] [CrossRef] [Scilit]
- Liu, Y.; Deng, W.; Li, S.; Bai, L. Structural characteristics and influencing factors of carbon emission spatial association networks based on carbon sink potential: A case study of urban agglomerations in the middle reaches of the Yangtze River. China Popul. Resour. Environ. 2024, 34, 1–15. [Google Scholar]
- Fang, D.C. Research on the spatial association network structure of national high-tech industrial development zone in the Yangtze River Delta zones. Contemp. Econ. Manag. 2021, 43, 73–79. [Google Scholar] [CrossRef]
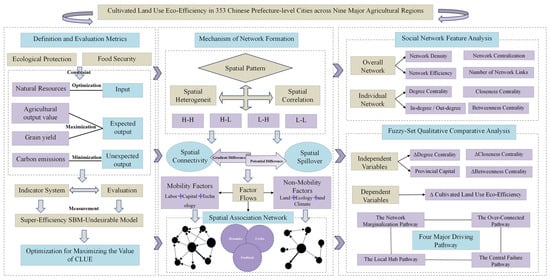
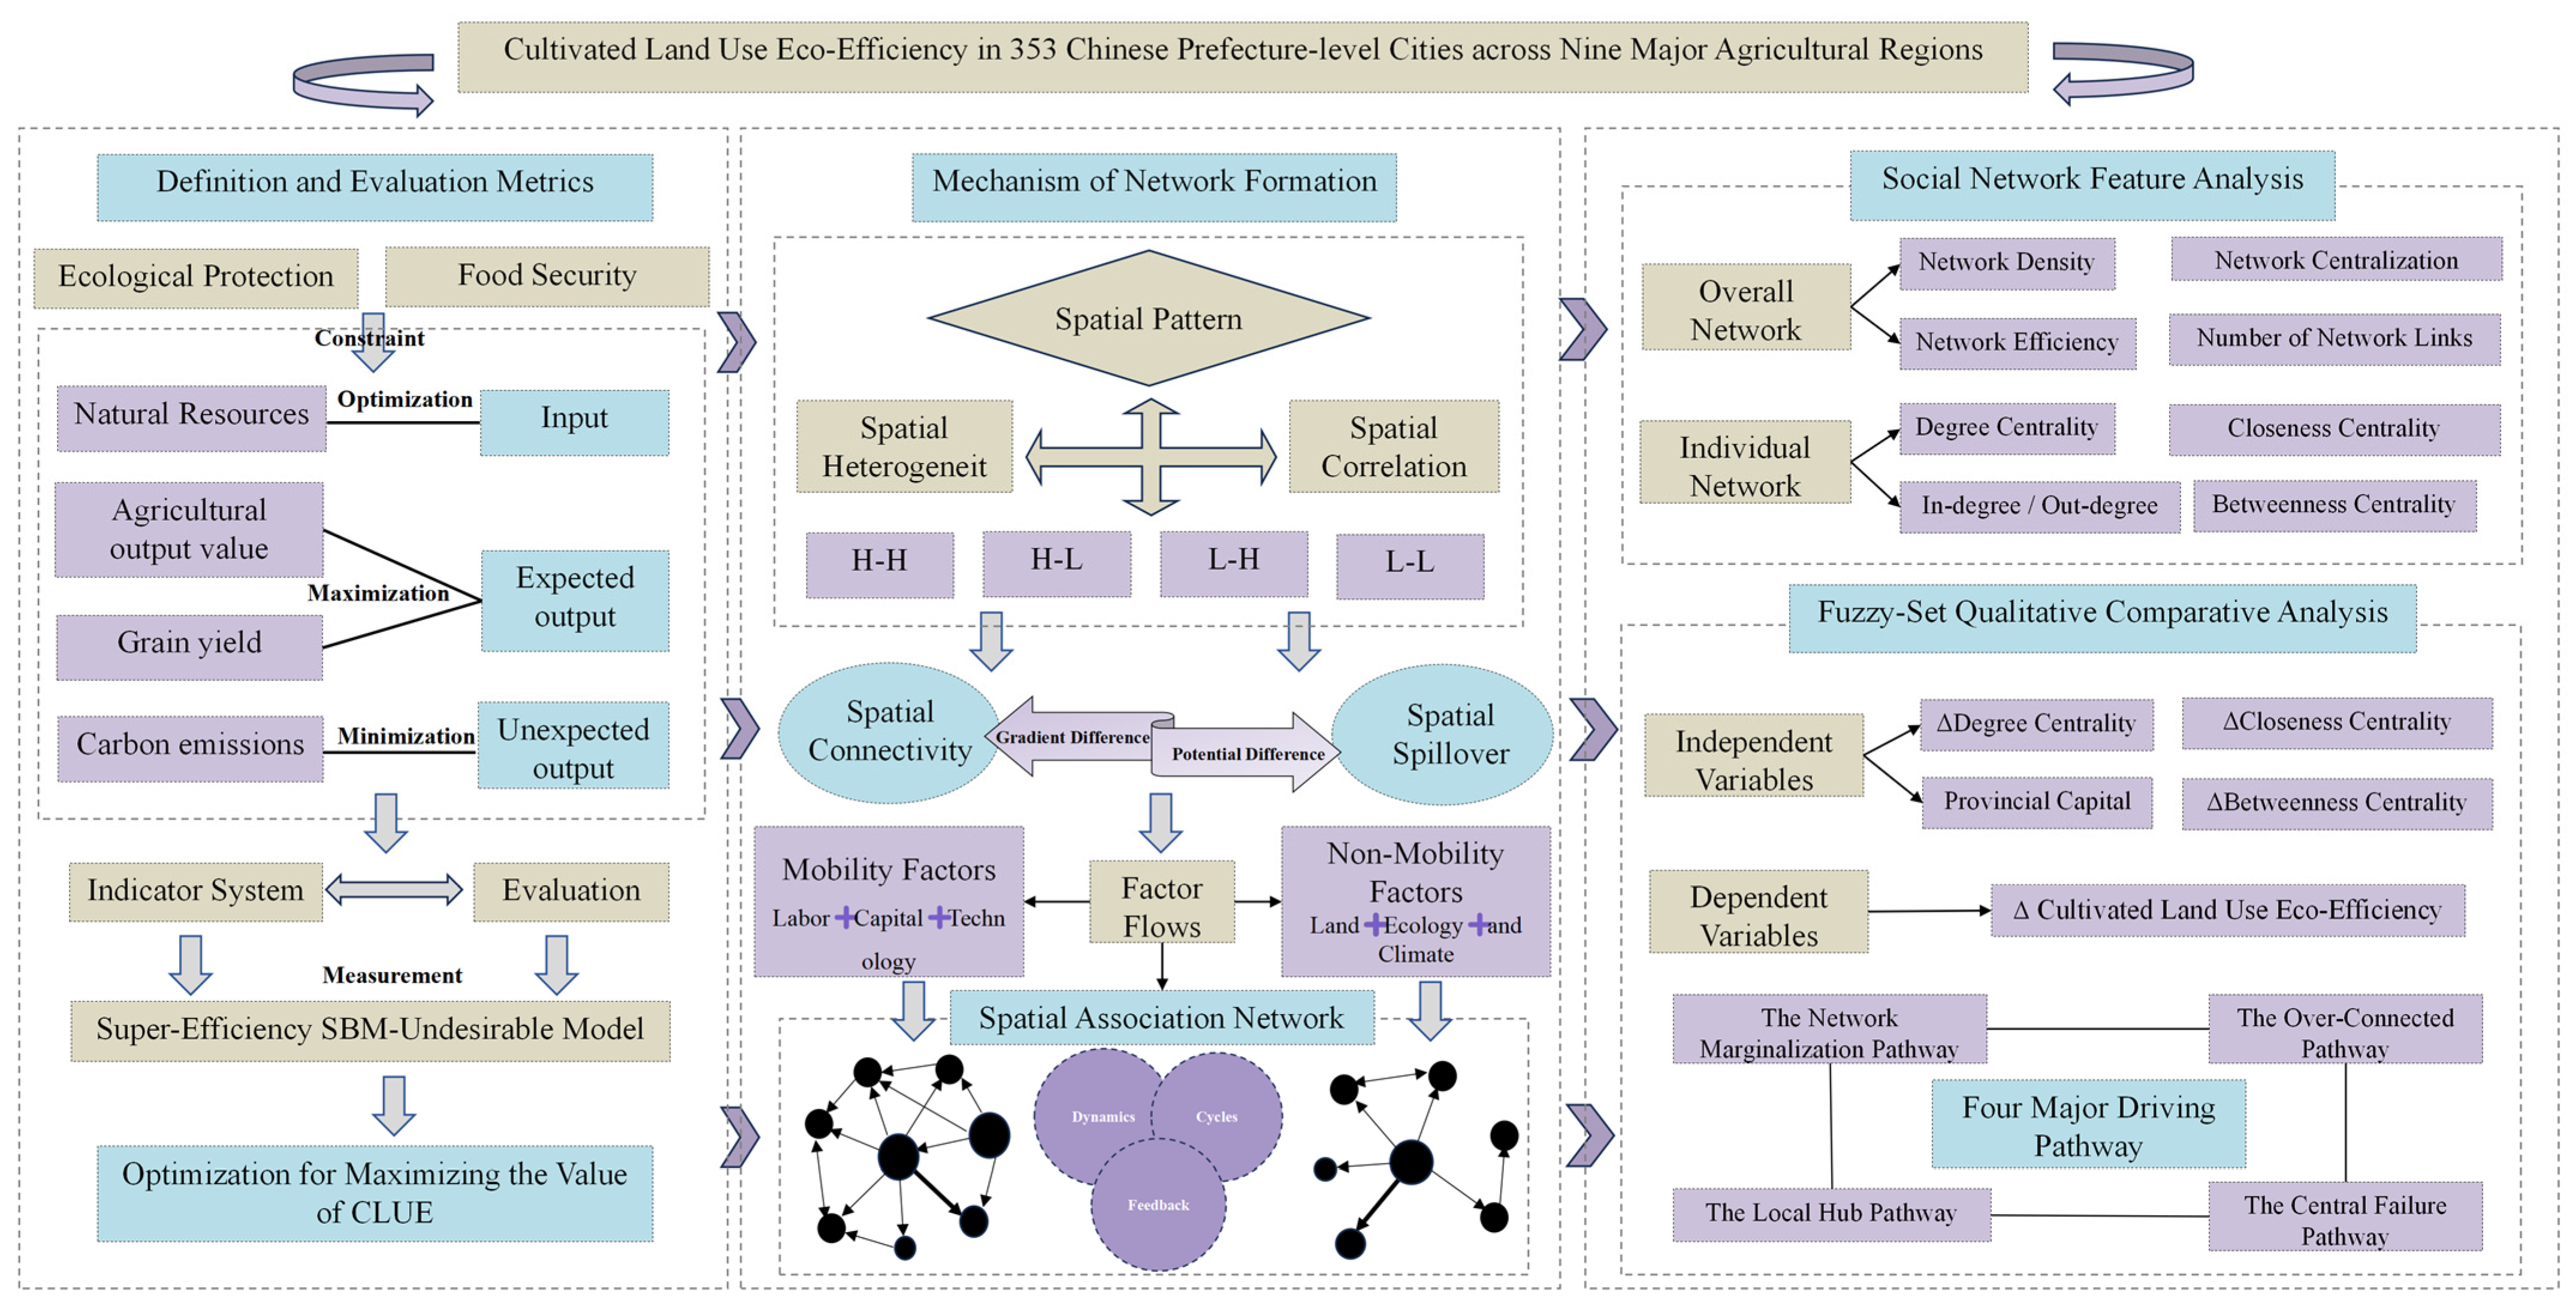
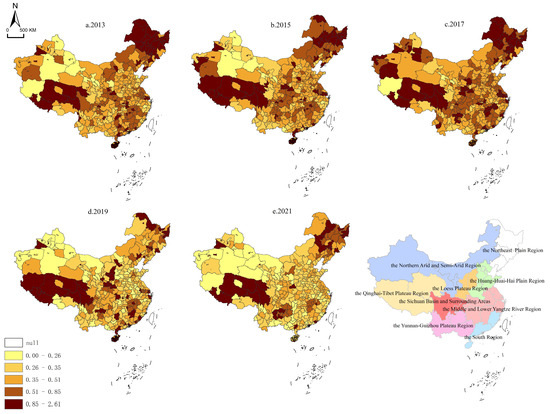
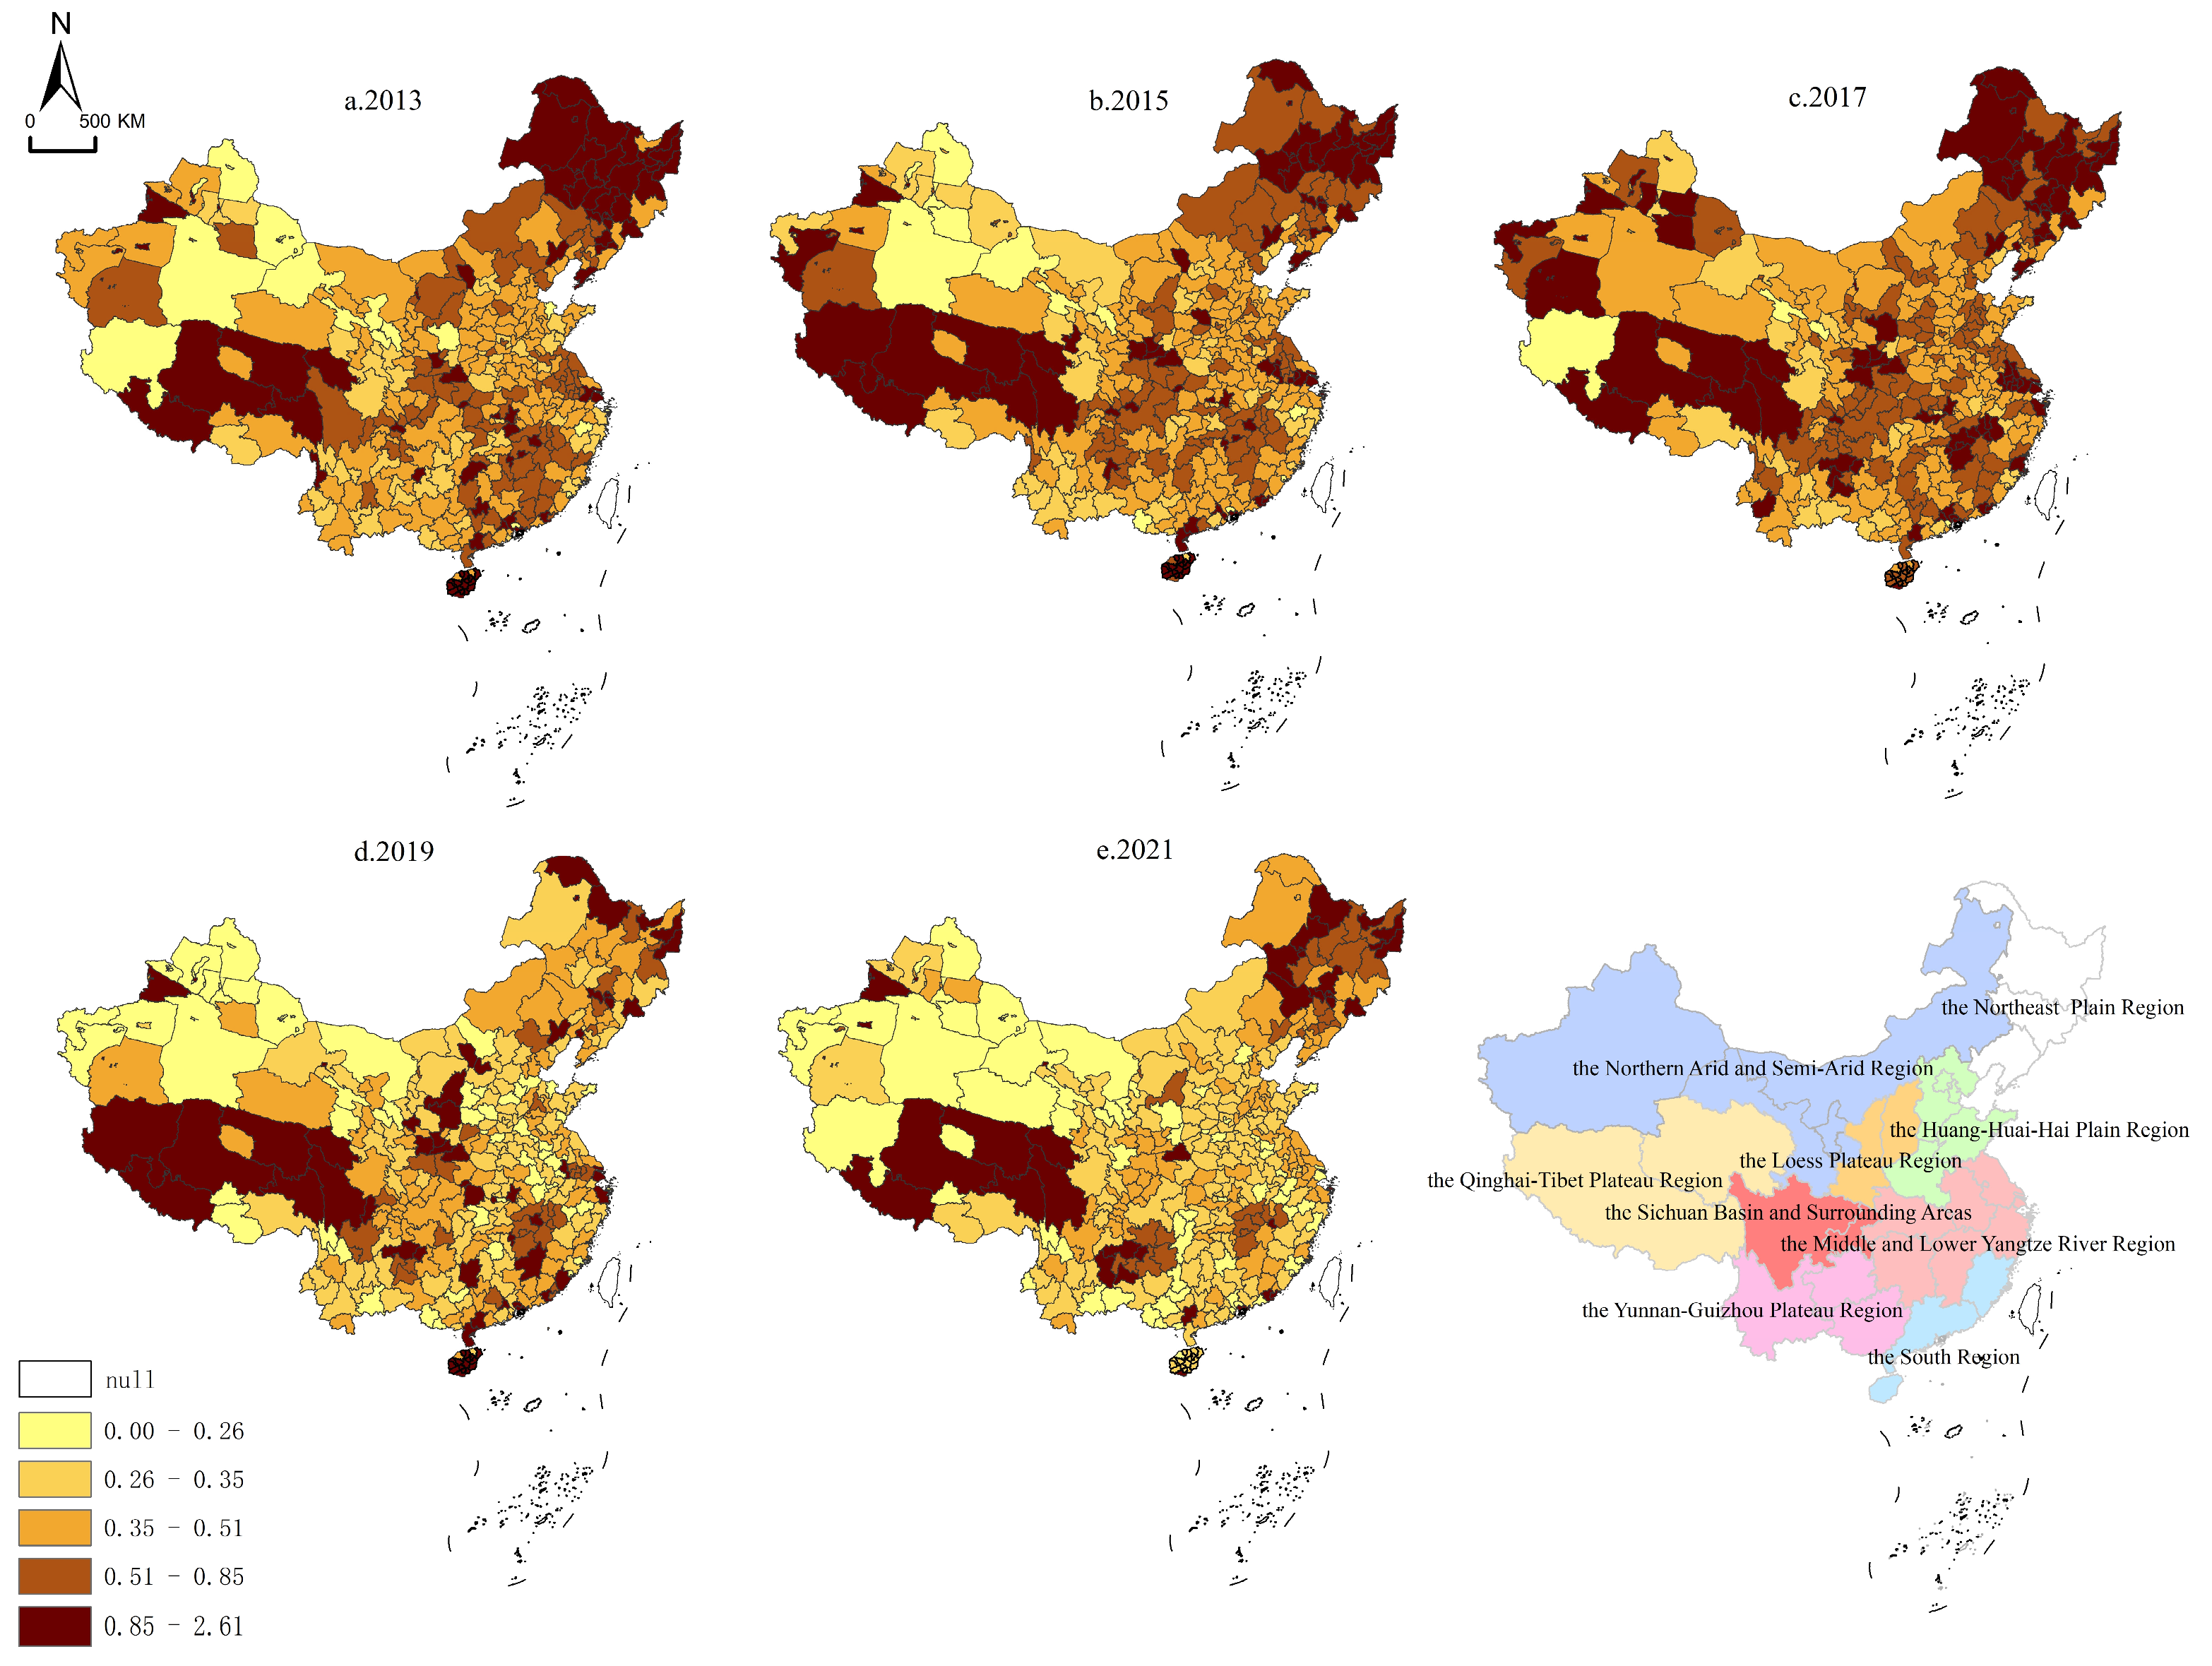
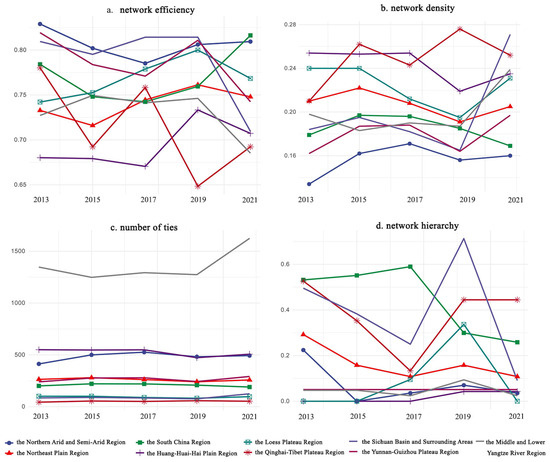
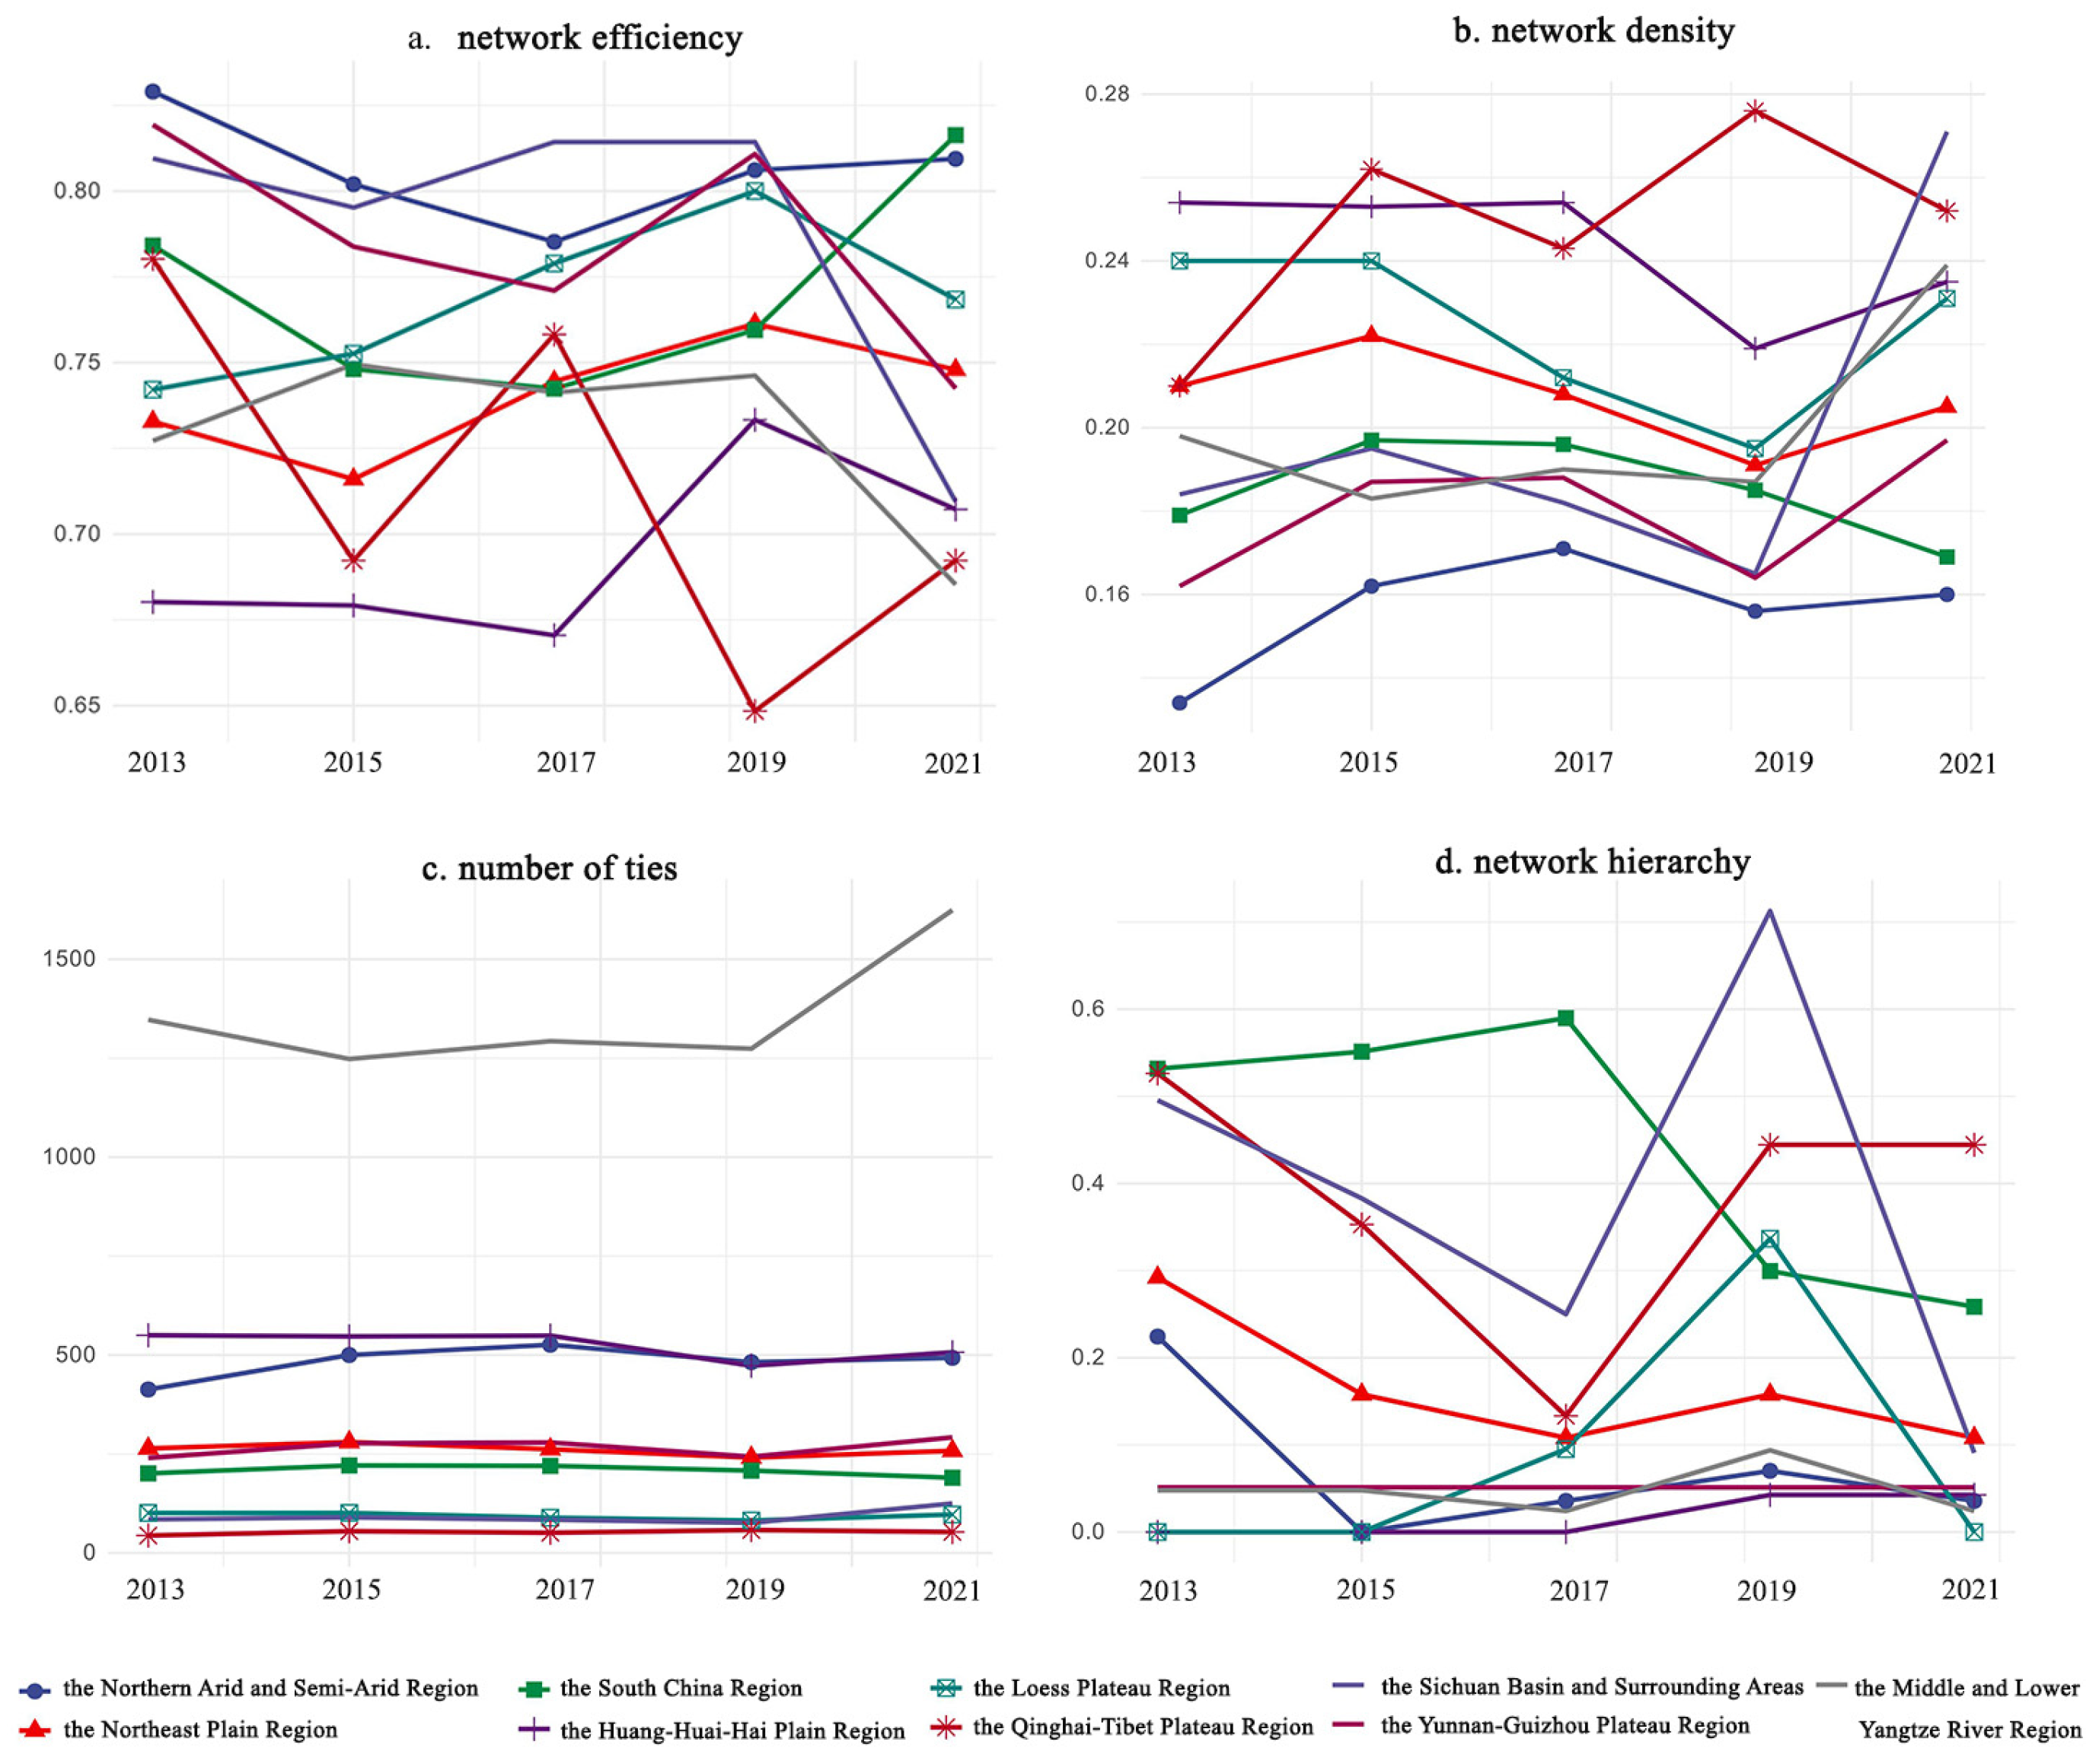
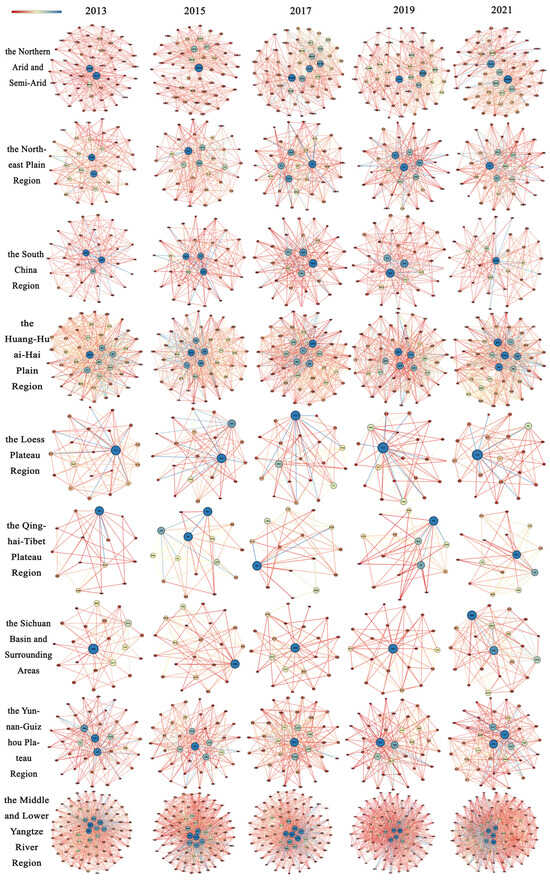
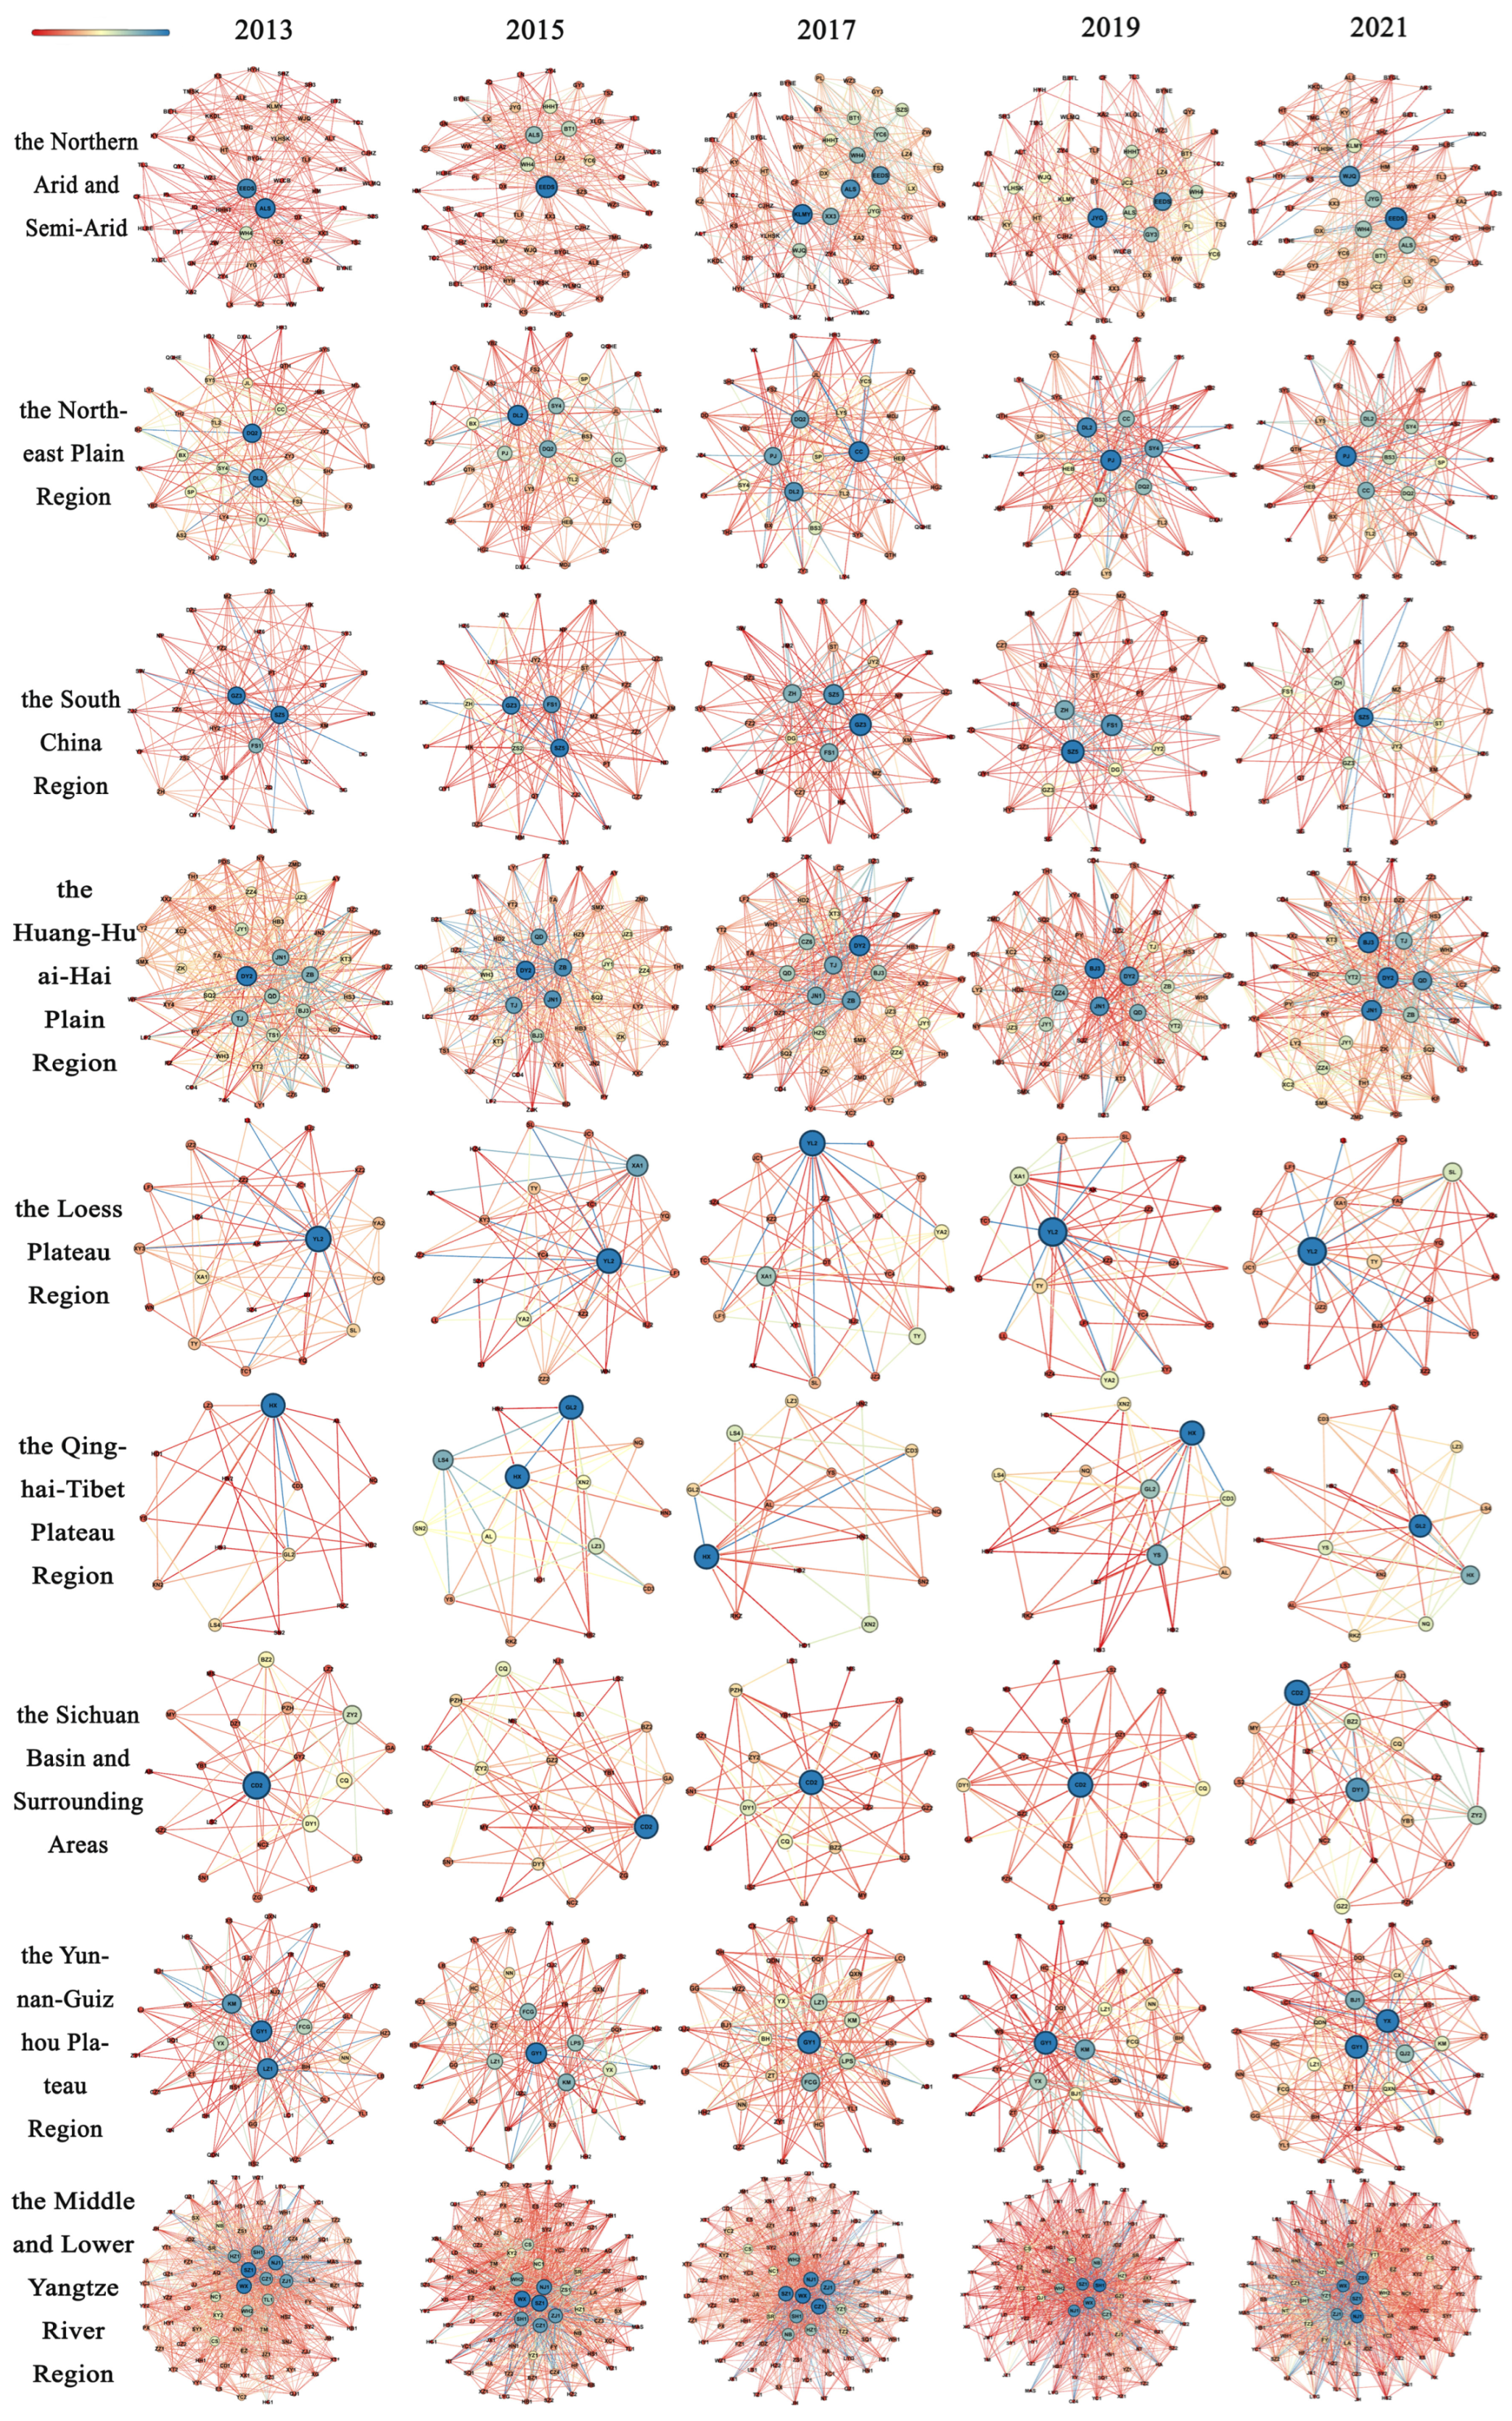
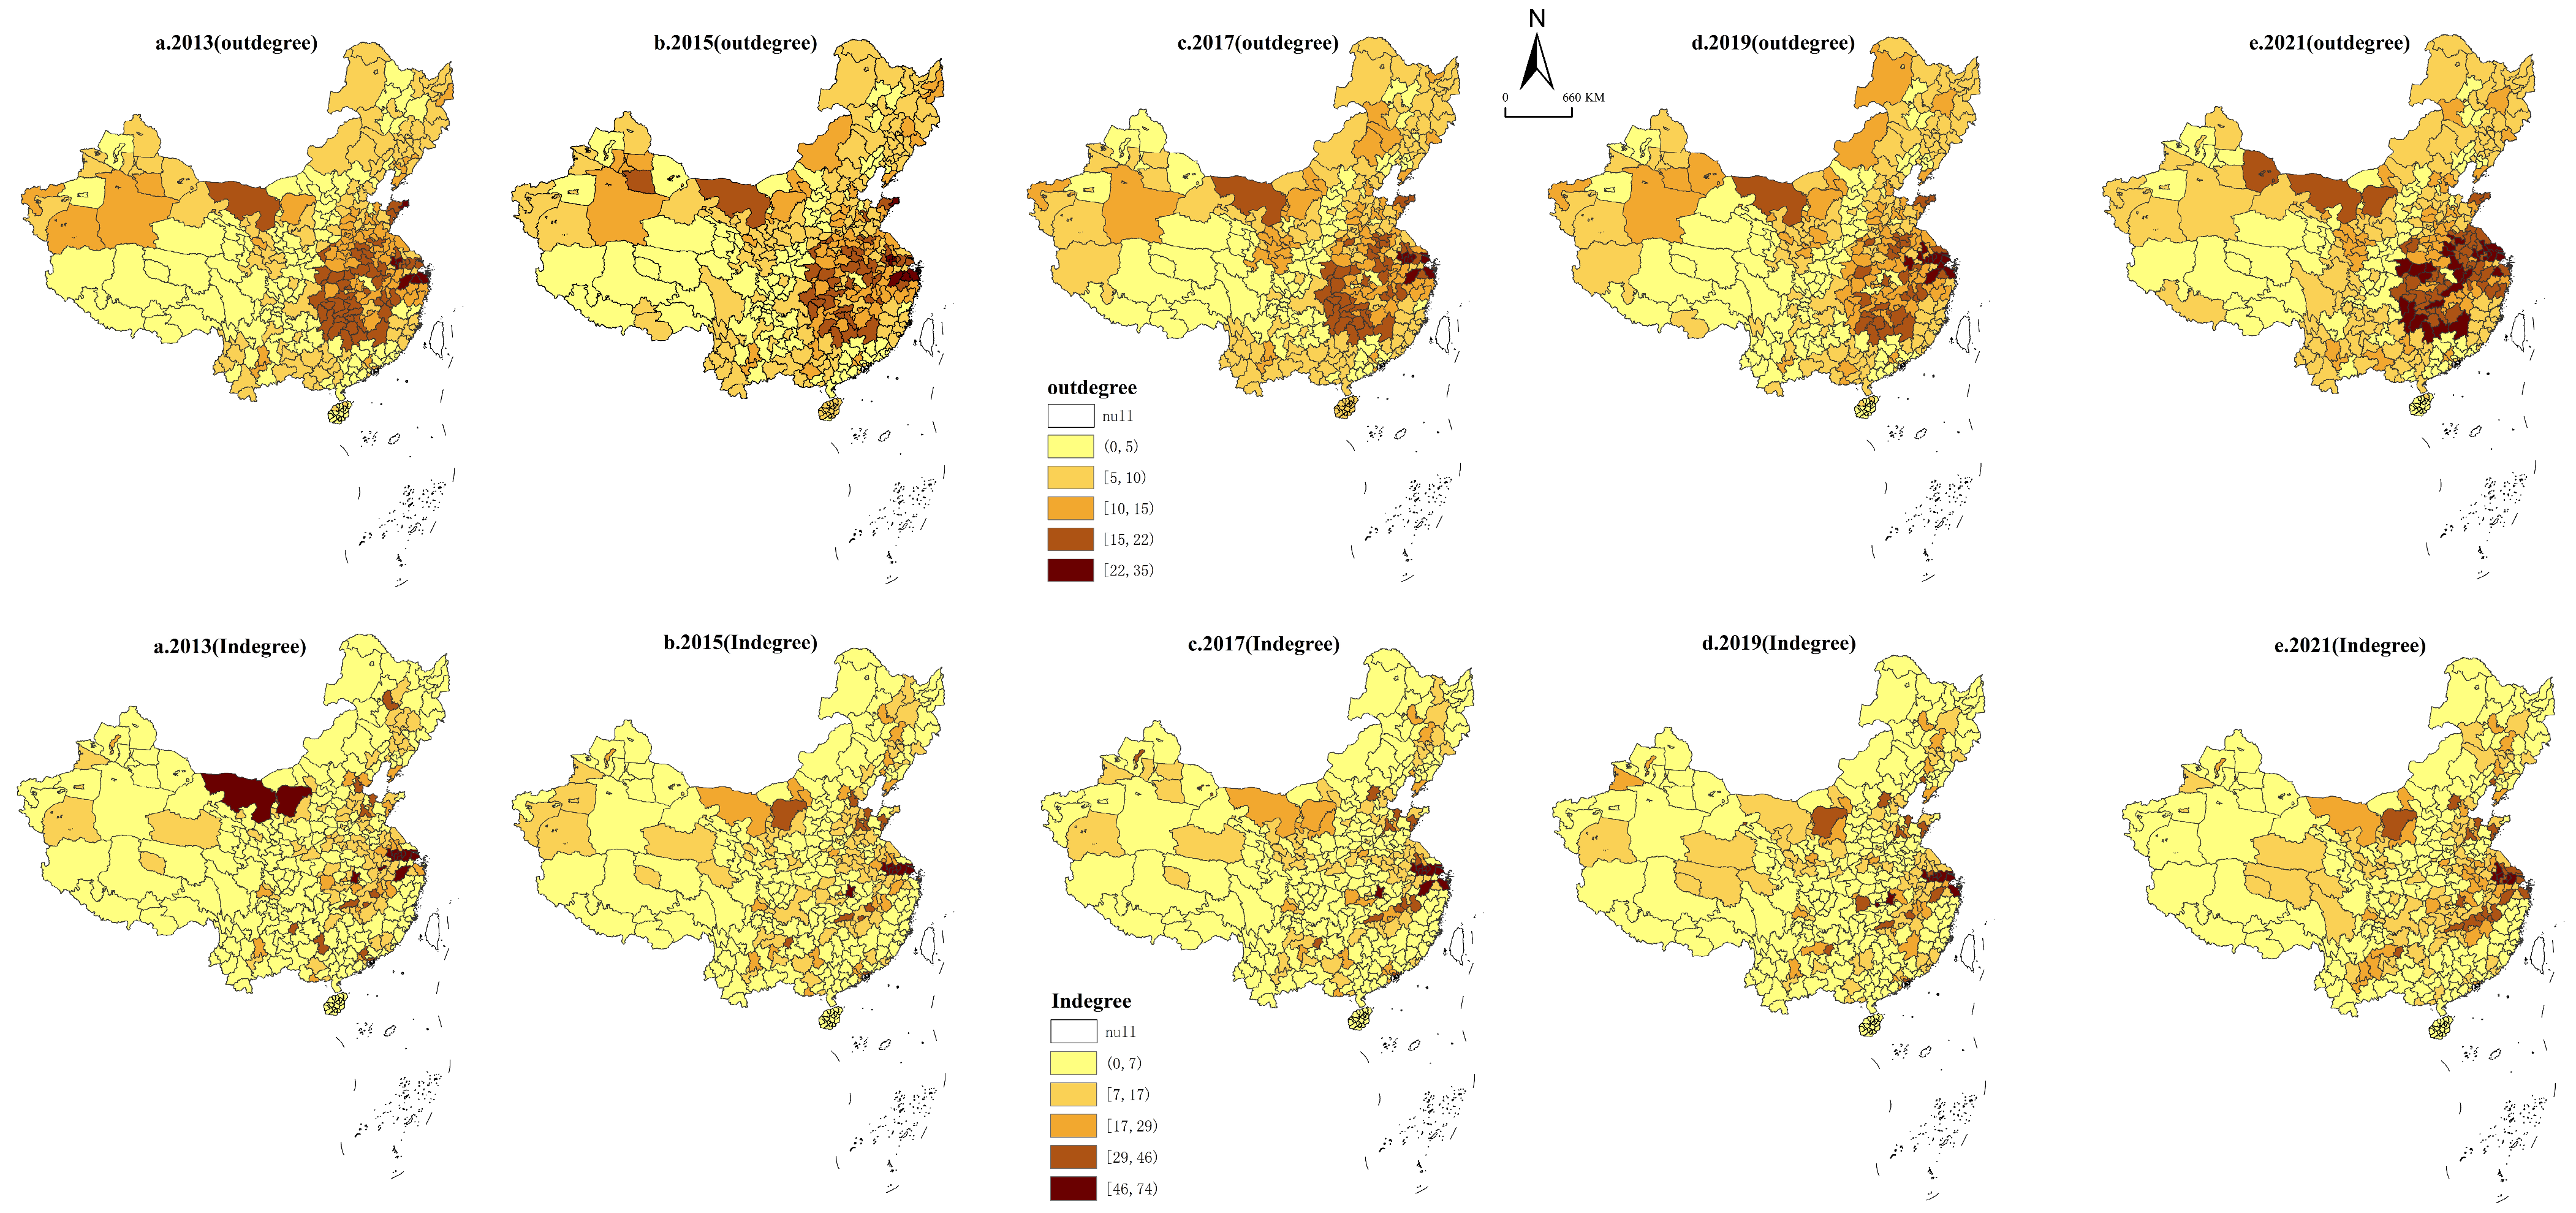

Disclaimer/Publisher’s Note: The statements, opinions and data contained in all publications are solely those of the individual author(s) and contributor(s) and not of MDPI and/or the editor(s). MDPI and/or the editor(s) disclaim responsibility for any injury to people or property resulting from any ideas, methods, instructions or products referred to in the content. |
© 2026 by the authors. Licensee MDPI, Basel, Switzerland. This article is an open access article distributed under the terms and conditions of the Creative Commons Attribution (CC BY) license.