Article

Urban Resilience to Heatwave Shocks in China’s Three Coastal Agglomerations: Spatial Heterogeneity and Nonlinear Driving Mechanisms with Threshold Effects

School of Architecture and Urban-Rural Planning, Sichuan Agricultural University, Chengdu 611830, China
*
Authors to whom correspondence should be addressed.
Land 2026, 15(6), 1052; https://doi.org/10.3390/land15061052
Submission received: 6 May 2026 / Revised: 1 June 2026 / Accepted: 10 June 2026 / Published: 14 June 2026

Abstract

Rising heatwaves threaten urban sustainability, necessitating a shift toward heat resilience. This study examines 38 cities across China’s three major coastal urban agglomerations (2016–2024) to quantify dynamic resilience responses. Utilizing a dual-threshold identification method and the Baidu Search Index to construct a Standardized Stress Index (SSI), the research evaluates urban heat vulnerability (UHV) through an exposure–sensitivity–adaptive capacity framework while applying NMF and machine learning models (XGBoost/SHAP) to analyze spatiotemporal heterogeneity. The results show that heatwave pressures peaked in 2022–2023, with Jing–Jin–Ji’s UHV evolving from localized clusters toward regional homogenization. Regional UHV profiles reveal that Jing–Jin–Ji is constrained by population pressures, the Yangtze River Delta (YRD) by resource allocation, and the Pearl River Delta by industrial attributes; notably, the YRD’s systematic coordination effectively offsets structural vulnerability. Furthermore, the optimized XGBoost model achieves strong predictive performance (R2 = 0.673), revealing that core factors like summer heat exposure intensity (SHE, 25.65% importance) trigger sharp non-linear surges in social stress upon crossing critical inflection thresholds (e.g., SHE at −0.10). The conclusion will lead to the formulation of differentiated, forward-looking climate adaptation strategies to enhance urban resilience across major regions.

1. Introduction

Climate change increasingly threatens global health and survival [1], as unprecedented heatwaves grow in frequency and intensity [2,3]. Cities, as hubs of socioeconomic activity, face the most severe impacts; extreme heat exacerbates social vulnerability and challenges the regulatory capacity of urban systems [4], creating significant risks to resident well-being [5,6,7]. Specifically, rising temperatures increase the burden of infectious, kidney, and mental health diseases [8,9,10], necessitating urgent analysis of urban response mechanisms to safeguard sustainable human settlements [11,12]. Given that traditional disaster prevention struggles with climate uncertainty, China’s 2016 Action Plan for Urban Climate Change Adaptation marked a shift toward urban resilience [13]. This paradigm is vital for achieving Sustainable Development Goals, as only resilient cities can effectively minimize casualties and economic damage during extreme events to ensure stable growth [14,15].
Against this background, the climate issues faced by the three major urban agglomerations along China’s eastern coast are becoming increasingly severe [16,17], exposing the vulnerability shortcomings of megacity clusters under extreme climate conditions. Therefore, conducting research on heatwave urban resilience at the urban agglomeration scale is of profound practical significance for promoting high-quality regional development and implementing climate adaptation strategies.
The connotation of resilience theory has undergone a profound evolution from engineering resilience [18] to ecological resilience [19] and evolutionary resilience [20]. Its focus has expanded from simple structural recovery to the system’s capacities for proactive adaptation and evolution. With the deepening of sustainable development theory, urban resilience has come to refer to the capacity of urban systems, after being subjected to external shocks, to maintain or rapidly restore system functions across temporal and spatial scales, adapt to ongoing changes, and break through constraints to pursue new development [21]. In the field of heat resilience, existing assessment frameworks are often constructed on the basis of static models such as the “pressure–state–response” (PSR) framework, and quantify resilience levels through multi-indicator systems [21]. However, urban resilience under heatwave conditions is not a static characteristic; rather, it exhibits significant dynamic evolutionary properties. Such static assessment methods often fail to capture the temporal and spatial complexity of urban life [22]. Therefore, scholars have begun to emphasize the use of high-frequency spatiotemporal data to capture the dynamic changes in resilience under heatwave conditions [23], such as using ambulance call data as a proxy indicator to measure the acute health impacts of urban heatwave events [24], or using the Baidu Search Index and similar data to reflect citizens’ immediate coping capacity [25,26], thereby compensating for the shortcomings of traditional static assessments in capturing “process” characteristics.
Analysis of the relationship between urban heat vulnerability (UHV) and urban resilience reveals complex nonlinear coupling characteristics, challenging the traditional linear understanding that the two are reciprocals of each other [5]. UHV is defined as the degree to which urban systems are susceptible to the adverse impacts of stressors such as heatwave events and are unable to cope with them [27]. Previous studies have often regarded vulnerability as the opposite of resilience [28], but recent empirical research shows that the two exhibit significant spatiotemporal dynamic reversals within cities [5]. Under the regulation of specific social capital or emergency response mechanisms, highly vulnerable areas may display unexpected adaptive resilience [23]. This complex nonlinear association indicates that simply treating relatively static UHV as a proxy for low urban resilience may be insufficient for guiding precise governance. There is therefore an urgent need to develop an assessment framework capable of capturing such dynamic reversal relationships and spatial heterogeneity, so as to gain a deeper understanding of the intrinsic mechanisms through which urban systems respond to heatwave risk.
While research has detailed urban thermal spatial patterns, two critical gaps remain: (1) Insufficient Spatiotemporal Comparative Analysis: There is a lack of comprehensive analysis across different time periods and regions. Traditional methods struggle to accurately capture the spatial heterogeneity in influence mechanisms driven by diverse development histories and climatic conditions. (2) Limited Understanding of Nonlinearity and Threshold Effects: Reliance on traditional linear models, such as linear regression, prevents the detection of complex nonlinear responses. Furthermore, these models fail to identify marginal threshold behaviors, ultimately constraining our understanding of the mechanisms through which urban resilience mitigates heatwave impacts.
To analyze the spatial heterogeneity and nonlinearity of urban heatwave resilience, this study constructs an integrated “decomposition–identification–characterization” framework. We utilize Non-Negative Matrix Factorization (NMF) to deconstruct UHV structures; compared with traditional principal component analysis, NMF’s physically meaningful basis and coefficient matrices [29,30], more accurately identify dominant vulnerability combinations and their spatial differentiation [5]. Furthermore, machine learning algorithms are employed to capture nonlinear threshold effects and multivariable interactions that linear models often miss [31]. This approach can accurately reveal response changes as the system shifts from an adaptive state to an unstable state [32].
In terms of dynamic response characterization, this study innovatively adopts the BSI as a high-frequency proxy variable for public resilience responses. Related studies have confirmed that by analyzing high-frequency data such as ambulance calls and BSI, it is possible to effectively capture the acute health impacts on the public and their immediate response capacity during heatwave events, thereby further dynamically quantifying urban resilience [5,24,26]. In addition, BSI is a function of the Baidu Index Service (BIS), which calculates the search frequency of each keyword based on internet users’ search volume and keyword weights. As a China-specific “perception–behavior” trace, BSI can sensitively reflect changes in the Chinese public’s willingness to engage in self-protection and their psychological stress, and this has been confirmed in numerous studies in the medical field [28,33,34]. Using such city-level, high-frequency, and dynamic behavioral data as the dependent variable in machine learning models can more realistically characterize the “stress state” of urban systems under heatwave shocks [35].
Based on the above theories and methods, this study defines the following research objectives: (1) Identify spatiotemporal heatwave characteristics (2016–2024) across the three coastal agglomerations and quantify resilience using the BSI. (2) Classify UHV using NMF and correlate results with resilience to deconstruct spatial heterogeneity. (3) Employ machine learning to identify nonlinear threshold effects of resilience responses across different UHV types. (4) Provide decision support for differentiated resilience strategies and collaborative governance pathways based on spatial and threshold analysis. By bridging methodological innovation with practical governance, this research is specifically tailored for academia, policy makers, and urban planners seeking data-driven climate adaptation solutions.
This paper is organized into five sections. Section 2 introduces the study area, data sources, the research indicator system, and the specific methods. Section 3 presents empirical results regarding spatiotemporal heatwave evolution, UHV spatial heterogeneity, and resilience threshold effects. Section 4 discusses dynamic resilience differences to inform differentiated climate strategies, while identifying study limitations and future research directions. Section 5 summarizes the study’s theoretical findings and implications.

2. Materials and Methods

2.1. Research Framework

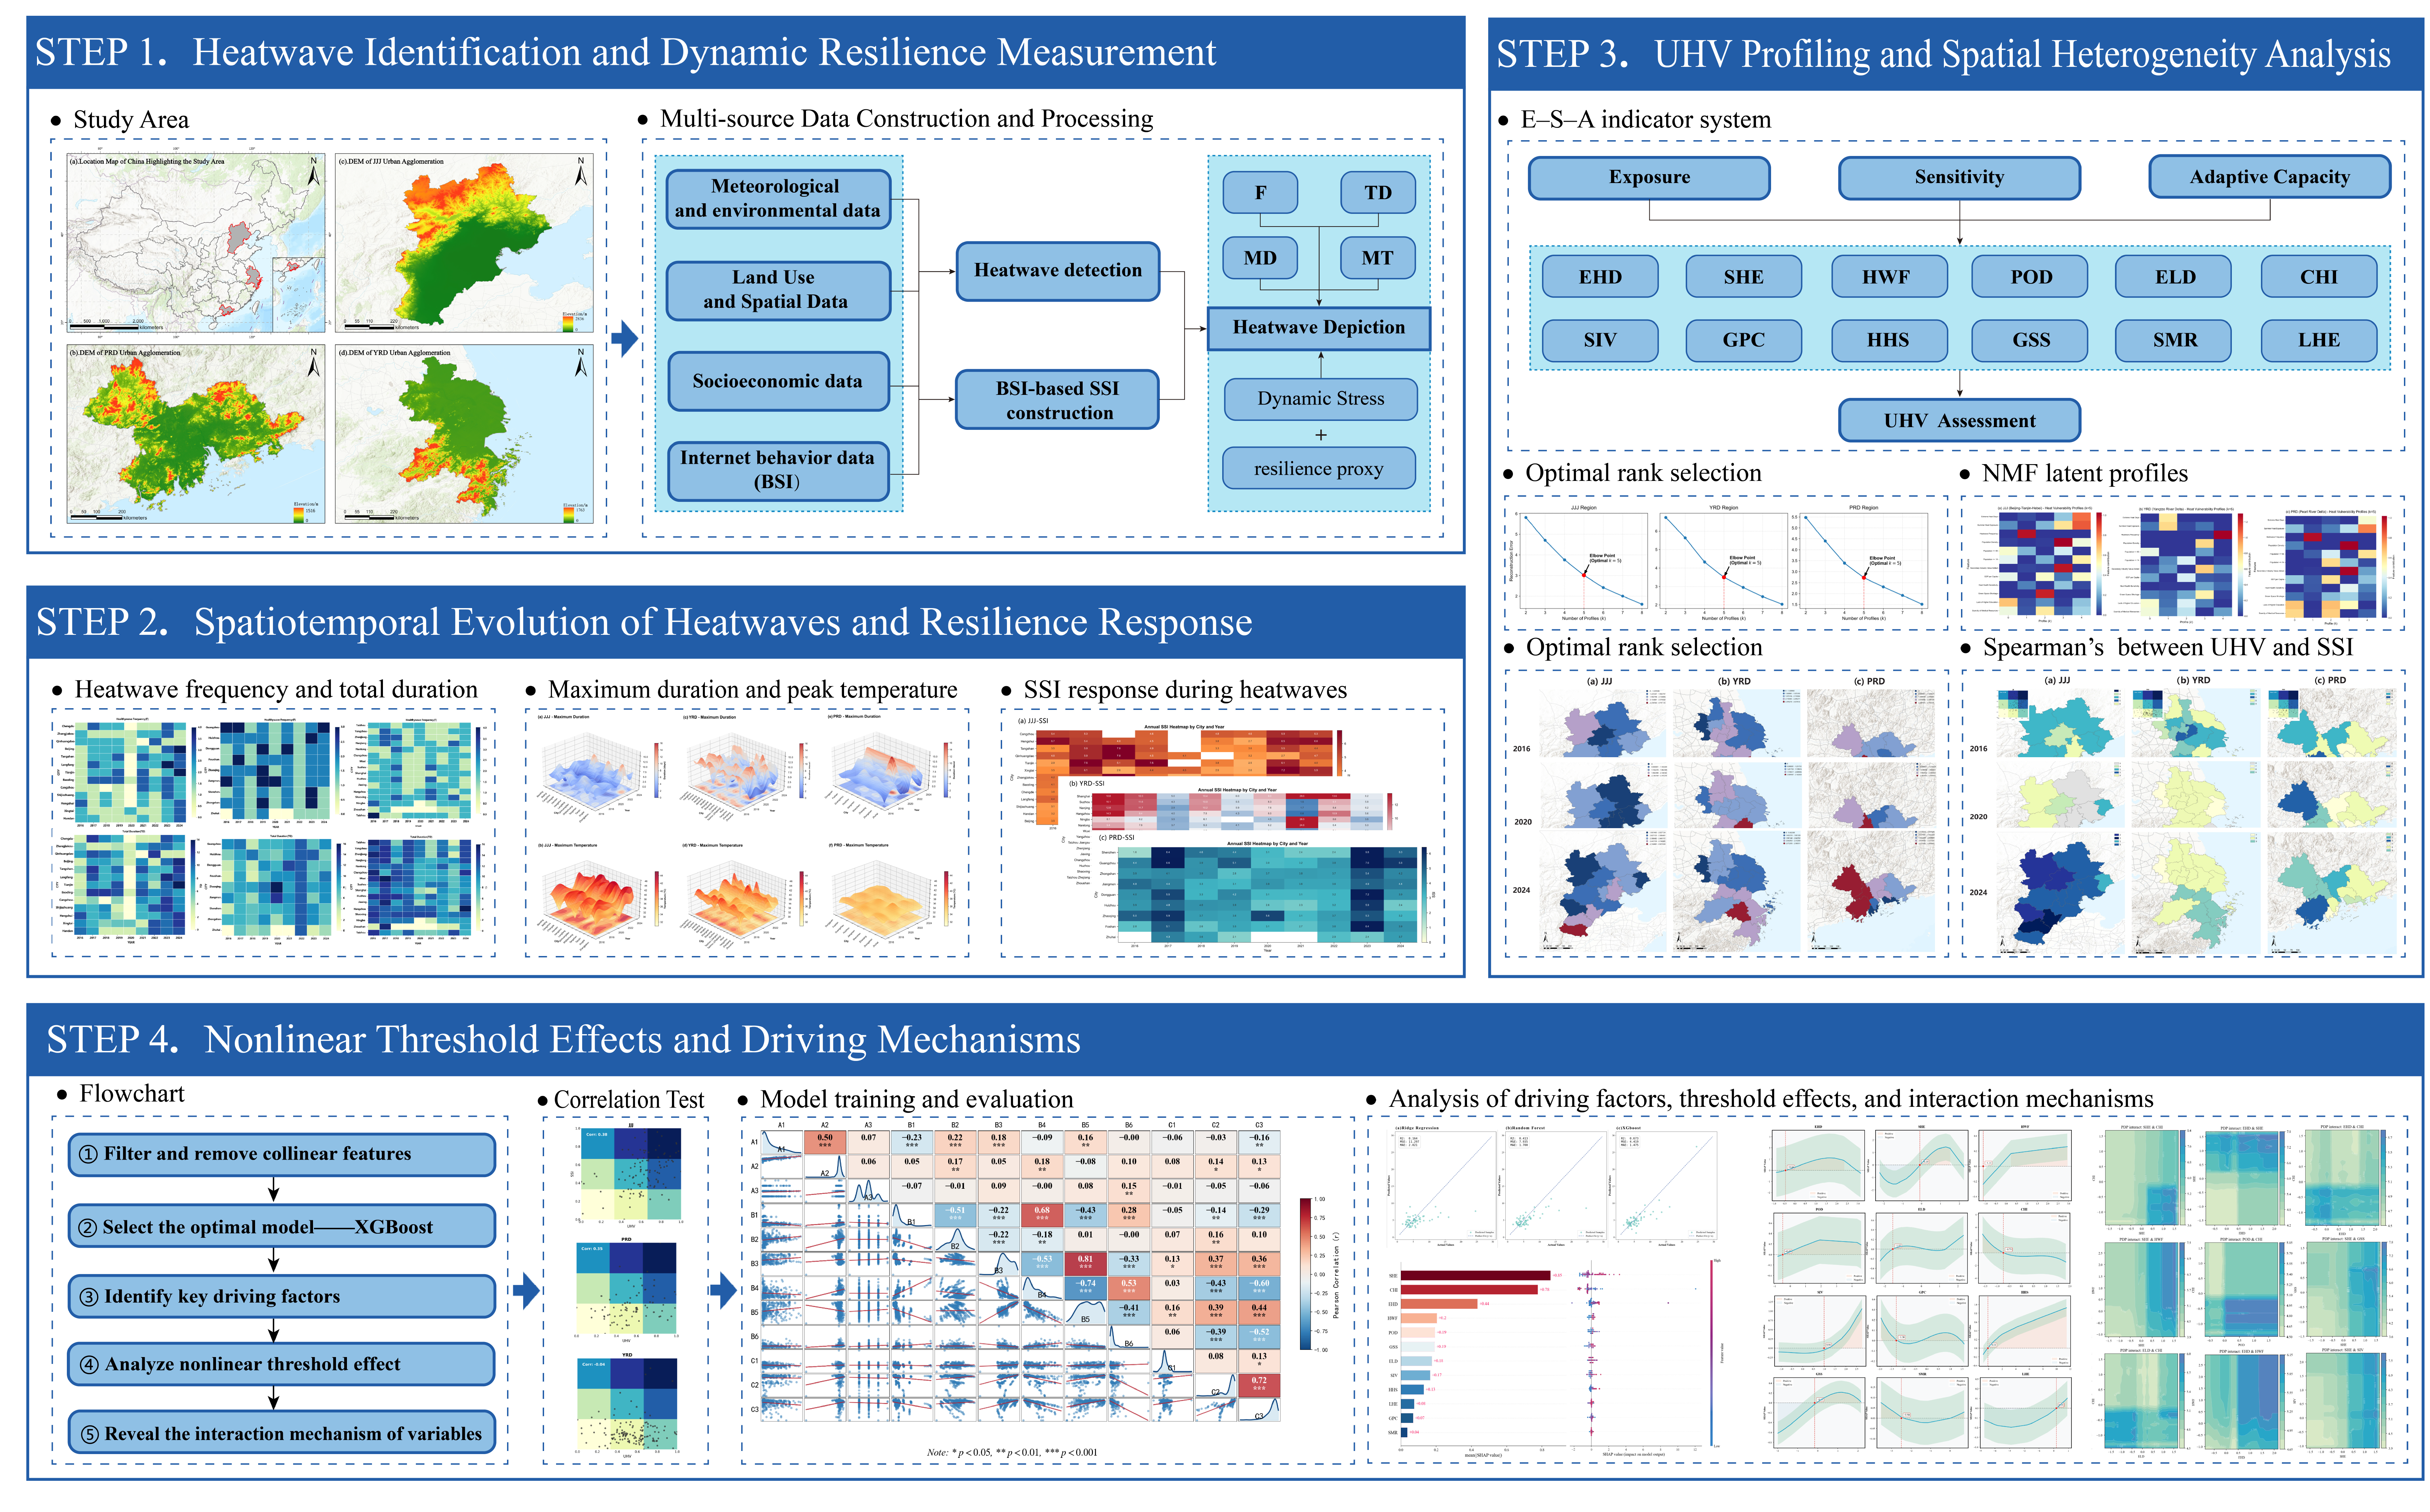
This study focuses on China’s three major eastern urban agglomerations and proposes a research framework (Figure 1) for investigating the spatial heterogeneity and threshold effects of urban resilience under heatwave events. We first conduct heatwave identification for 38 cities in the three major urban agglomerations during 2016–2024, accurately determine the annual heatwave periods of the 38 cities, preliminarily identify the spatiotemporal distribution patterns of heatwave events, and simultaneously extract the BSI during heatwave periods to quantify the dynamic resilience response of cities. On this basis, we construct a UHV assessment system based on the exposure–sensitivity–adaptive capacity framework and use NMF to identify UHV profiles, while applying the Spearman correlation coefficient to analyze the associations between UHV under different urban profiles and the dynamic response of urban resilience. Subsequently, the XGBoost model is used to reveal the non-linear associations linking UHV and urban resilience under heatwave conditions, and to construct an identification model for the dynamic threshold behaviors of urban resilience. By introducing nonlinear regression methods, this framework traces the resilience influence mechanisms of different factors within the UHV framework from a dynamic perspective, and reveals the key factors underlying the “resilience fatigue” phenomenon in different cities under heatwave conditions.

2.2. Study Area

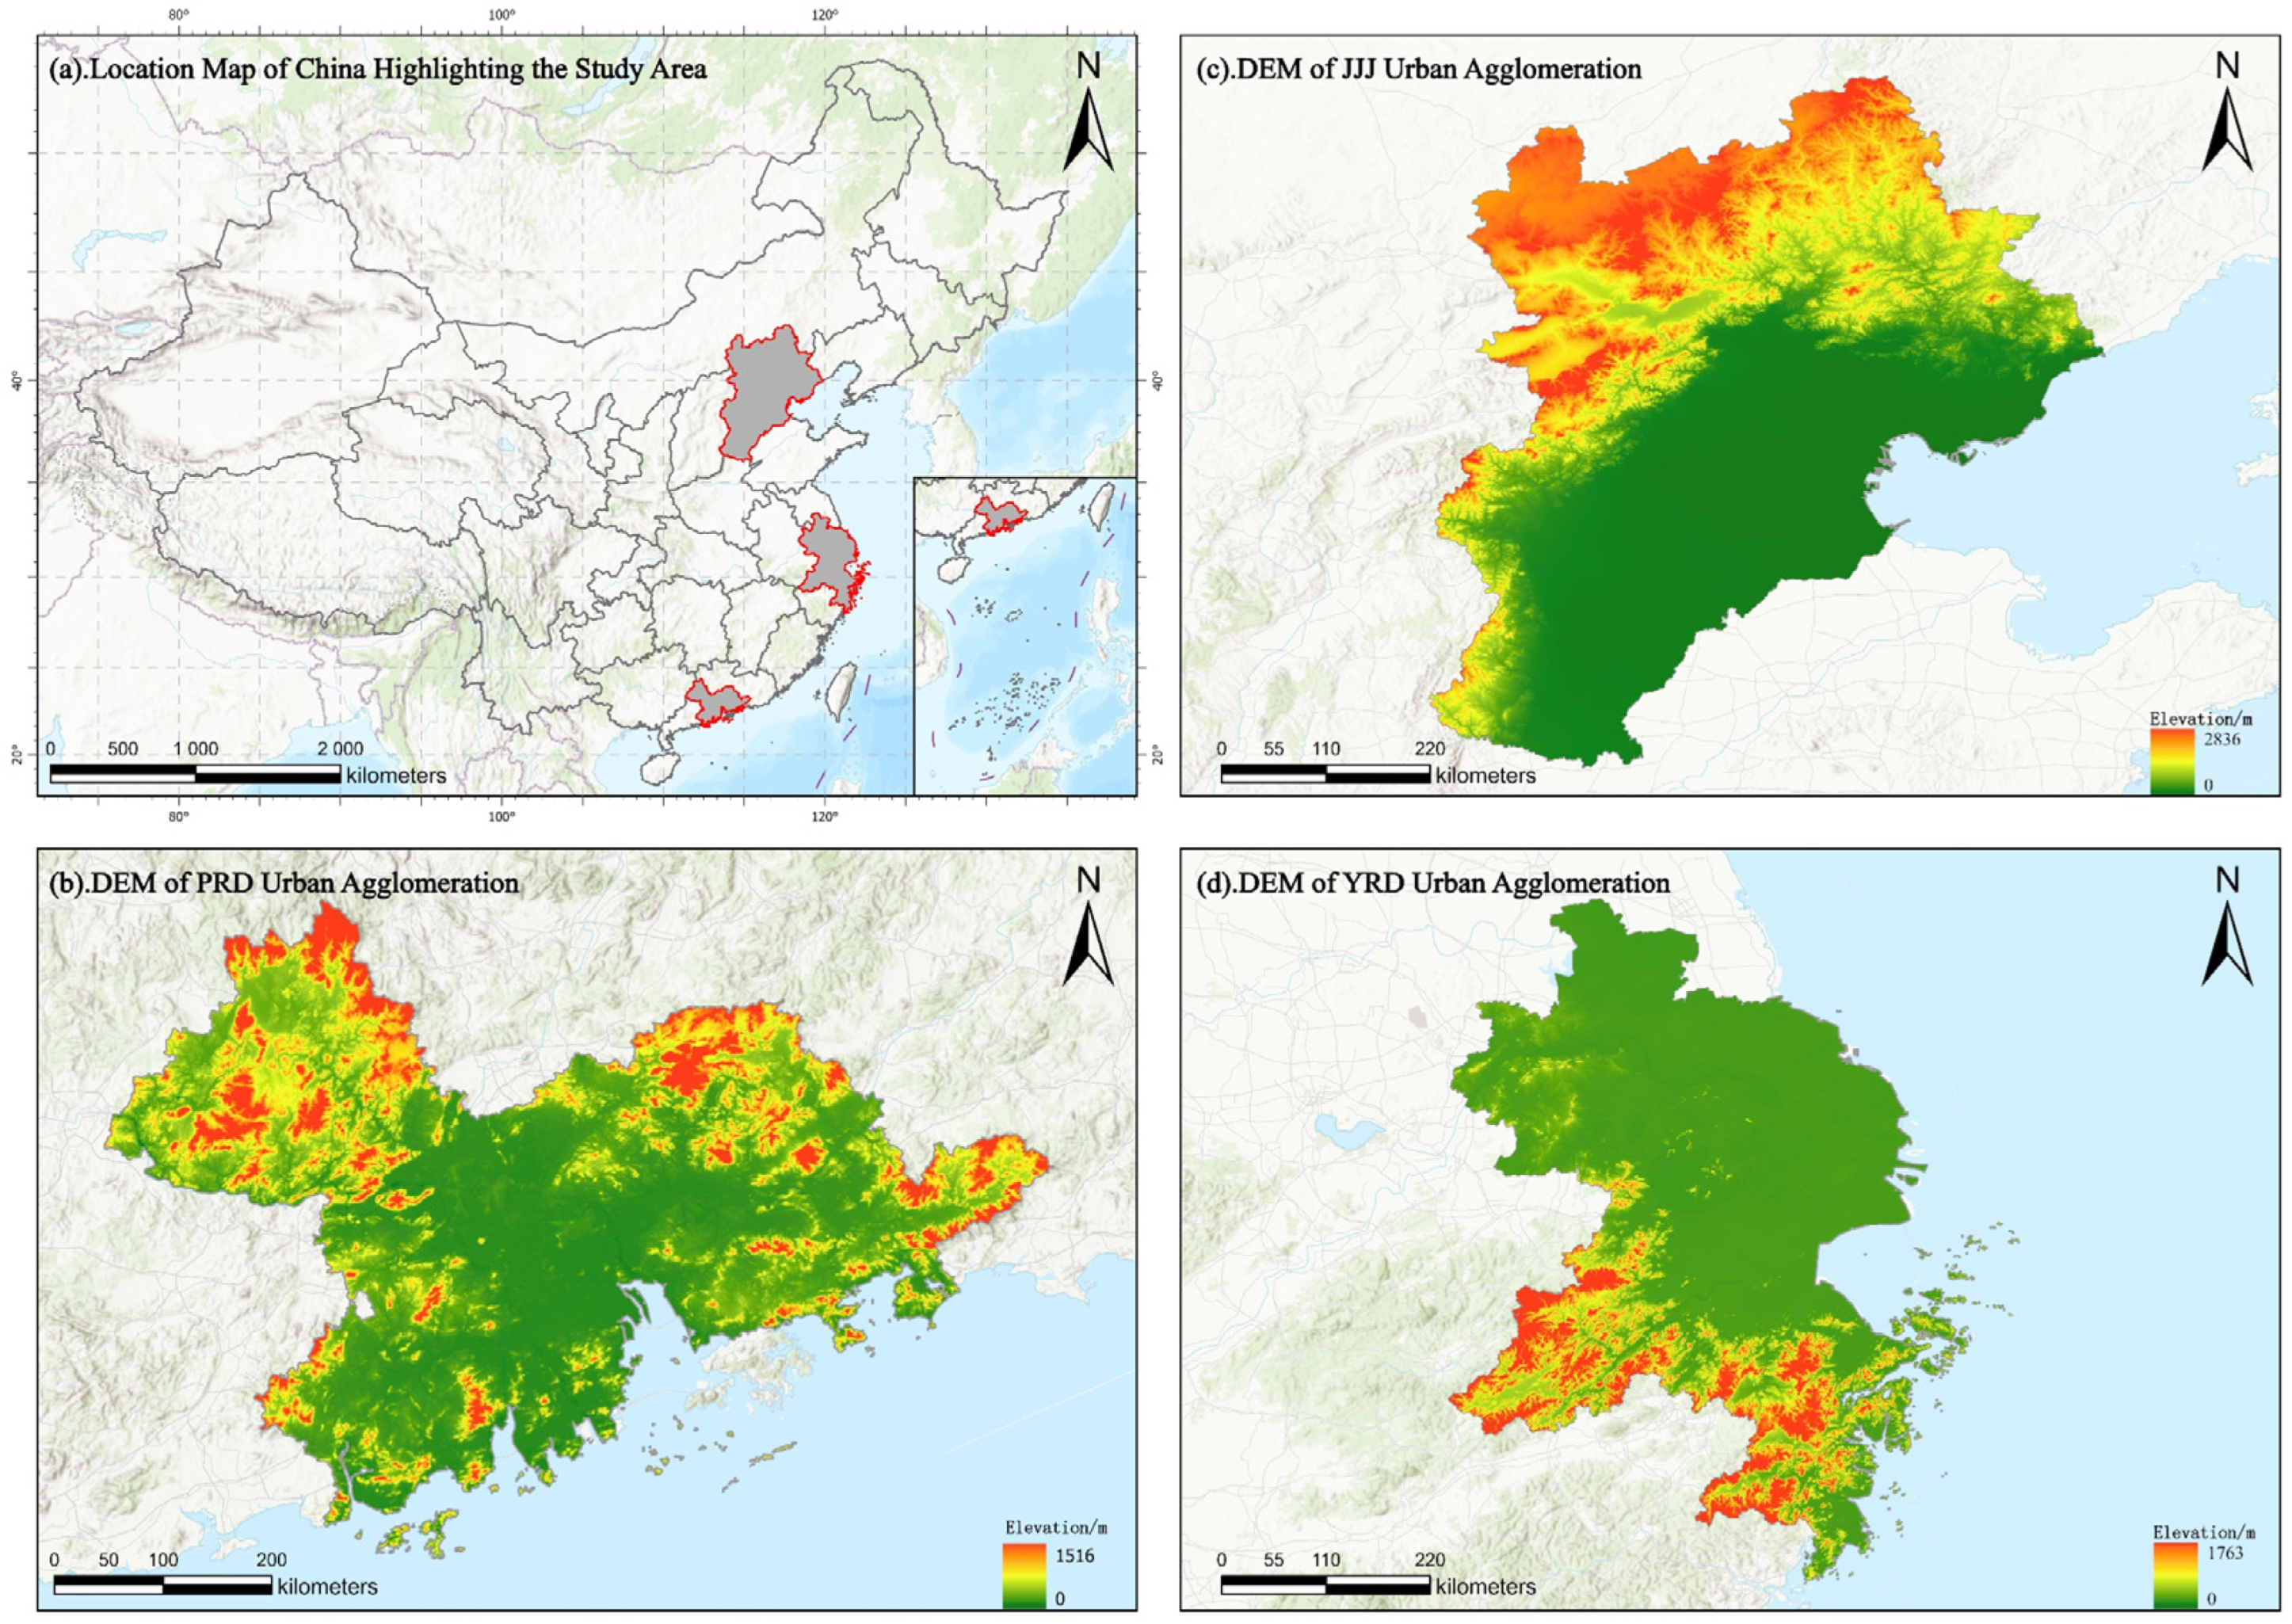
This study selects 38 cities in the three major eastern coastal urban agglomerations of China—Jing–Jin–Ji (JJJ), Yangtze River Delta (YRD), and Pearl River Delta (PRD)—as the study area (Figure 2). Their geographic locations and socioeconomic backgrounds exhibit both certain commonalities and significant heterogeneity. From a climatic perspective, all three urban agglomerations are located in the eastern coastal zone, but JJJ lies in the warm temperate zone and has a semi-humid monsoon climate with hot summers; YRD is located in the subtropics and has a humid monsoon climate, with frequent extreme heat in recent years; and PRD is situated in the south subtropics and has a maritime monsoon climate, with perennial heat and abundant rainfall and frequent influence from tropical cyclones. Together, these characteristics form a pronounced regional climatic gradient.
In addition, topographic elevation reveals another key factor underlying both the climatic differences and shared heat characteristics of the three regions. In JJJ, the terrain is high in the northwest and low in the southeast, causing the northwestern mountains to block summer airflow and allowing heat to accumulate easily in the plains. By contrast, although YRD is dominated by alluvial plains with limited hilly landforms in the south, its low-latitude setting and open, well-connected topography facilitate the large-scale spread of heatwave events. PRD has the most complex and fragmented terrain, consisting of central plains surrounded by hills, which is unfavorable for internal monsoon circulation and water vapor transport. Likewise, as the core growth poles with the highest level of urbanization in China, the three major urban agglomerations bear extremely high population density and energy consumption, accompanied by severe anthropogenic heat emissions [17], resulting in a significant urban heat island effect. Therefore, the three major urban agglomerations face severe heat risk stress, providing excellent samples for this study. By comparing these three highly representative regions, it is possible to scientifically reveal the spatial differences in urban resilience responses and the system tolerance thresholds under heat risk across different urban characteristics.

2.3. Data Sources

This study collected multi-source data for a total of 38 cities in the three major urban agglomerations. Administrative boundary vector data were obtained from the 1:1,000,000 public basic geographic information dataset released by the National Geomatics Center of China. Meteorological and environmental data were derived from the ERA5 global climate reanalysis dataset released by the European Centre for Medium-Range Weather Forecasts through the Copernicus Climate Change Service and were used to extract key climatic parameters such as the annual number of extreme high-temperature days (EHD) and heatwave frequency (HWF). Land-use data were obtained from the China multi-period land-use remote sensing monitoring dataset provided by the Resource and Environmental Science Data Center of the Chinese Academy of Sciences, with a spatial resolution of 30 m and a secondary classification system. Socioeconomic indicators, including population, economy, and medical resources, were collected from the China Statistical Yearbook and statistical yearbooks of provinces and cities. In addition, public health perception data were obtained from the Baidu Index data-sharing platform, covering the daily search frequencies for the keywords “sunstroke”, “heat stroke”, and “high temperature” in each city from 2016 to 2024. During preprocessing, data integration involved grid-to-city ERA5 aggregation, linear interpolation for missing entries, and strict administrative-temporal alignment to systematically synchronize daily behavioral traces with annual indicators.

2.4. Heatwave Identification and Quantification of the Threshold Effects of Urban Resilience Response

This study uses a dual-threshold method based on the combination of “the 90th percentile threshold of the summer season within each year + regional absolute temperature threshold + 3 consecutive days” to identify heatwave events. Specifically, the relative threshold is used to reflect the abnormality of each city relative to its own climatic background; the requirement of 3 consecutive days ensures the persistence of the heatwave, and the absolute temperature threshold is used to ensure that the event entails a realistic heat-related health risk [36].
Considering the significant differences among the three major urban agglomerations in latitudinal location and hot-humid conditions, we refer to previous studies to set differentiated absolute temperature thresholds for the Jing–Jin–Ji (JJJ), Yangtze River Delta (YRD), and Pearl River Delta (PRD), respectively. Specifically, JJJ is located at relatively high latitudes and is jointly influenced by the temperate monsoon climate and temperate continental climate; therefore, 33 °C is adopted as the absolute threshold [37]. YRD has a subtropical monsoon climate, with more pronounced hot and humid conditions in summer, and thus 35 °C is adopted as the absolute threshold [38]. PRD is located in the low-latitude coastal region of southern China and is strongly influenced by monsoon circulation and oceanic regulation; therefore, a threshold of 35 °C is also adopted for heatwave identification [39].
Based on the above definitions, this study takes the daily maximum temperature of city i in year y , T i , t m a x , as the basis and first calculates the 90th percentile threshold of daily maximum temperature during the warm-season baseline period for that city, P 90 , i Furthermore, let the regional absolute temperature threshold for the three major urban agglomerations be T g * ; then:
For g = JJJ,
T g * = 33   ° C ,
For g = YRD,
T g * = 35   ° C ,
For g = PRD,
T g * = 35   ° C
where g denotes the urban agglomeration to which city i belongs.
At the city level, the relative threshold is defined as:
P 90 , i = Q u a n t i l e 0.90 ( T i , t m a x ) , t Ω i
where Ω i is the set of warm-season daily sequences for city i.
If a given day simultaneously satisfies both the relative threshold and the absolute threshold, it is defined as a potential heatwave day:
H W i , t = 1 , T i , t max     P 90 , i   and   T i , t max     T g * 0 , o t h e r s
Accordingly, when city i satisfies H W i , t   =   1 for L consecutive days and L     3 , that period is identified as a heatwave event. This is expressed as:
Heatwave   Event i , e   =   1   if   H W i , t   =   1 ,   t     [ s e , s e   +   L i , e     1 ]   and   L i , e     3
It should be noted that if no heatwave occurs in a given city in a given year, that city-year is excluded from the scope of this study. Subsequently, the study further extracts indicators such as heatwave frequency F i , y , cumulative duration D i , y , maximum duration L i , y , and the maximum temperature during the heatwave period H i , y to characterize the spatiotemporal evolution of heatwave processes across different cities:
F i , y   =   e = 1 E i , y 1 ;   D i , y   =   e = 1 E i , y L i , e
Max   D i , y = max L i , e ;   H T i , t max = max t H i , y T i , t max
where E i , y is the total number of heatwave events identified in city i in year y, and H i , y is the set of all heatwave days in that year.
After identifying heatwave events, to accurately capture the dynamic resilience response and threshold effects of urban resilience during heatwave periods, this study uses the daily BSI, which has high spatiotemporal resolution, as a proxy for the urban resilience response. Following previous studies, we select three keywords, namely “sunstroke”, “high temperature”, and “heat stroke” [25,40], to directly reflect the physiological stress and health anxiety of urban populations during heatwave periods, thereby quantifying the adaptive feedback of the social system under extreme heat stress. As a digital proxy for social perception, the dynamic fluctuations of the BSI characterize the process by which the public shifts from a routine steady state to an emergency stress state, constituting a direct mapping of the “response sensitivity” of urban resilience. Theoretically, within social-ecological resilience frameworks [20], these immediate health-seeking behaviors reflect the cognitive activation of a system’s adaptive capacity [22]; an abnormal surge (high SSI) thus marks the critical inflection point where routine community buffering is overwhelmed, effectively signifying localized social resilience fatigue [5]. To account for differences in population size and internet use habits across cities, this study constructs the Standardized Stress Index (SSI) to quantify the outlier multiple by which search intensity deviates from its daily baseline fluctuations, thereby measuring the extent to which social health concern under heatwave shocks breaks through the normal fluctuation band. When the SSI significantly exceeds the “buffer zone” of normal fluctuations, it indicates that social perception has crossed the tolerance ceiling and entered a nonlinear outbreak stage. The maximum SSI during a heatwave period then reflects the degree of social stress failure in the city, thereby providing a scientific characterization of the extent of social impact after urban resilience has taken effect and indicating the degree to which resilience exceeds its tolerance limit during heatwave events.
Specifically, let B I i , t denote the heat-related health concern index of city i on date t. This indicator is obtained by summing the daily BSI values for the three keywords “sunstroke”, “heat stroke”, and “high temperature”. For each heatwave event e, this study defines the 14 days preceding the event as the baseline window B i , e and the heatwave duration as the shock window H i , e .
Accordingly, the baseline-period mean, baseline-period standard deviation, and heatwave-period peak are defined as follows:
B I ¯ i , e b a s e = 1 14 k = 1 14 B I i , s e k
σ i , e b a s e = 1 13 k = 1 14 B I i , s e k B I ¯ i , e b a s e 2
B I i , e max = max t H i , e B I i , t
Accordingly, the SSI of city i under heatwave event e is defined as:
S S I i , e = B I i , e max B I ¯ i , e b a s e σ i , e b a s e
If a city experiences multiple heatwave events within a year, the average value of the corresponding social stress response index is taken as the annual threshold response intensity. In terms of indicator interpretation, the SSI measures whether urban health concern under heatwave shocks deviates significantly from normal conditions. A larger SSI indicates that urban resilience is more likely to fail under heatwave shocks and that resilience fatigue is more severe.

2.5. Urban Heat Vulnerability Evaluation Index System

This study adopts the exposure–sensitivity–adaptive capacity framework proposed by the Intergovernmental Panel on Climate Change (IPCC) [41], and, on the basis of existing research, constructs a multidimensional composite indicator system for UHV in accordance with the principles of scientific rigor, effectiveness, and representativeness. Considering multicollinearity and data availability, heat vulnerability is represented by a total of 12 indicators across three dimensions: exposure, sensitivity, and adaptive capacity (Table 1). In this study, to more sensitively capture the association between resilience thresholds and UHV, and given that sensitivity places greater emphasis on the stress intensity of urban systems during heatwave events, relatively more indicators are assigned to the sensitivity dimension to better reflect differences in the responses of social demographics and economic structure to heat exposure and to better characterize regional heterogeneity among cities.

2.6. Non-Negative Matrix Factorization (NMF) for Restoring Spatial Heterogeneity

To effectively reflect UHV heterogeneity across different urban agglomerations, we used NMF to quantitatively calculate the UHV evaluation index system constructed above. NMF is an unsupervised learning algorithm based on low-rank matrix decomposition. It decomposes the high-dimensional observation matrix V into the product of a basis matrix W and a coefficient matrix H (V = WH), thereby achieving data dimensionality reduction and feature extraction and enabling complex social indicators to be parsed into distinct feature profiles.
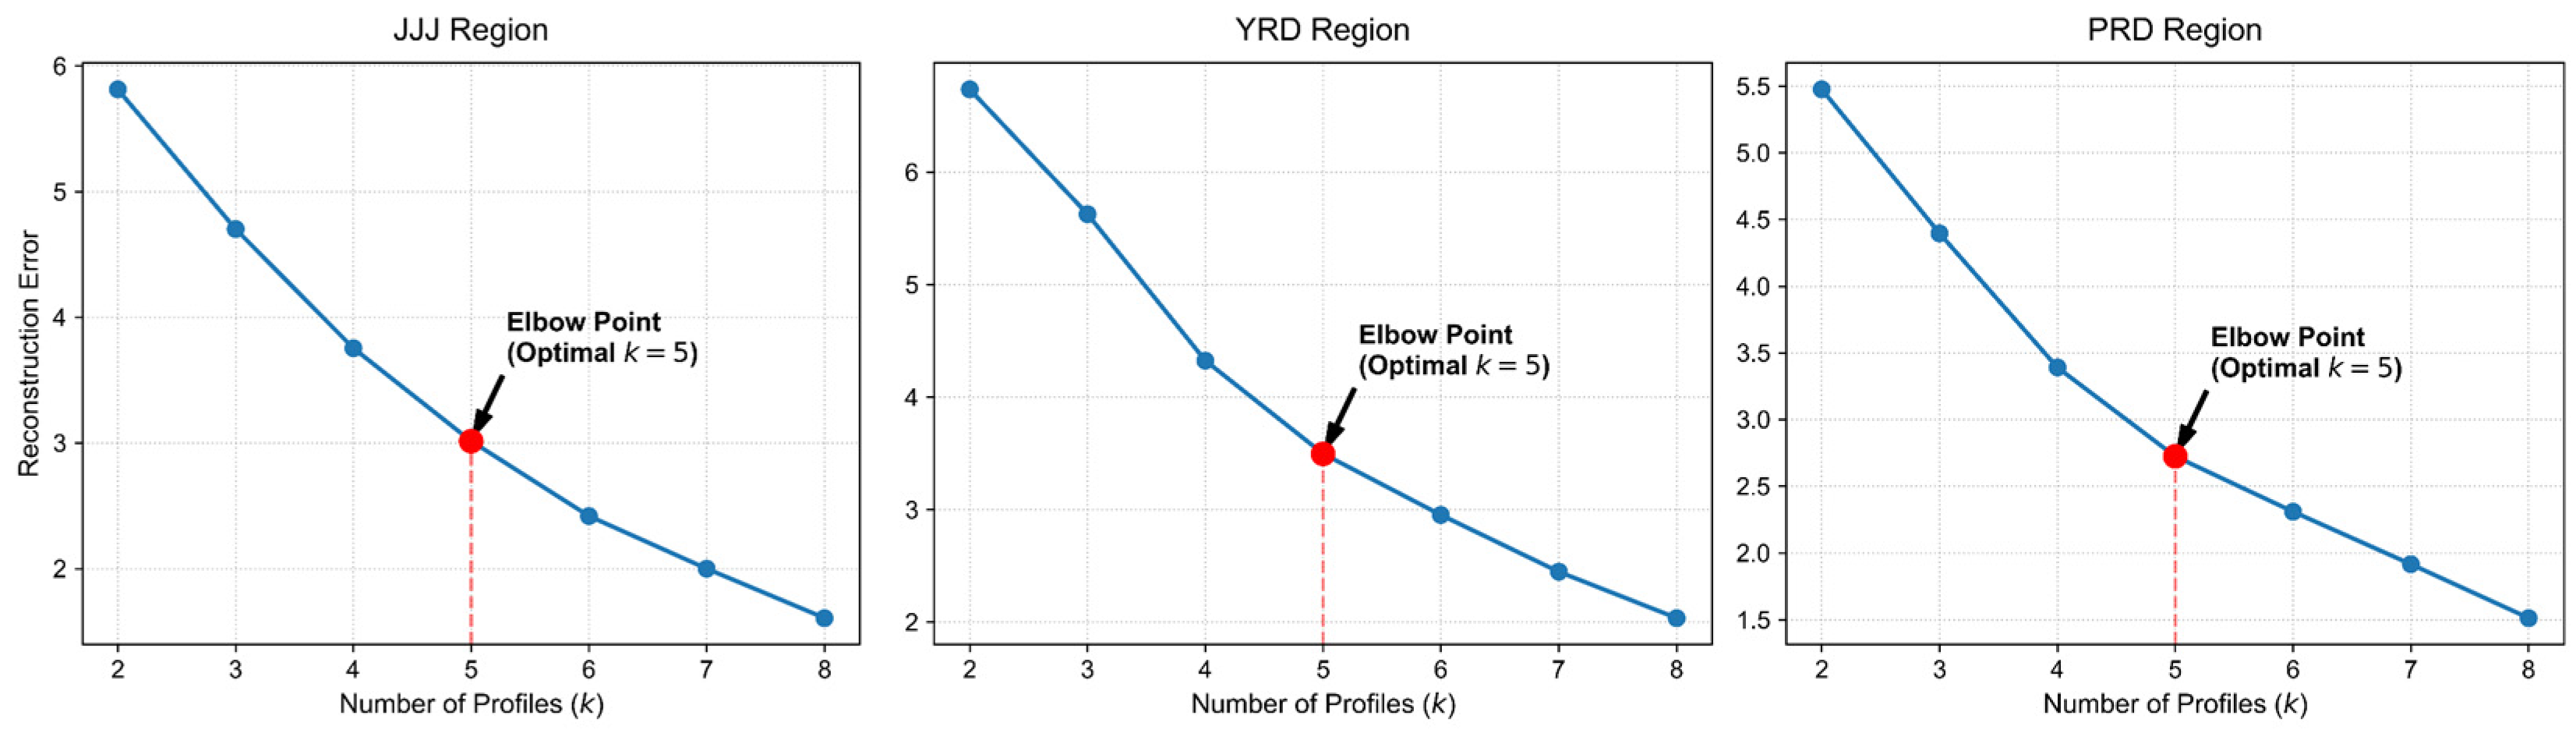
Based on this method, we integrated the 12 vulnerability indicators of 38 cities in the three major coastal urban agglomerations from 2016 to 2024 into an input matrix and, using urban agglomeration membership as the basis for grouping, applied the NMF algorithm separately to decompose the UHV profiles within each urban agglomeration. Before this, using the heat vulnerability data of the three urban agglomerations as the benchmark, we plotted reconstruction error curves for each of them and selected the “elbow-point” K value at which the cophenetic correlation coefficient remained relatively high and the reconstruction error curve tended to flatten, which was taken as the decomposition rank of UHV for the three major urban agglomerations in this study.
Subsequently, through NMF, this study treated the three major urban agglomerations as spatial variables and extracted vulnerability feature profiles for different urban agglomerations according to their specific K values, thereby identifying the dominant feature combinations driving heat vulnerability in different urban agglomerations. In addition, the sum of each city’s membership weights across the K vulnerability profiles of its corresponding urban agglomeration was used as a proxy variable for its vulnerability level. Mathematically, the sum of membership weights represents the integrated mapping length of the sample after normalization across the 12 indicators, which can reflect the structural superposition effect and total system burden of UHV. Because the baseline indicators are identically normalized across all regions prior to decomposition, these region-specific sums consistently capture the absolute cumulative multi-dimensional burden within each agglomeration’s unique structural context. A larger sum generally indicates more severe accumulation of vulnerability across multiple dimensions in that city and therefore a higher UHV. Through the above approach, the heat vulnerability characteristics of different urban agglomerations can be preliminarily revealed, and the heat vulnerability level of each target city can be quantified under the premise of spatial heterogeneity.
To further investigate heterogeneous patterns under different UHV characteristics, we used the Spearman correlation coefficient to examine differences in urban resilience responses under different vulnerability features. The SSI calculated above was used as an indicator of the magnitude of the resilience response threshold and was matched with the sum of the membership weights of the vulnerability profiles generated by NMF. By comparing the annual distribution of correlations from 2016 to 2024, we quantified the interaction patterns between different vulnerability profiles and health risks, thereby providing an in-depth reflection of differences in urban performance during heatwave events under spatial heterogeneity.

2.7. Machine Learning Interpretation of the Nonlinear Factors Behind Resilience Fatigue

Because the driving factors of UHV underlying urban resilience exhibit complex nonlinear interactions, accurately characterizing these relationships is essential for regulating the urban thermal environment. This study introduced three machine learning models: Ridge Regression, Random Forest, and XGBoost. Ridge Regression is a regression algorithm in supervised learning. It is an improvement over ordinary least squares and addresses overfitting and multicollinearity by introducing L_2 regularization. As a classical machine learning method, Random Forest trains each tree on a randomly selected subset of the data and uses random subsets of predictor variables; the predictions of all trees are then aggregated to generate the final output, thereby enhancing robustness against overfitting [52,53,54]. XGBoost constructs a more robust ensemble model by iteratively integrating multiple weak predictive models [55,56], with the 12 representative heat vulnerability indicators set as the independent variables and SSI as the dependent variable.
Using Pearson correlation coefficient analysis, variables with high correlations (greater than 0.85) were excluded. This process ensured that the selected features had high importance while minimizing the influence of multicollinearity on the model to the greatest extent possible [57]. The above explanatory variables were then used to train the models. The dataset was randomly divided into testing (19%) and training (81%) subsets, with the random seed set to 42. During model evaluation, standard metrics, including MSE, mean absolute error (MAE), and the coefficient of determination (R2), were used [58,59] to assess model performance on both the training and testing datasets.
To address the black-box effect of machine learning, this study introduced the SHAP interpretive framework [60,61] to explain the outputs of machine learning models and to obtain the contribution and directional effects of features in the best-performing model. To analyze the nonlinear marginal effects of driving factors, the study combined partial dependence plot (PDP) and individual conditional expectation plots. By averaging the effects of other features [62], PDP reveals the general driving logic of UHV factors on SSI.

3. Results

3.1. Spatiotemporal Characteristics of Heatwave Distribution

3.1.1. Heatwave Frequency (F) and Total Duration (TD)

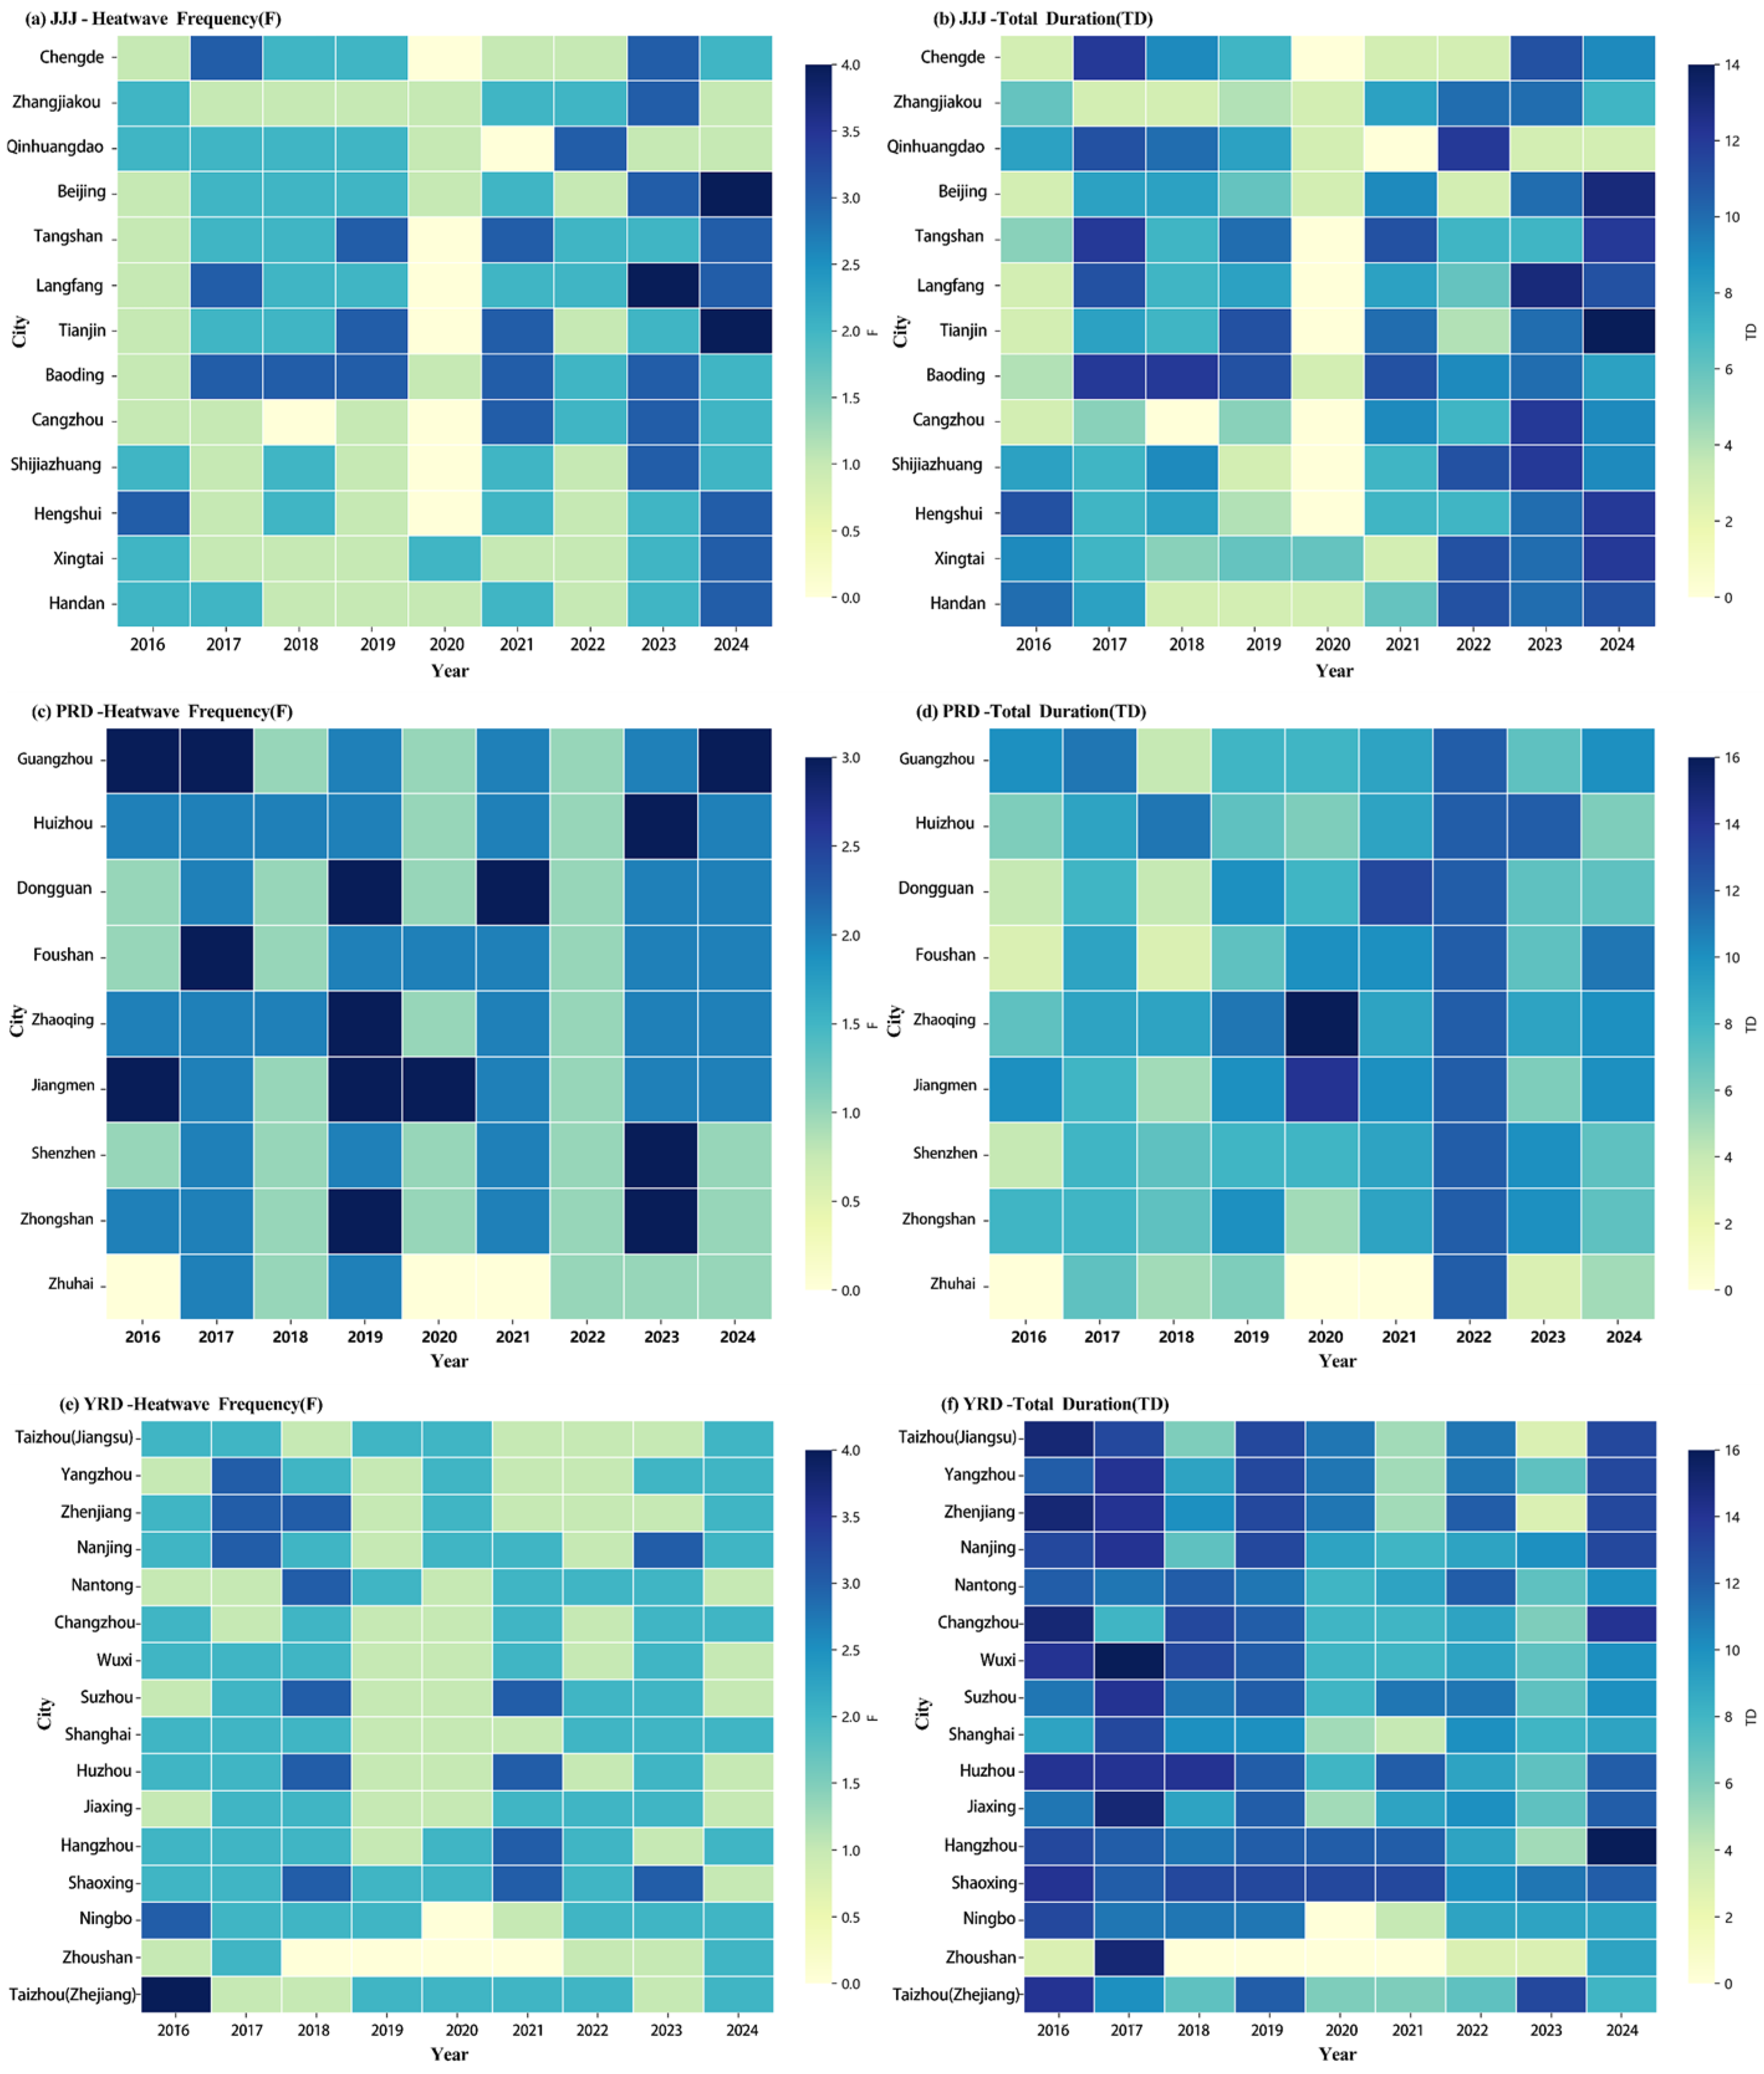
From 2016 to 2024, the spatiotemporal evolution of heatwave frequency (F) and total duration (TD) in the three major urban agglomerations, JJJ, YRD, and PRD, differs markedly (Figure 3). In terms of overall characteristics, PRD exhibits a more frequent fluctuation rhythm and pronounced stage-specific features, with periods of high frequency and long duration distributed relatively concentratively, while the overall variation remains comparatively stable and continuous. YRD, by contrast, shows a pronounced inverse fluctuation pattern: F is generally characterized by “high in the middle and low at both ends”, whereas TD follows a pattern of “high at both ends and low in the middle”. Compared with these two urban agglomerations, JJJ displays much more intense interannual fluctuations, including an abrupt region-wide decline in both indicators in 2020, followed by a rapid rebound and the formation of high-value clusters in the subsequent years; the magnitude of change is clearly greater than that in the other two urban agglomerations. Overall, the three major urban agglomerations exhibit significant differences in their spatiotemporal patterns: PRD is relatively stable, YRD shows inverse and complementary fluctuations, and JJJ is mainly characterized by stage-specific abrupt changes, reflecting differences in regional climatic environments.

3.1.2. Maximum Duration of Heatwave (MD) and Highest Temperature During Heatwave (MT)

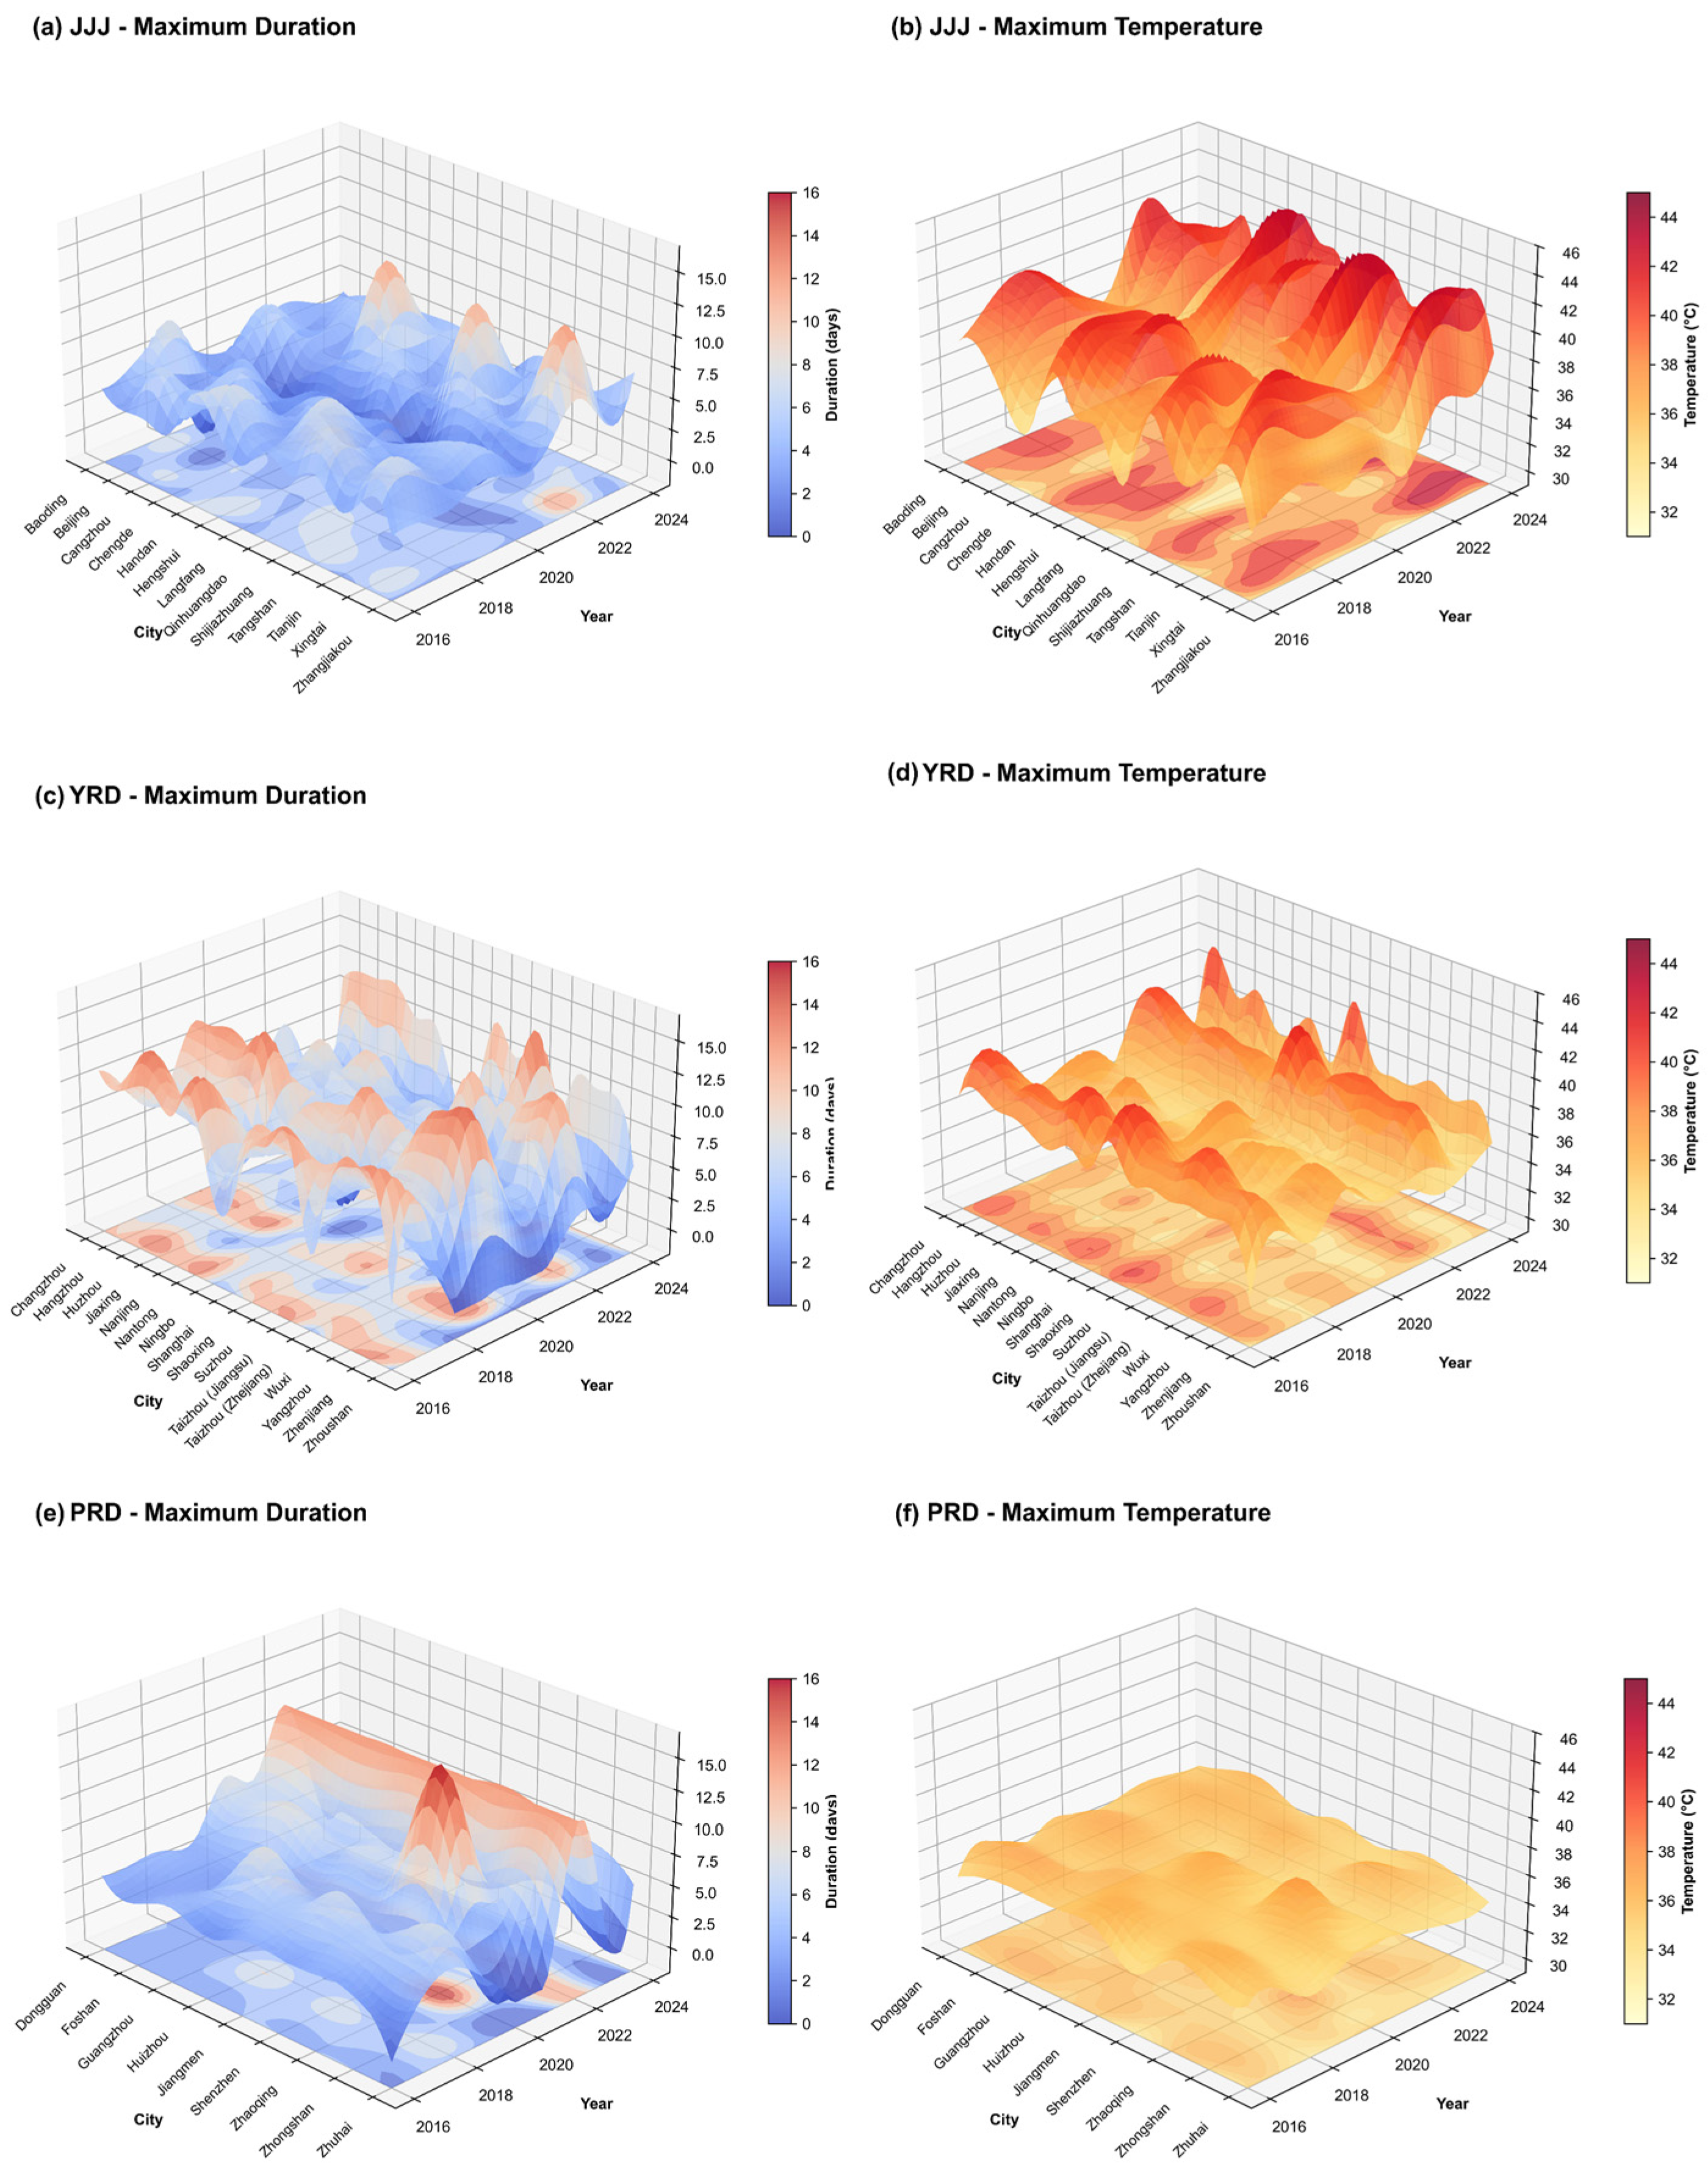
Figure 4 shows the spatiotemporal differences in MD and MT among the three urban agglomerations. Overall, from 2016 to 2024, MD and MT in the three urban agglomerations exhibit complex spatiotemporal dual fluctuations, which are most evident in YRD. For the MD indicator, the MD surface in JJJ fluctuates most smoothly and remains generally low, with high values appearing only in Xingtai, Handan, and Shijiazhuang in 2022. Similarly, PRD shows a relatively small overall fluctuation range, but presents region-wide high values in 2022. By contrast, YRD exhibits the most intense fluctuations, and MD remains at relatively high levels across most of the spatiotemporal domain. In addition, the MT surface in JJJ fluctuates substantially and is clearly higher than that in PRD and YRD. PRD shows smooth fluctuations and the lowest values, maintaining an overall stable pattern. The MT surface in YRD is consistent with its MD surface, showing relatively intense fluctuations. It is also noteworthy that, in 2020, most cities in all three urban agglomerations showed comparatively low values for both indicators relative to other periods, with only Shenzhen exhibiting a pronounced high-value feature in the MD indicator.

3.2. Quantifying the Threshold Effects of Urban Resilience During Heatwave Using SSI

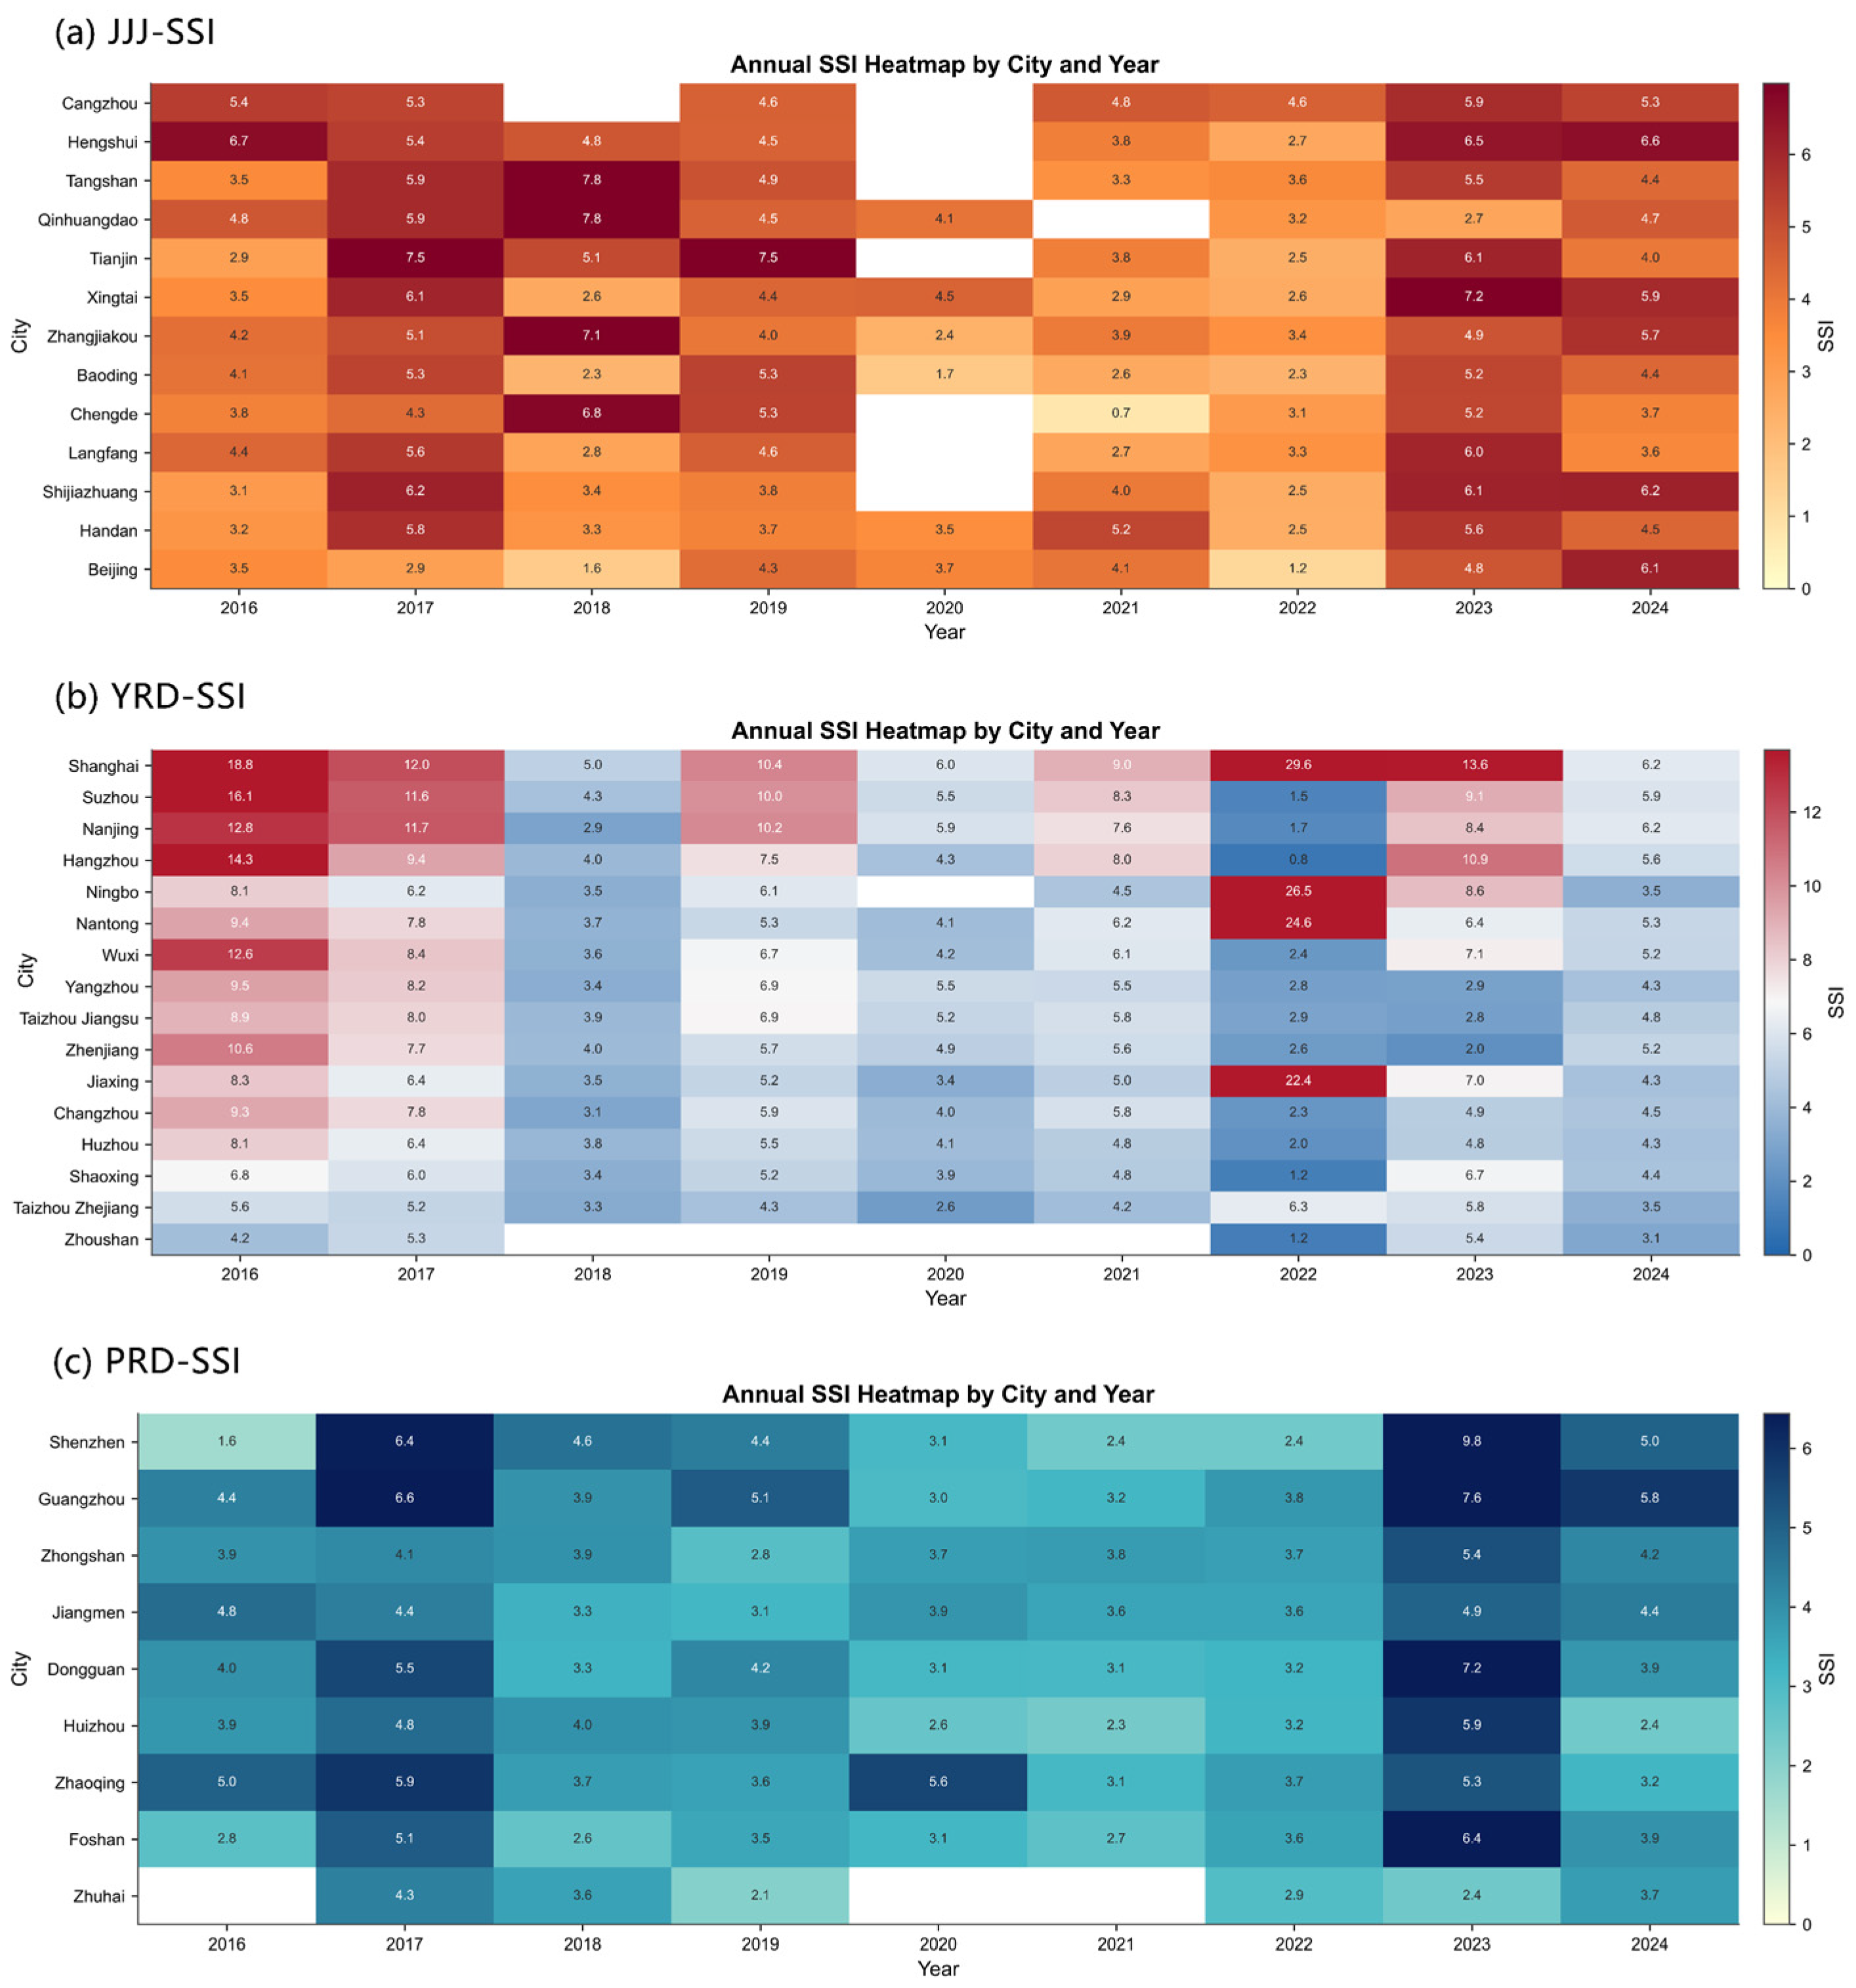
Figure 5 shows the spatiotemporal differences in SSI among the three urban agglomerations from 2016 to 2024. Overall, the extreme SSI values in YRD are far higher than those in JJJ and PRD. For example, Shanghai (29.6) and Ningbo (26.6) in YRD in 2022 are much higher than Qinhuangdao (7.8) and Tangshan (7.8) in JJJ in 2018. In terms of normalized values, the overall SSI distributions in JJJ and PRD are relatively concentrated in the low-to-medium range, whereas YRD is mainly concentrated in the medium-to-high range. Along the temporal dimension, high-value years in JJJ are relatively dispersed, with SSI values in 2017 and 2023 generally higher than in other years. YRD shows an overall high-value pattern in 2017, and in 2022 contains four exceptionally high-value areas: Jiaxing (22.4), Nantong (24.6), Ningbo (26.5), and Shanghai (29.6). PRD shows characteristics similar to those of JJJ, with high-value years relatively dispersed and overall values in 2017 and 2023 higher than in other years. Along the spatial dimension, high-value areas in JJJ are scattered in a point-like pattern, indicating a complex overall spatial distribution. Within YRD, a clear hierarchical differentiation is observed, with cities such as Shanghai, Suzhou, Nanjing, and Hangzhou showing markedly more high-SSI years than cities such as Zhoushan, Taizhou, and Zhejiang. In PRD, however, color differences among cities within the same year are small, indicating relatively limited internal spatial variation in SSI.

3.3. Extraction and Quantification of UHV Characteristic Profiles

3.3.1. Selection of Decomposition Rank

This study determines the optimal decomposition rank of UHV for JJJ, YRD, and PRD based on the NMF reconstruction error curves. The results are shown in Figure 6. As the number of latent profiles increases, the reconstruction errors of all three urban agglomerations show a pattern of sharp decline followed by gradual decrease, reflecting the trade-off in NMF between error minimization and information fragmentation. Across the sample groups of the three urban agglomerations, the variation in reconstruction error follows a broadly consistent pattern. Specifically, when k < 5, the error curves decline very steeply, indicating that increasing the number of characteristic profiles substantially enhances the ability of NMF to capture the original UHV data. However, when k > 5, the curves become flatter, and the marginal benefit of reducing reconstruction error decreases markedly. At this stage, the contribution of additional characteristic profiles to model performance is relatively limited and may instead hinder the precise characterization of UHV features by NMF. Notably, the reconstruction error curves of all three major urban agglomerations exhibit a clear “elbow point” at k = 5, suggesting that the model has sufficiently extracted the core structural characteristics of the data and achieves the best balance between information retention and model parsimony. Therefore, k = 5 is selected as the optimal decomposition rank for UHV analysis in the three major urban agglomerations.

3.3.2. UHV Characteristic Decomposition

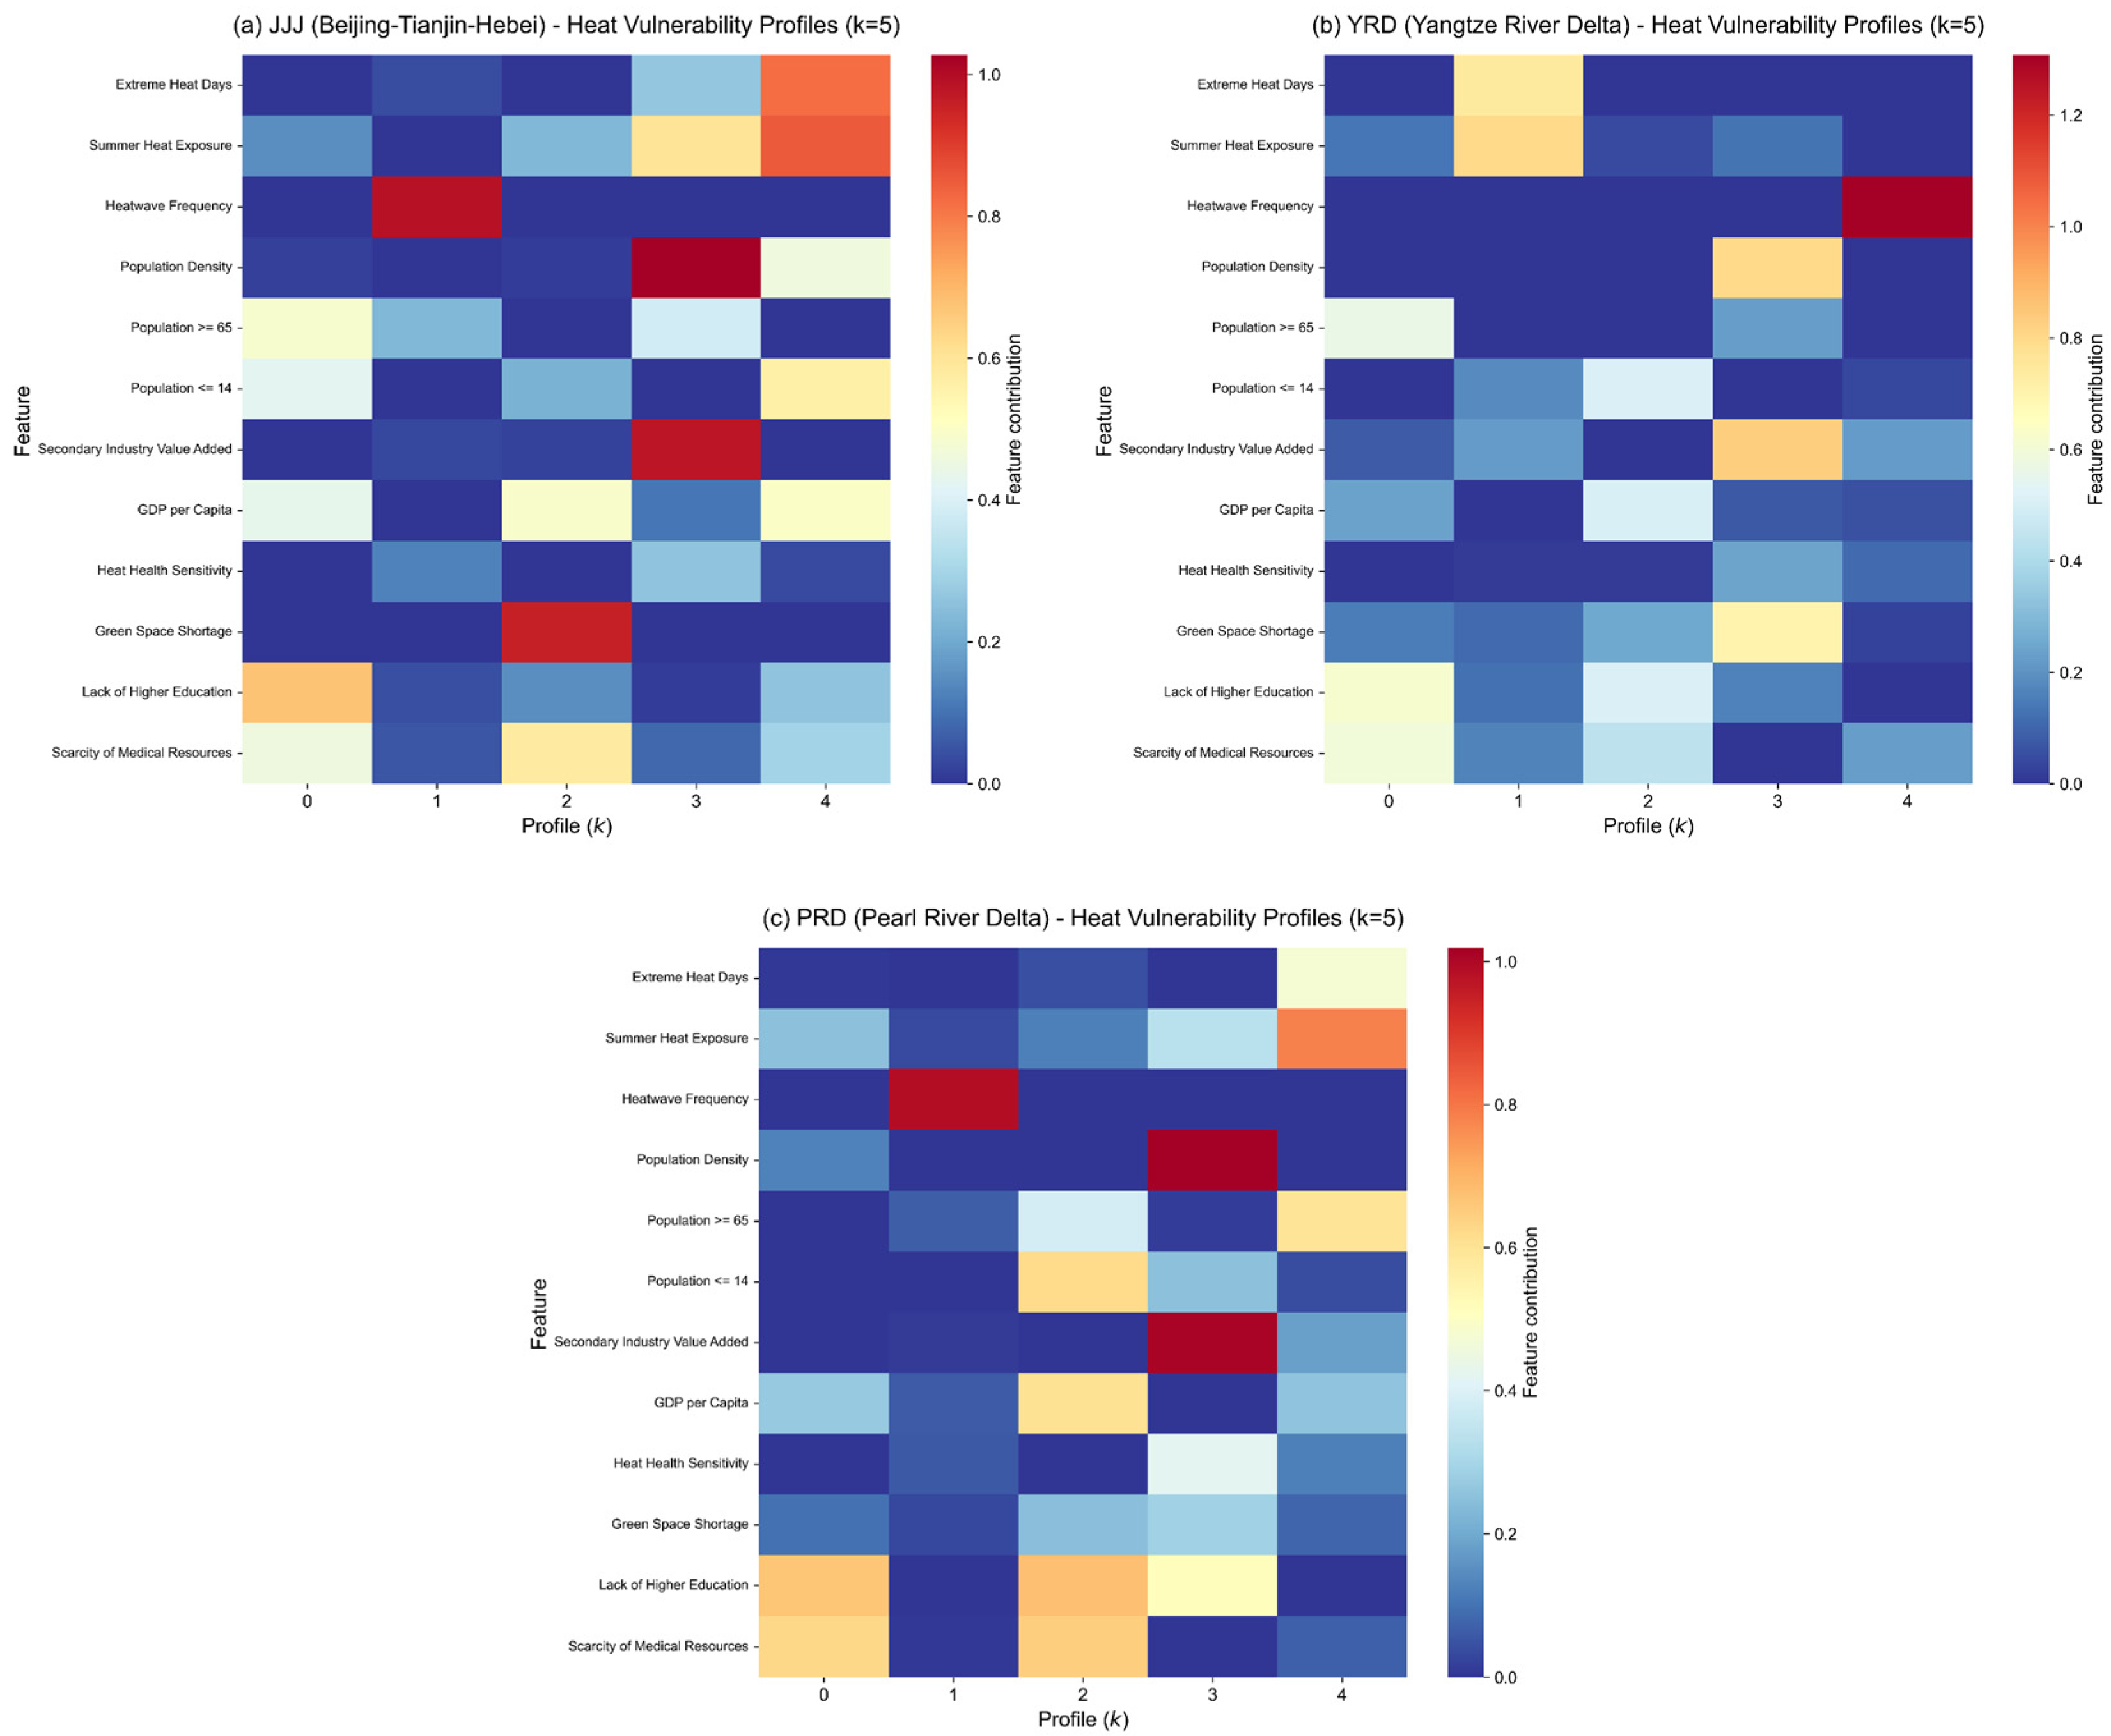
Based on NMF, this study decomposes the UHV indicators of the three urban agglomerations, JJJ, YRD, and PRD, into five latent characteristic profiles, as shown in Figure 7. The results reveal both certain commonalities and significant spatial heterogeneity. At the Profile0 level, the three urban agglomerations exhibit marked commonality in vulnerability factors such as SHE, ELD, GPC, LHE, and SMR. These factors jointly dominate the Profile0 profile of the three urban agglomerations, indicating that all three generally face substantial climate exposure pressure and share common problems related to uneven regional development in aging, economic level, and public service provision. Meanwhile, Profile3 consistently appears across all regions as a population vulnerability profile composed of ELD and CHI, revealing that population vulnerability is a common driving factor of UHV in all three urban agglomerations.
Although the UHV of the three urban agglomerations shares the commonalities noted above, it still exhibits non-negligible spatial heterogeneity. In JJJ, Profile2 is characterized prominently by GSS, while POD and SIV show strong loadings in Profile3, revealing that the combination of high-intensity population agglomeration and an imbalanced social-industrial structure constitutes the core of its vulnerability. In contrast, YRD presents a relatively multi-factor composite UHV structure. Apart from the imbalance of the HWF factor in Profile4, the weights of the various factors in its UHV characteristics are comparatively balanced, mainly reflecting the combined effects of moderate exposure, moderate ELD, and pressure from social resource allocation, which indicates that its UHV is both systemic and complex. PRD exhibits the same extreme factor-dominated pattern as JJJ, indicating a high degree of similarity in the underlying structure of UHV between the two. However, the dominant factors in PRD remain distinct from those in JJJ. Specifically, in PRD, the dominance of ELD and GPC in Profile2 and that of SIV in Profile3 is relatively more pronounced. NMF reveals the industrial attribute dominance within its UHV and further indicates the dual vulnerability challenges of a complex population structure and mismatches in social resource allocation driven by industrial development. Overall, the driving factors of UHV differ significantly among the three urban agglomerations: JJJ is confronted with environmental scarcity and population pressure, YRD shows comprehensive exposure to social resource pressure, and PRD is more strongly affected by factors such as industrial–economic imbalance and lagging infrastructure.

3.3.3. Spatiotemporal Evolution Characteristics of UHV

Based on the above NMF decomposition results, this study quantifies the UHV level of each city by summing the membership values of its K profiles. Figure 8 shows the evolution of UHV in the three major urban agglomerations from 2016 to 2024, with JJJ, YRD, and PRD exhibiting distinct evolutionary characteristics and complex dynamic patterns. The JJJ region shows pronounced abrupt-change characteristics. For example, Beijing maintained a low UHV level for a prolonged period from 2016 to 2022, but in 2023–2024 it suddenly broke this equilibrium state and surged to the highest point. Under this pattern, JJJ has no long-term stable local vulnerability hotspot. Nevertheless, Xingtai, Hengshui, and Cangzhou in southern JJJ consistently rank high in regional vulnerability, whereas core JJJ cities such as Beijing and Tianjin perform relatively better, echoing the uneven regional development revealed by the previous NMF decomposition. In contrast, YRD exhibits relatively stable UHV peaks, with Shaoxing, Jiaxing, and Taizhou repeatedly appearing as regional UHV high points, reflecting unbalanced development among cities within YRD. However, from an interannual perspective, UHV values in YRD remain relatively stable. Although slight fluctuations appear around 2022, the overall pattern remains steady. PRD, by contrast, presents a dynamic evolution characterized by the coexistence of macro-level stability at high values and large-amplitude fluctuations in individual cities. On the one hand, Zhaoqing and Jiangmen have remained among the regional UHV high-value cities for many years; on the other hand, cities such as Zhongshan and Foshan exhibit relatively strong interannual fluctuations.
The inter-urban agglomeration comparison of UHV reveals a spatial distribution pattern characterized by differences between peripheral and core areas, with a strong internal gradient pattern. For example, YRD has formed a contiguous low-UHV area centered on “Shanghai–Nanjing”, whereas UHV in its southern peripheral cities has consistently remained at a high level. Although JJJ and PRD also exhibit this distribution pattern, they show different trends in their evolution over the past two years. In JJJ, the gap between core cities such as Beijing and Tianjin and the peripheral areas is narrowing, and the spatial distribution is tending toward homogenization at high UHV levels. In contrast, UHV peaks have repeatedly appeared in cities such as Jiangmen and Foshan in PRD, showing an evolutionary trend of fragmented distribution. Although the UHV distribution of the major urban agglomerations shares certain commonalities, under the more complex conditions of recent urban development it shows a strongly heterogeneous evolutionary trend.

3.4. Dynamic Association Mechanism Between UHV and SSI During Heatwave

3.4.1. Regional Heterogeneity in the Relationship Between UHV and SSI

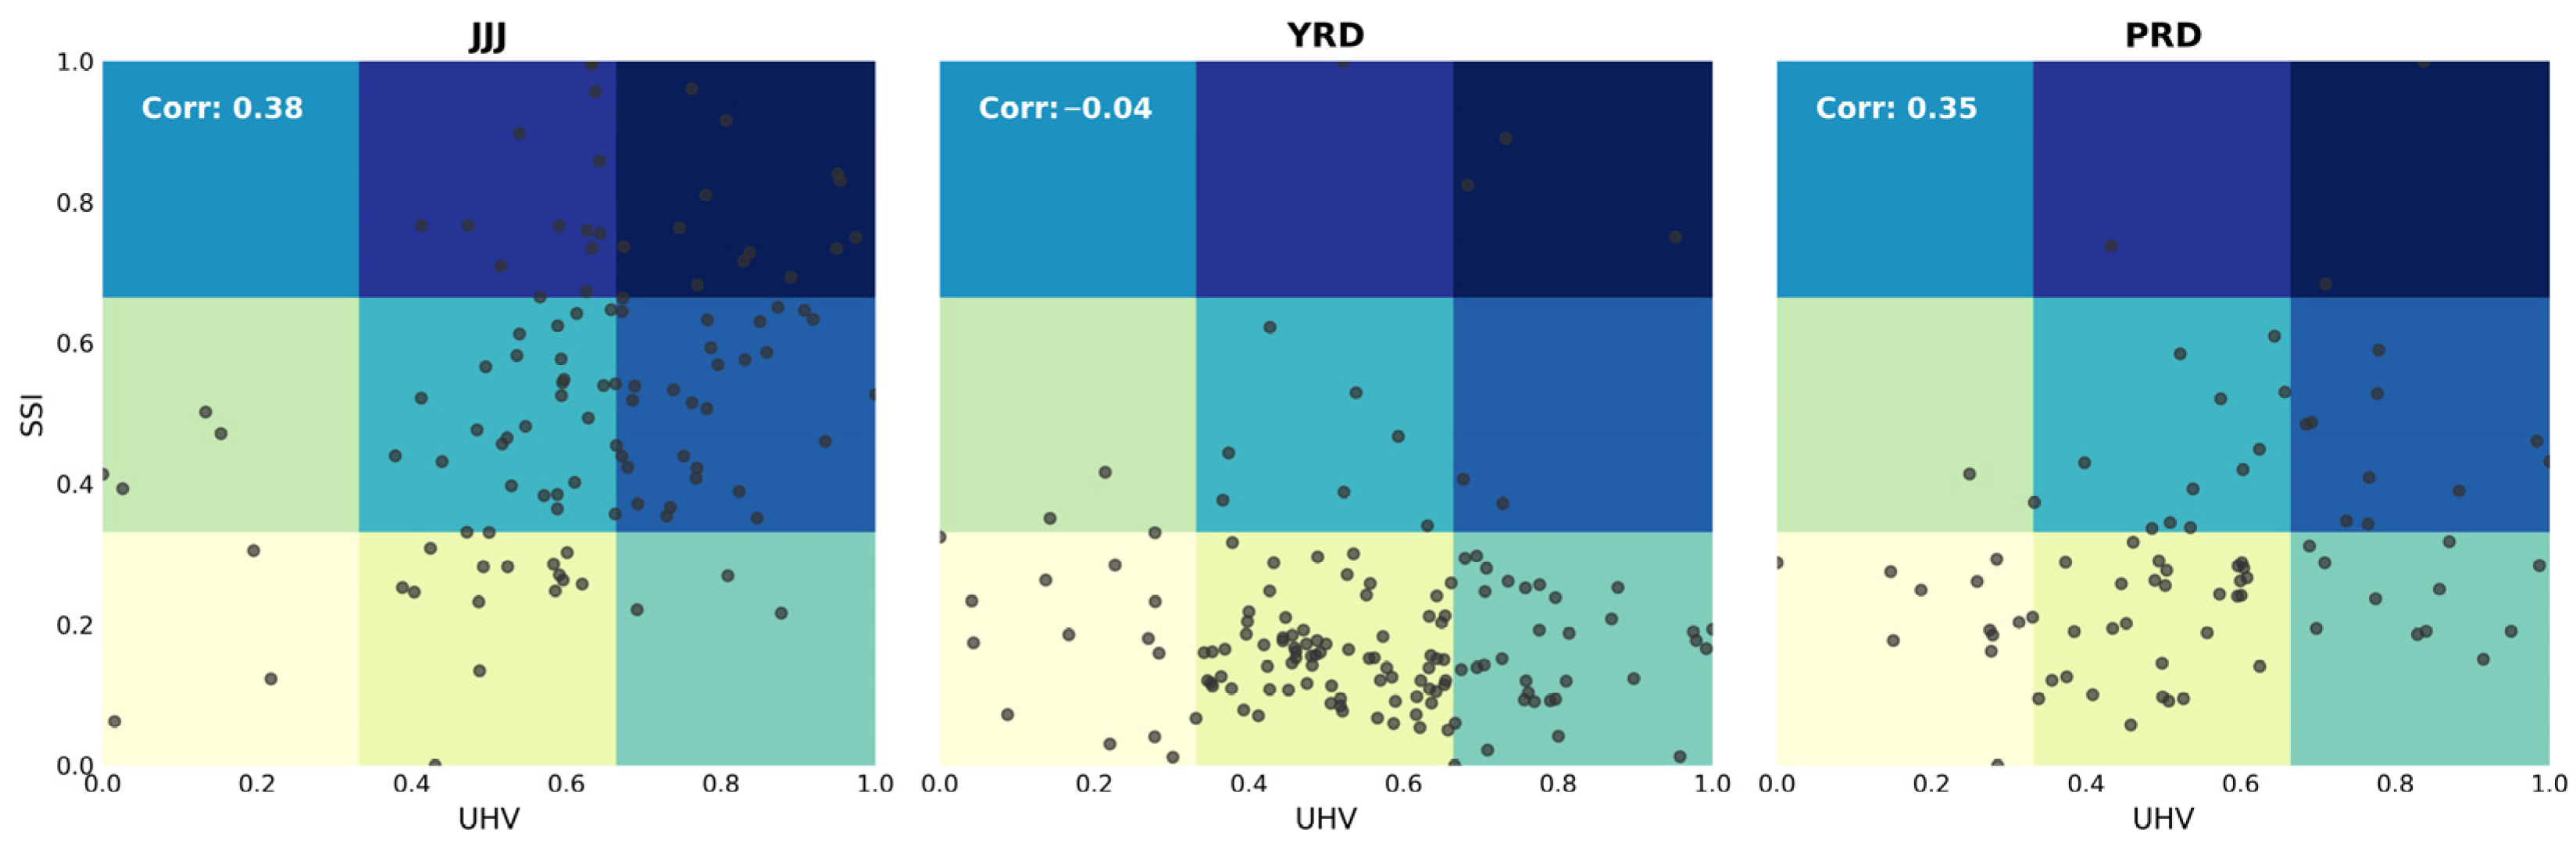
Figure 9 shows the Spearman correlation coefficient between UHV and the SSI across cities in the three major coastal urban agglomerations, namely JJJ, YRD, and PRD. Overall, the scatter distribution patterns and correlation coefficients differ markedly among the urban agglomerations, indicating significant spatial heterogeneity in the transmission process from UHV to stress outcomes under heatwave shocks. Here, a higher SSI value indicates a greater deviation of the urban social system from its baseline state during heatwave, representing a higher level of system stress and a closer approach to functional instability.
In terms of correlation, UHV and SSI in JJJ and PRD generally vary in the same direction, with Corr values of 0.38 and 0.35, respectively. In these two regions, more vulnerable cities tend to experience greater stress during heatwave. By contrast, the Corr value for YRD is −0.04, showing almost no stable association, which suggests that there is no clear linear correspondence between the level of urban vulnerability and the actual stress borne during heatwave.
Combined with the distribution of different samples within the nine-grid framework, the upper-right quadrant corresponds to the “high UHV-high SSI” type, representing samples with both high structural vulnerability and high event-induced stress, where heatwave risk is most concentrated. Such samples are relatively common in JJJ and PRD, but less frequent in YRD. At the same time, a small number of “low UHV-high SSI” and “high UHV-low SSI” samples can still be observed, indicating that static vulnerability alone cannot fully determine the actual consequences under heatwave shocks. Factors such as short-term adaptive capacity, public service provision, and response mechanisms also play important roles. Therefore, relying solely on static UHV indicators and linear association mechanisms is insufficient to fully identify the actual stress state of cities. It is necessary to combine structural vulnerability with dynamic stress indicators during events and to introduce nonlinear models in order to more accurately characterize urban risk under extreme high temperatures.

3.4.2. Intra-Urban Agglomeration Spatial Differentiation and Its Stagewise Evolution

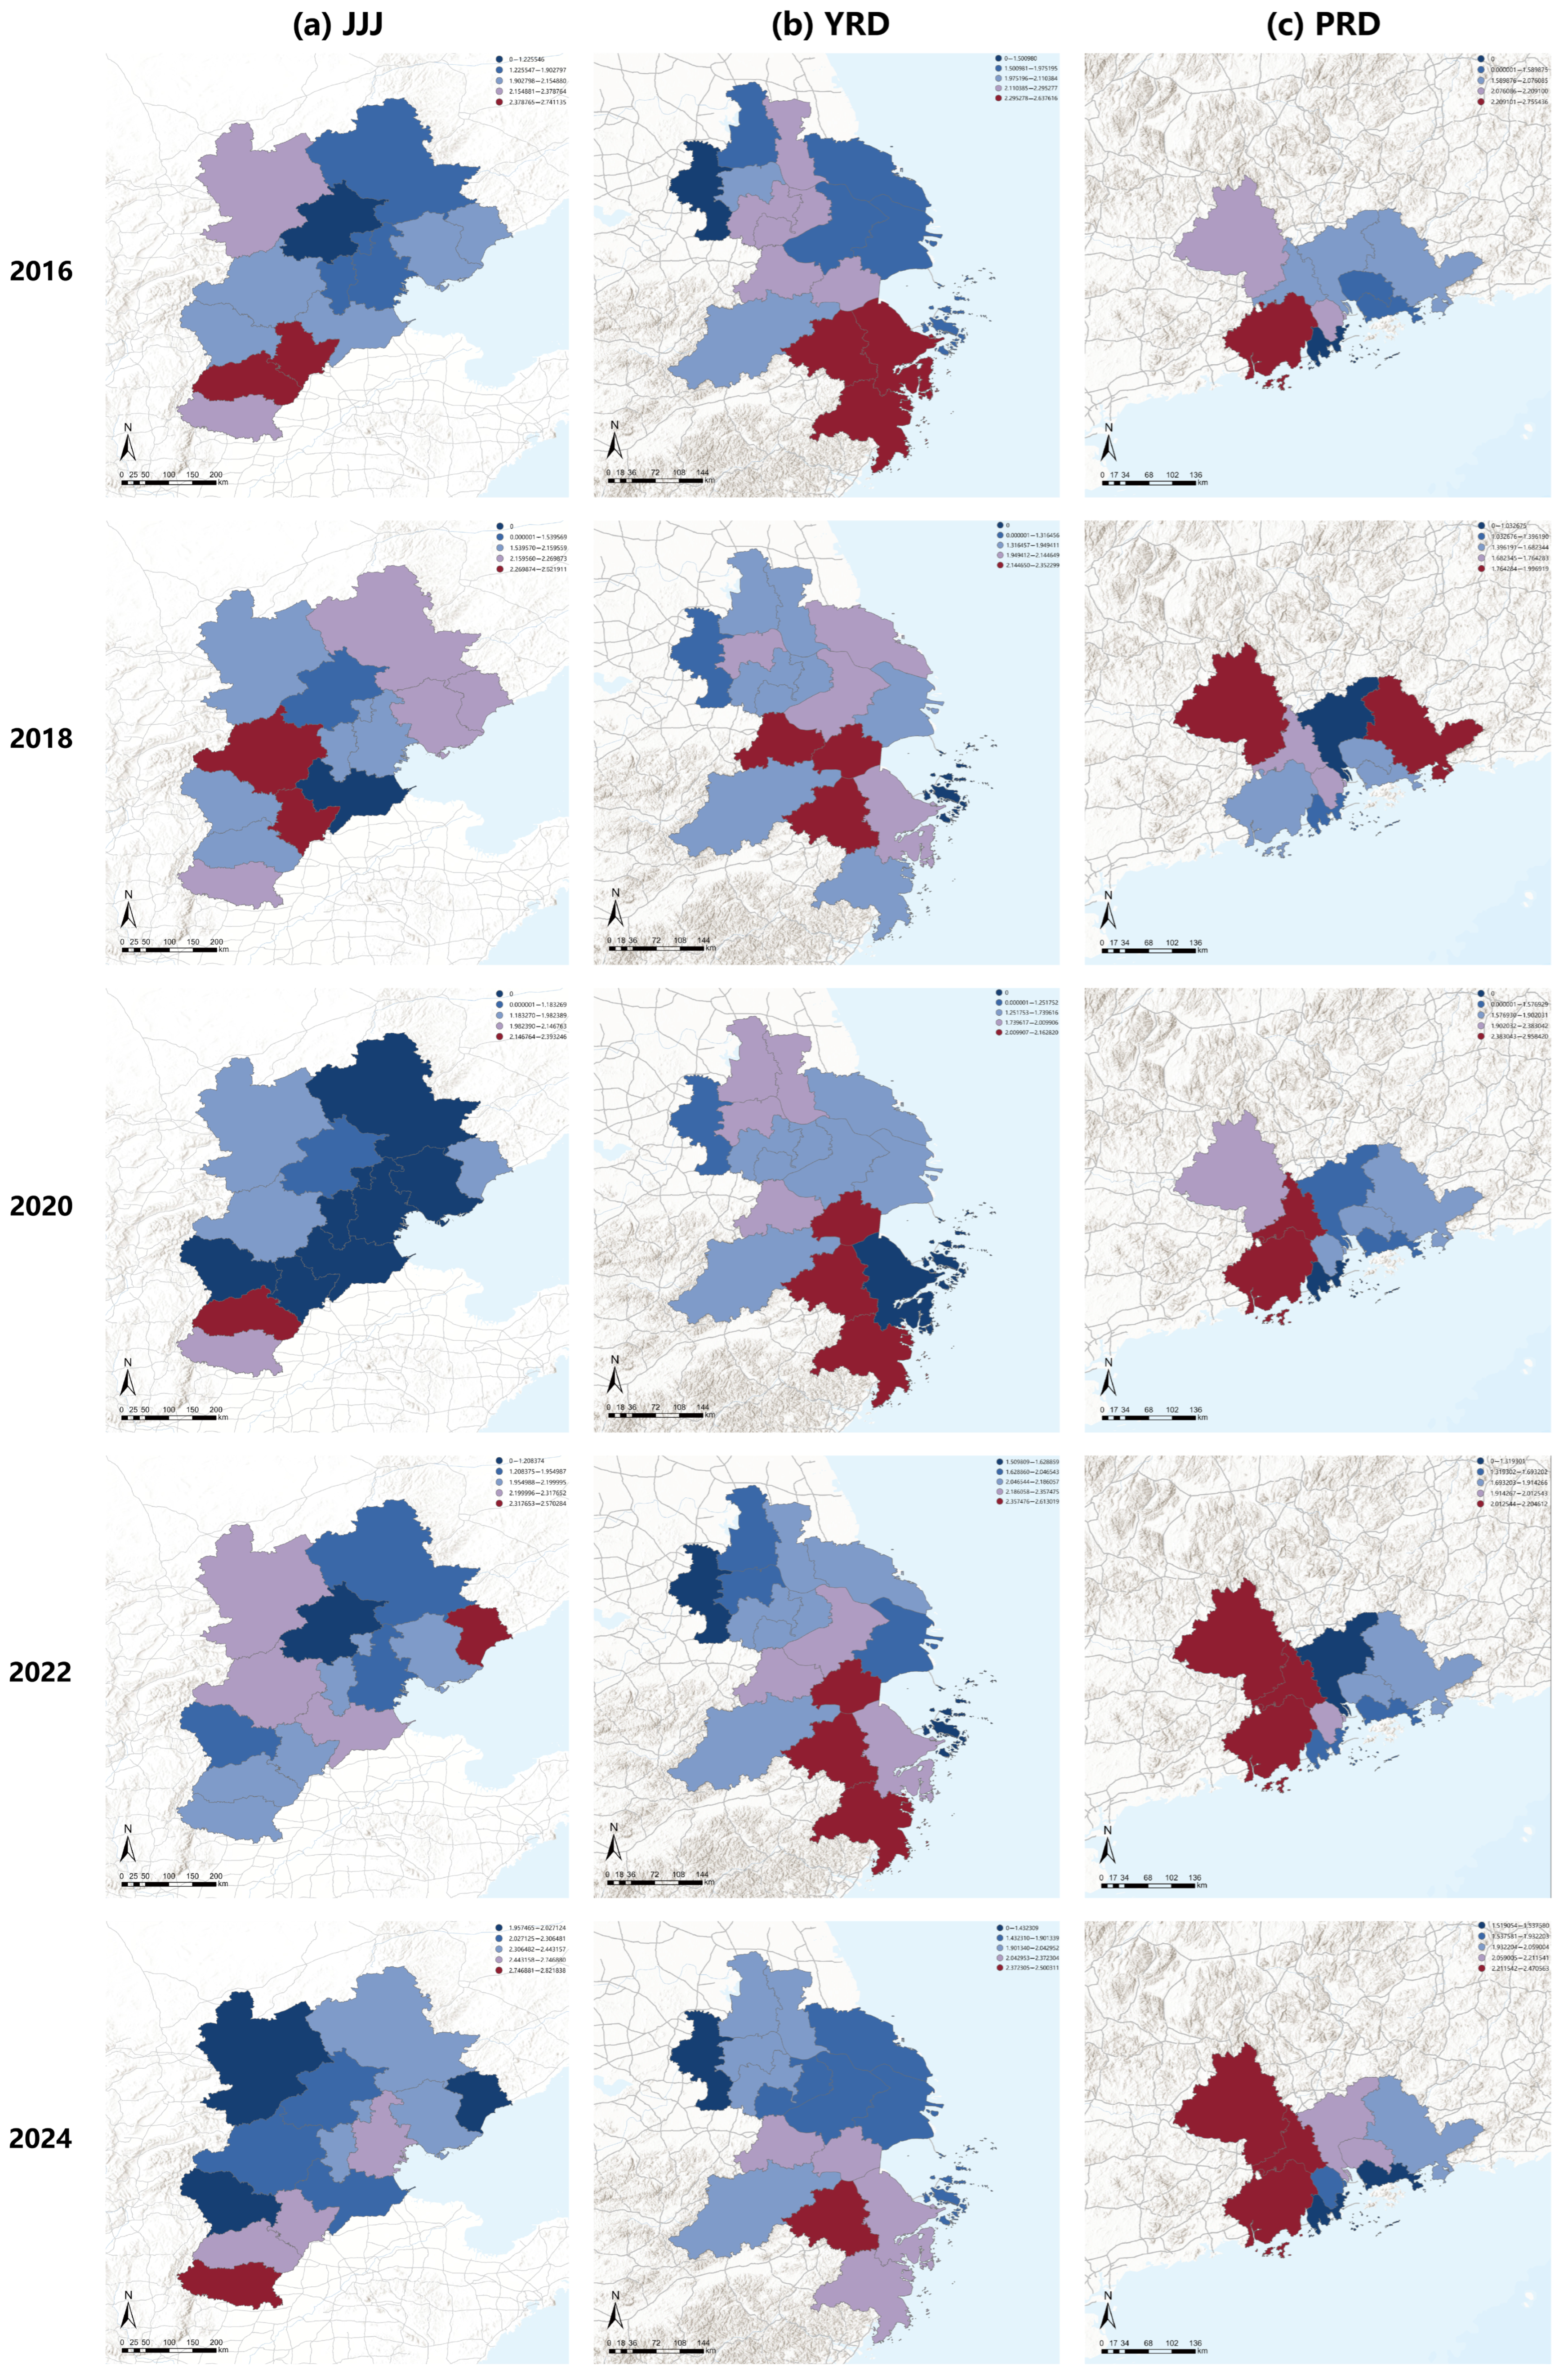
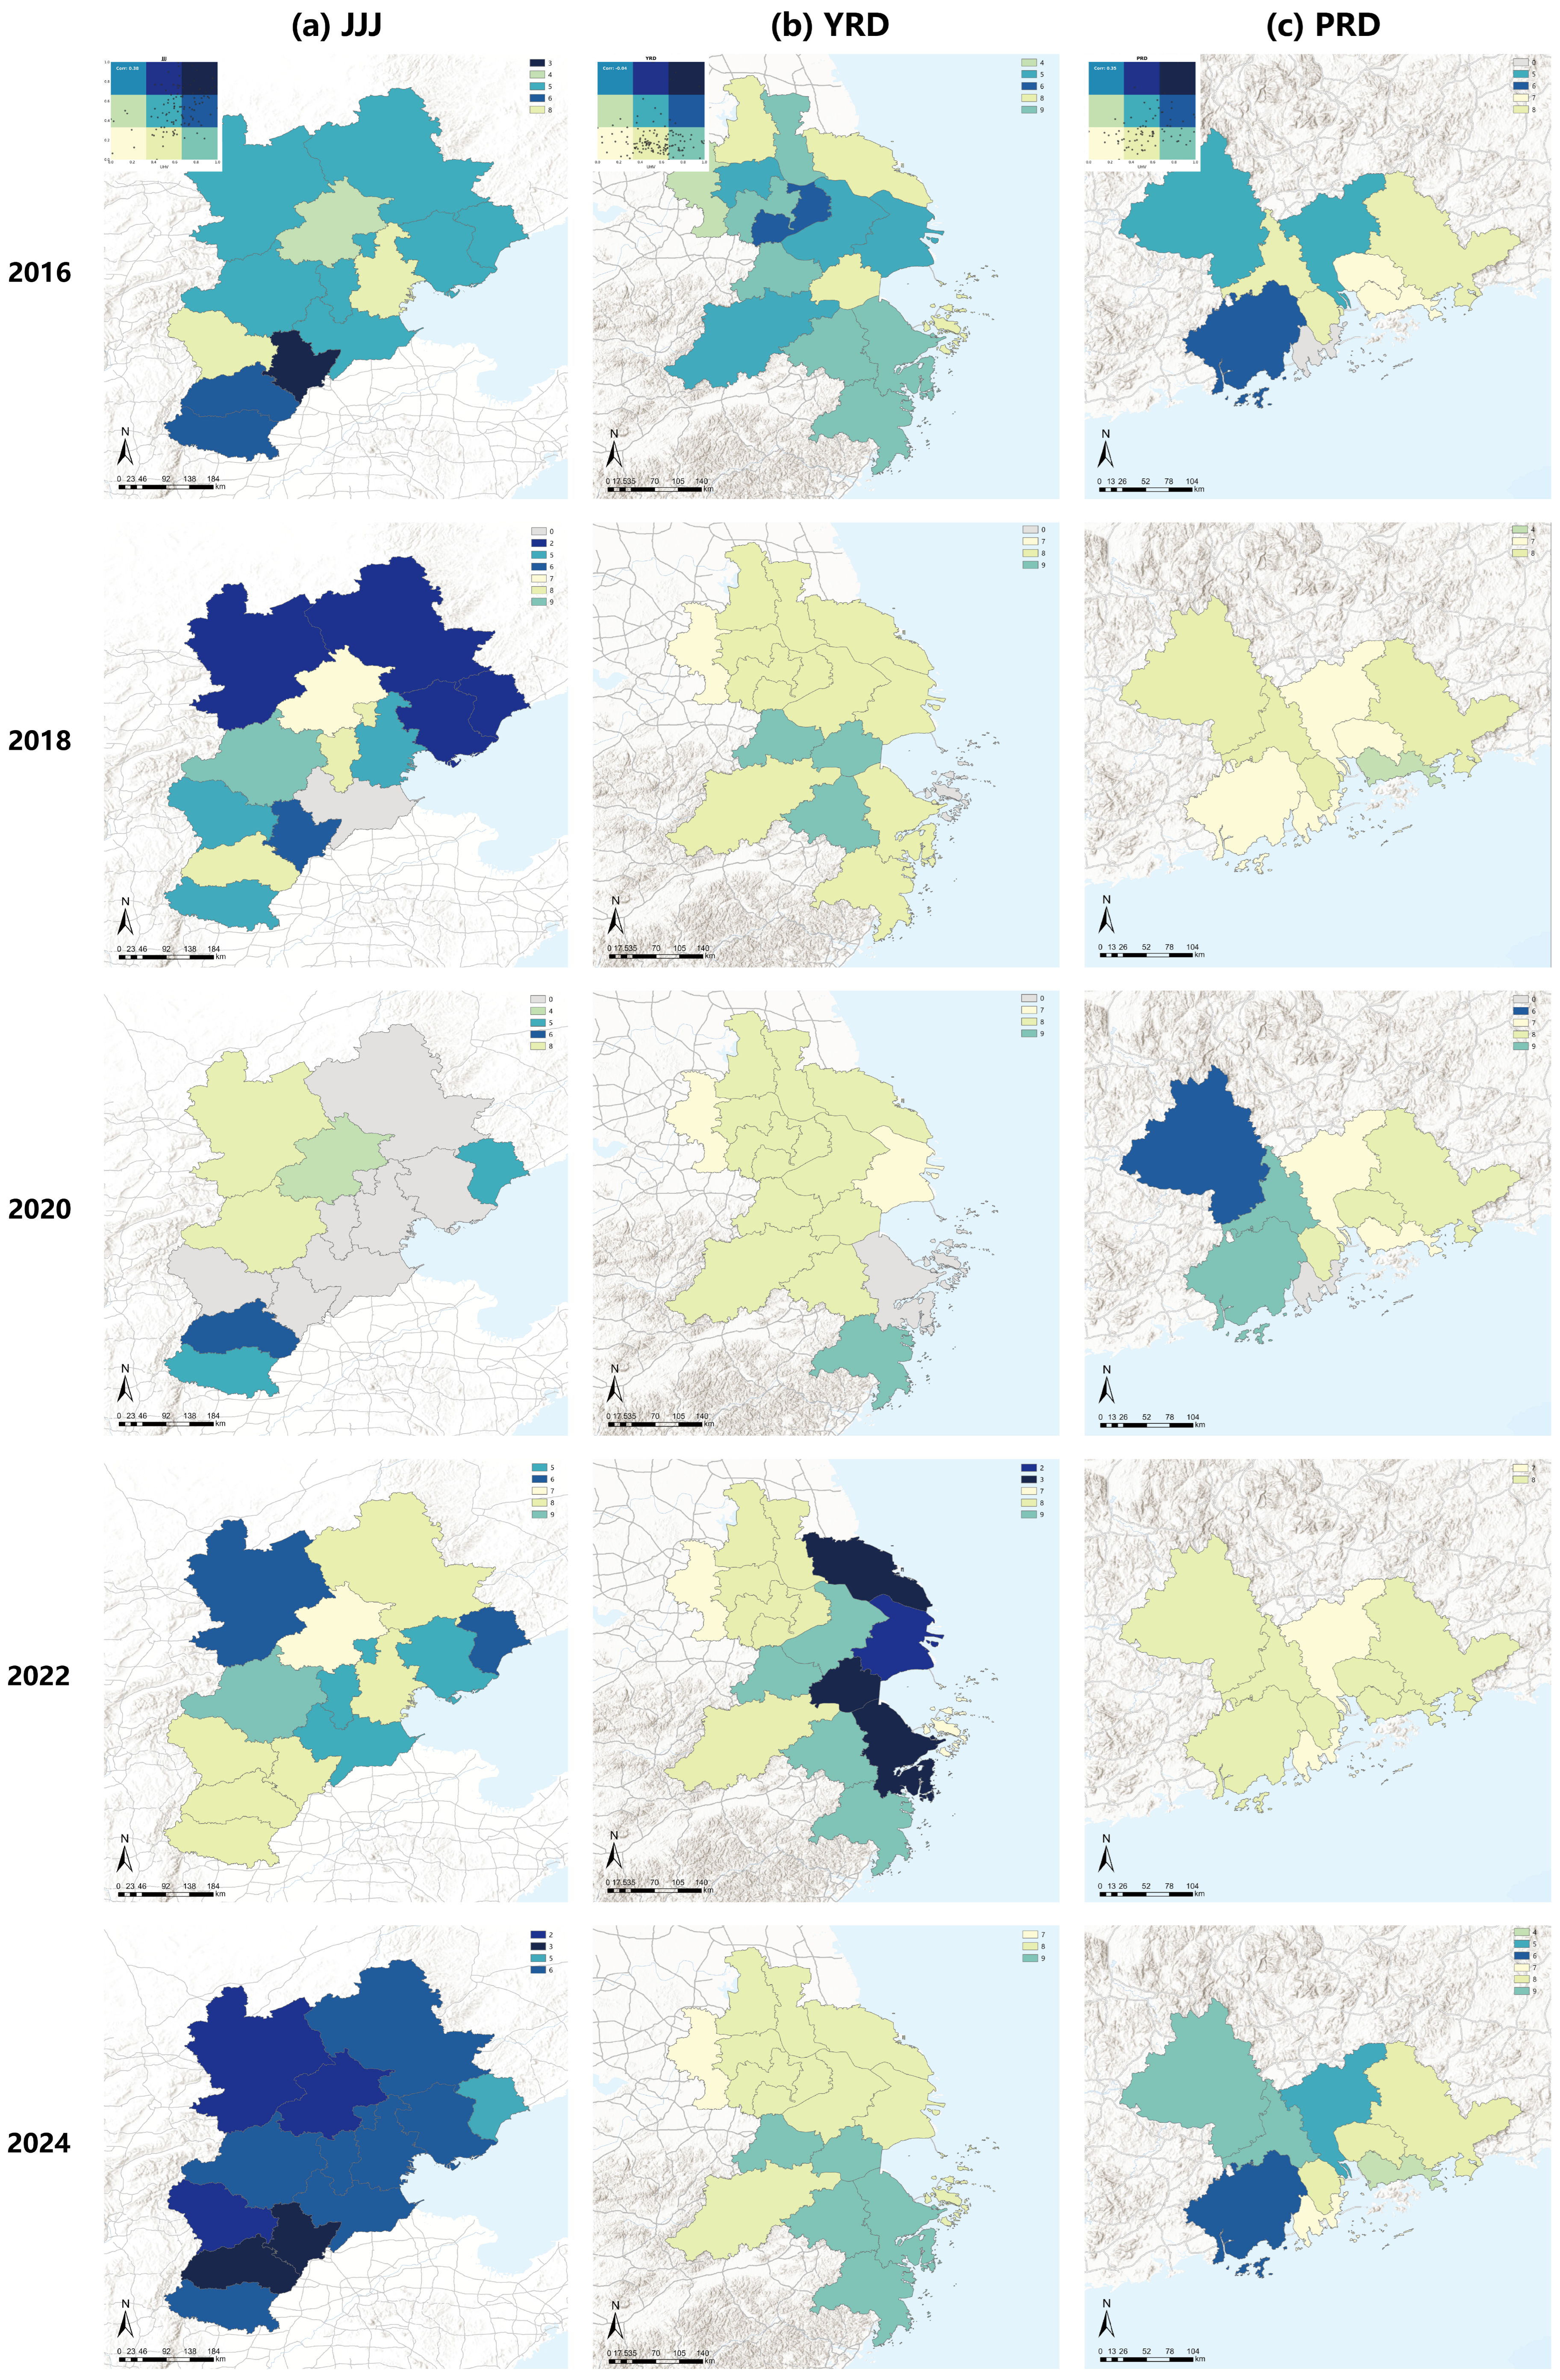
The results in Figure 10 indicate that the UHV-SSI coupling pattern within all three major urban agglomerations exhibits significant spatial heterogeneity, although the directions of evolution differ. Internal differences are more pronounced in JJJ. In 2016, high values were mainly concentrated in Tianjin and cities in southern Hebei, whereas Beijing and the northern mountainous cities were relatively low; after 2018, cities in the north and east showed a marked increase. In 2020, the overall heat stress in JJJ experienced a brief decline, with only southern and some coastal cities remaining at relatively high levels; by 2024, high values across the region increased again, with Beijing, Shijiazhuang, and cities in southern Hebei rising simultaneously, showing an accumulative process shifting from local clustering to broad regional diffusion.
By contrast, YRD is characterized by repeated adjustment under external disturbances. From 2016 to 2020, most cities generally remained under low to moderate stress, with differences mainly concentrated around Shanghai, southern Jiangsu, and northern Zhejiang; Shanghai itself also did not remain consistently at a high level, but showed a marked increase in specific years. In 2022, stress in coastal and bay-area cities intensified rapidly, forming a high-value belt extending from Shanghai-Nanjing-Hangzhou toward the eastern coast, but by 2024 this high-value belt had clearly retreated, and the region returned to a pattern characterized by lower inland values and relatively higher coastal values. PRD shows the smallest overall fluctuation, with a relatively stable spatial hierarchy. Cities along the Guangzhou–Shenzhen corridor did not continuously occupy the highest levels; instead, cities on the western bank of the Pearl River and in the southwestern part of the region were more prone to high-value clustering. Regional differences temporarily converged in 2018 and 2022, whereas the western wing rose again in 2020 and 2024.
Therefore, JJJ is characterized by a continuous strengthening process in which UHV and heat stress increase synergistically and spread from local high-value areas to the broader region; YRD mainly reflects significant fluctuations in a few core cities under stage-specific shocks; PRD, by contrast, exhibits an evolutionary pattern dominated by fluctuations in western-wing cities, with more evident overall oscillatory adjustment.

3.5. Analysis of Nonlinear Mechanisms Based on Interpretable Machine Learning

This study employs machine learning models combined with SHAP and PDP to identify the nonlinear associations linking the drivers of UHV and SSI.

3.5.1. Model Training and Evaluation

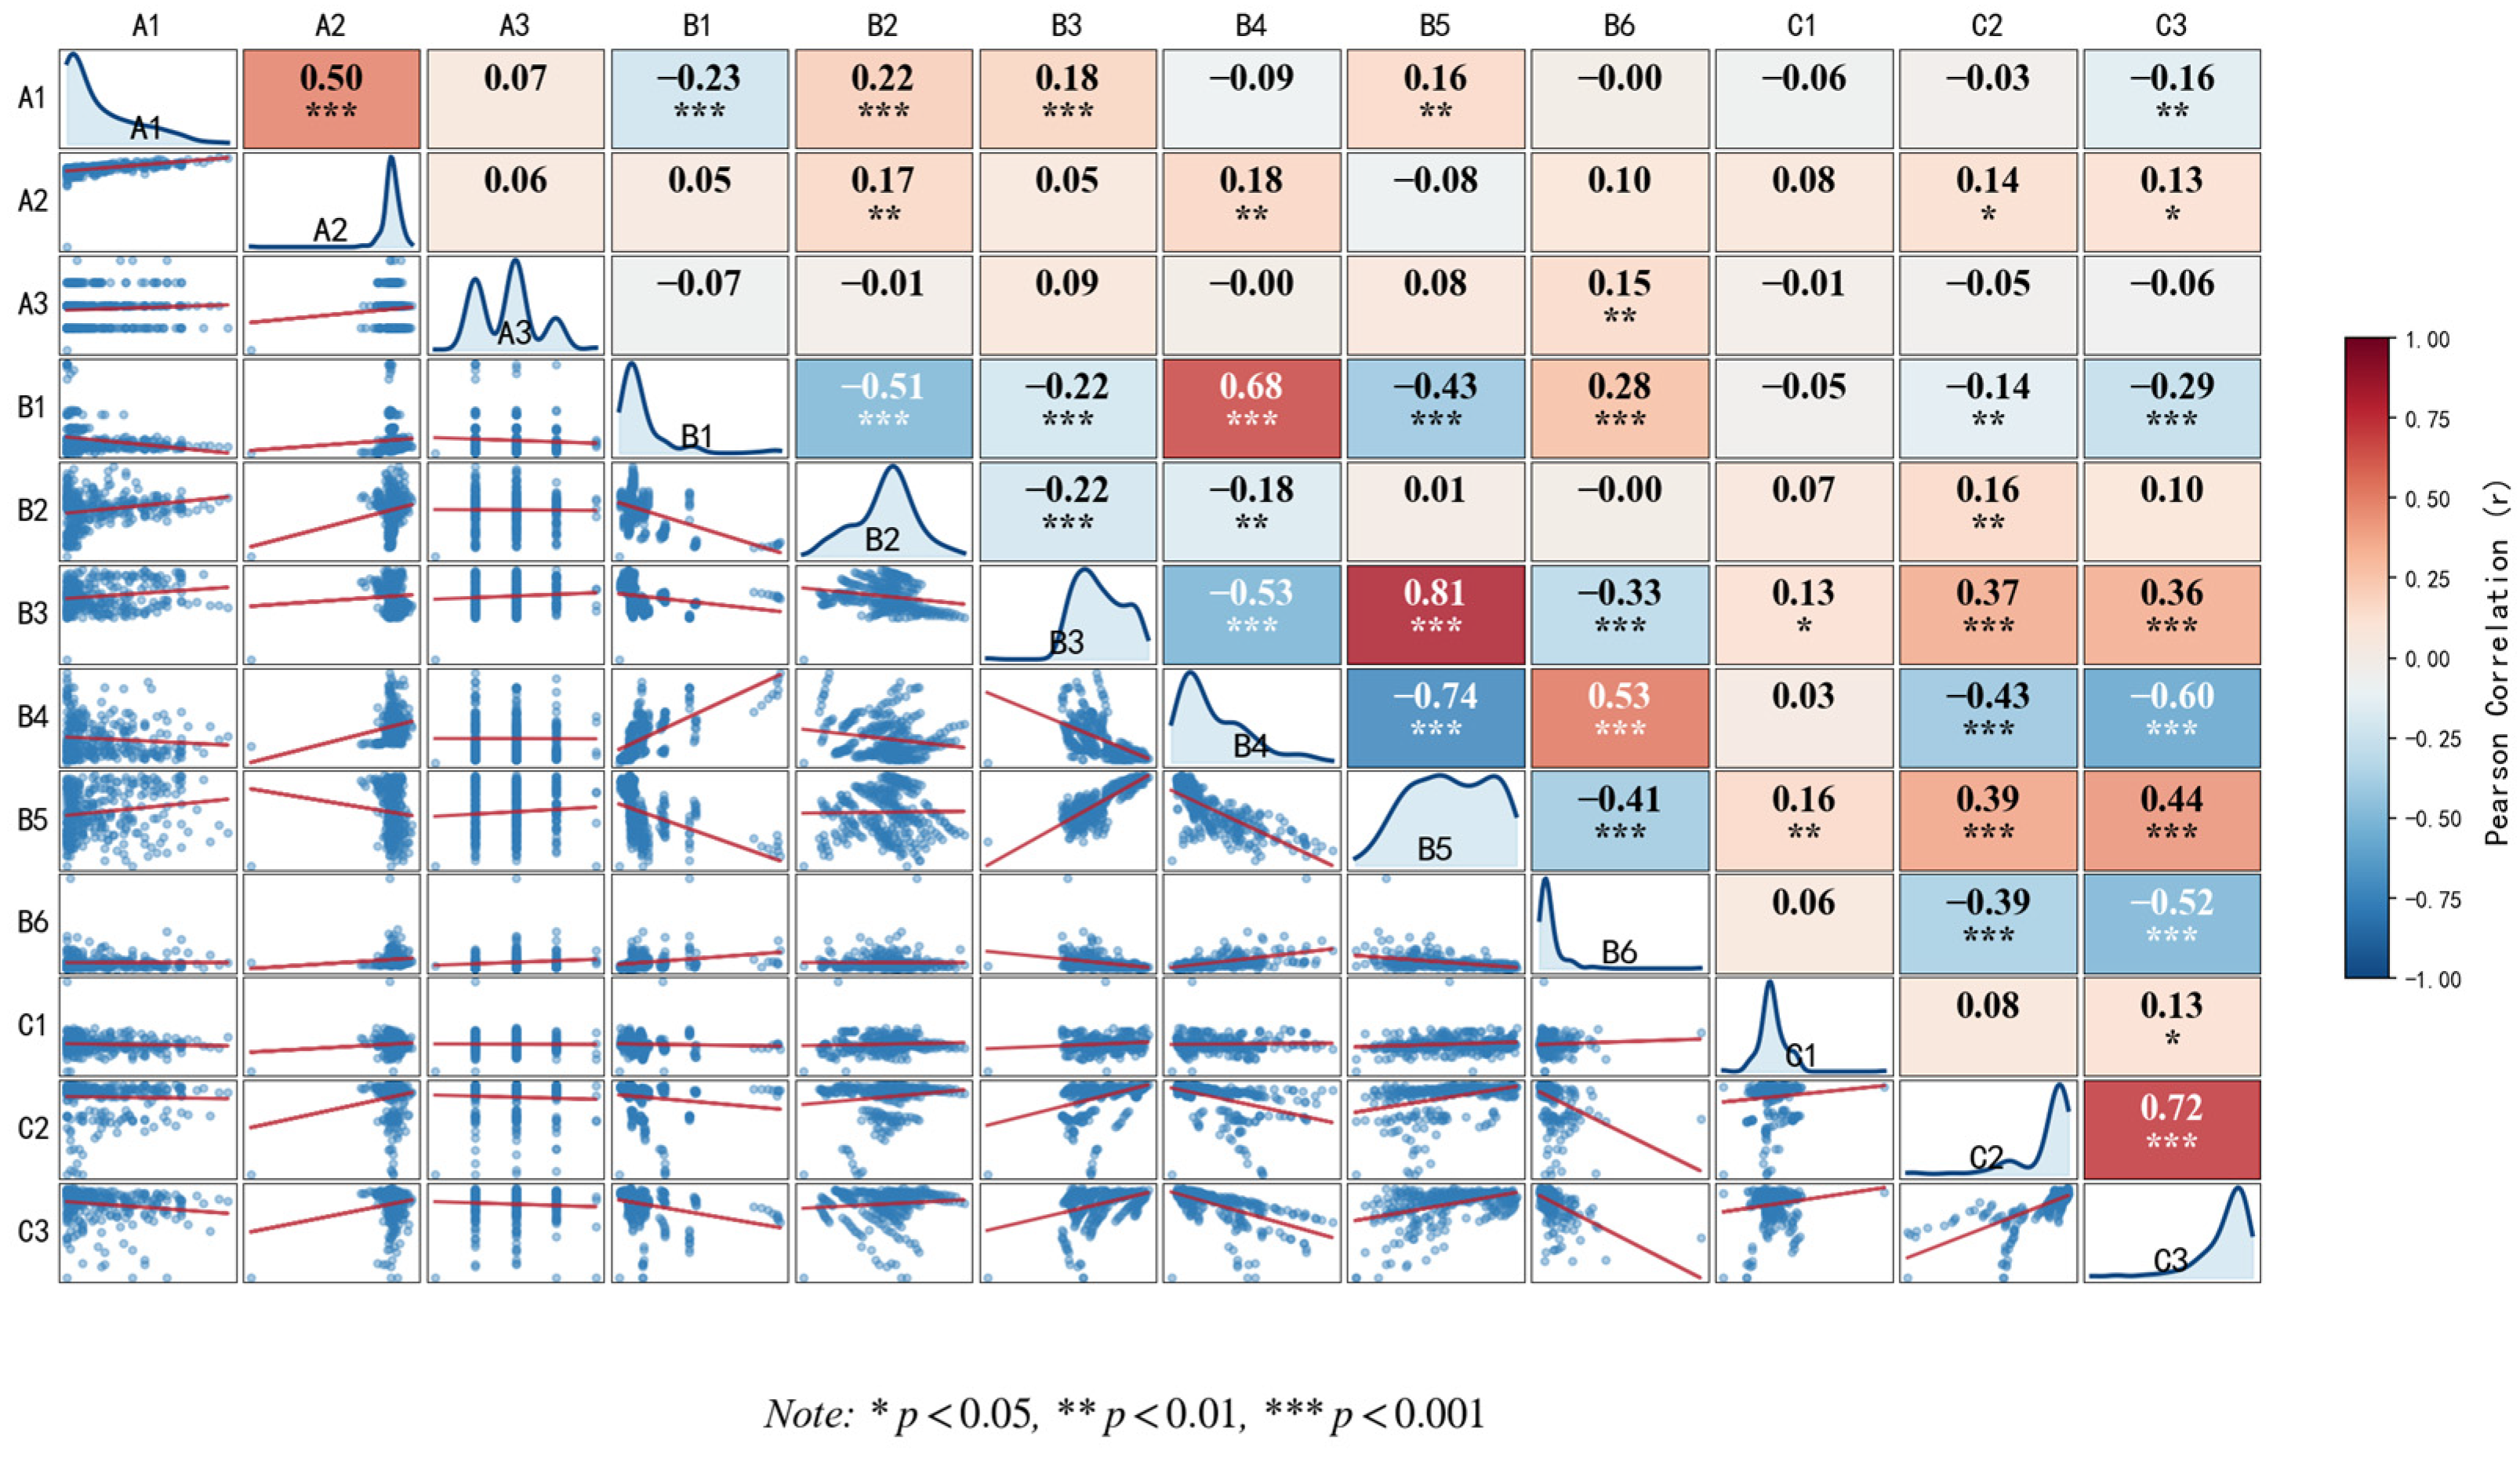
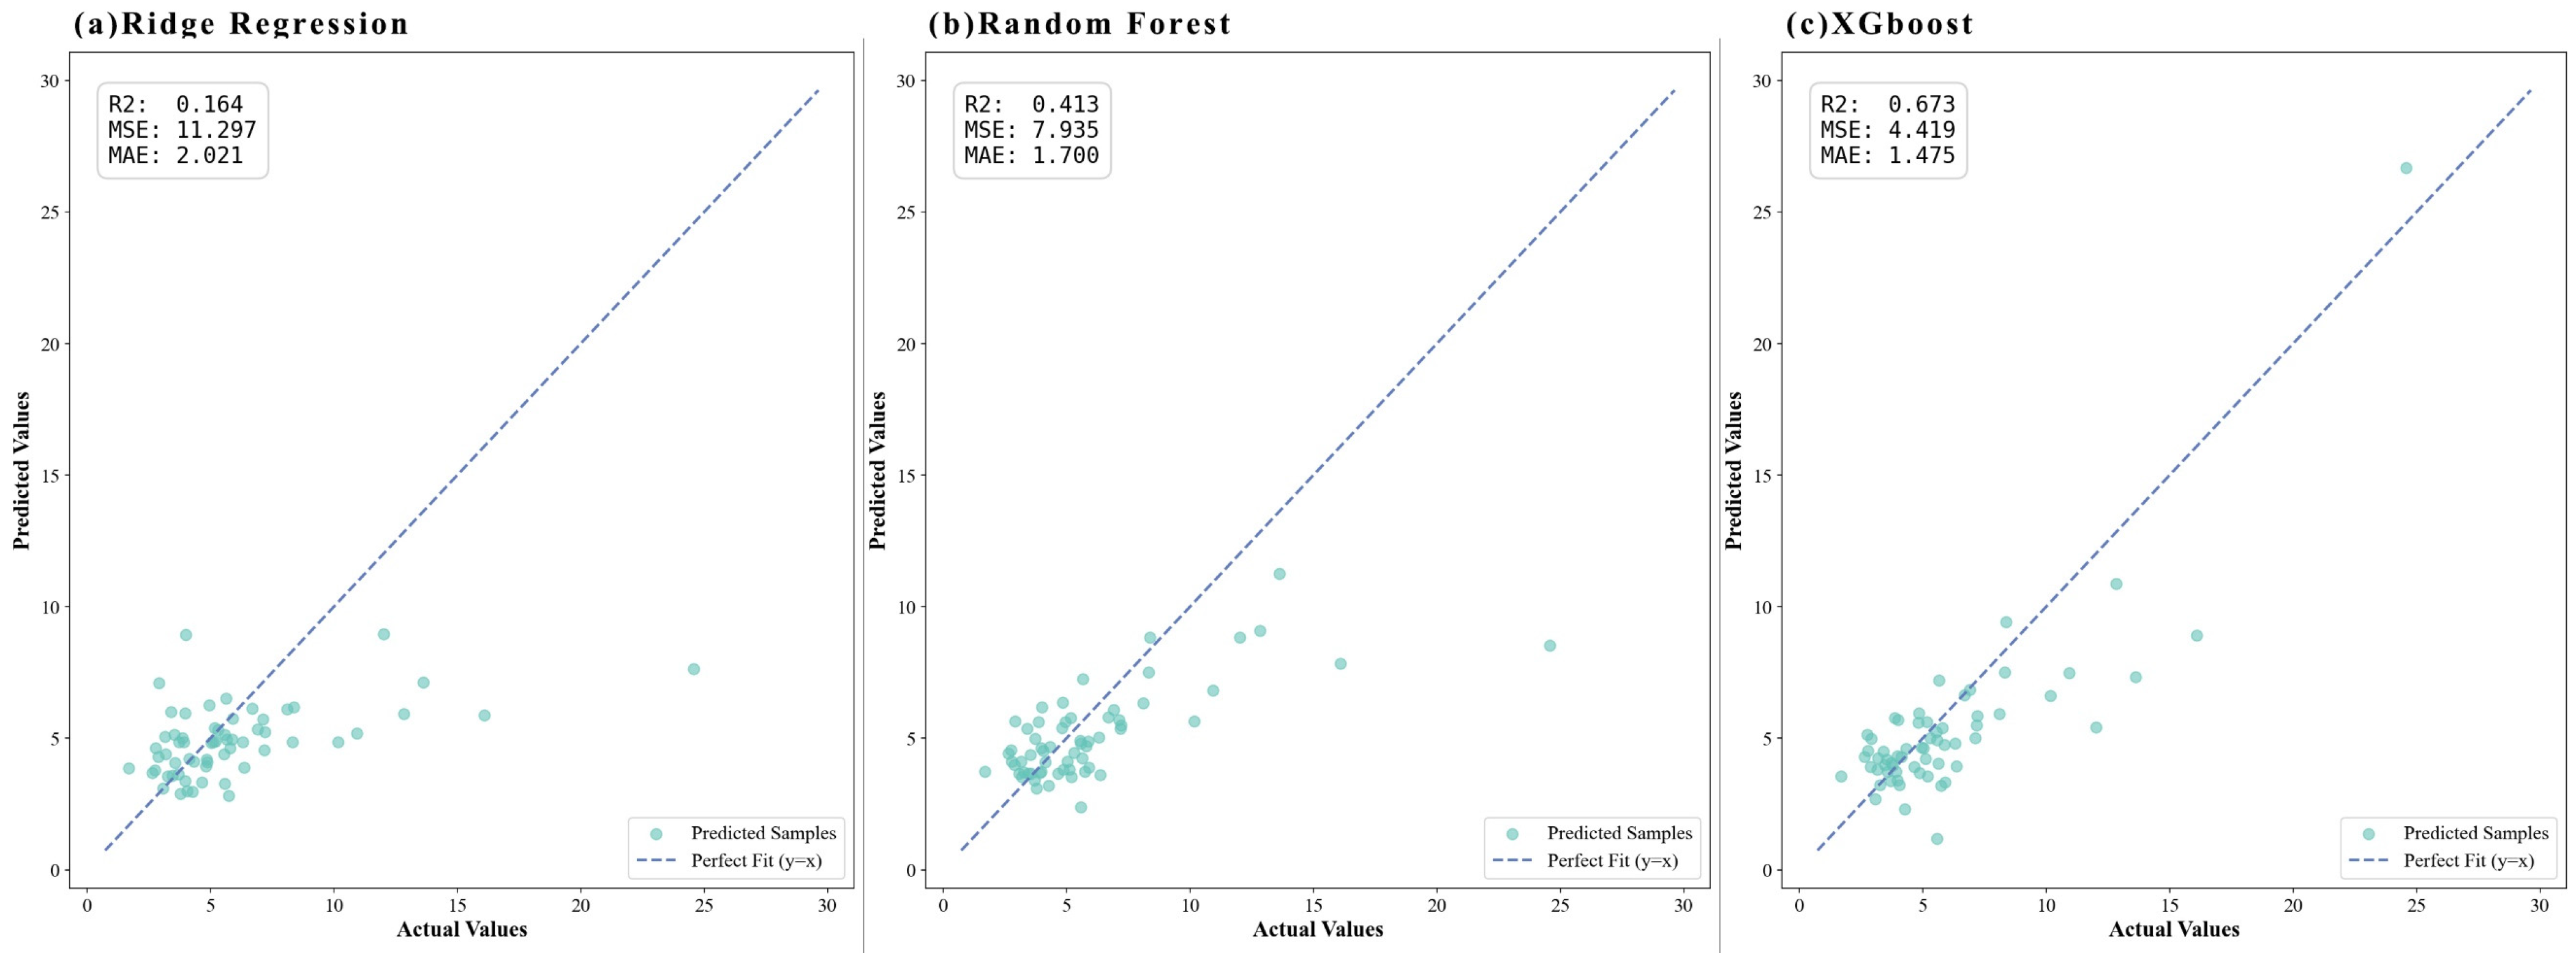
Before model construction, we analyzed the Pearson correlation coefficients among all factors and found that all values were below 0.85 (Figure 11), indicating the absence of multicollinearity. Following the machine learning model construction procedure described above, we then trained and comparatively analyzed three machine learning models: Ridge Regression, Random Forest (RF), and XGBoost. The model performance evaluation results (Figure 12) show that XGBoost performs best in terms of R2 (0.673), MSE (4.419), and MAE (1.475); therefore, XGBoost was selected as the final evaluation model. Robustness checks completely excluding the HHS variable yielded highly stable metrics and identical feature rankings, ruling out the risk of data leakage.

3.5.2. Analysis of the Contribution and Effects of Driving Factors

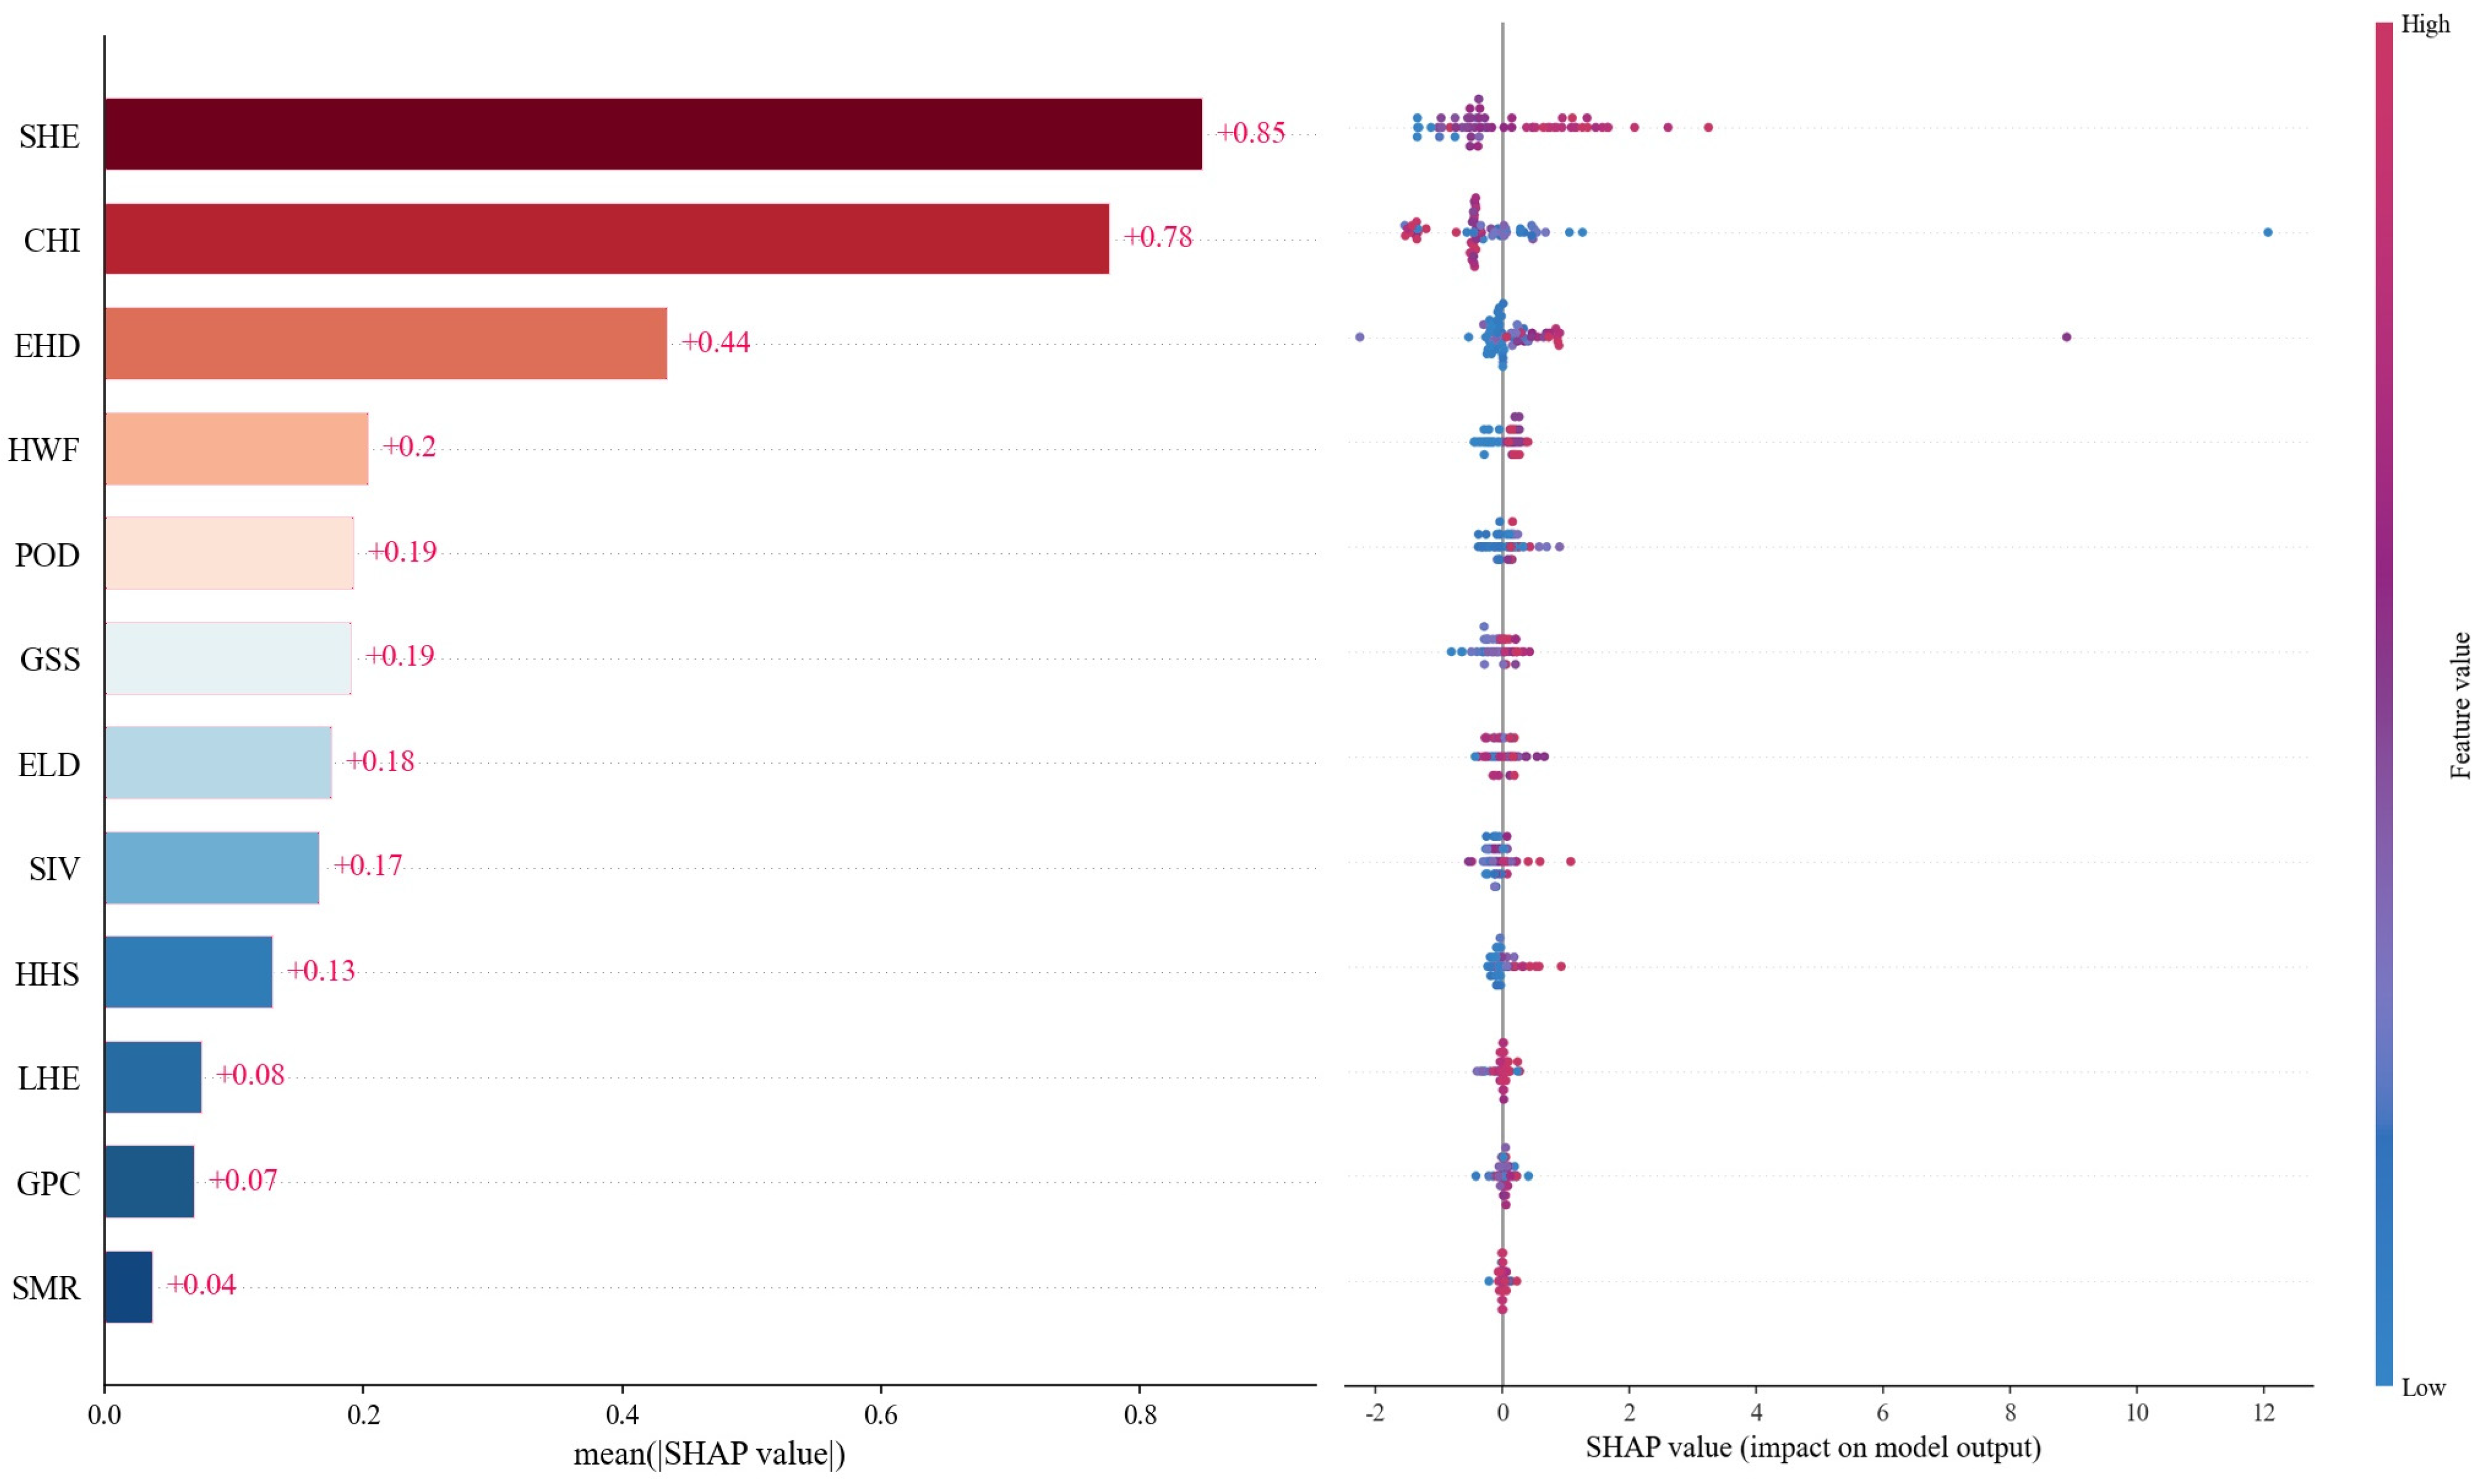
Based on SHAP, this study quantified the contributions of the factors affecting SSI and identified their directions of influence. The feature importance ranking (Table 2) shows that SHE, CHI, and EHD account for 25.65%, 23.49%, and 13.15% of total importance, respectively, which are significantly higher than those of the other factors, indicating that they are core driving factors. The influence distribution plot (Figure 13) further shows that factors such as SHE, EHD, SIV, and HHS have clear positive effects on SSI: higher values significantly increase the model prediction, whereas lower values reduce the overall evaluation. Similarly, CHI is a typical negatively correlated indicator, where a higher proportion of the population aged under 14 corresponds to a lower model prediction.

3.5.3. Marginal and Threshold Effects of Core Environmental Factors

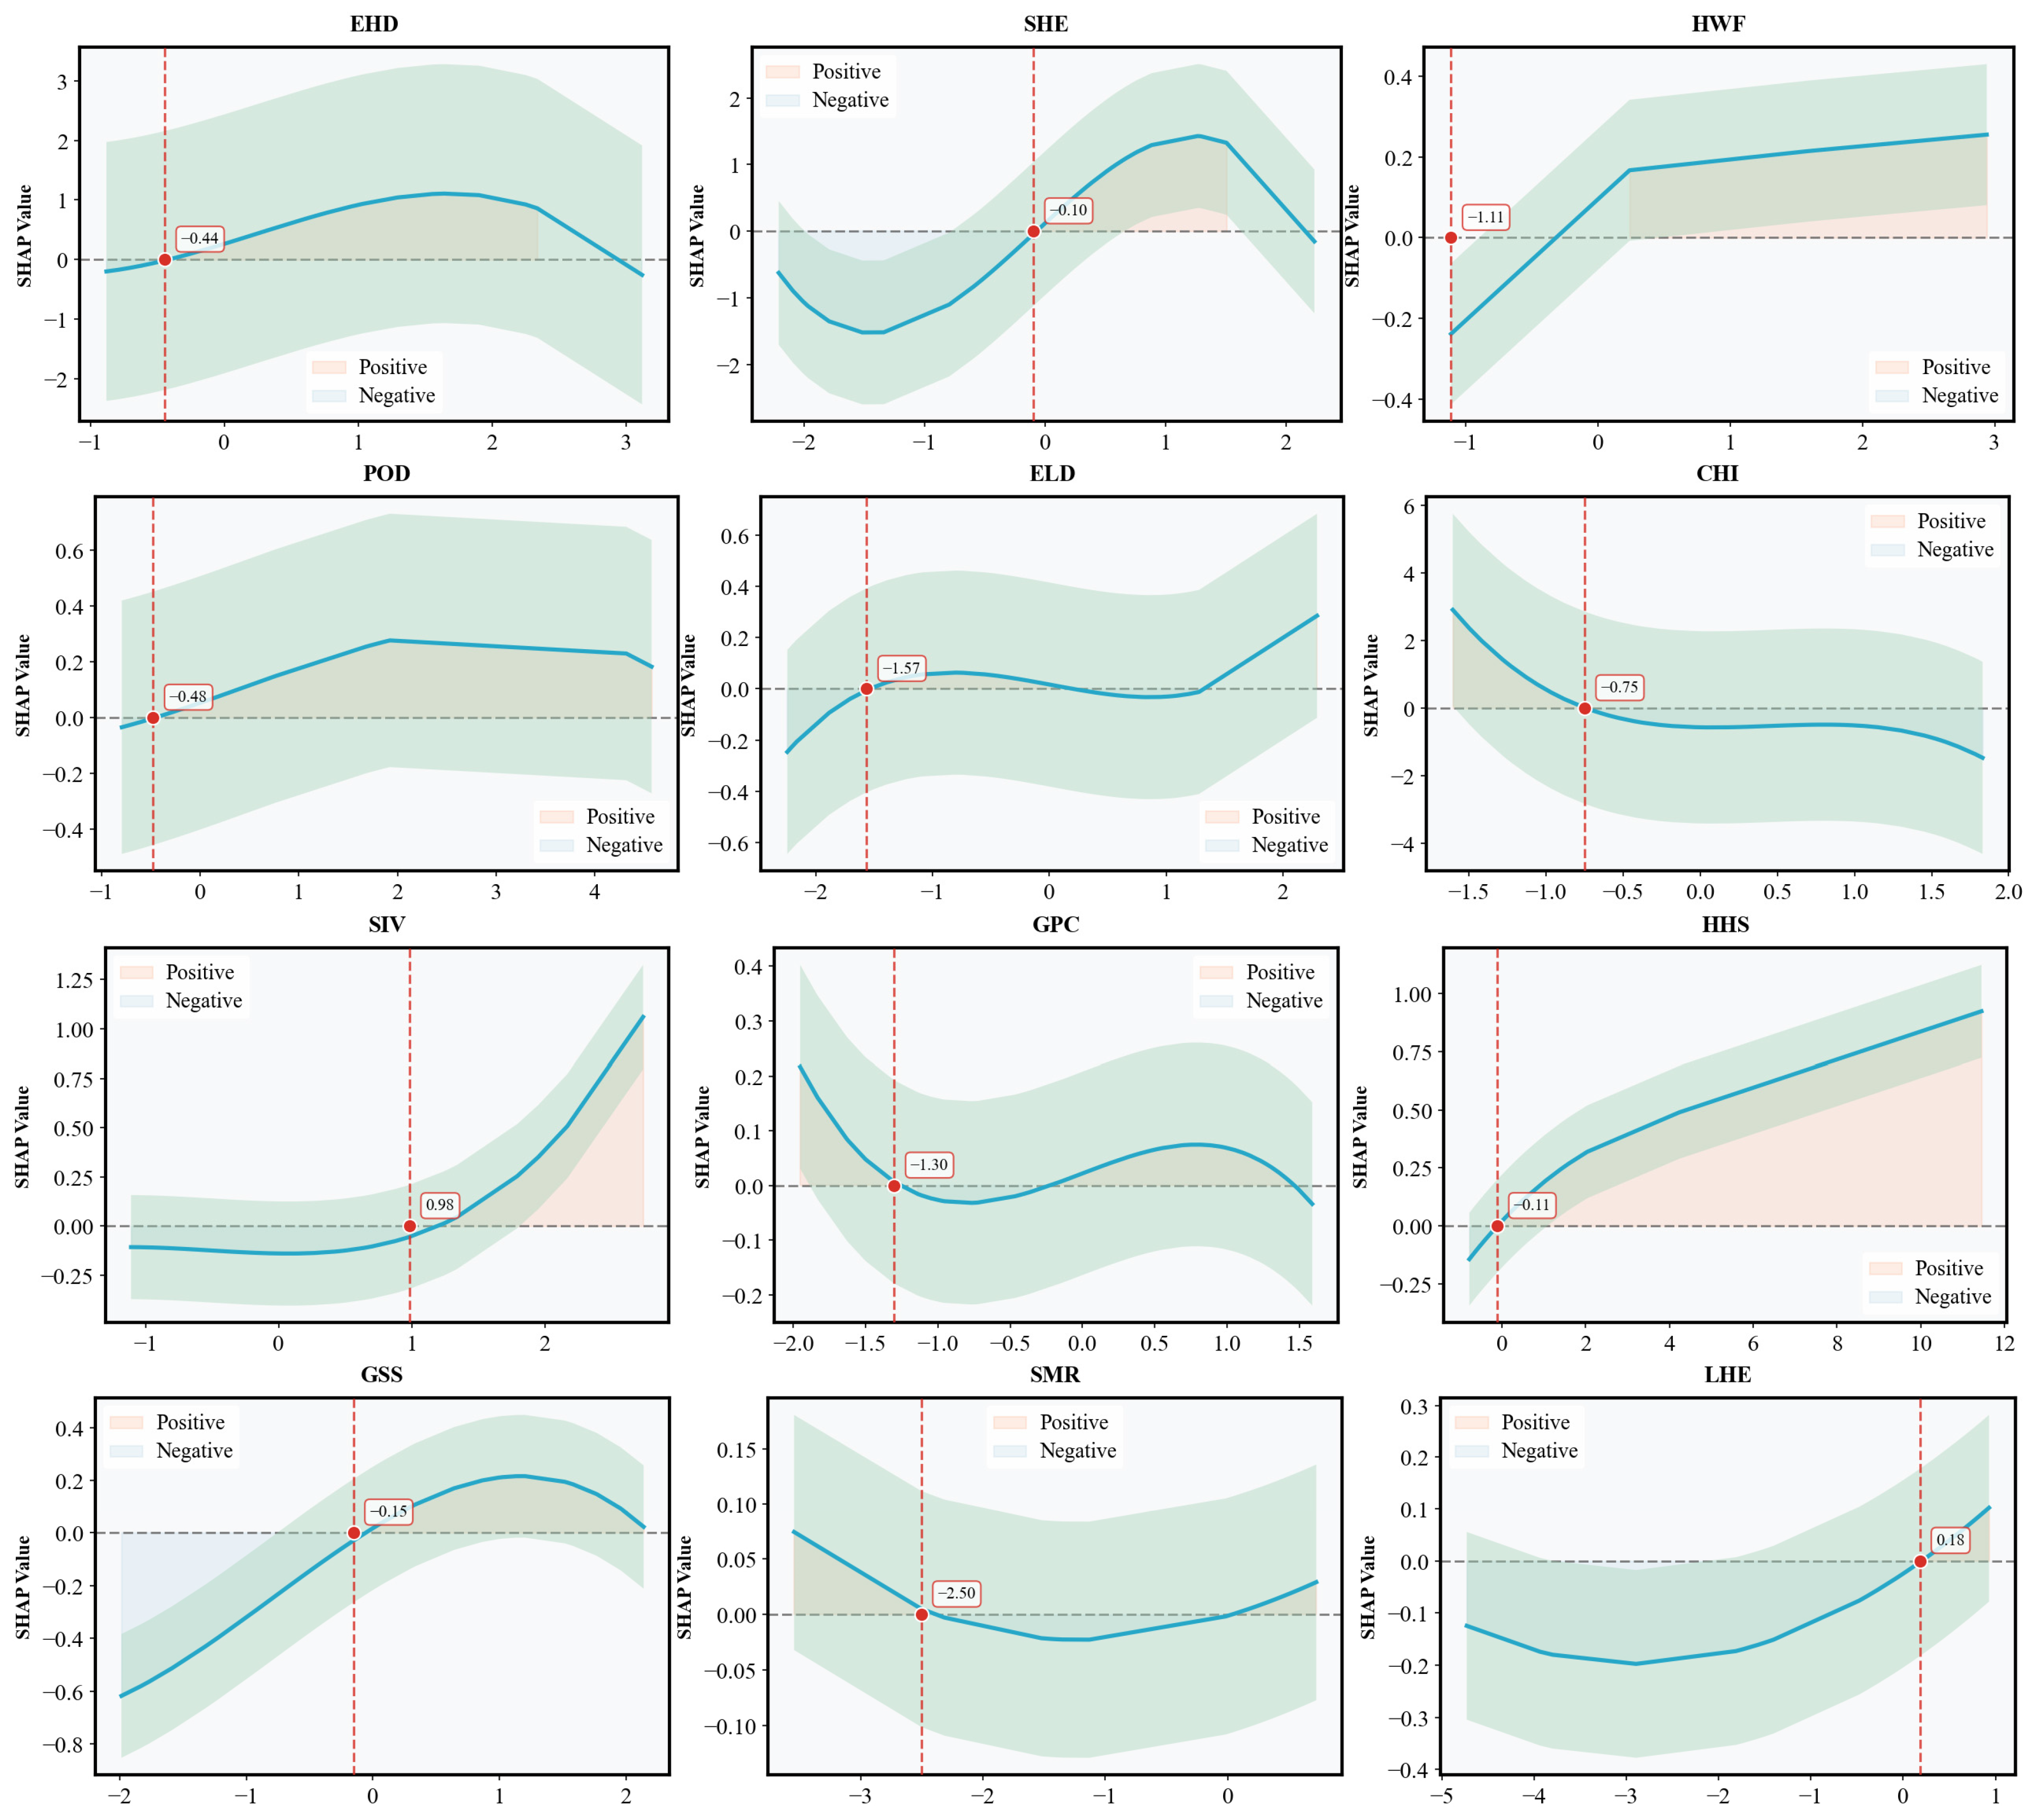
The SHAP dependence plots (Figure 14) show that the contributions of the indicators to the evaluation target exhibit pronounced nonlinear and critical characteristics. Among the positively driving factors, HHS and SIV show clear increasing trends: HHS crosses the zero line at a standardized value of 0.11 and then rises steadily as the value increases, whereas the effect of SIV remains relatively stable before the threshold of 0.98 and then increases sharply thereafter. Both SHE and GSS display distinct response intervals, with critical thresholds of −0.10 and −0.15, respectively. After crossing these thresholds, their SHAP values rise rapidly and reach peak contributions at feature values of approximately 1.5 and 1.0, respectively, before stabilizing or declining. In contrast, CHI exhibits a persistent negative inhibitory effect, with its SHAP value continuing to decline into the negative range after the threshold of −0.75. LHE presents a U-shaped pattern, first decreasing and then increasing, reaching the extreme of negative contribution at a standardized value of approximately −2.8, then rebounding and turning into a positive effect at the threshold of 0.18. In addition, the critical turning points of EHD, ELD, and HWF are located at −0.44, −1.57, and −1.11, respectively, reflecting the marginal effect boundaries at which these driving factors shift from inhibition to promotion.

3.5.4. Complex Spatial Coupling Characteristics of Bivariate Interactions

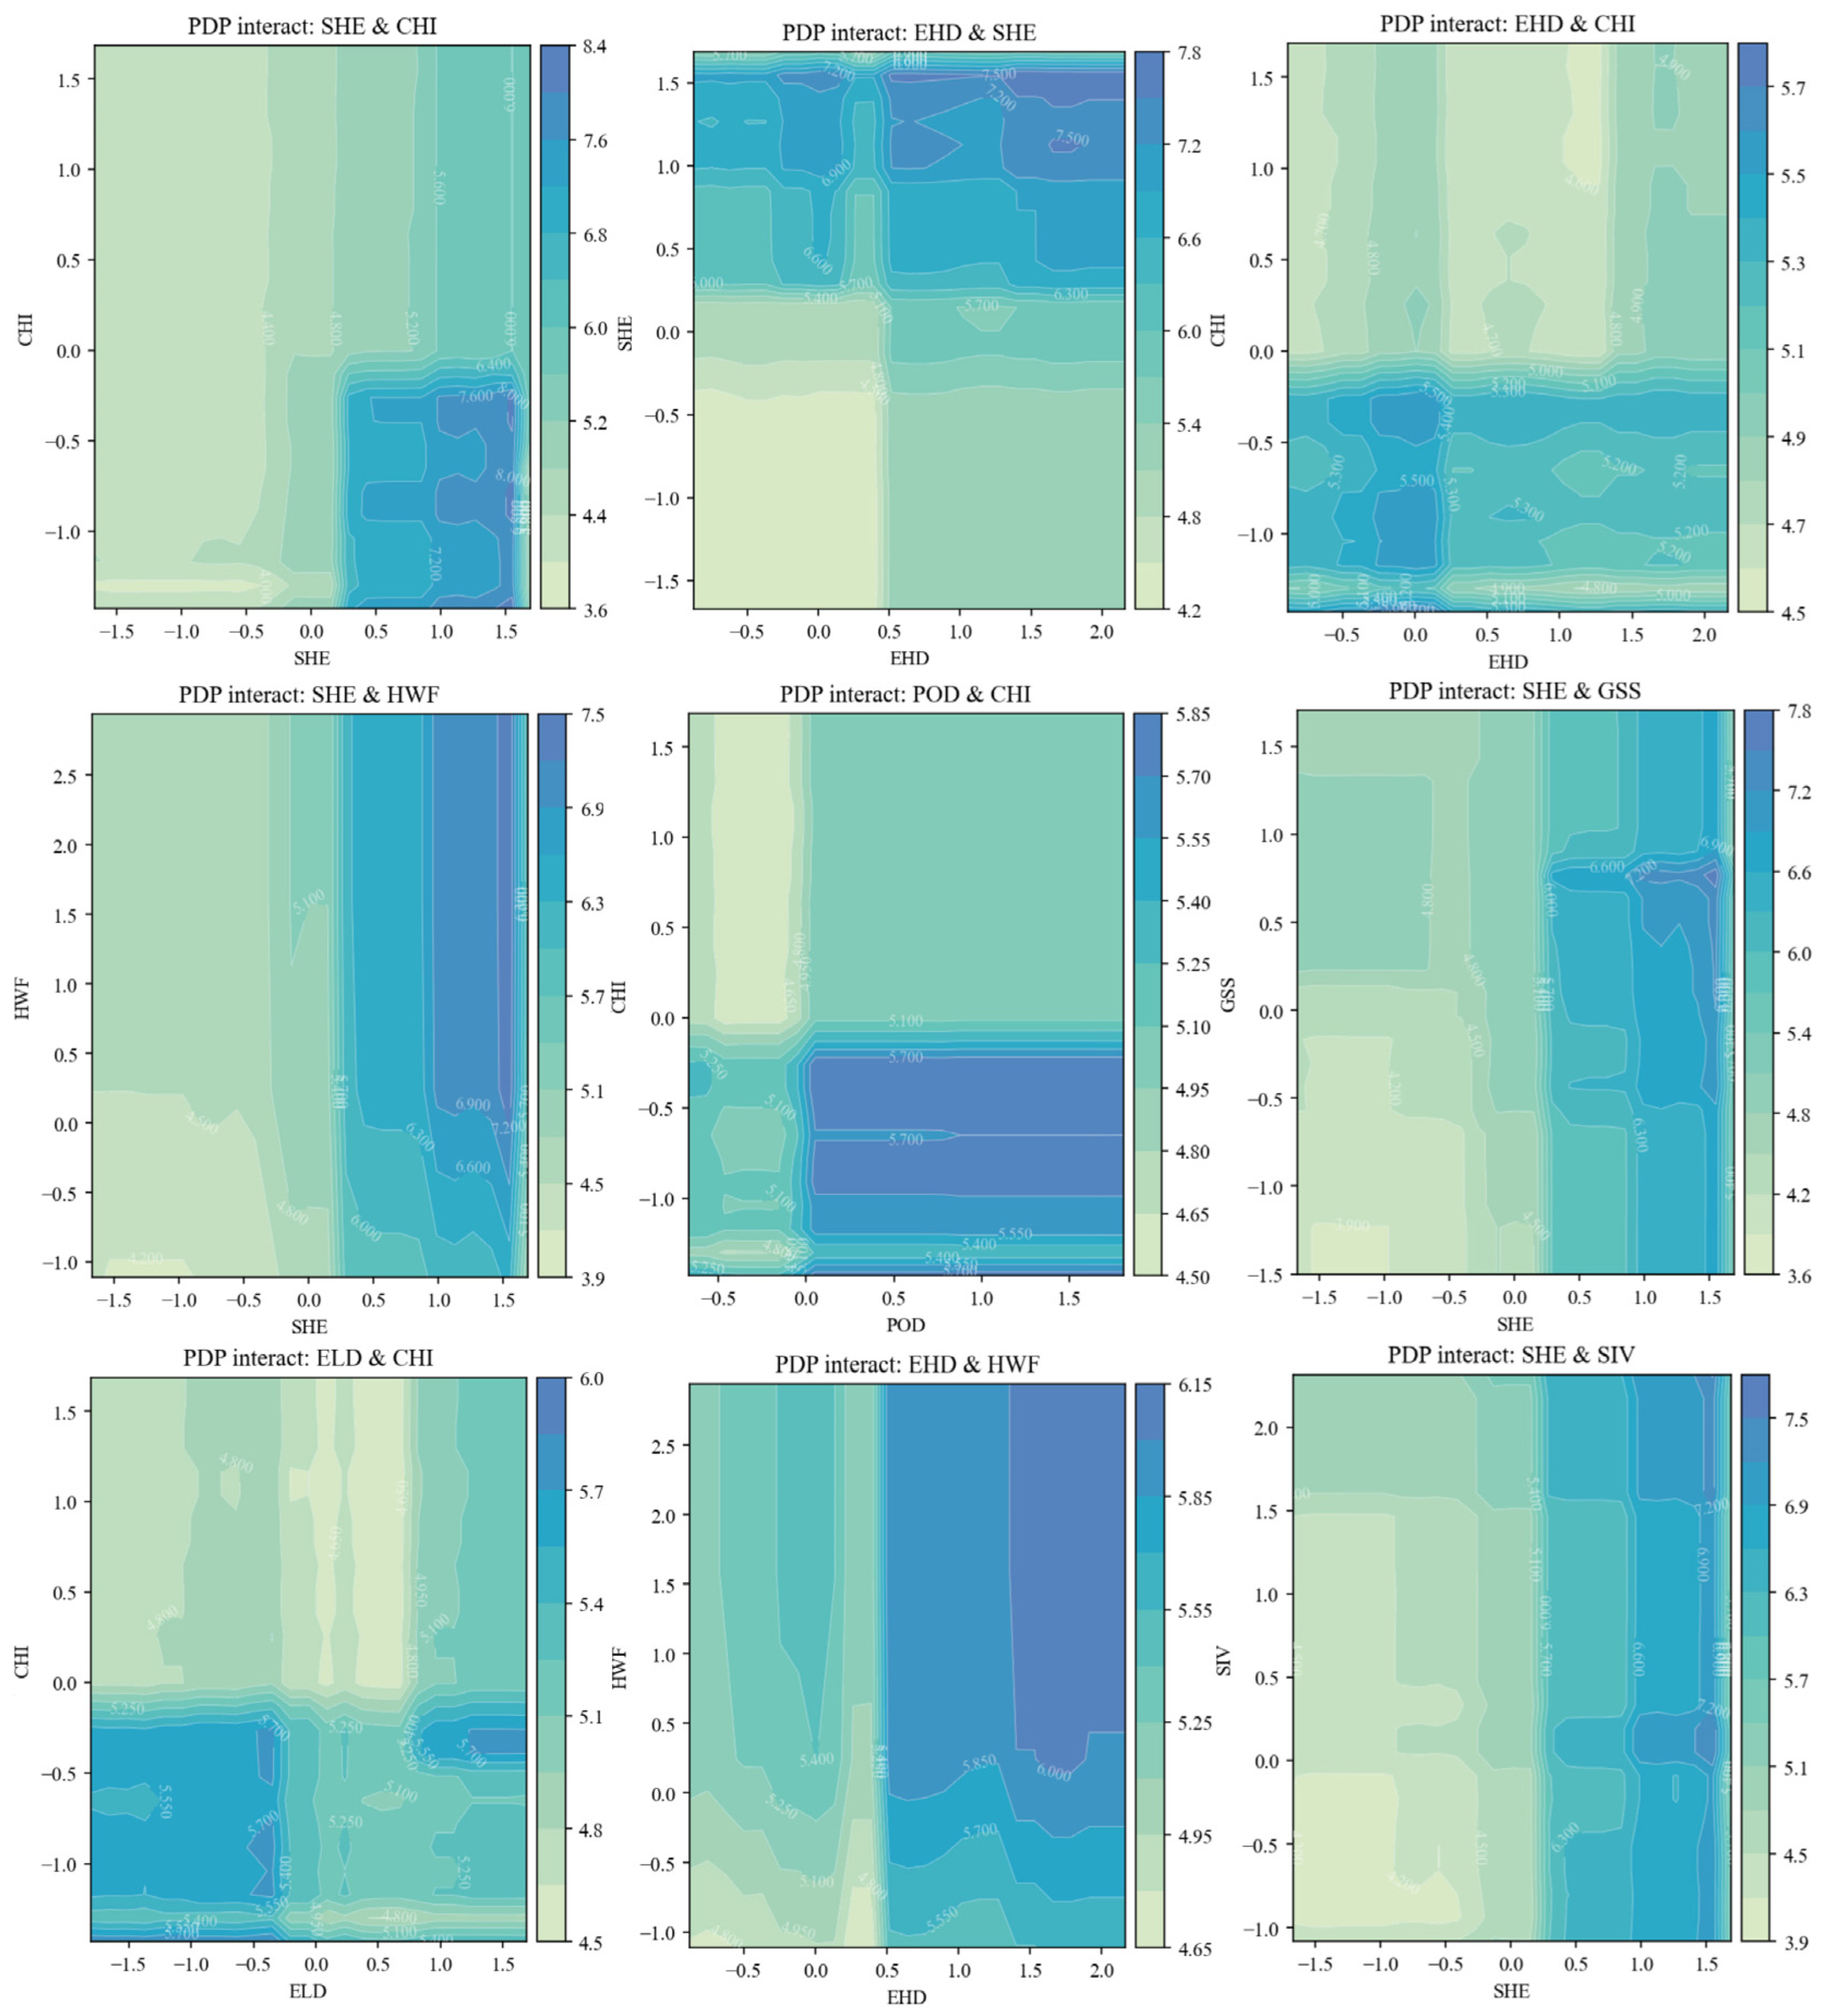
To further investigate how the driving factors are associated with SSI, we used the best-performing XGBoost model to construct two-dimensional partial dependence plots (PDP) (Figure 15), thereby quantitatively revealing the significant synergistic effects and nonlinear interaction mechanisms among the core driving factors. The results show that, under the interaction between SHE and CHI, the predicted SSI exhibits the largest fluctuation range in the entire indicator system, ranging from 3.6 to 8.4. When SHE exceeds 0.5 and CHI approaches 0, the predicted SSI reaches a high level. At the meteorological factor level, EHD and SHE show a clear superimposed effect; when EHD is greater than 0.5 and SHE equals 1.5, the predicted value reaches a peak of approximately 7.8. In addition, under conditions of low GSS and low exposure, SSI remains at the baseline level of 3.6, but as GSS increases to 0.75 and SHE reaches 1.5, the predicted value rises to 7.8. In terms of socioeconomic factors, POD and CHI form a significant high-SSI zone when POD is greater than 0.0 and CHI is less than 0.0, with SSI exceeding 5.10, whereas the interaction between SHE and SIV shows that when SHE exceeds 1.5, the predicted value can reach 7.5.

4. Discussion

4.1. Regional Differentiation of Heatwave Stress and Structural Decomposition of UHV in Urban Agglomerations

Since 2016, heatwave stress has continuously increased across the three major urban agglomerations [63]. This study finds that both the spatial distribution of heatwave and the distribution of UHV exhibit marked spatial heterogeneity. In terms of heatwave impacts, although the three urban agglomerations are all located along the eastern coast of China, they still display different levels of thermal environmental stress due to differences in latitude and topography [64]. Influenced by the characteristics of the temperate monsoon climate, the higher-latitude JJJ shows significantly stronger fluctuations; although its high-temperature events occur less frequently, it exhibits the largest variation in temperature extremes, confirming the greater prevalence of abrupt factors under its climatic conditions [65]. By contrast, although YRD and PRD are urban agglomerations with more similar latitudes, they still present distinct characteristics: YRD is characterized by a persistent heat stress environment with low frequency and long duration, whereas PRD exhibits intermittent thermal field stress with high frequency and short duration. Similarly, all three have shown a continued increase in thermal environmental stress in recent years, with the characteristics of the heatwave impacts experienced in 2022 and 2023 both reaching peaks. This indicates that the thermal environmental stress in China’s three major coastal urban agglomerations has gradually intensified in recent years [66], directly confirming the strong representativeness of the samples selected in this study. Crucially, the 2020 cooling anomaly serves as a rigorous baseline control against the 2022–2023 peaks, proving our framework’s robust generalizability to characterize system responses across both sudden macro-reliefs and escalating thermal shocks.
In addition to the external thermal environmental stress faced by urban agglomerations, the internal UHV characteristics of cities exhibit clear spatial heterogeneity after decomposition. On the one hand, the high-intensity and highly concentrated population agglomeration in JJJ poses substantial challenges to the allocation of internal green space resources, causing its UHV to manifest as dual pressure from population and ecology [67]. At the same time, the urban agglomeration structure centered on the core poles of Beijing and Tianjin keeps the UHV of its peripheral cities persistently high. In particular, under the strong heatwave shocks of 2023 and 2024, SSI performed poorly, indicating that the “Matthew effect” of urban development within JJJ has an important influence on its capacity to respond to shocks [37]. Cities within YRD exhibit a certain degree of developmental homogeneity, which indirectly contributes to the systemic and complex nature of its UHV; under NMF, different UHV profiles appear similar and superimposed, confirming its comprehensive pressure on resource allocation [68]. PRD displays a strong industrial character in its UHV profiles. As a southern coastal urban agglomeration, the rapid industrial expansion of some of its cities at the end of the last century generated negative effects on urban space and created challenges for the distribution of social resources within the urban agglomeration [69]. Overall, although the UHV characteristics of the three major urban agglomerations differ, the common pattern of urban core-pole distribution within them causes UHV hotspots to remain relatively stably distributed along the peripheries of the urban agglomerations, demonstrating the long-term nature of uneven urban development within China’s three major eastern coastal urban agglomerations [70]. Nevertheless, JJJ has shown a recent trend toward the homogenization of high UHV values, suggesting that the decentralization of capital functions may have contributed to alleviating internal UHV within the urban agglomeration. In addition, the above analysis shows that NMF reveals the sources of UHV stress in different urban agglomerations, providing a basis for implementing resilience enhancement strategies tailored to local conditions across regions.

4.2. Coupling and Decoupling Between UHV and SSI: Mechanism Analysis Behind the YRD Anomaly

The results show that UHV and SSI do not follow the same association logic across the three major urban agglomerations. In JJJ and PRD, the correlation coefficients are 0.38 and 0.35, respectively, indicating relatively stable “synergistic coupling”; that is, the higher the structural vulnerability of a city, the more likely its social system is to enter a high-stress state during heatwave. This suggests that population agglomeration, cumulative exposure, and service imbalance can be transformed relatively directly into observable social stress-bearing pressure [71]. In contrast, the correlation coefficient in YRD is only −0.04, constituting almost no stable linear relationship. This means that vulnerability is not necessarily an antecedent of stress-related consequences, and UHV is not simply the inverse construct of urban resilience. Therefore, under extreme high-temperature conditions, whether a city experiences stress depends on the combined effects of structural conditions and process regulation [5].
The reason YRD emerges as an anomaly lies in the presence of mediating variables in the transmission from UHV to SSI that are obscured by static indicators. Empirically, this decoupling is driven by YRD’s advanced regional integrated emergency response capacity and institutionalized cross-city public resource sharing networks. Under severe heatwave shocks, this polycentric coordination allows flexible medical logistics and joint power grid peak-shaving, thereby preventing localized structural vulnerabilities from translating into widespread social panic. Stronger social capital, more mature early warning and emergency response systems, and higher levels of medical and public service provision may all weaken the amplifying effect of structural vulnerability on social stress responses [72,73]. Spatially, the low-UHV core area along the Shanghai–Nanjing axis forms a contiguous distribution, and, as shown by the preceding NMF analysis, the spatial homogeneity of UHV within YRD is significant. Such a more stable and homogeneous system may exert a stress-reducing effect on surrounding cities through resource spillover from core development, cross-city coordination, and network connectivity [74].

4.3. Resilience Fatigue Under Heatwave Shocks and Urban Resilience Threshold Effects Under Nonlinear Mechanisms

To identify the key vulnerability factors determining urban resilience and thereby clarify the variation pattern of the SSI under heatwave shocks, this study constructs a machine learning model and combines SHAP and PDP to conduct a nonlinear analysis of the three dimensions of exposure, sensitivity, and adaptive capacity. The results show that the annual number of extreme high-temperature days (EHD), proportion of population aged under 14 (CHI), and heatwave frequency (HWF) are the core influencing factors, with importance shares of 25.65%, 23.49%, and 13.15%, respectively, accounting for more than 60% in total. Among them, the annual number of extreme high-temperature days (EHD) and heatwave frequency (HWF) are positively correlated factors, indicating that the higher the values of EHD and HWF, the more susceptible a city is to heatwave shocks, thereby leading to a higher SSI. Of particular note is the sensitivity dimension: as a typical negatively correlated indicator, the proportion of population aged under 14 (CHI) ranks second only to EHD in importance. This reveals the critical influence of the proportion of heat-vulnerable groups in the social demographic structure: the greater the proportion of vulnerable groups, the more likely a city is to experience resilience fatigue before heatwave events [75,76].
Subsequently, this study uses SHAP dependence plots to analyze the nonlinear intervention boundaries of 12 driving factors on SSI, revealing complex threshold effects. Among them, the relatively low threshold of summer heat exposure intensity (SHE) at −0.10 indicates that urban responses to high-temperature intensity are markedly sensitive, meaning that even slight changes in intensity can trigger sharp changes in public sensitivity; when the value rises to around 1.5, heat exposure reaches an extreme level. At this point, as the public may shift to full-time indoor avoidance, marginal risk perception may decline [77]. Many factors exhibit U-shaped response characteristics. For example, the rapid shift to positive values for deficiency in green space coverage at −0.15 indicates that even a slight shortage of green space can quickly intensify urban resilience fatigue [78]. In addition, particular attention should be paid to the nonlinear interaction mechanisms among important driving factors [79]. Taking the interaction between the proportion of population aged under 14 (CHI) and summer heat exposure intensity (SHE) as an example, the results show that SSI reaches its peak when the values are −0.75 and 1.5, respectively. This indicates that in areas with a low proportion of children, owing to the lack of heat-environment resilience protection facilities and the proactive risk-avoidance behaviors of guardians, the impacts of heat stress are more likely to be transformed into social anxiety, thereby increasing SSI. For instance, crossing the sensitive SHE threshold (−0.10) should serve as an administrative trigger to activate flexible working hours and cooling corridors to counteract acute demographic shocks in Jing–Jin–Ji. Concurrently, the GSS threshold (−0.15) establishes a strict baseline for urban zoning codes, mandating targeted pocket park interventions to resolve systemic resource pressures in the Yangtze River Delta and alleviate high-density industrial exposure grids in the Pearl River Delta to preemptively buffer resilience fatigue. Therefore, cities need to focus on identifying the critical thresholds of key meteorological exposure and social sensitivity factors and, in response to the nonlinear interaction mechanisms among factors, implement targeted strategies to address shortcomings in urban heat resilience infrastructure and related interventions [80].

4.4. Limitations and Future Research Prospects

Although this study systematically reveals the mechanisms of urban resilience evolution under heatwave shocks in China’s three major coastal urban agglomerations, several limitations remain. First, although the BSI effectively captures dynamic social perception, it inherently underrepresents heat stress among elderly and marginalized groups due to the digital divide. Nevertheless, existing epidemiological literature establishes a robust alignment between heat-related search behavior volatility and real-world clinical outcomes, such as subsequent spikes in hospital admissions and emergency calls for heatstroke [24,25]—thereby cross-validating the reliability of our proxy choice. Second, the current study focuses on macro-level comparisons at the city scale. While this city-level approach is indispensable for guiding regional collaborative governance and macro-resource allocation across large urban agglomerations, it inevitably masks intra-urban microclimatic heterogeneity. In future extensions, incorporating community- or neighborhood-scale microclimate data could uniquely complement our macro-framework by identifying localized thermal boundary layers and capturing fine-grained variations in social vulnerability.
Future work will integrate multi-source big data, such as emergency call records, to conduct multidimensional calibration of the relationship between social perception and actual physiological damage, while further refining the research scale to the community level to provide more precise governance pathways. To ensure methodological rigor within this city-year panel data structure, future extensions will transition from standard random train-test splits to panel-conscious validation, such as spatial-temporal block cross-validation, completely ruling out any potential performance overestimation. Specifically, this framework will transition from deterministic risk assessments toward a probabilistic framework, coupling the trained XGBoost model with CMIP6 projections to predict long-term resilience fatigue trajectories up to the 2050 horizon. Furthermore, on the climate mitigation front, we aim to investigate localized sustainable cooling strategies, exploring how mixed-mode ventilation and active urban thermal adaptation can be structurally deployed to alleviate extreme heat [81,82], particularly in high-density coastal environments like the Pearl River Delta.

5. Conclusions

Amid pronounced global climate change and the frequent occurrence of heat-related disasters, it is essential to clarify the interregional heterogeneity and threshold effects of urban resilience resistance under heatwave conditions. Taking 38 cities in China’s three major coastal urban agglomerations from 2016 to 2024 as the study area, this study uses the SSI to quantify resilience fatigue during heatwave processes, applies NMF to analyze the spatial heterogeneity of UHV, and finally employs XGBoost combined with SHAP and PDP to identify the nonlinear driving mechanisms linking vulnerability factors and the dynamic resilience response.
The results show that, under the same heatwave events, although Jing–Jin–Ji (JJJ), Yangtze River Delta (YRD), and Pearl River Delta (PRD) all exhibit resilience fatigue and this effect continues to increase year by year under heatwave impacts, the dominant factors of UHV differ significantly among them. JJJ is mainly constrained by the scarcity of environmental resources and the pressure of high population density; although resource distribution is relatively balanced in the YRD, it exhibits systemic UHV characteristics under heatwave shocks; in the PRD, the attributes of the secondary industry and infrastructure allocation constitute important components of UHV. At the same time, all three urban agglomerations show a certain degree of internal imbalance in resource allocation, which is related to their initial development strategies. However, due to increasing government attention, resource allocation in the JJJ urban agglomeration has tended to become more balanced in recent years, which is also reflected in resilience changes induced by heatwave events.
Taking the heatwave events in 38 cities from 2016 to 2024 as an example, UHV and resilience fatigue in the three major urban agglomerations exhibit complex nonlinear associations. Although the samples from JJJ and PRD show significant positive correlations in the Spearman correlation coefficient analysis, manifested as a coordinated coupling between UHV and SSI, which represents the threshold effects of urban resilience resistance, this finding is consistent with the traditional understanding that the more vulnerable a city is, the weaker its urban resilience resistance becomes. However, the correlation coefficient in the YRD is only −0.04, demonstrating that under the YRD’s systemic UHV characteristics, its relatively balanced resource allocation and complex UHV system can relatively effectively offset the hidden risks of structural vulnerability under heatwave shocks.
In addition, to further clarify the nonlinear association between UHV and resilience response and to explore the threshold effects of different UHV factors on urban resilience, this study compares different machine learning models and ultimately selects XGBoost. SHAP is used to identify SHE, CHI, and EHD as the three core factors, while PDP is used to extract the specific threshold values of different vulnerability factors, thereby identifying their key roles in driving urban resilience from a normal steady state to an emergency stress state during heatwave events.

Author Contributions

Conceptualization, W.C.; Methodology, L.H. and W.C.; Software, P.C., L.H., W.C., K.H. and Y.Z.; Validation, P.C. and K.H.; Formal analysis, P.C., L.H., K.H. and Y.Z.; Investigation, P.C., W.C. and H.W.; Resources, Y.Z.; Data curation, L.H., Y.Z. and H.W.; Writing—original draft, P.C., L.H., K.H., Y.Z. and H.W.; Writing—review & editing, P.C., K.H., X.T. and C.T.; Visualization, W.C.; Supervision, X.T. and C.T.; Project administration, X.T. and C.T.; Funding acquisition, X.T. All authors have read and agreed to the published version of the manuscript.

Funding

This research was funded by the Philosophy and Social Sciences Research Planning Project of Ya’an City, grant number YAA2025012.

Data Availability Statement

The raw data supporting the conclusions of this article will be made available by the authors on request.

Conflicts of Interest

The authors declare no conflict of interest.

Abbreviations

The following abbreviations are used in this manuscript:
BSIBaidu Search Index
CHIProportion of population aged under 14 (Children)
EHDAnnual number of extreme high-temperature days
ELDProportion of elderly population
GPCEconomic pressure level (based on Gross Domestic Product per capita)
GSSInsufficiency of green space coverage in built-up areas
HHSPublic heat-health sensitivity
HWFAnnual heatwave frequency
IPCCIntergovernmental Panel on Climate Change
JJJJing–Jin–Ji (Beijing–Tianjin–Hebei urban agglomeration)
YRDYangtze River Delta
PRDPearl River Delta
LHEInsufficiency of higher education coverage
NMFNon-Negative Matrix Factorization
PDPPartial Dependence Plot
PSRPressure–State–Response framework
RFRandom Forest
SHAPSHapley Additive Explanations
SHESummer heat exposure intensity
SIVShare of secondary industry output value
SMRScarcity of medical resources
SSIStandardized Stress Index
UHVUrban heat vulnerability
XGBoostExtreme Gradient Boosting

References

  1. Romanello, M.; Napoli, C.D.; Green, C.; Kennard, H.; Lampard, P.; Scamman, D.; Walawender, M.; Ali, Z.; Ameli, N.; Ayeb-Karlsson, S.; et al. The 2023 Report of the Lancet Countdown on Health and Climate Change: The Imperative for a Health-Centred Response in a World Facing Irreversible Harms. Lancet 2023, 402, 2346–2394. [Google Scholar] [CrossRef] [Scilit]
  2. Morit, A. Extreme Heatwaves: Surprising Lessons from the Record Warmth. Nature 2022, 608, 35927493. [Google Scholar] [CrossRef] [Scilit] [PubMed]
  3. Tuholske, C.; Caylor, K.; Funk, C.; Verdin, A.; Sweeney, S.; Grace, K.; Peterson, P.; Evans, T. Global Urban Population Exposure to Extreme Heat. Proc. Natl. Acad. Sci. USA 2021, 118, e2024792118. [Google Scholar] [CrossRef] [Scilit] [PubMed]
  4. Chen, M.; Chen, L.; Zhou, Y.; Hu, M.; Jiang, Y.; Huang, D.; Gong, Y.; Xian, Y. Rising Vulnerability of Compound Risk Inequality to Ageing and Extreme Heatwave Exposure in Global Cities. npj Urban Sustain. 2023, 3, 38. [Google Scholar] [CrossRef] [Scilit]
  5. Sirenko, M.; Comes, T.; Verbraeck, A. Urban Heatwaves Reverse Vulnerability-Resilience Relationships throughout the Day. npj Urban Sustain. 2026, 6, 22. [Google Scholar] [CrossRef] [Scilit]
  6. McDonald, R.I.; Biswas, T.; Chakraborty, T.C.; Kroeger, T.; Cook-Patton, S.C.; Fargione, J.E. Current Inequality and Future Potential of US Urban Tree Cover for Reducing Heat-Related Health Impacts. npj Urban Sustain. 2024, 4, 18. [Google Scholar] [CrossRef] [Scilit]
  7. Chen, M.; Li, X.; Dang, A.; Weng, Y.; Qiu, S. Adapting to Heatwaves: Optimizing Urban Green Spaces in Beijing to Reduce Heat Health Risks. Sustain. Cities Soc. 2025, 130, 106600. [Google Scholar] [CrossRef] [Scilit]
  8. Faurie, C.; Varghese, B.M.; Liu, J.; Bi, P. Association between High Temperature and Heatwaves with Heat-Related Illnesses: A Systematic Review and Meta-Analysis. Sci. Total Environ. 2022, 852, 158332. [Google Scholar] [CrossRef] [Scilit]
  9. Phung, D.; Thai, P.K.; Guo, Y.; Morawska, L.; Rutherford, S.; Chu, C. Ambient Temperature and Risk of Cardiovascular Hospitalization: An Updated Systematic Review and Meta-Analysis. Sci. Total Environ. 2016, 550, 1084–1102. [Google Scholar] [CrossRef] [Scilit]
  10. Liu, J.; Varghese, B.M.; Hansen, A.; Xiang, J.; Zhang, Y.; Dear, K.; Gourley, M.; Driscoll, T.; Morgan, G.; Capon, A.; et al. Is There an Association between Hot Weather and Poor Mental Health Outcomes? A Systematic Review and Meta-Analysis. Environ. Int. 2021, 153, 106533. [Google Scholar] [CrossRef] [Scilit]
  11. Duan, W.; Madasi, J.D.; Khurshid, A.; Ma, D. Industrial Structure Conditions Economic Resilience. Technol. Forecast. Soc. Change 2022, 183, 121944. [Google Scholar] [CrossRef] [Scilit]
  12. Mavhura, E.; Manyangadze, T.; Aryal, K.R. A Composite Inherent Resilience Index for Zimbabwe: An Adaptation of the Disaster Resilience of Place Model. Int. J. Disaster Risk Reduct. 2021, 57, 102152. [Google Scholar] [CrossRef] [Scilit]
  13. National Development and Reform Commission of China; Ministry of Housing and Urban-Rural Development. Notice on Issuing the Action Plan for Urban Climate Change Adaptation. 2016. Available online: https://www.ndrc.gov.cn/xxgk/zcfb/tz/201602/t20160216_963584.html (accessed on 20 August 2025).
  14. Zhang, R.; Zhou, J.; Sun, F.; Xu, H.; Xing, H. Spatiotemporal Evolution and Driving Factors of Urban Resilience against Disasters: A Dual Perspective of Urban Systems and Resilience Capacities. Land 2025, 14, 741. [Google Scholar] [CrossRef] [Scilit]
  15. Feng, X.; Xu, M.; Zhong, Y.; Li, Q.; Loo, B.P.Y.; Xiu, C. Urban Resilience and Panarchy: Insights from Nanchang City, China. Cities 2025, 162, 105934. [Google Scholar] [CrossRef] [Scilit]
  16. Chou, J.; Sun, M.; Dong, W.; Zhao, W.; Li, J.; Li, Y.; Zhou, J. Assessment and Prediction of Climate Risks in Three Major Urban Agglomerations of Eastern China. Sustainability 2021, 13, 13037. [Google Scholar] [CrossRef] [Scilit]
  17. Shu, Y.; Zou, K.; Li, G.; Yan, Q.; Zhang, S.; Zhang, W.; Liang, Y.; Xu, W. Evaluation of Urban Thermal Comfort and Its Relationship with Land Use/Land Cover Change: A Case Study of Three Urban Agglomerations, China. Land 2022, 11, 2140. [Google Scholar] [CrossRef] [Scilit]
  18. Berkes, F.; Folke, C.; Colding, J. Linking Social and Ecological Systems: Management Practices and Social Mechanisms for Building Resilience; Cambridge University Press: Cambridge, UK, 1998. [Google Scholar] [CrossRef] [Scilit]
  19. Dakos, V.; Kéfi, S. Ecological Resilience: What to Measure and How. Environ. Res. Lett. 2022, 17, 043003. [Google Scholar] [CrossRef] [Scilit]
  20. Folke, C. Resilience: The Emergence of a Perspective for Social–Ecological Systems Analyses. Glob. Environ. Change 2006, 16, 253–267. [Google Scholar] [CrossRef] [Scilit]
  21. Ruan, J.; Chen, Y.; Yang, Z. Assessment of Temporal and Spatial Progress of Urban Resilience in Guangzhou under Rainstorm Scenarios. Int. J. Disaster Risk Reduct. 2021, 66, 102578. [Google Scholar] [CrossRef] [Scilit]
  22. Sharifi, A. Resilience of Urban Social-Ecological-Technological Systems (SETS): A Review. Sustain. Cities Soc. 2023, 99, 104910. [Google Scholar] [CrossRef] [Scilit]
  23. Stolte, T.R.; Koks, E.E.; De Moel, H.; Reimann, L.; Van Vliet, J.; De Ruiter, M.C.; Ward, P.J. VulneraCity–Drivers and Dynamics of Urban Vulnerability Based on a Global Systematic Literature Review. Int. J. Disaster Risk Reduct. 2024, 108, 104535. [Google Scholar] [CrossRef] [Scilit]
  24. Seong, K.; Jiao, J.; Mandalapu, A. Evaluating the Effects of Heat Vulnerability on Heat-Related Emergency Medical Service Incidents: Lessons from Austin, Texas. Environ. Plan. B Urban Anal. City Sci. 2023, 50, 776–795. [Google Scholar] [CrossRef] [Scilit]
  25. Li, T.; Ding, F.; Sun, Q.; Zhang, Y.; Kinney, P.L. Heat Stroke Internet Searches Can Be a New Heatwave Health Warning Surveillance Indicator. Sci. Rep. 2016, 6, 37294. [Google Scholar] [CrossRef] [Scilit]
  26. Liu, J.; Chen, C.; Wang, Y.; Cui, L.; Han, D.; Li, T. Evaluation on heat-health risk warning in Jinan based on Baidu heat stroke search index. J. Shandong Univ. (Health Sci.) 2023, 61, 103–108. [Google Scholar]
  27. D’Ambrosio, V.; Di Martino, F.; Miraglia, V. A GIS-Based Framework to Assess Heatwave Vulnerability and Impact Scenarios in Urban Systems. Sci. Rep. 2023, 13, 13073. [Google Scholar] [CrossRef] [Scilit]
  28. Hufschmidt, G. A Comparative Analysis of Several Vulnerability Concepts. Nat. Hazard. 2011, 58, 621–643. [Google Scholar] [CrossRef] [Scilit]
  29. Jin, J.; Liu, P.; Huang, H.; Dong, Y. Analyzing Urban Traffic Crash Patterns through Spatio-Temporal Data: A City-Level Study Using a Sparse Non-Negative Matrix Factorization Model with Spatial Constraints Approach. Appl. Geogr. 2024, 172, 103402. [Google Scholar] [CrossRef] [Scilit]
  30. Wang, Y.-X.; Zhang, Y.-J. Nonnegative Matrix Factorization: A Comprehensive Review. IEEE Trans. Knowl. Data Eng. 2013, 25, 1336–1353. [Google Scholar] [CrossRef] [Scilit]
  31. Li, T.; Liu, Y.; Zheng, Z.; Li, S.; Zheng, X.; Wei, G.; He, B. The Mitigating Effects of Urban Resilience on Surface Urban Heat Islands: Nonlinear Responses, Threshold Effects, and Spatial Heterogeneity. Sustain. Cities Soc. 2025, 131, 106722. [Google Scholar] [CrossRef] [Scilit]
  32. Chen, C.; Wang, S.; Liu, M.; Huang, K.; Guo, Q.; Xie, W.; Wan, J. Beyond Linearity: Uncovering the Complex Spatiotemporal Drivers of New-Type Urbanization and Eco-Environmental Resilience Coupling in China’s Chengdu–Chongqing Economic Circle with Machine Learning. Land 2025, 14, 1424. [Google Scholar] [CrossRef] [Scilit]
  33. Wang, L.; Liu, B.; He, Y.; Dong, Z.; Wang, S. Have Public Environmental Appeals Inspired Green Total Factor Productivity? Empirical Evidence from Baidu Environmental Search Index. Environ. Sci. Pollut. Res. 2022, 30, 30237–30252. [Google Scholar] [CrossRef] [Scilit]
  34. Zhou, W.; Zhong, L.; Tang, X.; Huang, T.; Xie, Y. Early Warning and Monitoring of COVID-19 Using the Baidu Search Index in China. J. Infect. 2022, 84, e82–e84. [Google Scholar] [CrossRef] [Scilit] [PubMed]
  35. Rahmatollahi, N.; Wang, Z.-H.; Wang, Y.; Yang, X. Machine Learning and Causal Attribution of Urban Heat in the Phoenix Metropolitan. Sustain. Cities Soc. 2026, 137, 107145. [Google Scholar] [CrossRef] [Scilit]
  36. You, Q.; Jiang, Z.; Kong, L.; Wu, Z.; Bao, Y.; Kang, S.; Pepin, N. A Comparison of Heat Wave Climatologies and Trends in China Based on Multiple Definitions. Clim. Dyn. 2017, 48, 3975–3989. [Google Scholar] [CrossRef] [Scilit]
  37. Wang, Y.; Ren, Y.; Song, L.; Xiang, Y. Responses of Extreme High Temperatures to Urbanization in the BEIJING–TIANJIN–HEBEI Urban Agglomeration in the Context of a Changing Climate. Meteorol. Appl. 2021, 28, e2024. [Google Scholar] [CrossRef] [Scilit]
  38. Ma, Y.; Liang, P.; Grimmond, S.; Yang, X.; Lyu, J.; Ding, Y. Three-Dimensional Urban Thermal Effect across a Large City Cluster during an Extreme Heat Wave: Observational Analysis. J. Meteorol. Res. 2022, 36, 387–400. [Google Scholar] [CrossRef] [Scilit]
  39. Tseng, W.-L.; Lin, S.-Y.; Wang, Y.-C.; Lo, S.-H.; Lo, M.-H.; Lee, S.-Y.; Tsai, C.-T.; Hsu, H.-H. Impact of Pacific–Japan Pattern on Temperature and Heatwave Events in Summer over Taiwan. Int. J. Climatol. 2023, 43, 7067–7081. [Google Scholar] [CrossRef] [Scilit]
  40. Sheng, Y.; Zhen, J.; Zhang, Y.; Li, D. Spatial Differentiation in Public Perception of Peak Summer Heat Based on Microblog Big Data. PLoS ONE 2026, 21, e0337738. [Google Scholar] [CrossRef] [Scilit]
  41. Watson, R.T.; Albritton, D.L.; Intergovernmental Panel on Climate Change Working Group I; Intergovernmental Panel on Climate Change Working Group II; Intergovernmental Panel on Climate Change Working Group III. Climate Change 2001: Synthesis Report; Cambridge University Press: Cambridge, UK, 2001. [Google Scholar]
  42. Prudent, N.; Houghton, A.; Luber, G. Assessing Climate Change and Health Vulnerability at the Local Level: Travis County, Texas. Disasters 2016, 40, 740–752. [Google Scholar] [CrossRef] [Scilit]
  43. Dahl, K.; Licker, R.; Abatzoglou, J.T.; Declet-Barreto, J. Increased Frequency of and Population Exposure to Extreme Heat Index Days in the United States during the 21st Century. Environ. Res. Commun. 2019, 1, 075002. [Google Scholar] [CrossRef] [Scilit]
  44. Estoque, R.C.; Ooba, M.; Seposo, X.T.; Togawa, T.; Hijioka, Y.; Takahashi, K.; Nakamura, S. Heat Health Risk Assessment in Philippine Cities Using Remotely Sensed Data and Social-Ecological Indicators. Nat. Commun. 2020, 11, 1581. [Google Scholar] [CrossRef] [Scilit]
  45. Yoo, C.; Im, J.; Weng, Q.; Cho, D.; Kang, E.; Shin, Y. Diurnal Urban Heat Risk Assessment Using Extreme Air Temperatures and Real-Time Population Data in Seoul. iScience 2023, 26, 108123. [Google Scholar] [CrossRef] [Scilit]
  46. Li, F.; Yigitcanlar, T.; Nepal, M.; Thanh, K.; Dur, F. Understanding Urban Heat Vulnerability Assessment Methods: A PRISMA Review. Energies 2022, 15, 6998. [Google Scholar] [CrossRef] [Scilit]
  47. Qureshi, A.M.; Rachid, A. Heat Vulnerability Index Mapping: A Case Study of a Medium-Sized City (Amiens). Climate 2022, 10, 113. [Google Scholar] [CrossRef] [Scilit]
  48. Karanja, J.; Kiage, L. Perspectives on Spatial Representation of Urban Heat Vulnerability. Sci. Total Environ. 2021, 774, 145634. [Google Scholar] [CrossRef] [Scilit]
  49. Lee, D.; Oh, K.; Suh, J. Diagnosis and Prioritization of Vulnerable Areas of Urban Ecosystem Regulation Services. Land 2022, 11, 1804. [Google Scholar] [CrossRef] [Scilit]
  50. Wu, X.; Liu, Q.; Huang, C.; Li, H. Mapping Heat-Health Vulnerability Based on Remote Sensing: A Case Study in Karachi. Remote Sens. 2022, 14, 1590. [Google Scholar] [CrossRef] [Scilit]
  51. Wilhelmi, O.V.; Hayden, M.H. Connecting People and Place: A New Framework for Reducing Urban Vulnerability to Extreme Heat. Environ. Res. Lett. 2010, 5, 014021. [Google Scholar] [CrossRef] [Scilit]
  52. Lu, Y.; Cheng, X.; Yang, Y.; Wang, H. Thresholds and Synergies: How 3D Urban Configurations Shape Thermal Environment Optimization in Chengdu’s Core—A Multidimensional Analysis with ECOSTRESS and Random Forest. Energy Build. 2026, 352, 116815. [Google Scholar] [CrossRef] [Scilit]
  53. He, R.; Wang, J.; Liu, D. Assessing the Impact of Urban Spatial Form on Land Surface Temperature Using Random Forest—Taking Beijing as a Case Study. Land 2025, 14, 1639. [Google Scholar] [CrossRef] [Scilit]
  54. Zeng, M.; Liu, C.; Li, Y.; He, B.; Wang, R.; Qian, Z.; Wang, F.; Huang, Q.; Li, P.; Leng, B.; et al. Investigating the Influence of Urban Morphology on Seasonal Thermal Environment Based on Urban Functional Zones. Land 2025, 14, 2117. [Google Scholar] [CrossRef] [Scilit]
  55. Bentéjac, C.; Csörgő, A.; Martínez-Muñoz, G. A Comparative Analysis of Gradient Boosting Algorithms. Artif. Intell. Rev. 2021, 54, 1937–1967. [Google Scholar] [CrossRef] [Scilit]
  56. Takefuji, Y. Beyond XGBoost and SHAP: Unveiling True Feature Importance. J. Hazard. Mater. 2025, 488, 137382. [Google Scholar] [CrossRef] [Scilit]
  57. Ji, R.; Chi, Y.; Zhang, Y.; Wu, X.; Li, Z.; Bai, Y.; Zhang, R.; Zhang, G.; Ye, H. Pathways for Mitigating Urban Thermal Environment through 3D Compact Form Regulation: A Novel Machine Learning Model for Exploration and Application. Urban Clim. 2025, 64, 102699. [Google Scholar] [CrossRef] [Scilit]
  58. You, J.; Yin, F.; Zhang, B.; Zhou, M.; Qing, Y.; Chen, Y.; Gao, L. A Novel Environmental Indicator: Compound Wind Droughts and Heat Waves for Assessing Climate-Driven Ecological and Energy Sustainability. Ecol. Indic. 2025, 178, 114114. [Google Scholar] [CrossRef] [Scilit]
  59. Liu, H.; Wang, S.; Wei, C.; Zhang, W.; Tatem, A.J.; Lai, S. Assessing Context-Dependent Effectiveness of Heat Adaptation through Human Mobility under Different Heatwave Regimes. Sustain. Cities Soc. 2025, 136, 107066. [Google Scholar] [CrossRef] [Scilit]
  60. Lundberg, S.M.; Lee, S.-I. A Unified Approach to Interpreting Model Predictions. In Advances in Neural Information Processing Systems; Curran Associates, Inc.: Red Hook, NY, USA, 2017; Volume 30. [Google Scholar]
  61. Lundberg, S.M.; Erion, G.; Chen, H.; DeGrave, A.; Prutkin, J.M.; Nair, B.; Katz, R.; Himmelfarb, J.; Bansal, N.; Lee, S.-I. From Local Explanations to Global Understanding with Explainable AI for Trees. Nat. Mach. Intell. 2020, 2, 56–67. [Google Scholar] [CrossRef] [Scilit]
  62. Greenwell, B.M. Pdp: An R Package for Constructing Partial Dependence Plots. R J. 2017, 9, 421–436. [Google Scholar] [CrossRef] [Scilit]
  63. Sun, X.; Gao, X.; Luo, Y.; Wong, W.-K.; Xu, H. A Comparative Analysis of Characteristics and Synoptic Backgrounds of Extreme Heat Events over Two Urban Agglomerations in Southeast China. Land 2022, 11, 2235. [Google Scholar] [CrossRef] [Scilit]
  64. Wu, D.; Lie, Y.; Liu, L.; Cheng, Z.; Zhang, Y.; Yang, Y.; Xiao, W.; Li, S.; Luo, G.; Wang, Z. City-Level Environmental Performance and the Spatial Structure of China’s Three Coastal City Clusters. J. Clean. Prod. 2023, 422, 138591. [Google Scholar] [CrossRef] [Scilit]
  65. Chen, R.; Wang, P.; Zheng, X.; Rao, X.; Zhang, X.; Wang, W. Dynamic Simulation of Urban Agglomeration Network Resilience under Disturbances: An Integrated Deep Learning and Agent-Based Approach—Case Study of the Beijing-Tianjin-Hebei Region. Sustain. Cities Soc. 2026, 140, 107253. [Google Scholar] [CrossRef] [Scilit]
  66. Yu, B.; Huang, G.; Zhou, X.; Wang, S.; Li, Y.; Wu, Y.; Ren, J. A Stepwise-Clustered Heat Stress Downscaling Approach to Analyze Future Variations of Heat Stress in East China. Theor. Appl. Climatol. 2025, 156, 112. [Google Scholar] [CrossRef] [Scilit]
  67. Chu, M.; Lu, J.; Sun, D. Influence of Urban Agglomeration Expansion on Fragmentation of Green Space: A Case Study of Beijing-Tianjin-Hebei Urban Agglomeration. Land 2022, 11, 275. [Google Scholar] [CrossRef] [Scilit]
  68. Zhang, M.; Xiao, H.; Sun, D.; Li, Y. Spatial Differences in and Influences upon the Sustainable Development Level of the Yangtze River Delta Urban Agglomeration in China. Sustainability 2018, 10, 411. [Google Scholar] [CrossRef] [Scilit]
  69. Chang, W.; Zhu, Y.; Lin, C.-J.; Arunachalam, S.; Wang, S.; Xing, J.; Fang, T.; Long, S.; Li, J.; Chen, G. Environmental Justice Assessment of Fine Particles, Ozone, and Mercury over the Pearl River Delta Region, China. Sustainability 2022, 14, 10891. [Google Scholar] [CrossRef] [Scilit]
  70. Zhang, Y.; Lai, G.; Li, S.; Li, D. Differences in Carbon Emissions and Spatial Spillover in Typical Urban Agglomerations in China. Geosciences 2026, 16, 41. [Google Scholar] [CrossRef] [Scilit]
  71. Szagri, D.; Nagy, B.; Szalay, Z. How Can We Predict Where Heatwaves Will Have an Impact?—A Literature Review on Heat Vulnerability Indexes. Urban Clim. 2023, 52, 101711. [Google Scholar] [CrossRef] [Scilit]
  72. Fu, Q.; Zheng, Z.; Sarker, M.N.I.; Lv, Y. Combating Urban Heat: Systematic Review of Urban Resilience and Adaptation Strategies. Heliyon 2024, 10, e37001. [Google Scholar] [CrossRef] [Scilit]
  73. Friesenecker, M.; Schneider, A.; Bügelmayer-Blaschek, M.; Getzner, M.; Hahn, C.; Schneider, M.; Seebauer, S.; Zawadzki, W.; Zuvela-Aloise, M.; Thaler, T. Socially Equitable Climate Risk Management of Urban Heat. npj Urban Sustain. 2025, 5, 8. [Google Scholar] [CrossRef] [Scilit]
  74. Wang, X.; Sun, M.; Wu, M. Recognizing Resilience Evolution and Connectivity in the Yangtze River Delta Urban Agglomeration. Sci. Rep. 2026, 16, 4583. [Google Scholar] [CrossRef] [Scilit]
  75. Sundar, K.M.; Collins, B.F.; Gross, J.E.; Carlos, W.G.; Jamil, S.M. The Growing Health Burden of Heat Waves with Focus on Respiratory Effects. Am. J. Respir. Crit. Care Med. 2025, 211, P13–P15. [Google Scholar] [CrossRef] [Scilit]
  76. Depietri, Y.; Welle, T.; Renaud, F.G. Social Vulnerability Assessment of the Cologne Urban Area (Germany) to Heat Waves: Links to Ecosystem Services. Int. J. Disaster Risk Reduct. 2013, 6, 98–117. [Google Scholar] [CrossRef] [Scilit]
  77. Hsu, A.; Sheriff, G.; Chakraborty, T.; Manya, D. Disproportionate Exposure to Urban Heat Island Intensity across Major US Cities. Nat. Commun. 2021, 12, 2721. [Google Scholar] [CrossRef] [Scilit]
  78. Chen, J.; Ma, H.; Yang, S.; Zhou, Z.; Huang, J.; Chen, L. Assessment of Urban Resilience and Detection of Impact Factors Based on Spatial Autocorrelation Analysis and GeoDetector Model: A Case of Hunan Province. ISPRS Int. J. Geo-Inf. 2023, 12, 391. [Google Scholar] [CrossRef] [Scilit]
  79. Turek-Hankins, L.L.; Hino, M.; Mach, K.J. Risk Screening Methods for Extreme Heat: Implications for Equity-Oriented Adaptation. PLoS ONE 2020, 15, e0240841. [Google Scholar] [CrossRef] [Scilit]
  80. Wang, B.; Gao, M.; Li, Y.; Li, Z.; Liu, Z.; Zhang, X.; Wen, Y. Unraveling the Effects of Extreme Heat Conditions on Urban Heat Environment: Insights from Local Climate Zones and Integrated Temperature Data. Sustain. Cities Soc. 2025, 122, 106254. [Google Scholar] [CrossRef] [Scilit]
  81. Chen, S.; Xu, R.; Wong, N.H.; Tong, S.; Wang, J.; Santamouris, M. A Probabilistic Framework for Predicting Spatiotemporal Intensity and Variability of Outdoor Thermal Comfort. Build. Environ. 2026, 289, 114102. [Google Scholar] [CrossRef] [Scilit]
  82. Lei, Y.; Zhan, S.; Chong, A. Sustainable Cooling in the Tropics with Mixed-Mode Ventilation and Thermal Adaptation. Build. Environ. 2025, 284, 113339. [Google Scholar] [CrossRef] [Scilit]
Figure 1. Methodological workflow and research framework.
Land 15 01052 g001
Figure 2. Study area location map.
Land 15 01052 g002
Figure 3. Spatiotemporal evolution of heatwave frequency (F) and total duration (TD) in each urban agglomeration.
Land 15 01052 g003
Figure 4. Maximum Duration (MD) and Maximum Temperature (MT) of heatwave in Each Urban Agglomeration.
Land 15 01052 g004
Figure 5. Standardized Stress Index in Each Urban Agglomeration.
Land 15 01052 g005
Figure 6. NMF Reconstruction Error for optimal rank selection by Urban Agglomeration.
Land 15 01052 g006
Figure 7. UHV Characteristic Profiles in Each Urban Agglomeration.
Land 15 01052 g007
Figure 8. Quantification of the Spatiotemporal Evolution Characteristics of UHV in Each Urban Agglomeration.
Land 15 01052 g008
Figure 9. Results of the Spearman Correlation Coefficient Analysis between UHV and SSI.
Land 15 01052 g009
Figure 10. Dynamic Response of SSI to UHV in Each Urban Agglomeration.
Land 15 01052 g010
Figure 11. Pearson Correlation Heatmap for multicollinearity test among the Driving Factors.
Land 15 01052 g011
Figure 12. Model Performance Evaluation Results.
Land 15 01052 g012
Figure 13. SHAP Analysis Results of the Relative Importance and Local Explanations of the Driving Factors.
Land 15 01052 g013
Figure 14. SHAP Dependence Plots of the Driving Factors.
Land 15 01052 g014
Figure 15. Two-Dimensional PDP of the Core Driving Factors.
Land 15 01052 g015
Table 1. Framework and variable configurations for the UHV evaluation index system.
Primary IndicatorSecondary IndicatorCalculation FormulaQuantitative InterpretationAbbreviation
Exposureannual number of extreme high-temperature days [42,43] E 1 = i = 1 365 I T m a x , i T t h ‘Tmax,i’ denotes the maximum temperature on day ‘i’, and ‘Tth’ is the high-temperature threshold, which is generally set at ‘35 °C’ in meteorological practice in China.EHD
summer heat exposure intensity [44] E 2 = 1 30 k = 1 30 T m a x k ‘Tmax(k)’ denotes the ‘k’th observed value after ranking the daily maximum temperatures of the city during summer in descending order.SHE
annual heatwave frequency [27] E 3 = C o u n t ( E v e n t j ) ‘Eventj’ denotes the frequency of heatwave occurrence in year ‘j’.HWF
Sensitivitypopulation density [44,45] S 1 = P t o t a l A b ‘Ptotal’ is the total resident population of the city; ‘A_b’ is the built-up area of the city.POD
Sensitivityproportion of elderly population [46] S 2 = P i , 65 P t o t a l ‘P ≥ 65’ is the number of resident population aged 65 and above.ELD
proportion of population aged under 14 [46] S 3 = P 14 P t o t a l ‘P ≤ 14’: resident population aged ‘0–14’ years (including age 14).CHI
share of secondary industry output value [47] S 4 = V S I V G D P ‘VSI’ is the added value of the secondary industry in the city in the given year; ‘VGDP’ is the gross domestic product of the city in the given year.SIV
economic pressure level [48] S 5 = 1 GDP p c m i n GDP p c m a x GDP p c m i n GDP p c ‘GDPpc’ is the gross domestic product per capita of the city.GPC
public heat-health sensitivity [25] S 6 = t = 1 n I s e a r c h , t P t o t a l × R / 1000 ‘Isearch’ is the sum of the BSI of the target keywords; ‘R’ is the internet penetration rate of the city.HHS
Adaptive capacityinsufficiency of green space coverage in built-up areas [48,49] A 1 = 1 G m i n G m a x G m i n G ‘G’ is the greening coverage rate of the built-up area.GSS
insufficiency of higher education coverage [50] A 2 = 1 U m i n U m a x U m i n U ‘U’ is the number of university students enrolled per ‘10,000’ population.LHE
scarcity of medical resources [51] A 3 = 1 M m i n M m a x M m i n M ‘M’ is the number of health technical personnel per ‘10,000’ population.SMR
Table 2. Results of the Mean SHAP Values and Relative Importance of the Driving Factors.
RankIndicatorFeature Mean|SHAP|Relative Importance
1SHE0.848625.65%
2CHI0.777323.49%
3EHD0.435013.15%
4HWF0.20456.18%
5POD0.19355.85%
6GSS0.19155.79%
7ELD0.17655.33%
8SIV0.16695.04%
9HHS0.13073.95%
10LHE0.07602.30%
11GPC0.07062.13%
12SMR0.03801.15%
Disclaimer/Publisher’s Note: The statements, opinions and data contained in all publications are solely those of the individual author(s) and contributor(s) and not of MDPI and/or the editor(s). MDPI and/or the editor(s) disclaim responsibility for any injury to people or property resulting from any ideas, methods, instructions or products referred to in the content.