


Abstract
Urban fire risk in high-density cities is characterized by complex spatial heterogeneity and nonlinear relationships with the built environment, population distribution, and climatic conditions. However, most existing studies rely on linear assumptions and offer limited interpretability. To address this gap, we developed an interpretable analytical framework that integrates the CatBoost model with SHAP (SHapley Additive exPlanations), using Futian District in Shenzhen as a case study. We constructed a fire risk surface from historical fire incident data using kernel density estimation (KDE) and incorporated multiple urban environmental factors—including points of interest (POIs), road networks, and meteorological variables—as explanatory variables. The CatBoost model captured nonlinear relationships, while SHAP quantified feature importance and revealed interaction effects. The results show that urban fire risk is strongly associated with the spatial agglomeration of population-related facilities, especially high-density commercial and residential areas, as well as thermal conditions. Several variables exhibit clear nonlinear threshold effects, with their influence on fire risk varying markedly across different intensity ranges. Interaction analysis further indicates that combinations of built-environment characteristics and climatic factors jointly shape the spatial pattern of fire risk. These findings provide empirical insights into the spatial mechanisms underlying urban fire risk and highlight the value of interpretable machine learning in urban safety research. The proposed framework offers a practical tool for developing more targeted, evidence-based fire risk management strategies in high-density urban areas.
1. Introduction
Urban fires are common urban disasters that have been increasing in frequency, posing severe threats to public safety and property. As urbanization accelerates and urban governance becomes more granular, identifying fire risk factors and developing effective prevention strategies have emerged as critical research topics in the field of urban safety [1]. Although fire incidents are characterized by their stochasticity, the integration of big data [2] and machine learning (ML) technologies [3] allows for a more profound understanding of risk factors and enables more precise urban fire risk assessments [4].
Currently, methodologies for analyzing urban fire risk factors primarily include the DEMATEL-ISM method [5], AHP-FCE method [6], entropy weight method [7], multi-criteria decision-making [8], risk matrix method [9], TOPSIS [10], and various machine learning techniques [11,12,13]. Zamanialaei et al. (2025) [14] used machine learning to assess structure-level fire risk in California’s wildland–urban interface (WUI), identifying building spacing and defensible space as key predictors. Complementing their WUI-focused study, the present work applies an interpretable CatBoost-SHAP framework to intra-urban fires in high-density settings, thereby extending data-driven fire risk assessment to purely urban contexts. Research scales in this domain span from individual buildings [15,16,17] and blocks [18,19] to urban grids [20,21]. For instance, Sun et al. (2019) developed an evaluation index system using the Analytic Hierarchy Process (AHP) based on historical fire statistics and theoretical analysis, thereby promoting the integration of smart fire protection within smart city frameworks [22]. Wei et al. (2018) proposed a rapid assessment approach combining fuzzy mathematics with Support Vector Machines (SVM); by training the model with samples derived from fuzzy comprehensive evaluations, they successfully predicted risks for specific sports facilities with high accuracy [23]. Kim et al. (2023) [24] developed a prediction model for fire occurrence and casualties using datasets from Seoul (2017–2021). By combining built environment characteristics with meteorological and demographic data, they enhanced predictive performance and identified high-risk zones in the Gangnam district. Furthermore, Oh and Jeong (2022) introduced an XGBoost-based prediction method utilizing grid-level data (e.g., population, aged buildings, and high-rise structures), which outperformed baseline models like SVM and logistic regression in localized fire prevention [25]. However, despite the predictive superiority of ML, existing studies often suffer from the “black-box” nature of these algorithms, failing to provide actionable spatial thresholds for urban planners. Alongside traditional methods’ issues of high subjectivity and coarse spatial resolution, current research lacks the capacity to fully capture complex nonlinear relationships or the spatiotemporal transition of driving mechanisms during rapid urbanization. Specifically, there is a lack of in-depth analysis regarding the fine-grained spatiotemporal evolution of fire risks within urban core areas.
To address these gaps, the present study focuses on the Futian District of Shenzhen. By integrating historical fire records with multi-source built environment data, we investigate the spatiotemporal distribution of fire incidents. Specifically, this study fills the identified gaps by: (1) constructing an interpretable CatBoost [26]-SHAP [27] framework to decouple the non-linear influences of multi-source urban data; (2) identifying the spatiotemporal transition of fire risk drivers in Futian District; and (3) quantifying critical management thresholds (e.g., firefighting service radii and thermal limits) to support evidence-based urban resilience planning. This research provides a scientific basis for optimizing fire resource allocation and advancing resilient urban planning.
2. Materials and Methods
Figure 1 presents the overall methodological workflow used to quantify, model, and interpret the spatial distribution of urban fire risk in Futian District during 2008–2018. The study timeline is first segmented into two distinct urban development stages—(i) the Urban Rapid Development Period (2008–2012) and (ii) the Spatial Structure Optimization Period (2013–2018)—to capture temporal transitions in urban morphology and fire risk patterns.
Figure 1.
Research framework. The overall workflow illustrates the process of urban fire risk assessment in Futian District using multi-source data, kernel density estimation (KDE), CatBoost modeling, and SHAP (SHapley Additive exPlanations) interpretation. The study period is divided into two phases: the Urban Rapid Development Period (2008–2012) and the Spatial Structure Optimization Period (2013–2018). FRI denotes the Fire Risk Index. Key abbreviations in the figure: POI = Points of Interest; KD_ = Kernel Density; DEM = Digital Elevation Model; NDVI = Normalized Difference Vegetation Index; NTL = Nighttime Light Intensity; SCV = Spatial Cross-Validation; SHAP = SHapley Additive exPlanations.
The analytical framework includes three main steps. The Fire Risk Index is first derived from historical fire points of interest (POI) data (2008–2012 and 2013–2018) through kernel density estimation (KDE). Parallel to this, Fire Risk Impact Factors are generated from multiple geospatial datasets: (a) POI kernel densities of public gathering places, residential places, flammable/explosive sites, large-scale buildings, and vulnerable facilities; (b) raster-based environmental variables, including topographic factors (DEM, slope), climatic variables (temperature and precipitation), and urban/environmental indicators such as nighttime light intensity (NTL), NDVI, road density, built-up density, and distance to fire stations. All impact layers are standardized to the same spatial resolution and time windows.
Subsequently, Influencing Factor Screening is performed via variable correlation analysis (Pearson heatmap) and collinearity diagnostics. Variables exhibiting weak correlation or strong collinearity—specifically slope, annual precipitation, and distance to water bodies—are excluded to reduce multicollinearity and enhance model interpretability.
The core Assessment and Explanation Module employs a supervised CatBoost gradient-boosting framework. The fire risk index serves as the target (dependent) variable, while the screened explanatory variables (DEM, annual mean temperature, building density, residential density, public gathering places density, road density, nighttime light intensity, NDVI, flammable/explosive sites density, large-scale buildings density, vulnerable facilities density, and distance to fire stations) constitute the feature set. After hyperparameter tuning and model training/validation, SHAP (SHapley Additive exPlanations) values are computed for global and local interpretability. The results include (i) feature importance rankings, (ii) SHAP dependence plots showing nonlinear effects, and (iii) interaction heatmaps.
Finally, the Models Comparison and Conclusions section conducts a comparative SHAP analysis between the two development periods (2008–2012 vs. 2013–2018), highlighting shifts in factor dominance, critical risk thresholds, and interaction effects. These insights feed directly into the ranking of influencing factors, derivation of SHAP-derived critical thresholds and interaction effects, and the ultimate discussion and conclusions on nonlinear threshold effects and policy implications for urban fire-risk management.
2.1. Study Area: Futian District, Shenzhen, China
Futian District is located in the central part of the Shenzhen Special Economic Zone and serves as a key central urban area for Shenzhen’s development and construction (Figure 2). The district covers 78.66 km2 and includes 10 sub-districts. It represents a typical high-density urban built-up area [28]. Futian District concentrates a substantial number of high-rise buildings, commercial complexes, aging residential communities, and “urban villages” (chengzhongcun), resulting in fire safety risks that exhibit diversified and complex characteristics. Between 2008 and 2018, a total of 2762 fire incidents were recorded in the district. After data cleaning to remove duplicate records, 2654 valid fire cases were retained for further analysis. Persistent safety hazards—such as the illegal parking of electric bicycles and the improper storage of debris obstructing fire access lanes—further underscore its status as a priority area for urban public safety governance.
Figure 2.
Study area of Futian District, Shenzhen.
2.2. Data Sources and Preprocessing
The data used in this study mainly include elevation, slope, normalized difference vegetation index (NDVI), nighttime light intensity, building density, road density, and POI data, all of which are obtained from publicly available online sources. The specific data sources are listed in Table 1.
Historical fire incident data for Futian District, Shenzhen, were obtained from the Shenzhen Municipal Government Data Open Platform [29], covering all publicly available records from January 2008 to December 2018. The initial dataset contained 2761 records. We applied a systematic multi-step cleaning protocol using Python 3.13 (pandas and geopandas) to ensure data quality and reproducibility. Duplicate records were removed using Python (pandas and geopandas). Duplicates were defined as entries with identical timestamps, overlapping coordinates within a 10 m tolerance, and consistent incident descriptions (n = 64). Subsequently, fire locations were geocoded via the Baidu Maps API and transformed to the WGS-84 coordinate system in ArcGIS 10.8. Records with coordinates falling outside the administrative boundary of Futian District or containing ambiguous addresses that could not be reliably verified were excluded to maintain spatial consistency with other geospatial layers, representing 35 instances. An additional 8 records were discarded due to missing critical fields such as alarm dates or location descriptions. All exclusion criteria were applied uniformly and documented in the preprocessing workflow to ensure analytical transparency. Following these procedures, 2654 valid fire incidents remained for analysis and were stratified into two sub-periods: 2008–2012 and 2013–2018, to align with the district’s transition from rapid urban expansion to spatial structure optimization around 2012. The kernel density of these fire incidents was calculated to construct the Fire Risk Index (FRI), which represents the continuous spatial intensity of urban fire risk. Notably, the original open-platform records lacked a standardized fire severity classification. To avoid introducing subjective categorization bias or sample imbalance, all incidents were treated as binary spatial events, and kernel density estimation was employed to capture continuous variations in overall fire risk intensity.
POI data were obtained from the Baidu Maps API. After deduplication and filtering, the raw POI data were reclassified according to fire risk characteristics into five major categories. Large-scale buildings include factories, shopping malls, and warehousing and logistics facilities, which are characterized by high fire loads and concentrated combustible materials. Residential places mainly refer to residential communities, where the use of electricity and fire-related activities is concentrated. Public gathering places include accommodation, catering, supermarkets, internet cafés, and tutoring institutions, which typically contain abundant combustible materials and high population density. Vulnerable facilities include hospitals, schools, nursing homes, and childcare facilities, where occupants often have limited emergency response capability. Flammable and explosive places include petrochemical enterprises, new energy enterprises, and gas stations, where flammable materials are highly concentrated.
Table 1.
Multi-source geographic data.
Some raster-based variables (e.g., NDVI and temperature) have relatively coarse spatial resolution compared to the scale of the study area. To ensure spatial consistency, all variables were resampled to a unified resolution and aggregated to a 240 m × 240 m grid, which serves as the analytical unit. This resolution represents a balance between data availability and the need to capture intra-urban spatial variability. In addition, kernel density estimation (KDE) was applied to transform discrete fire incidents into continuous spatial surfaces, which helps reduce the sensitivity of the analysis to differences in data resolution. Therefore, the modeling framework focuses on relative spatial patterns and nonlinear relationships rather than fine-scale pixel accuracy.
To ensure temporal consistency, POI data from 2012 and 2018 are used to represent the two study periods (2008–2012 and 2013–2018), respectively. This approach captures the dominant built-environment characteristics of each phase while maintaining comparability [37]. Given the marked slowdown in large-scale development after 2012, the 2012 POI dataset effectively captures the vast majority of functional facilities added between 2008 and 2012, thereby serving as a robust representation of the built environment characteristics during that specific period. By the same token, the 2018 POI dataset reasonably reflects the overall conditions during the 2013–2018 period. This snapshot approach allows for a more accurate depiction of the actual urban functional distribution and POI density characteristics during each phase, avoiding potential temporal biases that might arise from relying on a single static dataset. Furthermore, both snapshots adhere to a consistent POI classification system, thereby ensuring methodological comparability across the two distinct time periods.
To further ensure the robustness of the CatBoost model and mitigate potential multicollinearity among explanatory variables, a Variance Inflation Factor (VIF) diagnostic was conducted for all 15 candidate predictors across both study periods (2008–2012 and 2013–2018). After Pearson correlation screening, three weakly correlated variables (Slope, Precip, Dist_Water) were excluded. VIF values for the remaining 12 variables are shown in Table 2. The VIF quantifies how much the variance of a regression coefficient is inflated due to linear dependence with other features; A commonly used threshold is VIF < 10, indicating acceptable levels of collinearity [38].
Table 2.
Variance inflation factor (VIF) diagnostics for explanatory variables across two study periods.
As shown in Table 2, all retained variables exhibited VIF values below the threshold of 10.0 in both periods. Specifically, 13 out of 15 variables showed VIF < 5.0, indicating negligible multicollinearity. Two variables—KD_Resid (Residential Density) and KD_Vuln (Vulnerable Facilities Density)—exhibited moderately elevated VIF values in the first period (9.53 and 5.02, respectively), but both decreased substantially in the second period (4.39 and 4.62), reflecting improved feature independence following urban spatial restructuring.
Notably, although tree-based models like CatBoost are relatively robust to multicollinearity, conducting VIF screening enhances the interpretability of SHAP values by reducing feature redundancy. The diagnostic results confirm that multicollinearity does not substantially affect the stability of feature importance estimation in our modeling framework.
2.3. Indicator System Construction
This study focuses on urban fire risk assessment and influencing factor analysis in Futian District, Shenzhen. A CatBoost regression model was constructed based on multi-source data. The kernel density of urban fire incident points is selected as the Urban Fire Risk Index, which reflects the spatial clustering characteristics and potential intensity of fire risk.
Based on an extensive review of related literature and expert consultation [39,40,41,42], the following variables were selected as explanatory features: elevation (DEM), slope (Slope), normalized difference vegetation index (NDVI), annual total precipitation (Precip), annual mean temperature (Temp), distance to water bodies (Dist_Water), building density (Bldg_Dens), road density (Road_Dens), nighttime light intensity (NTL), vulnerable facilities density (KD_Vuln), public gathering places density (KD_PubGath), flammable/explosive sites density (KD_Flame), residential density (KD_Resid), large-scale buildings density (KD_LargeBld), and distance to fire stations (Dist_FireStn).
Although vegetation coverage in Futian District is relatively limited due to its high urbanization level, NDVI was retained as a proxy variable to capture micro-scale environmental heterogeneity. NDVI reflects variations in surface moisture and urban thermal conditions. These factors may influence fire ignition and spread. Moreover, in highly urbanized areas, fragmented green spaces and urban vegetation may still contribute to localized cooling effects and humidity regulation. Therefore, NDVI was not interpreted as a dominant ecological driver, but rather as a complementary environmental indicator interacting with temperature and built-environment variables.
Although building density reflects the physical intensity of the built environment, nighttime light intensity (NTL) captures the functional dimension of urban activity, particularly human activity intensity and energy consumption patterns during nighttime. In high-density urban areas, NTL has been widely used as a proxy for socioeconomic activity and urban vitality. These aspects are not fully represented by structural indicators such as building density. Therefore, the inclusion of NTL enables the model to distinguish between areas with similar physical density but different levels of human activity, which may lead to different fire risk profiles.
It is acknowledged that the distance to fire stations is more directly related to fire response capacity rather than the intrinsic probability of fire occurrence. However, in this study, this variable is incorporated as a contextual modifier to capture the spatial heterogeneity of fire risk outcomes. Areas with longer distances to fire stations may experience delayed response times, which can exacerbate fire consequences and indirectly influence the observed spatial pattern of fire incidents. Therefore, this variable is not interpreted as a direct causal driver of fire occurrence, but rather as a proxy for reflecting the spatial configuration of emergency service accessibility within the urban system.
2.4. Spatial Analysis Methods
For the spatial analysis, a regular grid-based spatial unit system covering the entire Futian District was established using ArcGIS 10.8. The grid cell size was set to 240 m × 240 m, generating a total of 1596 grid cells as independent analytical units. The geocoded historical fire event point data were imported into the spatial database, and kernel density estimation (KDE) was applied (with the quartic kernel function used by default in ArcGIS) to analyze the spatial point pattern.
2.4.1. Kernel Density Estimation (KDE)
The spatial intensity of urban fire incidents was quantified using KDE, which is defined as:
where is the number of fire incidents, is the bandwidth (determined by Silverman’s rule of thumb to ensure spatial smoothness), and is the kernel function. This method allows for the identification of high-risk “hotspots” beyond discrete points, producing continuous fire risk surfaces for both sub-periods.
This method quantifies the influence intensity of fire incident points on surrounding areas through a weighted function that decays with distance, effectively smoothing the data distribution and revealing spatial clustering characteristics. All kernel density calculations, including the Fire Risk Index (FRI) and POI indicators, adopted a unified parameter system: the cell size was set to 30 m, and the search radius and bandwidth parameter (h) were optimized according to the Silverman rule [43]:
where σ denotes the standard deviation, represents the interquartile range, and indicates the sample size; these parameters were automatically computed using the “Bandwidth Calculator” tool in ArcGIS 10.8.
By calculating the kernel density value (fire events per km2) for each grid cell, a continuous spatial risk surface was generated. This density value serves as the regional Fire Risk Index (FRI), which is quantified using the following formula:
where represents the Fire Risk Index of grid cell , denotes the kernel density function, represents the Euclidean distance between the center of grid cell and fire incident point , is the bandwidth parameter, and denotes the total number of fire incidents within the bandwidth range.
To assess the robustness of the Fire Risk Index (FRI) to the chosen analytical parameters, a sensitivity analysis was conducted. The baseline configuration (240 m × 240 m grid and bandwidth determined by Silverman’s rule) was compared against four alternative setups: (i) 120 m grid, (ii) 480 m grid, (iii) bandwidth × 0.8, and (iv) bandwidth × 1.2. Pearson correlation coefficients between the baseline FRI and the alternative FRI surfaces exceeded 0.92 in all cases (p < 0.01), and the spatial overlap of high-risk hotspots (Getis-Ord Gi* hotspot analysis at 99% confidence) remained above 87%. These results indicate that the identified fire risk patterns and subsequent SHAP-derived thresholds are robust to reasonable variations in grid resolution and bandwidth, although finer grids (120 m) slightly increase local variability in low-density areas while coarser grids (480 m) tend to smooth extreme hotspots.
2.4.2. Spatial Autocorrelation
Spatial autocorrelation analysis quantifies the degree of autocorrelation of geographic variables within a study area, reflecting spatial dependence and heterogeneity. It can identify spatial hotspots, cold spots, and outliers, and help interpret the spatial structure and variation patterns of geographic phenomena. This method is used to explore the spatial distribution and temporal variation characteristics of the historical fire kernel density (FRI) in Futian District, Shenzhen. The analysis was conducted using ArcGIS [44].
Among the methods employed, Global Spatial Autocorrelation (Global Moran’s I) [45] focuses on testing the overall spatial clustering tendency of the study object. It is used to determine whether the fire kernel density exhibits significant spatial clustering or dispersion patterns during the study period.
High/Low clustering analysis (Getis-Ord General G), a global spatial statistical method, is used to measure the spatial clustering degree of high or low values within the study area. This statistic standardizes the weighted sum of attribute values for spatial units and their neighboring units, comparing the calculated observed value with the expected value under a random distribution. The method generates a z-score and p-value to determine clustering significance: when the z-score is positive, the observed General G index is greater than the expected index, indicating a high-value clustering pattern; when the z-score is negative, the expected index exceeds the observed index, indicating a low-value clustering pattern. We use it to identify the overall high/low clustering pattern of fire kernel density [46].
Following a “global–local” analytical framework, this study first tests the overall clustering trend using global spatial autocorrelation methods. Subsequently, the Getis-Ord General G statistic is applied to conduct high/low clustering analysis. Combined with the actual geographic context of Futian District and the characteristics of the fire kernel density dataset, multidimensional statistical significance tests and feature interpretation are performed to more comprehensively reveal the spatial distribution patterns and heterogeneity of fire kernel density in the study area.
2.5. CatBoost-SHAP Modeling Framework
2.5.1. CatBoost Algorithm
CatBoost is a high-performance gradient boosting decision tree algorithm developed by Yandex. It improves upon the traditional Gradient Boosting Decision Tree (GBDT) framework by learning and predicting based on symmetric decision trees. By addressing issues related to categorical feature processing and prediction shift, the algorithm effectively reduces overfitting [47,48].
To address spatial autocorrelation in grid-based data, a 7-fold spatial cross-validation (SCV) framework was adopted. The study area was divided into seven spatial clusters using K-means based on geographic coordinates. Model performance was quantified using the coefficient of determination (R2), root mean square error (RMSE), and mean absolute error (MAE). R2 reflects the explanatory power of the model for the target variable, with values closer to 1 indicating better performance. RMSE and MAE quantify the magnitude of prediction errors, with smaller values indicating higher accuracy. Together, these three indicators provide a comprehensive evaluation of the goodness-of-fit and predictive accuracy of the urban fire risk model. The calculation formulas are as follows:
where represents the number of samples, denotes the observed value, represents the predicted value, and denotes the mean of the observed values . The coefficient of determination measures the goodness-of-fit of the model to the data, with a value range of [0, 1]. Values closer to 1 indicate a better model fit.
A comprehensive grid search strategy was employed to optimize CatBoost hyperparameters, including tree depth, learning rate, and regularization coefficients, ensuring an optimal balance between predictive accuracy and model stability. To enhance the scientific rigor of the interpretability analysis, a statistical verification framework was introduced for identifying critical thresholds. Rather than relying on subjective visual inspection of SHAP dependence plots, piecewise linear fitting combined with 1000-iteration bootstrap resampling was applied to calculate 95% confidence intervals (CIs) for each identified breakpoint. This approach quantifies predictive uncertainty and provides a statistically robust foundation for evidence-based policy recommendations. In practical application, the optimized CatBoost algorithm efficiently processes multiple influencing factors, accurately captures nonlinear associations and interaction effects among built environment and climatic variables, and suppresses overfitting through spatially constrained validation. This provides a reliable modeling foundation for subsequent SHAP-based interpretation.
To investigate the relationship between regional fire kernel density and its influencing factors, the fire risk kernel density of Futian District during 2008–2012 and 2013–2018 was used as the dependent variable. The independent variables included DEM, NDVI, Temp, Bldg_Dens, Road_Dens, NTL, KD_Vuln, KD_PubGath, KD_Flame, KD_Resid, KD_LargeBld, and Dist_FireStn.
2.5.2. SHAP Method
This study adopts the SHAP (SHapley Additive explanations) method proposed by Scott M. Lundberg et al. [27] to identify key factors influencing changes in urban fire risk and to determine the direction of their effects. SHAP quantifies the contribution of each feature at the individual sample level, enabling an intuitive interpretation of how different variables influence variations in urban fire risk. SHAP interaction values are used to analyze the interaction effects among feature variables, helping to explain complex nonlinear relationships. The calculation formula is as follows:
where represents the predicted value of the Fire Risk Index, denotes the baseline value, and represents the SHAP value of each feature, reflecting the marginal contribution of that feature to the prediction result. To further analyze the interaction effects among features, SHAP interaction values are employed:
where represents the interaction contribution value between feature and feature , and denotes a subset of features.
Equation (8) measures the joint effect of two features and reveals how their combined influence affects the model’s prediction results.
SHAP dependence plots were subsequently generated to visualize the marginal relationship between each feature and the predicted risk. To rigorously identify nonlinear threshold effects and quantify their uncertainty, this study applied a bootstrap-based piecewise linear fitting approach (pwlf package, 1000 bootstrap resamples) on the SHAP dependence plots. The identified breakpoints and their 95% confidence intervals (95% CI) provide statistically supported critical thresholds for each key feature.
3. Results
3.1. Spatiotemporal Variation in Fire Risk in Futian District
3.1.1. Temporal Variation Characteristics of Historical Fires in Futian District
As shown in Figure 3, a total of 2654 fire incidents occurred in Futian District, Shenzhen, between 2008 and 2018, with an annual average of 241 fires. Figure 3a indicates that the interannual variation in fire frequency exhibits significant fluctuations, showing an initial increase followed by a decline. Among these years, 2013 represents the peak year of fire occurrence, with 436 recorded fires, accounting for 16.4% of the total during the study period. In contrast, 2008 was the year with the lowest fire frequency, with only 110 incidents, representing 4.1% of the total. The decline observed after 2013 may be related to the strengthening of national and local fire safety policies.
Figure 3.
Historical fire statistics of Futian District. (a) Interannual distribution of historical fires in Futian District. (b) Intermonthly distribution of historical fires in Futian District. (c) Bar chart of fire causes in Futian.
Figure 3b shows the monthly distribution averaged across years. At the monthly scale, fire incidents occur more frequently in January, February, and March. Among them, January records the highest number of fires, with 269 incidents, accounting for approximately 10.1% of the annual total. This pattern may be associated with dry and low-humidity winter conditions, increased use of heating equipment, and fireworks during the Chinese New Year period. In contrast, November shows the lowest fire frequency, with 184 incidents, accounting for 6.9% of the annual total. The relatively higher humidity and moderate temperatures during this month make combustible materials less likely to ignite.
Figure 3c illustrates that, among the 2654 fire incidents recorded in Futian District, Shenzhen, the distribution of fire causes exhibits marked heterogeneity. Due to incomplete classification in the original open-data records, 1293 incidents (48.72%) were categorized as “Other”, reflecting a common limitation in municipal fire databases. Among the classified causes, electrical fires ranked first with 761 incidents (28.67%), followed by accidental domestic fires with 342 incidents (12.89%). This pattern underscores the prominence of electrical infrastructure overload and residential fire-use behaviors as primary preventable risk sources in high-density urban settings.
3.1.2. Global Spatial Autocorrelation Analysis
This study used ArcGIS to conduct a global spatial autocorrelation analysis of the spatial distribution and temporal variation in historical fire kernel density (FRI) in Futian District, Shenzhen. The results of the Global Moran’s I analysis indicate that during both 2008–2012 and 2013–2018, the historical fire kernel density in Futian District exhibited a highly significant (p < 0.01) positive spatial autocorrelation (clustering) pattern. Specifically, the Global Moran’s I value was 0.959 for 2008–2012 and 0.961 for 2013–2018. Before modeling, this Global Moran’s I test verified the spatial autocorrelation of fire incidents. The results (Moran’s I > 0.95, p < 0.01) confirmed a significant spatial clustering pattern, justifying the use of spatial-based machine learning models.
The results (Figure 4) show that during 2008–2012, areas with high annual average fire kernel density were mainly concentrated in the eastern and central–southern parts of Futian District, including Shatou Subdistrict, Futian Subdistrict, Huaqiangbei Subdistrict, and Yuanling Subdistrict, with sporadic distribution also observed in Meilin Subdistrict in the northern part of the district. During 2013–2018, the annual average fire kernel density increased in Shatou Subdistrict and Huaqiangbei Subdistrict, while it decreased in Meilin Subdistrict and Yuanling Subdistrict.
Figure 4.
Annual average kernel density of fires in Futian District. (a) Mean annual fire kernel density, 2008–2012; (b) mean annual fire kernel density, 2013–2018.
3.2. Spatial Correlation Analysis of Fire Incidents in Futian District
High/Low clustering analysis using the Getis-Ord General G statistic further indicates that the fire kernel density in the study area exhibited a significant high-value clustering pattern (p < 0.01) during both periods, with z-scores of 51.69 and 51.83, respectively.
Hotspot analysis (Getis-Ord Gi*) was applied to identify statistically significant hotspot and cold spot areas. Figure 5 shows that the spatial distribution patterns of hotspots remained highly consistent across the two periods. For 2008–2012, the areas of hotspots, cold spots, and non-significant regions were 19.69 km2, 21.76 km2, and 52.16 km2, respectively. For 2013–2018, the corresponding areas were 17.88 km2, 20.97 km2, and 54.77 km2.
Figure 5.
Spatial distribution of kernel density hotspots of fire incidents in Futian District, Shenzhen City. (a) Spatial distribution of fire kernel density hotspots in Futian District, 2008–2012; (b) spatial distribution of fire kernel density hotspots in Futian District, 2013–2018.
Comparative analysis indicates that both hotspot and cold spot areas showed a decreasing trend, while the area of non-significant regions expanded, accompanied by slight morphological changes in hotspot areas. Hotspots remained concentrated in the eastern and southern parts of the study area, whereas cold spots were mainly distributed in the central and western areas, demonstrating significant spatial heterogeneity.
3.3. Variable Correlation and Multicollinearity Diagnosis
Prior to model construction, a rigorous screening process was applied to the 15 initial explanatory variables to ensure data quality and model robustness. This process involved two steps: (1) examining pairwise correlations to identify weakly related factors, and (2) conducting multicollinearity diagnostics to prevent redundancy among retained predictors.
Figure 6 presents the results based on the Pearson correlation coefficient matrix. Considering the results from both 2008–2012 and 2013–2018, built-environment factors exhibit significant positive correlations with fire kernel density. Among them, the kernel density of vulnerable facilities, residential places, public gathering places, and large-scale buildings forms a core driving cluster.
Figure 6.
Pearson correlation coefficient heatmap. (a) Heatmap of Pearson correlation coefficients, 2008–2012; (b) heatmap of Pearson correlation coefficients, 2013–2018. Abbreviations: KD_FireAvg: Annual Average Fire Kernel Density (dependent variable).
In addition, building density, nighttime light intensity, and road density further confirm the positive influence of urbanization processes on fire risk. In contrast, distance to fire stations acts as a key inhibitory factor and shows a significant negative effect.
Natural geographic factors such as slope, elevation, annual total precipitation, and distance to water bodies show weak correlations, indicating that topographic and hydrological characteristics have limited explanatory power within the highly urbanized fire risk system of Futian District. Significant multicollinearity exists among variables, which needs to be addressed through the regularization mechanisms of machine learning models.
Therefore, three weakly correlated factors—slope, annual total precipitation, and distance to water bodies—were excluded to improve the model’s generalization ability. While correlation analysis provides an overall understanding of relationships among variables, it cannot directly reveal the actual driving effects of each variable on regional fire kernel density. Further investigation using the CatBoost algorithm and the interpretable method SHAP (SHapley Additive Explanations) is therefore required.
3.4. CatBoost Model Performance
To capture the nonlinear relationships between urban environmental factors and fire risk, a CatBoost regression model was constructed using the 12 screened predictors (detailed in Section 2.2). To mitigate information leakage induced by strong spatial autocorrelation, conventional random splitting was replaced with a rigorous 7-fold spatial cross-validation framework. The study area was partitioned into geographically distinct clusters using K-means clustering. GroupKFold was then applied to ensure that training and testing sets were spatially non-overlapping, enabling a realistic evaluation of out-of-sample performance. Concurrently, a comprehensive grid search was conducted across hyperparameter spaces (iterations: 800–1200, depth: 4–6, learning rate: 0.02–0.08, subsample: 0.7–0.9, reg_lambda: 1–3, colsample_bylevel: 0.7–0.9) to identify the optimal configuration balancing predictive accuracy and model stability.
As shown in Table 3, the optimized CatBoost model achieved robust performance under spatial validation, with mean R2 values of 0.7572 ± 0.0464 (2008–2012) and 0.7484 ± 0.1461 (2013–2018). The corresponding RMSE and MAE were 0.8233 ± 0.2792 and 1.3507 ± 0.6894 events/km2 (2008–2012) and 0.5673 ± 0.2286 and 0.9683 ± 0.4654 events/km2 (2013–2018), respectively. Although these values are lower than those from random splitting (R2 > 0.94), they avoid spatial leakage and provide a more realistic estimate of model generalization. The relatively narrow standard deviations confirm consistent generalization performance, indicating stable model performance across folds.
Table 3.
Seven-fold spatial cross-validation evaluation metrics.
To further evaluate the model’s predictive accuracy, scatter plots of predicted versus observed fire counts were generated for both study periods (Figure 7). For 2008–2012 (Figure 7a), the points are generally aligned along the 1:1 line, with a linear fit of . This indicates strong overall agreement between predictions and observations, although the slope slightly below 1 suggests a modest tendency toward under-prediction at higher fire counts. The color gradient (representing predicted values) shows that higher predicted values correspond well to higher observed counts, with limited scatter in the low-value range.
Figure 7.
Scatter plots of predicted versus observed fire Counts in Futian District, Shenzhen. (a) Model validation results in Futian District, Shenzhen, 2008–2012; (b) model validation results in Futian District, Shenzhen, 2013–2018.
For 2013–2018 (Figure 7b), the relationship remains linear but exhibits greater dispersion, with a fitted line of . The model continues to capture the overall trend effectively, yet the slightly lower slope and increased scatter at mid-to-high observed values indicate a more pronounced under-prediction in areas of elevated fire activity compared with the earlier period.
To address potential zero-inflation issues arising from the grid-based structure of the dataset (1596 grid cells), a zero-inflation diagnostic was performed for both study periods (Table 4). In the raw data, 6.3% of grid cells (100/1596) exhibited zero fire risk index (FRI = 0) during 2008–2012, while this proportion increased to 12.7% (202/1596) during 2013–2018. After training the full CatBoost model, the proportion of predicted values near zero (<0.01) dropped substantially to 2.6% (42/1596) in 2008–2012 and 1.9% (31/1596) in 2013–2018. These results indicate that the model does not simply replicate the zero-inflated pattern observed in the raw data. Instead, it successfully captures meaningful spatial variations in fire risk intensity across the study area.
Table 4.
Zero-inflation diagnostics for the fire risk index.
To further evaluate the spatial performance of the model, residuals (observed minus predicted values) were mapped across the 1596 grid cells for the two study periods (Figure 8). For the 2008–2012 period, the residuals are generally centered around zero, indicating a relatively good overall model fit. However, distinct spatial heterogeneity is observed. Areas of underestimation (positive residuals) are mainly concentrated in the central–southern and eastern parts of the study area, forming localized clusters that correspond to high-risk zones identified in the kernel density results. In contrast, overestimation (negative residuals) is primarily distributed in the central region, suggesting that the model tends to slightly over-predict fire risk in areas with moderate fire activity. Overall, the residual pattern indicates that while the model captures the general spatial distribution of fire risk, it exhibits limitations in accurately representing localized high-intensity clusters.
Figure 8.
Spatial distribution of model residuals (observed minus predicted values) across 1596 grid cells in Futian District, Shenzhen. (a) Residual patterns and spatial heterogeneity in Futian District, Shenzhen, 2008–2012; (b) shift in overestimation and underestimation clusters in Futian District, Shenzhen, 2013–2018.
For the 2013–2018 period, the spatial pattern of residuals exhibits a more pronounced structure. Overestimation becomes more widespread, particularly in the northern and central regions, where large contiguous areas of negative residuals are observed, indicating that the model tends to over-predict fire risk in these zones. Meanwhile, underestimation is mainly concentrated in the central–southern corridor and parts of the eastern region, forming clear linear or clustered patterns. Compared with the earlier period, the spatial distribution of residuals shows a noticeable shift, reflecting the evolving nature of fire risk drivers under changing urban conditions. These results suggest that although the model maintains good overall predictive performance, certain emerging or localized factors—such as intensified human activities or functional land-use changes—may not be fully captured, leading to systematic biases in specific areas.
3.5. Analysis of Influencing Factor Importance
Figure 9 and Figure 10 present the relative importance of factors influencing fire risk in Futian District, Shenzhen, during 2008–2012 and 2013–2018, respectively. In Figure 9a and Figure 10a, the contribution (SHAP value) and relative importance ranking of the 12 influencing factors are shown. Figure 9b and Figure 10b combine factor importance with their influence on fire risk. Each point in the figure represents the predictive effect (SHAP value) of built-environment variables on individual samples, and samples with identical SHAP values are vertically stacked.
Figure 9.
Relative importance of factors influencing fire risk in Futian District, Shenzhen, from 2008 to 2012. (a) Mean absolute SHAP values of fire risk factors in Futian District, Shenzhen, 2008–2012; (b) SHAP summary plot, 2008–2012.
Figure 10.
Relative importance of factors influencing fire risk in Futian District, Shenzhen, from 2013 to 2018. (a) Mean absolute SHAP values of fire risk factors in Futian District, Shenzhen, 2013–2018; (b) SHAP summary plot, 2013–2018.
The results indicate that during 2008–2012, the key influencing factors of fire risk, ranked by importance, were: KD_Vuln, KD_PubGath, KD_LargeBld, Temp, Dist_FireStn, and KD_Resid. The KD_Vuln ranked first, mainly because such facilities (e.g., schools, hospitals) are critical zones where evacuation is difficult and the presence of vulnerable populations creates significant potential for severe consequences. The high importance of the KD_PubGath and KD_LargeBld is associated with the distribution of facilities in densely populated urban cores, where high human traffic and significant electrical loads create prominent fire hazards. The KD_Resid ranked last among the top factors, largely because residential areas may be more spatially dispersed or have lower building densities compared to the concentrated commercial and vulnerable facility clusters, resulting in a relatively lower marginal contribution to the prediction.
During 2013–2018, the ranking of influencing factors shifted to: KD_PubGath, KD_Vuln, Dist_FireStn, Temp, KD_Resid, and KD_LargeBld. The KD_PubGath rose to first place, reflecting the continued growth of visitor flows in the Futian central area and the Huaqiangbei Commercial Area, where large populations gather. The KD_Resid increased to fifth place due to accelerated urban renewal processes, increasing residential density and exposing issues such as aging infrastructure in older residential communities. The NTL emerged as a notable factor (ranking seventh), reflecting the growing intensity of nighttime economic activities and the associated increase in electricity use and fire-related scenarios. In contrast, the importance of the KD_LargeBld declined, likely due to improved spatial planning of newly constructed large buildings and stricter fire safety inspection standards.
Overall, KD_PubGath, KD_Vuln, and Dist_FireStn consistently remain the core influencing factors across both periods. This indicates a shift in dominant fire risk drivers from building expansion (2008–2012) to population concentration and activity intensity (2013–2018). Meanwhile, NDVI, Bldg_Dens, Road_Dens, and DEM all exhibit relatively low mean absolute SHAP values during both periods, indicating limited influence on urban fire risk.
3.6. Feature Interaction Analysis
To quantitatively address the reviewers’ concerns regarding feature interactions, the SHAP interaction value matrices and the top 10 dominant interaction pairs for both study periods were computed and summarized (Figure 11 and Table 5). The results indicate a substantial intensification and structural shift in synergistic effects over time. In the 2008–2012 period, the interaction between Dist_FireStn and Temp was the primary driver (0.0581). However, by 2013–2018, the interaction strength increased substantially, with the synergy between KD_PubGath and KD_Vuln emerging as the dominant factor (0.1399). Furthermore, significant interactions were observed between NTL and socio-economic densities (KD_PubGath and KD_Vuln), supporting the presence of complex nonlinear interactions between urban development intensity and fire risk vulnerability in high-density areas.
Figure 11.
SHAP interaction value matrices for urban fire risk factors: (a) 2008–2012; (b) 2013–2018.
Table 5.
Top 10 pairwise feature interactions based on mean absolute SHAP interaction values.
3.7. Nonlinear Relationships Between Features and Regional Fire Risk
We further examined the nonlinear relationships between influencing factors and regional fire risk by analyzing scatter plots combined with locally weighted regression (LOWESS) fitting curves. Colors represent the feature with the strongest interaction effect in each sample. To ensure statistical rigor, critical thresholds were identified using a bootstrap-based piecewise linear fitting method (pwlf package, 1000 bootstrap resamples). The identified breakpoints and 95% confidence intervals (95% CI) are reported below. Figure 12 and Figure 13 show the nonlinear relationships between environmental factors and fire risk in Futian District, Shenzhen, during 2008–2012 and 2013–2018, respectively.
Figure 12.
Nonlinear relationships between core environmental factors and fire risk in Futian District, Shenzhen, 2008–2012. (a) KD_Vuln; (b) KD_PubGath; (c) KD_LargeBld; (d) Temp; (e) Dist_FireStn; (f) KD_Resid.
Figure 13.
Nonlinear relationships between core environmental factors and fire risk in Futian District, Shenzhen, 2013–2018. (a) KD_PubGath; (b) KD_Vuln; (c) Dist_FireStn; (d) Temp; (e) KD_Resid; (f) KD_LargeBld.
In Figure 12 and Figure 13, the threshold (red dashed line) and 95% confidence interval (pink shading) are displayed only for those variables exhibiting a distinct change in the direction or slope of the LOWESS-fitted relationship.
The results for 2008–2012 (Figure 12) show that KD_Vuln (a) is positively correlated with SHAP values: when the kernel density exceeds 6.60 POI/km2, it begins to exert a positive effect on FRI; the effect peaks at approximately 8 POI/km2, with SHAP values stabilizing at around 1.5. A strong positive interaction exists between KD_Vuln and KD_Resid; when the latter is high, the positive contribution of KD_Vuln to SHAP values is further amplified.
KD_PubGath (b) shows a positive association with SHAP values. When the density exceeds 958.05 POI/km2, SHAP values turn positive, indicating a positive effect on FRI; the growth rate slows after exceeding approximately 1000 POI/km2. This variable also exhibits a positive interaction with KD_Resid: higher residential density corresponds to higher SHAP values.
KD_LargeBld (c) shows an overall positive correlation with SHAP values. When the density is below 3.41 POI/km2, SHAP values are negative, indicating a negative effect on FRI; once it exceeds 3.41 POI/km2, SHAP values become positive, and the growth rate remains strong without significant slowing. This variable also shows a positive interaction with KD_PubGath, with a strong amplification effect in medium- and high-density ranges.
Temp (d) shows that when the temperature is less than 22.72 °C, SHAP values are negative, indicating a negative influence on FRI. When the temperature exceeds 22.72 °C, SHAP values turn positive, suggesting a clear threshold effect. This pattern is likely related to spatial thermal heterogeneity within the study area. Specifically, coastal zones tend to maintain relatively lower temperatures due to the thermal regulation effect of adjacent water bodies, which contributes to reduced fire occurrence. In contrast, inland urban areas with higher temperatures are more likely to experience intensified FRI, potentially driven by the urban heat island effect, potentially increasing energy demand and reducing local moisture conditions.
In addition, Temp is positively correlated with NTL: areas with higher temperature generally correspond to higher light intensity, while lower temperature areas exhibit relatively lower nighttime light levels.
Dist_FireStn (e) shows that when the distance is less than 2000 m, SHAP values are positive, indicating a positive influence on FRI. When the distance exceeds 2000 m, SHAP values become negative. Dist_FireStn is negatively correlated with KD_Resid: areas near fire stations generally have higher KD_Resid (POI/km2), while more distant areas show lower KD_Resid levels.
KD_Resid (f) shows a clear positive correlation with SHAP values. When the density is below approximately 25 POI/km2, SHAP values are predominantly negative or close to zero, indicating a limited or slightly suppressing effect on FRI. Once the density exceeds this threshold, SHAP values turn positive and increase steadily, suggesting a significant enhancement of FRI. This pattern indicates a distinct threshold effect. Furthermore, higher Temp further strengthens this positive contribution, as reflected by the color gradient in the figure, where higher-temperature observations are associated with larger SHAP values at similar density levels. This interaction may be attributed to intensified human activity and elevated thermal conditions. High residential density concentrates population and daily activities. Under higher temperatures, increased energy use, reduced moisture, and more frequent ignition sources jointly contribute to higher FRI.
The results for 2013–2018 (Figure 13) show that KD_PubGath (a) is positively correlated with SHAP values: when the density is below the bootstrap-derived breakpoint of 2270.39 POI/km2, SHAP values are negative, indicating a negative effect on FRI; once it exceeds 2270.39 POI/km2, SHAP values become positive, and growth slows beyond ~2300 POI/km2. A strong interaction is observed between KD_PubGath and KD_LargeBld; when the latter is high (as indicated by redder points), the positive contribution of KD_PubGath to SHAP values is further amplified.
KD_Vuln (b) is positively correlated with SHAP values: when the density is below the bootstrap-derived breakpoint of 1.62 POI/km2, SHAP values are negative, indicating a negative effect on FRI; once it exceeds 1.62 POI/km2, SHAP values turn positive, and SHAP values increase substantially with higher densities. A strong interaction is observed between KD_Vuln and KD_Resid; when the latter is high (as indicated by redder points), the positive contribution of KD_Vuln to SHAP values is further amplified.
Dist_FireStn (c) shows that when the distance is less than the bootstrap-derived breakpoint of 1398.74 m, SHAP values are positive, indicating a positive influence on FRI. When the distance exceeds 1398.74 m, SHAP values become negative. Dist_FireStn is negatively correlated with KD_Vuln: areas near fire stations generally have higher KD_Vuln (POI/km2), while more distant areas show lower KD_Vuln levels.
Temp (d) shows negative SHAP values when the temperature is below the bootstrap-derived breakpoint of 23.27 °C, indicating a negative influence on FRI; once it exceeds 23.27 °C, SHAP values become positive, indicating a clear threshold effect. This phenomenon is closely related to the interaction between Temp and NTL; higher NTL values (as indicated by redder points) strengthen the positive effect of Temp on SHAP values, whereas lower NTL values reinforce its negative effect, reflecting the synergistic amplification of fire risk by elevated temperature and intense anthropogenic activity in urban environments.
KD_Resid (e) is positively correlated with SHAP values. SHAP values rise rapidly from negative to positive as the density increases, indicating a transition from negative to positive effect on FRI; once the density is higher, SHAP values become positive, and the growth rate slows significantly, stabilizing at around 0.8. A strong positive interaction exists between KD_Resid and KD_Vuln; when the latter is high (as indicated by redder points), the positive contribution of KD_Resid to SHAP values is further amplified.
KD_LargeBld (f) shows negative SHAP values in the range of 0–0.5 POI/km2, indicating a negative influence on FRI; once the density exceeds 0.5 POI/km2, SHAP values turn positive. This phenomenon is also related to the spatial concentration of high-fire-load structures and urban density variations. Higher densities of KD_PubGath strengthen the positive effect of KD_LargeBld on SHAP values, whereas lower densities reinforce its negative or neutral effect in less developed areas.
Comparing the results for 2008–2012 (Figure 12) and 2013–2018 (Figure 13) reveals both notable similarities and clear dynamic shifts in the nonlinear relationships between the core environmental factors and regional fire risk.
In terms of similarities, the six key factors—KD_PubGath, KD_Vuln, KD_Resid, Dist_FireStn, Temp, and KD_LargeBld—remain central to fire risk prediction across both periods. Their relationships with SHAP values consistently exhibit a threshold-dependent pattern: SHAP values are predominantly negative (or near zero) below the identified breakpoint and turn positive above it, indicating a shift from risk suppression to risk amplification. Significant interaction effects among variables are also evident in both periods, with color gradients highlighting how one factor modulates the influence of another (e.g., KD_Resid amplifying KD_Vuln and KD_PubGath; Temp interacting with NTL).
In terms of differences, two major changes stand out. First, the critical thresholds display substantial temporal evolution. The positive-effect breakpoint for KD_PubGath rose sharply from 958.05 POI/km2 to 2270.39 POI/km2 (with growth slowing after approximately 2300 POI/km2); the threshold for KD_Vuln decreased from 6.60 POI/km2 to 1.62 POI/km2; the threshold for KD_Resid shifted to a substantially higher density range where the growth rate slows significantly once density is higher; the breakpoint distance for Dist_FireStn decreased from 2000 m to 1398.74 m; the temperature threshold rose modestly from 22.72 °C to 23.27 °C; and the breakpoint for KD_LargeBld fell from 3.41 POI/km2 to 0.5 POI/km2. These shifts reflect changing urban conditions, such as intensified population density and evolving spatial patterns.
Second, interaction patterns and the role of auxiliary factors strengthened in the later period. The positive interaction between KD_PubGath and KD_LargeBld became more pronounced, while the synergistic amplification between Temp and NTL grew more explicit: higher NTL values notably reinforced the positive effect of temperature on fire risk. In addition, the overall importance ranking shifted (with KD_PubGath rising to first place and NTL emerging as a notable seventh-ranked factor in 2013–2018), underscoring a transition from building-expansion-driven risk to population-concentration- and activity-intensity-driven risk.
These evolving feature dependence patterns demonstrate that the influence of built-environment factors on urban fire risk is inherently dynamic rather than static. Risk assessment and governance strategies should therefore incorporate temporal context and adopt period-specific adjustments to remain effective.
3.8. Local Diagnostics and Spatiotemporal Mechanism Evolution
To further unravel the non-linear driving mechanisms and their temporal evolution, this section conducts a comparative local SHAP analysis on two representative hotspots—Huaqiangbei (a premier commercial hub) and Shatou (a typical urban village/mixed-use area)—across the 2008–2012 and 2013–2018 periods. The base value, representing the average predicted risk, remains stable at 1.732 across both periods according to the latest model training, providing a consistent benchmark for evaluating how specific local features deviate from the global mean to determine the final Fire Risk Index (FRI). The detailed feature contributions and their spatiotemporal shifts, visualized in the 2 × 2 waterfall diagnostic matrix in Figure 14, reveal distinct evolutionary trajectories for these two urban functional zones.
Figure 14.
Local SHAP waterfall diagnostics (Huaqiangbei vs. Shatou, Two Periods).
3.8.1. Huaqiangbei: Paradigm Shift from Activity-Driven to Vulnerability-Dominated Risk
In Huaqiangbei, the local diagnostics reveal a clear mechanistic transition reflecting its evolution from a rapid wholesale expansion phase to a mature, managed commercial core.
During the 2008–2012 period, the risk was overwhelmingly driven by the sheer scale of the built environment and intense commercial pressure, where KD_LargeBld contributed the most significant positive SHAP value (approximately +1.78), followed by KD_PubGath (+1.66) and KD_Vuln (+1.00). This early phase underscores how massive building volumes and high functional density directly dictated the fire load in a burgeoning market district.
By the 2013–2018 period, while the area remained high-risk, the dominant drivers shifted toward the interplay of social vulnerability and persistent functional activity. KD_PubGath (+1.35) and KD_Vuln (+1.08) continued to be the primary risk enhancers, but the influence of physical building scale (KD_LargeBld) diminished notably to +0.63. Crucially, Dist_FireStn emerged as a powerful risk-reducing factor with a negative SHAP value of −0.43, indicating that the maturation of the district has been accompanied by more effective fire service integration and localized safety management. The emergence of slight negative contributions from NDVI and Bldg_Dens further suggests that modern urban renewal and density controls have begun to exert a synergistic mitigating effect on the fire risk profile.
3.8.2. Shatou: Intensification of Infrastructure Vulnerability Synergy in Urban Villages
In stark contrast to the adaptive transition observed in Huaqiangbei, Shatou exemplifies a scenario of risk intensification and structural inertia typical of informal high-density settlements.
During the 2008–2012 period, the risk mechanism was relatively fragmented; although KD_LargeBld (+1.10) and KD_Vuln (+0.71) were the leading drivers, the impact of environmental factors like Temp was actually negative (−0.50), reflecting a different socio-spatial equilibrium in the early stage.
However, by the 2013–2018 period, the diagnostic mechanism underwent a dramatic escalation, characterized by a “vulnerability–infrastructure gap” loop. KD_PubGath surged to become the dominant risk driver with a SHAP contribution of +1.72, while KD_Vuln’s impact intensified to +1.27, highlighting the extreme pressure of population crowding within limited spatial confines. Most significantly, the role of Temp flipped to a strong positive contribution (+0.87), suggesting that environmental thermal stress now acts as a critical catalyst for fire risk in the poorly ventilated, high-density fabric of the urban village. Furthermore, Dist_FireStn maintained a positive contribution (+0.18), confirming that Shatou remains functionally isolated from effective fire response thresholds.
These findings emphasize that while general city governance has improved, the “structural traps” of urban villages like Shatou necessitate place-specific, infrastructure-first interventions—such as decentralized micro-fire stations—to break the cycle of escalating risk.
Overall, the local SHAP trajectories across the two periods and two functional zones reveal substantial spatiotemporal heterogeneity: Huaqiangbei demonstrates adaptive risk transformation through functional maturation, whereas Shatou underscores structural inertia requiring place-specific, infrastructure-first remedies. These findings underscore the necessity of dynamic, grid-level “precision fire governance” rather than uniform district-wide strategies in megacity redevelopment.
4. Discussion
4.1. Spatiotemporal Evolution and the Paradigm Shift in Risk Drivers
The findings show a clear spatiotemporal differentiation of fire risk within Futian District, demonstrating a gradual shift from physical–structural dominance toward activity-related patterns. During the first period (2008–2012), high-risk hotspots were primarily concentrated in the eastern and southern parts of the district, covering approximately 19.69 km2. These clusters were mainly associated with the density of large-scale buildings (KD_LargeBld) and vulnerable populations (KD_Vuln), which corresponds to a stage in which fire risk was closely related to rapid built-up expansion and uneven infrastructure conditions.
In the second period (2013–2018), the total hotspot area decreased to 17.88 km2, which is likely related to improvements in urban governance and the implementation of policies such as the “Refined Urban Renewal” initiative introduced around 2012. Despite the overall reduction, Nighttime Light (NTL) and the density of public gathering places (KD_PubGath) became more prominent in the model results, indicating that fire risk is increasingly associated with patterns of economic activity and human use of space. In high-density urban environments such as Shenzhen, fire risk is linked not only to the spatial distribution of buildings but also to the intensity and timing of urban activities, particularly in areas characterized by active nighttime economies and mixed commercial functions. This observation is consistent with previous studies emphasizing the relationship between land use intensity and urban safety resilience, while also indicating that the relative importance of risk factors varies across different stages of urban development.
4.2. Decoupling Non-Linear Thresholds Through XAI (Explainable AI)
An important aspect of this study is the use of the CatBoost–SHAP framework with 7-fold spatial cross-validation to examine nonlinear relationships between urban environmental factors and fire risk. Compared with conventional models, this approach allows for a more detailed characterization of how the effects of individual variables vary across different value ranges. For example, the analysis of temperature (Temp) shows the presence of threshold-like behavior. The estimated critical values increased from approximately 22.72 °C in 2008–2012 to 23.27 °C in 2013–2018 (with 95% CI derived from 1000 bootstrap resamples). Beyond these ranges, the marginal contribution of temperature to predicted fire risk becomes more pronounced, which is likely related to combined effects such as increased energy demand and intensified urban heat conditions.
A similar nonlinear pattern is observed for emergency response accessibility. The SHAP results indicate that the distance to fire stations (Dist_FireStn) is associated with fire risk in a nonlinear manner, with a noticeable change in marginal effects around 1398.74 m. The adoption of spatial cross-validation effectively mitigates information leakage caused by strong spatial autocorrelation, thereby enhancing the reliability of these SHAP-derived thresholds. Beyond this distance, the contribution to predicted risk increases more rapidly. At the same time, this effect appears to be moderated in areas with higher densities of public gathering places (KD_PubGath), which is likely linked to the presence of fire safety facilities and stricter building regulations in large commercial complexes. These findings show that fire risk is shaped by the combined influence of spatial configuration and functional characteristics, and that uniform planning standards may not fully capture such variability. In this sense, the results provide an empirical complement to recent studies that emphasize perceptual or qualitative assessments of urban safety, by offering a quantitative perspective on how nonlinear responses of physical land-use variables relate to fire risk patterns [49].
4.3. Comparative Analysis with Existing Literature
Compared with traditional fire risk studies, this research extends previous findings on the relationship between population density and fire occurrence. While earlier work has often emphasized a linear association between density and fire frequency, the present analysis reveals a more complex pattern in which the effects of activity-related density (e.g., KD_PubGath) vary under different environmental conditions. For instance, public gathering places do not appear to uniformly increase fire risk; instead, their contribution becomes more pronounced under higher temperature conditions, indicating an interaction between human activity intensity and climatic stress.
In addition, while prior studies have highlighted the role of proximity to fire stations as a key factor in reducing fire risk, the results in this study suggest a more heterogeneous spatial pattern. Although accessibility to firefighting services remains important, areas such as Shatou and Huaqiangbei continue to exhibit relatively high risk levels, even with improved infrastructure. This shows that, in highly dense urban environments, physical proximity alone may not fully account for variations in fire risk.
More broadly, these findings are consistent with recent research emphasizing the importance of integrating multiple dimensions—such as socio-economic activity and environmental conditions—into urban risk assessment. At the same time, the present study highlights the value of considering nonlinear effects and feature interactions, which are often overlooked in conventional approaches. By incorporating these aspects, the analysis provides a more nuanced understanding of how different factors are associated with fire risk in complex urban systems [50,51].
5. Policy Implications
5.1. Precision Governance for “Dual-Core” High-Density Clusters
The persistence of high-risk clusters in Shatou and Huaqiangbei necessitates a transition from “one-size-fits-all” firefighting strategies to zone-specific, precision governance.
For Huaqiangbei (Commercial Core): Given that KD_PubGath and NTL are the primary risk drivers, land management departments should implement IoT-based (Internet of Things) real-time monitoring of electrical loads and population flow. Safety audits should focus on the internal management of commercial POIs rather than just building-scale structural inspections.
For Shatou (Mixed-use/Urban Village): The focus should remain on bridging the 1398.74 m service gap for emergency response. In these dense quarters where traditional fire trucks may struggle to navigate, the deployment of “Micro-Fire Stations” and decentralized water supply systems is essential to maintain the “Golden 4 min” response time within the 1398.74 m service gap identified by the model.
5.2. Integrating Urban Heat Mitigation with Fire Prevention
The identified thermal thresholds (23.27 °C, derived from SHAP dependence plots under spatial cross-validation) provide a scientific imperative for integrating fire safety into climate adaptation strategies. Urban planners should prioritize “Nature-based Solutions” (NbS) in high-risk zones to mitigate the urban heat island effect. Strategies such as increasing green roof coverage, promoting permeable pavements, and creating urban wind corridors can lower local micro-environmental temperatures. By maintaining ambient temperatures below the 23.27 °C critical limit, cities can indirectly reduce the probability of heat-induced spontaneous combustion and electrical failures, thereby enhancing the overall resilience of the urban land system.
5.3. Cause-Specific Interventions and Targeted Governance
The cause-level analysis presented in Section 3.1.1 further refines these policy priorities by linking dominant fire typologies to targeted interventions. Given that electrical fires account for 28.67% of all incidents and strongly correlate with the SHAP-identified importance of residential density, fire prevention strategies should prioritize aging residential communities and urban villages. Targeted measures should include mandatory upgrades to outdated electrical wiring, standardized deployment of safe charging facilities for electric bicycles, and community-based fire safety awareness campaigns. Similarly, the prominence of accidental domestic fires (12.89%) alongside the high-risk contribution of public gathering places underscores the necessity for stringent, routine fire safety inspections in high-occupancy venues, coupled with mandatory emergency evacuation drills and smart early-warning systems.
Furthermore, the observed interaction between ambient temperature and built-environment factors indicates that fire risk management should adopt dynamic, seasonally adaptive protocols. During dry, high-temperature periods (particularly winter months with low humidity and peak summer periods), municipal authorities should intensify public outreach, temporarily restrict high-risk ignition activities (e.g., fireworks), and pre-position mobile firefighting resources in historically vulnerable sub-districts. This cause-informed, temporally responsive governance framework ensures that urban fire safety strategies move beyond static spatial zoning to directly address the root ignition mechanisms and environmental triggers of fire incidents.
6. Conclusions
This study develops an interpretable machine learning framework to examine the spatial patterns and influencing factors of urban fire risk in a high-density urban context. By integrating the CatBoost model with SHAP analysis, the study captures nonlinear relationships and provides a detailed interpretation of how different factors influence fire risk distribution.
The results show that urban fire risk is closely related to the spatial concentration of population-related facilities, including commercial, residential, and vulnerable-use spaces. These factors exhibit heterogeneous effects across different density levels, with several variables showing evident threshold characteristics. In addition, climatic conditions, particularly temperature, are associated with variations in fire risk, although their effects are not strictly linear. Interaction analysis further indicates that the combined presence of built environment features and thermal conditions reinforces or moderates fire risk patterns in specific areas.
Overall, this study demonstrates the effectiveness of interpretable machine learning methods in urban risk analysis and provides a useful reference for understanding complex spatial phenomena in high-density cities.
6.1. Limitations
It should be noted that this study focuses on a single high-density urban district, and the generalizability of the findings to other cities requires further validation. In addition, the use of POI data and kernel density estimation introduces certain uncertainties related to data completeness and spatial smoothing.
Furthermore, the use of aggregated POI-based indicators (e.g., commercial facilities) rather than more fine-grained classifications may mask potential heterogeneity in fire risk associated with different subtypes of urban activities. Due to limitations in data availability, this study adopts POI kernel density as a proxy for urban functional intensity, which may not fully capture all dimensions of land-use heterogeneity.
In addition, the use of historical POI snapshots (2012 and 2018) may introduce minor uncertainties related to positional shifts in individual POIs over time, although this approach helps ensure temporal consistency in matching.
Moreover, the raw fire records provided by the Shenzhen Municipal Government Open Data Platform do not include standardized information on fire severity levels. The transition from conventional random splitting to rigorous 7-fold spatial cross-validation further improves model robustness against spatial autocorrelation, although it results in moderately lower R2 values compared with random partitioning, reflecting more realistic out-of-sample performance in geographically heterogeneous urban environments.
6.2. Future Research Directions
Future research could incorporate multi-source and higher-resolution datasets, including more detailed land-use classifications, business-type data, and environmental variables, to further improve the granularity of fire risk analysis.
In addition, sensitivity analyses based on multi-temporal POI datasets could be conducted to better account for potential spatial and temporal uncertainties in POI data. Comparative studies across different urban contexts would also help evaluate the robustness and transferability of the findings.
Furthermore, future work could integrate more detailed fire incident records, including severity levels and internal operational data from fire departments, to enable more refined analyses of fire risk mechanisms across different fire intensities.
Author Contributions
Conceptualization, H.L.; methodology, Y.W.; validation, Y.W.; formal analysis, Y.W.; investigation, Y.W.; resources, H.L.; data curation, Y.W.; writing—original draft preparation, Y.W.; writing—review and editing, H.L. and Y.W.; visualization, Y.W.; supervision, H.L.; project administration, Y.W. All authors have read and agreed to the published version of the manuscript.
Funding
This work was supported by the Major Project of Philosophy and Social Science Research in Higher Education Institutions of Henan Province (2025-YYZD-12).
Data Availability Statement
The original contributions presented in the study are included in the article, further inquiries can be directed to the corresponding author(s).
Conflicts of Interest
The authors declare no conflicts of interest.
Abbreviations
The following abbreviations are used in this manuscript:
| DEM | Elevation |
| Slope | Slope |
| NDVI | Normalized Difference Vegetation Index |
| Precip | Annual Total Precipitation |
| Temp | Annual Mean Temperature |
| Dist_Water | Distance to Water Bodies |
| Bldg_Dens | Building Density |
| Road_Dens | Road Density |
| NTL | Nighttime Light Intensity |
| KD_Vuln | Vulnerable Facilities Density |
| KD_PubGath | Public Gathering Places Density |
| KD_Flame | Flammable/Explosive Sites Density |
| KD_Resid | Residential Density |
| KD_LargeBld | Large-scale Buildings Density |
| KD_Vuln_POI | Vulnerable Facilities Points of Interest |
| KD_PubGath_POI | Public Gathering Places Points of Interest |
| KD_Flame_POI | Flammable/Explosive Sites Points of Interest |
| KD_Resid_POI | Residential Points of Interest |
| KD_LargeBld_POI | Large-scale Buildings Points of Interest |
| Dist_FireStn | Distance to Fire Stations |
| FRI | Fire Risk Index |
| POI | Points of Interest |
| KDE | Kernel Density Estimation |
| GBDT | Gradient Boosting Decision |
| ML | Machine Learning |
| AHP | Analytic Hierarchy Process |
| SVM | Support Vector Machine |
References
- Bai, M.; Liu, Q. Evaluating Urban Fire Risk Based on Entropy-Cloud Model Method Considering Urban Safety Resilience. Fire 2023, 6, 62. [Google Scholar] [CrossRef] [Scilit]
- Kim, J.S.; Kim, J.H.; Lee, S.K. Analysis of Fire-Accident Factors Using Big-Data Analysis Method for Construction Areas. KSCE J. Civ. Eng. 2018, 22, 1535–1543. [Google Scholar] [CrossRef] [Scilit]
- Taylor, M.; Dean, E.; Fielding, J.; Lyon, R.; Reilly, D.; Francis, H.; Kwasnica, V. The Use of Machine Learning for Accidental Dwelling Fire Prevention. Fire Saf. J. 2025, 157, 104510. [Google Scholar] [CrossRef] [Scilit]
- Cui, S.; Wang, N.; Zhao, E.; Zhang, J.; Zhang, C. Assessing Urban Fire Risk: An Ensemble Learning Approach Based on Scenarios and Cases. Int. J. Disaster Risk Reduct. 2024, 114, 104941. [Google Scholar] [CrossRef] [Scilit]
- Kang, J.; Wang, H.; Jin, H.; Wang, Z.; Zhang, J. Risk Analysis and Management of Hydrogen Station Fire and Explosion Accidents Using DEMATEL-ISM and Complex Network Models. Int. J. Hydrogen Energy 2025, 136, 1230–1241. [Google Scholar] [CrossRef] [Scilit]
- Pei, J.; Zhang, H.; Yin, S.; Wang, M.; Luo, Y. Research on Forest Fire Risk Assessment and Prevention and Control Countermeasures: A Case Study of Qinyuan County, Shanxi Province, China. Ecol. Indic. 2025, 176, 113719. [Google Scholar] [CrossRef] [Scilit]
- Liu, F.; Zhao, S.; Weng, M.; Liu, Y. Fire Risk Assessment for Large-Scale Commercial Buildings Based on Structure Entropy Weight Method. Saf. Sci. 2017, 94, 26–40. [Google Scholar] [CrossRef] [Scilit]
- Bostani, A.M.; Pourebrahim, S. Integrated Fire Risk Assessment Using Time-Series Satellite Data and Multi-Criteria Decision-Making Techniques. Environ. Sustain. Indic. 2025, 28, 100916. [Google Scholar] [CrossRef] [Scilit]
- Xie, S.; Dong, S.; Chen, Y.; Peng, Y.; Li, X. A Novel Risk Evaluation Method for Fire and Explosion Accidents in Oil Depots Using Bow-Tie Analysis and Risk Matrix Analysis Method Based on Cloud Model Theory. Reliab. Eng. Syst. Saf. 2021, 215, 107791. [Google Scholar] [CrossRef] [Scilit]
- Gulum, P.; Ayyildiz, E.; Taskin Gumus, A. A Two Level Interval Valued Neutrosophic AHP Integrated TOPSIS Methodology for Post-Earthquake Fire Risk Assessment: An Application for Istanbul. Int. J. Disaster Risk Reduct. 2021, 61, 102330. [Google Scholar] [CrossRef] [Scilit]
- Seo, M.S.; Osorio, E.E.C.; Yoo, H.H. Analysis of Fire Risk Factors in Seoul, Korea, by Machine Learning. Sens. Mater. 2022, 34, 4841–4854. [Google Scholar] [CrossRef] [Scilit]
- Bouzeraa, Y.; Bouchemal, N.; Djaaboub, S.; Hristov, G.; Zahariev, P. Machine Learning-Based Wildfire Susceptibility Mapping: A GIS-Integrated Predictive Framework. Appl. Sci. 2025, 15, 12188. [Google Scholar] [CrossRef] [Scilit]
- Sivrikaya, F.; Demirel, D. Fire Risk Mapping Using Machine Learning Method and Remote Sensing in the Mediterranean Region. Adv. Space Res. 2025, 75, 5402–5419. [Google Scholar] [CrossRef] [Scilit]
- Zamanialaei, M.; San Martin, D.; Theodori, M.; Purnomo, D.M.J.; Tohidi, A.; Lautenberger, C.; Qin, Y.; Trouvé, A.; Gollner, M. Fire Risk to Structures in California’s Wildland-Urban Interface. Nat. Commun. 2025, 16, 8041. [Google Scholar] [CrossRef] [Scilit] [PubMed]
- Rohde, D.; Corcoran, J.; Chhetri, P. Spatial Forecasting of Residential Urban Fires: A Bayesian Approach. Comput. Environ. Urban Syst. 2010, 34, 58–69. [Google Scholar] [CrossRef] [Scilit]
- Granda, S.; Ferreira, T.M. Assessing Vulnerability and Fire Risk in Old Urban Areas: Application to the Historical Centre of Guimarães. Fire Technol. 2019, 55, 105–127. [Google Scholar] [CrossRef] [Scilit]
- Chhetri, P.; Corcoran, J.; Stimson, R.J.; Inbakaran, R. Modelling Potential Socio-Economic Determinants of Building Fires in South East Queensland. Geogr. Res. 2010, 48, 75–85. [Google Scholar] [CrossRef] [Scilit]
- Xia, Z.; Zhang, X.; Zhai, G.; Zhang, Y. Integrating Visual Spatial Vulnerability to Quantify Fire-Prone Neighborhoods in Cities: A Case Study of Nanjing, China. Int. J. Disaster Risk Reduct. 2025, 128, 105758. [Google Scholar] [CrossRef] [Scilit]
- Palazzi, N.C.; Juliá, P.B.; Ferreira, T.M.; Rosas, J.; Monsalve, M.; de la Llera, J.C. Fire Risk Assessment of Historic Urban Aggregates: An Application to the Yungay Neighborhood in Santiago, Chile. Int. J. Disaster Risk Reduct. 2023, 86, 103550. [Google Scholar] [CrossRef] [Scilit]
- Song, C.; Kwan, M.-P.; Song, W.; Zhu, J. A Comparison between Spatial Econometric Models and Random Forest for Modeling Fire Occurrence. Sustainability 2017, 9, 819. [Google Scholar] [CrossRef] [Scilit]
- Pei, Z.; Li, J.; Guo, J.; Li, Q.; Chen, J. Using Local Co-Location Quotient and Niche-Based Model to Assess Fire Risk in Urban Environments: A Case Study of Beijing, China. Sustain. Cities Soc. 2023, 99, 104989. [Google Scholar] [CrossRef] [Scilit]
- Sun, J.; Lin, M.; Wu, J.; Liu, X.; Sun, T.; Fang, H. Study on Urban Fire Risk Assessment Index System for Smart Cities. In Proceedings of the 2019 IEEE 2nd International Conference on Electronics Technology (ICET), Chengdu, China, 10–13 May 2019; pp. 609–613. [Google Scholar] [CrossRef] [Scilit]
- Wei, Y.; Zhang, J.; Wang, J. Research on Building Fire Risk Fast Assessment Method Based on Fuzzy Comprehensive Evaluation and SVM. Procedia Eng. 2018, 211, 1141–1150. [Google Scholar] [CrossRef] [Scilit]
- Kim, Y.; Cho, Y.; Heo, H.K.; Lim, L. Estimating Casualties from Urban Fires: A Focus on Building and Urban Environment Information. Sustain. Cities Soc. 2024, 115, 105839. [Google Scholar] [CrossRef] [Scilit]
- Oh, H.Y.; Jeong, M.-H. Grid-Based Urban Fire Prediction Using Extreme Gradient Boosting (XGBoost). Sens. Mater. 2022, 34, 4879. [Google Scholar] [CrossRef] [Scilit]
- Prokhorenkova, L.; Gusev, G.; Vorobev, A.; Dorogush, A.V.; Gulin, A. CatBoost: Unbiased Boosting with Categorical Features. Adv. Neural Inf. Process. Syst. 2018, 31, 6639–6649. [Google Scholar] [CrossRef] [Scilit]
- Lundberg, S.M.; Lee, S.-I. A Unified Approach to Interpreting Model Predictions. arXiv 2017, arXiv:1705.07874. [Google Scholar] [CrossRef] [Scilit]
- Cao, Y.; Li, F.; Xi, X.; van Bilsen, D.J.C.; Xu, L. Urban Livability: Agent-Based Simulation, Assessment, and Interpretation for the Case of Futian District, Shenzhen. J. Clean. Prod. 2021, 320, 128662. [Google Scholar] [CrossRef] [Scilit]
- Shenzhen Municipal Government Data Open Platform. Available online: https://opendata.sz.gov.cn/ (accessed on 20 March 2026).
- Geospatial Data Cloud. Available online: https://www.gscloud.cn/ (accessed on 20 March 2026).
- Yang, J.; Dong, J.; Xiao, X.; Dai, J.; Wu, C.; Xia, J.; Zhao, G.; Zhao, M.; Li, Z.; Zhang, Y.; et al. Divergent Shifts in Peak Photosynthesis Timing of Temperate and Alpine Grasslands in China. Remote Sens. Environ. 2019, 233, 111395. [Google Scholar] [CrossRef] [Scilit]
- Peng, S.; Ding, Y.; Liu, W.; Li, Z. 1 km Monthly Temperature and Precipitation Dataset for China from 1901 to 2017. Earth Syst. Sci. Data 2019, 11, 1931–1946. [Google Scholar] [CrossRef] [Scilit]
- Peng, S. 1-km Monthly Mean Temperature Dataset for China (1901–2024); National Tibetan Plateau/Third Pole Environment Data Center: Beijing, China, 2019. [Google Scholar] [CrossRef]
- OpenStreetMap. Available online: https://www.openstreetmap.org/ (accessed on 20 March 2026).
- Shi, Q.; Zhu, J.; Liu, Z.; Guo, H.; Liu, M.; Liu, Z.; Liu, X. A First High-Quality Vector Data of Buildings in East Asian Countries Based on a Comprehensive Large-Scale Mapping Framework; Zenodo: Geneva, Switzerland, 2023. [Google Scholar] [CrossRef]
- Zhong, X.; Yan, Q.; Li, G. Long Time Series Nighttime Light Dataset of China (2000–2020). J. Glob. Change Data Discov. 2022, 6, 416–424. [Google Scholar] [CrossRef] [Scilit]
- Baidu Maps Open Platform. Map Imagery—Customized Map Solution. Available online: https://lbsyun.baidu.com/products/map (accessed on 20 March 2026).
- O’Brien, R.M. A Caution Regarding Rules of Thumb for Variance Inflation Factors. Qual. Quant. 2007, 41, 673–690. [Google Scholar] [CrossRef] [Scilit]
- Hao, Y.; Li, M.; Wang, J.; Li, X.; Chen, J. A High-Resolution Spatial Distribution-Based Integration Machine Learning Algorithm for Urban Fire Risk Assessment: A Case Study in Chengdu, China. ISPRS Int. J. Geo-Inf. 2023, 12, 404. [Google Scholar] [CrossRef] [Scilit]
- Hossain, M.R.; Smirnov, O. Analyzing the Risk Factors of Residential Fires in Urban and Rural Census Tracts of Ohio Using Panel Data Analysis. Appl. Geogr. 2023, 151, 102863. [Google Scholar] [CrossRef] [Scilit]
- Hu, J.; Shu, X.; Xie, S.; Tang, S.; Wu, J.; Deng, B. Socioeconomic Determinants of Urban Fire Risk: A City-Wide Analysis of 283 Chinese Cities from 2013 to 2016. Fire Saf. J. 2019, 110, 102890. [Google Scholar] [CrossRef] [Scilit]
- Rahmawati, D.; Pamungkas, A.; Aulia, B.U.; Larasati, K.D.; Rahadyan, G.A.; Dito, A.H. Participatory Mapping for Urban Fire Risk Reduction in High-Density Urban Settlement. Procedia Soc. Behav. Sci. 2016, 227, 395–401. [Google Scholar] [CrossRef] [Scilit]
- Silverman, B.W. Density Estimation for Statistics and Data Analysis; Routledge: New York, NY, USA, 2018; ISBN 978-1-315-14091-9. [Google Scholar]
- Islam, S.M.S.; Islam, K.M.A.; Mullick, M.R.A. Drought Hot Spot Analysis Using Local Indicators of Spatial Autocorrelation: An Experience from Bangladesh. Environ. Chall. 2022, 6, 100410. [Google Scholar] [CrossRef] [Scilit]
- Hu, X.; Ma, C.; Huang, P.; Guo, X. Ecological Vulnerability Assessment Based on AHP-PSR Method and Analysis of Its Single Parameter Sensitivity and Spatial Autocorrelation for Ecological Protection—A Case of Weifang City, China. Ecol. Indic. 2021, 125, 107464. [Google Scholar] [CrossRef] [Scilit]
- He, P.; Zhang, D.; Chen, W.; Jia, B. Spatio-Temporal Distribution Estimation and Analysis of Post-Earthquake Casualties in Urban Areas: A Case Study in Chenghua District, Chengdu. Int. J. Disaster Risk Reduct. 2025, 123, 105477. [Google Scholar] [CrossRef] [Scilit]
- Wu, J.; Chen, X.; Li, R.; Wang, A.; Huang, S.; Li, Q.; Qi, H.; Liu, M.; Cheng, H.; Wang, Z. A Novel Framework for High Resolution Air Quality Index Prediction with Interpretable Artificial Intelligence and Uncertainties Estimation. J. Environ. Manag. 2024, 357, 120785. [Google Scholar] [CrossRef] [Scilit] [PubMed]
- Segoni, S.; Nocentini, N.; Ajin, R.S.; Gatto, A.; Fanti, R. Understanding the Spatial Patterns of Major Geo-Hydrological Disasters in Italy Using the CatBoost Algorithm. Sci. Total Environ. 2025, 999, 180355. [Google Scholar] [CrossRef] [Scilit]
- Yuan, L.; Dan, Y.; Leng, Y.; Zhang, J. Influencing Factors of Urban Safety Perception Based on the Combination of Multi-Source Data and Machine Learning: A Case Study of Nanchang City, China. Sci. Rep. 2025, 16, 3972. [Google Scholar] [CrossRef] [Scilit] [PubMed]
- Zhang, Z.; Guo, Z.; Wu, S.; Tang, P.; Wang, S.; Yang, L. Harnessing Machine Learning and Multi-Source Data Fusion for Urban Fire Risk Assessment: Predictive Analysis of Spatial Heterogeneity. Nat. Hazards 2026, 122, 262. [Google Scholar] [CrossRef] [Scilit]
- Yang, X.; Hao, Y.; Ding, H.; Yu, C.; Liu, J.; Li, L.; Chen, J. Explainable Artificial Intelligence (XAI) Framework Using XGBoost and SHAP for Assessing Urban Fire Risk Based on Spatial Distribution Features. Int. J. Disaster Risk Reduct. 2025, 129, 105798. [Google Scholar] [CrossRef] [Scilit]
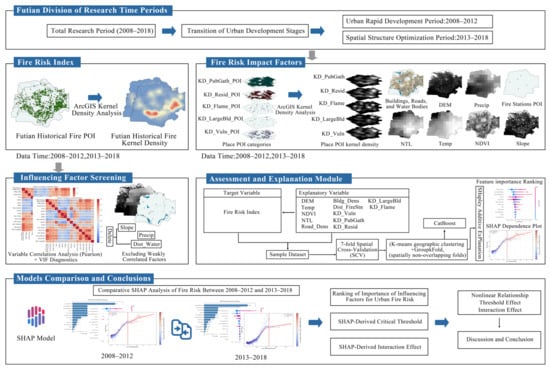
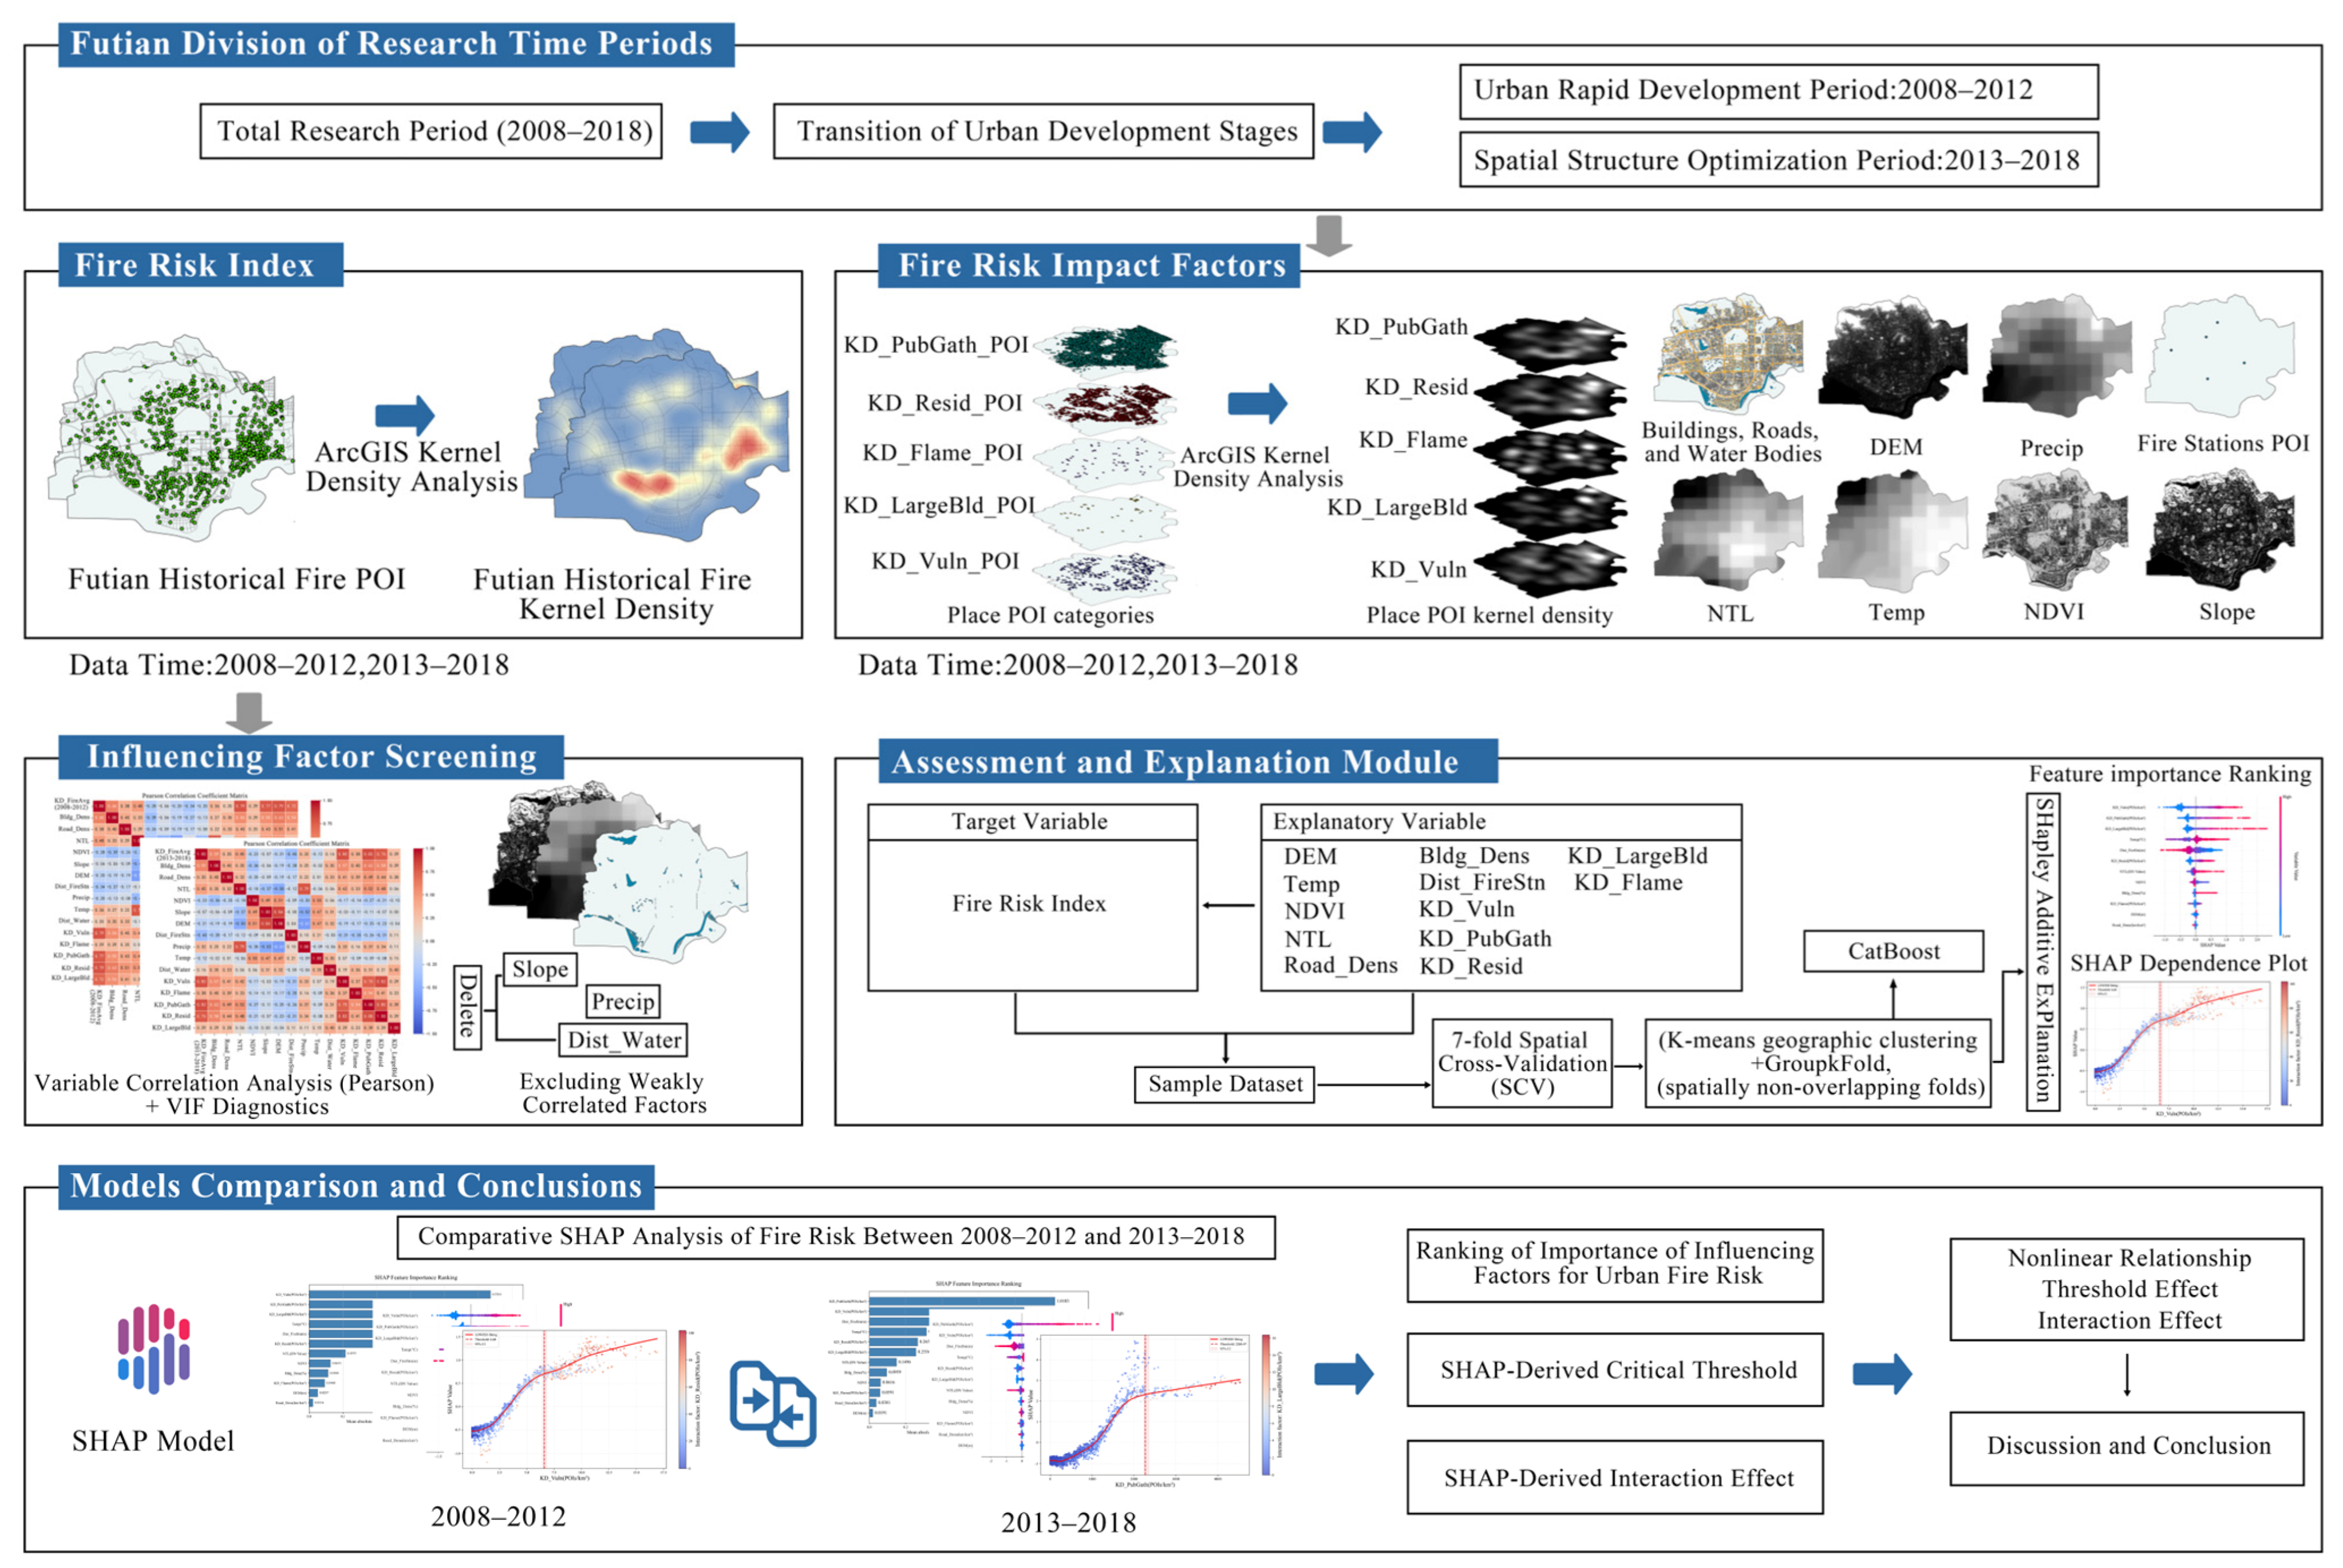
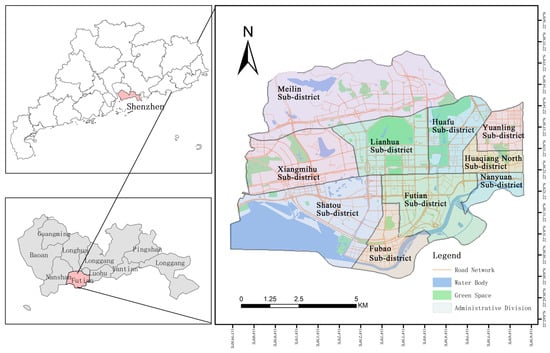
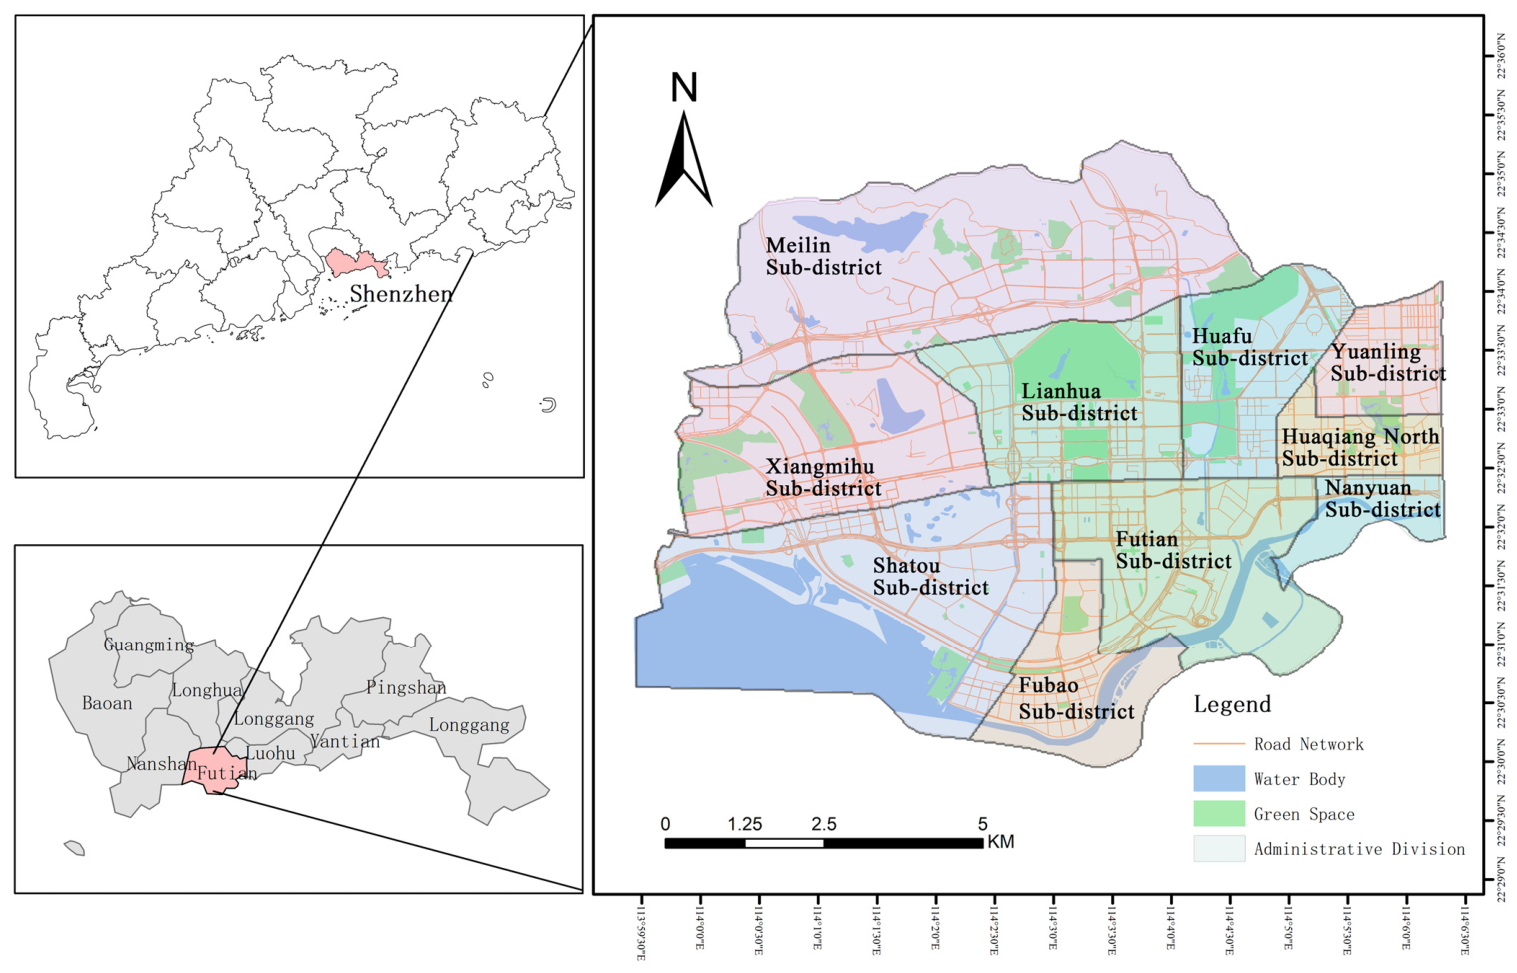
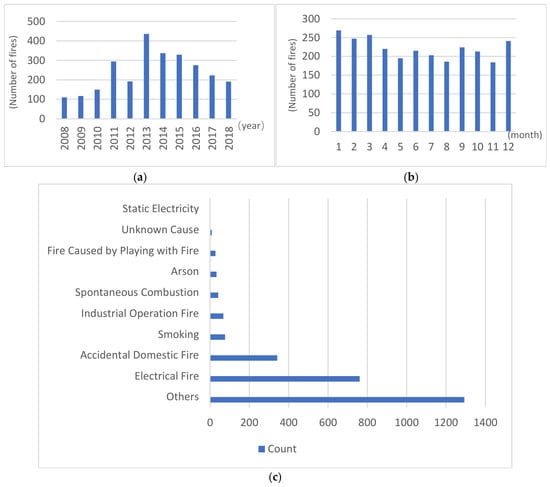
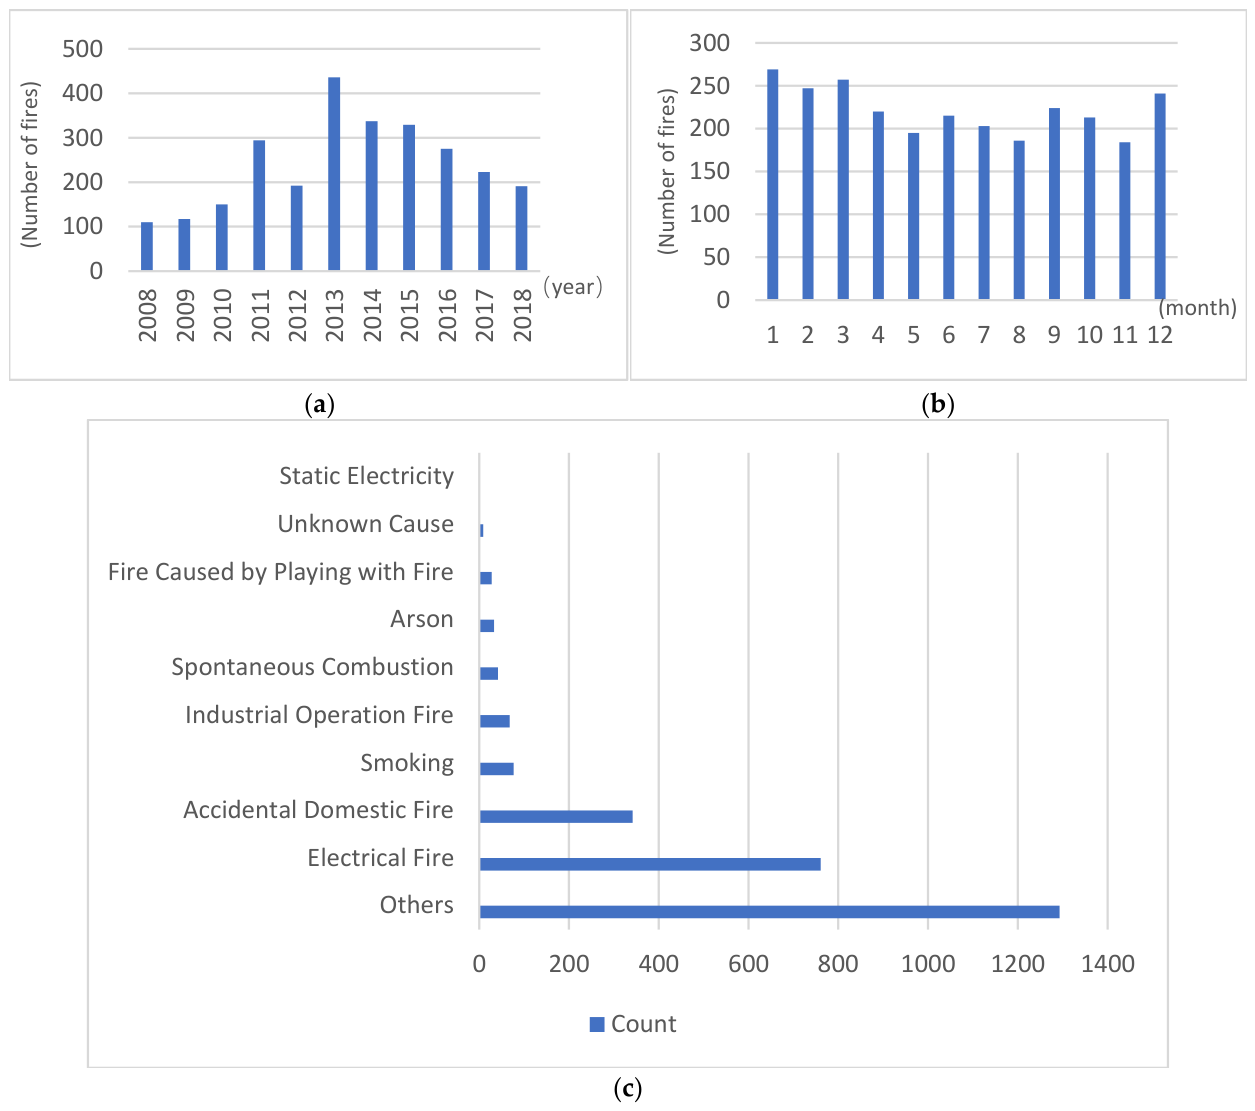
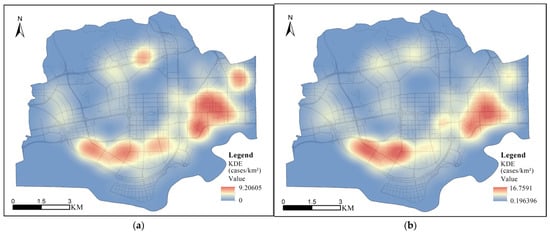
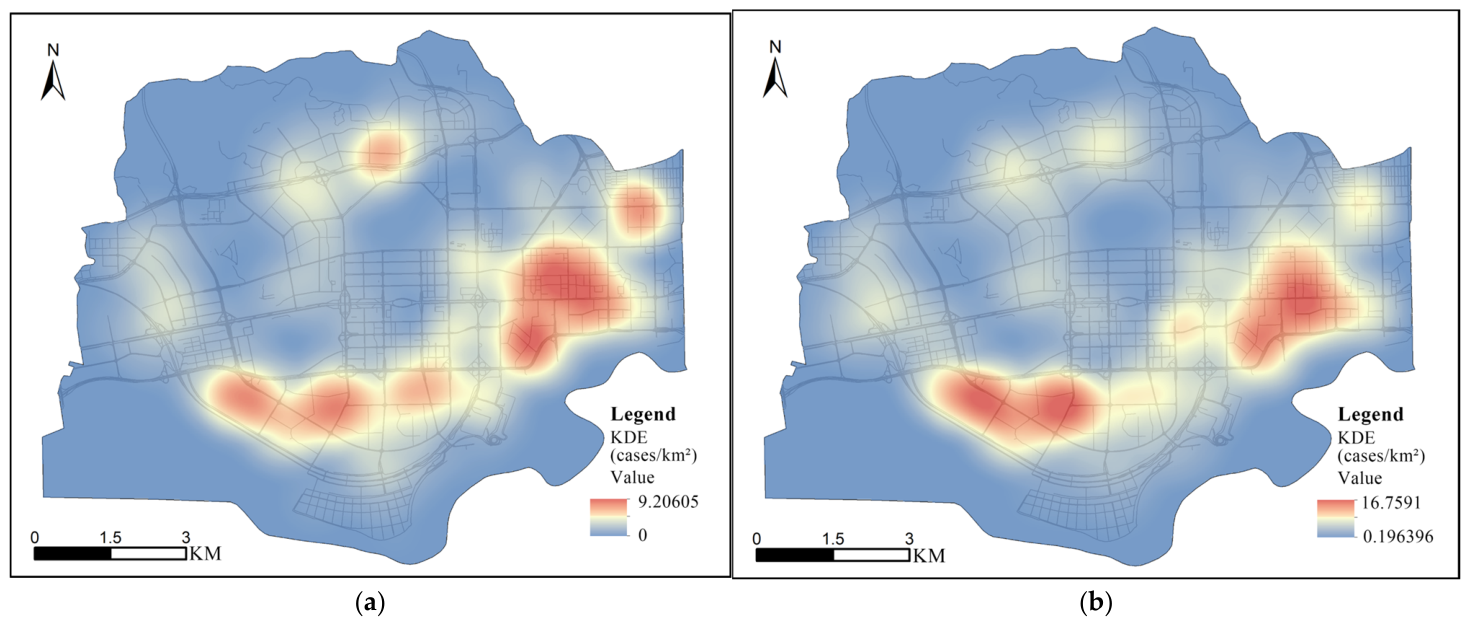
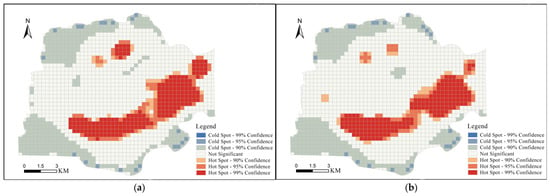
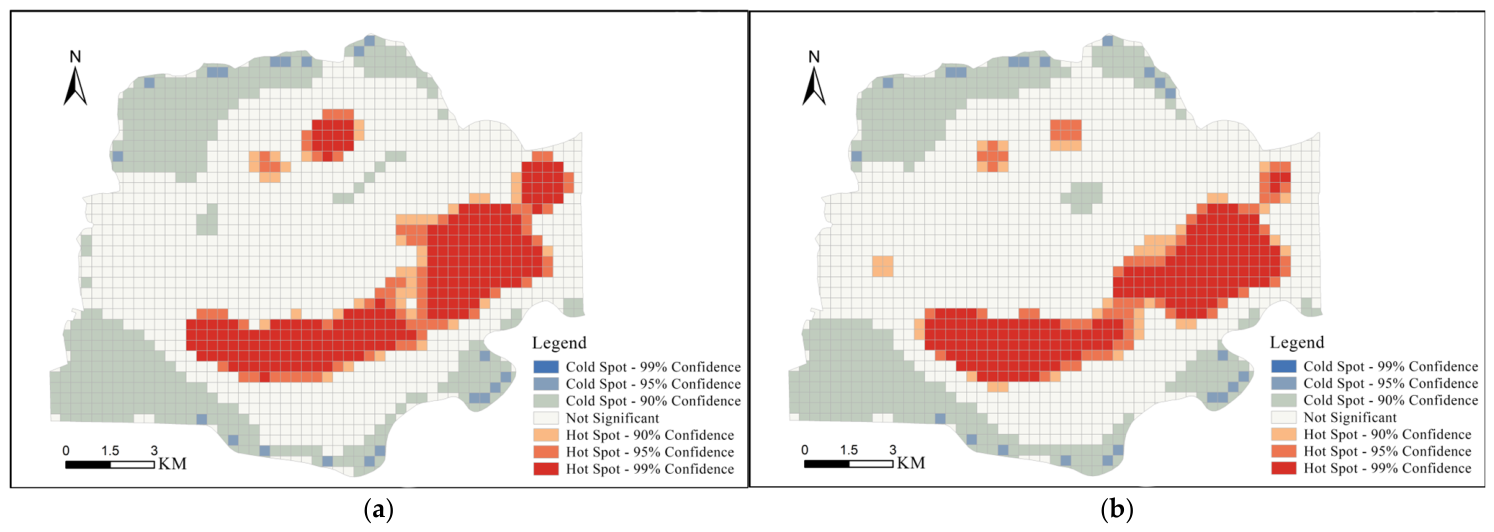
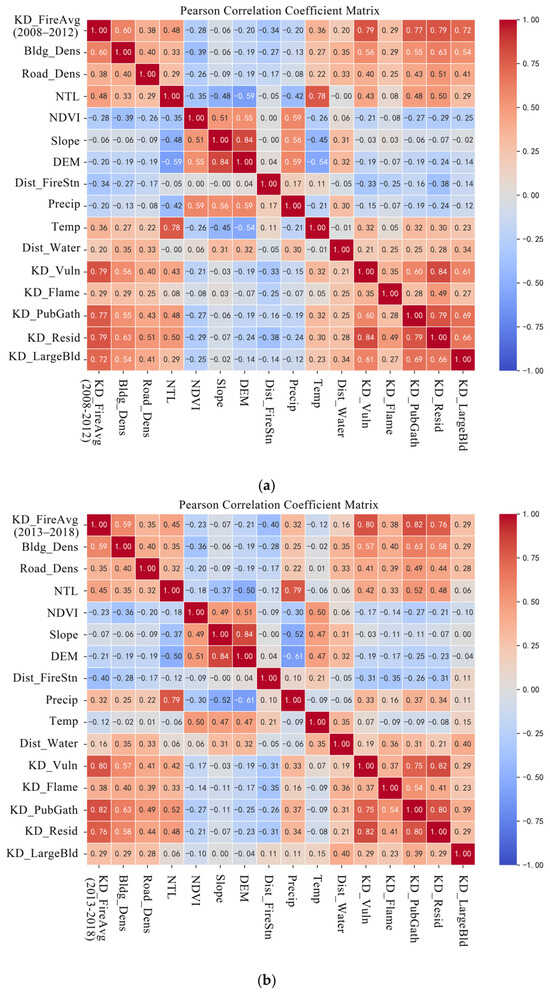
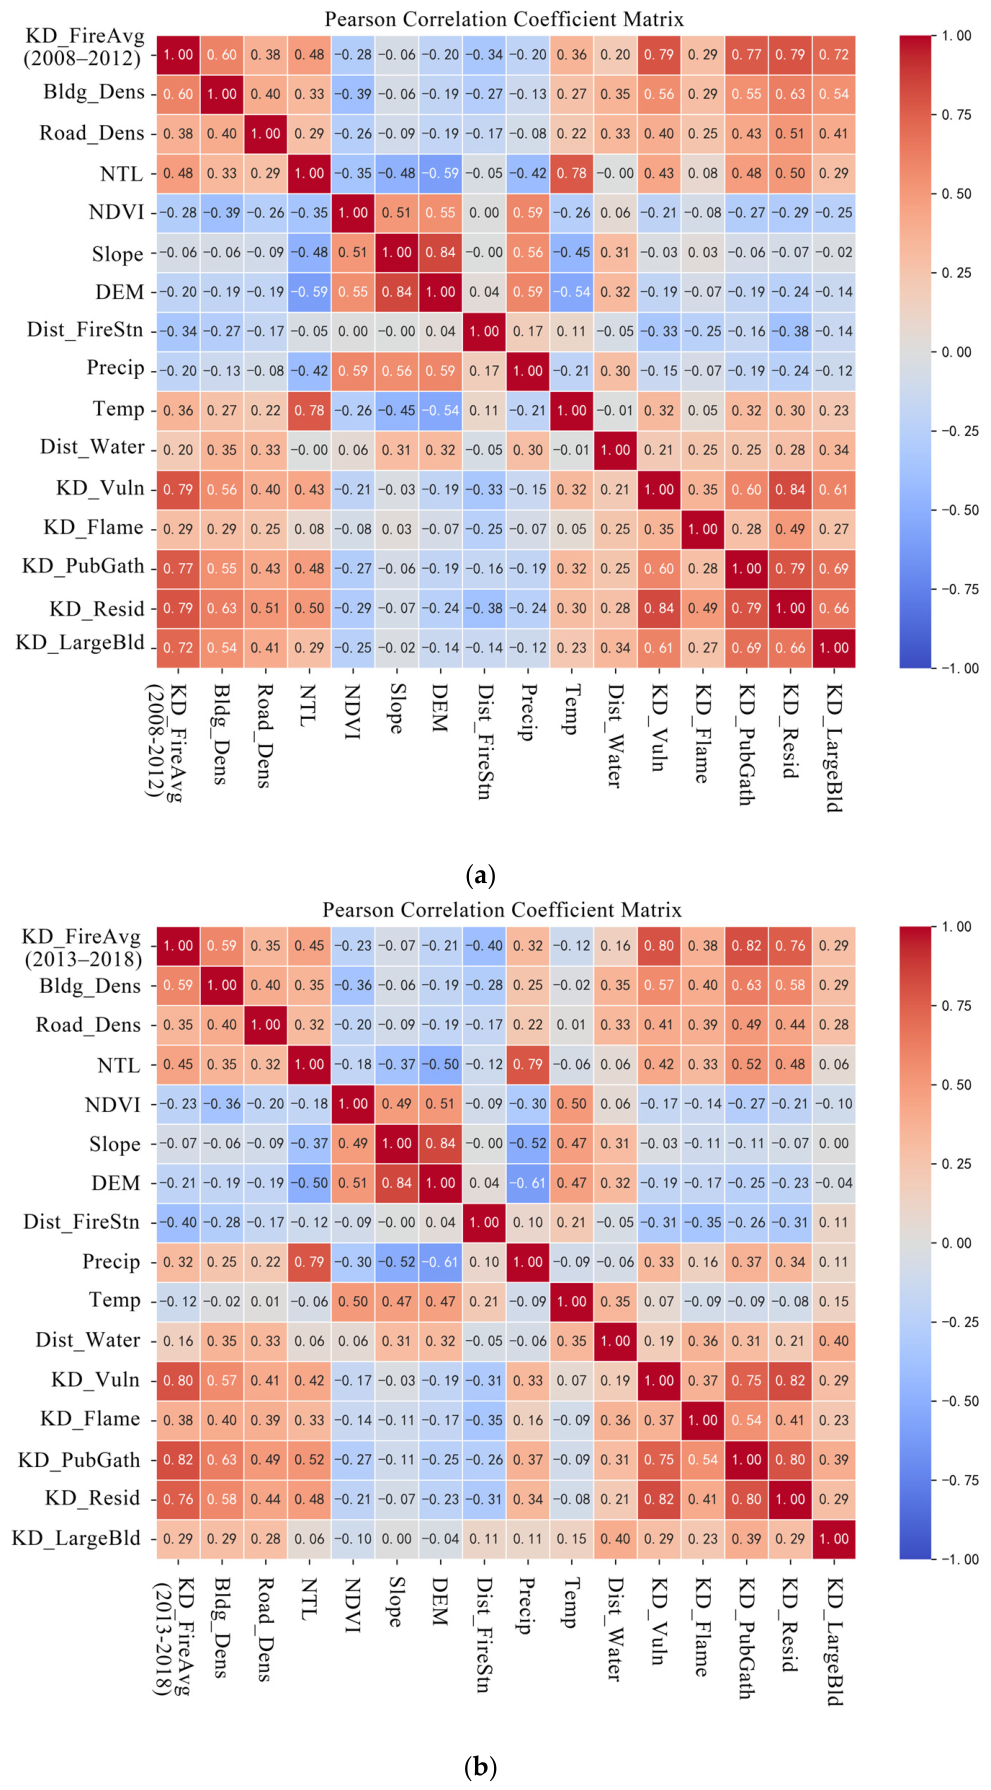
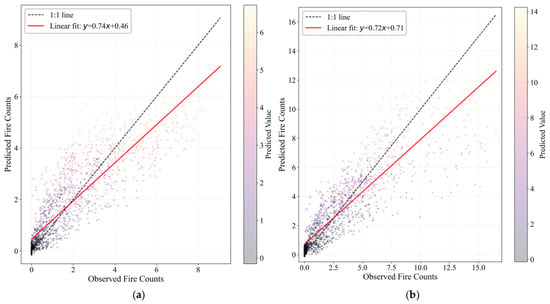
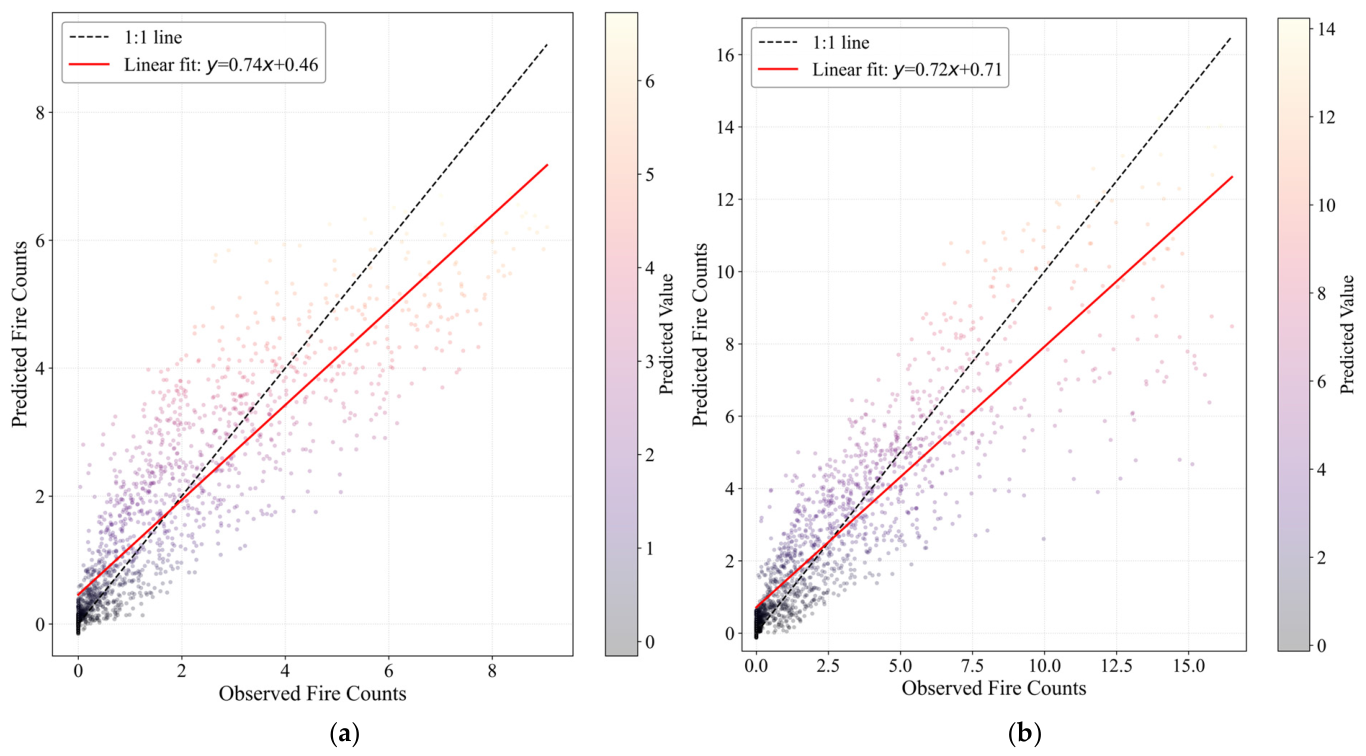
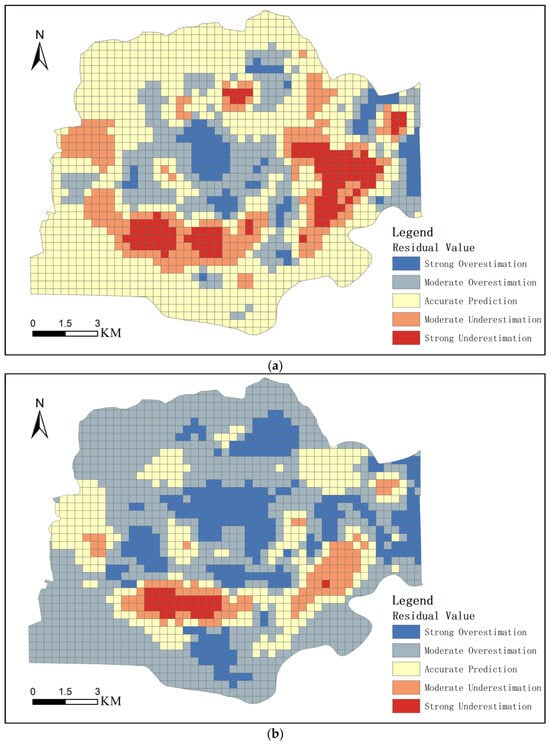
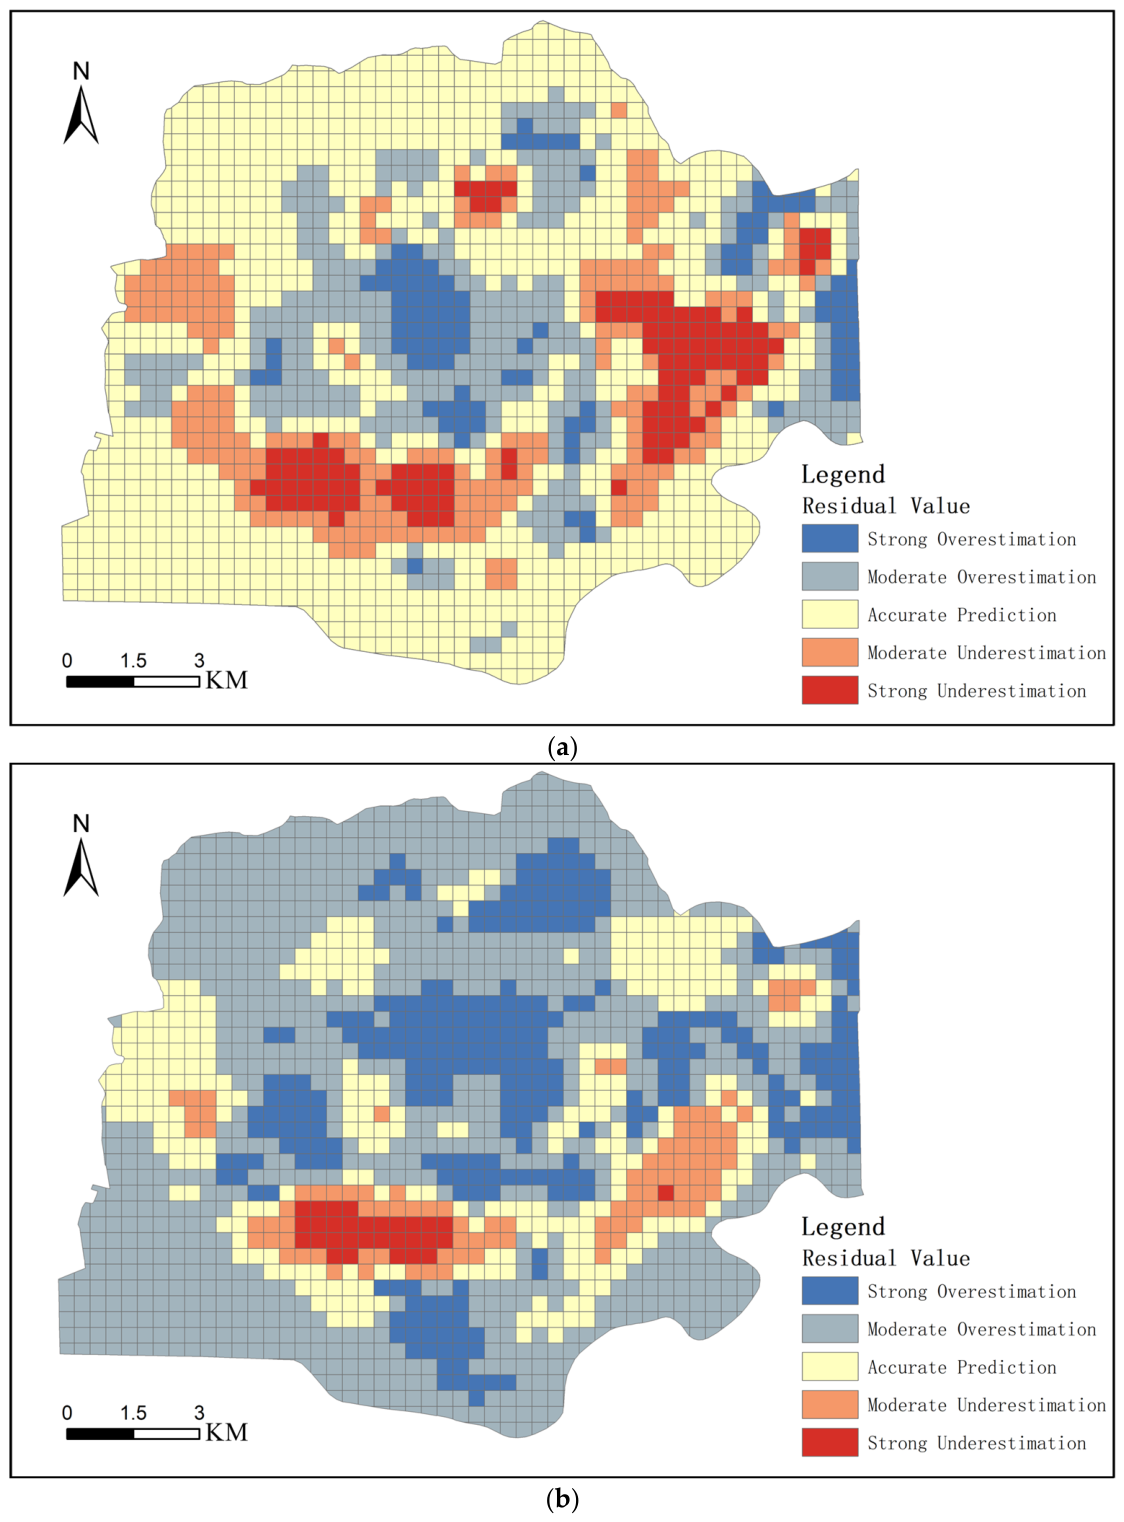
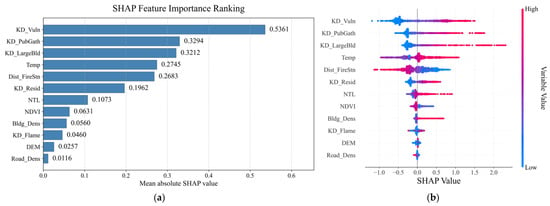
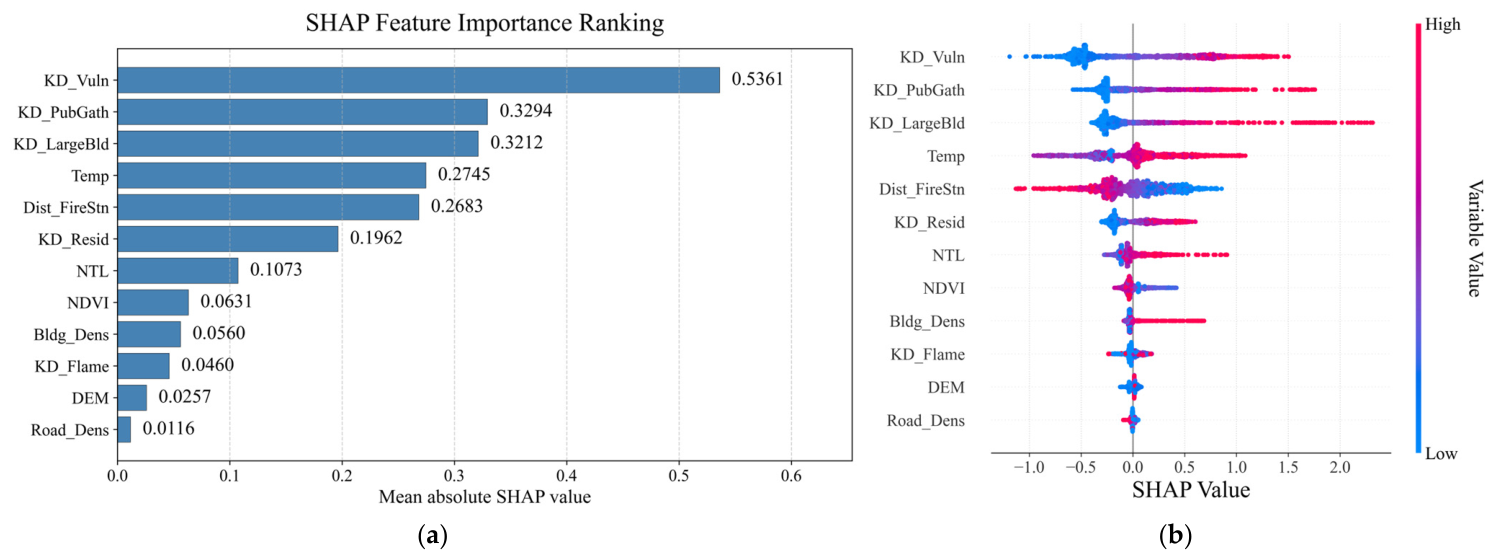
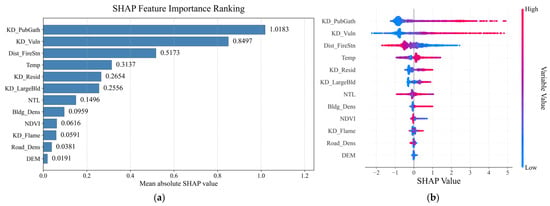
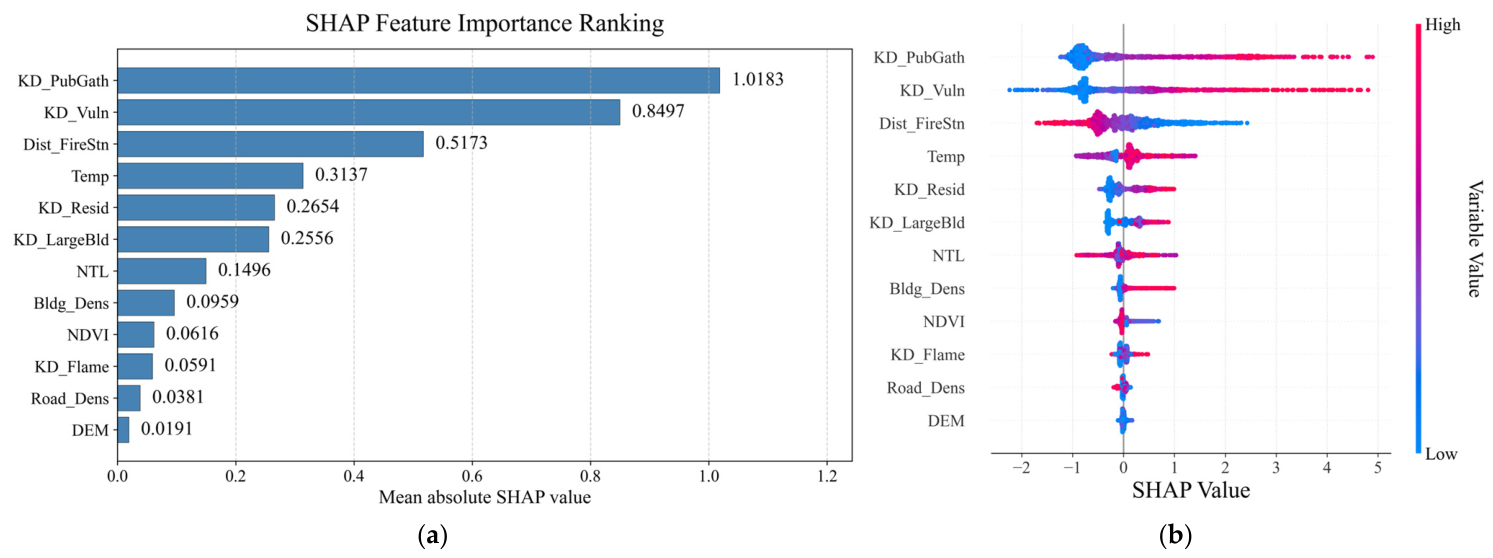
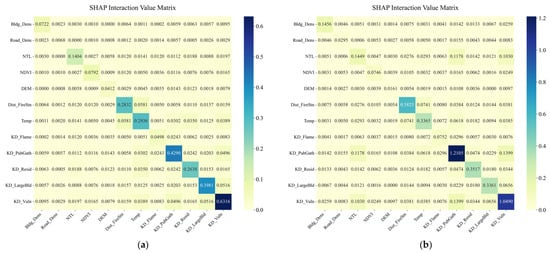
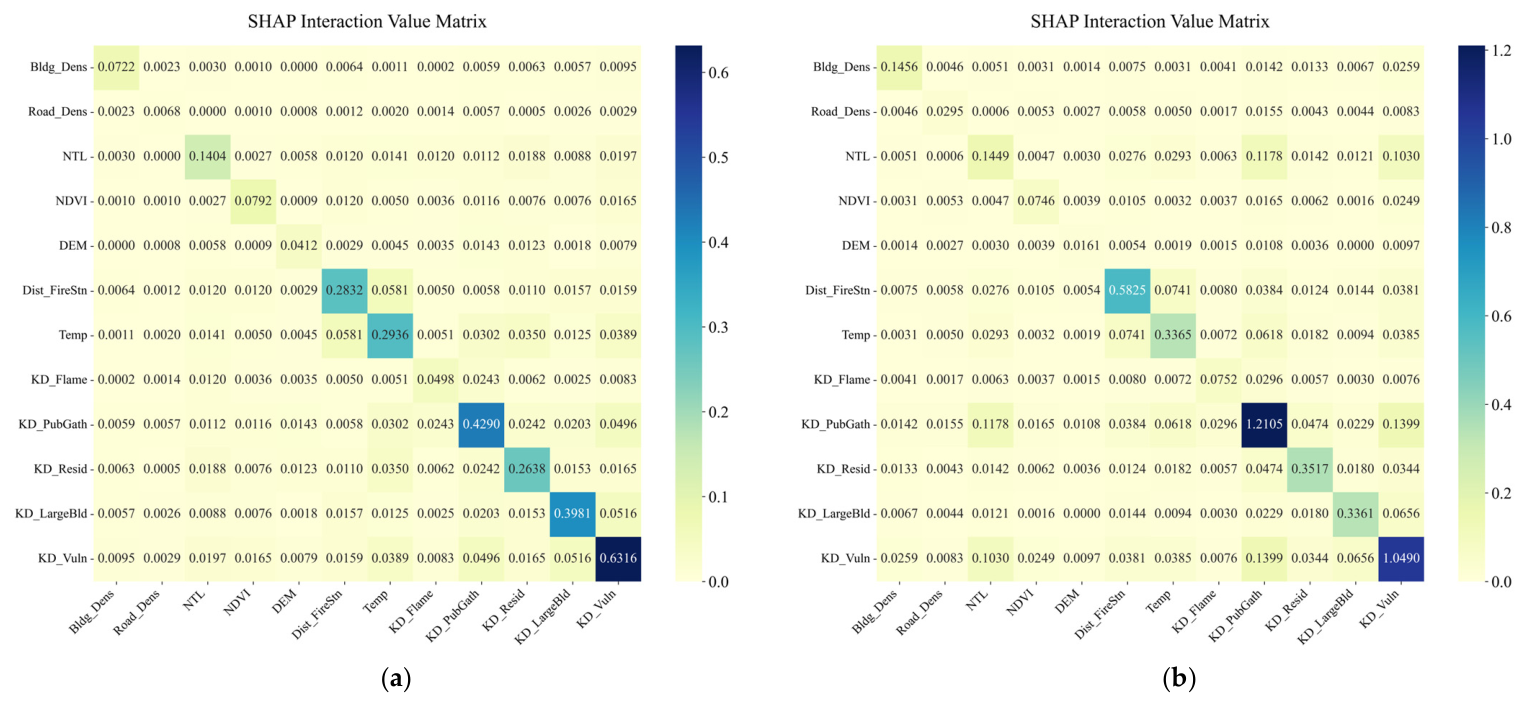
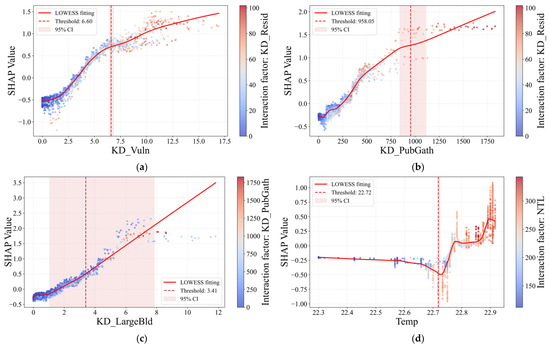
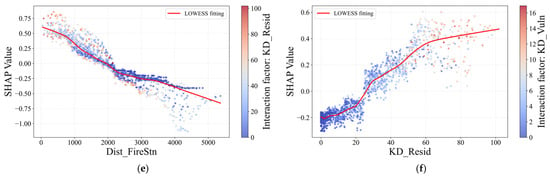
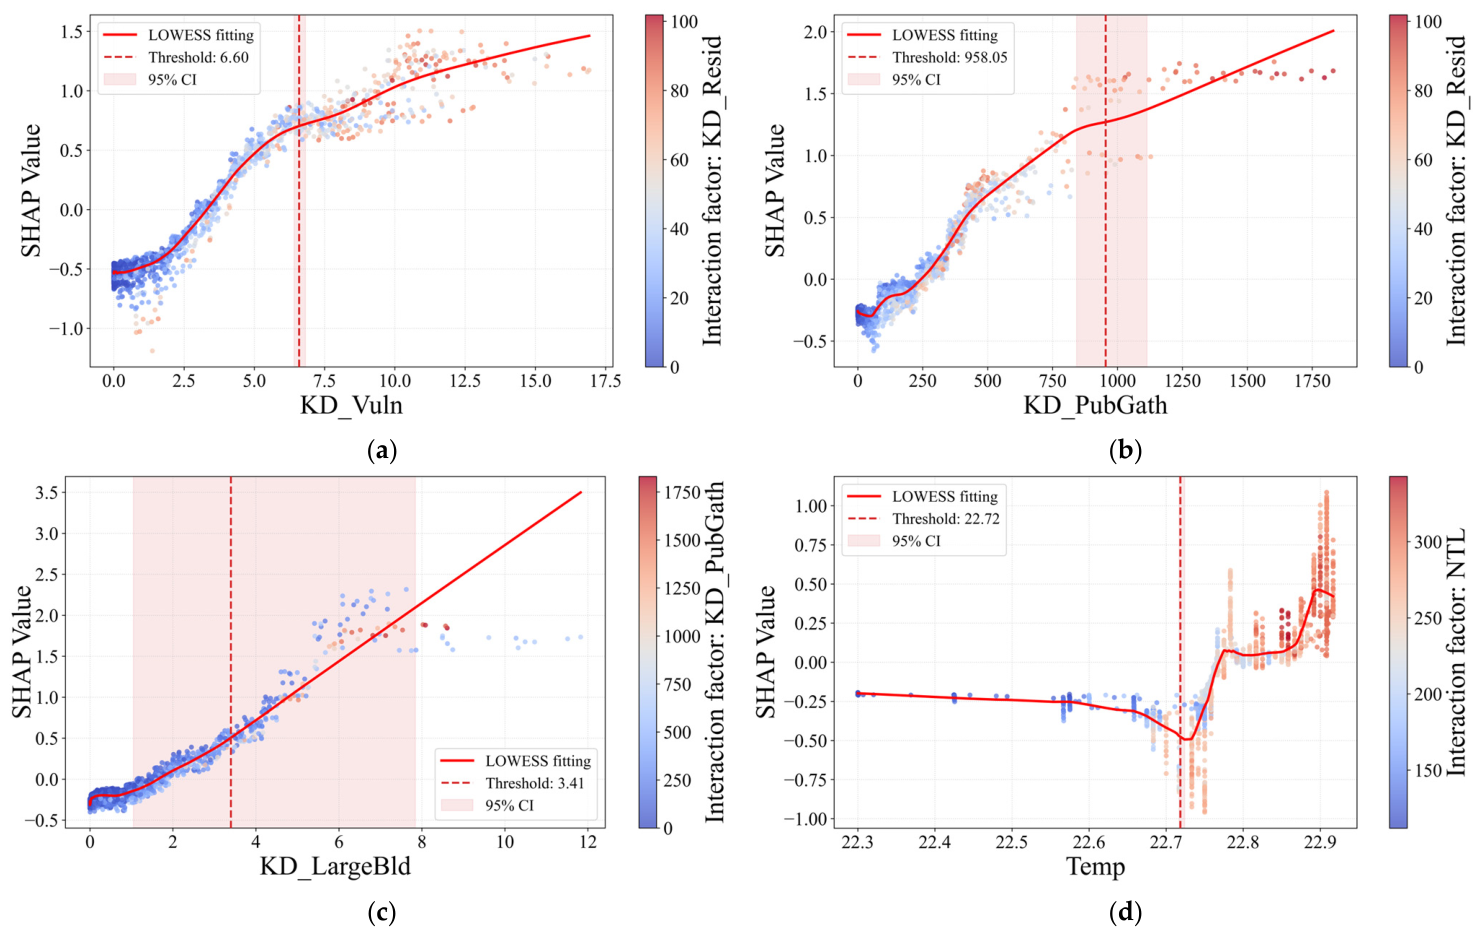
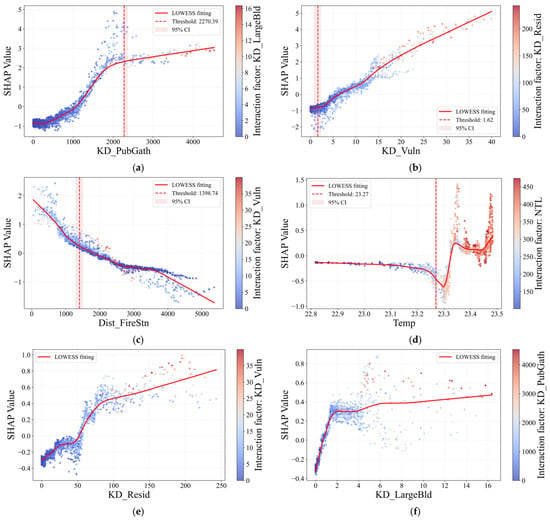
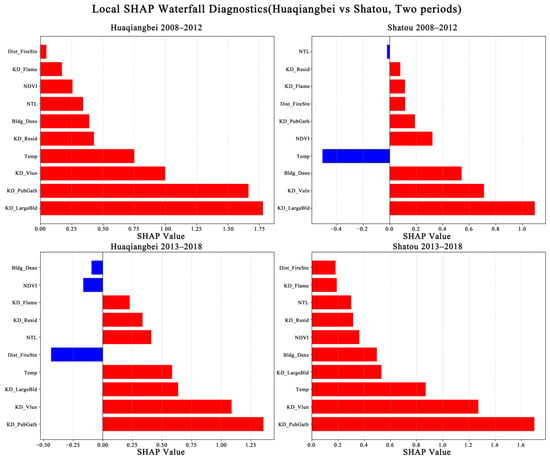

Disclaimer/Publisher’s Note: The statements, opinions and data contained in all publications are solely those of the individual author(s) and contributor(s) and not of MDPI and/or the editor(s). MDPI and/or the editor(s) disclaim responsibility for any injury to people or property resulting from any ideas, methods, instructions or products referred to in the content. |
© 2026 by the authors. Licensee MDPI, Basel, Switzerland. This article is an open access article distributed under the terms and conditions of the Creative Commons Attribution (CC BY) license.