


Abstract
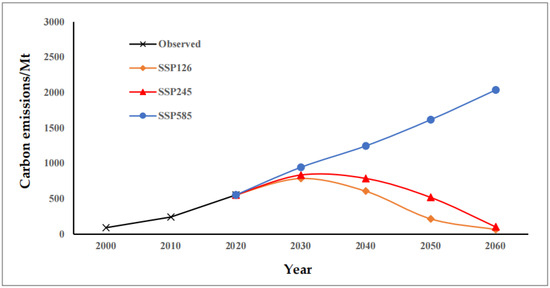
Understanding how land-use dynamics and carbon balance respond to socio-economic development and future climate change is essential. It supports the refinement of ecological management strategies in environmentally fragile regions and the achievement of China’s dual-carbon goals. This study aims to (i) analyze historical land-use evolution in Xinjiang from 2000 to 2020 and simulate its future dynamics from 2021 to 2060 under multiple SSP-RCP scenarios; (ii) quantify land-use carbon emissions and carbon storage using the coupled SD-PLUS-InVEST model; and (iii) evaluate the carbon balance through the carbon emission to storage ratio (CESR). This study coupled the system dynamics (SD) model, Patch-generating Land Use Simulation (PLUS) model, and InVEST model by integrating socio-economic statistics, IPCC climate data, and land-use datasets. The integrated model was used to simulate land-use evolution in Xinjiang from 2000 to 2060 and to quantify the spatiotemporal variation in land-use carbon emissions, carbon storage, and the CESR. Results indicated that carbon emission increased continuously from 2000 to 2020. Carbon emission showed an inverted U-shaped pattern from 2020 to 2060, with the peak occurring in approximately 2030 under the SSP1–2.6 and SSP2–4.5 scenarios, while it continued to rise from 2020 to 2060 under SSP585. Carbon storage exhibited an “initial increase followed by decline” from 2000 to 2020 but increased consistently from 2020 to 2060 under all scenarios. Xinjiang is a carbon-contributing area with the CESR less than 1 from 2000 to 2060. The CESR increased first and then decreased from 2020 to 2060 under SSP126 and SSP245, while it increased significantly under SSP585. The carbon contribution capacity in Xinjiang decreased under SSP585. These findings indicated that Xinjiang is a carbon contribution area, but its contribution function may be weakened by the expansion of energy-related land use and reduction in forest areas. Hence, it is necessity to uphold Xinjiang’s role within the national carbon balance framework by enhancing spatially differentiated land management, promoting the low-carbon transformation of the energy structure, and strengthening ecological restoration efforts to improve regional carbon sink capacity.
1. Introduction
A sustained rise in greenhouse gas emissions, with carbon dioxide being the dominant contributor, was caused by profound transformations in economic structure and rapid urban expansion since the Industrial Revolution [1]. Climate governance has emerged as a pressing global challenge, prompting countries worldwide to elevate it on their policy agendas and to pursue more effective pathways for mitigation and adaptation. China has actively responded to this challenge by announcing its “dual-carbon” goals of peaking carbon emissions and achieving carbon neutrality [2]. Consequently, extensive research has been conducted by domestic scholars on both carbon peaking and carbon neutrality [3,4]. Carbon reduction and carbon sequestration are the two key factors in achieving carbon neutrality [5]. Land-use change such as deforestation as the physical substrate of human activities constitutes a major driver of increased carbon emissions and reduced carbon storage. Land-use change also exerts substantial impacts on both carbon mitigation and carbon sequestration processes [6,7]. Therefore, estimating and analyzing the carbon emissions and carbon storage driven by land-use change can provide a scientific basis for understanding regional carbon cycles, support the development of land management and ecological restoration strategies to maximize carbon sequestration.
Most existing assessments of regional carbon balance rely solely on carbon emissions or on composite indicators such as economic–ecological coefficients [8,9]. Some studies either focus on quantifying carbon emissions, defined as the net difference between carbon sources and sinks, to evaluate carbon-neutrality potential [10], or delineate functional zones based on indicators such as economic contribution and ecological support capacity [11]. Chen et al. [12] explicitly conceptualized carbon balance as the equilibrium between regional carbon sinks and carbon emissions and proposed the carbon balance ratio (carbon source/sink) as the core indicator to diagnose carbon surplus or deficit within a region. The carbon emission to storage ratio (CESR) was defined as the ratio of carbon emissions to carbon storage; it provides an integrative measure of the balance between anthropogenic emission pressure and the carbon sequestration capacity of land-use types [13]. When carbon emissions exceed the carbon storage capacity within a region, the region can be set as a net carbon source; conversely, the region can be set as a net carbon sink. Examining the spatiotemporal dynamics of CESR offers deeper insights into the tension and resilience of regional human–environment systems and provides clearer guidance for formulating differentiated low-carbon management strategies. Li et al. [14] analyzed the variations in CESR using a coupled PLUS–InVEST modelling. However, the Markov model integrated within the PLUS model rarely consider the influence of the driving factors (such as climatic and socio-economic variables) on land use, which may influence the simulation of land use in the future.
Recent studies have witnessed substantial progress in integrating land-use prediction models with assessments of carbon emissions and carbon storage. Land-use prediction models generally fall into two categories—quantitative prediction models and spatially explicit simulation models—with commonly applied approaches including artificial neural networks (ANNs) [15], Markov models [16], and FLUS models [17,18]. In recent years, an increasing number of studies have departed from single-model frameworks and employed coupled modelling approaches to enhance the accuracy of land-use change simulations. Typical coupled model combinations comprise the CA–Markov, SD–FLUS, and SD–PLUS models, which have been extensively applied in regional land-use change analysis. Marwa Waseem A. et al. [19] employed the CA-Markov model to predict land-use types in the northwestern coastal desert of Egypt. MA et al. [20] utilized the SD-FLUS model to simulate the future land-use distribution pattern of Changsha City by setting different scenarios. Zhang et al. [21] applied the coupled SD-PLUS model to simulate the spatiotemporal distribution pattern of land use in the Chinese Tianshan Mountainous in the future. Methods for estimating land-use carbon emissions primarily comprise plot-based inventory surveys, direct measurement techniques, and emission factor approaches [22]. Meng et al. [23] calculated the carbon emissions in China from 1980 to 2020 using the carbon emission coefficient method. Carbon storage is typically quantified using field measurement, remote sensing survey, and process-based or statistical modelling technique [24]. Wu et al. [25] employed the InVEST model to calculate and analyze the spatiotemporal pattern of carbon storage in Dalian City. The carbon emission factor method, the InVEST model, and the PLUS model have become widely used due to their relatively low data requirements, robust accuracy, and strong applicability in predicting land-use carbon emissions and carbon storage dynamics [26,27]. Li et al. [28] and Jiang et al. [29] coupled the PLUS model with the InVEST model to calculate and predict the carbon storage in the Bosten Lake Basin and the Guangxi Beibu Gulf Economic Zone, respectively. However, these studies often deviated from actual conditions due to the limitation of subjectively defined scenarios for ecological conservation and economic development. CMIP6 provides diverse future climate scenarios which offer potential pathways for future land-use development patterns. The SD model can integrate climate and socio-economic drivers and combine with various future climate scenarios, which can better capture the systemic characteristics of land-use change. The innovations of this study are as follows: (1) the SD model was incorporated to construct an SD-PLUS coupled model to simulate the land-use demand driven by socioeconomic and climatic factors; (2) the SSP-RCP scenarios were adopted by replacing traditional subjective scenarios to make the simulation results more objective; and (3) the carbon emission peaks under different scenarios were identified to compare with China’s dual-carbon goals.
Carbon storage variation in arid and semi-arid regions plays an important role in regulating the global carbon cycle. As a representative arid region, Xinjiang provides essential empirical evidence for evaluating carbon-sink potential in arid environments. Systematic observation and modelling of carbon storage not only fill the long-standing scarcity of carbon-flux data in arid regions but also improve the parameterisation and accuracy of global carbon budget assessments. In addition, the practices of carbon governance in Xinjiang may offer valuable insights for developing carbon compensation and trading mechanisms tailored to arid regions. The contribution of Xinjiang to China’s carbon balance is substantial [14]. However, the fragile and structurally simple ecosystems of Xinjiang are confronted with mounting pressures from rapid population growth and economic development. Whether the region can maintain its carbon-sink function has become a critical question, highlighting the need for accurate projections of future carbon emissions and carbon storage. Based on the research background, gaps, and regional needs, the specific research objectives of this study were: (1) analyzing historical land-use evolution in Xinjiang and simulate its future dynamics under multiple SSP-RCP scenarios; (2) quantifying land-use carbon emissions and storage using the coupled SD-PLUS-InVEST model; and (3) evaluating the carbon balance through CESR. Therefore, this study takes Xinjiang as the research area to evaluate the region’s carbon emissions and carbon storage under land use and climate change. The socio-economic factors (population, GDP) and climatic factors (temperature, precipitation) were integrated into a system dynamics framework to construct feedback loops to simulate land-use dynamics under multiple climate scenarios. Based on these findings, the study proposed low-carbon land-use optimization strategies to support regional sustainability and China’s dual-carbon goals. This study provided scientific supports for low-carbon land-use planning, carbon-market construction, and the implementation of Nationally Determined Contributions (NDCs) in Belt and Road regions and other ecologically fragile areas.
2. Materials and Methods
2.1. Study Area
The Xinjiang Uygur Autonomous Region (34°25′–48°10′ N, 73°40′–96°18′ E) is located in northwestern China at the core of the Eurasian continent. Covering approximately 1.66 million km2 and bordering eight countries, Xinjiang hosts a diverse geomorphology, comprising the Altai Mountains in the north, the Kunlun Mountains in the south, and the Junggar and Tarim Basins. The Tianshan Mountains traverse the central part of the region, forming a natural divide between northern and southern part of Xinjiang. The region is characterized by a typical continental climate with low precipitation and high aridity, resulting in a fragile ecological environment and complex patterns of land use.
2.2. Data Source
The data used in this study include land-use datasets, carbon emission data, socio-economic and climate variables for the SD model, SSP–RCP scenario data, and spatial datasets for the PLUS model. Detailed data sources are provided in Table 1. Land-use data were obtained from the China Land Cover Dataset (CLCD) [30], developed by Yang Jie and Huang Xin of Wuhan University. The land-use data had a spatial resolution of 30 m × 30 m. The land-use dataset was reclassified into six categories, i.e., cultivated land, forest, grassland, water, unused land, and construction land, and was subsequently resampled to a 1 km × 1 km grid. The land-use data from 2011 to 2020 were statistical data which were used in the SD model. Population in the future were obtained from kilometre-scale gridded population projections for China under the Shared Socioeconomic Pathways (SSPs) from 2010 to 2100 [31]. GDPs were derived from the global 1/12° gridded SSP1–5 GDP dataset developed by Murakami et al. [32]. Temperature and precipitation projections were sourced from the CMIP6 climate datasets released by the IPCC. Road networks were acquired from the Geographical Information Professional Knowledge Service Platform (Kmap) (https://www.webmap.cn, accessed on 20 January 2026).
Table 1.
Data sources.
2.3. Methods
2.3.1. Quantitative Land-Use Projections
The SD model enables the effective simulation of causal relationships among natural and anthropogenic factors within complex systems by incorporating stocks, flows, and feedback loops. It not only captures the nonlinear feedback mechanisms among system components but also performs robustly in predicting behavioural changes and land system trajectories under various hypothetical scenarios [33]. A system flow diagram constructed from the causal relationships among subsystem variables provides an intuitive representation of their interactions and feedback structures. Furthermore, structural equation modelling quantifies the relationships among variables, offering a rigorous description of their mutual influences within the system [34].
- Model Construction
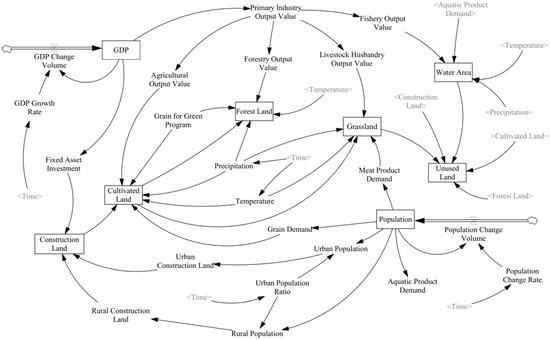
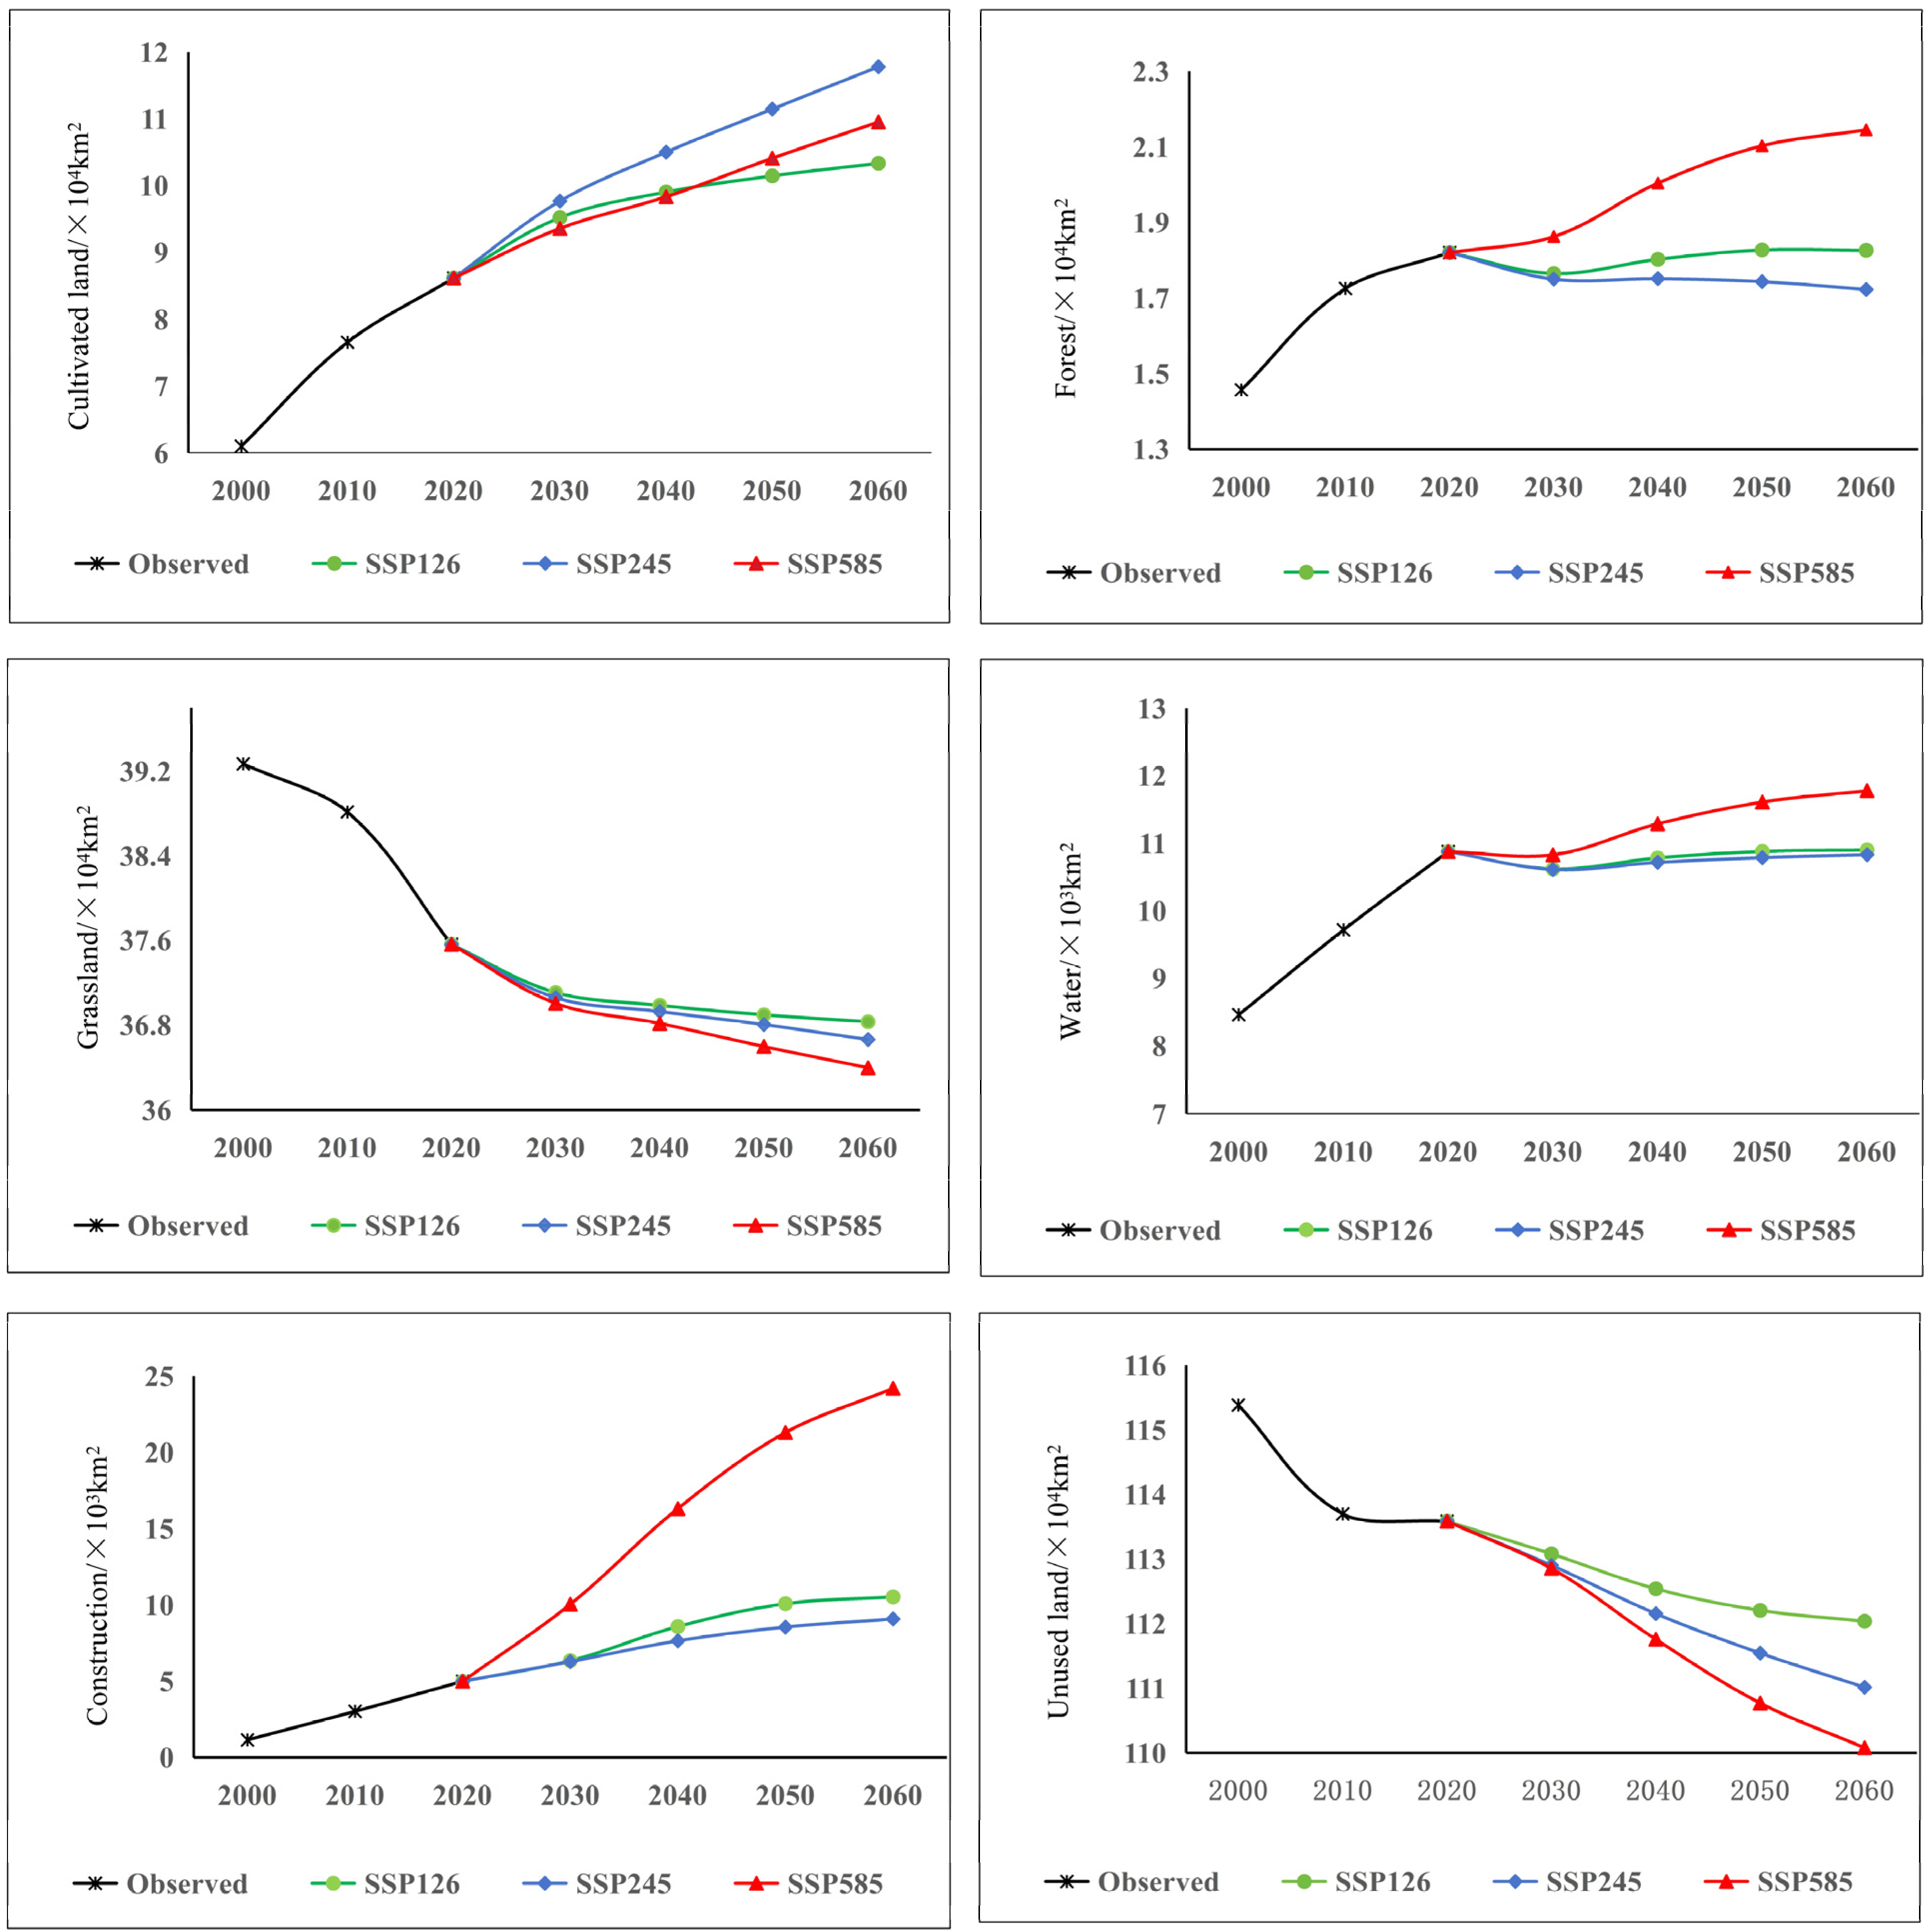
Building on previous studies [21,35], this study used Vensim PLE to construct a land system model for Xinjiang (Figure 1). The model integrated population, economic, climate, and land subsystems, and used population, GDP, temperature, and precipitation as the main driving variables to simulate quantitative land-use changes under different scenarios. Due to data limitations and accessibility constraints, Xinjiang was defined as the spatial boundary of the SD model. The temporal extent covered from 2011 to 2060, caused by the complete and consistent socio-economic data, was available from 2011. The period from 2011 to 2020 was used for calibration period and that from 2021 to 2060 was used for projection. The model operated at an annual time step. The main equations were given in the Appendix A (Table A1).
Figure 1.
Flow-stock diagram of the land system in Xinjiang.
- 2.
- Model validation
This study evaluated the performance of the SD model using relative error, calculated as follows:
where RE denoted relative error, (km2) represented the simulated area of land-use category , and (km2) denoted the actual area of land-use category . A larger relative error indicates a greater deviation between actual and simulated values, reflecting weaker model performance, whereas a smaller relative error signifies closer agreement and thus better simulation accuracy.
- 3.
- Parameter settings for multiple land-use scenarios
This study used SSP-RCP scenario combinations to project future land-use quantities in Xinjiang. The SSP-RCP framework, which was employed in CMIP6 (Coupled Model Intercomparison Project Phase 6) and related studies, integrates Shared Socioeconomic Pathways (SSPs) with Representative Concentration Pathways (RCPs) [36]. Three representative scenarios, i.e., SSP126, SSP245, and SSP585, were selected and used in this study. SSP126 (SSP1-RCP2.6) represents low emissions with strong mitigation and a sustainable development pathway. SSP245 (SSP2-RCP4.5) reflects moderate emissions with intermediate mitigation under current trends. Also, SSP585 (SSP5-RCP8.5) corresponds to high emissions, energy-intensive development, and high radiative forcing. By 2100, radiative forcing was projected to reach approximately 2.6, 4.5, and 8.5 W/m2 under SSP126, SSP245, and SSP585, respectively. Detailed parameter settings are provided in Table 2.
Table 2.
Scenario simulation parameter settings.
2.3.2. Spatial Prediction of Land Use
The PLUS model integrates the LEAS approach and the CARS model. The LEAS approach is based on land-use expansion analysis strategies, while the CARS model adopts multi-type random patch seeds. This combination significantly improves spatial simulation accuracy [37].
- LEAS Module
The LEAS module examines the influence of various land-use drivers using two-phase land-use datasets and employs a random forest algorithm to estimate the development probability for each land-use type. The computation is expressed as follows:
In the formula, represents the growth probability of land-use type at spatial unit . x is a vector composed of driving factors. denotes the land prediction type of the nth decision tree for vector . is the number of decision trees. takes values of 1 or 0, where = 1 indicates conversion from other land types to land type k, and = 0 indicates no conversion to land type .
- 2.
- CARS Module
The CARS module uses initial land-use data to configure parameters such as conversion restriction zones, patch generation thresholds, land-use conversion cost matrices, future demand for each land-use type, and neighbourhood weights. By combining random seed generation with a threshold reduction mechanism, it dynamically simulates the autonomous formation of land-use patches under constraints defined by the development probability of each land-use type. The process is expressed as follows:
where represents the overall probability of land-use type . is the growth probability of land-type on grid cell . indicates the spatial influence of other grid cells on cell . is the adaptive inertia coefficient, reflecting the impact of future land demand on land type .
- 3.
- Accuracy Validation
This study used the land-use data in 2000 and 2010 as inputs to forecast the spatial distribution of land use in 2020 and subsequently validated the model’s accuracy by comparing the simulation results with the observed land-use distribution in 2020.
2.3.3. Calculation of Carbon Emissions
- Direct Carbon Emission Calculation
The IPCC carbon emission coefficient method was used in this study to calculate the direct carbon emissions from land use. The specific parameters and formulas were as follows:
where (t) represents the direct carbon emissions from land use. (km2) represents the area of land-use type . represents the carbon emission coefficient for land-use type . The selection of carbon emission coefficients is critical for ensuring the accuracy of carbon emission accounting. Referring to the research findings of Li et al. [14], the carbon emission coefficients for water, unused land, grassland, cultivated land, and forest were −0.253, −0.005, −0.021, 0.469, and −0.623 respectively. These coefficients had been widely applied and validated in Xinjiang and other arid regions of northwest China. Compared with the international literature, these coefficients were consistent with those commonly used in arid and semi-arid regions. Therefore, the selected coefficients were regionally appropriate and reliable in Xinjiang, which can effectively guarantee the reliability of this study.
- 2.
- Indirect Carbon Emissions Calculations for 2000–2020
Indirect carbon emissions were estimated using provincial apparent carbon emission data from CEADs. In compiling these data, CEADs collected energy consumption information for 17 fossil fuels across 47 socio-economic sectors. IPCC emission factors were adjusted based on field measurements and the relevant literature in China. Carbon emissions were then calculated and aggregated by sector and fuel type. The data were cross-validated using statistical yearbooks, enterprise-level emissions records, field measurements, and satellite remote sensing to ensure accuracy and scientific reliability. The CEAD carbon emission calculation was expressed as follows:
where represents indirect carbon emissions. is the emissions from energy combustion activities. indicates emissions from industrial production processes. represents the consumption of fuel . is the carbon dioxide emission factor for fuel . represents the production volume of product , and represents the process emission factor per unit of product .
- 3.
- Projection of Future Indirect Carbon Emissions
The STIRPAT model was used in this study to project future indirect carbon emissions. Derived from the IPAT model, STIRPAT overcomes the linear constraints of IPAT and allows for interactions among variables [38]. The model is formulated as follows:
where is the environmental impact. represents population size. is per capita resource consumption, and indicates the level of technological development. is the model coefficient, while , , and are the estimated parameters for , , and , respectively. represents the error term. To avoid multicollinearity among factors, this study uses three indicators—population, GDP, and carbon emission intensity—to project future carbon emissions. A lower carbon emission intensity reflects higher technological advancement. Population and GDP projections are aligned with the SSP-RCP scenarios. Carbon emission intensity is based on the baseline pathway (SSP245), following the Opinions on Comprehensively, Accurately and Fully Implementing the New Development Philosophy to Advance Carbon Peaking and Carbon Neutrality, the Autonomous Region’s Implementation Plan for Synergistic Pollution Reduction and Carbon Emission Reduction, and the Xinjiang Uygur Autonomous Region Carbon Peaking Implementation Plan. The rate of change is then adjusted to derive projections under SSP126 and SSP585 [39].
2.3.4. Carbon Storage Estimation
Due to its advantages of low data demand and high accuracy, the InVEST model has been widely applied in carbon storage assessment [40,41]. Accordingly, this study adopted the carbon storage module of the InVEST model to quantify carbon storage in the study area. Temperature and precipitation jointly determine the spatial heterogeneity of carbon density. The carbon density was corrected by using these two climatic factors to effectively improve the accuracy of carbon storage estimation in arid areas. The carbon density parameters were obtained from previous studies in arid regions [14,42,43]. The specific calculation and revision formulas were as follows:
where (t) denotes total carbon storage. , , , and (t·hm−2) represent biomass carbon density, underground biomass carbon density, soil organic carbon density, and dead organic carbon density, respectively. (hm2) represents the area of land-use type . (t·hm−2) is the soil carbon density derived from annual precipitation. and (t·hm−2) denote biomass carbon density derived from annual precipitation and annual mean temperature respectively. MAP (mm) denotes annual mean precipitation. MAT (°C) denotes annual mean temperature. and represent precipitation factor and temperature factor correction coefficients for biomass carbon density, respectively. C′ and C″ denote carbon density data for Xinjiang and China, respectively. and denote biomass and soil carbon density correction coefficients, respectively.
2.3.5. Calculation of CESR
The CESR was used to evaluate the carbon emission pressure and carbon storage capacity in the study area. The formula of CESR was as follows:
when CESR ≤ 0, the regional carbon stock can fully offset carbon emissions with an extra carbon sequestration capacity; thus, the region can be classified as strong carbon sink zones. When 0 < CESR < 1, the regional carbon stock exceeds carbon emissions, maintaining a carbon sink function but with limited sequestration potential, corresponding to weak carbon sink zones. When CESR = 1, the regional carbon stock and carbon emissions are in a balanced state. However, reaching an exact carbon balance is difficult; therefore, regions with a CESR = 1 are also categorized as weak carbon sink zones. If CESR > 1, regional carbon emissions exceed the sequestration capacity of the carbon stock, and these areas can be defined as carbon source zones.
3. Results
3.1. Spatiotemporal Evolution of Land Use
Simulations of land use from 2011 to 2020 were performed using the land system model and compared with observed land-use areas. The relative errors for selected years were shown in Table 3. The relative errors for all six land-use categories were lower than 10%, indicating that the model achieved satisfactory performance.
Table 3.
Relative errors in Xinjiang in 2012, 2014, 2016, 2018 and 2020.
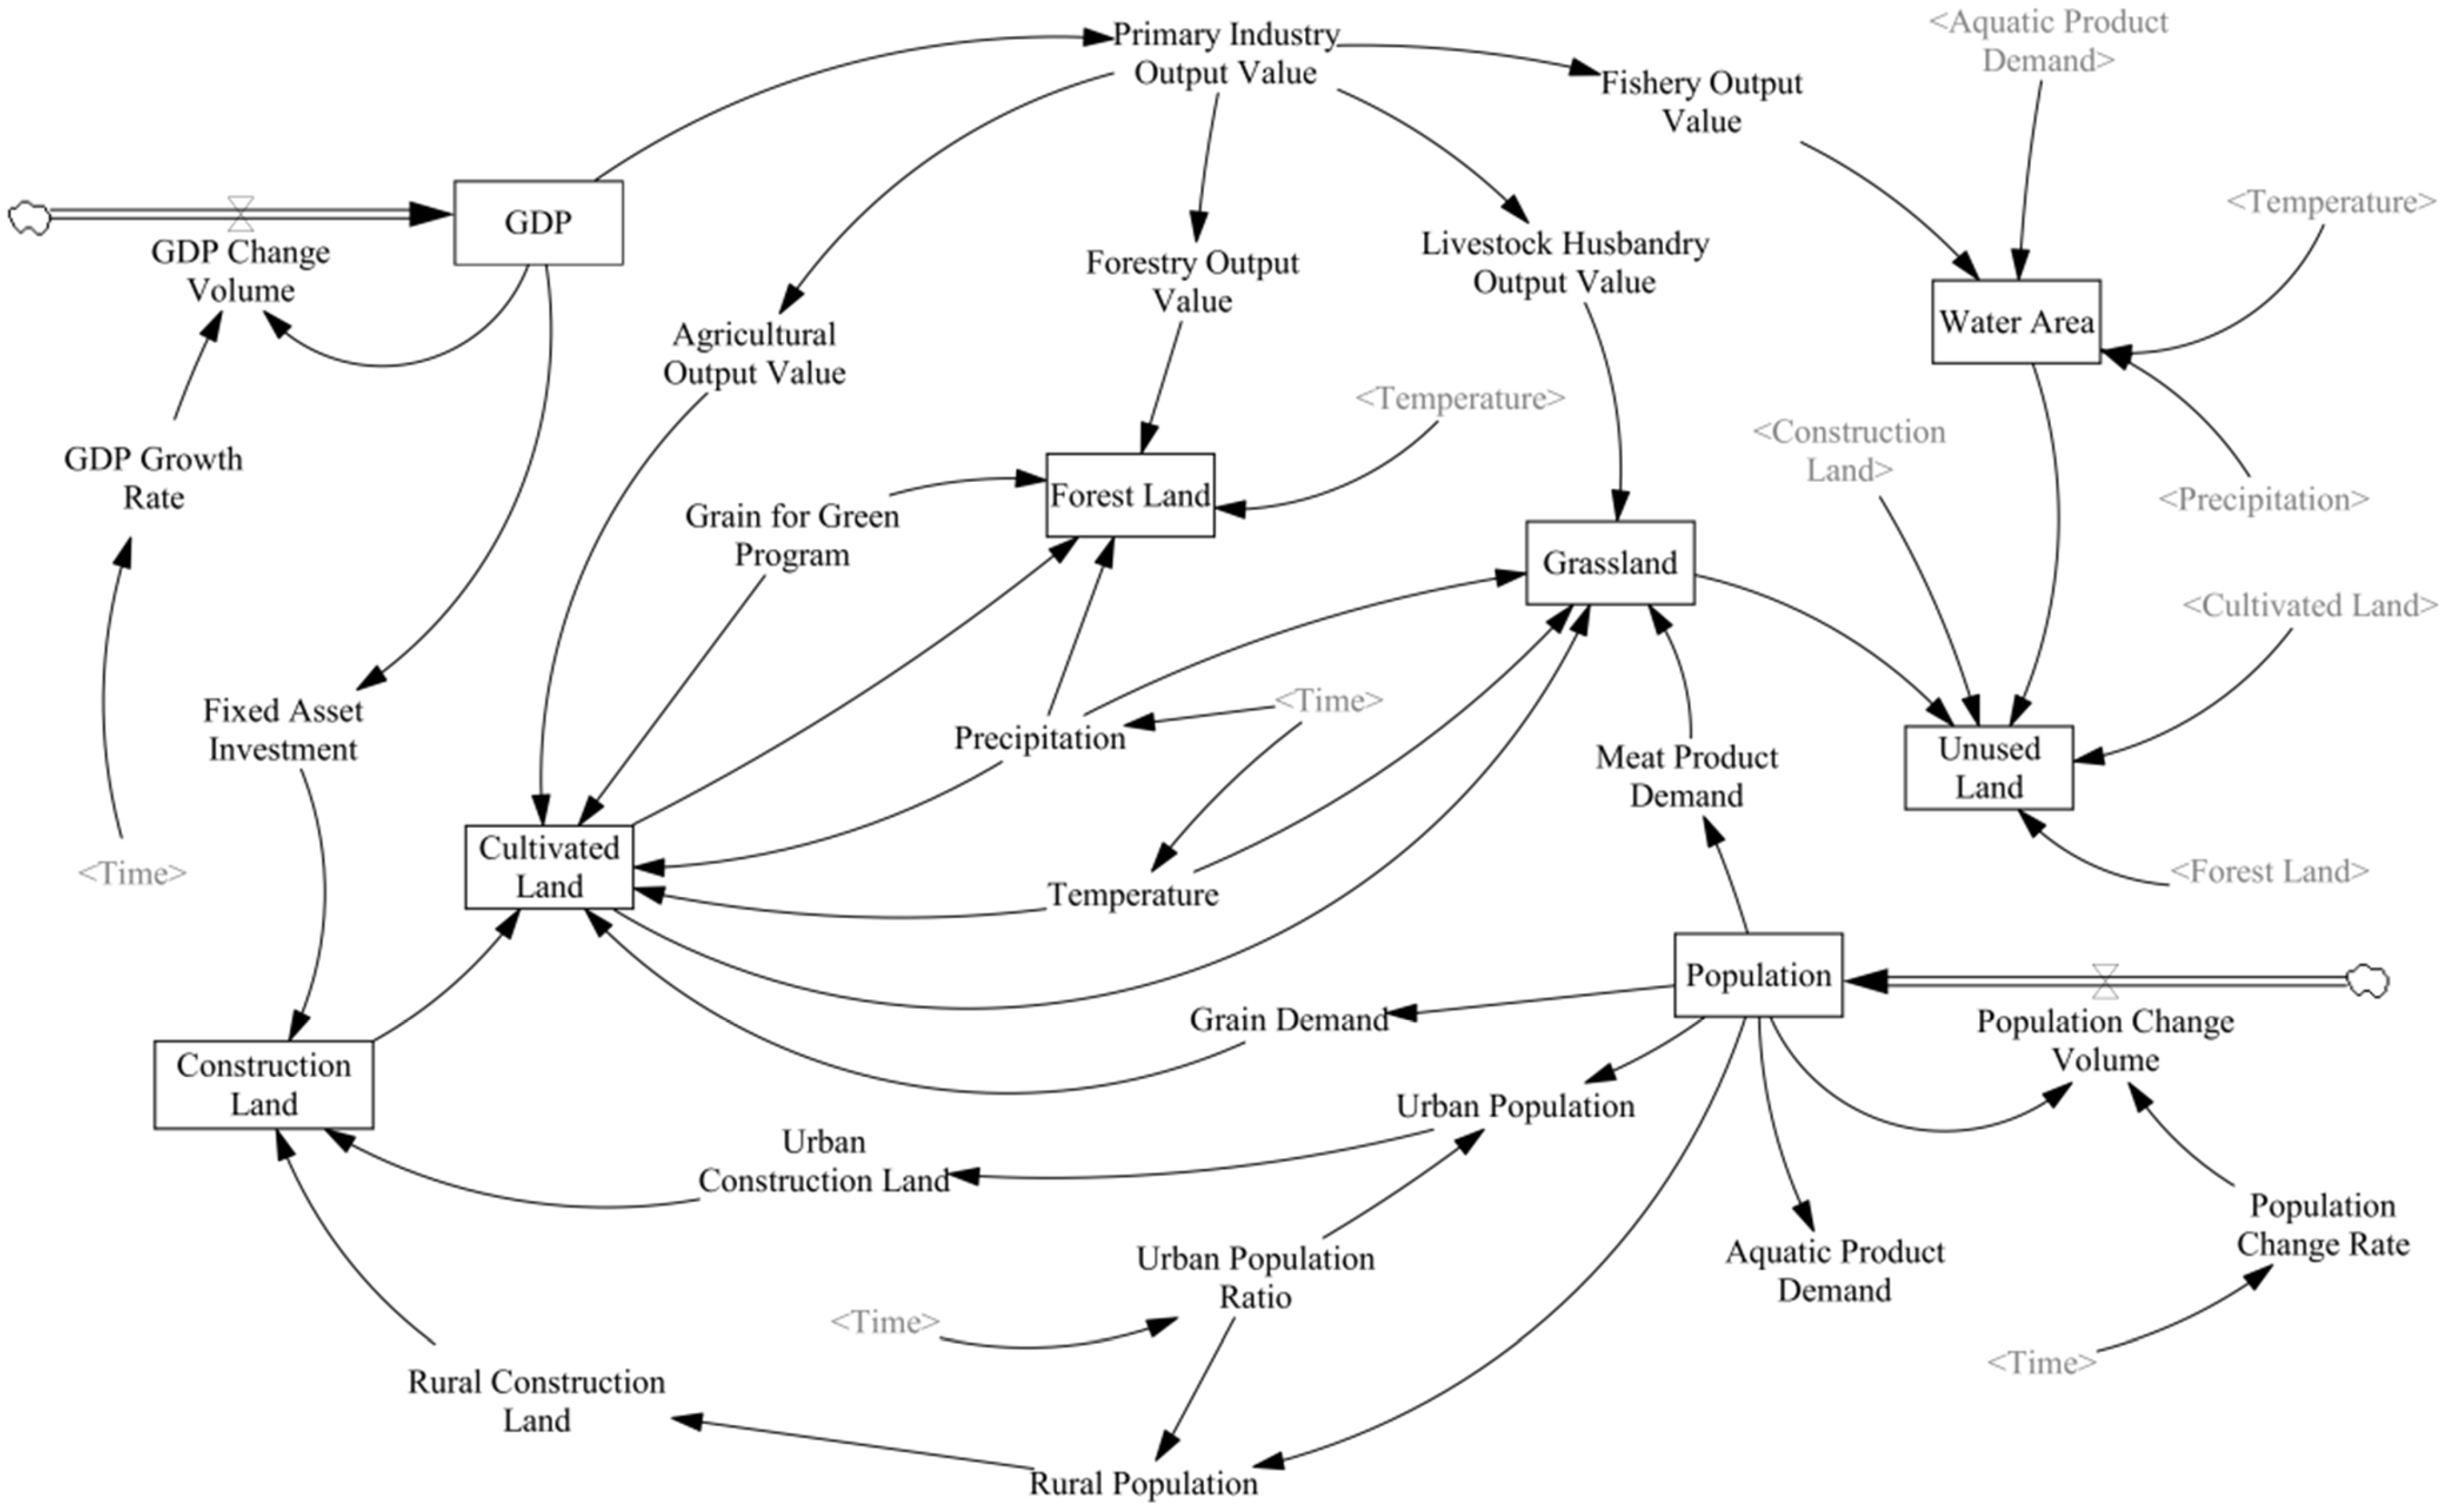
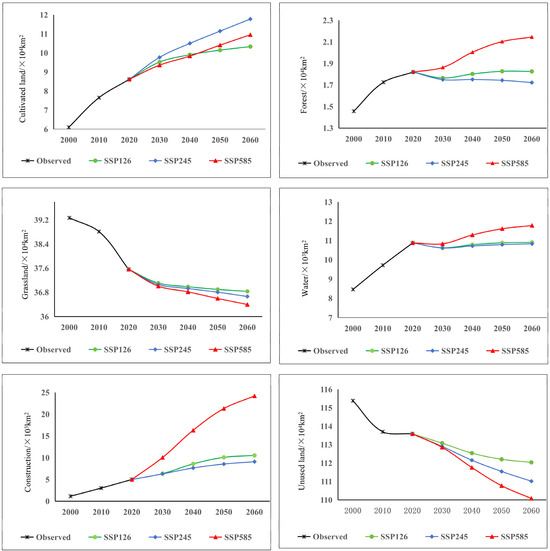
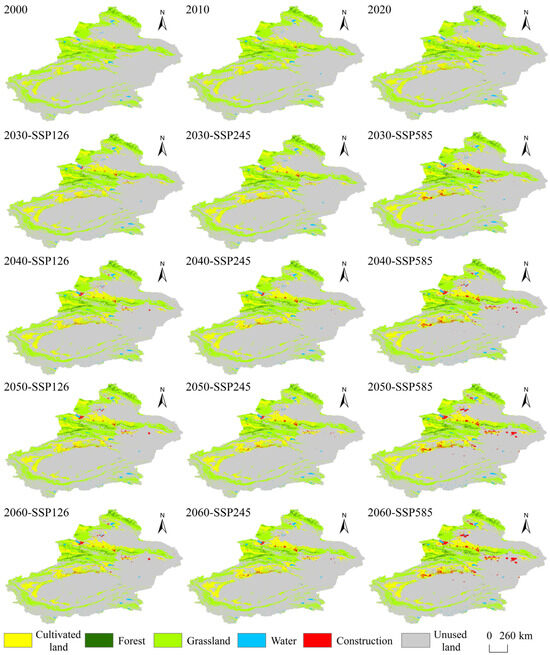
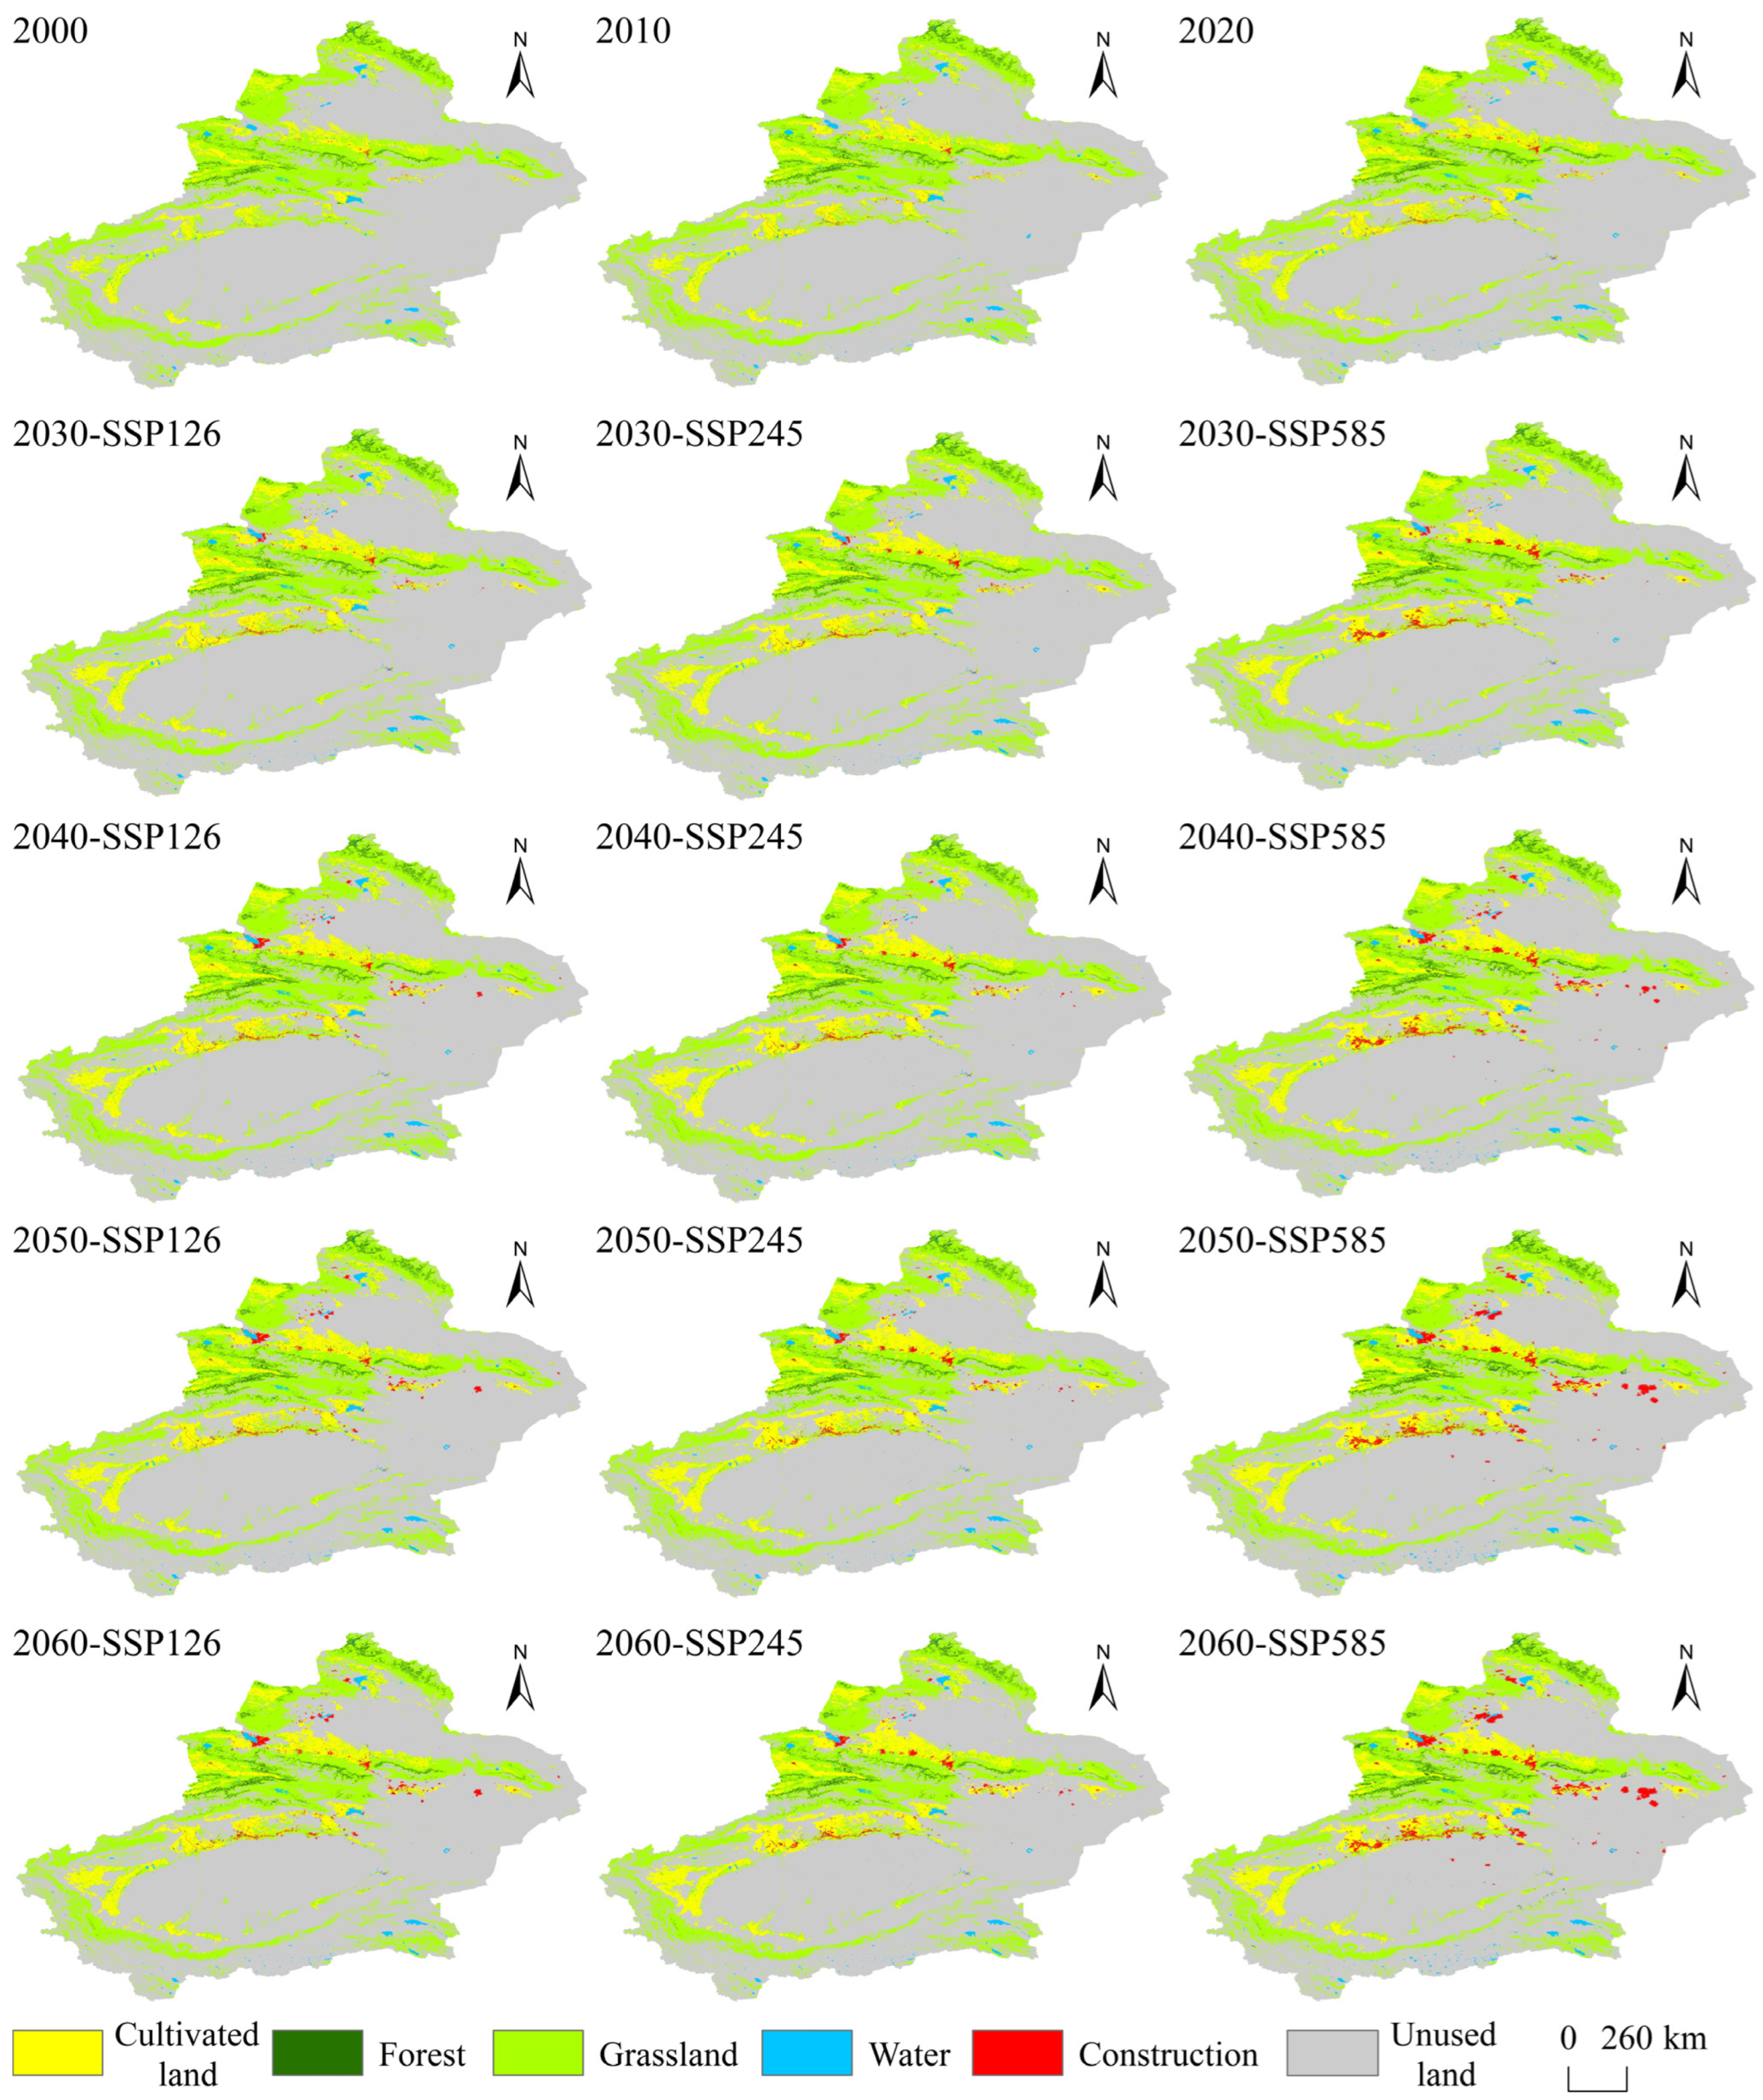
The area changes in various land-use types in Xinjiang from 2000 to 2060 were shown in Table 4 and Figure 2. The land-use changing trend from 2020 to 2060 was consistent with that in the historical period. However, it is different under different scenarios. Under all three SSP–RCPs, cultivated land exhibited persistent expansion. The largest increase occurred under SSP245, with an increase of 31,617 km2 and a growth rate of 0.92% per year. Under SSP126, cultivated land expanded slowly, increasing by 17,167.65 km2, while SSP585 produced a moderate with an increasement of 23,358.5 km2. Forest dynamics varied substantially across different scenarios. In SSP245, the forest loss was about 974.6 km2. Under SSP126, forest area exhibited minor fluctuations, i.e., declined firstly and then increased, resulting in a net gain of 61.55 km2. Forest expanded significantly under SSP585, with an increase of 3248.5 km2. Grassland exhibited a continuous decline under all scenarios, with reductions of 7315 km2, 8990 km2, and 11,659 km2 under SSP126, SSP245, and SSP585, respectively. The decline rate was the lowest under SSP126 and the highest under SSP585. Water bodies showed a pattern of initial contraction followed by recovery. Specifically, water area increased by 24.9 km2 under SSP126 and by 903.6 km2 under SSP585, whereas SSP245 resulted in a slight net decrease of 44.8 km2. Construction land exhibited a persistent expansion across all scenarios. The growth was relatively moderate under SSP126 (5532.7 km2) and SSP245 (4086 km2). In contrast, SSP585 showed a pronounced acceleration, with an average annual expansion rate of 9.62%. Unused land consistently decreased across all scenarios and represented the dominant contributor to land conversion. The greatest reduction was observed under SSP585 (35,055.2 km2), followed by SSP245 (25,694.55 km2).
Table 4.
Area changes in land-use types under different scenarios from 2030 to 2060.
Figure 2.
Land-use change from 2000 to 2060 in Xinjiang.
By inputting the 2020 land-use projections generated by the land system model into the CARS module of the PLUS framework, the spatial land-use pattern of Xinjiang for 2020 was simulated. Comparison with the observed land-use map yielded a kappa coefficient of 0.8526 and an overall accuracy of 0.9316, which demonstrated that the model achieved a high level of simulation reliability.
Using the land-use quantities projected by the SD model as inputs to the PLUS model, and integrating the outputs with ArcGIS, spatial land-use maps for Xinjiang from 2000 to 2060 were generated (Figure 3). Pronounced land-use transitions were concentrated along the northern and southern slopes of the Tianshan Mountains and the periphery of the Tarim Basin. In contrast, the land use changed little in Junggar and Tarim Basins where there was minimal human disturbance. In order to clearly illustrate the dynamics of land use, this study mainly analyzed the representative areas, including the northern and southern Tianshan slopes (Urumqi, northeastern Aksu, and northern Turpan) and western Kashgar. From 2000 to 2060, construction land in Urumqi expanded rapidly, encroaching upon adjacent grassland and cultivated land and exhibiting a pronounced radial growth pattern. In western Kashgar, cultivated land increased substantially, primarily through the conversion of grassland and unused land. In northeastern Aksu, cultivated land expanded into unused land, while construction land progressively occupied portions of cultivated land. In northern Turpan, both construction and cultivated land advanced into surrounding unused land, accompanied by slight grassland degradation. Under the SSP126 and SSP245 scenarios, compact urban-development strategies and strengthened ecological conservation policies constrained construction-land expansion, resulting in slower and more spatially balanced growth. In contrast, under SSP585, economic development driven by conventional energy pathways led to a markedly accelerated and extensive expansion of construction land.
Figure 3.
Spatial distribution of land use from 2000 to 2060 in Xinjiang.
3.2. Spatiotemporal Evolution of Land-Use Carbon Emissions
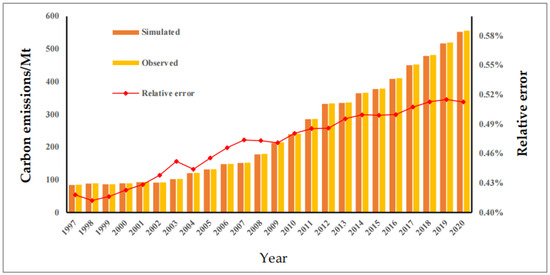
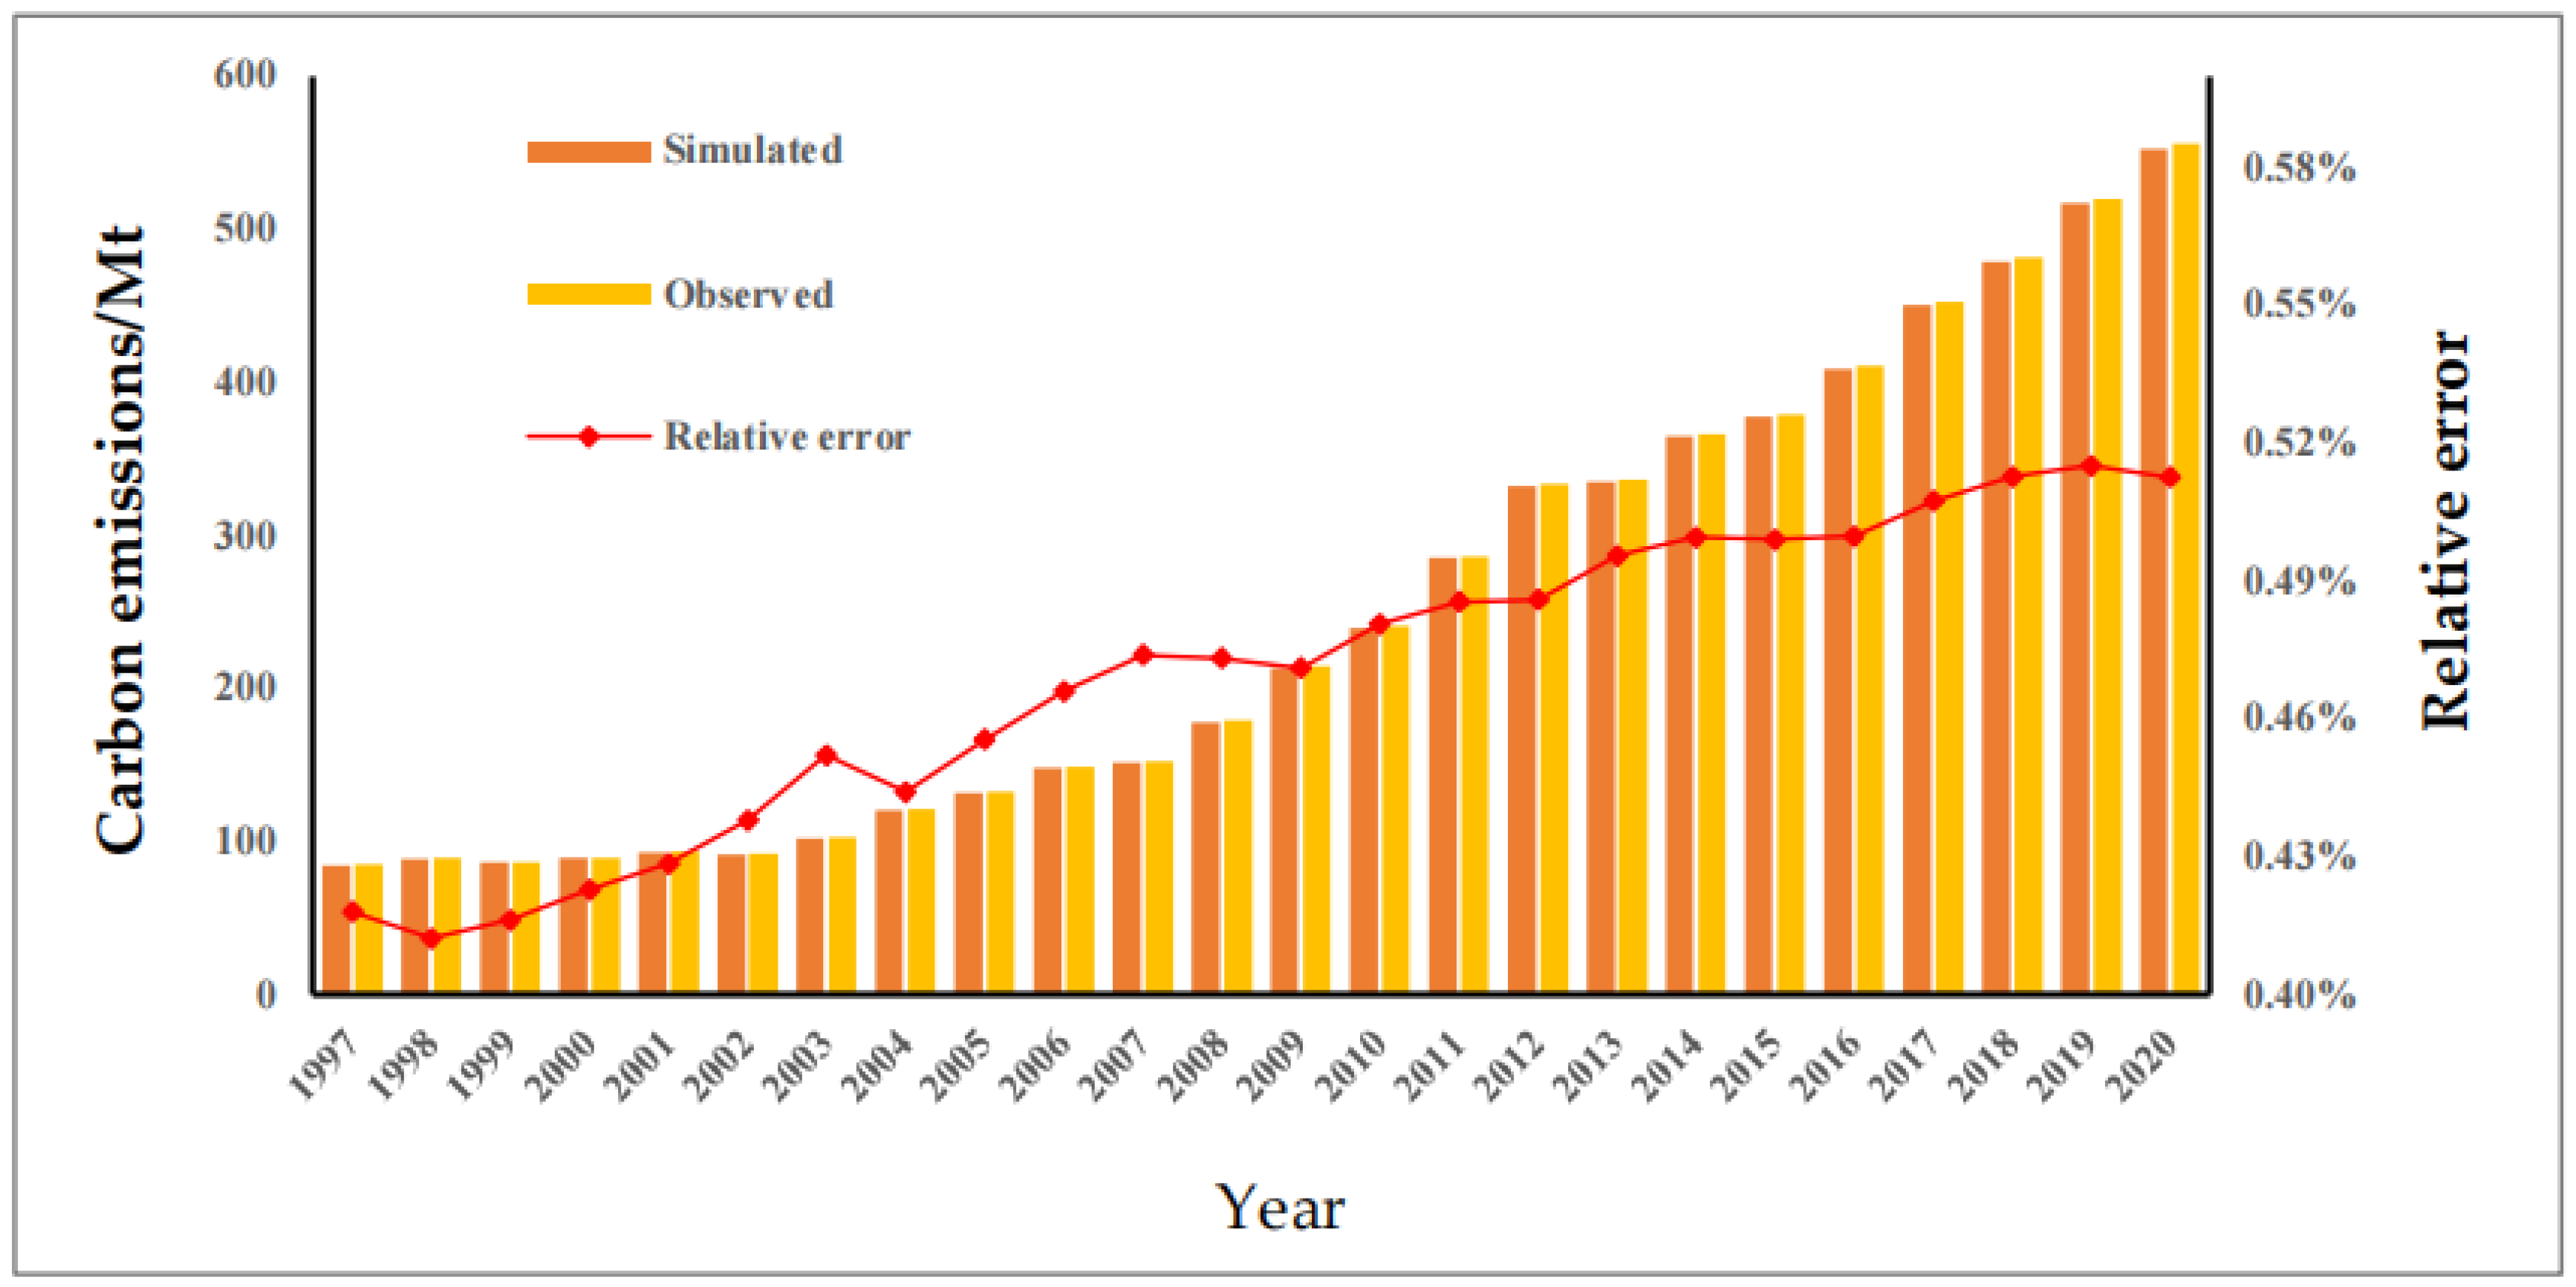
The STIRPAT model was employed in this study to fit the indirect carbon emission by using population, GDP, and carbon emission intensity from 1997 to 2020 (Figure 4). The R2 was 0.996 and the relative errors were less than 0.52%, which indicated the satisfaction of the simulation performance. The results confirmed the suitability of the model.
Figure 4.
Fitted indirect carbon emissions from 1997 to 2020.
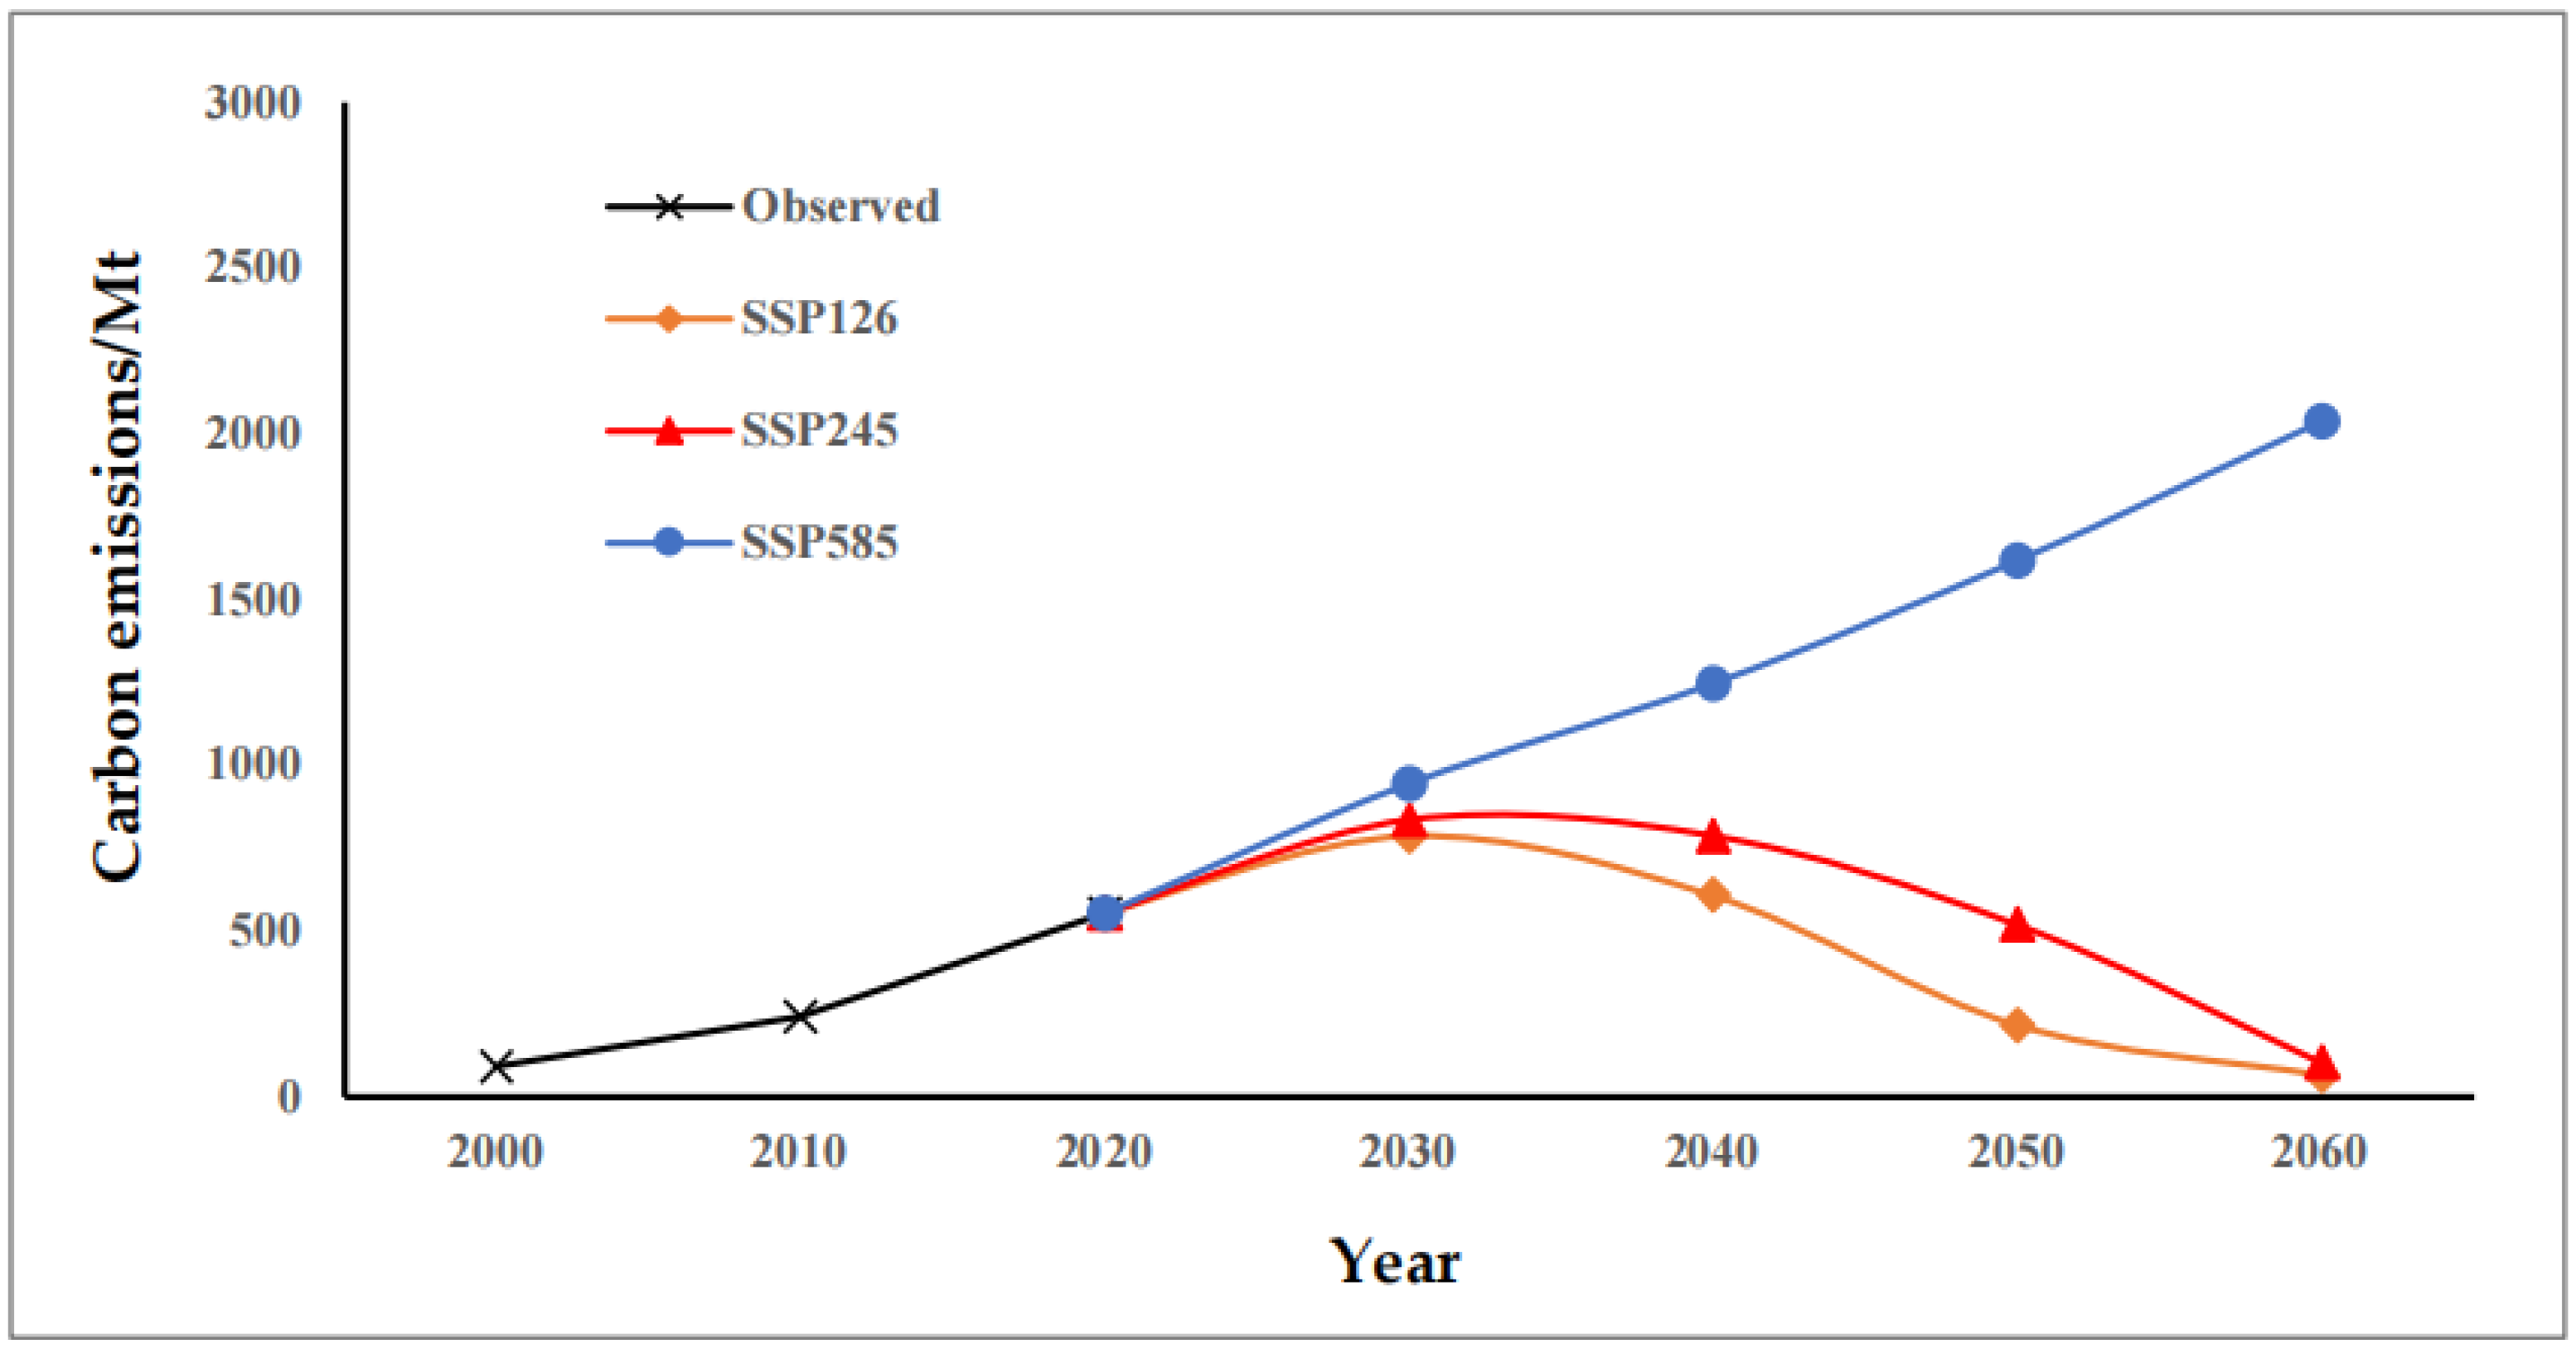
Figure 5 presented the temporal evolution of land-use carbon emissions in Xinjiang from 2000 to 2060. From 2000 to 2020, Xinjiang’s carbon emissions increased rapidly by about 464.61 Mt. This rise was driven by intensified energy development and consumption, the expansion of energy-intensive industries, and increased agricultural activities. The carbon emissions in 2020 reached a level 5.2 times higher than that in 2000. From 2020 to 2060, Xinjiang’s carbon emissions raised firstly and then declined under SSP126 and SSP245. Carbon emissions peaked at approximately 785.36 Mt under SSP126 and 834.56 Mt under SSP245 around 2030. Carbon emissions decreased steadily after 2030. By 2060, carbon emissions decreased to 65.42 Mt with a reduction of 91.67% from the 2030 peak, and 101.95 Mt with a reduction of 87.78% from the 2030 peak under SSP126 and SSP245, respectively. However, carbon emissions increased continuously under SSP585, which increased from 553.89 Mt in 2020 to 2036.84 Mt in 2060, with an overall increase of 267.73%.
Figure 5.
Carbon emissions from 2000 to 2060 in Xinjiang.
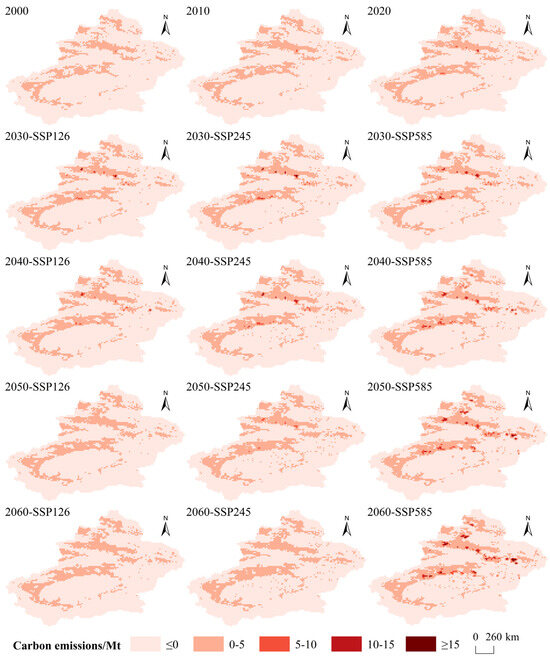
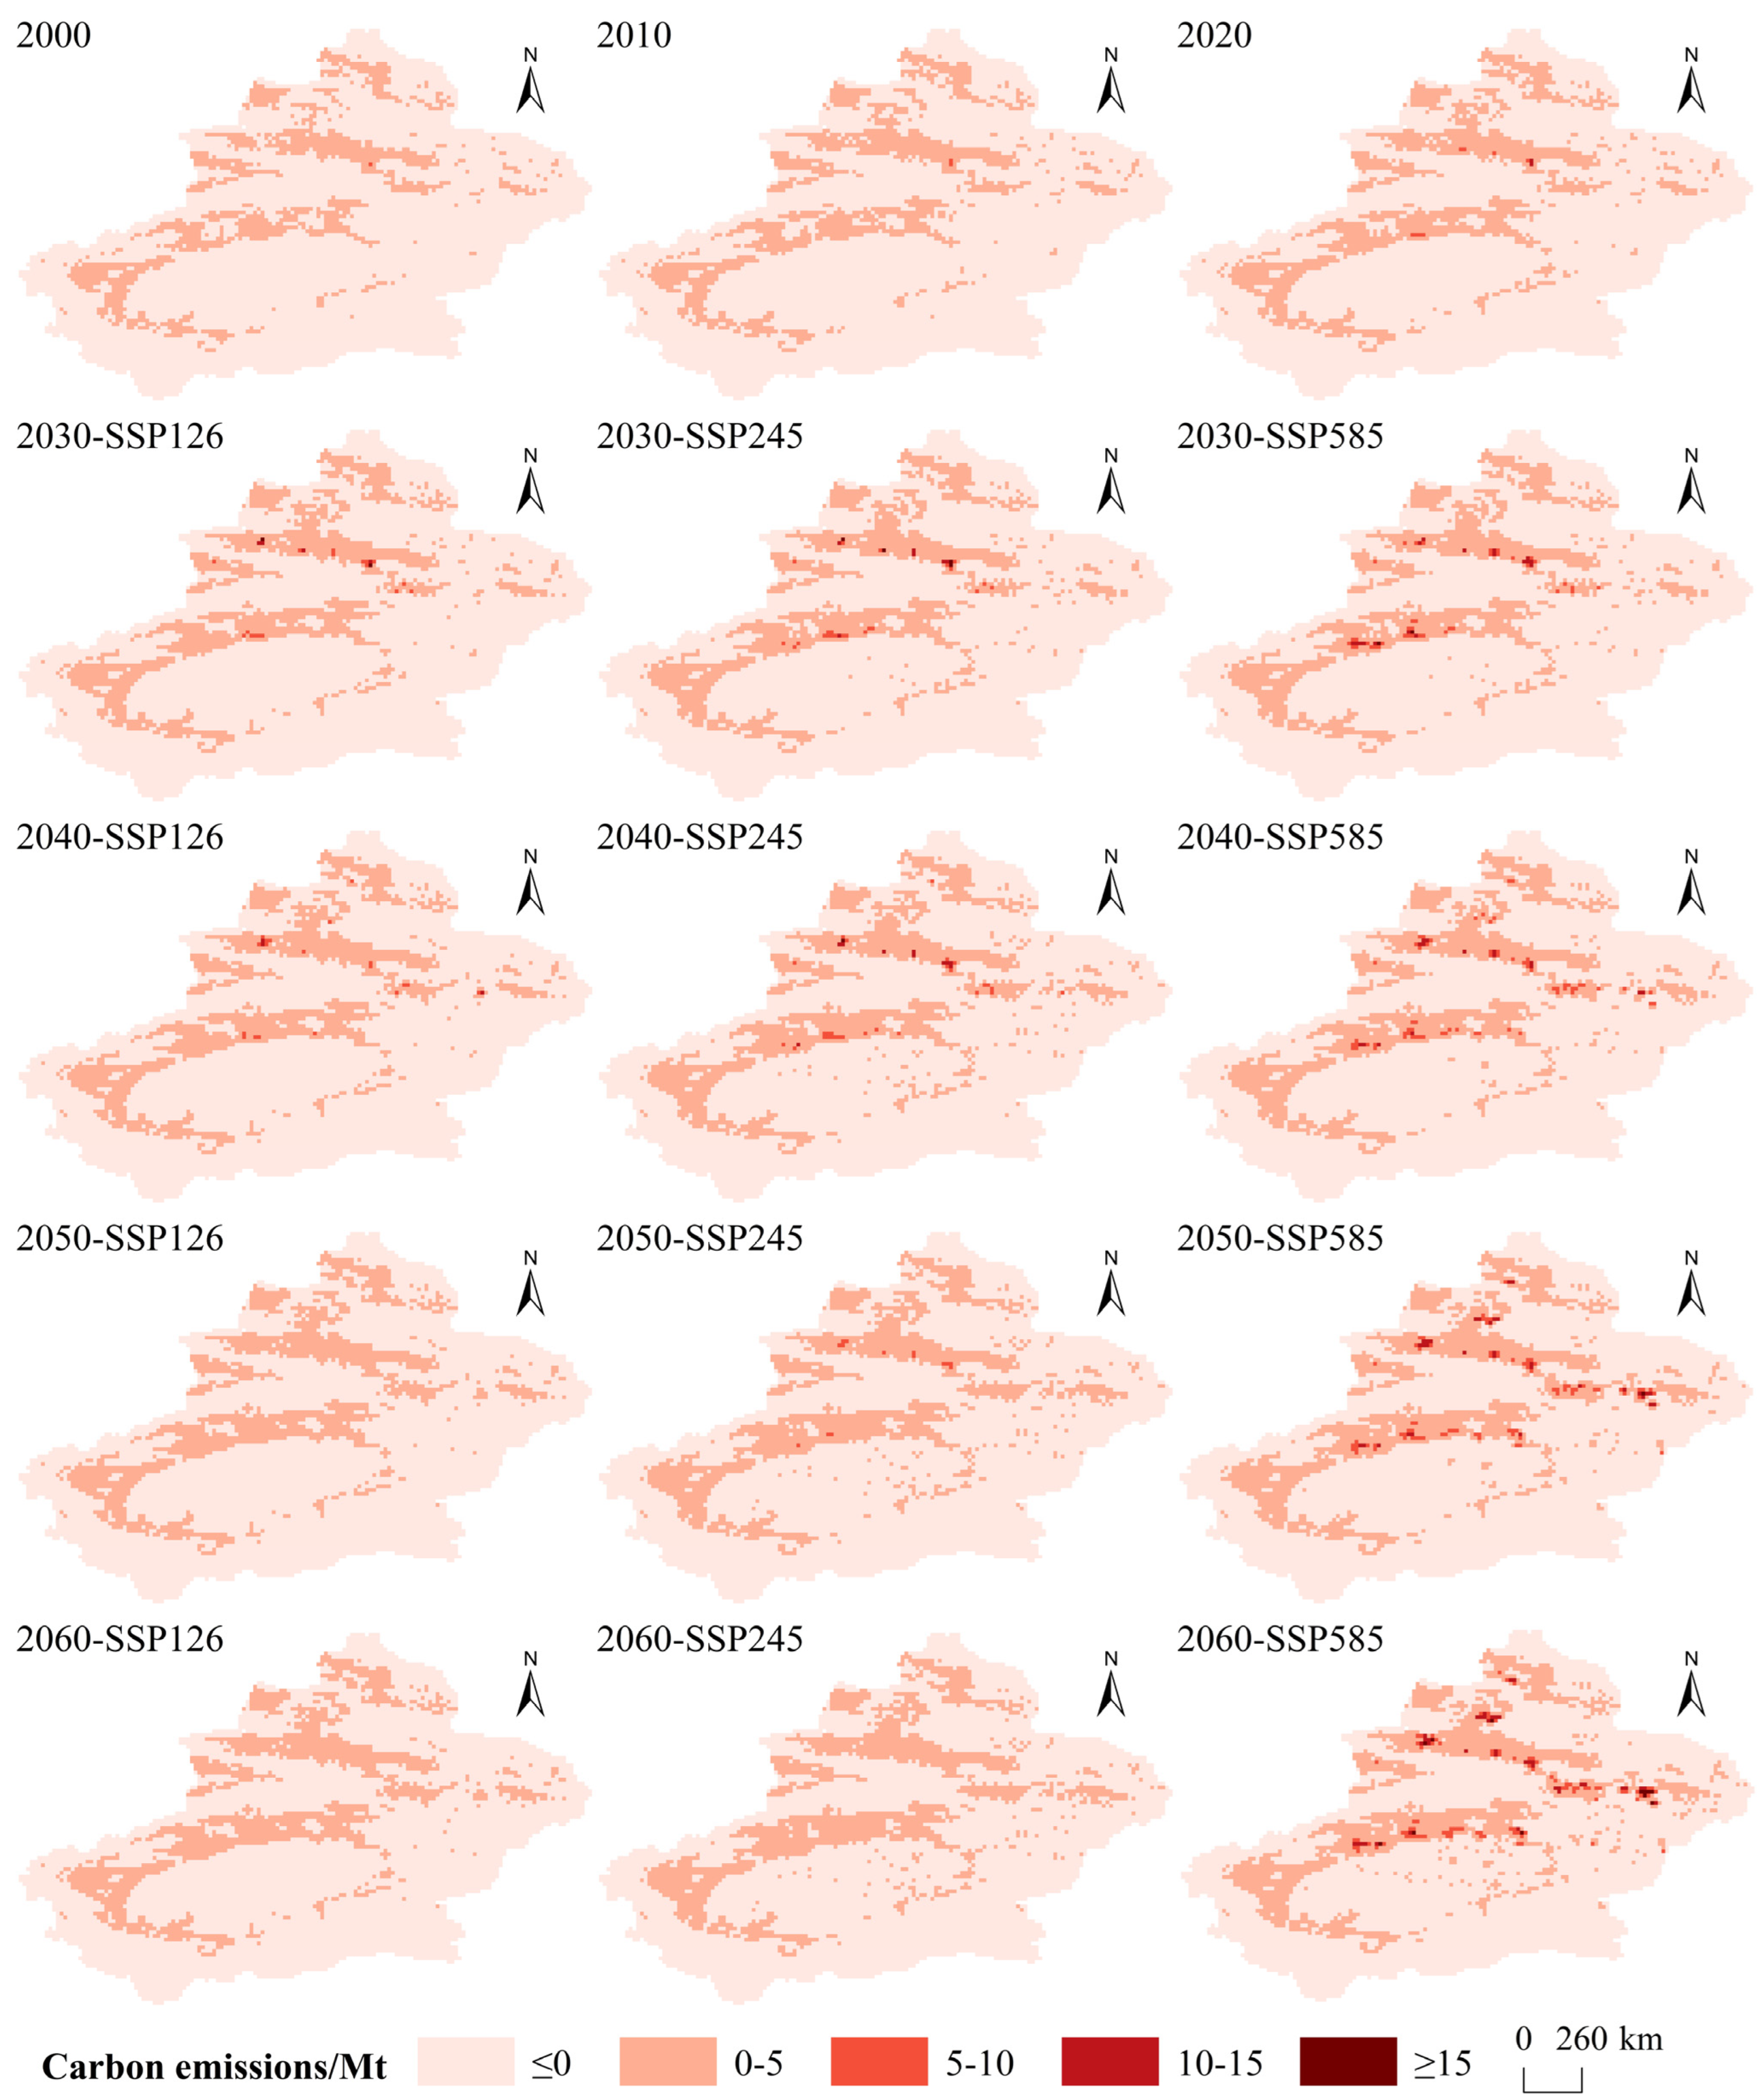
A fishnet grid (15 km × 15 km) was generated to visualize the spatial distribution of land-use carbon emissions in Xinjiang by using ArcGIS software. This study area was divided into five carbon emission gradient zones based on total carbon emissions, zero-emission zone (carbon emissions ≤ 0 Mt), low-emission zone (0 Mt < carbon emissions ≤ 5 Mt), medium-emission zone (5 Mt < carbon emissions ≤ 10 Mt), medium-to-high-emission zone (10 Mt < carbon emissions ≤ 15 Mt) and high-emission zone (carbon emissions > 15 Mt), as illustrated in Figure 6. Carbon emissions exhibited a characteristic pattern of high values on the northern and southern slopes of mountains and low values in basin areas. Driven by socio-economic development and topographic constraints, high-emission zone was concentrated in oasis areas, including the Urumqi metropolitan region, Turpan, and the oasis cities of Alar and Shaya in Aksu Prefecture. Zero-emission zone and low-emission zone were predominantly located in deserts, protected forests, and grasslands areas. From 2000 to 2020, medium-to-high-emission zone and high-emission zone expanded into the Wuchangshi urban areas and radiated outward from their cores. By 2030, medium-to-high-emission zone and high-emission zone clusters appeared in Yining, the Gaochang District of Turpan, Shaya County (Aksu Prefecture), and Karamay under all three scenarios. The increase was greatest under SSP585, whereas it was smallest under SSP126. From 2030 to 2060, medium-to-high-emission zone and high-emission zone contracted under SSP126 and SSP245. The carbon emission declined to below 5 Mt per grid by 2050 and 2060, respectively. In contrast, SSP585 produced rapid expansion of medium-to-high-emission zone and high-emission zone, with new hotspots emerging in Jiumen County (Altay Prefecture) and the Turpan–Hami Basin.
Figure 6.
Spatial distribution of carbon emissions from 2000–2060 in Xinjiang.
3.3. Spatiotemporal Evolution of Carbon Storage
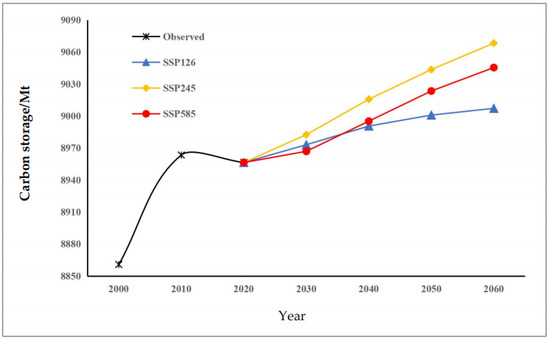
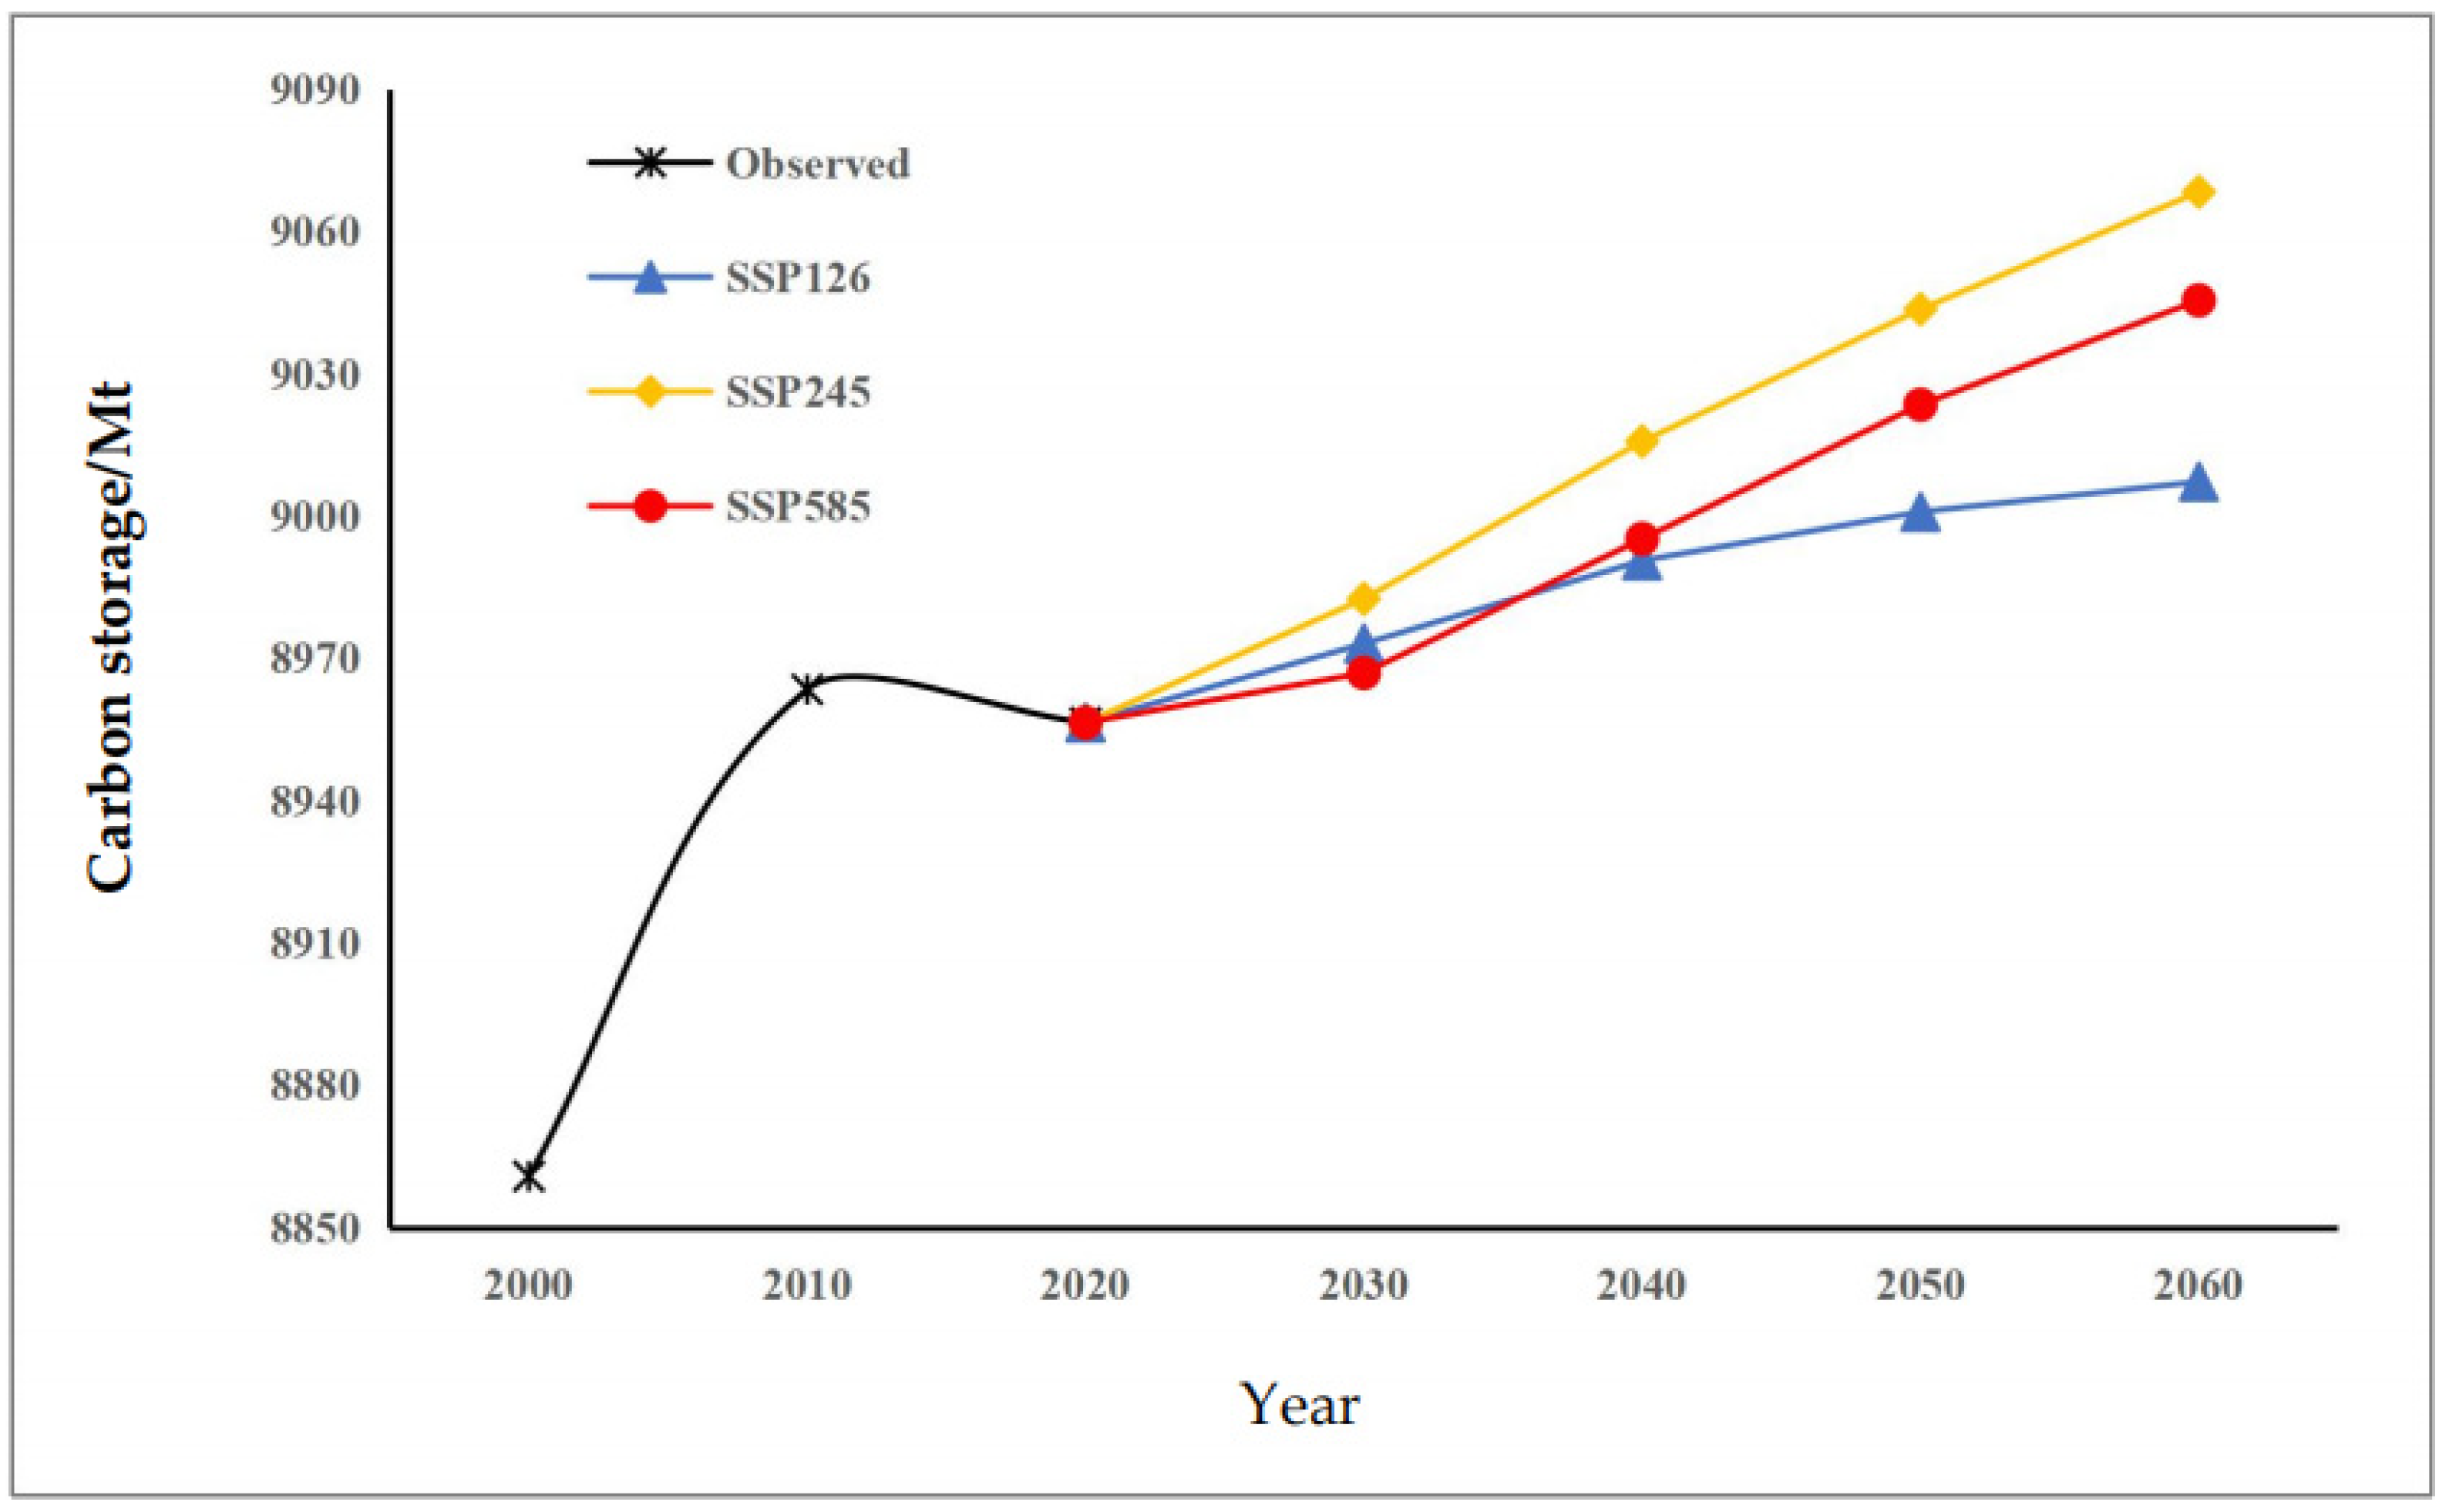
Figure 7 illustrated the carbon storage in Xinjiang from 2000 to 2060. From 2000 to 2010, carbon storage increased rapidly by 102.68 Mt. From 2010 to 2020, it decreased gradually by 7.01 Mt. From 2020 to 2060, carbon storage increased by 50.81 Mt, 111.95 Mt, and 89.08 Mt respectively under SSP126, SSP245 and SSP585 scenarios. After 2040, the total carbon storage under the SSP585 scenario was higher than that under the SSP126 scenario, which was mainly attributed to the substantial and rapid expansion of cultivated land under the SSP585 scenario. Although the carbon density of cultivated land is lower than that of forest and grassland, the large-scale increase in cultivated land under the high-emission development pathway still leads to a rapid rise in regional total carbon storage. Meanwhile, the parameters of carbon density for cultivated land adopted in this study include soil organic carbon and biomass carbon, which further amplify the contribution of cultivated land expansion to the increase in total carbon storage during this period.
Figure 7.
Carbon storage distribution from 2000–2060 in Xinjiang.
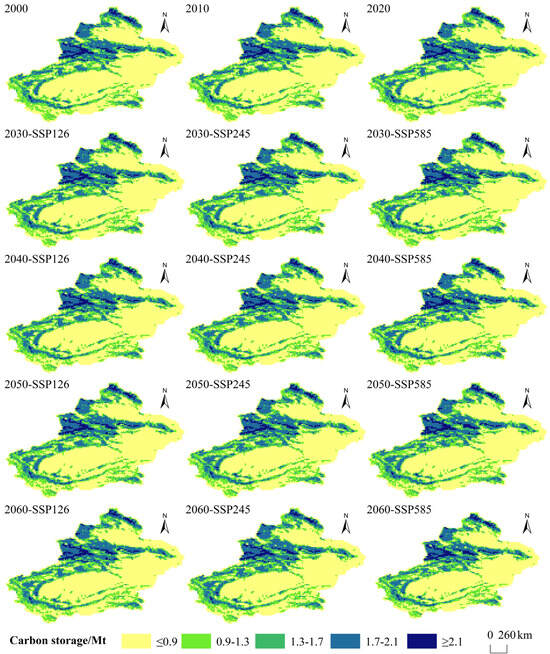
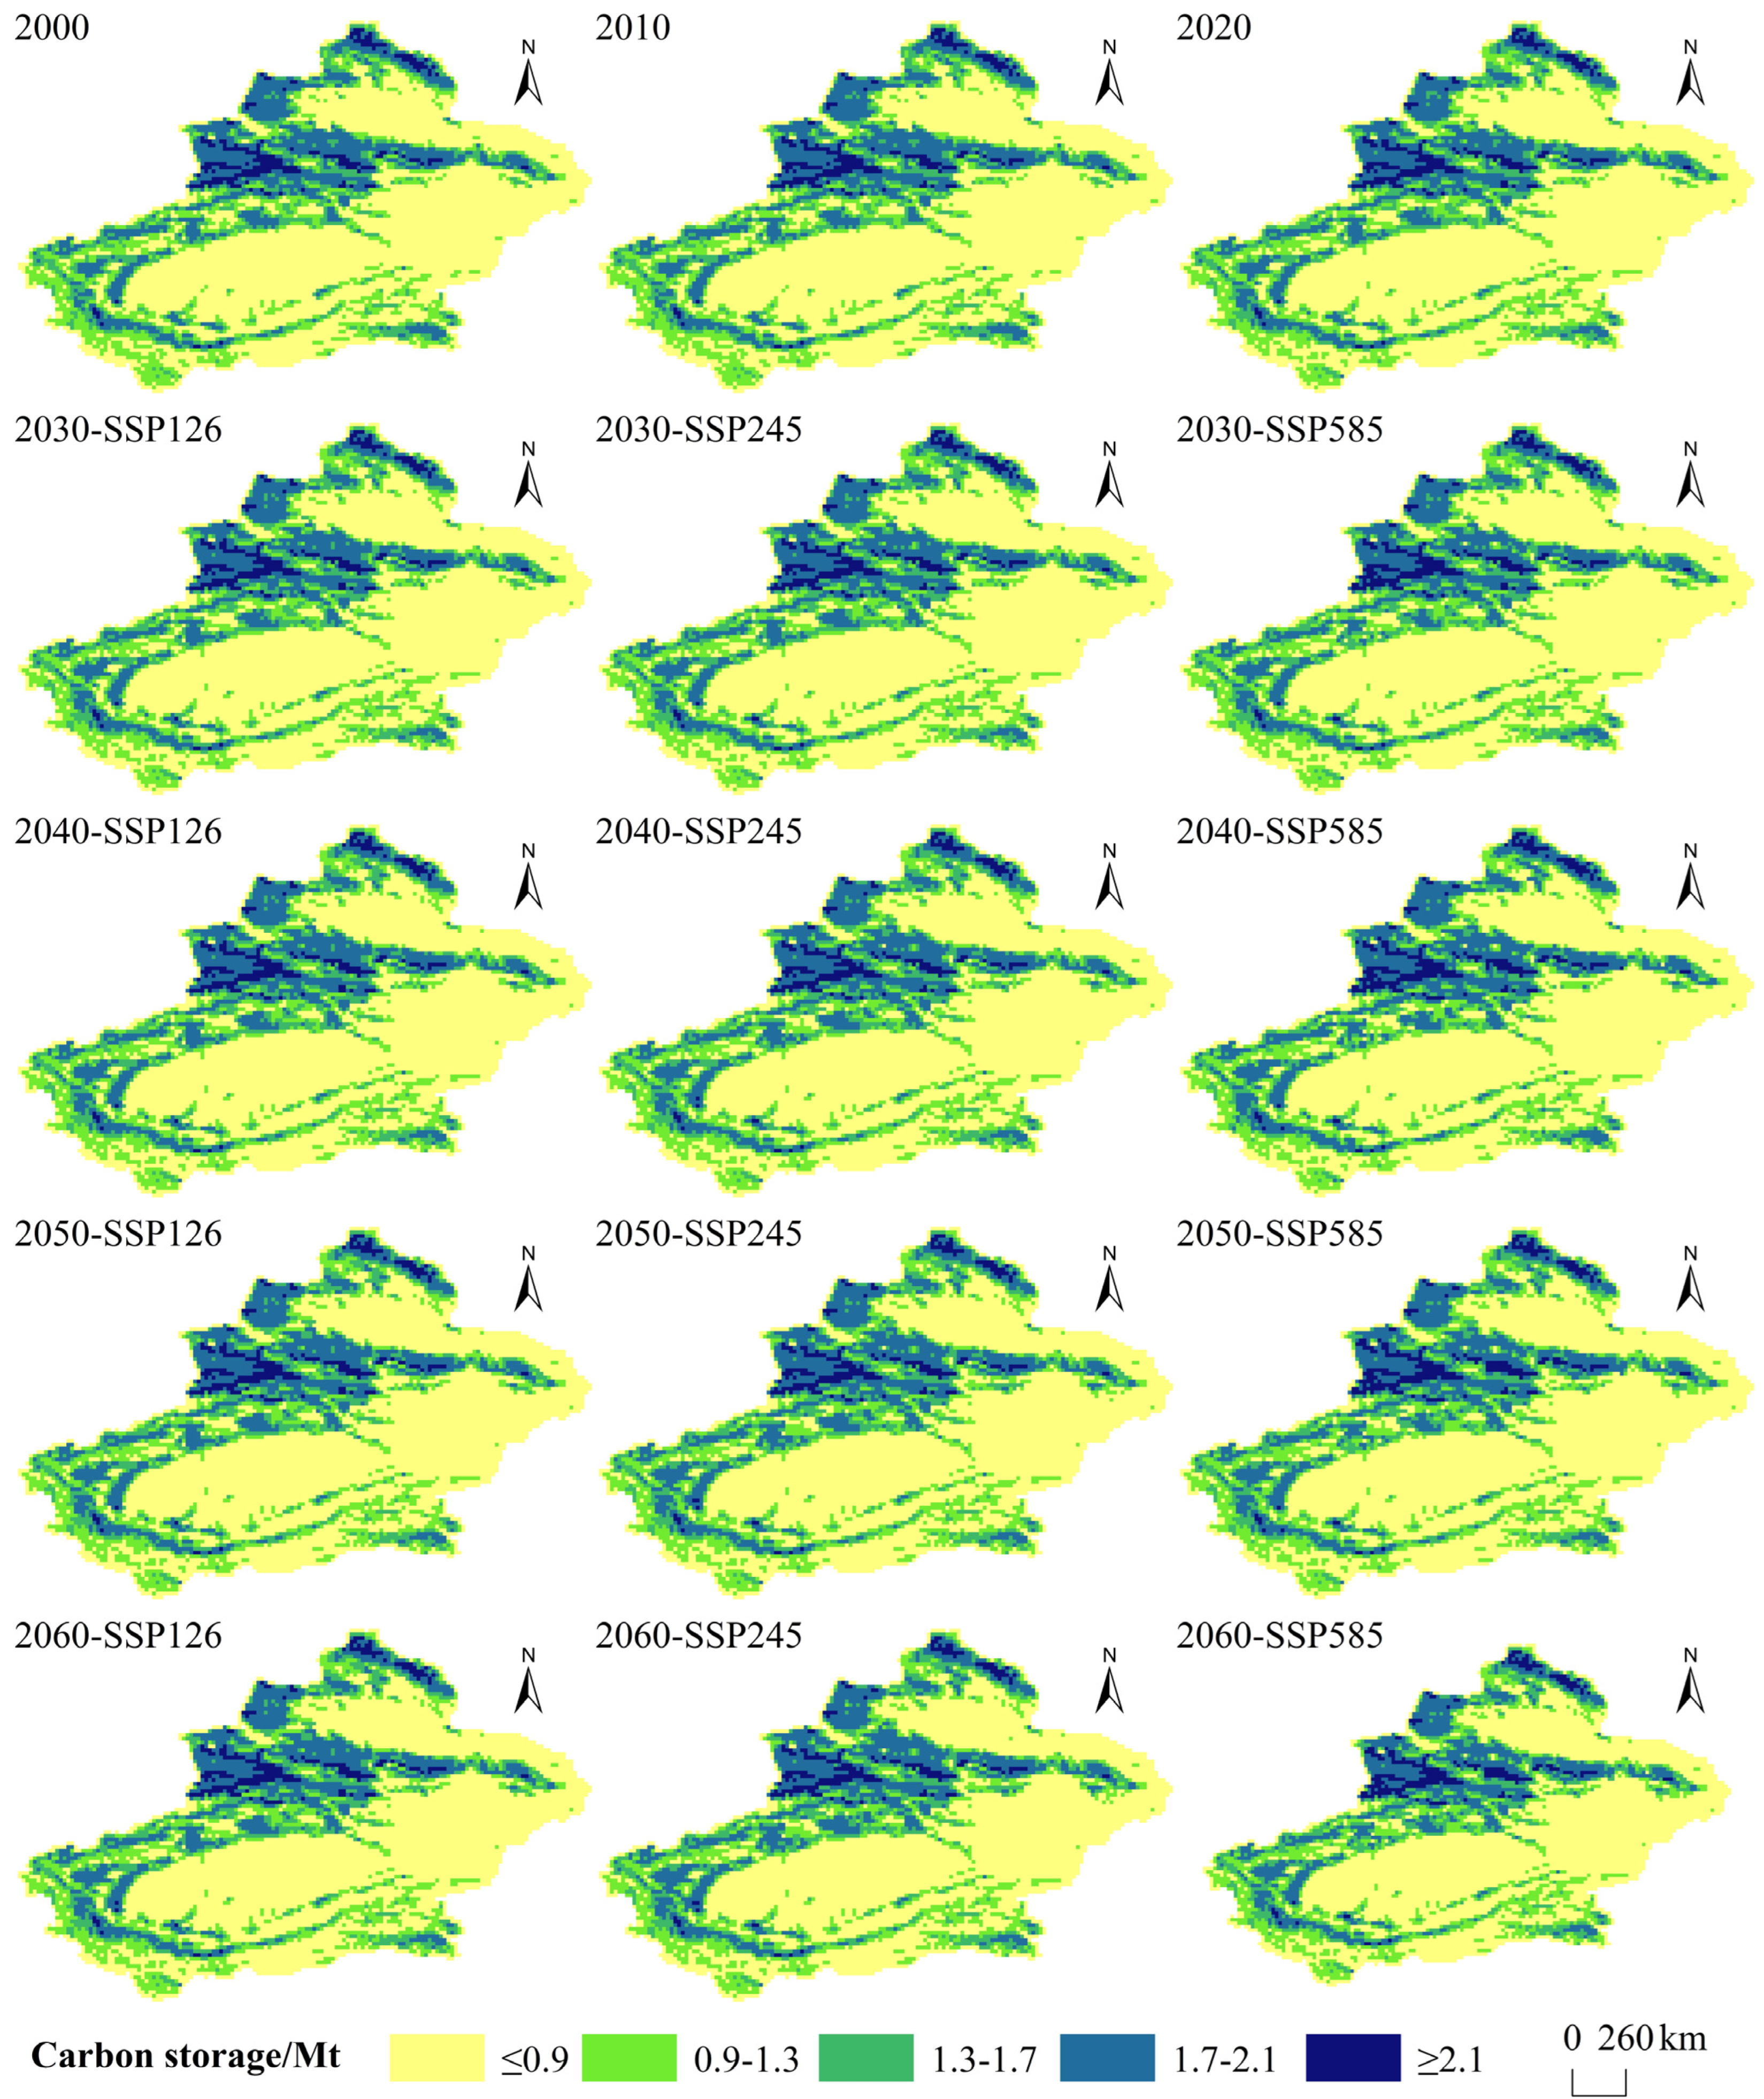
The study area was divided into the following five carbon stock gradient zones based on carbon storage: the low carbon storage zone (CS < 1 Mt), medium–low carbon storage zone (1.0 Mt < CS ≤ 1.3 Mt), medium carbon storage zone (1.3 Mt < CS ≤ 1.6 Mt), medium–high carbon storage zone (1.6 Mt < CS ≤ 1.9 Mt), and high carbon storage zone (CS > 1.9 Mt) (Figure 8). From 2000 to 2060, carbon storage in Xinjiang exhibited a consistent spatial pattern, with higher values in the northwest and lower values in the southeast (Figure 8). High carbon storage zone and medium–high carbon storage zone concentrated in forested and grassland regions at higher elevations of the Altay, Tianshan, and Kunlun Mountains. Low carbon storage zone and medium–low carbon storage zone were primarily located in sparsely populated desert regions. In the transitional zones between desert and grassland, frequent conversions between grassland and unused land lead to shifts between medium carbon storage, medium–low carbon storage, and low carbon storage.
Figure 8.
Spatial distribution of carbon storage from 2000–2060 in Xinjiang.
3.4. Spatiotemporal Evolution of CESR
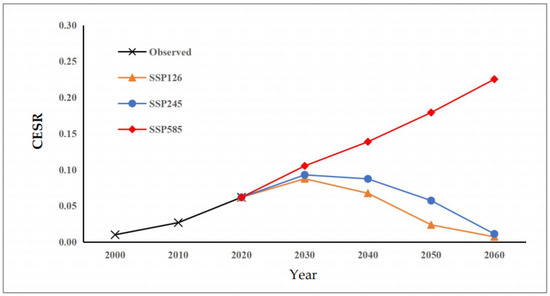
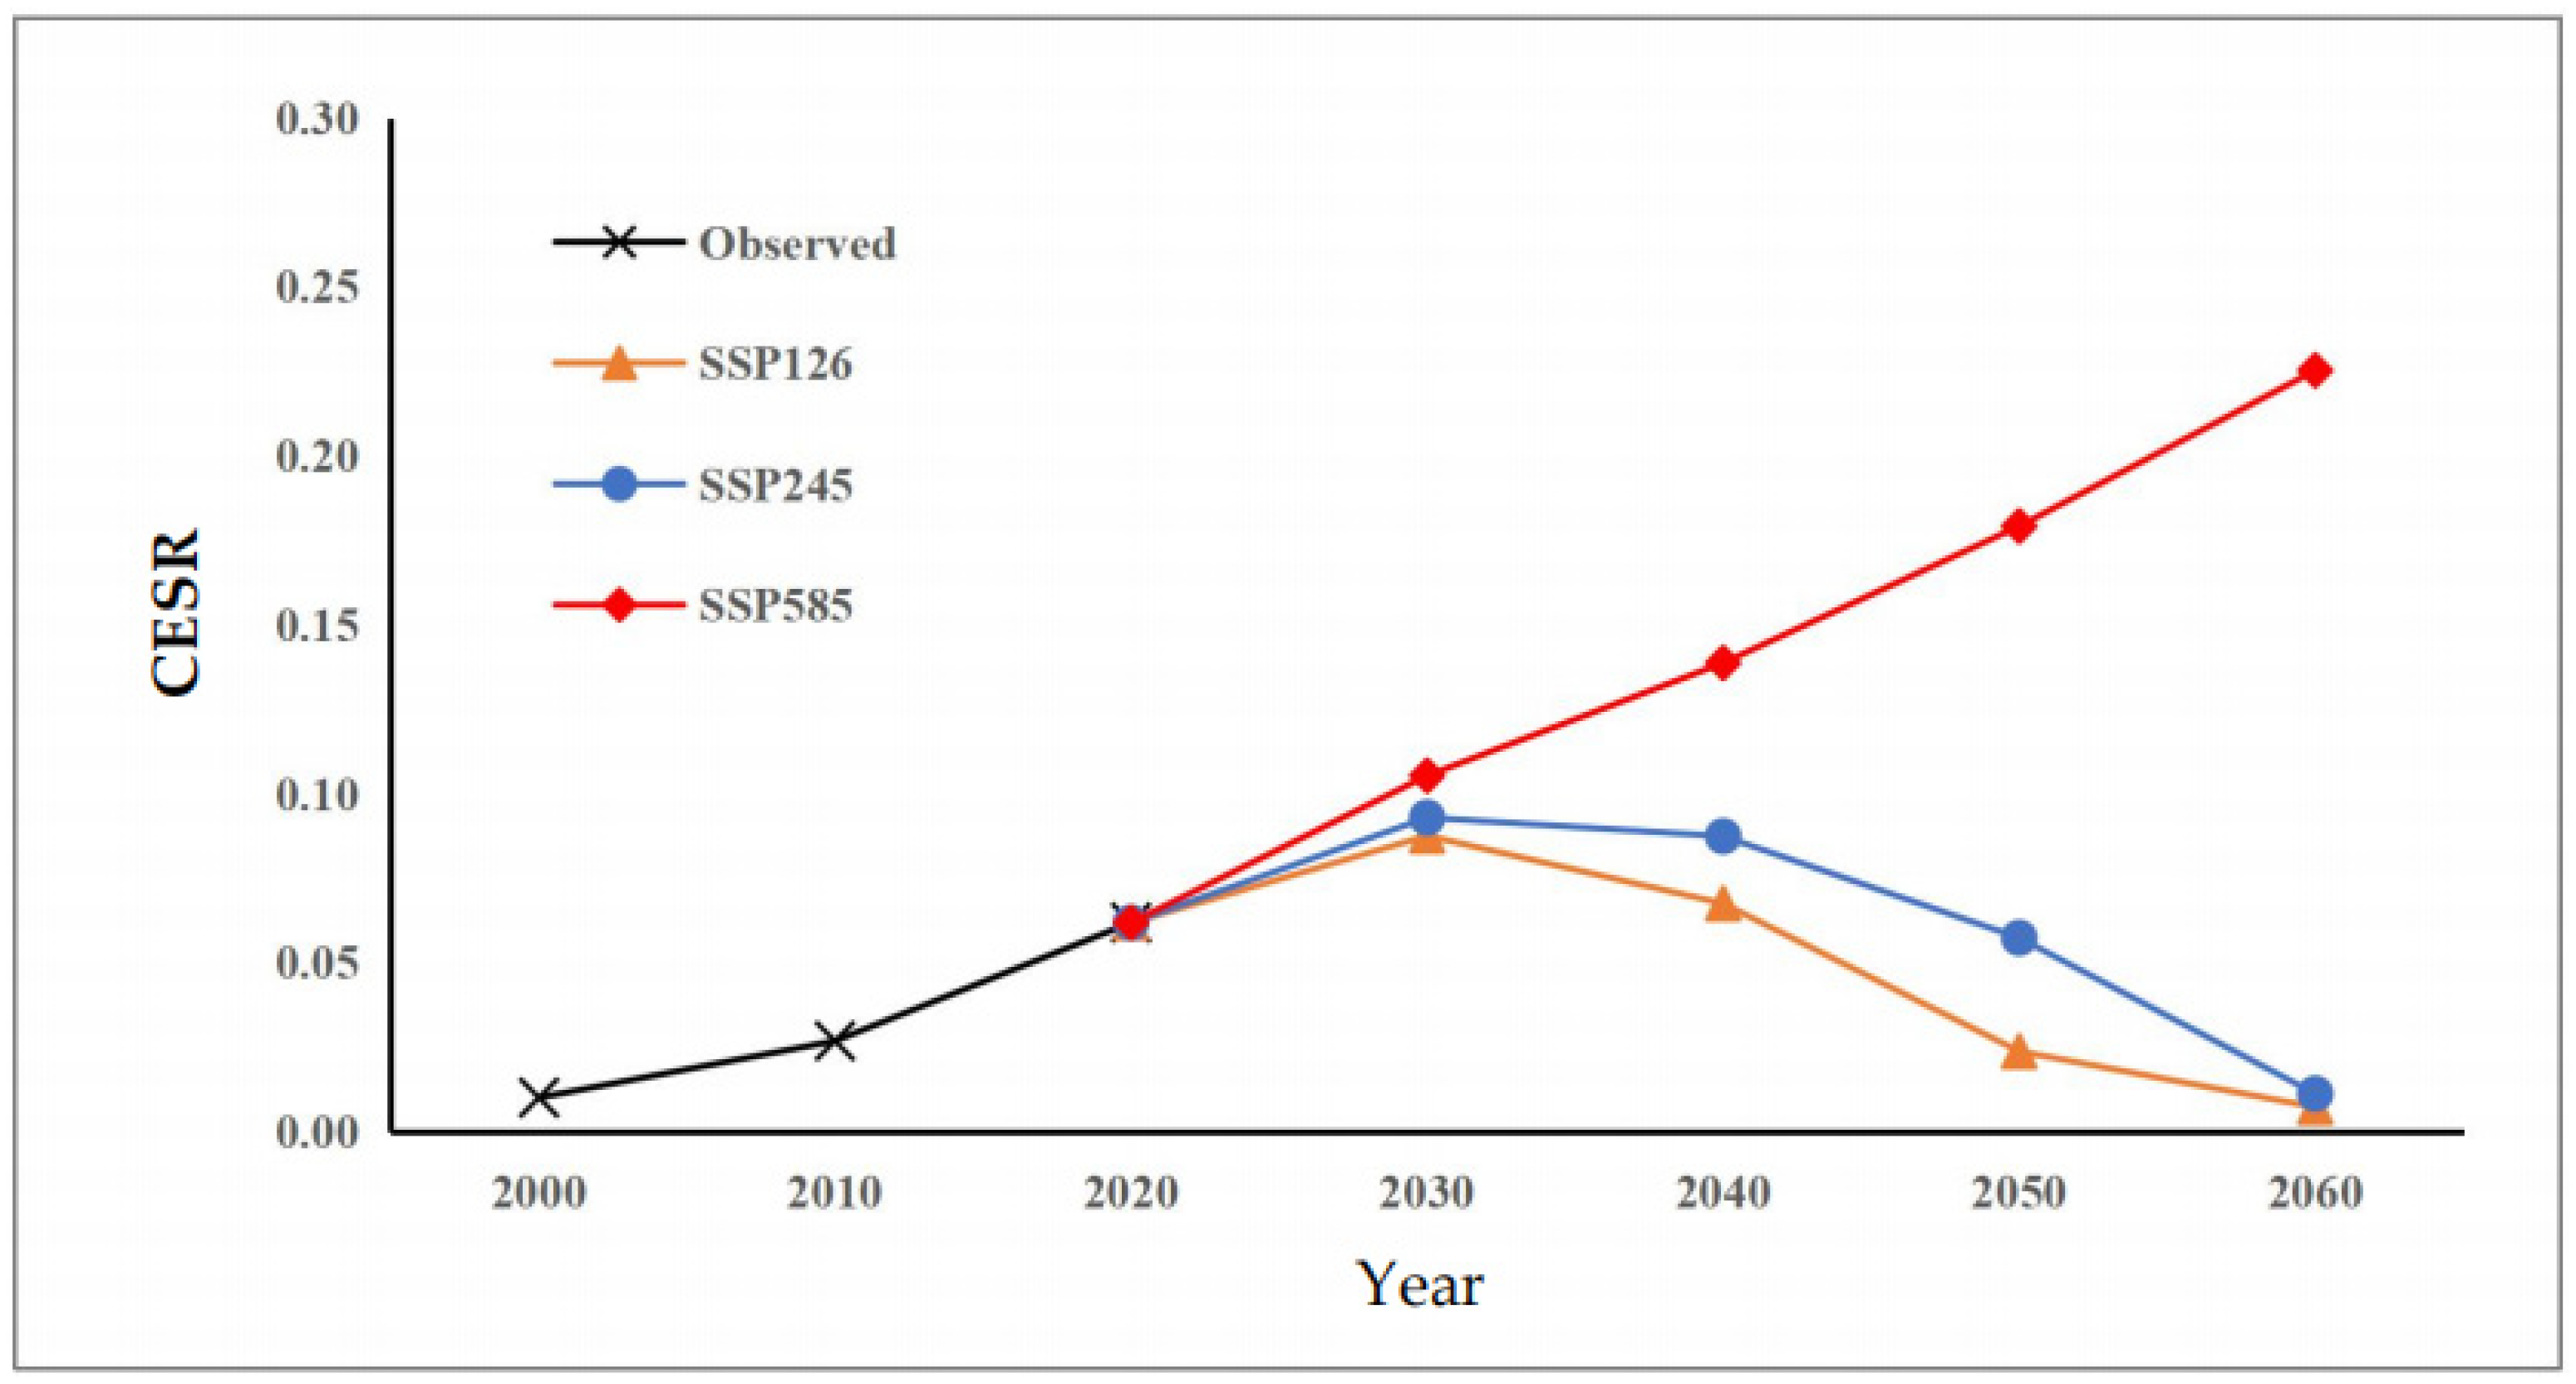
The CESR for Xinjiang from 2000 to 2060 was illustrated in Figure 9. The overall CESR was less than 1, indicating Xinjiang functions as a net carbon sink. From 2000 to 2010, the CESR increased from 0.0101 to 0.0268 with an annual growth rate of 16.63%. From 2010 to 2020, the growth rate was 13.04%. The CESR exhibited an inverted U-shaped trend from 2020 to 2060 under SSP126 and SSP245. The CESR reached the peak value in 2030 with values of 0.0875 and 0.0929, respectively. The CESRs were 0.0073 and 0.0112, respectively in 2060. The decreasing rates of the CESR from 2030 to 2060 were 22.06%/10a and 20.46%/10a, respectively under SSP126 and SSP245. Under the SSP585 scenario, the CESR increased from 0.0618 in 2020 to 0.2252 in 2060, with a growth rate of 66.03%/10a.
Figure 9.
CESR from 2000–2060 in Xinjiang.
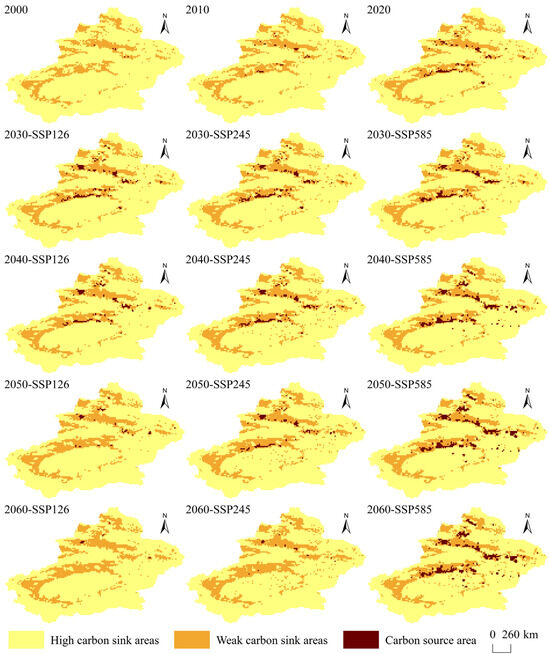
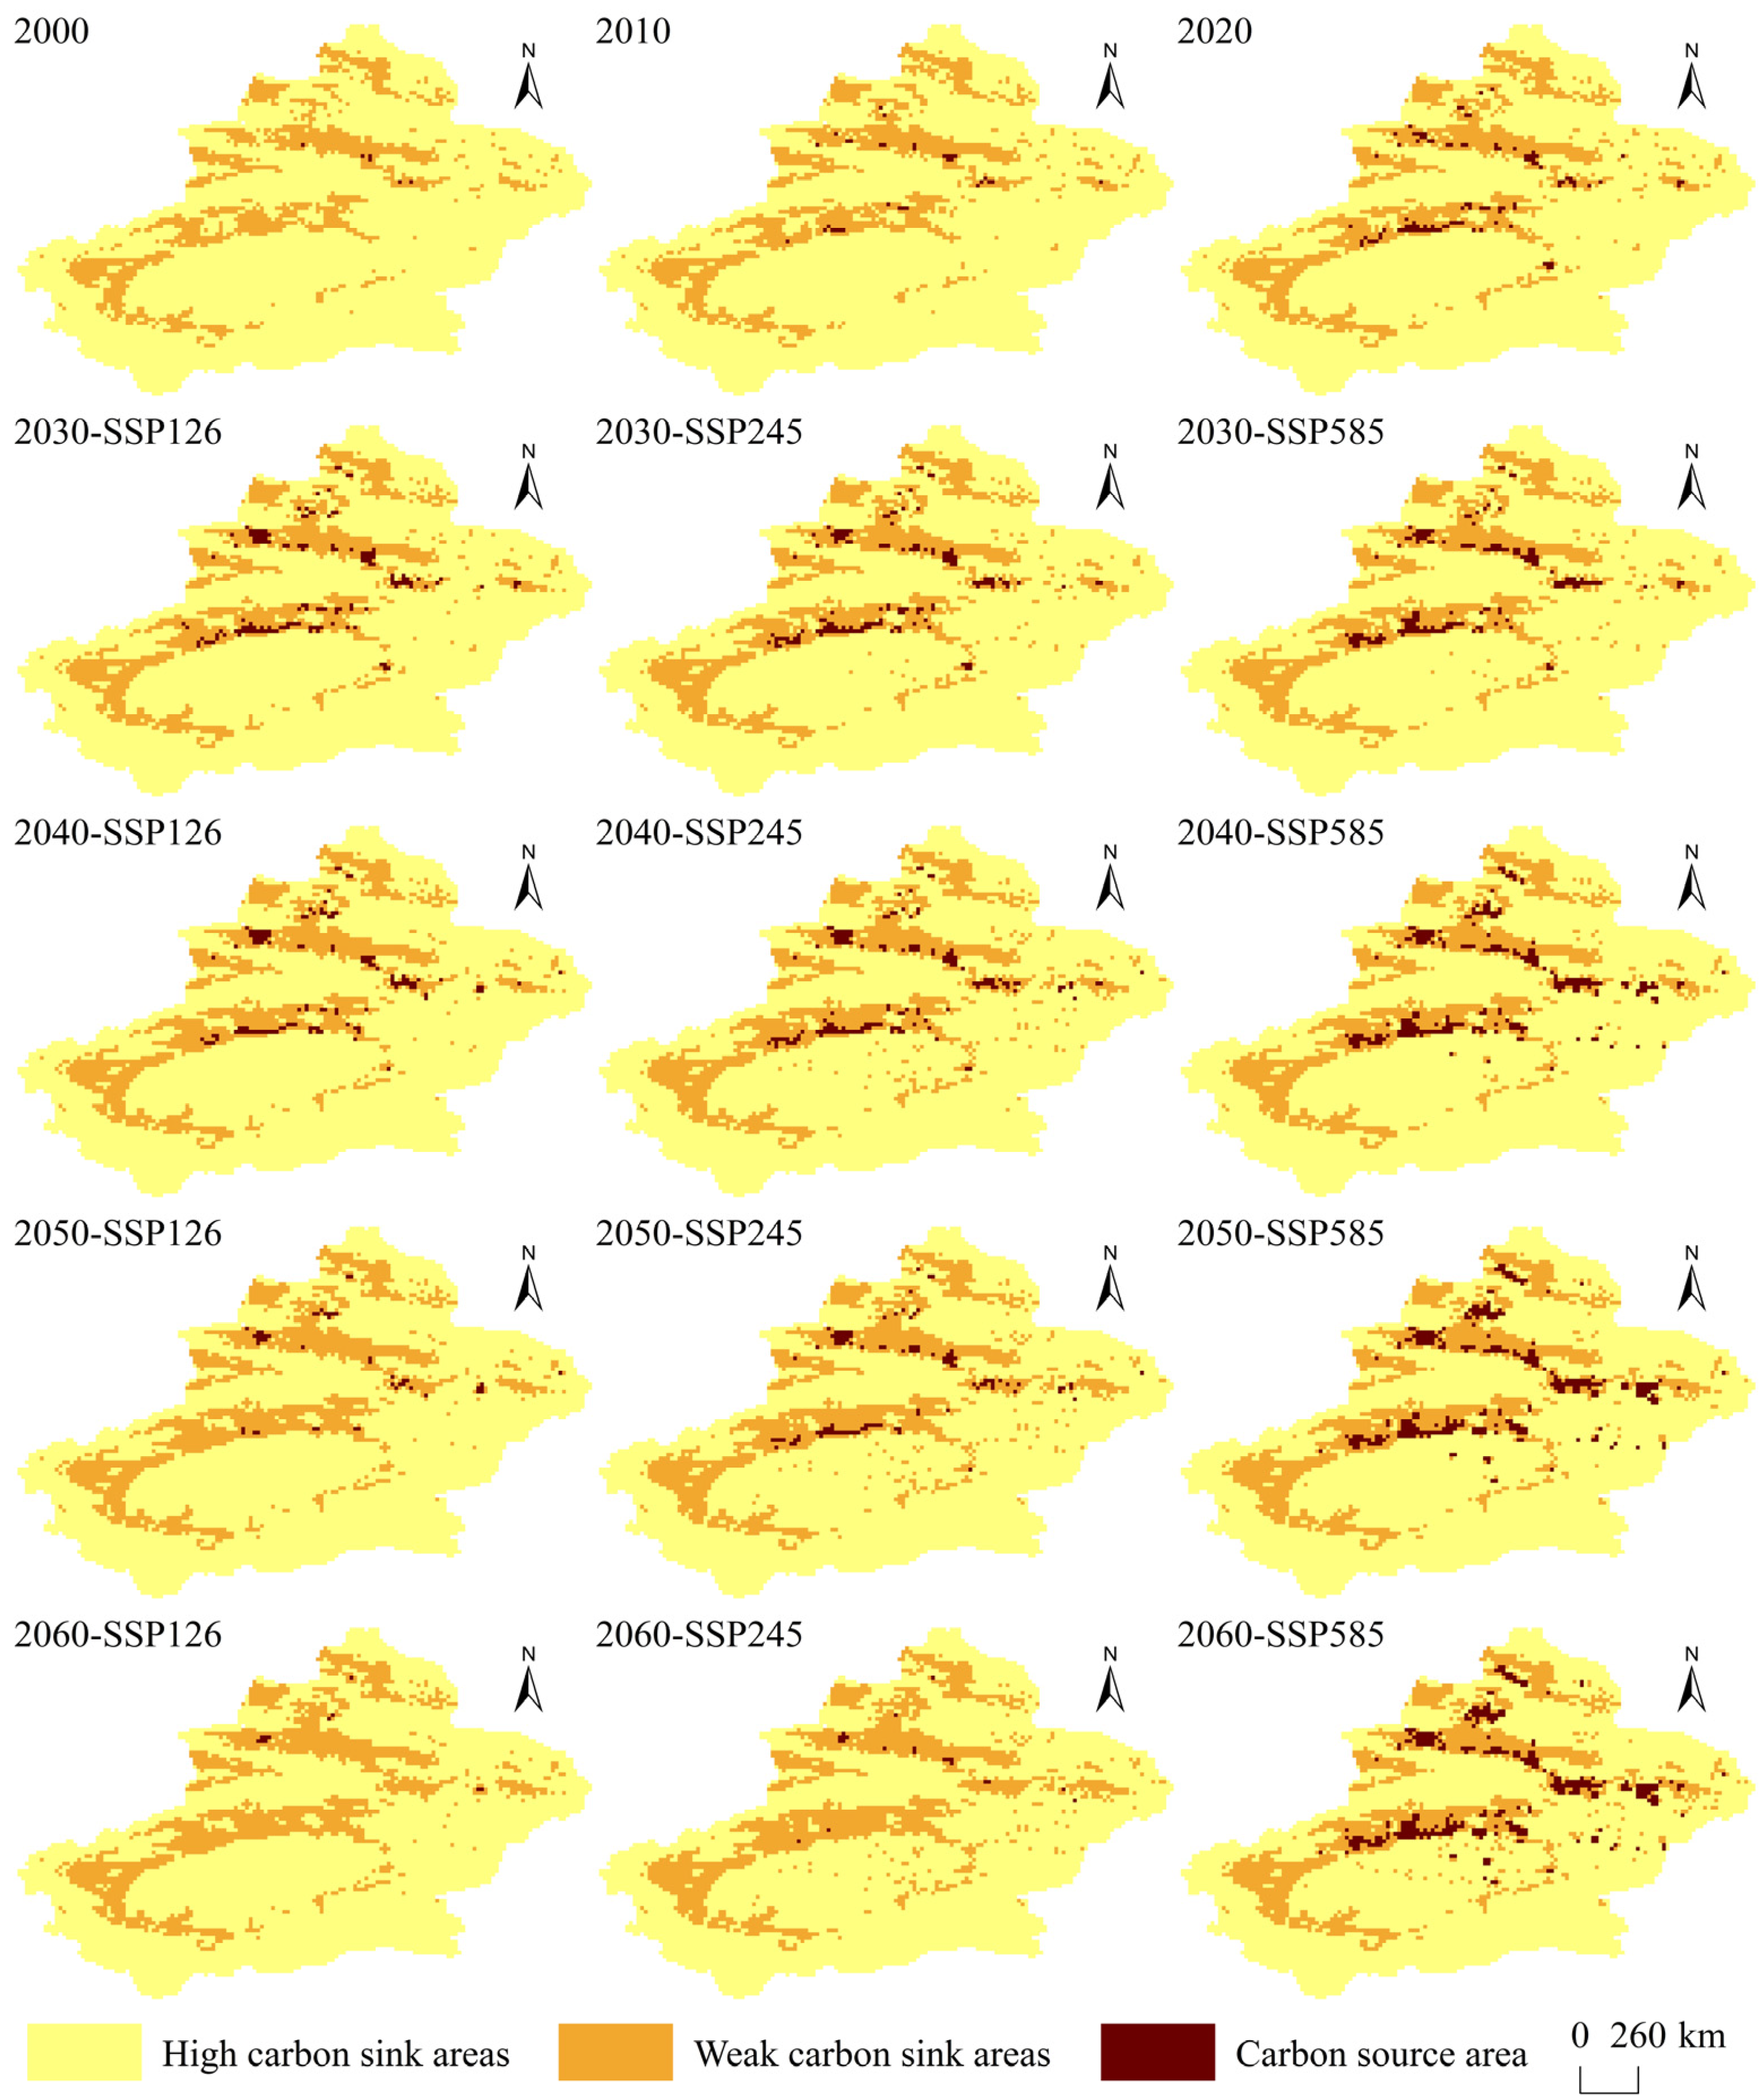
The spatial distribution of the CESR in Xinjiang from 2000 to 2060 was shown in Figure 10. Based on the CESR, this study area was classified into strong carbon sink zones (ratio ≤ 0), weak carbon sink zones (0 < ratio ≤ 1), and carbon source zones (ratio > 1). The distribution of carbon sources and sinks was highly uneven. The area of strong carbon sink zones was the largest, carbon source zones occupied the smallest area, and weak carbon sink zones were intermediate in extent. Strong carbon sink zones were primarily located in low-altitude deserts and high-elevation mountain ranges. Weak carbon sink zones occurred in the farmland and cultivated areas subject to human disturbance. Carbon source zones were concentrated in urban centres and industrial or mining areas along the northern and southern slopes of the Tianshan Mountains. From 2000 to 2020, ecological degradation driven by economic development and agricultural activities led to a gradual encroachment of weak carbon sink zones into adjacent strong sinks zones, while carbon source zones at the source-sink boundaries expanded rapidly in all directions. From 2020 to 2030, carbon source zones expanded rapidly near the northern and southern slopes of the Tianshan Mountains (including Urumqi, Shihezi, Karamay, Aksu, and Turpan) encroaching upon both strong and weak carbon sink areas. From 2030 to 2060, some carbon source zones gradually transitioned into weak carbon sinks under the SSP126 and SSP245 scenarios. In contrast, carbon source zones continued to expand outward, with new carbon source areas emerging in regions such as Ruoqiang County and Shanshan County under the SSP585 scenario. By 2060, carbon source zones were limited to small areas in Karamay and the Turpan region under the SSP126 scenario. The distribution of carbon source zones under SSP245 was largely similar to that of SSP126.
Figure 10.
Spatial distribution of CESR in Xinjiang, 2000–2060.
4. Discussion
4.1. Spatiotemporal Variations in Land Use, Carbon Emissions, Carbon Storage, and CESR in Xinjiang
This study analyzed the evolution of land use, carbon emissions, carbon storage, and CESR in Xinjiang from 2000 to 2060 under historical and SSP-RCP scenarios.
From 2000 to 2020, the rapid expansion of construction land and cultivated land was driven by accelerated urbanization, population growth, economic development, and national strategies including the Western Development and agricultural support policies. Correspondingly, carbon emissions rose rapidly and were approximately 5.2 times higher in 2020 than that in 2000. They are consistent with the national-scale pattern reported by Liu et al. [13], reflecting the general trend of carbon growth in inland arid regions during urbanization. Liu et al. only analyzed carbon emissions [13]. This study integrated carbon storage and CESR, overcoming the one-sideness of focusing solely on carbon sources and highlighting the importance of comprehensive carbon source-sink assessment. The continuous degradation of grassland caused by human activities and the arid climate reduced grassland carbon storage by 611.34 Mt. This finding is consistent with Zhu et al. [44]. However, this study further quantifies the coupled effects of human activities and climate change, whereas Zhu et al. [44] emphasized climatic impacts alone. By incorporating the interactions between human activity, climate, and land use, this study fills the gap of insufficient consideration of multi-factor coupling in previous carbon storage studies in arid zones. Ecological restoration projects, including the Three-North Shelterbelt and Grain for Green programmes, effectively enhanced vegetation cover and soil carbon sequestration, increasing forest carbon storage by 73.47 Mt. This confirms that ecological engineering plays a critical role in enhancing carbon sinks in arid regions, which is of great significance for regional carbon balance and desertification control. During 2000–2020, carbon emissions grew rapidly while carbon storage showed an “initial increase followed by decline” pattern, which led to a rising of CESR. This divergence reflects the imbalance between rapid socioeconomic development and relatively fragile ecological carrying capacity in arid regions, which is supported by Li et al. [14].
Under SSP126 and SSP245 scenarios, strict constraints on construction land expansion and low-carbon development pathways effectively suppressed carbon emissions, leading to a continuous decline in the CESR after 2030. This trend is consistent with China’s carbon peak goal, indicating that Xinjiang has the potential to become an important national carbon sink, which provides a scientific basis for promoting the “dual carbon” strategy in inland arid regions. In the SSP245 scenario, continuous grassland degradation weakens the carbon sink capacity, partially offsetting emission reduction benefits and threatening the long-term realization of carbon neutrality. Under the SSP585 scenario, rapid economic growth and high-intensity energy consumption drive sharp expansion of construction land, increasing carbon emissions by 1482.94 Mt and reducing grassland carbon storage by 110.18 Mt. The CESR increases by nearly 2.64 times from 0.0618 to 0.2252. These dynamics establish a self-reinforcing cycle of “high emissions and low storage”, which is in stark contradiction with the targets outlined in China’s 14th Five-Year Plan.
4.2. Countermeasures and Suggestions
The results indicated that although Xinjiang serves as a contributor to China’s national carbon cycle, its fragile ecological environment renders this contribution highly unstable. Xinjiang is expected to occupy a complex and pivotal position within China’s future carbon cycle framework. To enable a transition from an unstable contributor to a reliable carbon sink provider, the following strategies should be prioritized. Firstly, differentiated land-use policies should be formulated according to spatial distribution characteristics. Strict protection and boundary control should be implemented in high carbon sink areas identified to maintain and enhance carbon sink stability. Secondly, low-carbon energy transformation should be promoted in carbon source areas with high emission intensity to curb carbon emission growth from the source. Thirdly, targeted ecological restoration should be strengthened in weak carbon sink areas to improve carbon sequestration capacity and stabilize regional carbon storage. Xinjiang is expected to become a principal carbon sink supplier within the national carbon trading market. It will also be a pivotal region bridging ecological protection and the realization of carbon sink benefits. This can be achieved by adopting the aforementioned strategies.
4.3. Limitations and Future Perspectives
The uncertainties of this study can were shown in the following three aspects. First, the carbon emission coefficients are adopted from previous studies, which may differ from local actual values in Xinjiang and affect the accounting accuracy. Second, the SD model involves many socio-economic and ecological parameters, and slight parameter variations may lead to simulation fluctuations. Third, no sensitivity analysis was conducted for the SSP-RCP scenarios, which introduces uncertainties into the research results. In addition, this study has several limitations. First, the carbon emission coefficients are assumed to be temporally stationary, without considering the dynamic changes driven by technological progress, management improvement and climate change. Second, the carbon accounting only focuses on CO2 emissions, failing to incorporate CH4 and N2O emissions from agricultural activities. Third, the InVEST carbon module has inherent limitations in estimating soil organic carbon in arid regions with sparse vegetation and strong soil heterogeneity. Fourth, the SD model does not include an independent policy subsystem, and policy effects are only reflected through scenario parameters.
Future research should therefore prioritize using dynamic carbon emission coefficients, incorporating non-CO2 greenhouse gases, optimizing soil carbon estimation methods for arid zones, conducting sensitivity analysis of the results using more models and more SSP-RCP scenarios, and quantifying the independent impacts of policy factors on land-use dynamics and carbon balance, thereby providing more robust support for accurate carbon accounting and evidence-based ecological policy formulation.
5. Conclusions
This study coupled the SD–PLUS–InVEST model to systematically analyze the spatiotemporal evolution of land use, carbon emissions, and carbon storage, CESR in Xinjiang from 2000 to 2060. The results indicated that the construction and cultivated land continuously expanded, particularly along the northern and southern slopes of the Tianshan Mountains and in oasis regions such as Aksu and Turpan in Xinjiang. Grassland and unused land were the primary sources of land conversion. Under the SSP585 scenario, construction land expanded most rapidly from 2030 to 2060, resulting in the most severe ecological degradation. Carbon emissions displayed a spatial pattern of “high values around mountain ranges and low values in basins.” From 2020 to 2060, carbon emissions under the SSP126 and SSP245 scenarios followed an inverted U-shaped trajectory, peaking around 2030, whereas emissions under the SSP585 scenario exhibited a continuous upward trend, reaching 2036.84 Mt by 2060. From 2000 to 2060, carbon storage exhibits a gradual overall increase, with a persistent spatial pattern characterized by higher values in the northwest and lower values in the southeast. From 2000 to 2060, the CESR in Xinjiang remains consistently below 1, indicating that the region continues to function as a net contributor to national carbon balance. Under the SSP585 scenario, this CESR exhibits a sustained increase from 2020 to 2060, and reaching 0.2252 by 2060, suggesting a tendency toward reduced stability in carbon sequestration capacity. Although Xinjiang generally maintains its carbon sink function from 2000 to 2060, drastic land-use changes, especially the rapid expansion of construction land and the decline of grassland, have exerted significant pressure on ecosystems. Different future development pathways will profoundly affect the carbon balance of Xinjiang. Under the SSP1–2.6 and SSP2–4.5 scenarios, carbon emissions are expected to peak and then decline, with carbon storage remaining relatively stable. However, under the SSP5–8.5 pathway, carbon emissions will continue to surge, resulting in a remarkable increase in the CESR, which seriously threatens the carbon balance of Xinjiang and puts its function as an important national carbon sink area at risk of degradation. It is urgent for Xinjiang to adopt an ecological-priority development strategy to avoid the ecological risks caused by high-emission pathways.
The findings provide scientific support for territorial spatial regulation, ecological restoration, and energy transition in Xinjiang, thereby contributing to the achievement of China’s dual-carbon goals in ecologically fragile western regions. However, this study also has certain limitations. Notably, the future projections under different SSP-RCP scenarios rely on scenario assumptions and model simulations and thus require further empirical validation with long-term observational data in future research. In the future, Xinjiang’s improving carbon sink capacity may offer prospects for it to assume a notable role in national carbon compensation and carbon trading markets, though further research and data support would be needed.
Author Contributions
Conceptualization, J.L. and F.Z.; methodology, J.L. and F.Z.; software, J.L. and J.M.; validation, J.L. and A.M.; formal analysis, Q.L. and D.L.; resources, F.Z.; data curation, J.L.; writing—original draft preparation, J.L. and F.Z.; writing—review and editing, F.Z.; visualization, J.L.; supervision, F.Z. All authors have read and agreed to the published version of the manuscript.
Funding
This research was supported by the 2025 Graduate Research Innovation Project of Xinjiang Uygur Autonomous Region (XJ2025G123); the Xinjiang Key Laboratory of Water Cycle and Utilization in Arid Zone (XJYS0907-2023-06); the Xinjiang Talent Development Fund (XJRC-2025-KJ-PY-KJLJ-100); and the 2025 Graduate Research Innovation Project of Xinjiang Agricultural University (XJAUGRI2025021).
Data Availability Statement
The original contributions presented in this study are included in the article.
Acknowledgments
The authors would like to thank the anonymous reviewers and the editors for their helpful suggestions on the earlier draft of our paper.
Conflicts of Interest
The authors declare no conflicts of interest.
Appendix A
Table A1.
Main equations of the SD model.
References
- Chen, W.X.; Gu, T.C.; Fang, C.L.; Zeng, J. Global urban low-carbon transitions: Multiscale relationship between urban land and carbon emissions. Environ. Impact Assess. Rev. 2023, 100, 107076. [Google Scholar] [CrossRef] [Scilit]
- Ding, M.L.; Yang, X.N.; Zhao, R.Q.; Zhang, Z.P.; Xiao, L.G.; Xie, Z.X. Optimization of Territorial Spatial Pattern Under the Carbon Neutrality Goal: Theoretical Framework and Practical Strategies. J. Nat. Resour. 2022, 37, 1137–1147. [Google Scholar] [CrossRef] [Scilit]
- Li, D.C.; Lu, J.Q.; Xie, X.W.; Yu, H.; Li, Y.; Wu, S. Optimization of Territorial Spatial Zoning Under the Classification Constraints of Major Function Zones from the Perspective of Carbon Neutrality: A Case Study of Fujian Province. Acta Ecol. Sin. 2022, 42, 10111–10126. [Google Scholar] [CrossRef] [Scilit]
- Yang, G.Q.; Zhu, W.R.; Wen, Y.; Lin, Y.C. Spatial Differentiation in the Intensity and Efficiency of Carbon Emission from Land Use in Guangdong Province in Past Two Decades. Ecol. Environ. Sci. 2019, 28, 332–340. [Google Scholar] [CrossRef]
- Fang, J.Y. Ecological Perspectives of Carbon Neutrality. Chin. J. Plant Ecol. 2021, 45, 1173–1176. [Google Scholar] [CrossRef] [Scilit]
- Baumann, M.; Gasparri, I.; Piquer-Rodríguez, M.; Gavier Pizarro, G.; Griffiths, P.; Hostert, P.; Kuemmerle, T. Carbon emissions from agricultural expansion and intensification in the Chaco. Glob. Change Biol. 2017, 23, 1902–1916. [Google Scholar] [CrossRef] [Scilit]
- Houghton, R.A. Revised Estimates of the Annual Net Flux of Carbon to the Atmosphere from Changes in Land Use and Land Management 1850–2000. Tellus B 2003, 55, 378–390. [Google Scholar] [CrossRef] [Scilit]
- Liu, L.; Qu, J.; Gao, F.; Maraseni, T.N.; Wang, S.; Aryal, S.; Zhang, Z.; Wu, R. Land Use Carbon Emissions or Sink: Research Characteristics, Hotspots and Future Perspectives. Land 2024, 13, 279. [Google Scholar] [CrossRef] [Scilit]
- Friedlingstein, P.; O′SUllivan, M.; Jones, M.W.; Andrew, R.M.; Gregor, L.; Hauck, J.; Le Quéré, C.; Luijkx, I.T.; Olsen, A.; Peters, G.P.; et al. Global Carbon Budget 2022. Earth Syst. Sci. Data 2022, 14, 4811–4900. [Google Scholar] [CrossRef] [Scilit]
- Li, Z.; Zhang, L.; Wang, W.; Ma, W. Assessment of Carbon Emission and Carbon Sink Capacity of China’s Marine Fishery under Carbon Neutrality Target. J. Mar. Sci. Eng. 2022, 10, 1179. [Google Scholar] [CrossRef] [Scilit]
- Wen, H.; Li, Y.; Li, Z.; Cai, X.; Wang, F. Spatial Differentiation of Carbon Budgets and Carbon Balance Zoning in China Based on the Land Use Perspective. Sustainability 2022, 14, 12962. [Google Scholar] [CrossRef] [Scilit]
- Chen, J.Q.; Zhang, K.; Li, X.S.; Shao, Z.H.; Zhai, X.Y. Accounting of Carbon Source/Sink and the Zoning Regulation of Carbon Balance in the Yangtze River Economic Belt: Practicing the Concept of “Prioritizing Ecological Conservation over Excessive Development”. J. Nat. Resour. 2025, 40, 3370–3393. [Google Scholar] [CrossRef] [Scilit]
- Liu, J.M.; Pei, X.T.; Zhu, W.Y.; Jiao, J.Z. Multi-Scenario Simulation of Carbon Budget Balance in Arid and Semi-Arid Regions. J. Environ. Manag. 2023, 346, 119016. [Google Scholar] [CrossRef] [Scilit]
- Li, J.Q.; Zhang, F.Y.; Li, Q.; Teng, L.; Li, D.Q.; Zhou, X.Y. Spatiotemporal Evolution Analysis and Simulation of Carbon Emissions and Carbon Storage from Land Use in Xinjiang Based on the PLUS-InVEST Model. J. Agric. Resour. Environ. 2025, 42, 1636–1647. (In Chinese) [Google Scholar] [CrossRef]
- Yang, Y.P.; Hu, W.M.; Jia, G.Y.; Li, G.; Li, Y. Scenario Simulation of Land Use Carbon Storage in the Surrounding Areas of Dongting Lake Based on InVEST and ANN-CA Models. J. Nanjing For. Univ. (Nat. Sci. Ed.) 2023, 47, 175–184. [Google Scholar] [CrossRef]
- Rani, A.; Gupta, S.K.; Singh, S.K.; Meraj, G.; Kumar, P.; Kanga, S.; Đurin, B.; Dogančić, D. Predicting Future Land Use Utilizing Economic and Land Surface Parameters with ANN and Markov Chain Models. Earth 2023, 4, 728–751. [Google Scholar] [CrossRef] [Scilit]
- Zhang, J.C.; Li, L.; Li, Q.S.; Chen, W.Q.; Huang, J.C.; Guo, Y.L.; Ji, G.X. Multiscenario Land Use Change Simulation and Its Impact on Ecosystem Service Function in Henan Province Based on FLUS-InVEST Model. Ecol. Evol. 2025, 15, e71111. [Google Scholar] [CrossRef] [Scilit] [PubMed]
- Liu, X.P.; Liang, X.; Li, X.; Xu, X.C.; Ou, J.P.; Chen, Y.M.; Li, S.Y.; Wang, S.J.; Pei, F.S. A Future Land Use Simulation Model (FLUS) for Simulating Multiple Land Use Scenarios by Coupling Human and Natural Effects. Landsc. Urban Plan. 2017, 168, 94–116. [Google Scholar] [CrossRef] [Scilit]
- Halmy, M.W.A.; Gessler, P.E.; Hicke, J.A.; Salem, B.B. Land Use/Land Cover Change Detection and Prediction in the North-Western Coastal Desert of Egypt Using Markov-CA. Appl. Geogr. 2015, 63, 101–112. [Google Scholar] [CrossRef] [Scilit]
- Ma, S.L.; Huang, J.L.; Wang, X.X.; Fu, Y. Multi-Scenario Simulation of Low-Carbon Land Use Based on the SD-FLUS Model in Changsha, China. Land Use Policy 2025, 148, 107418. [Google Scholar] [CrossRef] [Scilit]
- Zhang, Z.R.; Li, X.M.; Liu, X.Y. Dynamic Simulation and Projection of Land Use Change Using System Dynamics Model in the Chinese Tianshan Mountainous Region, Central Asia. Sci. Total Environ. 2024, 487, 110564. [Google Scholar] [CrossRef] [Scilit]
- Rong, T.Q.; Qin, M.Z.; Zhang, P.Y.; Chang, Y.H.; Liu, Z.Y.; Zhang, Z.F. Spatiotemporal Evolution of Land Use Carbon Emissions and Multi-Scenario Simulation in the Future—Based on Carbon Emission Fair Model and PLUS Model. Environ. Technol. Innov. 2025, 38, 104087. [Google Scholar] [CrossRef] [Scilit]
- Meng, J.J.; Wang, C.; Zou, Y.; Han, Z.Y.; Zou, G.N. Multi-Scale Spatiotemporal Interactions Between Land Use Transformation and Carbon Emissions in China from 1980 to 2020. Resour. Conserv. Recycl. 2026, 226, 108653. [Google Scholar] [CrossRef] [Scilit]
- Nelson, E.; Sander, H.; Hawthorne, P.; Conte, M.; Ennaanay, D.; Wolny, S.; Manson, S.; Polasky, S. Projecting Global Land-Use Change and Its Effect on Ecosystem Service Provision and Biodiversity with Simple Models. PLoS ONE 2010, 5, e14327. [Google Scholar] [CrossRef] [Scilit]
- Peng, M.; Yang, Y.; Deng, Y.; Jize, D.; Chen, H.; Hai, Y.; Liu, G.; Wang, H.; Xie, T.; Li, H.; et al. The Impact of the Grain-for-Green Programme on Carbon Storage in the Upper Yangtze River Basin Based on the PLUS-InVEST Model. Carbon Balance Manag. 2025, 20, 24. [Google Scholar] [CrossRef] [Scilit] [PubMed]
- Li, Y.; Peng, Y.-L.; Cheng, W.-Y.; Peng, H.-N. Spatial-Temporal Evolution and Multi-Scenario Prediction of Carbon Emissions from Land Use in the Adjacent Areas of Nature Reserves. Ecol. Indic. 2025, 170, 113047. [Google Scholar] [CrossRef] [Scilit]
- Wu, Q.; Wang, L.; Wang, T.Y.; Ruan, Z.Y.; Du, P. Spatial–Temporal Evolution Analysis of Multi-Scenario Land Use and Carbon Storage Based on PLUS-InVEST Model: A Case Study in Dalian, China. Ecol. Indic. 2024, 166, 112448. [Google Scholar] [CrossRef] [Scilit]
- Li, D.Q.; Zhang, F.Y.; Li, Q.; Zhou, H.T.; Li, J.Q.; Zhou, X.Y. Spatiotemporal Evolution and Prediction of Carbon Storage in the Bosten Lake Basin Based on the PLUS-InVEST Model. J. Agric. Resour. Environ. 2025, 42, 1267–1276. (In Chinese) [Google Scholar] [CrossRef]
- Jiang, H.; Cui, Z.; Fan, T.; Yin, H. Impacts of Land Use Change on Carbon Storage in the Guangxi Beibu Gulf Economic Zone Based on the PLUS-InVEST Model. Sci. Rep. 2025, 15, 6468. [Google Scholar] [CrossRef] [Scilit]
- Yang, J.; Huang, X. The 30 m Annual Land Cover Dataset and Its Dynamics in China from 1990 to 2019. Earth Syst. Sci. Data 2021, 13, 3907–3925. [Google Scholar] [CrossRef] [Scilit]
- Chen, Y.D.; Guo, F.; Wang, J.C.; Cai, W.J.; Wang, C.; Wang, K.C. Provincial and Gridded Population Projection for China under Shared Socioeconomic Pathways from 2010 to 2100. Sci. Data 2020, 7, 83. [Google Scholar] [CrossRef] [Scilit]
- Murakami, D.; Yoshida, T.; Yamagata, Y. Gridded GDP Projections Compatible with the Five SSPs (Shared Socioeconomic Pathways). Front. Built Environ. 2021, 7, 760306. [Google Scholar] [CrossRef] [Scilit]
- Xing, X.T.; Wang, Q.; Meng, F.; Liu, P.D.; Huang, L.; Zhuo, W. Assessing the Land Use-Carbon Storage Nexus Along G318: A Coupled SD-PLUS-InVEST Model Approach for Spatiotemporal Coordination Optimization. Land 2025, 14, 2067. [Google Scholar] [CrossRef] [Scilit]
- Li, Y.; Wang, C.D.; Sun, M.X.; Zhang, H. Dynamic Simulation of Land Use Change and Assessment of Ecosystem Services Under Climate Change Scenarios: A Case Study of Shanghai, China. Land 2025, 14, 1791. [Google Scholar] [CrossRef] [Scilit]
- Wang, Z.Y.; Li, X.; Mao, Y.T.; Li, L.; Wang, X.R.; Lin, Q. Dynamic Simulation of Land Use Change and Assessment of Carbon Storage Based on Climate Change Scenarios at the City Level: A Case Study of Bortala, China. Ecol. Indic. 2022, 134, 108499. [Google Scholar] [CrossRef] [Scilit]
- Cui, Y.Y.; Wu, C.B.; Niu, G.; Huang, G.H. Water Yield Service Flow Assessment Under Future SSP-RCP Scenarios in the Yellow River Basin: Coupled Effect of Climate and Land Use Change. J. Hydrol. 2025, 662, 133852. [Google Scholar] [CrossRef] [Scilit]
- Liang, X.; Guan, Q.F.; Clarke, K.C.; Liu, S.S.; Wang, B.Y.; Yao, Y. Understanding the Drivers of Sustainable Land Expansion Using a Patch-Generating Land Use Simulation (PLUS) Model: A Case Study in Wuhan, China. Comput. Environ. Urban Syst. 2021, 85, 101569. [Google Scholar] [CrossRef] [Scilit]
- Dietz, T.; Rosa, E.A. Effects of Population and Affluence on CO2 Emissions. Proc. Natl. Acad. Sci. USA 1997, 94, 175–179. [Google Scholar] [CrossRef] [Scilit]
- Hou, Y.F.; Chen, Y.N.; Li, Z.; Li, Y.P.; Sun, F. Land Structure Change and Ecological Effects Under Future Development Scenarios in Tarim River Basin, Central Asia. Geogr. Sustain. 2025, 6, 100300. [Google Scholar] [CrossRef] [Scilit]
- Ye, Y.; Lai, M.; Dong, M.; Li, Z.; Yuan, J.; Lyu, J. Coupling the PLUS-InVEST Model for Multi-Scenario Land Use Simulation and Carbon Storage Assessment in Northern Anhui, China. Sustainability 2025, 17, 4185. [Google Scholar] [CrossRef] [Scilit]
- Jing, J.; Wei, F.; Jiang, H.; Chen, Z.; Lv, S.; Li, T.; Li, W.; Tang, Y. Prediction of Land Use Change and Carbon Storage in Lijiang River Basin Based on InVEST-PLUS Model and SSP-RCP Scenario. Land 2025, 14, 460. [Google Scholar] [CrossRef] [Scilit]
- Alam, S.A.; Starr, M.; Clark, B.J.F. Tree Biomass and Soil Organic Carbon Densities across the Sudanese Woodland Savannah: A Regional Carbon Sequestration Study. J. Arid. Environ. 2013, 89, 67–76. [Google Scholar] [CrossRef] [Scilit]
- Giardina, C.P.; Ryan, M.G. Evidence that decomposition rates of organic carbon in mineral soil do not vary with temperature. Nature 2000, 404, 858–861. [Google Scholar] [CrossRef] [Scilit]
- Zhu, G.F.; Qiu, D.; Zhang, Z.; Sang, L.; Liu, Y.; Wang, L.; Zhao, K.; Ma, H.; Xu, Y.; Wan, Q. Land-Use Changes Lead to a Decrease in Carbon Storage in Arid Region, China. Ecol. Indic. 2021, 127, 107770. [Google Scholar] [CrossRef] [Scilit]

Disclaimer/Publisher’s Note: The statements, opinions and data contained in all publications are solely those of the individual author(s) and contributor(s) and not of MDPI and/or the editor(s). MDPI and/or the editor(s) disclaim responsibility for any injury to people or property resulting from any ideas, methods, instructions or products referred to in the content. |
© 2026 by the authors. Licensee MDPI, Basel, Switzerland. This article is an open access article distributed under the terms and conditions of the Creative Commons Attribution (CC BY) license.