


Abstract
Urban agglomerations have become the dominant spatial platform of urbanization, regional coordination, and economic transformation in China. Yet whether the expansion of agglomeration scale at the urban-agglomeration level alleviates or intensifies energy use remains insufficiently understood. Extending the scale of analysis from individual cities to integrated urban agglomerations, this study investigates 64 cities in four major Chinese urban agglomerations, including Beijing–Tianjin–Hebei, the Yangtze River Delta, the Pearl River Delta, and Chengdu–Chongqing, over the period 2006–2023. Using panel data models, this study examines the impact of the scale agglomeration within urban agglomeration on urban energy intensity. The results show that the overall agglomeration scale generated by urban agglomeration formation significantly suppresses energy intensity while indicating a robust energy-saving effect: every 10% increase in agglomeration scale is associated with a decline of approximately 0.0893 million tons of standard coal per CNY 100 million of GDP. This finding remains stable after addressing endogeneity concerns and performing a series of robustness checks. Mechanism analyses further suggest that this effect operates primarily through talent agglomeration, technological progress, and public transportation expansion. In addition, the energy-saving effect is more pronounced in smaller cities, cities with lower administrative rank, cities with weaker factor mobility, and cities characterized by poorer air quality but stronger public environmental attention. These findings contribute to the literature on urban agglomeration and green development by showing that the agglomeration scale within urban agglomerations can generate inclusive energy-efficiency gains, especially for relatively disadvantaged cities, thereby offering important implications for spatial governance and low-carbon transition in rapidly urbanizing economies.
1. Introduction
China’s urban transition has entered a stage in which development is increasingly shaped not by isolated cities, but by interconnected urban agglomerations and emerging mega-regional systems. According to the National Bureau of Statistics of China, by the end of 2024 the country’s urban permanent population had reached 943.50 million, and the urbanization rate had risen to 67.00%. A growing body of research argues that China’s urbanization is being reorganized through urban agglomerations and mega-city regions, where intensified inter-city linkages, functional specialization, and regional integration are redefining the spatial foundations of growth [1,2]. In this context, urban agglomerations are no longer merely a descriptive spatial phenomenon; they have become a core territorial unit through which China pursues coordinated development, industrial upgrading, and ecological transition.
This transition, however, is accompanied by a profound sustainability challenge. Urban agglomerations are areas of dense population, concentrated production, intensive mobility, and high resource throughput; they therefore sit at the center of the tension between economic dynamism and environmental constraint. Recent studies show that Chinese urban agglomerations are major arenas of urbanization, carbon pressure, and green-development divergence [3,4]. In policy terms, the issue is especially salient because green and low-carbon transition has become an explicit national objective. Yet whether the expansion of the agglomeration scale within urban agglomerations contributes to lower energy intensity remains an open empirical question.
Existing research offers competing theoretical expectations. On the one hand, agglomeration may reduce energy intensity by generating scale economies, improving matching efficiency, facilitating knowledge spillovers, and accelerating technological upgrading. Recent evidence suggests that economic agglomeration can improve energy efficiency, while technological progress remains a critical channel through which energy intensity declines [5,6]. Related work further shows that urban agglomeration policies in China can reduce energy intensity, implying that integrated regional development may create energy-saving benefits beyond the boundaries of individual cities [7]. From this perspective, a larger agglomeration scale within urban agglomerations may enhance resource allocation, diffuse cleaner technologies, and enable more efficient infrastructure use, thereby lowering energy intensity.
On the other hand, agglomeration may also increase energy demand through congestion, rebound effects, and transport- or industry-related expansion. Research shows that the relationship between city size and energy conservation is not uniformly beneficial, and that larger urban scale can, under some conditions, intensify energy use [8]. At the urban-agglomeration level, Wang et al. report complex interactions among economic agglomeration, energy intensity, and carbon intensity across China’s three major urban agglomerations, suggesting that agglomeration may produce both efficiency gains and environmental pressures [9]. Similarly, recent work indicates that the environmental outcomes of urbanization and spatial concentration vary substantially across Chinese urban agglomerations, with differences in urban form, land development, and regional structure shaping carbon outcomes in non-uniform ways [3,10]. In short, the existing literature does not provide a definitive answer as to whether the agglomeration scale within urban agglomerations is ultimately energy-saving or energy-intensive.
More importantly, a scale-related gap remains. Much of the literature focuses on city size, industrial or economic agglomeration at the city level, or the quasi-natural-experiment effects of urban agglomeration policy [5,6,11]. These studies are valuable, but they do not fully capture the collective agglomeration scale formed through sustained inter-city integration within major urban agglomerations. In other words, the literature has paid far more attention to agglomeration within individual cities or to the policy treatment of cities than to the agglomeration scale within urban agglomerations generated across interconnected cities. This distinction matters because urban agglomerations function through networked complementarities, division of labor, cross-city commuting, infrastructure sharing, and factor circulation—mechanisms that differ analytically from the internal scale economies of a single city. As a result, the environmental implications of agglomeration may be misestimated if the spatial unit of analysis remains confined to the individual city.
From the perspective of land-system governance, the rise in urban agglomerations has changed the scale at which economic activity, infrastructure provision, and environmental externalities should be analyzed. Recent studies show that carbon emissions in China are closely intertwined with land urbanization, urban form, and city-level development trajectories, suggesting that energy and carbon outcomes increasingly depend on cross-jurisdictional spatial organization rather than on isolated local attributes alone [3,4,10,11]. This is particularly relevant in China, where national territorial planning, new-type urbanization, and the “dual carbon” agenda are being implemented simultaneously, making urban agglomerations a key policy arena in which development efficiency and environmental performance must be coordinated.
Energy intensity is an especially useful lens through which to examine the energy-saving effect of city-cluster development. Compared with total energy consumption, which tends to scale mechanically with economic size, energy intensity focuses more directly on the efficiency with which energy is transformed into economic output. It is therefore well suited to identifying whether deeper urban agglomerations improve the quality rather than merely the quantity of development. If the agglomeration scale within urban agglomerations can reduce energy intensity, the implication is not simply that cities consume less energy in absolute terms, but that city-cluster development can reorganize production, mobility, and innovation in a more resource-efficient way.
To integrate the above literature and provide a unified explanation for both the average and heterogeneous effects examined in this study, this paper develops a theoretical framework linking the agglomeration scale within urban agglomerations to urban energy intensity through agglomeration externalities, mechanism channels, and heterogeneous local conditions. Specifically, the expansion of the agglomeration scale within urban agglomerations is expected to affect urban energy intensity through the regional logic of sharing, matching, and learning. Through these processes, the city-cluster system may improve resource allocation, accelerate knowledge diffusion, and enhance infrastructure efficiency, thereby lowering the amount of energy required per unit of output.
Against this background, the present study asks three related questions. First, does the agglomeration scale within urban agglomerations significantly reduce urban energy intensity? Second, through what channels does this effect operate? Third, is the energy-saving effect evenly distributed, or does it accrue more strongly to particular types of cities within the urban agglomeration?
Using panel data for 64 cities in the Beijing–Tianjin–Hebei, Yangtze River Delta, Pearl River Delta, and Chengdu–Chongqing urban agglomerations from 2006 to 2023, this study investigates whether the agglomeration scale within urban agglomerations lowers urban energy intensity, through which mechanisms such effects operate, and under what urban conditions they are strengthened or weakened. Figure 1 presents the detailed research process and framework. These four urban agglomerations provide an especially appropriate empirical setting. They are among China’s most important urban agglomerations in terms of population concentration, economic scale, inter-city connectivity, and policy salience. At the same time, they differ in administrative structure, industrial composition, geography, and stage of integration, allowing the analysis to capture meaningful variation in both agglomeration scale and energy performance. By focusing on these four urban agglomerations, the paper is able to address not only the general relationship between agglomeration and energy intensity, but also the way in which that relationship may vary across different models of regional urbanization.
Figure 1.
Research flowchart of the study.
By answering these questions, the paper contributes to the broader literature on urban agglomeration, land-use governance, and green transition, while also offering evidence that may inform differentiated regional policy design under conditions of rapid urban and territorial restructuring. This paper makes three contributions. First, it shifts the analytical lens from intra-urban agglomeration to the agglomeration scale within urban agglomerations, thereby enriching the literature on the environmental consequences of city-cluster development. Second, it opens the “black box” of the agglomeration effect by examining three mechanisms, namely, talent agglomeration, technological progress, and public transportation expansion. Third, it highlights the inclusiveness of the energy-saving effect by testing heterogeneous impacts across city size, administrative rank, factor mobility, air quality, and public environmental concern.
2. Theoretical Framework and Research Hypotheses
2.1. Theoretical Framework
The theoretical basis of this study is primarily grounded in agglomeration economics and the new economic geography. From this perspective, the agglomeration scale within urban agglomerations is not merely a simple concentration of population and economic activities. More importantly, it generates broader agglomeration externalities through inter-city connectivity, factor circulation, functional specialization, and networked coordination. Such externalities may reshape how cities allocate resources, diffuse knowledge, and utilize infrastructure, thereby affecting the amount of energy required to produce a given level of output.
More specifically, the effect of the agglomeration scale within urban agglomerations on energy intensity can be understood through the classical logic of sharing, matching, and learning. First, agglomeration allows cities within the same urban agglomeration to share infrastructure, public services, and market access, which improves the utilization efficiency of transport systems and other facilities. Second, a larger and more integrated agglomeration scale within urban agglomerations improves the matching of labor, firms, capital, and other productive factors across cities, thereby reducing misallocation and enhancing production efficiency. Third, intensified interaction among cities strengthens learning effects by facilitating knowledge spillovers, technological diffusion, and collaborative innovation. Through these channels, a larger agglomeration scale within urban agglomerations may lower the energy required to generate a given level of output and thus reduce urban energy intensity.
This framework is especially suitable for the present study because the core explanatory variable is not intra-urban concentration within one administrative unit, but rather the effective scale generated across interconnected cities within the same urban agglomeration. Compared with traditional city-level agglomeration, the agglomeration scale within urban agglomerations better captures the regional system formed by cross-city commuting, infrastructure sharing, labor circulation, and network complementarities. To clarify the theoretical distinction between these two concepts, Table 1 summarizes their key differences among several dimensions, including spatial scale, sources of externalities, core mechanisms, and potential costs.
Table 1.
Theoretical distinction between intra-urban agglomeration and cross-city integration within urban agglomerations.
Traditional agglomeration economics, rooted in Marshallian theory, primarily ex-plains the benefits arising from the spatial concentration of economic activities through geographical proximity, including infrastructure sharing, labor-market pooling, and localized knowledge spillovers [12]. However, this perspective mainly emphasizes proximity-based externalities and is less well suited to explaining the benefits generated through sustained cross-city interaction within integrated urban regions. By contrast, the agglomeration scale examined in this study emphasizes cross-city linkages, functional complementarity, and network-mediated spillovers across multiple interconnected cities. In this sense, the analysis extends the focus of traditional agglomeration economies toward the role of network externalities in urban agglomerations [13,14]. A key concept bridging these perspectives is “borrowed size”, originally proposed by Alonso in 1973, which describes how smaller cities located within a larger urban complex can gain access to some of the agglomeration benefits of larger neighboring cities [15]. Meijers and Burger further developed this idea by arguing that borrowed size occurs when a city exhibits urban functions and/or performance levels normally associated with larger cities, enabled through interactions in networks of cities that can substitute for some of the benefits of geographical proximity [16]. More recently, Zhang and Sun distinguished two types of urban network externalities corresponding to Central Place Theory and Central Flow Theory, thereby highlighting that inter-city linkages may arise from both hierarchical spatial structures and connectivity-driven urban networks [17]. Accordingly, the present study moves from a single-city logic of agglomeration toward a city-cluster logic centered on the agglomeration scale within urban agglomerations.
The framework also provides a basis for interpreting the heterogeneous effects identified later in the paper. The energy-saving benefits generated by agglomeration externalities are unlikely to be spatially uniform. Depending on initial urban conditions, some cities may obtain larger marginal gains from urban agglomerations than others. In particular, smaller cities and lower-rank cities may benefit through borrowed size [15,16], cities with weaker factor mobility may benefit through the easing of resource misallocation, and cities under stronger environmental pressure may convert agglomeration advantages into energy-saving outcomes more effectively under the combined influence of regulatory and social pressure.
On this basis, this study develops a unified analytical framework in which the agglomeration scale within urban agglomerations affects urban energy intensity through three main mechanism channels, i.e., talent agglomeration, technological progress, and public transportation expansion, while the magnitude of this effect is conditioned by city size, administrative rank, factor mobility, air quality, and public environmental concern.
2.2. The Agglomeration Scale Within Urban Agglomerations and Energy Intensity
Existing studies have generated important insights into the relationship between agglomeration and energy or environmental performance, but they remain fragmented in terms of analytical scale. One strand of the literature focuses on city-level economic agglomeration, showing that agglomeration can affect energy efficiency in a nonlinear manner [5]. Another strand examines urban-agglomeration-related policies, reporting that China’s urban agglomeration policy can reduce energy intensity [6]. Recent studies further show that Chinese urban agglomerations are major arenas of carbon pressure and green transition, but they also display substantial spatial heterogeneity in carbon-emission responses and green high-quality development trajectories [3,4].
The ambiguity in the literature is partly rooted in differences in spatial scale and analytical emphasis. Studies centered on city size or intra-city concentration often stress congestion, housing pressure, and the overuse of land and transport infrastructure, whereas studies that examine integrated urban regions are more likely to emphasize functional specialization, network externalities, and infrastructure sharing. From the perspective of agglomeration economics, this distinction is crucial. When agglomeration is conceptualized as concentration within a single city, its costs may be dominated by congestion and environmental pressure. When it is conceptualized as an agglomeration scale within urban agglomerations generated through the interaction of multiple cities, however, the regional system may realize part of the benefits of scale without reproducing all the diseconomies associated with monocentric overconcentration.
This paper argues that once cities are embedded in a sufficiently integrated urban agglomeration, the regional system may improve the efficiency of land use, infrastructure provision, factor allocation, and inter-city mobility. If the environmental footprint of growth depends on how land, infrastructure, and mobility are organized across space, then the agglomeration scale within urban agglomerations should matter for energy intensity in ways that cannot be captured by single-city measures alone. In mature urban agglomerations such as Beijing–Tianjin–Hebei, the Yangtze River Delta, the Pearl River Delta, and Chengdu–Chongqing, where regional integration and transport connectivity are relatively advanced, the net effect of a larger agglomeration scale within urban agglomerations is more likely to manifest through efficiency gains than through purely local congestion costs.
Therefore, we propose the following hypothesis:
H1.
The agglomeration scale within urban agglomerations significantly reduces urban energy intensity.
2.3. Talent Agglomeration as a Mechanism
One plausible mechanism is talent agglomeration. Urban agglomerations enlarge labor markets, improve matching efficiency between firms and workers, and lower the mobility cost of skilled labor across neighboring cities. Recent evidence shows that innovative human capital agglomeration significantly contributes to greener urban development [18]. More directly, urban agglomeration has been shown to reduce carbon-emission intensity partly through factor mobility and innovation [19].
From a theoretical perspective, the talent mechanism can be understood through the logic of matching efficiency and human capital externalities. A larger agglomeration scale within urban agglomerations expands the spatial scope within which firms and skilled labor can be matched, reducing search frictions and improving the probability that human capital is allocated to its most productive uses. At the same time, the concentration and circulation of talent can generate spillovers through professional interaction, imitation, organizational learning, and the diffusion of managerial knowledge.
In the context of energy intensity, talent agglomeration matters because highly skilled workers facilitate the adoption of advanced production technologies, cleaner managerial practices, and more efficient organizational arrangements. A larger agglomeration scale within urban agglomerations may also strengthen inter-city learning and professional interaction, allowing firms in non-core cities to access capabilities that would otherwise remain concentrated in metropolitan centers. The talent mechanism can also be understood from a dynamic rather than static perspective. Urban agglomerations do not merely host a larger labor pool at a given point in time; they can reshape the trajectory of human-capital accumulation by improving access to higher education, professional services, entrepreneurial opportunities, and cross-city job matching. In urban agglomerations with a larger agglomeration scale, students, researchers, engineers, and managers are more likely to circulate within a regional labor market rather than remain constrained within one administrative unit. Such circulation can strengthen both the stock and the allocative efficiency of human capital, increasing the probability that cities adopt less energy-intensive technologies and more sophisticated modes of production.
Therefore, we propose the following hypothesis:
H2.
The agglomeration scale within urban agglomerations reduces urban energy intensity by promoting talent agglomeration.
2.4. Technological Progress as a Mechanism
A second mechanism is technological progress. Technological advancement is one of the most direct drivers of lower energy intensity [6]. At the urban-agglomeration level, agglomeration can reduce carbon intensity by fostering innovation and improving factor mobility [19].
This mechanism can be further interpreted through knowledge spillover theory and the logic of endogenous growth. A larger agglomeration scale within urban agglomerations can accelerate technological progress through several channels. First, denser inter-city interactions promote knowledge spillovers and collaborative innovation. Second, regional specialization and division of labor encourage firms to upgrade production processes and adopt cleaner technologies. Third, integrated urban agglomerations typically provide a richer innovation ecosystem, including universities, R&D institutions, producer services, and digital infrastructure, which together improve the probability that new technologies are generated and diffused across cities.
Technological progress is especially relevant for energy intensity because it not only raises output, but also changes the way output is produced. Process innovation, equipment upgrading, cleaner production techniques, and energy-saving technological substitution can all lower the amount of energy required per unit of GDP. In this sense, technological progress constitutes a direct pathway through which agglomeration externalities are translated into lower energy intensity. As a result, the agglomeration scale within urban agglomerations is expected to lower energy intensity by inducing technology upgrading and innovation diffusion.
Therefore, we propose the following hypothesis:
H3.
The agglomeration scale within urban agglomerations reduces urban energy intensity by promoting technological progress.
2.5. Public Transport Expansion as a Mechanism
A third mechanism is public transportation expansion. Compared with traditional city-level agglomeration, the agglomeration scale within urban agglomerations is more strongly associated with regional accessibility, inter-city commuting, and integrated transport systems. Recent research shows that urban transportation development significantly reduces daily travel carbon emissions in Chinese cities [20]. Public transportation development is also negatively associated with carbon emissions, and energy consumption constitutes an important transmission channel [21].
The public transport mechanism can be understood through the logic of infrastructure sharing, network economies, and spatial coordination. Public transportation expansion deserves separate attention because it captures an infrastructural channel that is central to the functioning of urban agglomerations. Compared with isolated urban growth, city-cluster development is more likely to generate demand for commuter rail, inter-city expressways, bus integration, and multimodal coordination. When these systems are supplied efficiently, they can reduce generalized travel costs, encourage modal substitution away from private vehicles, and support more compact land-use patterns around transport corridors.
A larger agglomeration scale within urban agglomerations generally implies denser population distribution, stronger commuting demand, and closer inter-city economic linkages. These changes increase the feasibility and economic viability of public transport provision and make coordinated transport systems more likely to emerge. In turn, these changes can reduce the energy required to sustain production and daily mobility. Therefore, the agglomeration effect at the city-cluster level is expected to lower energy intensity through the expansion and optimization of public transportation systems.
Therefore, we propose the following hypothesis:
H4.
The agglomeration scale within urban agglomerations reduces urban energy intensity by expanding public transportation.
2.6. Heterogeneous and Inclusive Energy-Saving Effects
Beyond the average treatment effect, prior studies suggest that the environmental dividends of urban agglomeration may be heterogeneous and potentially inclusive. The carbon-reduction effect of urban agglomeration varies substantially across city types [14], and city-cluster development strategies may generate larger policy effects in relatively late-developing regions [22]. The concept of borrowed size further implies that smaller cities can benefit from the scale, functions, and spillovers of nearby larger cities in wider urban systems [16,23]. Administrative hierarchy and political rank may also condition how cities access fiscal and policy resources [24,25]. Finally, public environmental concern can exert pressure for emission reduction and greener urban development [26,27].
A heterogeneous perspective is also important because urban agglomerations are internally unequal systems. Core cities typically enjoy stronger market access, better infrastructure, thicker labor markets, and greater administrative support, whereas peripheral cities often face constraints in capital access, technological capability, and public-service provision. Whether the agglomeration scale within urban agglomerations narrows or widens such disparities is therefore an empirical question. If the environmental benefits of agglomeration are stronger in smaller, lower-rank, or lower-mobility cities, this would suggest that urban agglomerations can generate inclusive efficiency gains rather than simply reinforcing pre-existing hierarchies.
From a theoretical perspective, three additional ideas are useful here. First, the stronger effect in smaller cities and lower-rank cities can be interpreted through borrowed size: cities with limited internal scale and weaker institutional status may nevertheless gain access to the advantages of larger neighboring cities through regional integration, including market access, infrastructure sharing, knowledge spillovers, and public services. Second, the stronger effect in cities with lower factor mobility can be interpreted through the easing of resource misallocation. When labor, capital, goods, and information do not circulate efficiently, production efficiency and energy-use efficiency are likely to be lower, so the marginal gain from urban agglomerations may be larger. Third, the stronger effect in cities with poorer air quality and higher public environmental concern can be understood through the logic of environmental pressure and social constraint. In more polluted cities, and in cities where public concern is stronger, governments and firms may face greater incentives to convert agglomeration-generated advantages into concrete energy-saving outcomes.
Building on this logic, the present study argues that the energy-saving effect of the agglomeration scale within urban agglomerations is not necessarily monopolized by core metropolitan centers. On the contrary, because smaller cities, lower-ranked cities, and cities with weaker factor mobility often face stronger bottlenecks in talent access, technology diffusion, and infrastructure provision, their marginal gains from urban agglomerations may be larger. Likewise, in cities with poorer air quality and stronger public environmental concern, the external pressure for cleaner growth may amplify the efficiency benefits of agglomeration. This motivates a broader proposition of inclusive energy-saving effects in which urban agglomeration offers a form of latecomer advantage for relatively disadvantaged cities.
Therefore, we propose the following hypothesis:
H5.
The energy-saving effect of the agglomeration scale within urban agglomerations is more pronounced in relatively disadvantaged or environmentally constrained cities, including smaller cities, lower-rank cities, cities with weaker factor mobility, and cities facing stronger environmental pressure and public concern.
3. Materials and Methods
3.1. Model Specification
To examine the impact of the agglomeration scale within urban agglomerations on urban energy intensity, this study estimates the following benchmark panel regression model:
where denotes the energy intensity of city i in year t; represents the agglomeration scale generated by the urban agglomeration to which city i belongs in year t; is a vector of control variables; denotes city fixed effects; denotes year fixed effects; and is the error term. The coefficient of main interest is , which captures the direction and magnitude of the effect of the agglomeration scale within urban agglomerations on energy intensity.
If is significantly negative, it indicates that a larger agglomeration scale within urban agglomerations helps reduce urban energy intensity and thus improves energy-use efficiency.
The inclusion of city fixed effects controls for time-invariant unobservable characteristics, such as geographic conditions, historical industrial foundations, and institutional endowments, while year fixed effects absorb common macro shocks affecting all cities, including national energy policies, economic cycles, and broad technological changes. All regression analyses were performed using Stata software (version 17.0).
3.2. Variable Definition and Measurement
3.2.1. Dependent Variable
The dependent variable is urban energy intensity (). Following existing study [28], it is measured by the ratio of total energy consumption to GDP. This indicator reflects the amount of energy consumed per unit of economic output. A lower value of energy intensity indicates higher energy-use efficiency and stronger energy-saving performance.
3.2.2. Core Explanatory Variable
The core explanatory variable is the agglomeration scale within urban agglomerations (). Following Li and Zhang [29], this study defines it as the sum of the scale of other cities within the same urban agglomeration, weighted by the inverse of inter-city distance to account for distance decay in spatial interaction. The measure is constructed as follows:
where denotes the urban agglomeration to which city belongs; denotes the agglomeration scale enjoyed by city ; denotes other cities within the same urban agglomeration; is the size of city ; and is the spherical distance between city and city .
In this study, city size is measured by the resident population. Compared with registered population, resident population better captures the actual scale of urban activities under conditions of substantial cross-regional population mobility, and is therefore more consistent with the real demand for energy consumption. The variable is further logarithmically transformed to reduce skewness and facilitate elasticity interpretation.
3.2.3. Control Variables
To minimize estimation bias arising from omitted variables, a set of control variables is included in the regression model, following relevant studies [30,31].
First, economic development () is measured by the logarithm of GDP per capita. Higher levels of economic development may affect energy intensity through changes in industrial upgrading, technology adoption, and consumption structure.
Second, industrial structure () is measured by the ratio of value added in the secondary industry to GDP. Since industrial activities are generally more energy-intensive than service activities, a higher share of secondary industry may increase energy intensity.
Third, fiscal pressure () is measured by the ratio of local general budget expenditure to local general budget revenue. Cities under greater fiscal pressure may face constraints in environmental governance, infrastructure provision, and green investment.
Fourth, financial support () is measured by the ratio of the year-end balance of loans from financial institutions to GDP. Financial development may improve access to capital and thereby influence technology upgrading and energy efficiency.
Fifth, urbanization rate () is measured by the ratio of urban population to total population. Urbanization may affect energy intensity through agglomeration economies, infrastructure efficiency, and changes in production and lifestyle patterns.
Sixth, foreign direct investment () is measured by the ratio of foreign direct investment to GDP. FDI may reduce energy intensity through technology spillovers and management improvement, but it may also increase energy consumption if it is concentrated in energy-intensive sectors.
3.3. Sample and Data Sources
The sample covers 64 cities in four major Chinese urban agglomerations, namely Beijing–Tianjin–Hebei, the Yangtze River Delta, the Pearl River Delta, and Chengdu–Chongqing, over the period 2006–2023. Figure 2 presents the geographical distribution and city coverage of these four agglomerations. The statistical criteria for delimiting them are derived from China’s national spatial planning documents. Specifically, the four agglomerations were identified as national-level priority development zones in the National Main Functional Zone Plan issued by the State Council in 2010, which assigned them the functional orientation of optimized and key development. This designation was subsequently confirmed by dedicated central government planning documents. First, the Beijing–Tianjin–Hebei Coordinated Development Plan (2015) positioned the Beijing–Tianjin–Hebei agglomeration as a world-class urban cluster with Beijing as its core, covering Beijing, Tianjin, and 11 prefecture-level cities in Hebei (13 cities in total). Second, the Yangtze River Delta Urban Agglomeration Development Plan (2016) proposed building the Yangtze River Delta into a globally influential world-class urban agglomeration, encompassing 26 cities across Shanghai, Jiangsu, Zhejiang, and Anhui. Third, the Pearl River Delta agglomeration dates back to 1994, and after several rounds of adjustments, currently includes nine cities (Guangzhou, Shenzhen, Foshan, etc.), jointly forming the Guangdong–Hong Kong–Macao Greater Bay Area together with the special administrative regions of Hong Kong and Macao. Fourth, the Chengdu–Chongqing Urban Agglomeration Development Plan (2016) covers 16 cities, including Chongqing and 15 prefecture-level cities in Sichuan. Accordingly, the analytical sample of this study comprises 64 cities across the four agglomerations, following the administrative scope specified in the relevant planning documents. Detailed information on the above-mentioned policy documents is provided in Appendix A.
Figure 2.
Geographical distribution of the four major urban agglomerations in China. Note: This map is based on the standard map with approval number GS(2023)2767 from the Standard Map Service website of the Ministry of Natural Resources of the People’s Republic of China [32]. The base map boundaries have not been modified.
The selection of the Beijing–Tianjin–Hebei, Yangtze River Delta, Pearl River Delta, and Chengdu–Chongqing urban agglomerations as the study sample is justified on the following grounds.
First, these four urban agglomerations are among China’s most economically advanced and densely populated regions, accounting for a substantial share of national GDP and population. They are highly representative and provide an appropriate empirical setting for investigating how expanding agglomeration scale within urban agglomerations affects energy intensity. According to data from the National Bureau of Statistics, the population share of these four agglomerations increased from 38.8% in 2000 to 40.0% in 2010 and further to 41.6% in 2020, indicating a continuing trend toward population concentration. More specifically, data from the Beijing Municipal Bureau of Statistics show that in 2023 the Beijing–Tianjin–Hebei had a permanent resident population of 109 million, accounting for 7.73% of the national total, and a GDP of CNY 10.44 trillion, accounting for 8.29% of the national total. In the Yangtze River Delta, Shanghai had 24.87 million permanent residents in 2023, while Suzhou and Hangzhou each exceeded 10 million, and Hefei, Ningbo, and Nanjing each surpassed 9 million. According to the Seventh National Population Census Bulletin, the nine cities of the Pearl River Delta had 78.01 million permanent residents, accounting for 61.91% of Guangdong’s total population, and this share rose by 8.04 percentage points compared with the 2010 census, indicating further population concentration. The Chengdu–Chongqing urban agglomeration, located in western China, has a large population base, accounting for over 7% of the national population, and is known as the “fourth pole” of China’s economic growth. In 2023, Chongqing had approximately 31.91 million permanent residents and a GDP exceeding CNY 3 trillion, while Chengdu had about 21.40 million permanent residents and a GDP of CNY 2.21 trillion. The entire agglomeration is densely populated, rich in labor resources, and serves as an economic hub in western China.
Second, these four urban agglomerations exhibit strong spatial diversity, covering northern and southern, eastern and western, coastal and inland regions, with notable differences in development stages, industrial structures, and environmental conditions. The Beijing–Tianjin–Hebei is a key region in northern China, where traditional industries remain an important part of the economic base and where industrial transformation and environmental governance are both highly salient. The Yangtze River Delta is marked by a strong manufacturing base, advanced modern services, and high innovation capacity. The Pearl River Delta is characterized by an export-oriented economy and dynamic innovative industries and remains one of the most economically vibrant regions in China, with a continuously increasing capacity for population absorption. The Chengdu–Chongqing urban agglomeration, one of the largest population and economic clusters in western China, features a dual-core polarization spatial structure and is undergoing rapid industrialization and industrial transfer absorption. Such inter-regional variation enhances the external validity of the analysis and reduces the risk that the results are driven by one single type of urban agglomeration.
Finally, all four agglomerations are nationally designated strategic regions explicitly planned by the central government and are therefore important arenas for regional integration and low-carbon transition policies. This facilitates the examination and interpretation of the relationship between agglomeration scale and energy intensity and offers potentially relevant implications for other urban agglomerations in China and beyond. The coordinated development of the Beijing–Tianjin–Hebei and the integrated development of the Yangtze River Delta have been elevated to national strategies. The Pearl River Delta, as the main body of the Guangdong–Hong Kong–Macao Greater Bay Area, has likewise been incorporated into national strategic planning. The Chengdu–Chongqing urban agglomeration, as an important growth pole in western China, plays a crucial role in promoting western development, enhancing inland opening-up, and strengthening regional comprehensiveness. As core carriers of national spatial planning, these agglomerations have accumulated substantial policy experience in cross-regional resource allocation, coordinated industrial layout, and low-carbon policy transition, thereby providing a useful institutional context for identifying the impact of agglomeration scale on energy intensity.
The data are mainly obtained from the China Energy Statistical Yearbook, the China City Statistical Yearbook, as well as provincial and municipal statistical yearbooks and official websites of local statistical bureaus. The combination of these sources ensures relatively comprehensive coverage of energy, economic, demographic, fiscal, and financial indicators at the city level.
3.4. Descriptive Statistics
Table 2 reports the descriptive statistics of the main variables. Urban energy intensity exhibits substantial variation across the sample, and the effective agglomeration scale within urban agglomerations enjoyed by different cities also varies considerably.
Table 2.
Descriptive statistics of the main variables.
As shown in Table 2, the main variables exhibit substantial variation across cities and years, which is essential for panel estimation. Energy intensity ranges widely across the sample, reflecting large differences in industrial base, technology, and urban structure. The agglomeration-scale index also varies considerably, suggesting that the four urban agglomerations do not constitute a homogeneous system. This heterogeneity provides the empirical basis for testing both the average effect of agglomeration scale and the heterogeneous effects examined later in the paper. Overall, the descriptive statistics indicate sufficient cross-sectional and temporal variation in both the dependent and explanatory variables, providing an appropriate basis for subsequent econometric analysis.
3.5. Identification Strategy, Endogeneity, and Robustness Design
A key empirical challenge in estimating the effect of the agglomeration scale within urban agglomerations on urban energy intensity is potential endogeneity. Reverse causality may arise if cities with lower energy intensity are more likely to attract population and resources, thereby contributing to a larger agglomeration scale. In addition, omitted time-varying factors, such as differences in regional coordination intensity or local infrastructure investment, may affect both agglomeration and energy performance.
To address these concerns, the benchmark model includes both city and year fixed effects and a rich set of control variables. The study further employs an instrumental-variable approach in the endogeneity test. Specifically, the IV is constructed as the ratio of average city elevation to the national number of deaths caused by natural disasters. Average elevation reflects exogenous terrain conditions that affect the development of urban agglomerations, while being unlikely to affect current urban energy intensity directly except through agglomeration. Additional robustness checks include more stringent fixed effects, urban-agglomeration fixed effects, alternative dependent-variable definitions, lagged explanatory variables, sample exclusions, and winsorization.
The endogeneity strategy combines several layers of protection. The fixed-effects specification removes time-invariant city characteristics and common shocks, while the IV design addresses the concern that cities with lower energy intensity may themselves become more attractive nodes within urban agglomerations. The instrument based on average elevation interacted with nationwide disaster mortality is designed to satisfy both relevance and exogeneity: topography affects the feasibility and historical pattern of city-cluster development, whereas the interaction with a national time-varying shock introduces temporal variation that can be exploited in panel estimation. In addition, the robustness exercises examine whether the results are sensitive to alternative variable definitions, sample adjustments, and lag structures.
Based on the above research design, the following section reports the benchmark estimation results, followed by endogeneity tests, mechanism analysis, heterogeneity analysis, and a series of robustness checks.
4. Results
4.1. Baseline Regression Results
To ensure the reliability of the baseline regression results, prior to the core estimation, we sequentially examined the extent to which the classical linear regression assumptions, normality of residuals, linearity, homoscedasticity, and independence, are satisfied for the panel fixed-effects model. The corresponding test results and their interpretations are presented in Appendix B. The obtained results confirm the validity of our regression model.
Table 3 reports the benchmark regression results based on Equation (1). Columns (1)–(4) present the estimates obtained by progressively introducing fixed effects and control variables. Across all specifications, the coefficient on lnScale remains negative, indicating that a larger agglomeration scale within urban agglomerations is consistently associated with lower urban energy intensity.
Table 3.
Baseline regression results.
In the fully specified model reported in Column (4), the estimated coefficient on lnScale is −0.893 and statistically significant at the 1% level. In economic terms, this implies that a 10% increase in the agglomeration scale within urban agglomerations is associated with a decline of approximately 0.0893 units in urban energy intensity, equivalent to a reduction of about 0.0893 ten thousand tons of standard coal per CNY 100 million of GDP. Overall, the benchmark results provide strong support for H1.
Two aspects of the baseline findings are worth highlighting. First, the coefficient on agglomeration scale becomes more negative after fixed effects are included, which suggests that simple pooled comparisons may underestimate the extent to which regional agglomeration improves energy performance. Once persistent differences in development level, geography, and institutional context are netted out, the efficiency-enhancing role of urban agglomerations becomes clearer. Second, the magnitude of the coefficient is economically meaningful rather than merely statistically significant. This matters because the policy relevance of urban agglomeration depends not only on whether the effect exists, but also on whether it is large enough to justify integration-oriented infrastructure and governance reforms.
Taken together, the benchmark results indicate that the agglomeration scale within urban agglomerations exerts a statistically robust and economically meaningful energy-saving effect.
4.2. Endogeneity Test
To address potential endogeneity, this study further employs an instrumental-variable approach. Specifically, the instrumental variable is constructed from average city elevation and the national number of deaths caused by natural disasters. Average elevation reflects the topographical characteristics of a city, which can affect the development of urban agglomerations to a certain extent, thereby satisfying the relevance requirement. At the same time, average elevation is a historically determined natural geographical condition and is unlikely to be directly related to current urban energy intensity, thereby satisfying the exogeneity requirement. Moreover, as a geographical factor, average elevation does not undergo significant changes over time within the sample period. Therefore, considering the time-varying influence of natural disasters on the development of urban agglomerations, this paper constructs the ratio of average city elevation to the national number of deaths caused by natural disasters as an instrumental variable.
Column (1) of Table 4 presents the first-stage regression. The coefficient on the IV is −0.051 and statistically significant at the 1% level, and the first-stage F-statistic is 46.57, suggesting that weak-instrument concerns are unlikely to be serious. Column (2) reports the second-stage results. After instrumenting for lnScale, the coefficient on agglomeration scale remains significantly negative at the 1% level, with an estimated value of −3.739. The sign and significance remain unchanged, reinforcing the causal interpretation of the energy-saving effect.
Table 4.
Instrumental-variable estimation results.
The IV estimates also provide a useful substantive insight. The larger absolute coefficient in the second stage is consistent with the possibility that measurement error in the agglomeration variable or attenuation bias in the baseline model leads ordinary least squares to understate the true energy-saving effect. While IV results should always be interpreted cautiously, the consistency of the sign and the strength of the diagnostic statistics together support the conclusion that the negative relationship between the agglomeration scale within urban agglomerations and energy intensity is not an artefact of reverse causality.
4.3. Robustness Checks
Table 5 presents a series of robustness checks. First, we address potential confounding effects from other environmental policies implemented during the sample period. Three major policy interventions are considered: the Low-Carbon City Pilot (launched in three batches), the Carbon-Inclusion Pilot (initiated in Guangdong in 2015), and the Environmental Vertical Management Reform (initiated in 2016). We construct dummy variables for these policies and include them as additional controls in the regression. For the Low-Carbon City Pilot, because the first batch involved provinces rather than individual cities, we create two dummy variables: one that excludes provincial coverage (LowCarbon_1) and another that treats all cities within the pilot provinces as treated (LowCarbon_2). Columns (1)–(6) show that the coefficient of lnScale remains significantly negative, indicating that the baseline results are not driven by these concurrent policy interventions.
Table 5.
Robustness check results.
Second, we alter the model specification. We add city-year interaction fixed effects, urban-agglomeration fixed effects, and use a one-period lag of the core explanatory variable. Columns (7)–(9) report the results; the coefficients of lnScale and L.lnScale are still significantly negative.
Third, we modify the measurement of the variables. For the core explanatory variable, we replace the original spherical-distance weighting with road distance and driving time, thereby reconstructing the agglomeration-scale index based on transportation accessibility and time cost. Columns (10) and (11) show that the coefficient remains significantly negative, confirming that the results is not sensitive to the specific weighting scheme. For the dependent variable, we replace urban energy intensity with per capita energy consumption. As shown in Column (12), the result remains robust.
Fourth, we modify the sample. On the one hand, we exclude the global financial crisis years (2008–2009) and the COVID-19 pandemic period (2020–2022) to test whether major external shocks affect the estimates. Columns (13) and (14) show that the coefficient of lnScale remains significantly negative. On the other hand, we exclude municipalities directly under the central government and winsorize all variables at the 1st and 99th percentiles. Columns (15) and (16) again show that the coefficient of lnScale remains significantly negative.
Fifth, we conduct a random subsampling test. To ensure that the findings are not driven by a particular subset of cities, we apply a cluster bootstrap approach that resamples cities with replacement and re-estimate the baseline model 500 times, each time randomly selecting 80% of the cities. The distribution of the estimated coefficients is presented in Figure 3. This provides strong evidence that the baseline result is robust to sample composition.
Figure 3.
Distribution of Estimated Coefficients from the Random Subsample Test. Note: The mean coefficient is −0.8925 (standard deviation 0.2303), and all 500 estimates are negative.
Finally, we reconstruct the agglomeration-scale measure using GDP instead of resident population so as to capture agglomeration from the perspective of economic output. When estimated over the full sample, the coefficient on this alternative measure is not statistically significant. However, given the trade-off between economic growth and energy saving in the earlier years of the sample, together with the substantial tightening of China’s environmental policies after 2013, exemplified by the issuance of the Air Pollution Prevention and Control Action Plan, we re-estimate the model using the GDP-weighted measure for the sub-period 2013–2023. The coefficient becomes negative and statistically significant (, ). This result suggests that when agglomeration scale is measured from the perspective of economic output, its energy-saving effect becomes more visible under a stricter environmental-policy regime. This finding provides additional support for the core conclusion and also points to a potentially important conditioning role of policy context.
The robustness results are important because the empirical setting combines several potential sources of concern, including differences in city status, incomplete data for certain variables, and the possibility that the effects of agglomeration unfold gradually rather than instantaneously. The persistence of the negative coefficient on agglomeration scale across all checks indicates that the main finding is not driven by one particular model choice. Taken together, the evidence from Table 3, Table 4 and Table 5 strongly suggests that the relationship is stable, substantively meaningful, and empirically credible.
4.4. Mechanism Analysis
To identify the channels through which the agglomeration scale within urban agglomerations affects energy intensity, this study further adopts the following mechanism specification:
where denotes the mechanism variable, including talent agglomeration, technological progress, and public transportation expansion.
To test the three mechanisms proposed in the theoretical framework, Equation (3) is estimated using talent agglomeration, technological progress, and public transportation expansion as dependent variables. Talent agglomeration is measured by the logarithm of the number of students enrolled in regular higher education institutions. Technological progress is measured by the ratio of patent grants to resident population. Public transportation expansion is measured by the ratio of the total number of urban buses to resident population. Table 6 reports the results.
Table 6.
Mechanism analysis results.
Column (1) shows that a larger agglomeration scale within urban agglomerations significantly promotes talent agglomeration, supporting H2. This result is consistent with the idea that urban agglomerations enlarge labor markets, strengthen educational and employment matching, and facilitate the mobility of skilled labor across cities. By attracting and concentrating human capital, urban agglomerations can improve managerial quality, accelerate knowledge spillovers, and promote more efficient energy use.
Column (2) indicates that lnScale has a strongly positive effect on technological progress, supporting H3. This finding suggests that a larger agglomeration scale within urban agglomerations helps reduce barriers to information transmission and knowledge diffusion, improves the matching efficiency of innovation resources, and lowers the marginal cost of technological upgrading. As a result, urban agglomeration facilitates innovation and technology diffusion, thereby contributing to lower energy intensity.
Column (3) shows that lnScale significantly increases public transportation expansion, supporting H4. A denser agglomeration scale tends to generate stronger commuting demand and greater requirements for regional accessibility, which in turn stimulate investment in urban and inter-city public transport systems. Moreover, as residence and employment become increasingly distributed across different cities within the same urban agglomeration, cross-city commuting flows further encourage transportation integration. This channel can reduce dependence on less efficient travel modes and improve the energy efficiency of mobility.
Overall, the mechanism analysis indicates that the energy-saving effect of the agglomeration scale within urban agglomerations operates through enhanced talent concentration, faster technological upgrading, and stronger public transportation supply, thereby supporting H2–H4.
The mechanism analysis further suggests that the energy-saving effect is not a black-box association. Rather, it is supported by improvements in the human-capital base, innovation capacity, and transport provision of cities embedded in larger city-cluster systems. This is important for interpretation because it shows that agglomeration scale does not simply coincide with lower energy intensity; it appears to change underlying urban capacities in ways that plausibly generate efficiency gains.
The mechanism analysis reveals that the energy-saving effect of urban-agglomeration-scale agglomeration is not a black-box association. Rather, it is supported by improvements in the human-capital base, innovation capacity, and transport provision of cities embedded in larger city-cluster systems. This is important for interpretation because it shows that agglomeration scale does not simply coincide with lower energy intensity; it appears to change underlying urban capacities in ways that plausibly generate efficiency gains.
5. Heterogeneity Analysis
5.1. Heterogeneity by City Size and Administrative Rank
In the Chinese context, urban development and energy consumption are closely associated with both city size and administrative rank. Larger cities usually accommodate more population and economic activity, but they also face stronger congestion and environmental pressure. Cities with higher administrative rank often enjoy greater decision-making power and fiscal autonomy, but they also bear heavier growth and policy responsibilities. It is therefore necessary to examine whether the energy-saving effect of the agglomeration scale within urban agglomerations differs across cities of different sizes and administrative levels.
City size is proxied by resident population. Using the sample median as the threshold, cities with resident population above the median are classified as large-scale cities, while those below the median are classified as small-scale cities. The median is chosen because, as a robust measure of central tendency, it is insensitive to extreme values [33], which is particularly relevant given the wide variation in city sizes across Chinese urban agglomerations. Moreover, when the independent variables are uncorrelated, employing a median split for statistical testing is entirely acceptable [34]. Using the median as the cut-off helps maintain a roughly balanced number of observations in each subgroup, thereby preserving statistical power for group comparisons. Municipalities, provincial capitals, and sub-provincial cities are classified as high administrative-rank cities, while the remaining cities are classified as low administrative-rank cities. Table 7 reports the subgroup results.
Table 7.
Heterogeneity analysis results by city size and administrative rank.
The energy-saving effect is substantially stronger in small-scale cities and in low administrative-rank cities. For small cities, the coefficient on lnScale is −1.502 and significant at the 1% level, implying that a 10% increase in the agglomeration scale within urban agglomerations reduces energy intensity by approximately 0.1502 units.
These findings are consistent with the concept of “borrowed size”, originally proposed by Alonso to describe how smaller cities located within a larger megapolitan complex can access agglomeration benefits [15], such as infrastructure, labor pools, and market size, from neighboring large cities. Subsequent research further developed this concept, arguing that borrowed size occurs when a city possesses urban functions and/or performance levels normally associated with larger cities, enabled through inter-city networks that serve as a substitute for some of the benefits of geographical proximity [16,23].
Within the broader literature, “borrowed size” has been systematically examined in China’s urban agglomerations. For example, using panel data of 285 Chinese cities, one study found that the ability of small cities to borrow size and functions from megacities play an important role in enhancing their productivity [35]. Using panel data of 280 Chinese cities, another study measured borrowed size along three dimensions, namely, borrowing population, borrowing economic-activity density and borrowing advanced functions, and found all three positively affect urban green development efficiency [36]. In the Yangtze River Delta context, borrowed size has been found to have a significant improve the economic efficiency of small and medium-sized cities [37]. These studies provide supportive evidence for our interpretation.
In interpreting this borrowed-size effect, a further distinction can be made between functional agglomeration and physical agglomeration. Functional agglomeration refers to the sharing of high-order services, such as financial services, headquarters economies, R&D institutions, and cultural amenities, across city boundaries. Physical agglomeration refers to the geographical concentration of population, manufacturing, and economic output within a contiguous built-up area. In the context of this study, the energy-saving effect of borrowed size appears to be more closely associated with functional agglomeration than with R&D spillovers alone. Relevant evidence shows that borrowing functions is an important channel through which firms in small cities benefit from interactions with large cities [38]. Another study further demonstrated that while large cities can borrow both functions and performance, small and medium-sized cities are more likely to borrow functions [39]. In addition, the intensity of both borrowed size and borrowed functions decreases with geographical distance [35], implying that R&D spillovers, which often rely on face-to-face interactions and are highly distance-sensitive, may be less accessible to geographically peripheral small cities. By contrast, functional agglomeration can be facilitated through inter-city networks that partially substitute for geographical proximity [13,16].
By leveraging the advanced service provision of larger core cities, smaller cities can avoid duplicating energy-intensive service infrastructure, such as large convention centers, specialized financial districts, or high-end medical facilities. This avoidance of redundant construction and operation can contribute to lower energy intensity. In contrast, R&D spillovers may be more relevant for cities that are closer to innovation networks or technological proximity. Although this mechanism is not directly tested in the present study, the distinction between functional borrowing and innovation spillovers helps clarify why the energy-saving effect of the agglomeration scale within urban agglomerations is particularly pronounced in smaller and lower-rank cities.
The inter-group difference tests confirm that these patterns are statistically meaningful rather than visually suggestive. In substantive terms, the results indicate that agglomeration scale may compensate for deficiencies in local endowments. Cities that lack internal scale or strong administrative leverage appear to gain more from being embedded in a larger urban agglomeration, whereas already advantaged cities may have exhausted a larger share of the easy efficiency gains associated with agglomeration. This interpretation reinforces the idea that urban-agglomeration development can create an environmental analogue of borrowed size; whereby peripheral cities access regional efficiencies that would be unattainable through isolated local growth.
5.2. Heterogeneity by Factor Mobility
Factor mobility can alleviate resource misallocation, improve production efficiency, and promote knowledge exchange and technology diffusion, all of which may affect energy use. To examine whether the energy-saving effect varies with factor mobility, this study distinguishes between population mobility and goods mobility. Road passenger traffic (Pass) and road freight traffic (Freight) are used as proxies for population and goods mobility, respectively. Following common practice in the literature, we use the sample median to classify cities into high- and low-mobility groups for each proxy. The median split is adopted because it is less sensitive to extreme values and helps maintain a relatively balanced number of observations across subgroups, thereby facilitating group com-parison, and when the independent variables are uncorrelated, statistically acceptable [33,34].
The subgroup results in Table 8 show that the suppressing effect of the agglomeration scale within urban agglomerations on energy intensity is stronger and more significant in cities with lower mobility levels. When lnPass and lnFreight, together with their interactions with lnScale, are included in the full-sample regression, the interaction terms are significantly positive, indicating a partially substitutive relationship between factor mobility and the agglomeration scale within urban agglomerations. In other words, some of the efficiency gains delivered by agglomeration in low-mobility cities may already have been realized through mobility itself in high-mobility cities.
Table 8.
Heterogeneity analysis results by factor mobility.
The substitutive relationship identified in the interaction models has important economic implications. It suggests that factor mobility and agglomeration scale may operate as partially substitutable channels for improving energy efficiency, rather than fully reinforcing each other. In cities where factor mobility is already high, meaning that labor, goods, and other productive factors can circulate relatively freely, the marginal energy-saving contribution of further agglomeration is naturally smaller, because mobility itself has already helped optimize resource allocation and improve production efficiency. Conversely, in cities where factor markets remain segmented or transport frictions are high, agglomeration scale plays a stronger compensatory role by mitigating resource misallocation and enabling shared infrastructure and knowledge spillovers. This interpretation is consistent with the finding that market segmentation significantly inhibits energy efficiency by distorting technological progress and allocation efficiency [40]. In low-mobility cities where such distortions are likely to be more severe, agglomeration scale may partially compensate for the absence of well-functioning factor markets.
The substitutive relationship also carries policy implications. First, for low-mobility cities (e.g., peripheral cities in central and western urban agglomerations), policies should prioritize urban agglomeration integration, including transportation infrastructure connectivity and coordinated industrial spatial planning, to leverage the energy-saving potential of agglomeration. Second, for high-mobility cities (e.g., core cities in the Yangtze River Delta and Pearl River Delta), policy efforts should shift from further scale expansion toward improving factor allocation efficiency, such as deepening market-oriented reforms. Third, at the macro level, the diminishing returns from simultaneously promoting both factor mobility and agglomeration scale suggest that policy levers should be tailored to city-specific constraints rather than applied uniformly. This finding underscores that the environmental value of urban agglomerations depends not only on the size of the regional system but also on the degree to which underlying markets for people and goods have already been integrated.
5.3. Heterogeneity by Air Quality and Public Environmental Concern
Air quality provides another important context for understanding the energy-saving effect of the agglomeration scale within urban agglomerations. Fossil-energy use, especially coal-based energy consumption, is strongly associated with air-pollution burdens, while pollution exposure may also reduce the energy-saving potential of natural ventilation and induce more energy-intensive ventilation choices. Public environmental concern is likewise an important force in environmental governance and emission reduction.
This study measures air quality by the share of days with and public environmental concern by the annual Baidu Search Index for the keyword “haze”. Following the same approach as for city size and factor mobility, we use the sample median to classify cities into good-air-quality and poor-air-quality groups, as well as high-public-concern and low-public-concern groups. Table 9 shows that the coefficient on lnScale is significantly negative regardless of air-quality conditions, but the magnitude is notably larger in cities with poor air quality. The energy-saving effect is also concentrated in cities with high public concern. The correlation coefficient between air quality and public concern is significantly negative (, ), suggesting that cities with worse air quality tend to exhibit stronger public environmental attention.
Table 9.
Heterogeneity analysis results by air quality and public environmental concern.
These empirical patterns suggest that stronger public environmental concern, often arising from worse air quality, may help induce concrete policy responses that translate agglomeration-scale expansion into actual energy savings. Across the four major urban agglomerations examined in this study, several such policy responses can be observed.
In Beijing–Tianjin–Hebei, where air quality has historically been poor, the environmental complaint reporting system has been significantly strengthened. Beijing established a full-chain “immediate handling upon complaint” mechanism for environmental petitions, and introduced a reward scheme for reporting ecological environment violations, with monetary incentives for citizens who report environmental offenses. In Tianjin, the first round of central environmental inspections identified 49 rectification tasks, all of which had been completed as of 2023.
In the Yangtze River Delta, public concern over PM2.5 pollution has encouraged more participatory forms of governance. Changxing County in Zhejiang established a “resident + community + sub-district” air pollution governance model with 74 grids, enabling residents to report issues through an integrated platform. Shanghai launched the Measures for Rewarding Reports of Environmental Violations to encourage public participation, offering monetary rewards based on the severity and nature of the environmental violations.
In the Pearl River Delta, severe ozone and fume pollution prompted public-responsive policies. Shenzhen’s Implementation Plan for the Continuous Improvement of Air Quality in Shenzhen explicitly prioritizes the resolution of air-environmental issues of public concern, including catering fumes, open burning, and auto painting emissions. Guangdong’s Carbon Inclusion mechanism also rewards individual low-carbon behaviors, thereby turning public concern into tangible environmental actions.
In Chengdu–Chongqing, frequent autumn–winter heavy pollution episodes and public health concerns over PM2.5 drove joint control measures. Sichuan and Chongqing revised their heavy pollution emergency plans, explicitly stating that protecting public health is the primary objective. In addition, a joint autumn–winter air pollution prevention mechanism for 2025–2026 was established to eliminate heavily polluted days. Detailed information on the above-mentioned policy documents is provided in Appendix A.
Taken together, these findings imply that the energy-saving benefits of the agglomeration scale within urban agglomerations are more pronounced when cities face stronger environmental stress and social pressure. In such contexts, improvements in transport systems, technology diffusion, and talent concentration may be more readily translated into actual reductions in energy intensity. The policy measures described above illustrate how public scrutiny, particularly in regions with poorer air quality, may shape concrete urban energy-saving responses. More broadly, the results suggest that the energy-saving effect is more likely to be activated where environmental stress and public scrutiny are stronger, thereby reinforcing the context-dependent nature of the agglomeration effect.
6. Discussion
The core finding of this paper is that a larger agglomeration scale within urban agglomerations significantly reduces urban energy intensity. This result is broadly consistent with studies showing that urban agglomeration policy and economic agglomeration can improve energy performance in China [5,7]. At the same time, the present paper extends that literature by shifting the focus from policy designation or within-city concentration to the shared scale generated across neighboring cities within the same urban agglomeration. While most existing studies measure agglomeration using single-city indicators such as population density or industrial output, our focus on cross-city connectivity captures a distinct dimension of agglomeration, namely one that operates through inter-city networks rather than purely within-city concentration [41].
This paper also helps reconcile an important tension in the literature. A number of studies caution that agglomeration is not uniformly green: its effects can be nonlinear, spatially uneven, or even adverse once congestion, overconcentration, and rebound effects become dominant [5,8,9]. Consistent with this cautionary view, some studies have found that industrial agglomeration may shift from promoting to inhibiting low-carbon transition beyond a certain threshold, and that its effects differ significantly across eastern versus central and western regions [42]. Other DID-based research further suggests that the development of urban agglomerations may even undermine urban ecological resilience [43]. However, the formation of urban agglomerations is a long-term and differentiated process, and the dummy variables in the DID model cannot accurately assess the contributions of individual cities within an urban agglomeration, nor can they reflect the differences in the support received by different cities [19]. By contrast, our results suggest that when the unit of analysis shifts from the single city to the urban agglomeration as an integrated system, the balance may tilt more clearly toward efficiency gains. Inter-city connectivity, functional complementarity, and regional coordination can offset part of the local congestion costs emphasized in city-scale studies. In this respect, our findings align with research demonstrating that well-integrated urban agglomerations can generate network externalities that help counteract some of the negative environmental consequences of excessive local concentration [16].
The mechanism analysis further shows that these channels can be jointly activated by the agglomeration scale within urban agglomerations. In this sense, urban agglomeration is not simply a larger economic space; it is a regional system that reorganizes talent, knowledge, and mobility in ways that can improve energy efficiency. Our finding that technological progress is a key mediating channel echoes recent studies showing that energy efficiency improvement and green technological innovation are critical mechanisms through which urban agglomeration reduces carbon emissions [44,45]. Moreover, our identification of public transportation expansion as a mechanism extends the existing literature by highlighting the role of integrated transport infrastructure in shaping the energy outcomes of agglomeration, an aspect that has received less attention in prior research.
The heterogeneity results further indicate that the energy-saving effect of the agglomeration scale within urban agglomerations is stronger in smaller cities, lower administrative-rank cities, cities with lower factor mobility, and cities facing stronger environmental pressure and public concern. This suggests that the environmental dividends of urban agglomeration need not be monopolized by metropolitan cores. This pattern is consistent with the concept of “borrowed size”, which suggests that smaller and peripheral cities can access the agglomeration benefits of larger core cities through inter-city networks [15,16]. Our finding that the effect is particularly strong in lower-mobility cities also aligns with recent evidence that regional integration policies generate larger energy efficiency improvements in central and western regions and in small and medium-sized cities [45], where market fragmentation and factor flow frictions are more severe. By contrast, the weaker effect in large and high-mobility cities suggests that these cities may have already exhausted the “easy gains” from agglomeration, a pattern consistent with diminishing returns to scale in well-connected metropolitan areas.
The results should not be interpreted as implying that agglomeration is automatically or universally beneficial. A more cautious reading is that urban-agglomeration integration can produce energy-saving gains under conditions where connectivity, factor mobility, and coordinated infrastructure provision are sufficiently strong. This interpretation does not deny the congestion-based argument in the literature; rather, it refines it by suggesting that city-scale overconcentration may raise environmental costs, whereas well-integrated urban agglomerations may convert spatial concentration into regional efficiency gains. Our findings thus complement studies that have documented negative environmental consequences of agglomeration in specific contexts [46], while also extending the literature by demonstrating that the network-based agglomeration at the urban-agglomeration level operates differently from within-city density-driven agglomeration [47]. This distinction has important implications for both theory and policy: it suggests that the spatial scale at which agglomeration is analyzed fundamentally shapes the conclusions one draws about its environmental consequences.
Another implication is methodological. Studies confined to single-city indicators may incorrectly attribute environmental outcomes either to local density or to local policy, while underestimating the role of regional interdependence. The present results indicate that a city’s energy intensity is partly shaped by the surrounding cities to which it is connected and from which it can draw scale, talent, innovation, and transport access. In this sense, the paper supports a more relational approach to urban environmental analysis, one that treats cities as nodes in broader territorial systems rather than self-contained units. This methodological shift echoes a broader movement in urban studies toward network-based conceptualizations of city systems, as advocated by scholars studying urban network externalities [13,14].
The findings also connect to a wider debate in the urban and regional literature about whether green transition should be pursued primarily through compact-city strategies, industrial upgrading, transport policy, or land-use governance. The results suggest that these agendas are not mutually exclusive when viewed through the lens of urban agglomerations. Urban agglomeration can serve as an umbrella condition that improves the effectiveness of all four: it changes the spatial scale of land and infrastructure planning, broadens the labor and innovation market that supports industrial upgrading, and increases the feasibility of public transport investments that are difficult to justify in fragmented settings. This helps explain why the energy-saving effect remains visible even after accounting for a range of conventional city-level determinants. Our results suggest that the effectiveness of compact-city strategies may be enhanced when implemented within a well-connected urban agglomeration, as the broader labor and housing markets reduce the risk of excessive local density [48].
Overall, the results provide further support for the argument that the energy-saving effect of the agglomeration scale within urban agglomerations is context-dependent but potentially inclusive. The strongest effects appear where cities face structural constraints, such as smaller internal scale, lower administrative status, weaker factor circulation, or stronger environmental pressure. In such settings, integration into a larger urban-agglomeration system may relax multiple bottlenecks simultaneously, allowing cities to convert regional connectivity into lower energy intensity more effectively than cities that are already well endowed. This context-dependent pattern is consistent with a compensatory-advantage logic in regional science, according to which lagging regions may benefit disproportionately from integration into larger economic systems [49]. Our findings thus suggest that promoting urban agglomeration integration may serve as an effective instrument for reducing regional inequality in environmental performance, an area where traditional policies have often struggled. However, this inclusive potential is not automatic; it requires deliberate policy efforts to ensure that connectivity and infrastructure investments reach peripheral areas rather than being concentrated solely in core cities.
7. Conclusions, Policy Implications, and Limitations
7.1. Conclusions
This paper investigates whether the agglomeration scale within urban agglomerations reduces urban energy intensity in China. Using panel data for 64 cities in the Beijing–Tianjin–Hebei, Yangtze River Delta, Pearl River Delta, and Chengdu–Chongqing urban agglomerations over the period 2006–2023, the study yields four main conclusions.
First, the agglomeration scale within urban agglomerations significantly reduces urban energy intensity. Second, the core finding remains robust after accounting for endogeneity and model uncertainty. Third, the energy-saving effect operates through three main channels: talent agglomeration, technological progress, and public transportation expansion. Fourth, the effect is heterogeneous across cities and is more pronounced in smaller cities, lower-rank cities, cities with lower factor mobility, and cities experiencing poorer air quality and higher public environmental concern.
Taken together, these findings suggest that urban agglomerations should be understood not merely as larger economic spaces, but as governance-relevant regional systems capable of reshaping the relationship between urbanization and energy use. More broadly, the results indicate that regional integration can generate not only economic gains, but also meaningful improvements in energy efficiency, especially where cities face stronger structural or environmental constraints.
7.2. Policy Implications
Based on the findings above, this paper proposes differentiated policy recommendations that should be read in both strategic and operational terms. Strategically, policymakers should move beyond administrative fragmentation toward regional governance arrangements that coordinate land use, transport, and innovation systems. Operationally, the effectiveness of policies for urban agglomeration depends on tailoring instruments to the specific constraints and endowments of each urban agglomeration.
At the strategic level, three implications are particularly important. First, policymakers should emphasize the quality of integration rather than focus narrowly on the expansion of core metropolitan centers. When inter-city linkages are sufficiently strong, the broader agglomeration scale can itself become an energy-saving asset. Second, governments should promote the circulation of talent and innovation resources across cities, facilitating regional sharing of R&D platforms, educational resources, and professional labor markets. Third, a differentiated and inclusive approach is essential. Because the energy-saving effect is stronger in smaller, lower-rank, and lower-mobility cities, urban-agglomeration governance should pay greater attention to diffusing agglomeration benefits across the entire regional urban system.
Given the heterogeneous characteristics of the four major urban agglomerations, more specific measures should be tailored accordingly. In Beijing–Tianjin–Hebei, where poor air quality and high public environmental concern drive stronger energy-saving effects, policies should prioritize cross-jurisdictional air pollution control and coal consumption reduction, while expanding public transportation and promoting new-energy vehicles. In the Yangtze River Delta, where factor mobility and technological progress are already high, policies should focus on deepening regional integration through unified digital governance platforms, joint carbon market mechanisms, and green technology diffusion, thereby leveraging the technological progress channel identified in this study. In the Pearl River Delta, a highly open and innovation-driven region, market-based instruments such as carbon pricing, green finance, and carbon-inclusion schemes should be further expanded so as to translate public environmental concern into tangible energy savings. In Chengdu–Chongqing, where factor mobility is relatively low and the energy-saving effect is particularly pronounced in smaller cities, policies should prioritize infrastructure connectivity (e.g., clean energy corridors) and joint environmental supervision to compensate for market segmentation and to amplify the benefits of agglomeration scale for peripheral cities.
Operationally, first, public transportation and regional accessibility systems should be further strengthened, including integrated rail transit, inter-city commuting networks, and coordinated land-use-transport planning. Second, performance-based differentiated emission controls could be expanded to create direct economic incentives for firms to reduce coal consumption and upgrade energy efficiency. Third, digital governance platforms enabling real-time data sharing and collaborative emission reduction should be promoted across regions. Finally, policies for urban agglomeration should be evaluated not only by GDP growth or infrastructure expansion, but also by whether they improve the efficiency with which cities use energy to generate output. Integrating energy-efficiency metrics into urban agglomeration planning may help align regional development with China’s longer-term carbon and sustainability goals.
7.3. Limitations and Future Research
Several limitations should be acknowledged. First, the measurement of the agglomeration scale within urban agglomerations is based on resident population and inverse geographic distance. Although this approach captures the external scale effect generated by neighboring cities, it cannot fully reflect all dimensions of functional integration, such as commuting flows, industrial linkages, transport-time accessibility, or digital connectivity. Future research could incorporate more refined measures, such as commuting-flow-based connectivity and digital connectivity indices, to better capture the multidimensional nature of urban agglomeration. Moreover, examining the spatial spillover effects of agglomeration scale on energy intensity across neighboring cities using spatial econometric models would provide a deeper understanding of how energy-saving benefits diffuse within and beyond urban agglomerations.
Second, the mechanism analysis focuses on three channels: talent agglomeration, technological progress, and public transportation expansion. These channels are theoretically meaningful and empirically supported, but they do not exhaust all possible pathways. Other mechanisms may also mediate the relationship between urban agglomeration and energy performance. Future studies could explore additional mediating channels. In particular, the rise in digital clustering, the spatial concentration of digital infrastructure, e-commerce activities, and information services, provides a useful avenue for understanding how virtual agglomeration complements or substitutes for physical agglomeration in reducing energy intensity.
Third, this study focuses on four major urban agglomerations in China. These regions are highly representative in terms of scale, integration, and policy relevance, but they are also relatively advanced compared with many other urban agglomerations in China and elsewhere. Future studies could extend the analysis to more agglomerations at different development stages or conduct cross-country comparisons to test the generalizability of our findings. Moreover, future research could examine the dynamic effects of agglomeration scale on energy intensity over longer time horizons, using methods such as PVAR or system GMM to distinguish short-term adjustments from long-term equilibrium relationships.
A final limitation concerns external validity over time. The study period spans 2006–2023, a phase during which China experienced rapid infrastructure expansion, industrial upgrading, and policy support for urban-agglomeration development. Whether the same magnitude of energy-saving effect will persist in a later stage of slower population growth, deeper decarbonization, and digital rather than physical integration remains an open question. Future studies may therefore examine whether the mechanisms identified here evolve as urban agglomerations mature and as the composition of energy demand shifts across sectors. More specifically, researchers could investigate the interplay between digital clustering and traditional agglomeration in shaping energy intensity. Exploring potential non-linear or threshold effects may also help refine policy recommendations for different stages of urban development.
Author Contributions
Conceptualization, M.W. and Q.C.; methodology, Q.C. and Z.H.; software, Q.C.; validation, Z.H. and H.W.; writing—original draft preparation, Q.C., Z.H. and M.W.; writing—review and editing, H.W. and Z.H.; supervision, M.W. and H.W.; funding acquisition, M.W. and H.W. All authors have read and agreed to the published version of the manuscript.
Funding
This research was funded by 2025 Key Project of the System Science and Enterprise Development Research Center of the Key Research Base of Philosophy and Social Sciences in Sichuan Province (No. Xq25B07), 2025 Sichuan Province Graduate High-Quality Education and Teaching Re-source Construction Project (No. YXGXM25-C020), and 2025 Sichuan Provincial Social Science Fund Entrusted Project (No. SCJJ25RKX112).
Data Availability Statement
The raw data supporting the conclusions of this article will be made available by the authors on request.
Conflicts of Interest
The authors declare no conflicts of interest.
Appendix A
Table A1.
Relevant policies and links.
Appendix B
To ensure the reliability of the baseline results, we conducted a series of diagnostic tests before estimation, examining residual normality, model linearity, homoscedasticity, and independence.
First, normality of residuals. The Shapiro–Wilk test yielded a W-statistic = 0.9406 (p < 0.001), rejecting strict normality. However, this does not undermine the validity of the baseline estimates. On one hand, with 1032 observations, the sample is large. By the central limit theorem, the OLS coefficients are asymptotically normal, and t- and F-statistics remain valid [50]. Moreover, the Q-Q plot (Figure A1) shows that the residuals closely follow the diagonal line, with only minor deviations at the tails, indicating that the departure from normality is negligible. On the other hand, the Gauss-Markov theorem does not require normality for the OLS estimator to be best linear unbiased estimate (BLUE), provided linearity, strict exogeneity, and spherical errors hold. We employ city-level cluster-robust standard errors to address heteroscedasticity and serial correlation, further ensuring reliable inference. Hence, the mild non-normality does not affect the credibility of the baseline results.
Figure A1.
Quantile-Quantile (Q-Q) plot of regression residuals. Note: The dots represent the empirical quantiles of the residuals, and the line represents the theoretical quantiles of a normal distribution. If the residuals are perfectly normally distributed, all dots would lie exactly on the diagonal line. The proximity of the dots to the line indicates that the normality assumption is reasonably satisfied.
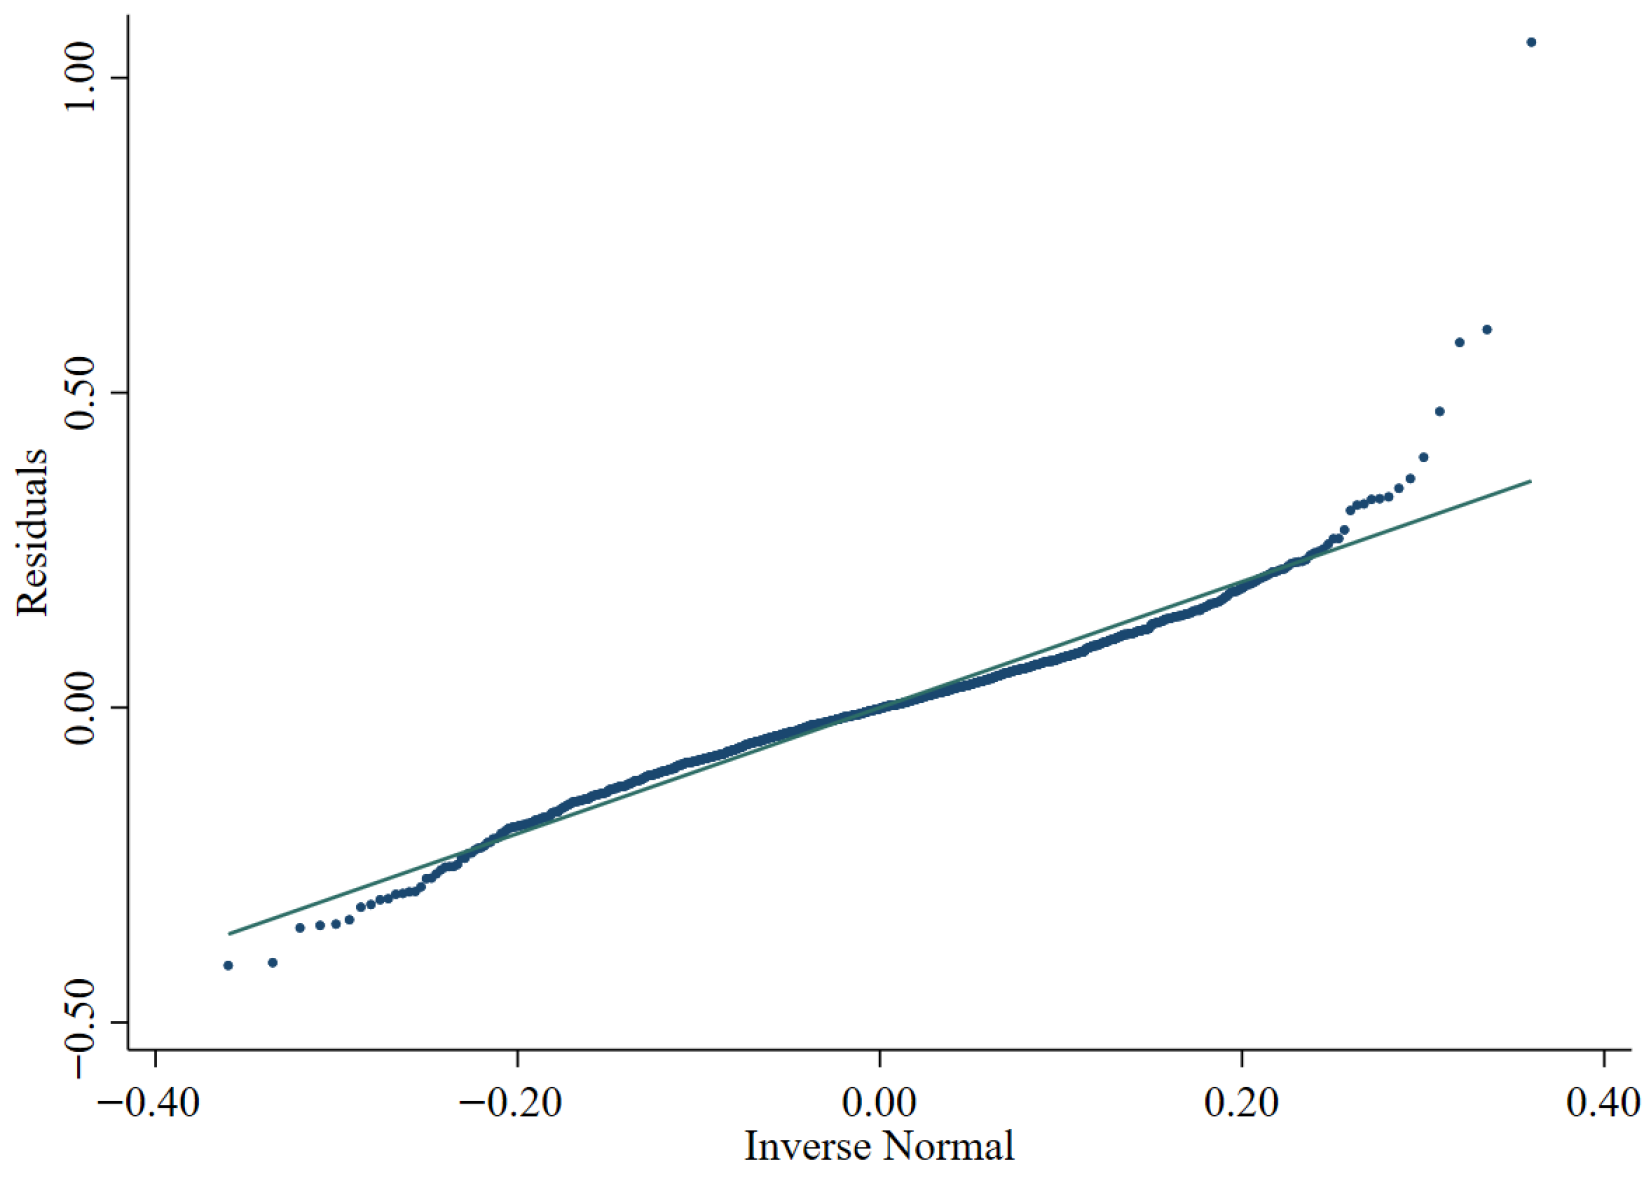
Second, linearity. To test for functional form misspecification (e.g., omitted higher-order terms or interactions), we performed Ramsey’s RESET test by adding the squared and cubed fitted values (ŷ2, ŷ3) to the auxiliary regression [51]. The test gave F-statistic = 0.22 (p = 0.8032), indicating that the linear specification is appropriate and no significant misspecification exists, reinforcing the baseline results.
Third, homoscedasticity. Using Greene’s modified Wald test for groupwise heteroscedasticity in the fixed-effects model [52], we obtained χ2-statistic = 6338.69 (p < 0.001), revealing significant differences in residual variances across cities. Nevertheless, this does not affect the validity of the coefficient estimates or inference, because we employ city-level cluster-robust standard errors throughout, which are consistent in the presence of heteroscedasticity [53]. Thus, the results remain robust.
Fourth, independence. We tested for serial correlation within cities (Wooldridge test) and cross-sectional dependence across cities (Pesaran CD test) [54]. The Wooldridge test produced F-statistic = 79.028 (p < 0.001), indicating significant first-order autocorrelation within cities. This is economically intuitive, as energy intensity tends to be persistent. To address this, we use city-level cluster-robust standard errors, which allow arbitrary within-panel correlation [53], ensuring consistent standard errors and valid inference. The Pesaran CD test gave CD-statistic = 0.23 (p = 0.814), failing to reject cross-sectional independence. This is because our specification includes year fixed effects, which absorb common time shocks across all cities. After removing these common factors, the residuals mainly capture city-specific idiosyncratic variations, and systematic cross-city correlation disappears. Hence, the model is well specified.
In summary, although the Shapiro–Wilk and Greene tests indicate mild non-normality and groupwise heteroscedasticity, the Q-Q plot supports approximate normality, and the use of cluster-robust standard errors effectively handles heteroscedasticity and serial correlation. The RESET test confirms linearity, and the Pesaran CD test shows cross-sectional independence. Overall, the regression model satisfies the key assumptions of linear regression, and the estimates are robust and reliable.
References
- Fang, C.L.; Yu, D.L. Urban agglomeration: An evolving concept of an emerging phenomenon. Landsc. Urban Plan. 2017, 162, 126–136. [Google Scholar] [CrossRef] [Scilit]
- Yeh, A.G.O.; Chen, Z.F. From cities to super mega city regions in China in a new wave of urbanisation and economic transition: Issues and challenges. Urban Stud. 2020, 57, 636–654. [Google Scholar] [CrossRef] [Scilit]
- Li, W.S.; Wu, J.H.; Yang, L.Y.; Chen, W.X.; Cui, X.H.; Lin, M.Y. Spatial Variations in Relationships between Urbanization and Carbon Emissions in Chinese Urban Agglomerations. Land 2024, 13, 1303. [Google Scholar] [CrossRef] [Scilit]
- Yu, T.H.; Huang, X.; Jia, S.S.; Cui, X.F. Unveiling the Spatio-Temporal Evolution and Key Drivers for Urban Green High-Quality Development: A Comparative Analysis of China’s Five Major Urban Agglomerations. Land 2023, 12, 1962. [Google Scholar] [CrossRef] [Scilit]
- Xu, M.M.; Tan, R.P.; He, X.J. How does economic agglomeration affect energy efficiency in China?: Evidence from endogenous stochastic frontier approach. Energy Econ. 2022, 108, 105901. [Google Scholar] [CrossRef] [Scilit]
- Wang, H.; Zhao, X.G.; Ren, L.Z.; Fan, J.C.; Lu, F. The impact of technological progress on energy intensity in China (2005–2016): Evidence from a geographically and temporally weighted regression model. Energy 2021, 226, 120362. [Google Scholar] [CrossRef] [Scilit]
- Ding, R.; Zhou, T.; Yin, J.; Zhang, Y.L.; Shen, S.W.; Fu, J.; Du, L.Y.; Du, Y.M.; Chen, S.H. Does the Urban Agglomeration Policy Reduce Energy Intensity? Evidence from China. Int. J. Environ. Res. Public Health 2022, 19, 14764. [Google Scholar] [CrossRef] [Scilit] [PubMed]
- Hu, W.; Fan, Y.M. City size and energy conservation: Do large cities in China consume more energy? Energy Econ. 2020, 92, 104943. [Google Scholar] [CrossRef] [Scilit]
- Wang, Y.A.; Yin, S.W.; Fang, X.L.; Chen, W. Interaction of economic agglomeration, energy conservation and emission reduction: Evidence from three major urban agglomerations in China. Energy 2022, 241, 122519. [Google Scholar] [CrossRef] [Scilit]
- Gu, H.L.; Chen, X.T.; Sun, H.H.; Huan, C.Y.; Wang, B.Y. How Does Land Urbanization Affect Carbon Emissions in China? Evidence from 209 Cities and Three Heterogeneous Regions in the East of the Hu Line of China. Land 2025, 14, 910. [Google Scholar] [CrossRef] [Scilit]
- Xie, X.J.; Wang, J.; Liu, M.H. Regional Disparities and Driving Factors of Residential Carbon Emissions: An Empirical Analysis Based on Samples from 270 Cities in China. Land 2025, 14, 510. [Google Scholar] [CrossRef] [Scilit]
- Marshall, A. Principles of Economics; Macmillan and Company: London, UK, 1890. [Google Scholar]
- Capello, R. The city network paradigm: Measuring urban network externalities. Urban Stud. 2000, 37, 1925–1945. [Google Scholar] [CrossRef] [Scilit]
- Burger, M.J.; Meijers, E.J. Agglomerations and the rise of urban network externalities. Pap. Reg. Sci. 2016, 95, 5–16. [Google Scholar] [CrossRef] [Scilit]
- Alonso, W. Urban Zero Population Growth. Daedalus 1973, 102, 191–206. [Google Scholar]
- Meijers, E.J.; Burger, M.J. Stretching the concept of “borrowed size”. Urban Stud. 2017, 54, 269–291. [Google Scholar] [CrossRef] [Scilit]
- Zhang, H.M.; Sun, T.S. Disentangling urban network externalities: The juxtaposition of central place theory and central flow theory. Reg. Stud. 2025, 59, 2461753. [Google Scholar] [CrossRef] [Scilit]
- Zhang, R.; Ying, W.H.; Wu, K.R.; Sun, H.P. The impact of innovative human capital agglomeration on urban green development efficiency: Based on panel data of 278 Cities in China. Sustain. Cities Soc. 2024, 111, 105566. [Google Scholar] [CrossRef] [Scilit]
- He, J.Z.; Wang, F. Does urban agglomeration reduce carbon emissions in Chinese cities? New perspective on factor mobility. Energy Econ. 2025, 143, 108297. [Google Scholar] [CrossRef] [Scilit]
- Yang, W.W.; Chen, Y.Z.; Gao, Y.C.; Hu, Y.Q. The Impact of Urban Transportation Development on Daily Travel Carbon Emissions in China: Moderating Effects Based on Urban Form. Land 2024, 13, 2107. [Google Scholar] [CrossRef] [Scilit]
- Jing, Q.L.; Liu, H.Z.; Yu, W.Q.; He, X. The Impact of Public Transportation on Carbon Emissions-From the Perspective of Energy Consumption. Sustainability 2022, 14, 6248. [Google Scholar] [CrossRef] [Scilit]
- Liu, Y.; Dong, X.Y.; Wang, C. Effectiveness of the city cluster development strategy on urban carbon reduction: Evidence from 286 cities in China. J. Clean Prod. 2025, 517, 145864. [Google Scholar] [CrossRef] [Scilit]
- Chen, L.; Wang, X.; Hao, Y.W.; Yin, J.B.; Chen, D.S. Population agglomeration, borrowed size and urban economic growth in China. Cities 2024, 155, 105491. [Google Scholar] [CrossRef] [Scilit]
- Gao, M.; Gu, Q.K.; He, S.J. Place-based policies, administrative hierarchy, and city growth: Evidence from China*. Econ. Model 2022, 115, 105952. [Google Scholar] [CrossRef] [Scilit]
- Jia, J.X.; Liang, X.; Ma, G.R. Political hierarchy and regional economic development: Evidence from a spatial discontinuity in China. J. Public Econ. 2021, 194, 104352. [Google Scholar] [CrossRef] [Scilit]
- Wang, Y.F.; Zhao, Z.H.; Shi, M.; Liu, J.; Tan, Z.X. Public environmental concern, government environmental regulation and urban carbon emission reduction-Analyzing the regulating role of green finance and industrial agglomeration. Sci. Total Environ. 2024, 924, 171549. [Google Scholar] [CrossRef] [Scilit]
- Chen, F.L.; Zhang, T.Z.; Chen, Z.F. Assessment of environmental concern for enterprise pollution reduction. Econ. Anal. Policy 2024, 81, 772–786. [Google Scholar] [CrossRef] [Scilit]
- Zhou, P.; Zhang, H.; Zhang, L. The drivers of energy intensity changes in Chinese cities: A production-theoretical decomposition analysis. Appl. Energy 2022, 307, 118230. [Google Scholar] [CrossRef] [Scilit]
- Li, P.; Zhang, X. Agglomeration spatial externalities and labor wage premiums in urban agglomerations. Manag. World 2021, 37, 121–136+183. (In Chinese) [Google Scholar] [CrossRef]
- Yan, H.J. Provincial energy intensity in China: The role of urbanization. Energy Policy 2015, 86, 635–650. [Google Scholar] [CrossRef] [Scilit]
- Zou, X.; Yang, X. Carbon emission reduction effects of optimizing the urban spatial structure of counties around large cities: From the perspective of population spatial distribution. J. Nat. Resour. 2025, 40, 330–349. (In Chinese) [Google Scholar] [CrossRef] [Scilit]
- GS(2023)2767; China Map (1:7,400,000). Ministry of Natural Resources of the People’s Republic of China: Beijing, China, 2023.
- DeCoster, J.; Gallucci, M.; Iselin, A.-M.R. Best practices for using median splits, artificial categorization, and their continuous alternatives. J. Exp. Psychopathol. 2011, 2, 197–209. [Google Scholar] [CrossRef] [Scilit]
- Iacobucci, D.; Posavac, S.S.; Kardes, F.R.; Schneider, M.J.; Popovich, D.L. The median split: Robust, refined, and revived. J. Consum. Psychol. 2015, 25, 690–704. [Google Scholar] [CrossRef] [Scilit]
- Liu, X.; Chen, Z. Scale Borrowing and Function Borrowing in Urban Systems: An Empirical Test from the Perspective of Network Externalities. Urban Probl. 2017, 12, 12–19. (In Chinese) [Google Scholar] [CrossRef]
- Guo, A.J.; Liu, P.X.; Zhong, F.L.; Yang, C.L.; Luo, X.J. Borrowing Size and Urban Green Development Efficiency in the City Network of China: Impact Measures and Size Thresholds. Land 2022, 11, 493. [Google Scholar] [CrossRef] [Scilit]
- Zhao, W.S.; Wang, Z.; Li, J.N. Improving the economic efficiency of small and medium-sized cities in the Yangtze River delta: What role for borrowed size? Cities 2025, 162. [Google Scholar] [CrossRef] [Scilit]
- Yang, J.; Liu, Y.; Chen, X.; Zhao, Y. Urban agglomeration spatial functional division, scale functional borrowing and enterprise export value-added. Econ. Sci. 2021, 5, 68–83. (In Chinese) [Google Scholar]
- Yang, T.; Zhu, Y.; Du, J. Is there a borrowed size in China’s urban agglomerations? Prog. Geogr. 2022, 41, 1156–1167. (In Chinese) [Google Scholar] [CrossRef] [Scilit]
- Qi, X.F.; Zhou, L.H. Market segmentation and energy efficiency-an empirical study based on China’s provincial panel data. Energy Effic. 2020, 13, 1781–1797. [Google Scholar] [CrossRef] [Scilit]
- Du, J.; Zhao, M.Q.; Zeng, M.; Han, K.Z.; Sun, H.P. Spatial Effects of Urban Agglomeration on Energy Efficiency: Evidence from China. Sustainability 2020, 12, 3338. [Google Scholar] [CrossRef] [Scilit]
- Liu, Y.Q. Impacts of industrial agglomeration on the energy consumption structure’s low-carbon transition process: A spatial and nonlinear perspective. PLoS ONE 2024, 19, e0307893. [Google Scholar] [CrossRef] [Scilit]
- Jiang, N.N.; Jiang, W. How does regional integration policy affect urban resilience? Evidence from urban agglomeration in China. Environ. Impact Assess. Rev. 2024, 104, 107298. [Google Scholar] [CrossRef] [Scilit]
- Zhang, S.; Zhou, J.; Khan, S.; Suplata, M. Does economic agglomeration reduce CO2 emissions? The role of green innovation and financial development in Chinese cities. Environ. Res. Commun. 2025, 7, 065024. [Google Scholar] [CrossRef] [Scilit]
- Wang, L.H.; Shao, J. How does regional integration policy affect urban energy efficiency? A quasi-natural experiment based on policy of national urban agglomeration. Energy 2025, 319, 135003. [Google Scholar] [CrossRef] [Scilit]
- Zhao, F.; Sun, Y.; Zhang, J. Does industrial agglomeration and environmental pollution have a spatial spillover effect?: Taking panel data of resource-based cities in China as an example. Environ. Sci. Pollut. Res. 2023, 30, 76829–76841. [Google Scholar] [CrossRef] [Scilit] [PubMed]
- Yang, T.B. Crossing administrative boundaries: Using internet development to improve borrowing size. Cities 2024, 154, 105362. [Google Scholar] [CrossRef] [Scilit]
- Fujita, M.; Thisse, J.F. Economics of agglomeration. J. Jpn. Int. Econ. 1996, 10, 339–378. [Google Scholar] [CrossRef] [Scilit]
- Puga, D. The Magnitude and Causes of Agglomeration Economies*. J. Reg. Sci. 2010, 50, 203–219. [Google Scholar] [CrossRef] [Scilit]
- Wooldridge, J.M. Econometric Analysis of Cross Section and Panel Data; MIT Press: Cambridge, MA, USA, 2010. [Google Scholar]
- Ramsey, J.B. Tests for Specification Errors in Classical Linear Least-Squares Regression Analysis. J. R. Stat. Soc. Ser. B 1969, 31, 350–371. [Google Scholar] [CrossRef] [Scilit]
- Greene, W.H. Econometric Analysis, 4th ed.; International Edition; Prentice Hall: Hoboken, NJ, USA, 2000; pp. 201–215. [Google Scholar]
- Cameron, A.C.; Miller, D.L. A Practitioner’s Guide to Cluster-Robust Inference. J. Hum. Resour. 2015, 50, 317–372. [Google Scholar] [CrossRef] [Scilit]
- Pesaran, M.H. General diagnostic tests for cross-sectional dependence in panels. Empir. Econ. 2021, 60, 13–50. [Google Scholar] [CrossRef] [Scilit]
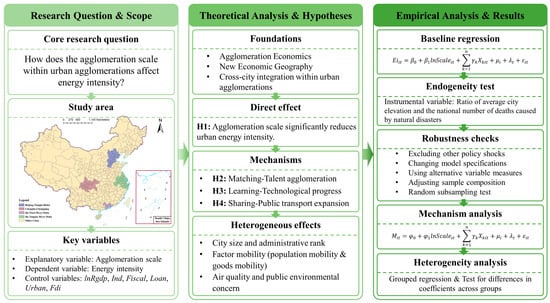
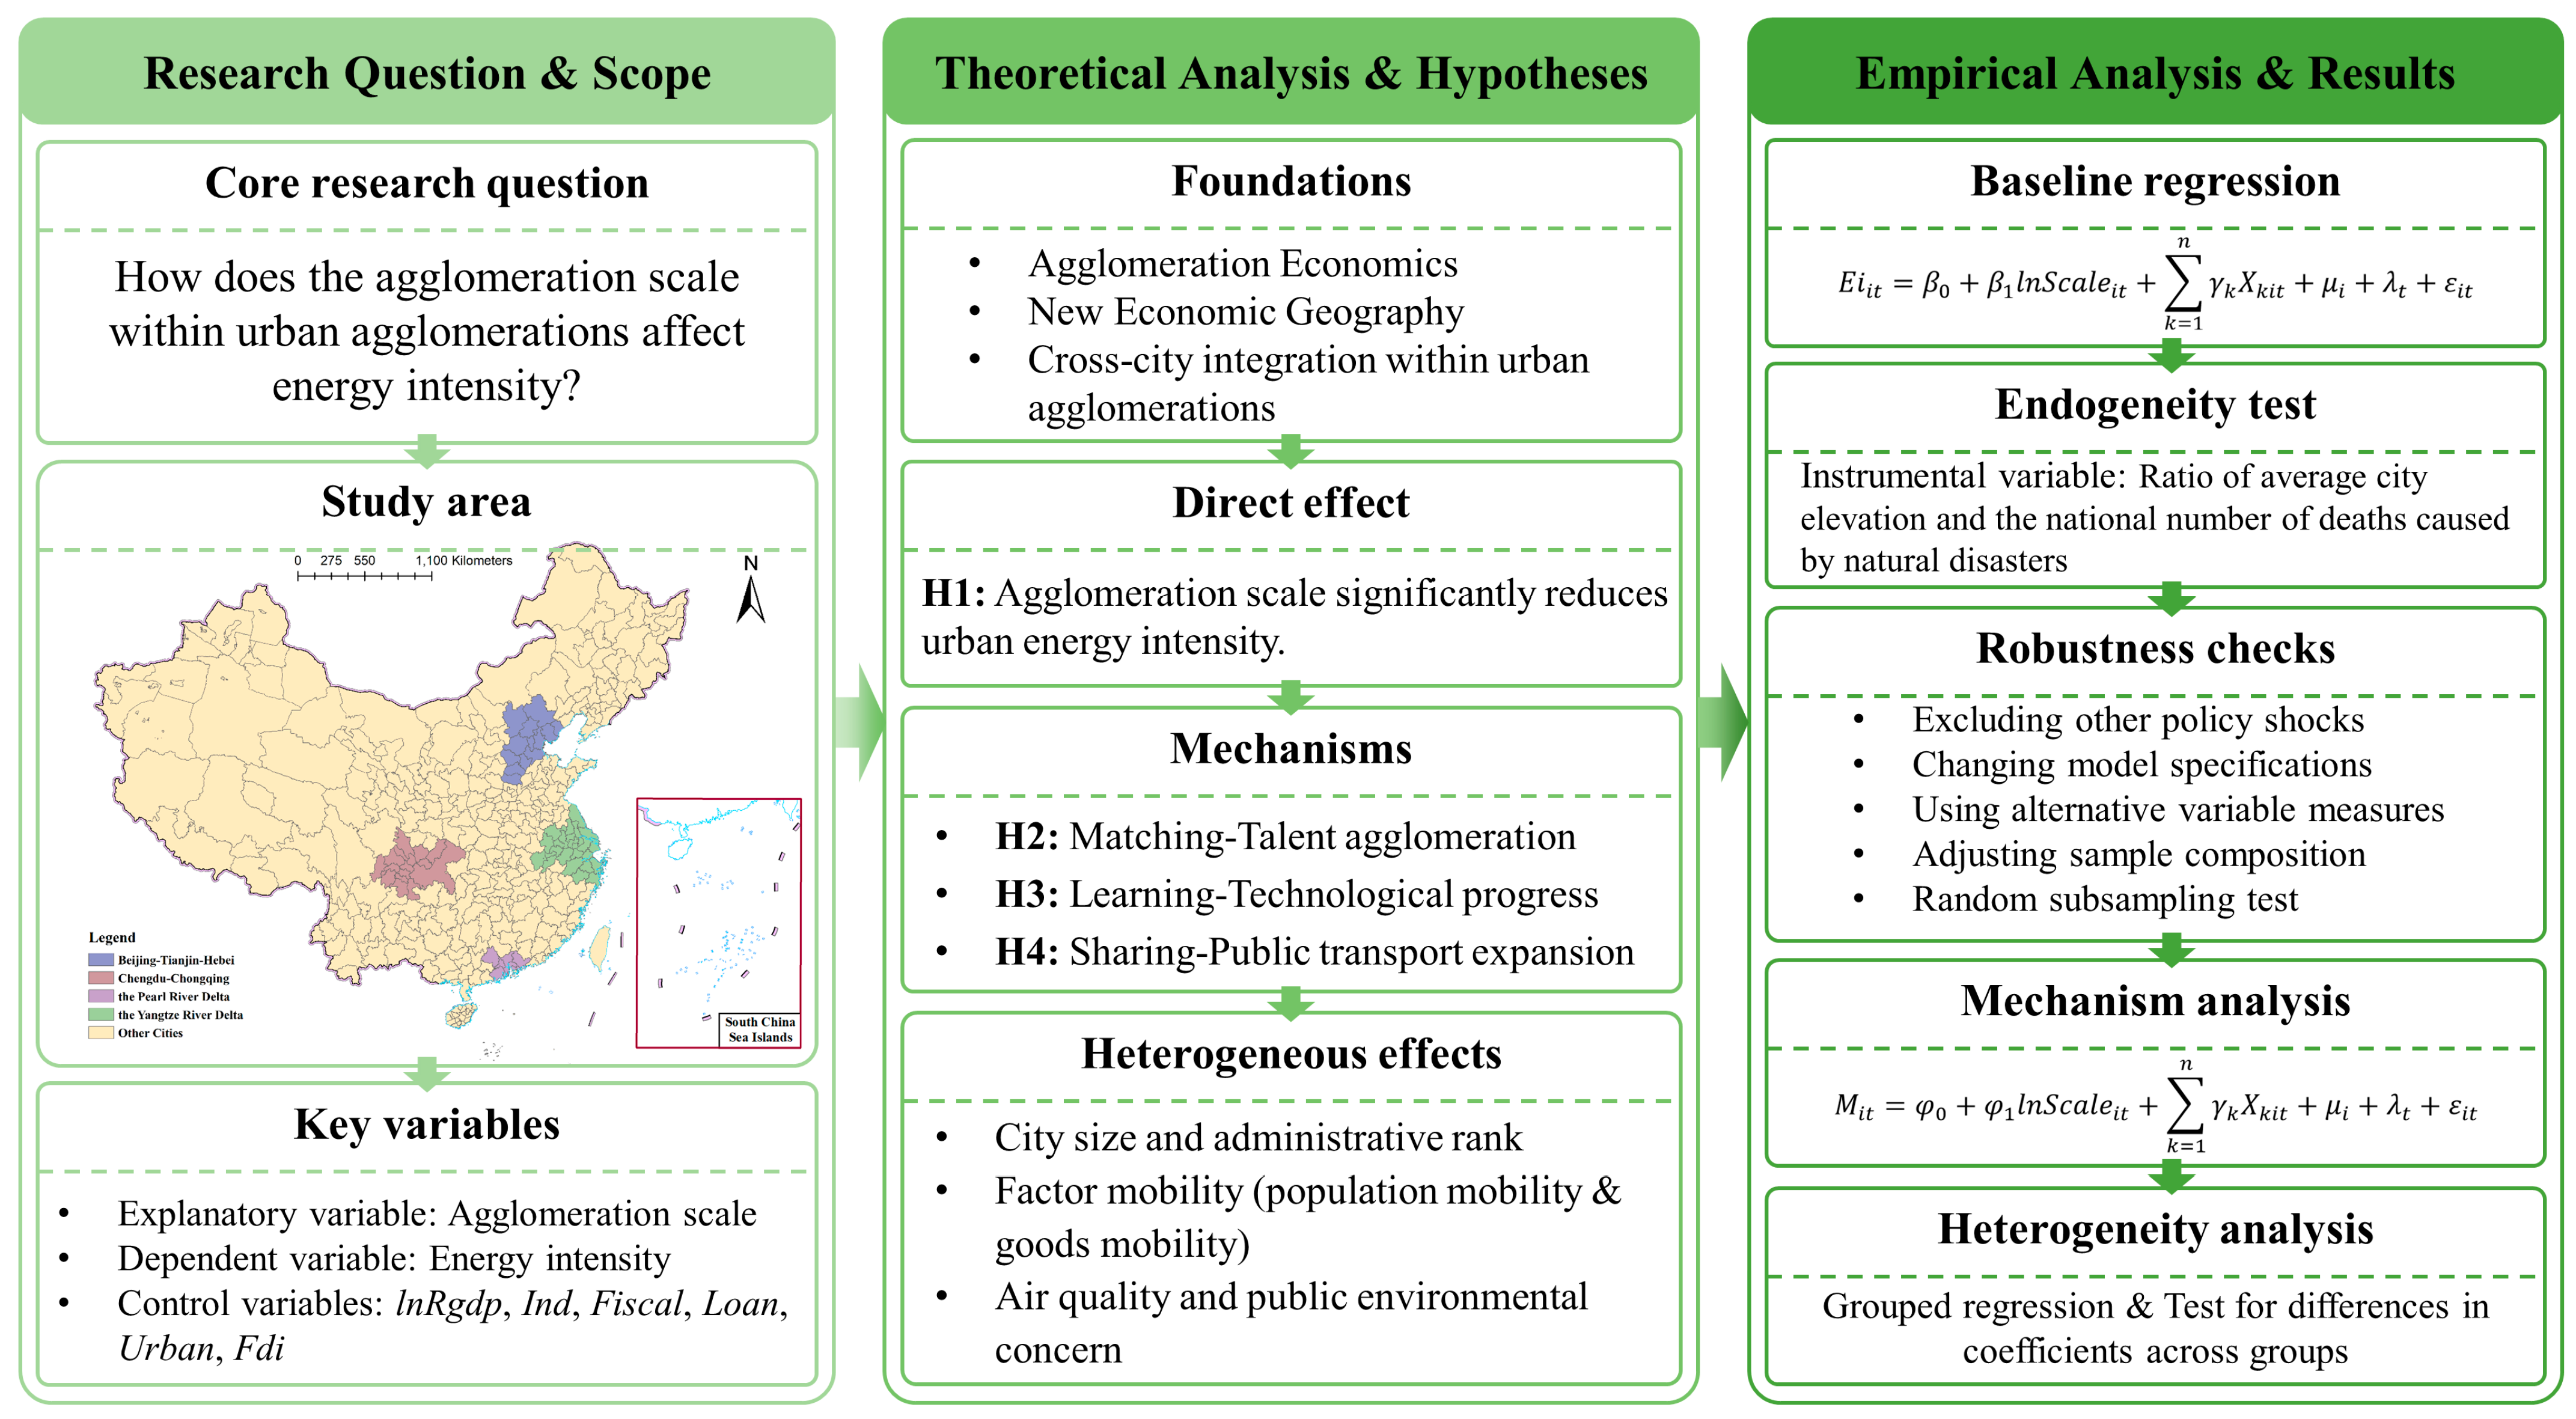
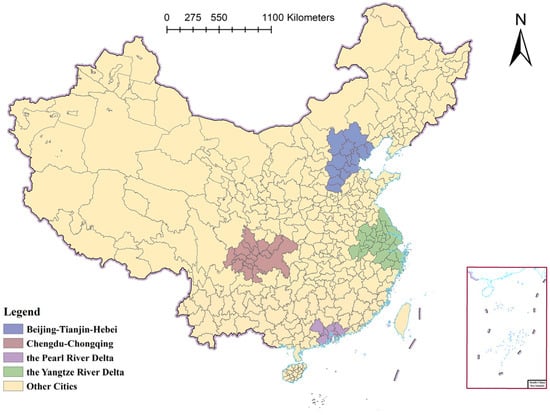
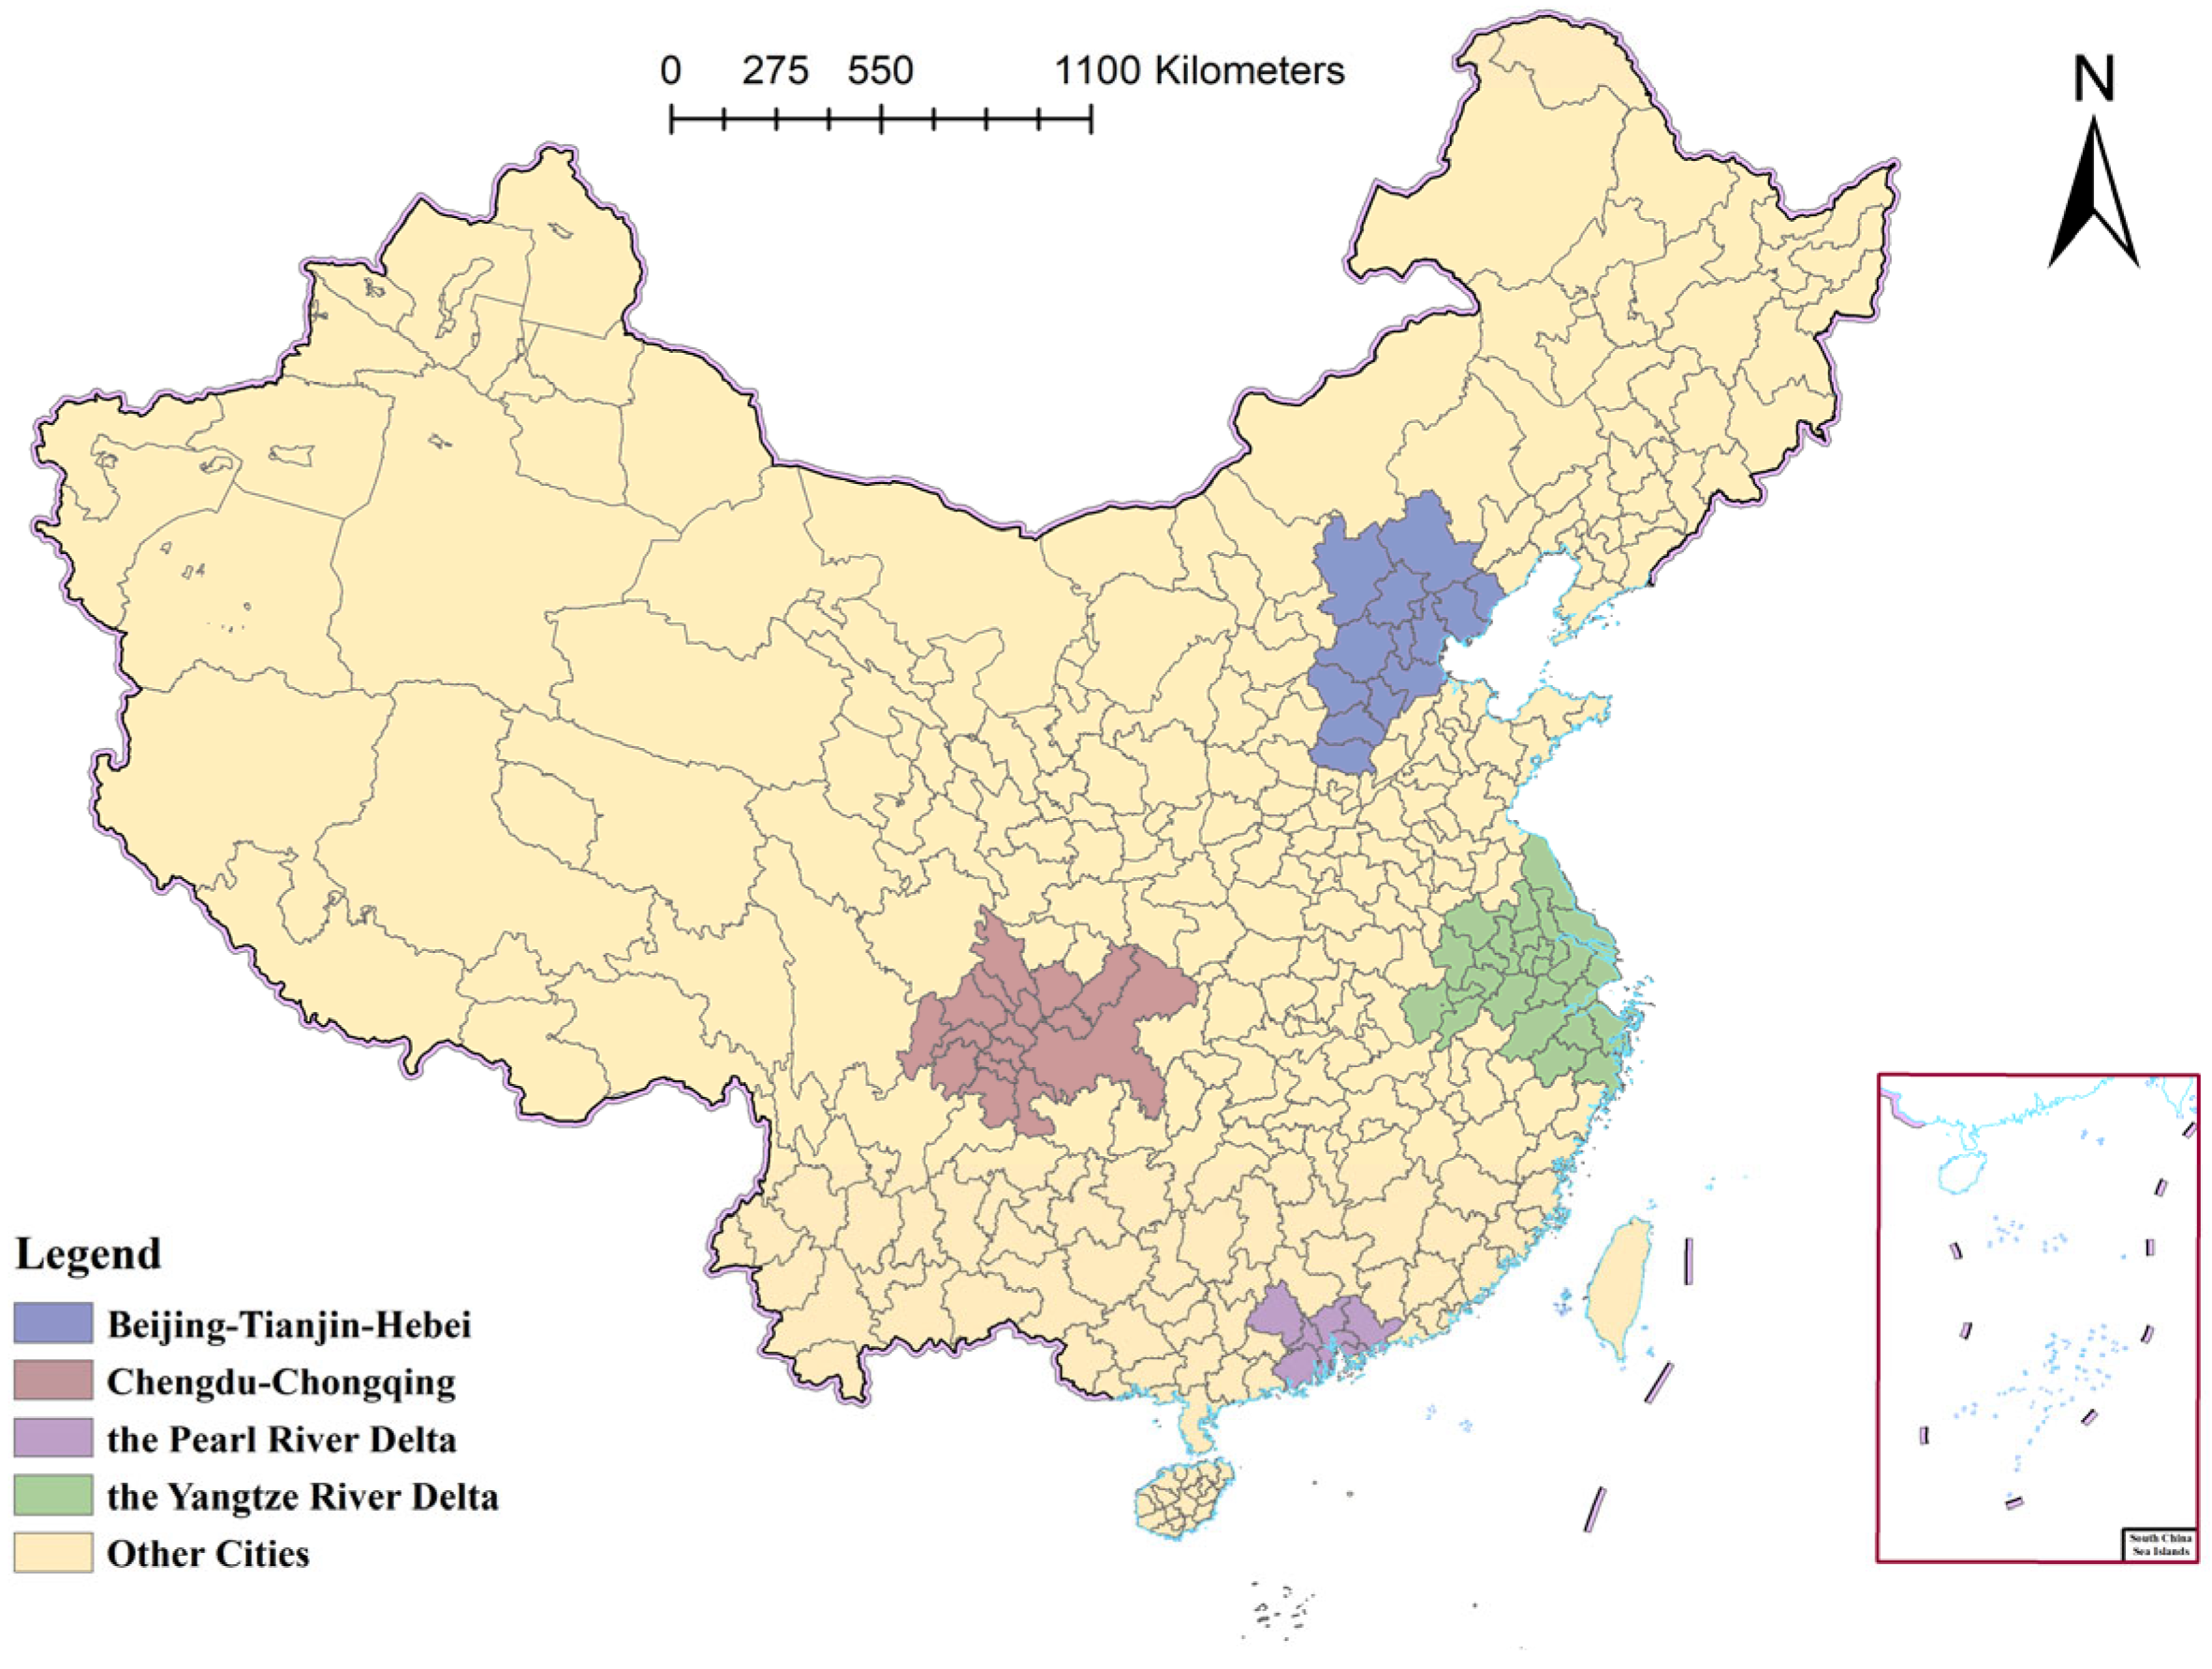
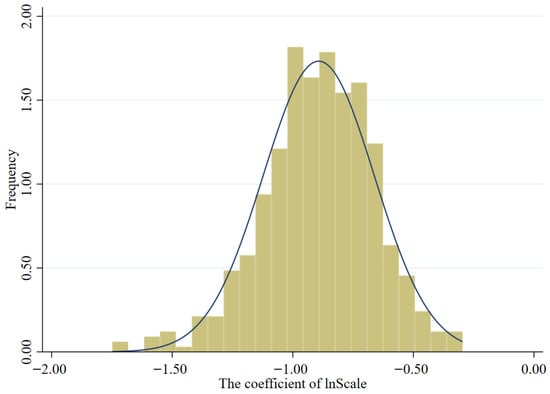
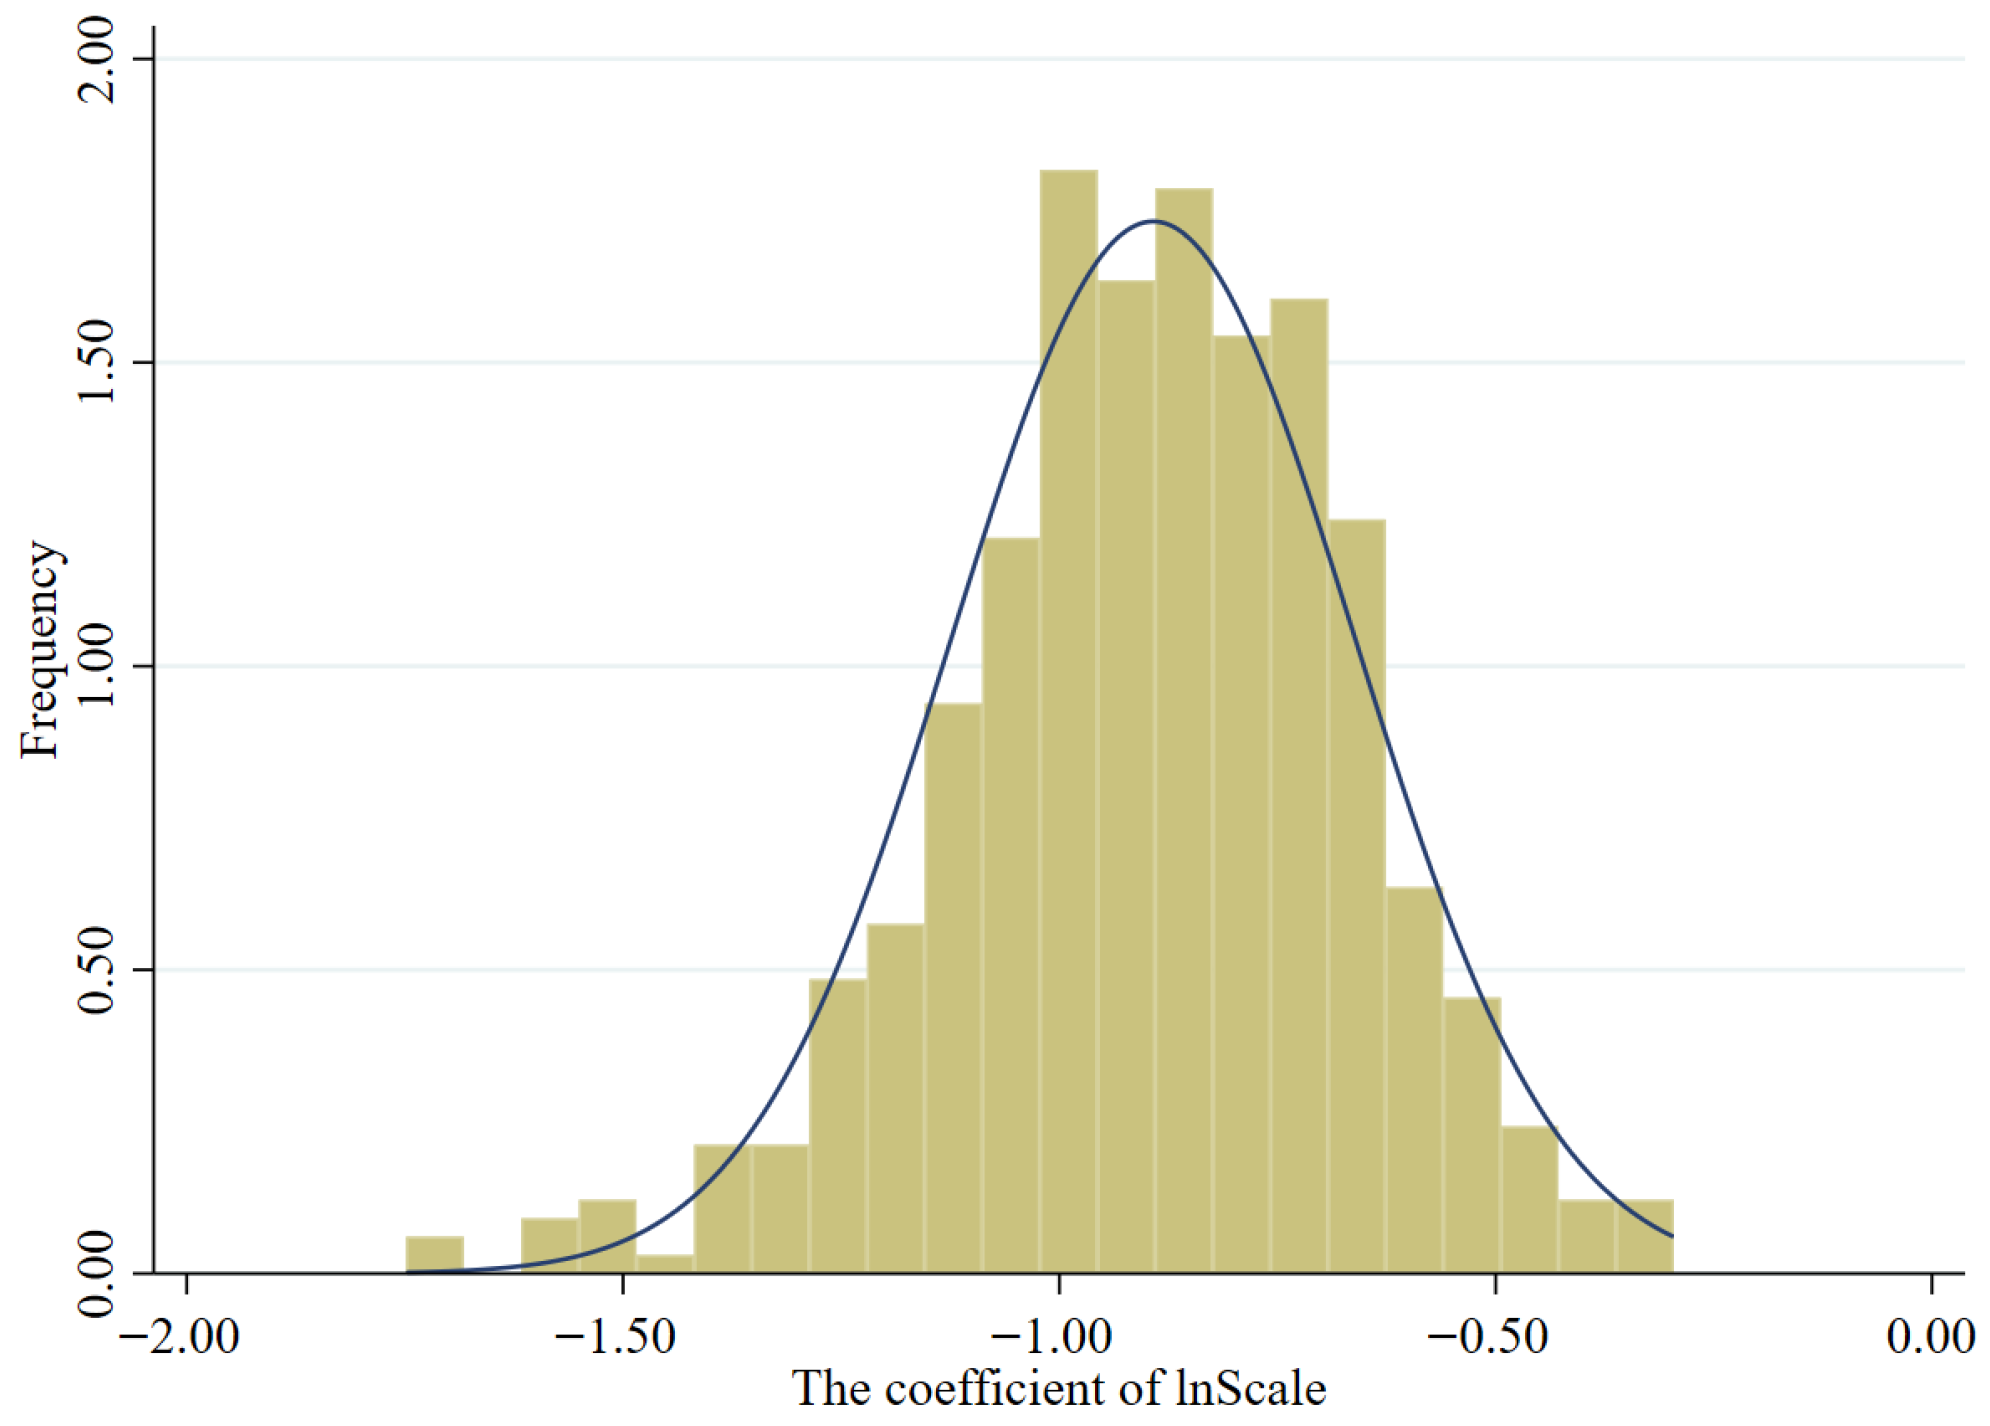

Disclaimer/Publisher’s Note: The statements, opinions and data contained in all publications are solely those of the individual author(s) and contributor(s) and not of MDPI and/or the editor(s). MDPI and/or the editor(s) disclaim responsibility for any injury to people or property resulting from any ideas, methods, instructions or products referred to in the content. |
© 2026 by the authors. Licensee MDPI, Basel, Switzerland. This article is an open access article distributed under the terms and conditions of the Creative Commons Attribution (CC BY) license.