


Abstract
The study analyzes flood susceptibility in the Banat Hydrographic Area (Romania) using an integrated GIS framework based on MCDA–AHP multicriteria analysis and the multitemporal evaluation of static and dynamic factors for two scenarios (2005 and 2023). The results highlight differences between the two scenarios, mainly driven by variations in precipitation: although the moderate class remains dominant (~56% of the area), the share of high and very high susceptibility classes is lower in 2023 (~6%) compared to 2005 (~17%), accompanied by an expansion of the low susceptibility class (~26% to ~37%). Validation using flood extent data from April 2005 shows that approximately 99% of the affected area falls within the moderate, high, and very high susceptibility classes (χ2 = 9475, p < 0.001). The multitemporal analysis indicates high stability (75% of the territory), while 25.35% exhibits transitions toward lower susceptibility classes. Dynamic factors show differentiated roles: precipitation exerts a dominant regional control (95.44% of the area), while LULC changes contribute locally. The differences between scenarios should be interpreted as a model response to climatic variability rather than as structural changes in intrinsic susceptibility. The approach provides a reproducible framework for susceptibility assessment and supports spatial planning and risk management.
1. Introduction
Floods are among the most widespread and destructive natural hazards worldwide, ranking third in the global classification of natural disasters and generating major socio-economic and environmental impacts [1,2,3,4,5,6]. Their consequences extend beyond the physical framework of the natural environment, affecting human lives, agricultural production, transport infrastructure, public health, and drinking water supply systems [7,8,9,10]. Recent assessments indicate an increase in the frequency and magnitude of flood events, particularly in the context of climate change [11,12,13,14,15], a phenomenon further amplified by urban expansion, land-use changes, river channel regulation, and inadequate drainage systems [16,17]. In this context, floods can be considered complex phenomena triggered by extreme meteorological conditions and amplified by specific hydrological and geomorphological characteristics [18].
At the global scale, floods are estimated to account for approximately 43% of all natural disasters and 47% of weather-related disasters [3]. In this context, in Europe, characterized by a dense hydrographic network, floods occur frequently and generate significant economic losses, representing a major concern for authorities, insurance companies, and local communities [19,20,21,22]. Romania also faces a high flood risk [23], with floods accounting for approximately 48% of all natural disasters recorded between 1900 and 2013 [24]. In recent decades, an intensification of hydrological extremes has been observed, associated with the country’s geographical position at the intersection of continental and oceanic air masses, which favors climatic instability [25]. The increasing severity, duration, and frequency of floods are correlated with climate change trends both nationally and globally [26,27].
Within this context, the Banat Hydrographic Area represents a relevant case study, as it has been repeatedly affected by hydrological events with significant consequences for human settlements, infrastructure, and agricultural land. Over the past decades, several flood episodes have highlighted the vulnerability of existing hydraulic systems and the sensitivity of the territory to extreme discharges [28]. Long-term meteorological analyses indicate a decrease in the total number of days with precipitation, accompanied by an increase in precipitation intensity and shifts in seasonal patterns, suggesting a trend toward more concentrated rainfall events with high hydrological potential.
Flood susceptibility refers to the probability that a given territory will be affected by such events [15,29]. Mapping flood susceptibility is essential for watershed management, land use planning, loss estimation, and risk reduction [30,31]. Considering the dynamic and multidimensional nature of floods [32], the identification and analysis of susceptible areas require the use of geomatic techniques capable of integrating topographic, hydrological, climatic, and anthropogenic variables [33,34,35,36,37,38].
The scientific literature describes numerous methodological frameworks for assessing flood hazard and susceptibility, including the historical disaster method [39], scenario simulation [40], index-based methods [41], GIS and remote sensing analyses [42,43,44,45], as well as hydraulic and hydrological modeling using dedicated platforms [46]. Advances in LiDAR, UAS, and radar technologies have considerably improved the accuracy of flood monitoring and spatial prediction [47,48]. In addition, Machine Learning algorithms, such as Artificial Neural Networks, Support Vector Machines, and Deep Learning Neural Networks, have demonstrated high performance in flood susceptibility modeling [49,50,51,52].
Nevertheless, Multicriteria Decision Analysis (MCDA), integrated within a GIS environment, remains one of the most widely used approaches for flood susceptibility mapping at the regional scale [53,54,55]. MCDA enables the coherent integration of heterogeneous criteria (topographic, hydrological, climatic, and anthropogenic) within a unified decision-making framework. Among MCDA techniques, the Analytic Hierarchy Process (AHP) is frequently applied due to its transparent pairwise comparison structure and the possibility of consistency verification [18,56]. Numerous studies have successfully applied the MCDA–AHP approach to evaluate flood susceptibility, including in river basins in Romania [43,57,58,59].
However, a common structural limitation in the literature lies in treating flood susceptibility as a static property of the territory, assessed for a single temporal moment and implicitly extrapolated as stable over time. Such an approach may lead to an underestimation of the real dynamics of the hazard, given that triggering and amplifying factors, particularly precipitation and land use, are characterized by significant interannual and spatial variability [60]. The absence of comparative assessments conducted under controlled methodological conditions limits the ability to understand how climatic changes and anthropogenic landscape transformations influence the spatial redistribution of flood susceptibility. In this context, the development of multitemporal analytical frameworks becomes necessary in order to test the robustness of the methodologies used and to explicitly quantify the contribution of dynamic factors to susceptibility variations. By maintaining constant the physico-geographical components and selectively updating time-dependent variables, it becomes possible to evaluate the structural stability of the model and to highlight the magnitude of changes induced by climatic and anthropogenic pressures.
Within this conceptual framework, the overall objective of the study is to develop and test an integrated spatial model for flood susceptibility assessment, capable of capturing variations in susceptibility under different climatic and land-use conditions. The proposed approach aims not only to map flood susceptibility, but also to evaluate the model response in a multitemporal context by analyzing the differences generated exclusively by dynamic factors.
The specific objectives of the study are: (1) to construct a conceptual and operational framework for flood susceptibility modeling by selecting and standardizing relevant factors according to the hydrogeomorphological characteristics of the analyzed area; (2) to integrate these factors into a multicriteria decision model implemented in a GIS environment, including the estimation of relative weights and the evaluation of hierarchical consistency; (3) to assess the performance of the model by comparing the results with a documented hydrological event in order to verify the spatial coherence of susceptibility class distribution; (4) to analyze the spatial variations in the susceptibility index between two distinct temporal moments and to identify sectors characterized by significant transitions between susceptibility classes; and (5) the assessment of the relative role of dynamic factors in generating the differences between scenarios, by investigating the relationship between the spatial distribution of susceptibility variations and the actual contribution of each factor to the variation in the Flood Susceptibility Index (FSI) value.
In this respect, the research seeks to address two main research questions. The first question concerns the methodological dimension of modeling: to what extent can a multicriteria model based on the integration of hydrogeomorphological and climatic factors coherently reproduce the spatial distribution of flood susceptibility, and how stable does this model remain under multitemporal conditions? The second question addresses the mechanisms that drive changes in flood susceptibility over time: which factors control the spatial distribution of susceptibility differences between the two scenarios, and which dynamic factors predominantly influence the variation in the Flood Susceptibility Index (FSI) across the study area?
The study provides a coherent methodological framework based on open-source data and implemented as a replicable spatial model for flood susceptibility assessment. The main contribution of the research lies in integrating a multitemporal perspective into MCDA–AHP modeling, allowing the explicit isolation and evaluation of the influence of dynamic factors (particularly precipitation and land use) on the spatial distribution of flood susceptibility. Through this approach, the proposed model can be applied and adapted to other river basins characterized by similar physico-geographical conditions, offering a replicable tool for analyzing spatial variations in flood susceptibility. At the same time, the results contribute to improving the understanding of the mechanisms controlling susceptibility changes over time and provide support for spatial planning and hydrological risk management decisions at the regional scale.
2. Materials and Methods
2.1. Research Methodological Framework
Flood susceptibility assessment was carried out by integrating MCDA with AHP, implemented within a GIS environment [16,32,53]. The model was applied for two temporal scenarios corresponding to April 2005 and April 2023.
Static factors (morphometric and pedological) were considered invariant between scenarios, while dynamic factors, namely precipitation and land use, were updated for each year. This approach allows the identification of susceptibility changes generated exclusively by variations in the dynamic components.
The methodological workflow (Figure 1) involved data preparation, generation and reclassification of conditioning factors, weight calculation using AHP, spatial aggregation through weighted overlay, model validation for the year 2005, analysis of spatial differences between the 2005 and 2023 scenarios, and the identification of the role of dynamic factors in the observed changes in flood susceptibility.
Figure 1.
Methodological framework for the multitemporal assessment of flood susceptibility using MCDA–AHP.
The adopted approach is susceptibility-based, aiming to assess the relative spatial predisposition to flooding according to the selected conditioning factors. The MCDA–AHP model used is not a probabilistic model and does not simulate hydrodynamic processes; instead, it provides a comparative ranking of areas based on their potential vulnerability to flooding. At the same time, the model can be considered within the category of extended susceptibility analyses, where, in addition to relatively stable physical-geographical factors, dynamic factors, particularly precipitation, are integrated in order to capture the triggering conditions of flood processes. In this context, the resulting Flood Susceptibility Index (FSI) does not represent a strictly static susceptibility, but rather an evaluation of predisposition to flooding under specific climatic conditions, placing it at the interface between susceptibility and hazard, an approach commonly adopted in MCDA–AHP-based studies.
2.2. Study Area
The Banat Hydrographic Area is located in the southwestern part of Romania (E: 134,612–332,849 m; N: 152,919–273,845 m, Stereo 70 projection) and has a total area of 18,312 km2, representing 7.68% of the national territory [61]. From an administrative perspective, the area entirely overlaps the Timiș and Caraș-Severin counties and partially extends into the Arad, Mehedinți, and Gorj counties.
The relief of the study area is characterized by a well-defined altitudinal step structure, ranging between 58 and 2248 m (Figure 2), which directly controls runoff processes and flood predisposition. The eastern and southeastern sectors are dominated by mountainous units belonging to the Southern Carpathians and the Banat Mountains, characterized by highly fragmented relief that generates torrential basins with short hydrological response times. The mountainous area is surrounded by depressions and hills that act as transitional zones capable of attenuating or, under certain conditions, amplifying flood waves. The western and northwestern parts of the hydrographic area are occupied by low plains of the Banat Plain, characterized by gentle slopes, elevations frequently below 100 m, and extensive floodplains [62]. This morphological setting favors the lateral expansion of water during high-flow periods and increases the duration of water stagnation.
Figure 2.
Location of the Banat Hydrographic Area in Romania and its main physical-geographical characteristics: elevation, hydrographic network, and relief units (based on data from [62,63,64,65]).
The hydrographic network shows a complex development, structured around the Bega–Timiș system, with contributions from the eastern mountainous basins, and the southern rivers (Caraș, Nera, Cerna) that flow directly into the Danube. In the mountainous sector, narrow valleys, steep slopes, and rapid runoff concentration processes prevail, whereas in the plain sectors meandering channels, river regulation works, and areas with high overflow potential are present. The hydrographic network consists of 389 registered watercourses, with a cumulative length of approximately 6,700 km, corresponding to an average density of 0.36 km/km2 [61].
According to official data [28,65], the areas most frequently affected by floods are located in the upper basins of the Bega River and its tributaries, along the Bega Veche, along the Timiș River up to the Lugoj area, along the Bârzava River between Reșița and Gătaia, as well as along the Caraș and Nera rivers. This spatial distribution reflects the interaction between rapid inflows from mountainous areas and the limited conveyance capacity of lowland sectors.
The Banat Hydrographic Area represents a suitable “natural laboratory” for flood susceptibility assessment due to its pronounced morphological and morphometric heterogeneity, the density of its hydrographic network, and the existence of a well-documented history of major hydrological events. The contrast between areas generating rapid flood waves and accumulation zones in the plain allows a robust evaluation of the influence of dynamic factors (precipitation and land use) within an MCDA–AHP framework, while maintaining the physico-geographical factors relatively constant.
2.3. Data Used
Flood susceptibility assessment was based on the integration of topographic, hydrological, climatic, and thematic datasets required for deriving the conditioning factors within the MCDA–AHP analysis (Table 1). To ensure spatial consistency, all layers were reprojected to the national Stereo 1970 projection system and harmonized to a common cell resolution of 25 m.
Table 1.
Datasets and their role in the model.
Data on the spatial extent of the 2005 floods were used as an empirical reference for evaluating the predictive capability of the model, enabling the comparison between the spatial distribution of susceptibility classes and the areas that were actually affected.
2.4. Selection of Flood Conditioning Factors
The conditioning factors were selected based on their hydrological relevance reported in the literature and data availability for the study area and were grouped into static factors, describing the relatively stable physical–geographical framework, and dynamic factors, characterized by temporal variability.
Elevation and slope control water accumulation and runoff propagation, with low elevations and gentle slopes generally being more prone to flooding [18,68,69,70,71]. The topographic wetness index (TWI) reflects the potential for soil saturation and flow concentration [18], while drainage density indicates the development of the hydrographic network and runoff transfer efficiency [72]. Proximity to rivers expresses the direct influence of river channels on the likelihood of overflow [32,73]. Soil types control infiltration and water retention [74], whereas proximity to road infrastructure may locally increase impermeabilization and flood susceptibility [6,15]. The dynamic factors considered are land use and land cover, which influence infiltration and surface runoff processes [6,15], and precipitation, the main triggering mechanism of flood events [6,15,18,75].
2.5. Derivation and Standardization of Factors in the GIS Environment
All spatial analyses were performed in the ArcGIS 10.8 environment [76]. To ensure spatial consistency, all thematic layers were reprojected to the national Stereo 1970 coordinate system and harmonized to a common spatial resolution of 25 m. The digital elevation model (DEM) [63] was hydrologically corrected by removing artificial depressions prior to the derivation of morphometric parameters. Conditioning factors were derived and standardized in the GIS environment to allow their integration within the multicriteria analysis.
Elevation was derived from the DEM and used as a static factor in the analysis. The relationship between elevation and flood susceptibility is inversely proportional, with lower values corresponding to a higher flood potential. Classification into susceptibility classes was performed using the Natural Breaks (Jenks) method.
Slope was derived from the DEM using the Slope tool, with values expressed in degrees and calculated using the planar method. The relationship between slope and flood susceptibility is inversely proportional, with lower slope values associated with a higher flood potential. Classification into susceptibility classes was performed using the Natural Breaks (Jenks) method.
The Topographic Wetness Index (TWI) was calculated using the formula proposed by Beven (1979) and widely applied in flood susceptibility mapping [32,77,78]:
where a represents the upslope contributing area (m2) and β is the local slope.
The required parameters were derived from the DEM. Flow direction and flow accumulation were estimated using the D8 algorithm.
The contributing area was expressed in surface units by converting the flow accumulation values (Equation (2)):
where FA is the flow accumulation (number of cells) and Ac is the area of a grid cell.
The slope derived from the DEM was converted into radians:
To avoid null values of the slope tangent, very small slope values were limited to 0.001 rad.
The relationship between TWI and flood susceptibility is directly proportional, and classification into susceptibility classes was performed using the quartile method.
Drainage density was derived from the vector hydrographic network using the Line Density tool, with a search radius of 1000 m. The relationship between drainage density and flood susceptibility is directly proportional. Classification into susceptibility classes was performed using the Natural Breaks (Jenks) method.
Distance to rivers was calculated by applying the Euclidean Distance function to the vector hydrographic network, resulting in a continuous raster expressed in meters. The relationship between distance and flood susceptibility is inversely proportional, with smaller values associated with a higher flood potential. Classification into susceptibility classes was performed using fixed thresholds: 0–100 m, 100–150 m, 150–500 m, 500–700 m, and >700 m, defined based on schemes commonly used in flood susceptibility mapping studies [32,38,59].
Soils were included as a static factor. Pedological information was obtained from the soil database available for the study area, considering both texture class and genetic soil type, according to the national soil classification system [79]. The relationship between soil properties and flood susceptibility is directly proportional, with fine-textured soils favoring water accumulation and coarse-textured soils facilitating infiltration.
The initial rating was assigned based on the dominant soil texture, while for mixed units the finer fraction was considered. To account for poor natural drainage or hydromorphic conditions, a positive expert correction (+1) was applied to selected genetic soil types.
Distance to roads was derived by applying the Euclidean Distance function to the vector road network, resulting in a continuous raster expressed in meters at a spatial resolution of 25 m. The relationship between distance and flood susceptibility is inversely proportional, with the influence of infrastructure decreasing as distance increases. Reclassification was performed using fixed thresholds (0–50 m, 51–100 m, 101–200 m, 201–300 m, and >300 m), defined based on schemes commonly used in flood susceptibility studies [38,80,81].
Land use and land cover (LULC) were analyzed as a dynamic factor using the CORINE Land Cover 2006 and 2018 datasets, corresponding to the closest available temporal references for the years 2005 and 2023. Considering that land use generally exhibits limited short-term variations at the regional scale, this temporal mismatch is deemed acceptable and does not significantly affect the comparability of the multitemporal analysis. The relationship between land use and flood susceptibility is considered directly proportional. CLC categories were grouped into five classes based on their general hydrological behavior, taking into account infiltration capacity, degree of surface impermeabilization, and runoff generation potential: very high—water bodies and wetlands (CLC 411, 511, 512); high—artificial surfaces and intensively used agricultural land (CLC 112, 121, 122, 123, 124, 131, 132, 133, 141, 142, 213); moderate—partially drained agricultural land (CLC 211, 212, 221, 332, 333); low—agro-natural mosaics (CLC 231, 242, 243); very low—forests and natural grasslands (CLC 311, 312, 313, 321, 322, 324). Although some categories within the same class may exhibit local differences in hydrological behavior, the aggregation was performed to ensure the coherence of the multicriteria model and the comparability between scenarios. In this context, the defined classes reflect general trends at the regional scale, while local variations do not significantly influence the overall results of the analysis. The same classification scheme was applied to both datasets to ensure consistency in the multitemporal analysis.
The NDVI, commonly used to characterize vegetation density, was not included in the model due to the lack of cloud-free satellite images for the analyzed periods. In addition, the predominantly mountainous character of the study area leads to a high frequency of cloud cover, while the seasonal variability of the NDVI may reflect short-term phenological changes, potentially affecting the comparability of the multitemporal analysis.
Precipitation was analyzed as a dynamic factor using monthly precipitation totals (mm) recorded in April for the years 2005 and 2023 at 17 meteorological stations located within and in the proximity of the study area. The continuous spatial distribution was obtained by interpolating point values using the Inverse Distance Weighting (IDW) method [82,83], according to Equation (4). This method was selected due to its robustness under conditions of moderate station density and relatively uniform spatial distribution. The application of geostatistical methods resulted in higher interpolation errors, mainly due to the limited number of stations, and therefore IDW provided a more stable representation of the spatial variability of precipitation.
where P(x) is the estimated value for cell x, Pi is the precipitation amount measured at station i, di is the distance to that station, and the weighting power p was set to 2.
The relationship between precipitation amount and flood susceptibility is directly proportional. To ensure multitemporal comparability, reclassification was performed using a common set of thresholds defined based on the minimum–maximum range of the combined values from 2005 and 2023, divided into equal classes according to Equation (5):
This approach preserves the absolute differences between scenarios and ensures the consistency of the evaluation process.
For integration into the multicriteria analysis, all conditioning factors were transformed into a common ordinal scale, with values ranging from 1 (very low susceptibility) to 5 (very high susceptibility). This step was necessary to ensure comparability between thematic layers originally expressed in different units and value ranges. Standardization was performed by reclassifying continuous values into five classes, defined based on statistical distribution or expert-defined thresholds, while preserving the functional relationship between the magnitude of the parameter and its influence on flood potential.
In general terms, the transformation can be expressed as follows (Equation (6)):
where Xi—the initial value of the factor for cell i, and Ri—the standardized rating.
Depending on the nature of the relationship between the parameter and susceptibility, the function f may take the following form: directly proportional relationship, when higher values correspond to higher susceptibility and inversely proportional relationship, when higher values correspond to lower susceptibility.
Through this procedure, all thematic layers were brought into a unified numerical framework, enabling the application of the weights determined through AHP and the subsequent calculation of the susceptibility index.
2.6. Weight Determination Using the AHP Method
The weights of the factors were determined using the Analytic Hierarchy Process (AHP) (Table 2), a widely applied MCDA technique in flood susceptibility mapping for quantifying the relative importance of criteria and assessing the consistency of pairwise comparisons [32,82,84].
Table 2.
AHP pairwise comparison matrix and normalized weights of the factors.
The pairwise comparison matrix (Table 2) was constructed based on an integrated evaluation combining insights from the scientific literature with expert knowledge of the hydrological and geomorphological processes specific to the Banat Hydrographic Area. The comparisons were performed to reflect the relative role of each factor in controlling the processes of runoff accumulation, propagation, and concentration.
Climatic and hydrological factors, particularly precipitation and distance from rivers, were considered dominant, as they directly control the triggering and spatial extent of flood events. Morphometric factors (elevation, slope, and TWI) were assessed as having a major role in controlling runoff accumulation and drainage conditions, while factors with predominantly local influence (drainage density, soil type, and distance from roads) were assigned lower weights. Land use/land cover (LULC) was positioned as an intermediate factor, reflecting its influence on infiltration and surface runoff processes.
The weights w were estimated based on the principal eigenvector of matrix A [85]:
Consistency was evaluated using the Consistency Index (CI) and Consistency Ratio (CR) according to Equation (8) [85,86]:
where for n = 9 the standard value of the Random Index (RI) was used.
For n = 9, the obtained values were λmax = 9.3889, CI = 0.0486, and CR = 0.0335, indicating a very good consistency of judgments, below the accepted threshold of 0.10 [32].
The distribution of weights reflects the hydrogeomorphological characteristics of the analyzed area and is consistent with results reported in the international literature [84,87]. Although a formal sensitivity analysis was not performed, the robustness of the model is supported by the internal consistency of the AHP matrix and by the spatial validation of the results against the April 2005 flood event.
2.7. Development of Flood Susceptibility Maps and Model Validation
The Flood Susceptibility Index (FSI) was calculated through the weighted linear combination of the standardized factors, using the weights obtained through the AHP. For each raster cell, the final value was determined according to Equation (9) [85,88]:
where: wi—weight of factor i; ri—standardized rating (1–5); n—total number of factors.
The resulting FSI index does not represent a physical probability of flooding but rather a relative score expressing the comparative predisposition of cells within the study area. Therefore, the obtained values should be interpreted as relative indicators of flood susceptibility, without representing the probability of occurrence of an event, water depth, or flood return period.
The calculation was performed in ArcGIS 10.8 using the Weighted Overlay tool, with all layers having the same spatial resolution (25 m). The weights derived through AHP were introduced into the tool as percent influence values.
The resulting FSI index was expressed directly on an ordinal scale with five susceptibility classes (very low, low, moderate, high, and very high), corresponding to the 1–5 scale used in the factor standardization stage. Thus, the final classification is consistent with the structure of the multicriteria evaluation applied within the MCDA–AHP analysis.
The same aggregation and classification procedure was applied to both temporal scenarios (2005 and 2023) to ensure direct comparability of the results.
The performance of the flood susceptibility model was evaluated for the scenario corresponding to April 2005, for which independent data on the actual flood extent are available. The inventory of the hydrological event from April 2005 was used as an empirical reference for testing the predictive capability of the MCDA–AHP methodology.
Validation was performed by spatially intersecting the inventory of flooded areas with the FSI map generated for 2005. For each cell corresponding to the flooded surface, the susceptibility class assigned by the model was identified, allowing the quantification of the flooded area corresponding to each susceptibility category.
Model performance was assessed by analyzing the distribution of flooded area among susceptibility classes and by testing the statistical significance of this distribution using a multinomial χ2 test, applied in JASP version 0.95.4.0 [89]. In addition, the cumulative distribution of flooded area captured by the susceptibility classes was analyzed, an indicator frequently used in the evaluation of susceptibility models based on MCDA [87,90,91].
The scenario corresponding to the year 2023 was not subjected to a similar validation procedure, as no comparable independent inventory of flood extent was available for this year. In this context, the validation performed for the extreme event of April 2005 allows testing the model’s ability to identify flood-prone areas under high hydrological stress conditions, while the 2023 scenario is used to analyze the model response under different climatic conditions, rather than for additional independent validation.
2.8. Methodology for Multitemporal Comparative Analysis (2005–2023)
The multitemporal analysis aimed to identify changes in the spatial distribution of flood susceptibility between the scenarios corresponding to April 2005 and April 2023. Since the static factors were kept constant, the observed differences can be attributed exclusively to the variation in the dynamic components, namely precipitation and land use/land cover.
In the first stage, the continuous change in flood predisposition was assessed by calculating the difference between the susceptibility indices (Equation (10)):
where positive values indicate an increase in susceptibility, while negative values indicate a decrease.
Subsequently, in order to highlight dynamics at the categorical level, the maps reclassified into the five susceptibility classes were compared using a cross-tabulation analysis, a method frequently used to evaluate spatial changes in susceptibility in multitemporal studies [87,91]. This procedure enabled the construction of a transition matrix, highlighting the areas that migrated between different susceptibility levels (e.g., from moderate to high or from high to very high).
For each scenario, the areas and corresponding percentage shares of the susceptibility classes were calculated, allowing the evaluation of general evolutionary trends and the identification of sectors where the influence of dynamic factors led to either an intensification or a reduction in flood predisposition.
By applying the same methodology, identical weights, and the same classification scheme, the comparison between the two temporal moments was conducted within a coherent analytical framework, ensuring the direct interpretability of the observed changes. By keeping all static factors and the same weighting scheme constant, the multitemporal analysis functions as a controlled experiment, in which the variation in the FSI reflects exclusively changes in dynamic factors, particularly precipitation.
Consequently, the obtained results should be understood as decision-support tools for spatial planning and risk management, being suitable for comparative analyses and the evaluation of spatial trends, rather than for the deterministic prediction of flood events.
2.9. Analysis of Dynamic Factors Influencing Changes in Flood Susceptibility
To evaluate the contribution of dynamic factors to changes in flood susceptibility between 2005 and 2023, the analysis was conducted in a GIS environment by quantifying the spatial contribution of changes in precipitation and land use to the variation in the Flood Susceptibility Index (FSI). Since static factors were kept constant between the two scenarios, FSI variations were attributed exclusively to changes in dynamic factors.
Temporal differences were calculated by subtracting the reclassified values (2023–2005) for each dynamic factor, weighted using AHP coefficients integrated into the Weighted Overlay Analysis (WOA) model. For each raster cell, the factor with the highest absolute contribution was identified, and the area controlled by each factor was quantified through raster analysis.
This approach enables the identification of the spatial dominance of each factor and provides a direct assessment of their role in controlling susceptibility variation at the regional scale, highlighting the differences between climatic influence and that associated with land use [92].
3. Results
3.1. Spatial Distribution of Static Conditioning Factors
3.1.1. Morphometric Factors: Elevation, Slope, and the Topographic Wetness Index (TWI)
Elevation in the Banat Hydrographic Area ranges between 58 m and 2248 m. Reclassification into five susceptibility classes (Figure 3), based on the inverse relationship between elevation and flood predisposition, resulted in the following intervals: class 5 (very high susceptibility): 58–221.6 m; class 4 (high susceptibility): 221.7–479.2 m; class 3 (moderate susceptibility): 479.3–796.9 m; class 2 (low susceptibility): 797–1235 m; and class 1 (very low susceptibility): 1236–2248 m. Class 5 occupies 54.23% of the total area of the analyzed region, representing the low-lying plain areas. Class 4 covers 19.81%, while class 3 accounts for 14.13%, being predominantly associated with hilly and depressional units. Classes 2 and 1 represent 9.02% and 2.81% of the territory, respectively, corresponding to mountainous areas with higher elevations.
Figure 3.
Spatial distribution of elevation reclassified into flood susceptibility classes used in the MCDA–AHP model.
The spatial distribution of these classes reflects the structure of the main relief units. Classes 4 and 5 are dominant in the Banat Plain, as well as in the low sectors of the depressions (Caraș, Almăj, and Bistra–Timiș–Cerna). Class 3 mainly characterizes the Lipova Hills and the Caraș–Pogăniș Hills. Classes 1 and 2 are concentrated in the eastern and southeastern mountainous units belonging to the Southern Carpathians (Țarcu Mountains, Godeanu Mountains) and the Banat Mountains (Semenic Mountains, Almăj Mountains, etc.).
Slope values in the Banat Hydrographic Area range between 0° and 75.1°.
Reclassification into five flood susceptibility classes (Figure 4) produced the following intervals: class 5 (very high susceptibility): 0–3.83°; class 4 (high susceptibility): 3.84–10.3°; class 3 (moderate susceptibility): 10.4–18°; class 2 (low susceptibility): 18.1–26.8°; and class 1 (very low susceptibility): 26.9–75.1°.
Figure 4.
Spatial distribution of slope (degrees) reclassified into flood susceptibility classes used in the MCDA–AHP model.
Class 5 occupies 50.45% of the total area of the study region and is associated with sectors characterized by low slopes. Class 4 covers 20.31%, while class 3 accounts for 14.84% of the territory. Classes 2 and 1, corresponding to steeper slopes, represent 10.07% and 4.34% of the area, respectively.
The spatial distribution of slope classes reflects the structure of the main relief units. Classes 4 and 5 are dominant in the Banat Plain, as well as in depressional areas. Class 3 mainly characterizes hilly regions, whereas classes 1 and 2 are concentrated in the eastern and southeastern mountainous sector (Southern Carpathians and Banat Mountains), where the highest slope values are recorded.
The values of the TWI range between 5.13 and 29.5. Reclassification into five susceptibility classes highlighted a relatively balanced distribution of areas among categories (Figure 5), with each class occupying approximately one-fifth of the area. Classes 4 and 5 (high and very high susceptibility) account for 41.21% of the area, while classes 1 and 2 (very low and low susceptibility) represent 39.32%. The moderate class (3) covers 19.46% of the territory. This nearly uniform distribution indicates a continuous spatial variability in saturation potential, without a dominant concentration within a single morphological sector.
Figure 5.
Spatial distribution of the TWI factor reclassified into flood susceptibility classes used in the MCDA–AHP model.
From a spatial perspective, high TWI values are mainly organized along the main hydrographic network (Aranca, Timiș, Bega, Caraș, Nera, Cerna, and the Danube) and in depressional areas, where continuous longitudinal accumulations can be observed. In the eastern and southeastern mountainous sectors, TWI values display a fragmented pattern associated with deep valleys and convergent slopes, whereas in the western plain extended distributions prevail, generally with moderate values.
Unlike elevation and slope, TWI exhibits a more granular spatial structure, directly controlled by microrelief and drainage organization, resulting in frequent alternations between classes over short distances.
The spatial distribution of morphometric factors reveals a clear contrast between the western sector, characterized by low elevations and gentle slopes, and the eastern and southeastern sectors, where higher elevations and steeper slopes predominate. Higher susceptibility classes associated with elevation and slope are mainly concentrated in the plain and depression areas. In contrast, the topographic wetness index (TWI) shows a more balanced spatial distribution closely associated with the hydrographic network.
3.1.2. Hydrographic Factors: Drainage Density and Distance from Watercourses
Drainage density values in the Banat Hydrographic Area range between 0 and 2.55 km/km2, reflecting significant differences in the degree of terrain fragmentation and the development of the hydrographic network. Reclassification into five flood susceptibility classes (directly proportional relationship) resulted in the following intervals (Figure 6): class 1 (very low susceptibility): 0–0.18 km/km2; class 2 (low susceptibility): 0.181–0.49 km/km2; class 3 (moderate susceptibility): 0.491–0.76 km/km2; class 4 (high susceptibility): 0.761–1.1 km/km2; class 5 (very high susceptibility): 1.11–2.55 km/km2.
Figure 6.
Spatial distribution of the drainage density factor reclassified into flood susceptibility classes used in the MCDA–AHP model.
The spatial distribution indicates a predominance of class 1, which occupies 47.15% of the total area and is characteristic mainly of the western plain sector. Class 2 represents 14.15%, while class 3 accounts for 26.26% of the territory, forming a transition zone within the hilly and depressional units. The higher classes (4 and 5), associated with high drainage density values, together account for 12.44% and are concentrated in the eastern and southeastern mountainous sectors.
From a spatial perspective, high drainage density values follow the radial and convergent structure of networks developed in the Țarcu, Godeanu, Cernei, Semenic, Almăjului, and Aninei Mountains, as well as in highly fragmented areas within the Lipova Hills and Caraș–Pogăniș Hills. In contrast, the Timiș, Vinga, and Lugoj plains exhibit low values, corresponding to a sparser and less branched hydrographic network.
The distance from the hydrographic network factor shows a differentiated distribution of susceptibility classes in relation to proximity to river channels. Class 5 (very high susceptibility), corresponding to the 0–100 m interval, covers 7.18% of the total area (Figure 7) and is linearly distributed along the main rivers (Aranca, Timiș, Bega, Caraș, Nera, Cerna, Danube) and their tributaries. Class 4 (100–150 m) represents 3.44% of the territory, forming a buffer zone immediately adjacent to the main river channels. Class 3 (150–500 m) covers 21.79% of the area, while the 500–700 m interval (class 2) accounts for 11.06%. The most extensive category is class 1 (>700 m), which occupies 56.53% of the area and characterizes sectors located at considerable distances from the hydrographic network.
Figure 7.
Spatial distribution of the distance from rivers factor reclassified into flood susceptibility classes used in the MCDA–AHP model.
From a spatial perspective, the higher susceptibility classes display a continuous linear distribution, following the course of the main and secondary hydrographic network, while the lower classes occupy compact areas on interfluves, particularly in the southwestern sector of the analyzed area.
The distribution of hydrographic factors highlights clear spatial differences related to the structure of the drainage network. Higher drainage density values are concentrated in the mountainous sector, whereas the western plains are characterized by lower values. At the same time, the distance to rivers generates a linear pattern of susceptibility, with higher classes distributed along the main and secondary river channels.
3.1.3. Static Pedological and Anthropogenic Factors: Soil Types and Distance from Road
The AHP scores for the pedological factor were assigned according to the soil type and the dominant texture.
Reclassification of the Soil Type factor (Figure 8) highlighted the predominance of class 4 (29.81%), followed by class 5 (24.82%) and class 2 (24.50%), while class 3 accounts for 20.87% of the total area. The absence of class 1 indicates that, within the analyzed area, no soil type–texture combinations associated with a very low contribution to flood susceptibility were identified.
Figure 8.
Spatial distribution of the soil type factor reclassified into flood susceptibility classes used in the MCDA–AHP model.
From a spatial perspective, the higher classes (4 and 5) are mainly associated with soils with clay–loam and clay textures (Gleysols, Stagnosols, Vertosols, and fine-textured Fluvisols), distributed in floodplains and intramontane depressions, as well as in the western plain sector. The lower classes (2 and 3) correspond predominantly to sandy or sandy-loam soils (Chernozems, Luvisols) found in plains and low hills, as well as Districambosols, developed mainly in mountainous units.
The distance to road infrastructure factor indicates a limited spatial extent of the higher susceptibility classes (Figure 9).
Figure 9.
Spatial distribution of the distance from roads factor reclassified into flood susceptibility classes used in the MCDA–AHP model.
Class 5 (0–50 m), corresponding to very high susceptibility, covers 0.91% of the total area and is distributed locally and linearly along the main road corridors. Class 4 (51–100 m) accounts for 0.77%, while classes 3 and 2 (101–200 m and 201–300 m) together represent approximately 4% of the territory.
The most extensive category is class 1 (>300 m), which covers 94% of the analyzed area, indicating that most of the territory is located at considerable distances from road infrastructure.
The spatial distribution (Figure 9) highlights a discontinuous linear pattern, concentrated around the main transport network, particularly in the western plain sector and in the major depressional corridors, while in mountainous areas the density of road infrastructure is lower.
The pedological factor shows a relatively balanced distribution between moderate and high susceptibility classes. Higher classes are mainly associated with fine-textured soils distributed in floodplains, intramontane depressions, and the plain sector. In contrast, the distance to roads factor displays a limited spatial extent of higher susceptibility classes, with most of the territory classified as very low susceptibility.
3.2. Spatial Distribution of Dynamic Factors
3.2.1. Land Use and Land Cover (LULC) in 2005 and 2023
The LULC factor highlights a clear contrast between the mountain–hilly sector and the plain sector (Figure 10).
Figure 10.
Spatial distribution of the contribution of LULC to flood susceptibility in 2006 and 2018.
Classes with a low contribution to susceptibility dominate forested areas within mountainous and hilly units, where forest cover favors water interception and infiltration. In contrast, classes with a high contribution are concentrated in the plain areas and along the main axes of urban and agricultural development, where intensified land use and higher levels of surface sealing increase surface runoff.
A comparison between 2006 and 2018 at the regional scale shows that the overall distribution of classes does not indicate major changes (Figure 10), suggesting a relative stability of the dominant land use structure. However, detailed analysis reveals significant local transformations, particularly in the vicinity of urban centers and within intensively cultivated agricultural areas, where the expansion of built-up surfaces or the reorganization of agricultural land use may locally influence the hydrological response of the basins. Therefore, although these changes do not alter the general configuration of classes at the regional scale, they may have important implications at the local scale, contributing to modifications in the conditions of runoff generation and propagation within certain sub-basins.
3.2.2. Distribution of Precipitation in April 2005 and April 2023
The spatial distribution of precipitation highlights significant differences between 2005 and 2023, both in terms of absolute values and in the relative share of flood susceptibility classes (Figure 11).
Figure 11.
Spatial distribution of the contribution of precipitation to flood susceptibility.
In 2005, precipitation amounts recorded considerably higher values, ranging approximately between 104 and 253 mm. The higher classes (corresponding to elevated values, above ~200 mm) are well represented in the southeastern mountainous sector, where the orographic effect leads to significant rainfall accumulation. The moderate class (≈55% of the area) is dominant, followed by the high susceptibility class (≈39%), indicating a pluviometric context favorable for the generation of surface runoff and flood events.
In 2023, total values are significantly lower, ranging approximately between 18 and 146 mm. The moderate susceptibility class occupies limited areas (less than 10%), while the distribution is dominated by low and very low susceptibility classes (approximately 52% and 39%, respectively). The mountainous sector remains the area with the highest relative values; however, their magnitude is substantially lower than in 2005.
Comparatively, 2005 is characterized by a much more intense pluviometric regime, with a substantial expansion of higher classes in the mountainous and hilly areas, whereas 2023 presents a more moderate regime dominated by low and very low values. The difference between the two periods is evident both in the overall range of variation (almost double in 2005) and in the proportion of classes with a high contribution to susceptibility.
Thus, from the perspective of the precipitation factor, the year 2005 indicates a significantly higher potential for the generation of flood processes compared with 2023.
3.3. Flood Susceptibility Modeling (FSI)
Flood susceptibility modeling allowed the estimation of the FSI for the two analyzed temporal scenarios, corresponding to April 2005 and April 2023.
3.3.1. Spatial Distribution of Flood Susceptibility for the 2005 and 2023 Scenarios
The spatial distribution of the flood susceptibility index for the analyzed scenarios is presented in Figure 12.
Figure 12.
Spatial distribution of flood susceptibility (FSI) in the Banat Hydrographic Area for the scenarios: April 2005 and April 2023.
For the April 2005 scenario (Figure 12), the moderate susceptibility class is dominant, covering approximately 56% of the total area of the Banat Hydrographic Area. This is followed by the low susceptibility class, which accounts for 26% of the territory. Areas characterized by high susceptibility represent 16% of the surface, while the extreme classes (very high and very low) have relatively small shares of approximately 1% each.
From a spatial perspective, high and very high susceptibility is mainly concentrated along the main watercourses and in the low sectors of the hydrographic basins, particularly in the central and western parts of the analyzed area. In contrast, the low and very low susceptibility classes are more frequent in the eastern and southeastern sectors, corresponding to mountainous and hilly units, where morphometric and hydrological conditions favor a lower predisposition to flooding.
For the April 2023 scenario (Figure 12), the general distribution of susceptibility remains similar, with the moderate class continuing to dominate, covering approximately 56% of the area. However, an increase in the area corresponding to the low susceptibility class is observed, reaching 37%, accompanied by a significant decrease in the high susceptibility class, which declines to approximately 6% of the territory. The very low susceptibility class retains a small share of about 1%, while the very high class is no longer represented in the analyzed scenario.
From a spatial perspective, areas characterized by high and moderate susceptibility remain mainly associated with floodplain sectors and areas close to the hydrographic network, while the low susceptibility class is distributed across extensive surfaces within the hilly and mountainous zones of the hydrographic area.
3.3.2. Assessment of the Spatial Accuracy of the Model (April 2005)
The distribution of flooded areas associated with the April 2005 hydrological event in relation to the FSI classes is presented in Figure 13. The results indicate a high level of agreement between the spatial distribution of the observed floods and the areas identified by the model as susceptible to flooding. The largest share of the flooded area is concentrated in the high susceptibility class, which includes 70.17% of the total flooded area, while 27.76% falls within the moderate susceptibility class. The very high susceptibility class accounts for 2.07%, whereas the lower classes are practically absent within the flooded areas. Overall, approximately 99% of the flooded surface is located within the moderate, high, and very high susceptibility classes, indicating a good capacity of the model to delineate areas predisposed to flooding.
Figure 13.
Spatial validation of the flood susceptibility model using the April 2005 flood inventory: (A) distribution of flooded area across susceptibility classes; (B) cumulative flooded area captured by susceptibility classes.
The statistical significance of this distribution was evaluated using a multinomial χ2 test, which indicates a significant difference from a random distribution of the flooded area among susceptibility classes (χ2 = 9475, df = 3, p < 0.001). This result confirms that flood-affected areas are systematically concentrated within the higher susceptibility classes defined by the model.
The cumulative curve (Figure 13B) indicates that almost the entire flooded area is captured by the moderate and high susceptibility classes, confirming the model’s ability to reproduce the spatial pattern of the analyzed hydrological event.
3.4. Multitemporal Comparative Analysis (2005–2023)
The multitemporal comparative analysis was carried out by evaluating the difference between the susceptibility indices calculated for the scenarios corresponding to April 2005 and April 2023, as well as by analyzing the transitions between susceptibility classes. The spatial distribution of the variation in the susceptibility index is illustrated in Figure 14, while the areas corresponding to the different types of transitions are summarized in Table 3.
Figure 14.
Spatial distribution of the variation in the flood susceptibility index (ΔFSI) between 2005 and 2023 in the Banat Hydrographic Area.
Table 3.
Transitions of flood susceptibility (FSI) classes between the 2005 and 2023 scenarios.
The results indicate a high stability in the spatial distribution of flood susceptibility within the Banat Hydrographic Area. Approximately 75% of the total area maintains the same susceptibility class between the two analyzed time periods. The most extensive stable transitions are associated with the moderate–moderate class, covering 44.43% of the territory, followed by the low–low class (24.30%) and the high–high class (5.91%). The very low–very low class occupies a negligible share of the total area.
Areas characterized by transitions toward lower susceptibility classes account for approximately 25% of the total area. The most frequent transitions are from moderate to low (12.96%) and from high to moderate (10.90%), followed by the low to very low transition (1.39%). The transition from the very high class to the high class is spatially limited, representing only 0.11% of the territory. In contrast, increases in susceptibility are extremely limited, being identified on less than 0.01% of the total area. Transitions corresponding to this category include changes from low to moderate and from moderate to high, but these occur only over very small areas and appear as isolated cases within the study region.
From a spatial perspective, areas exhibiting transitions toward lower susceptibility classes are predominantly distributed in the central and southern sectors of the hydrographic area, while stable areas dominate across most geomorphological units. Local increases in susceptibility are rare and scattered, without forming compact spatial clusters.
3.5. Geospatial Analysis of the Contribution of Dynamic Factors to Flood Susceptibility Variation
To evaluate the contribution of dynamic factors to changes in flood susceptibility between 2005 and 2023, the GIS-based spatial analysis indicates the dominant role of precipitation variability at the regional scale.
The results show that changes in precipitation control approximately 95.44% of the analyzed area, while changes in land use and land cover (LULC) influence only 4.56% of the area (Table 4).
Table 4.
Weighted contribution and spatial dominance of dynamic factors controlling the multitemporal variation in flood susceptibility.
The absolute contribution values confirm this pattern, indicating a significantly higher influence of precipitation on FSI variation (mean value of 0.304), compared to the much lower contribution of LULC changes (0.005).
These results highlight that climatic variability represents the primary factor controlling the differences observed in flood susceptibility between the two analyzed scenarios. In contrast, LULC changes have a limited spatial extent and contribute mainly to localized adjustments in susceptibility.
Accordingly, the differences identified between the two scenarios reflect the model response to variations in precipitation conditions.
4. Discussion
4.1. Role of Conditioning Factors in Controlling Flood Susceptibility
The distribution of flood susceptibility in the Banat Hydrographic Area primarily reflects the control exerted by physico-geographical factors on water accumulation and propagation processes, in interaction with dynamic climatic and land use factors. The results indicate that lowland plain areas concentrate most of the high susceptibility classes, with elevations below 222 m accounting for 54.23% of the total study area, while mountainous zones with elevations above 1236 m occupy only 2.81% of the territory. This distribution highlights the determinant role of elevation in controlling the predisposition to water accumulation [68,69], a pattern frequently observed in flood susceptibility mapping studies based on GIS and multicriteria analyses [18,32].
A similar control is exerted by slope, where low values favor water stagnation and lateral expansion [70,71]. In the analyzed area, slope classes below 3.8° occupy 50.45% of the total surface and are concentrated mainly in the Banat Plain and depressional sectors. These morphometric conditions explain the high predisposition to water accumulation in the western sector of the hydrographic basin, whereas the eastern mountainous sector, characterized by steeper slopes, shows a lower susceptibility. The role of topographic parameters in controlling flood processes is widely documented, being considered among the most important factors in flood susceptibility assessment [45].
The TWI highlights the spatial distribution of water accumulation potential controlled by microrelief and drainage organization [18]. In the analyzed basin, the classes with high and very high susceptibility account for 41.21% of the total area and are distributed predominantly along the hydrographic network, in plain areas and depressional zones. The use of TWI for identifying potentially saturated areas is common in hydrological studies because the index reflects the relationship between upslope contributing area and local slope, which controls water accumulation in the terrain [45,77,78].
Hydrographic factors further confirm the role of the drainage network in controlling flood susceptibility. Areas located within 100 m of watercourses represent 7.18% of the total area, but concentrate the sectors with the highest predisposition to overflow. At the same time, areas located more than 700 m from the hydrographic network cover 56.53% of the territory and are characterized by very low susceptibility. This spatial pattern reflects the direct influence of proximity to watercourses on flood probability, a relationship also highlighted in other studies on hydrological hazard assessment [72,73].
Regarding dynamic factors, land use highlights a clear contrast between forested mountainous areas and the plain sector dominated by agricultural uses [93]. Forested surfaces, predominant in mountainous units, contribute to the reduction in surface runoff through precipitation interception and increased infiltration, whereas agricultural and anthropized areas favor increased runoff and higher flood susceptibility [6,15]. The role of land-use changes in amplifying or reducing hydrological hazards is well documented and is considered an important factor in the dynamics of flood processes [60,75].
An essential role is also played by the precipitation regime, which represents the main triggering factor of flood processes [15,18,75]. In 2005, precipitation amounts recorded in April ranged between 104 and 253 mm, whereas in 2023 the values were significantly lower, ranging between 18 and 146 mm. The substantial difference between the two scenarios highlights the role of climatic conditions in controlling the potential for flood generation, an aspect emphasized in recent literature on hydrological hazards [4].
The results indicate that flood susceptibility in the study area is primarily determined by the morphological framework of the basin, which controls the spatial distribution of areas favorable to water accumulation, while dynamic factors, such as precipitation and land use, influence the intensity and temporal variability in these processes.
4.2. Spatial Distribution of Flood Susceptibility and Validation of the MCDA–AHP Model
The results of the FSI modeling highlight a spatial distribution dominated by the moderate class, which covers approximately 56% of the Banat Hydrographic Area in both analyzed scenarios. For 2005, the low susceptibility class covers about 26% of the territory, while the high class accounts for approximately 16%, whereas the extreme classes (very high and very low) have small shares of about 1% each. Areas with high susceptibility are mainly concentrated along the major watercourses and in the low sectors of the hydrographic basins, while low susceptibility characterizes primarily the mountainous and hilly sector in the eastern and southeastern parts of the region.
The comparison of the two temporal scenarios highlights a reduction in susceptibility in 2023, reflected by an increase in the low susceptibility class to approximately 37% and a decrease in the high class to about 6%, while the very high class is no longer represented. This redistribution suggests a general decrease in flood potential, mainly associated with differences between the pluviometric regimes of the two analyzed periods.
Model validation was carried out by comparing the susceptibility map generated for 2005 with the inventory of flooded areas corresponding to the April 2005 flood event [28]. The results show a high level of agreement between the observed flooded areas and the susceptibility classes estimated by the model: 70.17% of the flooded area falls within the high susceptibility class, 27.76% within the moderate class, and 2.07% within the very high class. Overall, about 99% of the flooded area is captured by the moderate and high susceptibility classes, indicating a good capacity of the model to delineate areas predisposed to flooding.
The statistical significance of this distribution was confirmed by the multinomial χ2 test (χ2 = 9475, df = 3, p < 0.001), which highlights a significant difference from a random distribution of flooded area among susceptibility classes. Similar performances of MCDA–AHP-based models have been reported in other flood susceptibility mapping studies, where the integration of topographic, hydrological, and anthropogenic factors within a GIS framework enables the effective identification of vulnerable areas [53,84,88]. These results confirm that GIS-based multicriteria approaches represent robust tools for flood susceptibility assessment at the regional scale, particularly in contexts where detailed hydrological data or complex hydrodynamic models are not available [54,87].
The multitemporal analysis indicates a high stability in the spatial distribution of flood susceptibility in the Banat Hydrographic Area. Approximately 75% of the total area maintains the same susceptibility class between 2005 and 2023, with the most frequent stable transitions being moderate–moderate (44.43%) and low–low (24.30%). This pattern suggests that the general structure of susceptibility is primarily controlled by the relatively stable physical characteristics of the hydrographic basin. At the same time, approximately 25.35% of the territory exhibits transitions toward lower susceptibility classes, while increases are extremely limited (<0.01%). This pattern indicates differences between the two scenarios, primarily driven by variations in dynamic factors, without suggesting structural changes in intrinsic susceptibility.
4.3. Contribution of Dynamic Factors to Changes in Flood Susceptibility
The contribution of dynamic factors to changes in flood susceptibility highlights the dominant role of precipitation in controlling variations at the regional scale. The spatial analysis shows that changes in precipitation control approximately 95.44% of the analyzed area, while changes in land use and land cover (LULC) influence only 4.56% of the territory.
The absolute contribution values confirm this pattern, indicating a significantly higher influence of precipitation on FSI variation (0.304), compared to the much lower contribution of LULC changes (0.005). These results indicate that climatic variability represents the primary factor controlling the differences observed between the two analyzed scenarios.
At the same time, land use changes contribute to localized redistributions of susceptibility, mainly influencing areas where transitions between classes occur. Thus, the role of dynamic factors is scale-dependent: precipitation controls the overall trend at the regional level, while LULC influences local spatial variations.
In this context, the differences observed between the analyzed scenarios should be interpreted primarily as a response of the model to variations in precipitation conditions, rather than as structural changes in the intrinsic susceptibility of the territory.
In this context, the value of the multitemporal analysis lies not in directly comparing hazard intensity between different years, but in highlighting the model’s sensitivity to variations in dynamic factors within a controlled methodological framework.
The obtained results are consistent with previous studies on flood susceptibility mapping, which highlight the dominant role of precipitation in controlling hazard at the regional scale and the more limited, yet relevant, influence of land use at the local level [18,60,75,87].
4.4. Impact of Flood Susceptibility on Agricultural Land and Implications for Spatial Management
This section aims to highlight the potential implications of the spatial distribution of flood susceptibility on dominant land uses, particularly agricultural systems, without intending to provide a detailed quantitative assessment of impacts on agricultural production.
The spatial distribution of flood susceptibility indicates a higher exposure of lowland sectors and floodplains in the central and western parts of the Banat Hydrographic Area, where the main agricultural land uses are also concentrated. In the April 2005 scenario, the high and very high susceptibility classes together account for approximately 17% of the study area, while in 2023 the high class still occupies about 6%, and the very high class is no longer represented. Although a reduction in susceptibility can be observed at the regional scale, the persistence of a dominant moderate class (~56% in both analyzed years) indicates that a large portion of the agricultural territory remains exposed to processes such as excess soil moisture, waterlogging, and temporary flooding, especially in proximity to the hydrographic network and in plain areas with low slopes.
This configuration is particularly relevant for agricultural landscapes, as the literature shows that the impact of floods is not limited to temporary water coverage but also includes changes in soil structure [94], reduced porosity [95], soil compaction, limited infiltration, and altered nutrient cycles [96], with direct effects on crop productivity. Flooding and the alternation between saturation and drainage can destabilize soil aggregates, promote erosion and sediment transport, and modify the availability of nitrogen and phosphorus, thereby affecting soil fertility and the functioning of agroecosystems. At the same time, in flooded soils, reduced oxygen levels and the onset of anaerobic conditions degrade the root environment and limit plant development [97]. These effects frequently translate into yield losses depending on the duration of inundation and the crop growth stage [98].
Studies show that, in the case of cotton, yield reduction may reach 38.8% during the flowering stage [99]; for wheat, yield may decrease by approximately 2% per day of excess water during stem elongation, with average losses reaching 44% for prolonged waterlogging [100]. For maize, the most severe effects have been observed during early growth stages [101], while in sesame losses of 51.67–58.24% have been reported after only 36 h of continuous flooding [102]. These findings suggest that, in a strongly agricultural region such as Banat, even areas classified only within moderate susceptibility classes may generate significant economic impacts when episodes of excess water coincide with critical crop growth stages.
From the perspective of spatial management, the results support the need to prioritize interventions in low-lying agricultural sectors, particularly in floodplains, poorly drained plains, and areas located near watercourses. The literature indicates that the most effective measures in such contexts include improving surface and subsurface drainage, controlled water management, maintaining or expanding retention areas, implementing soil conservation practices, and adapting crop structures according to flood exposure [98,103,104,105,106].
Schilling et al. (2014) [107] also show that changes in agricultural land use can contribute to reducing flood risk. In the Banat Hydrographic Area, these directions are particularly relevant for integrating susceptibility maps into land-use planning, identifying agricultural areas that should be prioritized for adaptation measures, and directing investments toward sectors where the potential impact on agricultural production is highest.
4.5. Limitations of the Study and Perspectives for Future Research
Although the multicriteria model applied in this study provides coherent results regarding the spatial distribution of flood susceptibility, several limitations should be acknowledged.
First, the methodology is based on a susceptibility-oriented approach, which expresses the relative predisposition to flooding without simulating hydrodynamic processes or the physical parameters of flood events, such as water depth, flow velocity, or return period. Therefore, the results should be interpreted as comparative indicators of spatial predisposition to flooding, rather than deterministic estimates of hydrological hazard.
Another limitation concerns the characteristics and resolution of the datasets used. The DEM employed in the analysis has a spatial resolution of 25 m, which may lead to a less detailed representation of microrelief, particularly in floodplain areas or sectors with subtle topographic variations, where water accumulation processes may be controlled by very small elevation differences. Similarly, precipitation interpolation was based on a limited number of meteorological stations, which may introduce uncertainties in estimating the spatial distribution of this factor, especially in mountainous areas where orographic effects can generate significant local variability.
In addition, the factor weights were determined using the AHP, which involves a certain degree of expert judgment and subjective interpretation when establishing pairwise comparisons between criteria. Although the consistency verification of the comparison matrix indicated acceptable values of the consistency index, the method remains dependent on expert judgment and on the selection of factors included in the analysis. The literature frequently highlights that the results of multicriteria models may vary depending on the weighting scheme adopted or the set of factors used [32,87].
Regarding the multitemporal analysis, it was conducted only for two distinct moments (2005 and 2023), which limits the ability to capture interannual variability or long-term trends in flood susceptibility. Furthermore, model validation was possible only for the 2005 scenario, as no comparable inventory of flood extent was available for 2023. Therefore, the results of the multitemporal analysis should be interpreted as an expression of the model’s response to two distinct combinations of dynamic factors, rather than as evidence of a structural evolution of territorial susceptibility.
For future research, the integration of hydrological or hydrodynamic models could allow a more detailed assessment of flood hazards by estimating the physical parameters of floods and simulating flood scenarios. Moreover, the use of machine learning or deep learning models, increasingly applied in flood susceptibility mapping, could contribute to improving predictive performance and reducing the influence of subjectivity in determining factor weights [13,51].
Another important direction for development is the extension of multitemporal analyses through the integration of longer climatic and land-use datasets, as well as the use of higher-resolution satellite imagery for monitoring spatial changes in flooded areas. In this way, susceptibility models could evolve from simple tools for the static evaluation of flood predisposition toward integrated analytical frameworks capable of capturing the spatial and temporal dynamics of hydrological hazards in the context of climate change and anthropogenic landscape transformations.
5. Conclusions
Flood susceptibility modeling using the integrated MCDA–AHP framework in a GIS environment highlights clear differences between the 2005 and 2023 scenarios, primarily driven by variations in precipitation conditions. Although the moderate class remains dominant (~56% of the Banat Hydrographic Area), the share of the high and very high classes is lower in 2023 (~6%) compared to 2005 (~17%), accompanied by an increase in the low class from about 26% to 37%.
The robustness of these results is supported by the validation of the model through comparison with the flooded areas recorded during the April 2005 flood event, which indicates a high level of agreement between simulated and observed flood-prone zones. Specifically, 70.17% of the flooded area falls within the high susceptibility class, 27.76% within the moderate class, and 2.07% within the very high class, meaning that approximately 99% of the flooded area is captured by the moderate, high, and very high susceptibility classes. The multinomial statistical test confirms the significance of this distribution (χ2 = 9475, df = 3, p < 0.001), demonstrating the model’s strong ability to identify flood-prone areas.
The multitemporal analysis indicates a high stability of the susceptibility structure, with approximately 75% of the total area maintaining the same class between 2005 and 2023. The most frequent stable transitions are moderate–moderate (44.43%) and low–low (24.30%), while 25.35% of the territory shows transitions toward lower susceptibility classes.
The analysis of dynamic factors highlights a scale-dependent behavior: precipitation exerts a dominant control at the regional level, influencing approximately 95.44% of the analyzed area, while land use changes contribute primarily to localized redistributions of susceptibility.
The observed differences between scenarios are primarily driven by variations in precipitation conditions.
Overall, the integration of geomorphological, hydrological, climatic, and anthropogenic factors within a multicriteria GIS framework, combined with a multitemporal evaluation of susceptibility, provides a reproducible methodological framework for flood susceptibility assessment and supports spatial planning and flood risk management in regions with similar characteristics.
Author Contributions
Conceptualization, L.C., L.L.C., C.B.-M. and M.V.H.; methodology, L.C., C.B.-M. and M.V.H.; software, L.C., C.A.P., C.B.-M., A.H. and M.V.H.; validation, L.L.C., C.A.P., A.H., T.P. and C.B.-M.; formal analysis, C.A.P., A.H. and T.P.; investigation, L.L.C., C.B.-M. and A.H.; resources, L.C., L.L.C., C.A.P., C.B.-M., A.H. and M.V.H.; data curation, L.C., L.L.C. and C.B.-M.; writing-original draft preparation, L.C., L.L.C. and C.B.-M.; writing-review and editing, L.C., L.L.C. and C.B.-M.; visualization, L.C., L.L.C., C.A.P., C.B.-M., A.H., T.P. and M.V.H.; supervision, L.L.C., C.A.P. and A.H.; project administration, L.L.C., C.B.-M. and M.V.H.; funding acquisition, C.A.P. and A.H. All authors have read and agreed to the published version of the manuscript.
Funding
The publication of the present paper was supported by the University of Life Sciences “King Mihai I” from Timisoara, Romania.
Data Availability Statement
The data presented in this study are available on request from the corresponding author. Additional data are contained within the article.
Acknowledgments
The authors thank the GEOMATICS Research Laboratory, University of Life Sciences “King Mihai I” from Timişoara, for the facility of software used for this study.
Conflicts of Interest
The authors declare no conflicts of interest.
References
- Rahmati, O.; Haghizadeh, A.; Stefanidis, S. Assessing the Accuracy of GIS-Based Analytical Hierarchy Process for Watershed Prioritization: Gorganrood River Basin, Iran. Water Resour. Manag. 2016, 30, 1131–1150. [Google Scholar] [CrossRef] [Scilit]
- He, B.; Huang, X.; Ma, M.; Chang, Q.; Tu, Y.; Li, Q.; Zhang, K.; Hong, Y. Analysis of Flash Flood Disaster Characteristics in China from 2011 to 2015. Nat. Hazards 2017, 90, 407–420. [Google Scholar] [CrossRef] [Scilit]
- Kundzewicz, Z.W.; Su, B.; Wang, Y.; Wang, G.; Wang, G.; Huang, J.; Jiang, T. Flood Risk in a Range of Spatial Perspectives—From Global to Local Scales. Nat. Hazards Earth Syst. Sci. 2019, 19, 1319–1328. [Google Scholar] [CrossRef] [Scilit]
- Merz, B.; Blöschl, G.; Vorogushyn, S.; Dottori, F.; Aerts, J.C.J.H.; Bates, P.; Bertola, M.; Kemter, M.; Kreibich, H.; Lall, U.; et al. Causes, Impacts and Patterns of Disastrous River Floods. Nat. Rev. Earth Environ. 2021, 2, 592–609. [Google Scholar] [CrossRef] [Scilit]
- Quesada-Román, A.; Ballesteros-Cánovas, J.A.; Granados-Bolaños, S.; Birkel, C.; Stoffel, M. Improving Regional Flood Risk Assessment Using Flood Frequency and Dendrogeomorphic Analyses in Mountain Catchments Impacted by Tropical Cyclones. Geomorphology 2022, 396, 108000. [Google Scholar] [CrossRef] [Scilit]
- Das, J.; Bhattacharya, S.K. Monitoring and Managing Multi-Hazards: A Multidisciplinary Approach; Springer: Cham, Switzerland, 2023. [Google Scholar] [CrossRef] [Scilit]
- Meyer, V.; Becker, N.; Markantonis, V.; Schwarze, R.; van den Bergh, J.; Bouwer, L.; Bubeck, P.; Ciavola, P.; Genovese, E.; Green, C.; et al. Assessing the Costs of Natural Hazards—State of the Art and Knowledge Gaps. Nat. Hazards Earth Syst. Sci. 2013, 13, 1351–1373. [Google Scholar] [CrossRef] [Scilit]
- Foudi, S.; Osés-Eraso, N.; Tamayo, I. Integrated Spatial Flood Risk Assessment: The Case of Zaragoza. Land Use Policy 2015, 42, 278–292. [Google Scholar] [CrossRef] [Scilit]
- Purohit, J.; Rout, H.S. Impact of Climate Change on Human Health Concerning Climate-Induced Natural Disaster: Evidence from an Eastern Indian State. Clim. Change 2023, 176, 109. [Google Scholar] [CrossRef] [Scilit]
- Aslam, R.W.; Naz, I.; Quddoos, A.; Quddusi, M.R. Assessing climatic impacts on land use and land cover dynamics in Peshawar, Khyber Pakhtunkhwa, Pakistan: A remote sensing and GIS approach. Geo-J. 2024, 89, 202. [Google Scholar] [CrossRef] [Scilit]
- Diaz, J.H. Global Climate Changes, Natural Disasters, and Travel Health Risks. J. Travel Med. 2006, 13, 361–372. [Google Scholar] [CrossRef] [Scilit]
- Ushiyama, T.; Kwak, Y.; Ledvinka, O.; Iwami, Y.; Danhelka, J. Interdisciplinary Approach for Assessment of Continental River Flood Risk: A Case Study of the Czech Republic. In Proceedings of the EGU General Assembly Conference Abstracts; European Geosciences Union (EGU): Vienna, Austria, 2017; Volume 19, p. 5737. [Google Scholar]
- Ahmadlou, M.; Al-Fugara, A.; Al-Shabeeb, A.R.; Arora, A.; Al-Adamat, R.; Pham, Q.B.; Al-Ansari, N.; Linh, N.T.T.; Sajedi, H. Flood Susceptibility Mapping and Assessment Using a Novel Deep Learning Model Combining Multilayer Perceptron and Autoencoder Neural Networks. J. Flood Risk Manag. 2020, 14, e12683. [Google Scholar] [CrossRef] [Scilit]
- Tamaș-Avram, M.; Luca, M.; Marcoie, N. Fast floods on the Trotuș River in the context of current climate change. Present Environ. Sustain. Dev. 2022, 17, 44–45. [Google Scholar] [CrossRef] [Scilit]
- Osman, S.A.; Das, J. GIS-based flood risk assessment using multi-criteria decision analysis of Shebelle River Basin in southern Somalia. SN Appl. Sci. 2023, 5, 134. [Google Scholar] [CrossRef] [Scilit]
- Hammami, S.; Zouhri, L.; Souissi, D.; Souei, A.; Zghibi, A.; Marzougui, A.; Dlala, M. Application of the GIS-Based Multi-Criteria Decision Analysis and Analytical Hierarchy Process (AHP) in the Flood Susceptibility Mapping (Tunisia). Arab. J. Geosci. 2019, 12, 653. [Google Scholar] [CrossRef] [Scilit]
- Raj, R.; Yunus, A.P.; Pani, P.; Avtar, R. Towards Evaluating Gully Erosion Volume and Erosion Rates in the Chambal Badlands, Central India. Land Degrad. Dev. 2022, 33, 1495–1510. [Google Scholar] [CrossRef] [Scilit]
- Kumar, R.; Kumar, M.; Tiwari, A.; Majid, S.I.; Bhadwal, S.; Sahu, N.; Avtar, R. Assessment and Mapping of Riverine Flood Susceptibility (RFS) in India through Coupled Multicriteria Decision Making Models and Geospatial Techniques. Water 2023, 15, 3918. [Google Scholar] [CrossRef] [Scilit]
- Roo, A.D.; Barredo, J.; Lavalle, C.; Bodis, K.; Bonk, R. Potential Flood Hazard and Risk Mapping at Pan-European Scale. In Digital Terrain Modelling: Development and Applications in a Policy Support Environment; Peckham, R.J., Jordan, G., Eds.; Springer: Berlin/Heidelberg, Germany, 2007; pp. 183–202. [Google Scholar]
- Diakakis, M. A Method for Flood Hazard Mapping Based on Basin Morphometry: Application in Two Catchments in Greece. Nat. Hazards 2011, 56, 803–814. [Google Scholar] [CrossRef] [Scilit]
- Kundzewicz, Z.W.; Pińskwar, I.; Brakenridge, G.R. Large Floods in Europe, 1985–2009. Hydrol. Sci. J. 2014, 58, 1–7. [Google Scholar] [CrossRef] [Scilit]
- Romanescu, G.; Cimpianu, C.I.; Mihu-Pintilie, A.; Stoleriu, C.C. Historic Flood Events in NE Romania (Post-1990). J. Maps 2017, 13, 787–798. [Google Scholar] [CrossRef] [Scilit]
- Iosub, M.; Minea, I.; Chelariu, O.E.; Ursu, A. Assessment of Flash Flood Susceptibility Potential in Moldavian Plain (Romania). J. Flood Risk Manag. 2020, 13, e12588. [Google Scholar] [CrossRef] [Scilit]
- Zaharia, L.; Costache, R.; Prăvălie, R.; Minea, G. Assessment and Mapping of Flood Potential in the Slănic Catchment in Romania. J. Earth Syst. Sci. 2015, 124, 1311–1324. [Google Scholar] [CrossRef] [Scilit]
- Alexandrov, V.B.; Dubuisson-Moisselin, J.-M.; Koleva, E. A case study on utilization of precipitation indices in Bulgaria. In Proceedings of the International Conference on Water Observation and Information System for Decision Support (BALWOIS), Ohrid, North Macedonia, 23–26 May 2006. [Google Scholar]
- Prabandaru, A.A.; Marko, K.; Tambunan, M.P. Estimation of flash flood loss level in Banjaririgasi Village, Lebakgedong Sub-district, Lebak Regency, Banten. IOP Conf. Ser. Earth Environ. Sci. 2021, 846, 012027. [Google Scholar] [CrossRef] [Scilit]
- Devitt, L.; Neal, J.; Coxon, G.; Savage, J.; Wagener, T. Flood hazard potential reveals global floodplain settlement patterns. Nat. Commun. 2023, 14, 2801. [Google Scholar] [CrossRef] [Scilit] [PubMed]
- Administrația Națională “Apele Române”; Administrația Bazinală de Apă Banat. Preliminary Flood Risk Assessment—Banat River Basin District (PFRA Report). Available online: https://inundatii.ro/wp-content/uploads/2022/07/RO1_ABA-Banat-PFRA-Report_C1-1.pdf (accessed on 15 November 2025).
- Nie, W.; Tian, C.; Song, D.; Liu, X.; Wang, E. Disaster process and multisource information monitoring and warning method for rainfall-triggered landslide: A case study in the southeastern coastal area of China. Nat. Hazards 2025, 121, 2535–2564. [Google Scholar] [CrossRef] [Scilit]
- Moazzam, M.F.U.; Vansarochana, A.; Rahman, A.U. Analysis of flood susceptibility and zonation for risk management using frequency ratio model in District Charsadda, Pakistan. Int. J. Environ. Geoinform. 2018, 5, 140–153. [Google Scholar] [CrossRef] [Scilit]
- Ozulu, G.; Essien, G.P.; Akudo, E.O. Geological and geospatial mapping of vulnerability areas for proper flood mitigation: Ganaja, Lokoja Metropolis, North-Central Nigeria. Int. J. Environ. Geoinform. 2021, 8, 267–275. [Google Scholar] [CrossRef] [Scilit]
- Swain, K.C.; Singha, C.; Nayak, L. Flood susceptibility mapping through the GIS-AHP technique using the cloud. ISPRS Int. J. Geo Inf. 2020, 9, 720. [Google Scholar] [CrossRef] [Scilit]
- Cai, S.; Fan, J.; Yang, W. Flooding Risk Assessment and Analysis Based on GIS and the TFN-AHP Method: A Case Study of Chongqing, China. Atmosphere 2021, 12, 623. [Google Scholar] [CrossRef] [Scilit]
- Antzoulatos, G.; Kouloglou, I.-O.; Bakratsas, M.; Moumtzidou, A.; Gialampoukidis, I.; Karakostas, A.; Lombardo, F.; Fiorin, R.; Norbiato, D.; Ferri, M.; et al. Flood Hazard and Risk Mapping by Applying an Explainable Machine Learning Framework Using Satellite Imagery and GIS Data. Sustainability 2022, 14, 3251. [Google Scholar] [CrossRef] [Scilit]
- Hagos, Y.G.; Andualem, T.G.; Yibeltal, M.; Mengie, M.A. Flood Hazard Assessment and Mapping Using GIS Integrated with Multi-Criteria Decision Analysis in Upper Awash River Basin, Ethiopia. Appl. Water Sci. 2022, 12, 148. [Google Scholar] [CrossRef] [Scilit]
- Pinos, J.; Quesada-Román, A. Flood Risk-Related Research Trends in Latin America and the Caribbean. Water 2022, 14, 10. [Google Scholar] [CrossRef] [Scilit]
- Covaci, O.; Gazda, M.R.; Niga, B.I.; Enea, A.; Iosub, M.; Tirnovan, A. Automation of the Rational Formula Using GIS Infrastructure—Case Study Siret River Basin, Romania. Present Environ. Sustain. Dev. 2023, 17, 31–44. [Google Scholar] [CrossRef] [Scilit]
- Copăcean, L.; Man, E.T.; Herban, S.; Popescu, C.A.; Cojocariu, L. Estimating Flood Susceptibility Based on GIS and Remote Sensing. Case Study: Hydrographic Basin of Crișul Alb River. Present Environ. Sustain. Dev. 2024, 18, 121–140. [Google Scholar] [CrossRef] [Scilit]
- De Moel, H.; Aerts, J.C.J.H.; Koomen, E. Development of Flood Exposure in the Netherlands during the 20th and 21st Century. Glob. Environ. Change 2011, 21, 620–627. [Google Scholar] [CrossRef] [Scilit]
- Willems, P. Revision of Urban Drainage Design Rules after Assessment of Climate Change Impacts on Precipitation Extremes at Uccle, Belgium. J. Hydrol. 2013, 496, 166–177. [Google Scholar] [CrossRef] [Scilit]
- Guo, E.; Zhang, J.; Ren, X.; Zhang, Q.; Sun, Z. Integrated Risk Assessment of Flood Disaster Based on Improved Set Pair Analysis and the Variable Fuzzy Set Theory in Central Liaoning Province, China. Nat. Hazards 2014, 74, 947–965. [Google Scholar] [CrossRef] [Scilit]
- Cai, T.; Li, X.; Ding, X.; Wang, J.; Zhan, J. Flood Risk Assessment Based on Hydrodynamic Model and Fuzzy Comprehensive Evaluation with GIS Technique. Int. J. Disaster Risk Reduct. 2019, 35, 101077. [Google Scholar] [CrossRef] [Scilit]
- Popa, M.C.; Peptenatu, D.; Drăghici, C.C.; Diaconu, D.C. Flood Hazard Mapping Using the Flood and Flash-Flood Potential Index in the Buzău River Catchment, Romania. Water 2019, 11, 2116. [Google Scholar] [CrossRef] [Scilit]
- Desalegn, H.; Mulu, A. Flood Vulnerability Assessment Using GIS at Fetam Watershed, Upper Abbay Basin, Ethiopia. Heliyon 2021, 7, e05865. [Google Scholar] [CrossRef] [Scilit]
- Kaya, C.M.; Derin, L. Parameters and methods used in flood susceptibility mapping: A review. J. Water Clim. Change 2023, 14, 1935–1960. [Google Scholar] [CrossRef] [Scilit]
- Copăcean, L.; Man, E.T.; Cojocariu, L.L.; Popescu, C.A.; Vîlceanu, C.-B.; Beilicci, R.; Creţan, A.; Herbei, M.V.; Cuzic, O.Ş.; Herban, S. GIS-Based Flood Assessment Using Hydraulic Modeling and Open Source Data: An Example of Application. Appl. Sci. 2025, 15, 2520. [Google Scholar] [CrossRef] [Scilit]
- Jakovljevic, G.; Govedarica, M.; Alvarez-Taboada, F.; Pajic, V. Accuracy Assessment of Deep Learning Based Classification of LiDAR and UAV Points Clouds for DTM Creation and Flood Risk Mapping. Geosciences 2019, 9, 323. [Google Scholar] [CrossRef] [Scilit]
- Annis, A.; Nardi, F.; Petroselli, A.; Apollonio, C.; Arcangeletti, E.; Tauro, F.; Belli, C.; Bianconi, R.; Grimaldi, S. UAV-DEMs for Small-Scale Flood Hazard Mapping. Water 2020, 12, 1717. [Google Scholar] [CrossRef] [Scilit]
- Sahana, M.; Rehman, S.; Sajjad, H.; Hong, H. Exploring Effectiveness of Frequency Ratio and Support Vector Machine Models in Storm Surge Flood Susceptibility Assessment: A Study of Sundarban Biosphere Reserve, India. Catena 2020, 189, 104450. [Google Scholar] [CrossRef] [Scilit]
- Ahmad, M.; Al Mehedi, M.A.; Yazdan, M.M.S.; Kumar, R. Development of Machine Learning Flood Model Using Artificial Neural Network (ANN) at Var River. Liquids 2022, 2, 147–160. [Google Scholar] [CrossRef] [Scilit]
- Costache, R.; Tin, T.T.; Arabameri, A.; Crăciun, A.; Ajin, R.S.; Costache, I.; Islam, A.R.M.T.; Abba, S.I.; Sahana, M.; Avand, M.; et al. Flash-Flood Hazard Using Deep Learning Based on H2O R Package and Fuzzy-Multicriteria Decision-Making Analysis. J. Hydrol. 2022, 609, 127747. [Google Scholar] [CrossRef] [Scilit]
- Langhammer, J. Flood Simulations Using a Sensor Network and Support Vector Machine Model. Water 2023, 15, 2004. [Google Scholar] [CrossRef] [Scilit]
- Souissi, D.; Zouhri, L.; Hammami, S.; Msaddek, M.H.; Zghibi, A.; Dlala, M. GIS-Based MCDM-AHP Modeling for Flood Susceptibility Mapping of Arid Areas, Southeastern Tunisia. Geocarto Int. 2019, 35, 991–1017. [Google Scholar] [CrossRef] [Scilit]
- Abdullah, M.F.; Siraj, S.; Hodgett, R.E. An Overview of Multi-Criteria Decision Analysis (MCDA) Application in Managing Water-Related Disaster Events: Analyzing 20 Years of Literature for Flood and Drought Events. Water 2021, 13, 1358. [Google Scholar] [CrossRef] [Scilit]
- Seydi, S.T.; Kanani-Sadat, Y.; Hasanlou, M.; Sahraei, R.; Chanussot, J.; Amani, M. Comparison of Machine Learning Algorithms for Flood Susceptibility Mapping. Remote Sens. 2023, 15, 192. [Google Scholar] [CrossRef] [Scilit]
- Cojocariu, L.L.; Horablaga, N.M.; Popescu, C.A.; Horablaga, A.; Bella-Sfîrcoci, M.; Copăcean, L. Mapping Grassland Suitability Through GIS and AHP for Sustainable Management: A Case Study of Hunedoara County, Romania. Sustainability 2026, 18, 1155. [Google Scholar] [CrossRef] [Scilit]
- Hazarika, N.; Barman, D.; Das, A.K.; Sarma, A.K.; Borah, S.B. Assessing and mapping flood hazard, vulnerability and risk in the upper Brahmaputra River valley using stakeholders’ knowledge and multicriteria evaluation (MCE). J. Flood Risk Manag. 2016, 11, S700–S716. [Google Scholar] [CrossRef] [Scilit]
- Msabi, M.M.; Makonyo, M. Flood susceptibility mapping using GIS and multicriteria decision analysis: A case of Dodoma region, central Tanzania. Remote Sens. Appl. Soc. Environ. 2021, 21, 100445. [Google Scholar] [CrossRef] [Scilit]
- Costache, R.; Crăciun, A.; Ciobotaru, N.; Bărbulescu, A. Intelligent Methods for Estimating the Flood Susceptibility in the Danube Delta, Romania. Water 2024, 16, 3511. [Google Scholar] [CrossRef] [Scilit]
- Yaghoobi, M.; Fathi, A.; Fazli, S.; Li, W.; Haghshenas, E.; Shokri Kuchak, V.; El-Askary, H. Impact of land use dynamics on the water yields in the Gorgan River Basin. Heliyon 2024, 10, e35674. [Google Scholar] [CrossRef] [Scilit]
- Administrația Națională “Apele Române”. Spațiul Hidrografic Banat. Available online: https://inundatii.ro/bazine-hidrografice/bazinul-hidrografic-banat/ (accessed on 10 October 2025).
- Posea, G.; Badea, I. România. Unitățile de Relief (Regionarea Geomorfologică) (Relief Units-Geomorphological Region); Editura Științifică și Enciclopedică: București, Romania, 1984. [Google Scholar]
- European Environment Agency. EU-DEM-European Environment Agency Dataset. 2015. Available online: https://www.eea.europa.eu/en/datahub/datahubitem-view/d08852bc-7b5f-4835-a776-08362e2fbf4b (accessed on 10 December 2015).
- Geospatial. România: Seturi de Date Vectoriale Generale; Geospatial, Romania. 2021. Available online: http://geo-spatial.org/vechi/download/romania-seturi-vectoriale (accessed on 12 December 2021).
- Administrația Bazinală de Apă Banat (ABA Banat). Hydrological, Statistical and Flood-Related Data for the Banat River Basin; Internal Archive Data: Timișoara, Romania, 2025. [Google Scholar]
- European Climate Assessment & Dataset (ECA&D). Daily Precipitation Data for Meteorological Stations in Romania. Zenodo Data Repository. Available online: https://zenodo.org (accessed on 20 June 2025).
- Copernicus Land Monitoring Service. Corine Land Cover (CLC). 2025. Available online: https://land.copernicus.eu/pan-european/corine-land-cover (accessed on 15 March 2025).
- Patrikaki, O.; Kazakis, N.; Kougias, I.; Patsialis, T.; Theodossiou, N.; Voudouris, K. Assessing flood hazard at river basin scale with an index-based approach: The case of Mouriki, Greece. Geosciences 2018, 8, 50. [Google Scholar] [CrossRef] [Scilit]
- Yin, J.; Guo, S.; Liu, Z.; Yang, G.; Zhong, Y.; Liu, D. Uncertainty analysis of bivariate design flood estimation and its impacts on reservoir routing. Water Resour. Manag. 2018, 32, 1795–1809. [Google Scholar] [CrossRef] [Scilit]
- Houghton-Carr, H.A.; Print, C.R.; Fry, M.J.; Gadain, H.; Muchiri, P. An assessment of the surface water resources of the Juba-Shabelle basin in southern Somalia. Hydrol. Sci. J. 2011, 56, 759–774. [Google Scholar] [CrossRef] [Scilit]
- Tehrany, M.S.; Kumar, L. The application of a Dempster–Shafer-based evidential belief function in flood susceptibility mapping and comparison with frequency ratio and logistic regression methods. Environ. Earth Sci. 2018, 77, 490. [Google Scholar] [CrossRef] [Scilit]
- Mitra, R.; Das, J. A comparative assessment of flood susceptibility modelling of GIS-based TOPSIS, VIKOR, and EDAS techniques in the sub-himalayan foothills region of Eastern India. Environ. Sci. Pollut. Res. 2022, 30, 16036–16067. [Google Scholar] [CrossRef] [Scilit]
- Ghosh, A.; Kar, S.K. Application of analytical hierarchy process (AHP) for flood risk assessment: A case study in Malda district of West Bengal, India. Nat. Hazards 2018, 94, 349–368. [Google Scholar] [CrossRef] [Scilit]
- Anni, A.H.; Cohen, S.; Praskievicz, S. Sensitivity of urban flood simulations to stormwater infrastructure and soil infiltration. J. Hydrol. 2020, 588, 125028. [Google Scholar] [CrossRef] [Scilit]
- Eriyagama, N.; Thilakarathne, M.; Tharuka, P.; Munaweera, T.; Muthuwatta, L.; Smakhtin, V.; Premachandra, W.W.; Pindeniya, D.; Wijayarathne, N.S.; Udamulla, L. Actual and perceived causes of flood risk: Climate versus anthropogenic effects in a wet zone catchment in Sri Lanka. Water Int. 2017, 42, 874–892. [Google Scholar] [CrossRef] [Scilit]
- Esri. ArcGIS Desktop Documentation: ArcMap (Including ArcCatalog, ArcScene, ArcGlobe). Available online: https://desktop.arcgis.com/en/documentation/ (accessed on 15 June 2025).
- Moore, I.D.; Grayson, R.B.; Ladson, A.R. Digital terrain modelling: A review of hydrological, geomorphological, and biological applications. Hydrol. Process. 1991, 5, 3–30. [Google Scholar] [CrossRef] [Scilit]
- Beven, K.J.; Kirkby, M.J. A physically based, variable contributing area model of basin hydrology. Hydrol. Sci. Bull. 1979, 24, 43–69. [Google Scholar] [CrossRef] [Scilit]
- Florea, N.; Munteanu, I. Sistemul Român de Taxonomie a Solurilor (SRTS); Editura Sitech: Craiova, Romania, 2012. [Google Scholar]
- Al-Kindi, K.M.; Alabri, Z. Investigating the Role of the Key Conditioning Factors in Flood Susceptibility Mapping through Machine Learning Approaches. Earth Syst. Environ. 2024, 8, 63–81. [Google Scholar] [CrossRef] [Scilit]
- Feizbahr, M.; Brake, N.; Arbabkhah, H.; Hariri Asli, H.; Woods, K. Flood Susceptibility Mapping Using Machine Learning and Geospatial-Sentinel-1 SAR Integration for Enhanced Early Warning Systems. Remote Sens. 2025, 17, 3471. [Google Scholar] [CrossRef] [Scilit]
- Varra, G.; Della Morte, R.; Tartaglia, M.; Fiduccia, A.; Zammuto, A.; Agostino, I.; Booth, C.A.; Quinn, N.; Lamond, J.E.; Cozzolino, L. Flood Susceptibility Assessment for Improving the Resilience Capacity of Railway Infrastructure Networks. Water 2024, 16, 2592. [Google Scholar] [CrossRef] [Scilit]
- Ahmad, I.; Ping, W.; Ullah, S.; Faqeih, K.Y.; Alamri, S.M.; Alamery, E.R.; Abalkhail, A.A.A.; Bilal Jan, H.M. Spatiotemporal Mapping of Urban Flood Susceptibility: A Multi-Criteria GIS-Based Assessment in Nangarhar, Afghanistan. Land 2025, 14, 2376. [Google Scholar] [CrossRef] [Scilit]
- AlAli, A.M.; Salih, A.; Hassaballa, A. Geospatial-Based Analytical Hierarchy Process (AHP) and Weighted Product Model (WPM) Techniques for Mapping and Assessing Flood Susceptibility in the Wadi Hanifah Drainage Basin, Riyadh Region, Saudi Arabia. Water 2023, 15, 1943. [Google Scholar] [CrossRef] [Scilit]
- Saaty, T.L. The Analytic Hierarchy Process: Planning, Priority Setting, Resource Allocation; McGraw-Hill: New York, NY, USA, 1980; Available online: https://books.google.ro/books/about/The_Analytic_Hierarchy_Process.html?id=Xxi7AAAAIAAJ (accessed on 10 December 2025).
- Pant, S.; Kumar, A.; Ram, M.; Klochkov, Y.; Sharma, H.K. Consistency Indices in Analytic Hierarchy Process: A Review. Mathematics 2022, 10, 1206. [Google Scholar] [CrossRef] [Scilit]
- Taoukidou, N.; Karpouzos, D.; Georgiou, P. Flood Hazard Assessment Through AHP, Fuzzy AHP, and Frequency Ratio Methods: A Comparative Analysis. Water 2025, 17, 2155. [Google Scholar] [CrossRef] [Scilit]
- Shrestha, S.; Dahal, D.; Poudel, B.; Banjara, M.; Kalra, A. Flood Susceptibility Analysis with Integrated Geographic Information System and Analytical Hierarchy Process: A Multi-Criteria Framework for Risk Assessment and Mitigation. Water 2025, 17, 937. [Google Scholar] [CrossRef] [Scilit]
- JASP Team. JASP, Version 0.95.4.0; University of Amsterdam: Amsterdam, The Netherlands, 2025; Available online: https://jasp-stats.org/ (accessed on 15 June 2025).
- Samanta, S.; Pal, D.K.; Palsamanta, B. Flood susceptibility analysis through remote sensing, GIS and frequency ratio model. Appl. Water Sci. 2018, 8, 66. [Google Scholar] [CrossRef] [Scilit]
- Pimenta, L.; Duarte, L.; Teodoro, A.C.; Beltrão, N.; Gomes, D.; Oliveira, R. GIS-Based Flood Susceptibility Mapping Using AHP in the Urban Amazon: A Case Study of Ananindeua, Brazil. Land 2025, 14, 1543. [Google Scholar] [CrossRef] [Scilit]
- Vojtek, M.; Vojteková, J. Flood Susceptibility Mapping on a National Scale in Slovakia Using the Analytical Hierarchy Process. Water 2019, 11, 364. [Google Scholar] [CrossRef] [Scilit]
- Copăcean, L.; Zisu, I.; Mazăre, V.; Cojocariu, L. Analysis of Land Use Changes and Their Influence on Soil Features. Case Study: Secaș Village, Timiș County (Romania). Present Environ. Sustain. Dev. 2019, 13, 157–166. [Google Scholar] [CrossRef] [Scilit]
- Garssen, A.G.; Baattrup-Pedersen, A.; Riis, T.; Raven, B.M.; Hoffman, C.C.; Verhoeven, J.T.A.; Soons, M.B. Effects of increased flooding on riparian vegetation: Field experiments simulating climate change along five European lowland streams. Glob. Change Biol. 2017, 23, 3052–3063. [Google Scholar] [CrossRef] [Scilit]
- Rahman, M.H.; Okubo, A.; Sugiyama, S.; Mayland, H.F. Physical, chemical and microbiological properties of an Andisol as related to land use and tillage practice. Soil Till. Res. 2008, 101, 10–19. [Google Scholar] [CrossRef] [Scilit]
- Khan, I.; Fahad, S.; Wu, L.; Zhou, W.; Xu, P.; Sun, Z.; Salam, A.; Imran, M.; Jiang, M.; Kuzyakov, Y.; et al. Labile organic matter intensifies phosphorous mobilization in paddy soils by microbial iron(III) reduction. Geoderma 2019, 352, 185–196. [Google Scholar] [CrossRef] [Scilit]
- Măgureanu, M.; Sfîrcoci, M.; Copăcean, L.; Cojocariu, L. Monitoring the vegetation coverage of the grasslands in the Poiana Ruscă Mountains using different remote sensing indices. Present Environ. Sustain. Dev. 2023, 17, 189–199. [Google Scholar] [CrossRef] [Scilit]
- Rupngam, T.; Messiga, A.J. Unraveling the Interactions between Flooding Dynamics and Agricultural Productivity in a Changing Climate. Sustainability 2024, 16, 6141. [Google Scholar] [CrossRef] [Scilit]
- Wang, X.; Deng, Z.; Zhang, W.; Meng, Z.; Chang, X.; Lv, M. Effect of waterlogging duration at different growth stages on the growth, yield and quality of cotton. PLoS ONE 2017, 12, e0169029. [Google Scholar] [CrossRef] [Scilit] [PubMed]
- Liu, K.; Harrison, M.T.; Shabala, S.; Meinke, H.; Ahmed, I.; Zhang, Y.; Tian, X.; Zhou, M. The state of the art in modeling waterlogging impacts on plants: What do we know and what do we need to know. Earth’s Future 2020, 8, e2020EF001801. [Google Scholar] [CrossRef] [Scilit]
- Huang, C.; Gao, Y.; Qin, A.; Liu, Z.; Zhao, B.; Ning, D.; Ma, S.; Duan, A.; Liu, Z. Effects of waterlogging at different stages and durations on maize growth and grain yields. Agric. Water Manag. 2022, 261, 107334. [Google Scholar] [CrossRef] [Scilit]
- Sarkar, P.K.; Khatun, A.; Singha, A. Effect of duration of water-logging on crop stand and yield of sesame. Int. J. Innov. Appl. Stud. 2016, 14, 1–6. [Google Scholar]
- Mâșu, S.; Cojocariu, L.; Horablaga, N.M.; Bordean, D.-M.; Borozan, A.B.; Cojocariu, A.; Pop, G.; Sandoiu, I.C. The Effects of Triticum aestivum Species for the Phytoremediation of Petroleum-Contaminated Soil. In Proceedings of the SGEM 2013 Conference, Albena, Bulgaria, 16–22 June 2013; Volume 1, pp. 963–970. [Google Scholar] [CrossRef] [Scilit]
- Copacean, L.; Cojocariu, L.; Simon, M.; Zisu, I.; Popescu, C. Geomatic techniques applied for remote determination of the hay quantity in agrosilvopastoral systems. Present Environ. Sustain. Dev. 2020, 14, 89–101. [Google Scholar] [CrossRef] [Scilit]
- Ali, S.; Liu, K.; Ahmed, W.; Jing, H.; Qaswar, M.; Kofi Anthonio, C.; Maitlo, A.A.; Lu, Z.; Liu, L.; Zhang, H. Nitrogen Mineralization, Soil Microbial Biomass and Extracellular Enzyme Activities Regulated by Long-Term N Fertilizer Inputs: A Comparison Study from Upland and Paddy Soils in a Red Soil Region of China. Agronomy 2021, 11, 2057. [Google Scholar] [CrossRef] [Scilit]
- Simon, M.; Copăcean, L.; Cojocariu, L. Techniques for identification, mapping and analysis of grasslands. Case study: Arad county. Present Environ. Sustain. Dev. 2022, 16, 39–49. [Google Scholar] [CrossRef] [Scilit]
- Schilling, K.E.; Gassman, P.W.; Kling, C.L.; Campbell, T.; Jha, M.K.; Wolter, C.F.; Arnold, J.G. The Potential for Agricultural Land Use Change to Reduce Flood Risk in a Large Watershed. Hydrol. Process. 2014, 28, 14–25. [Google Scholar] [CrossRef] [Scilit]
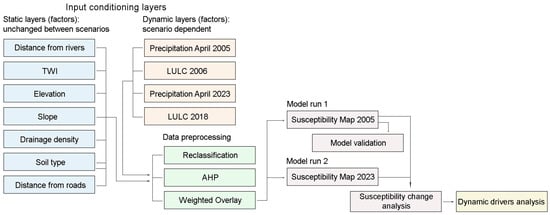
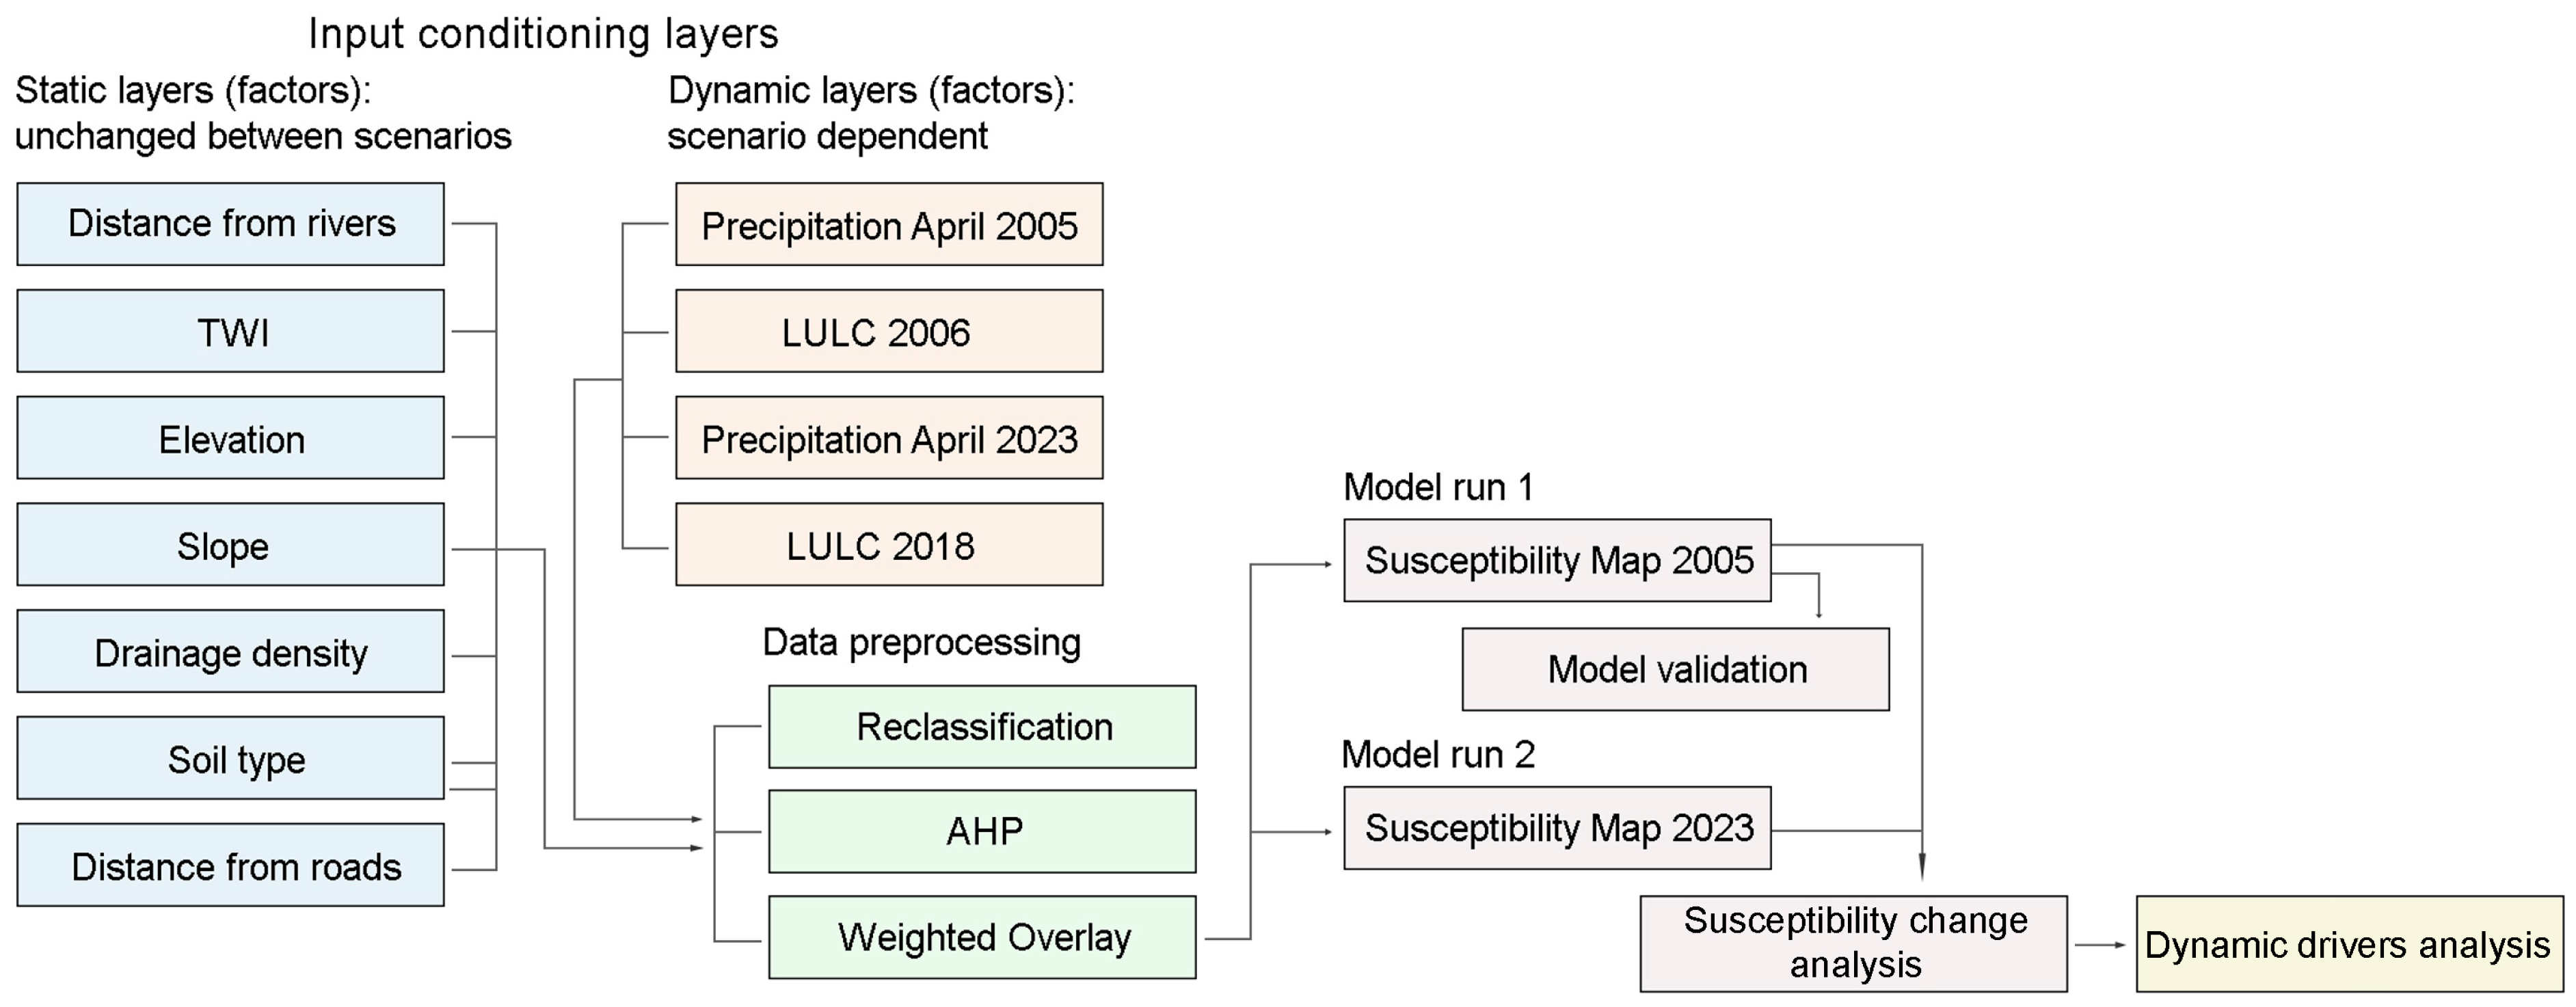
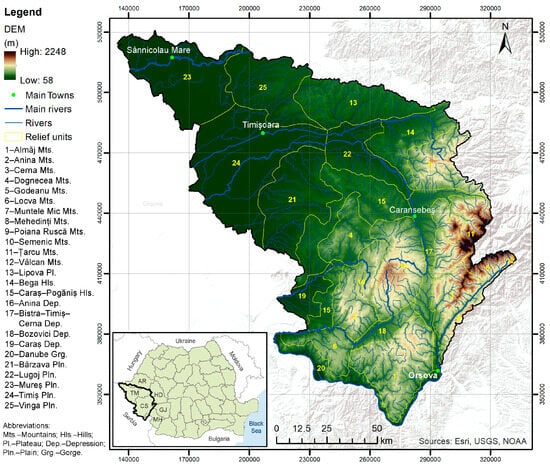
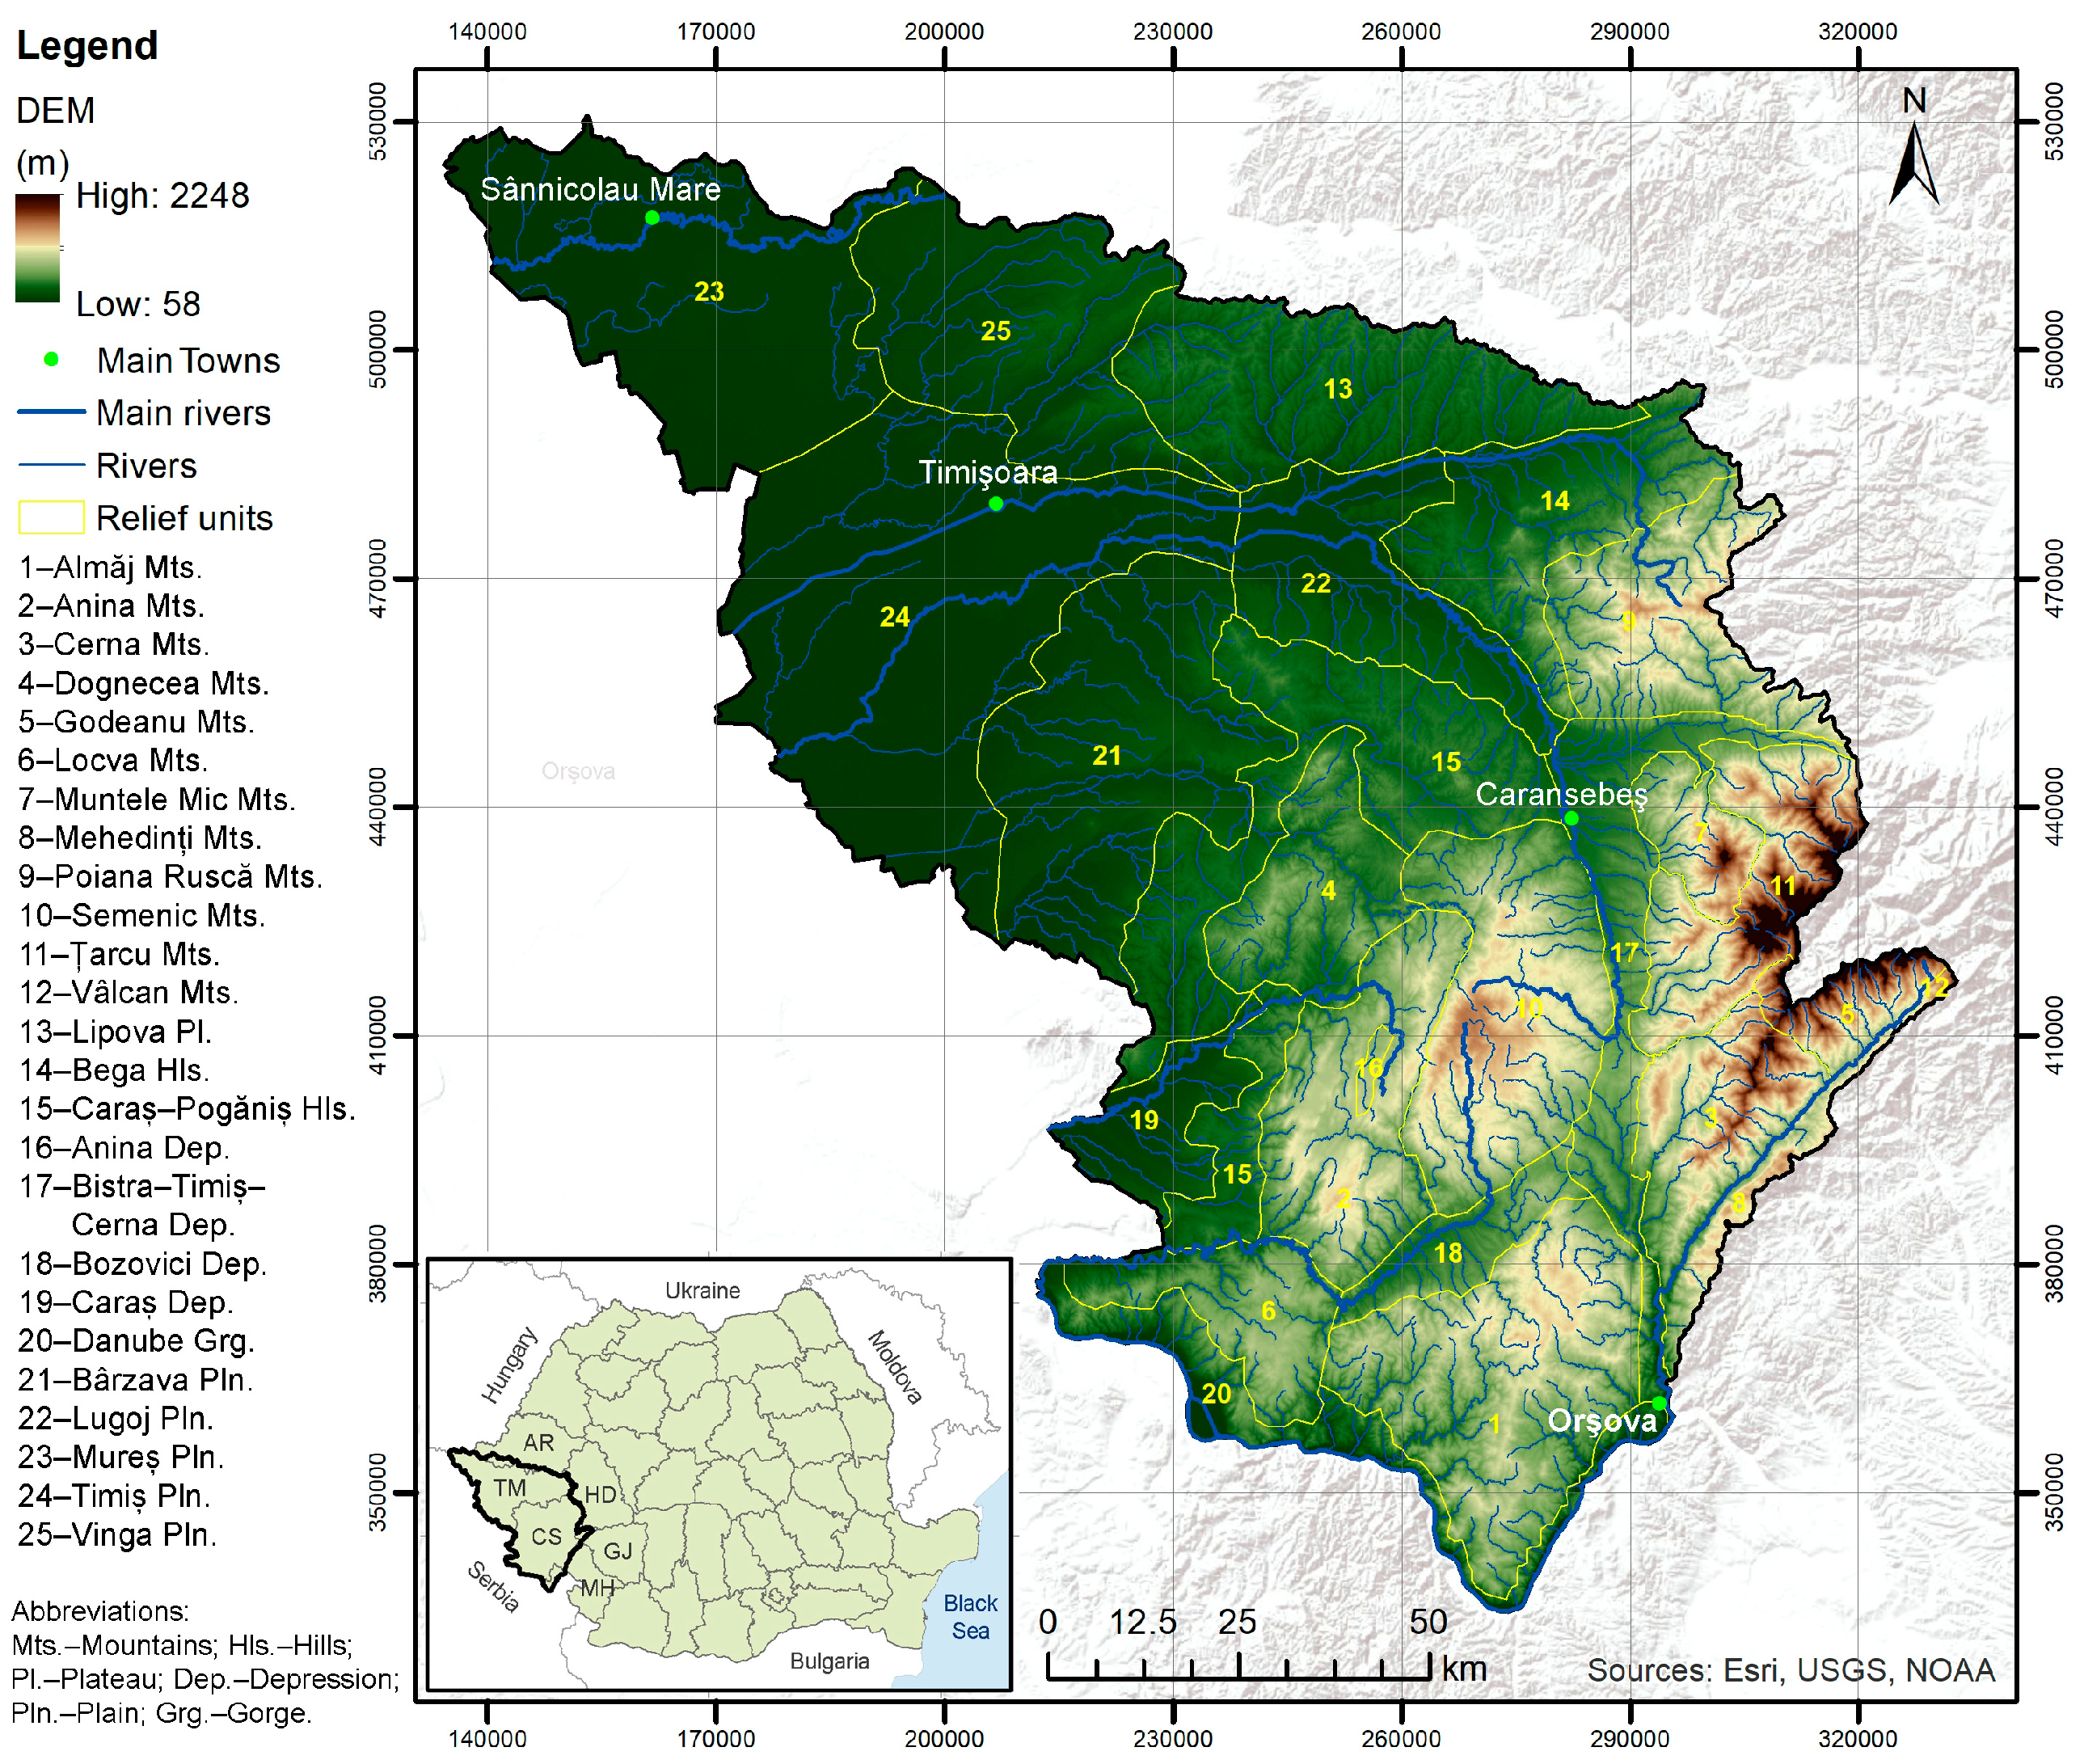
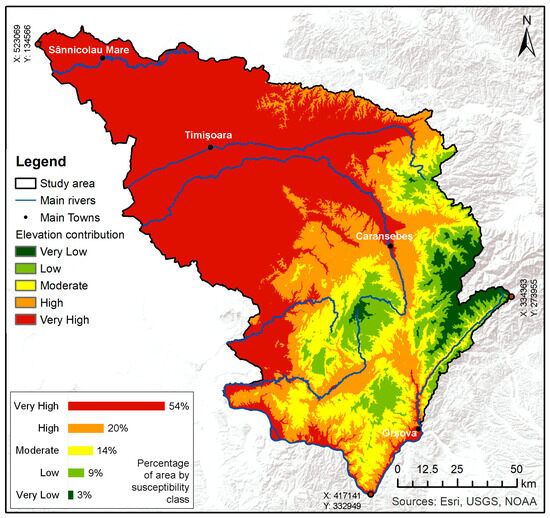
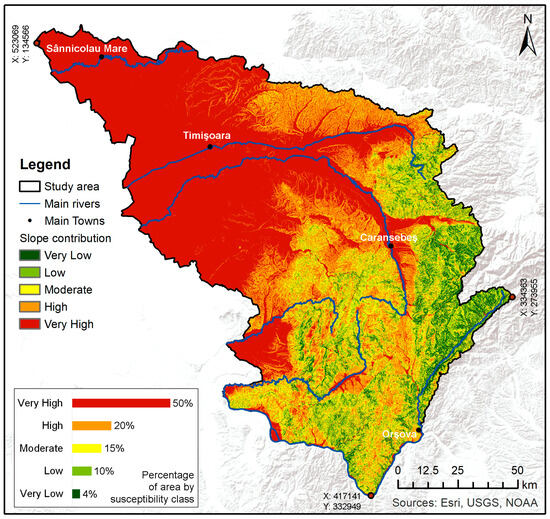
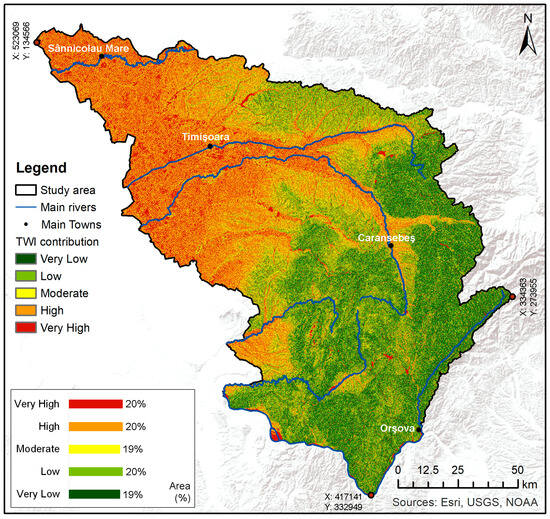
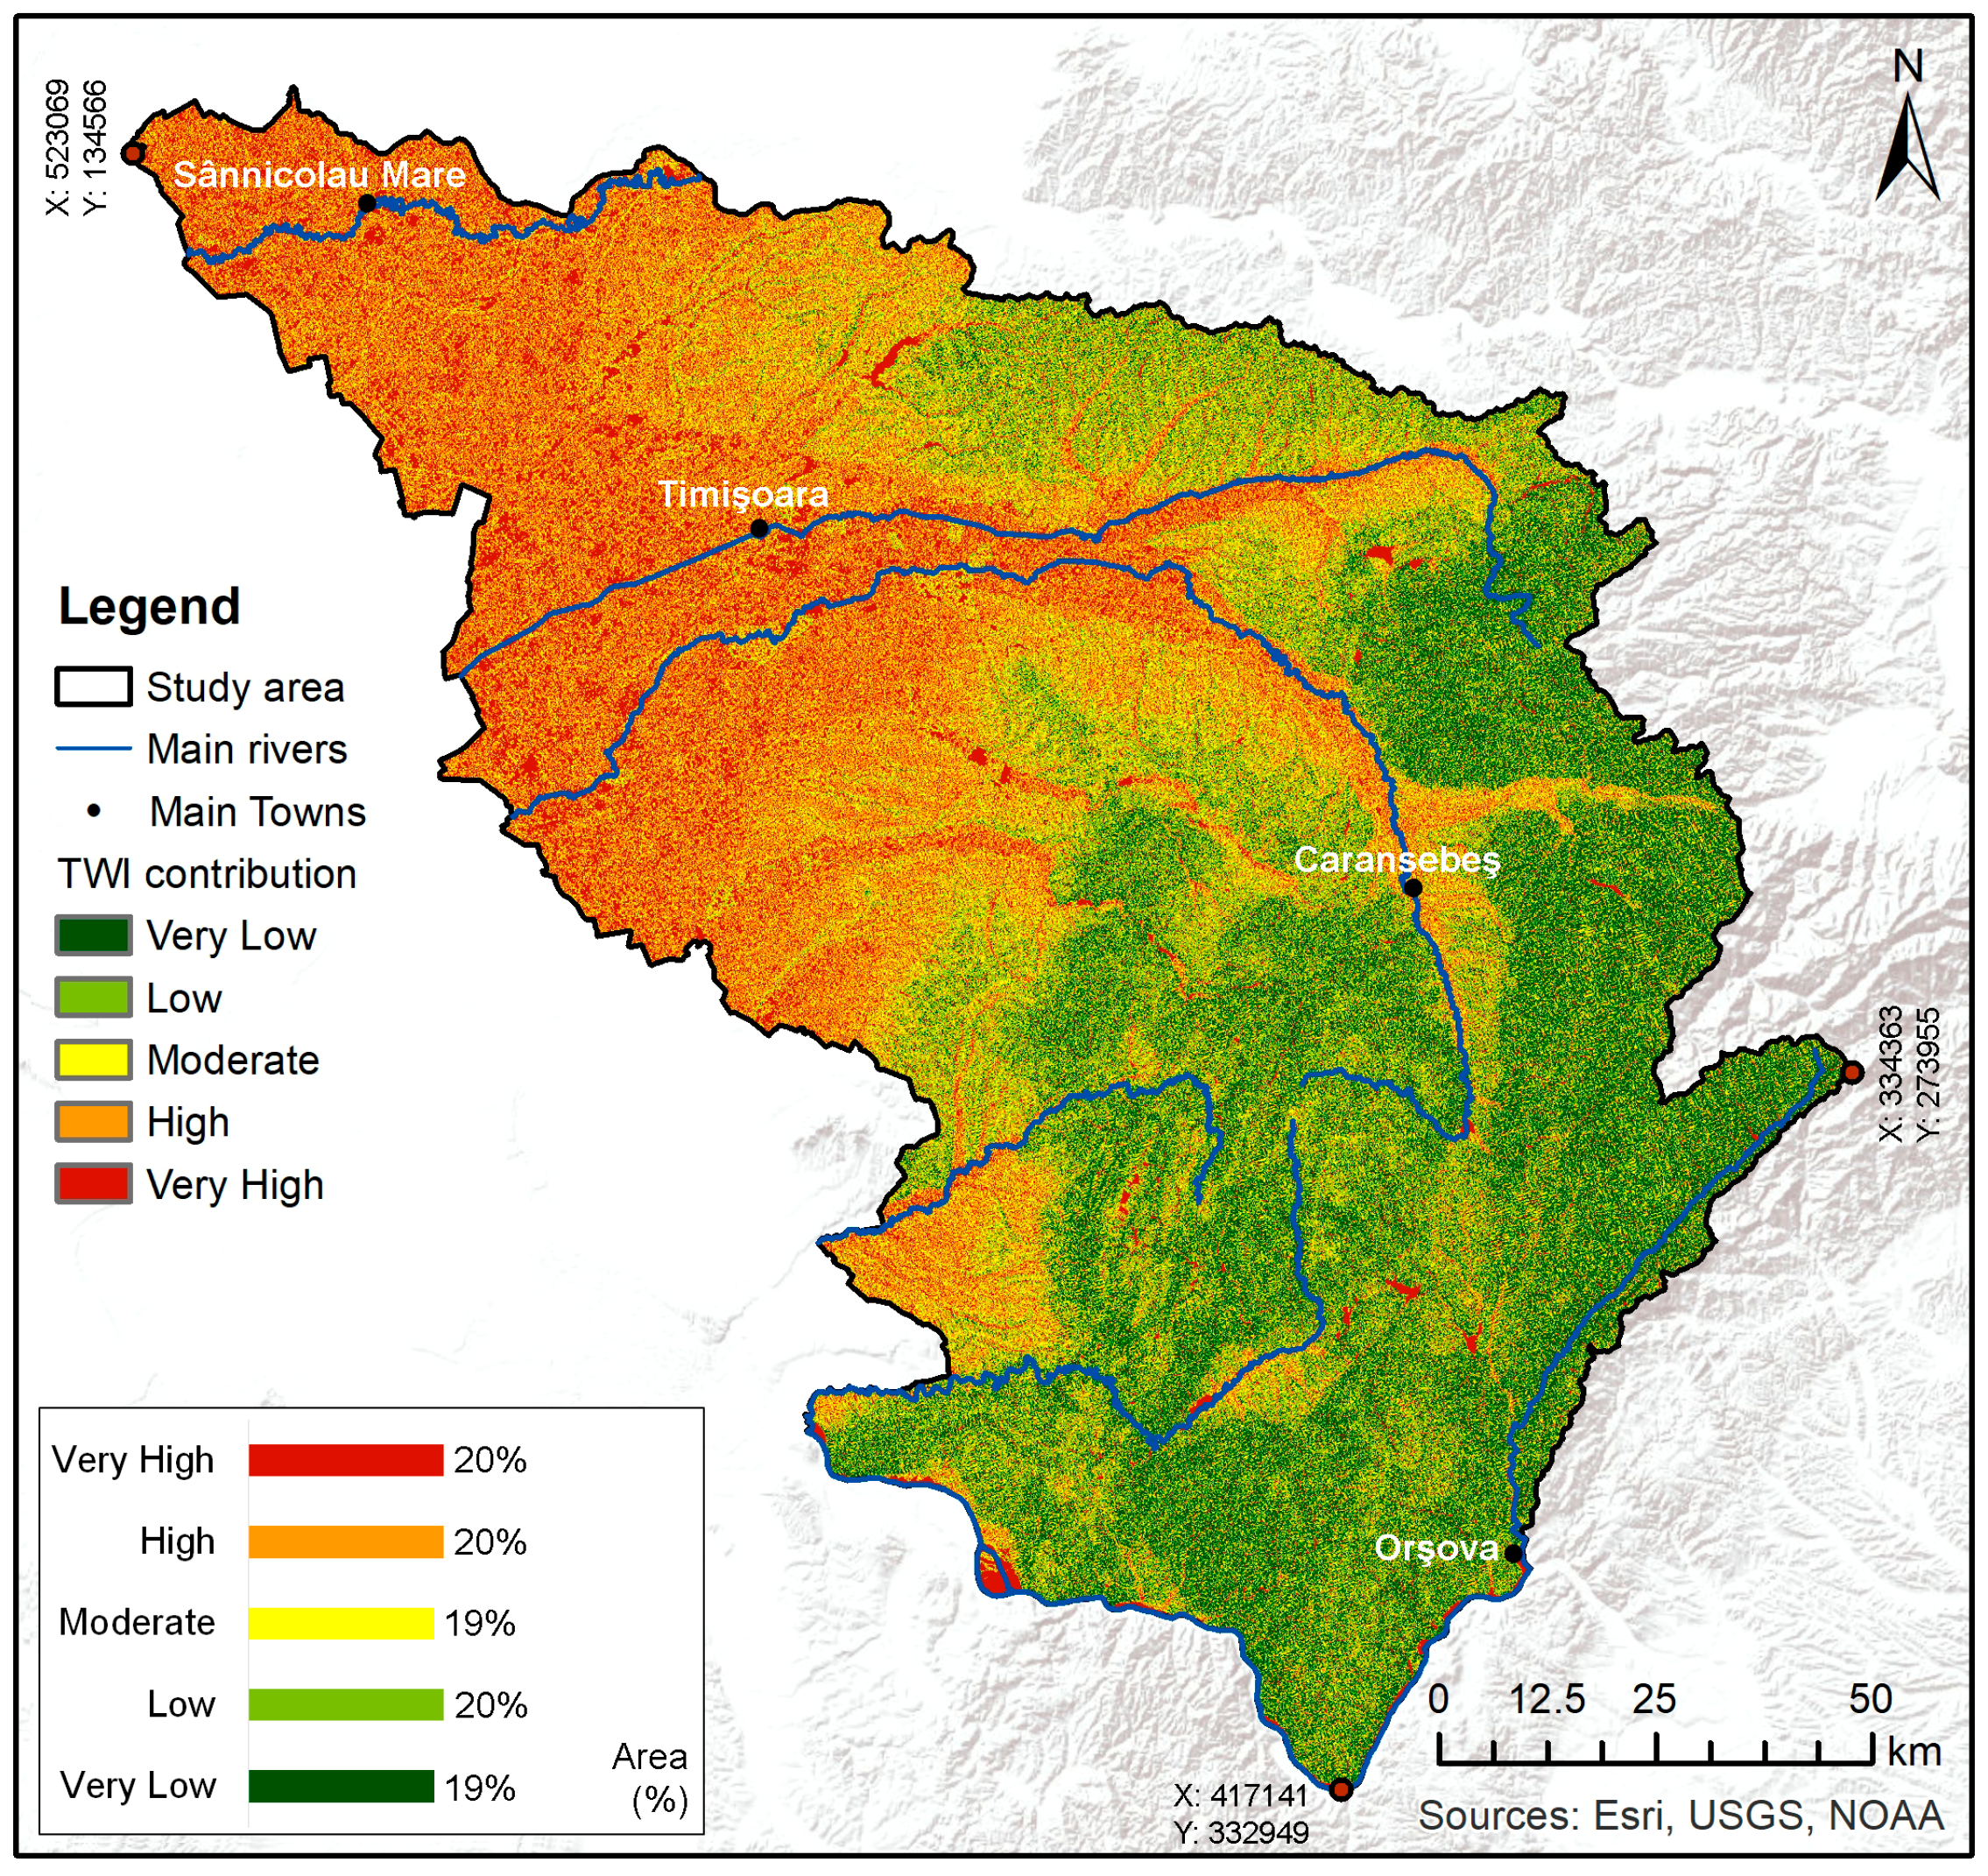
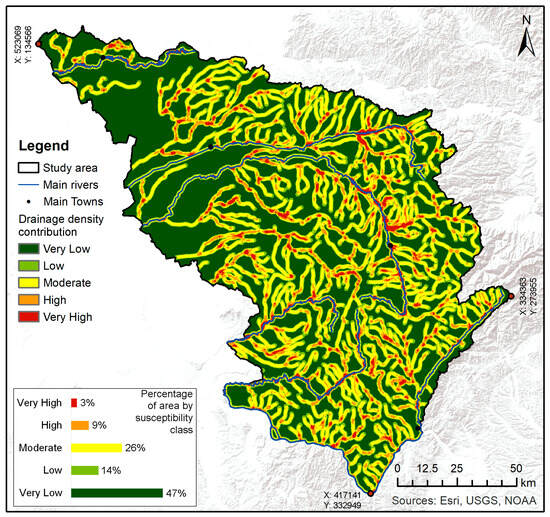
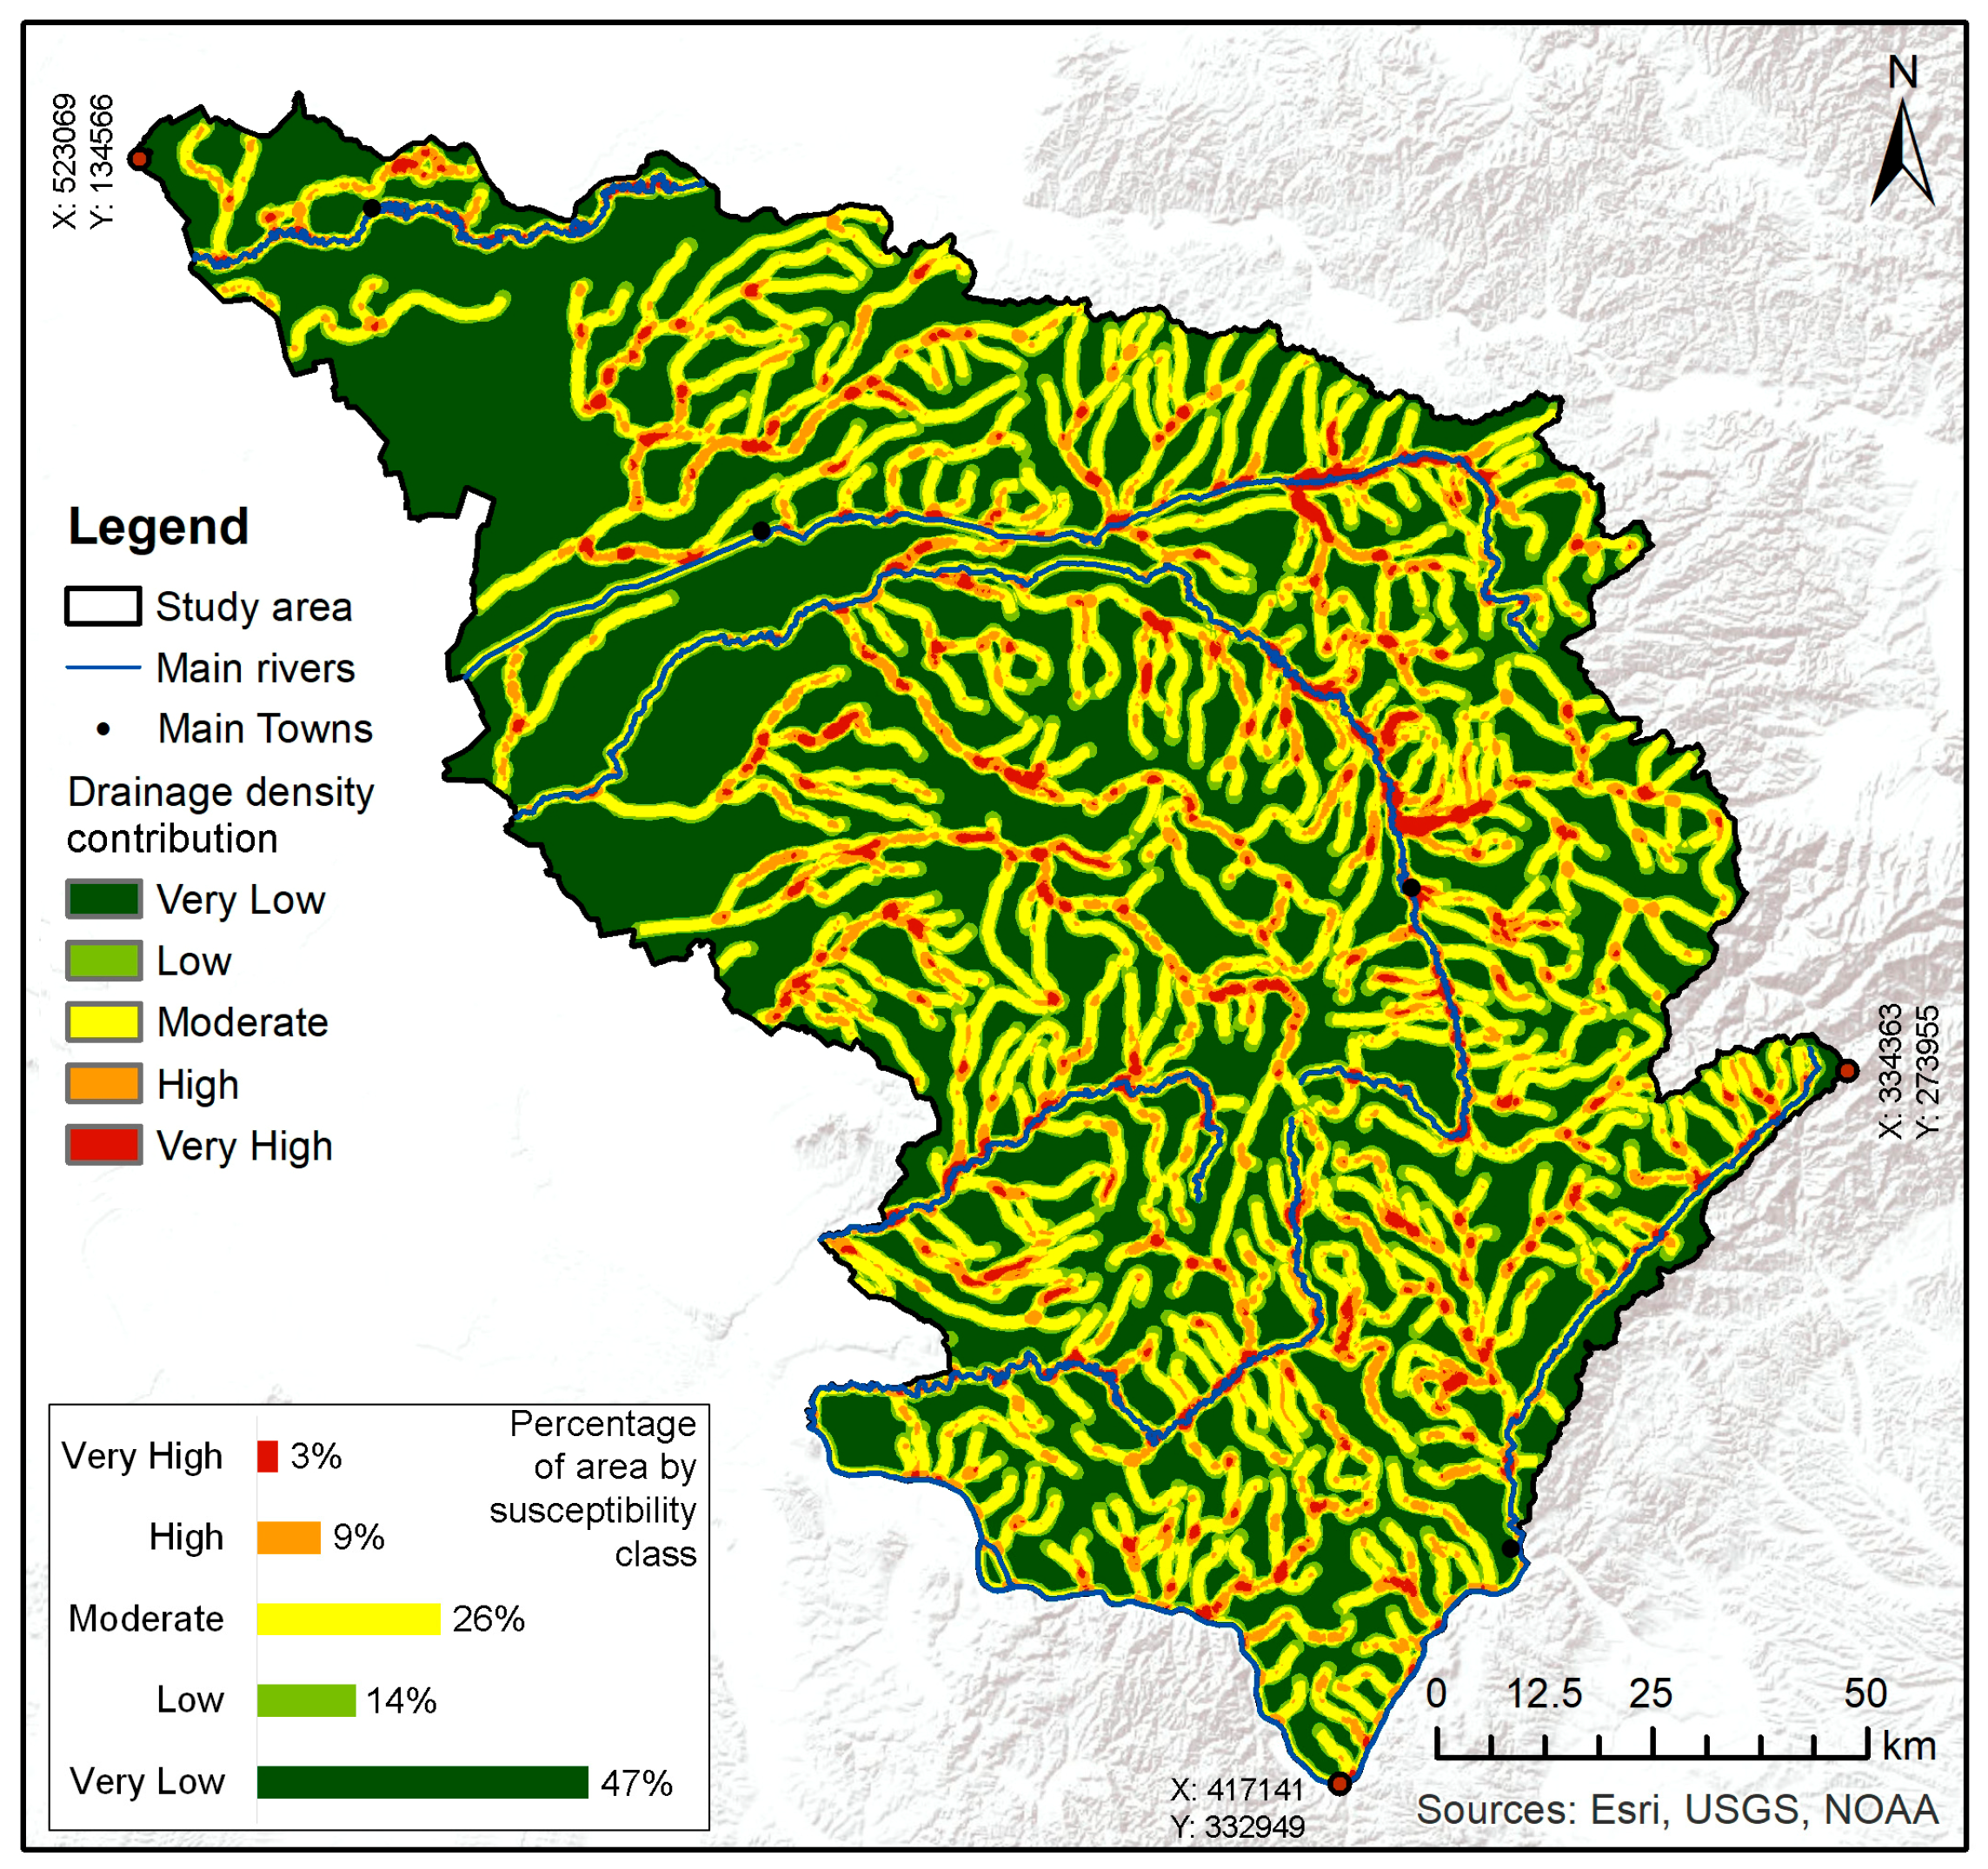
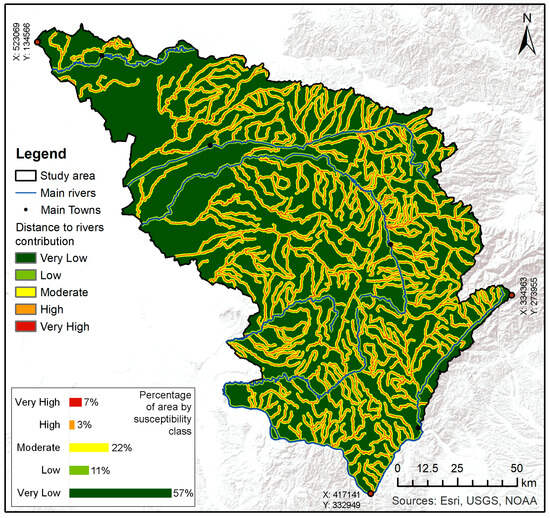
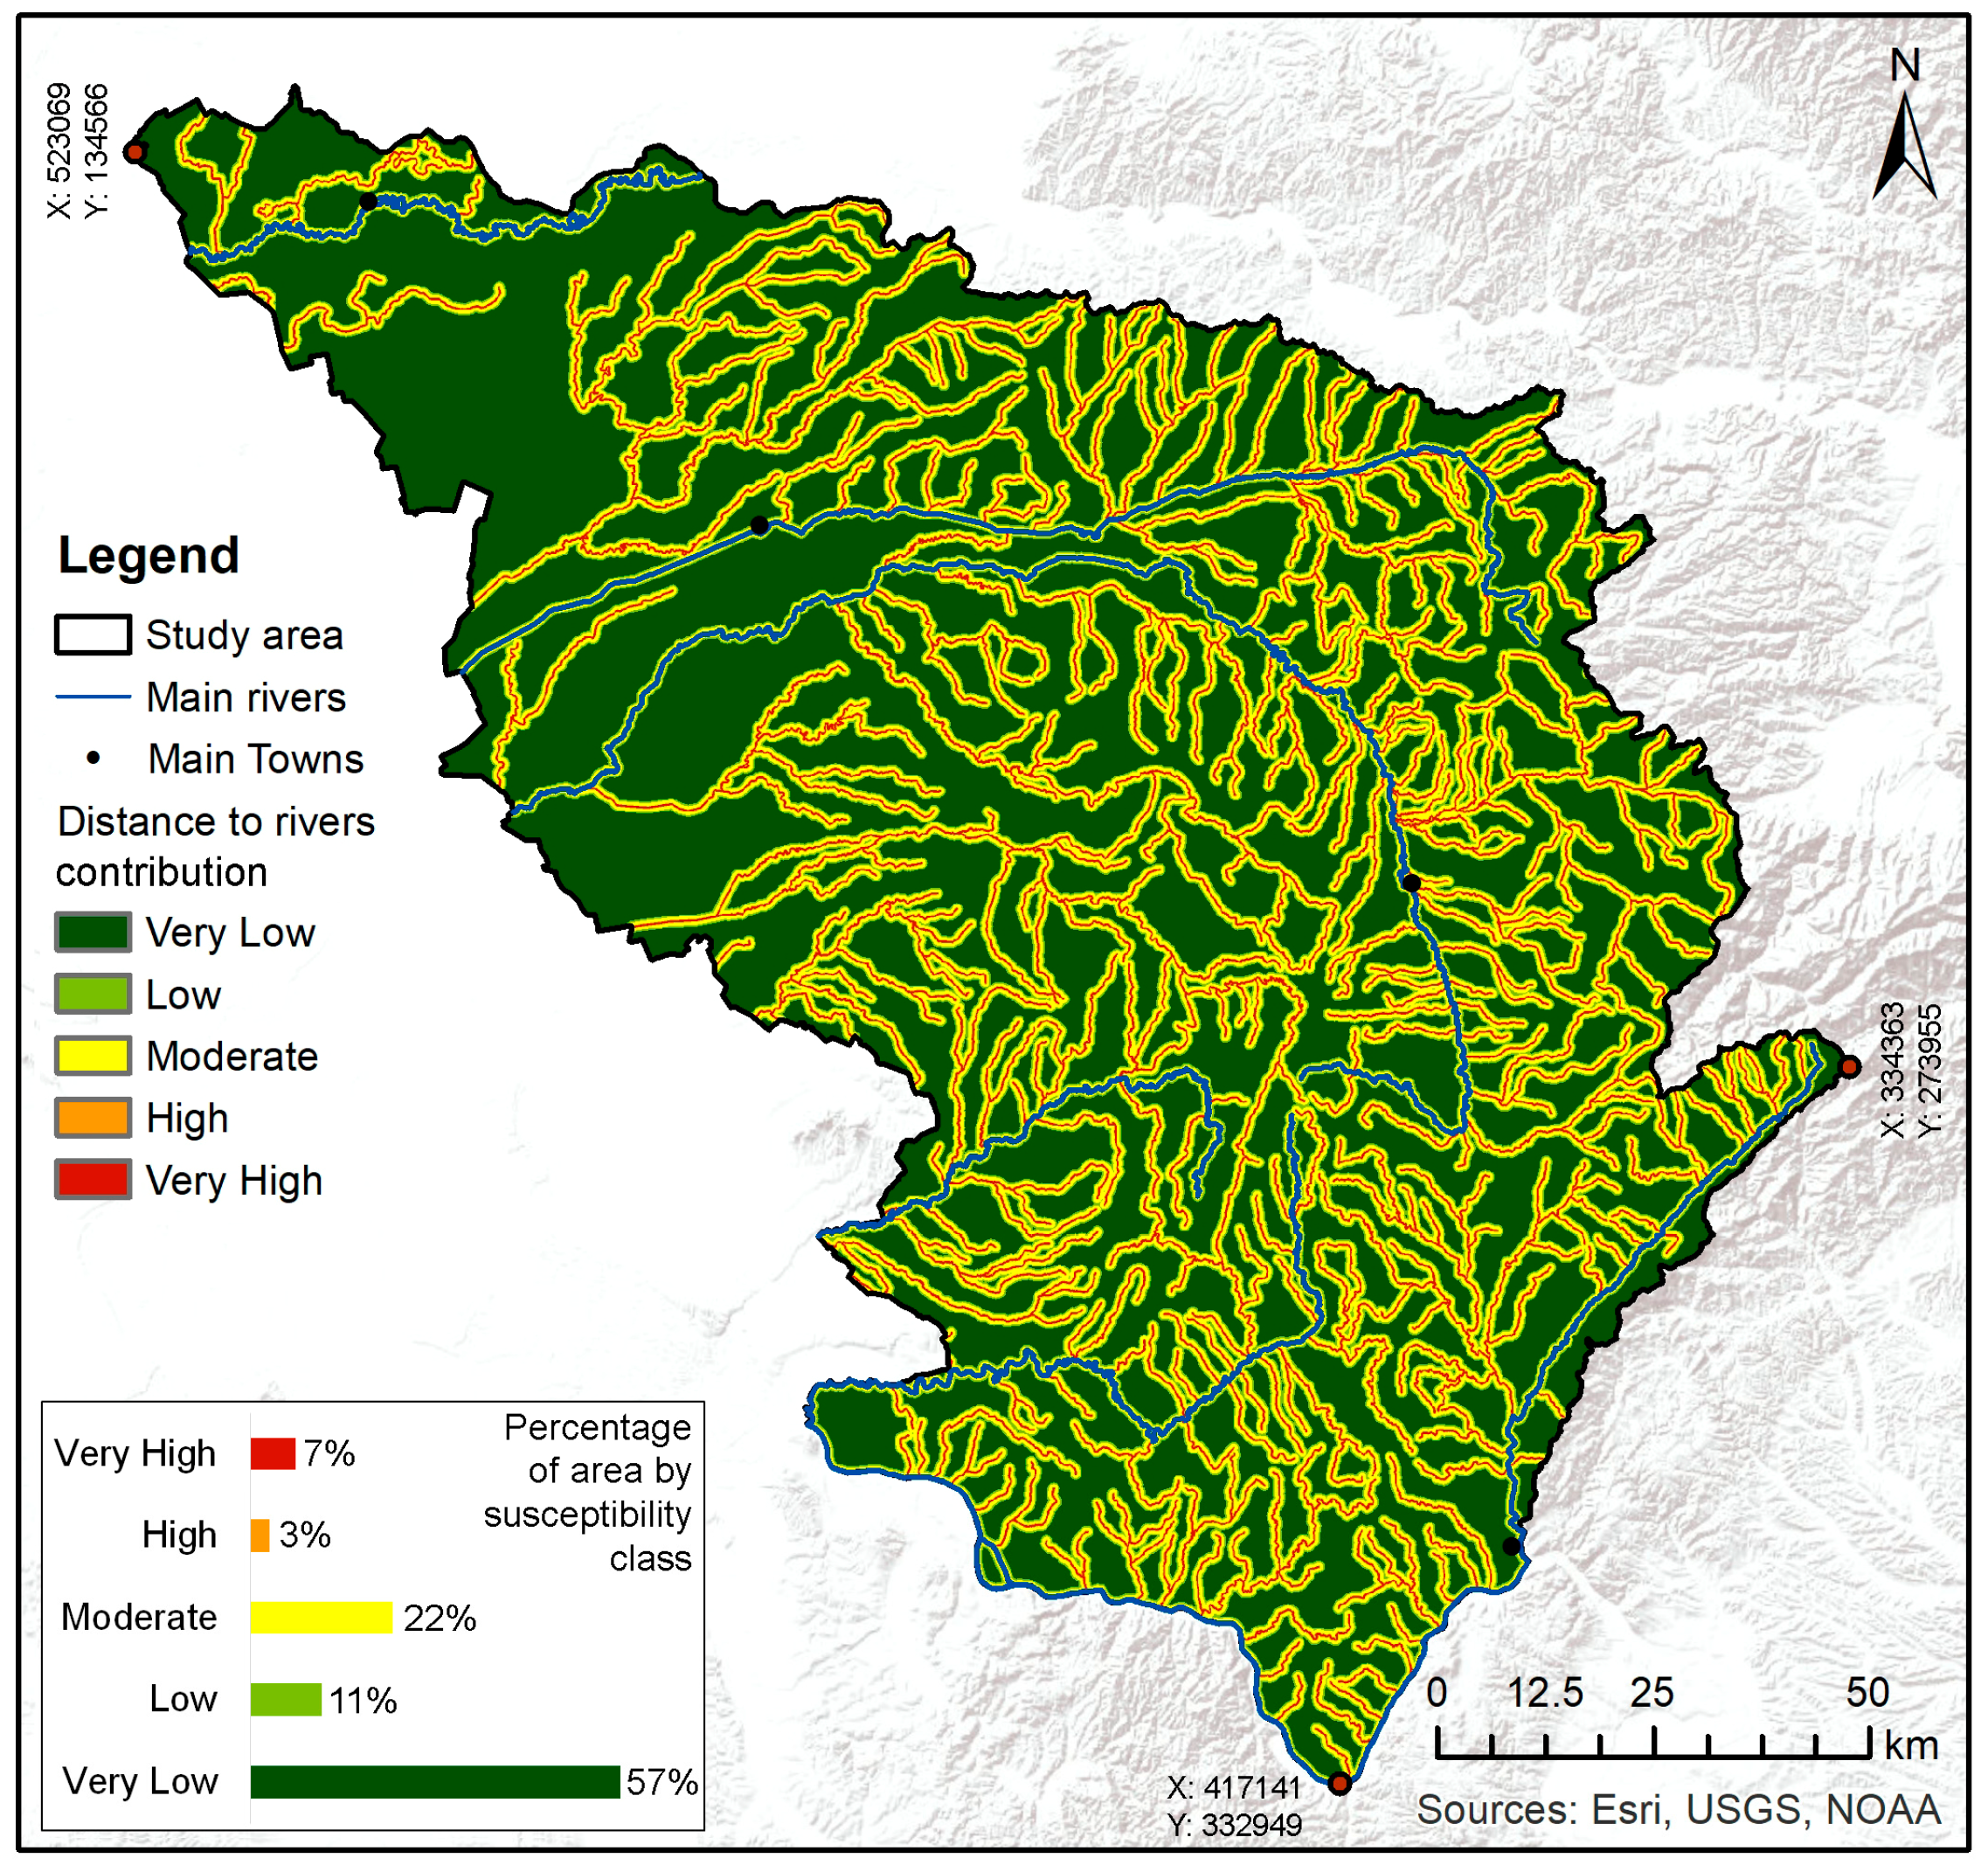
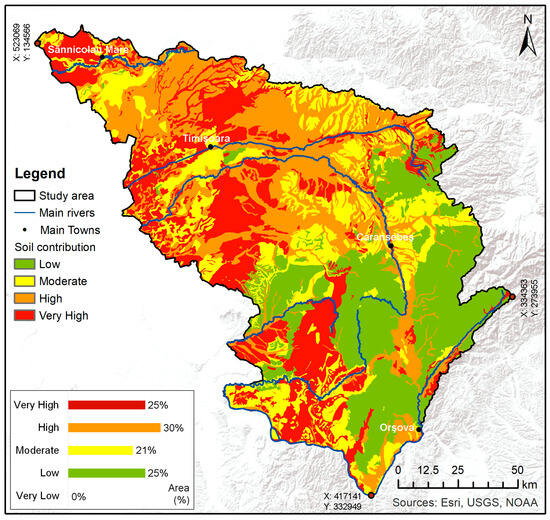
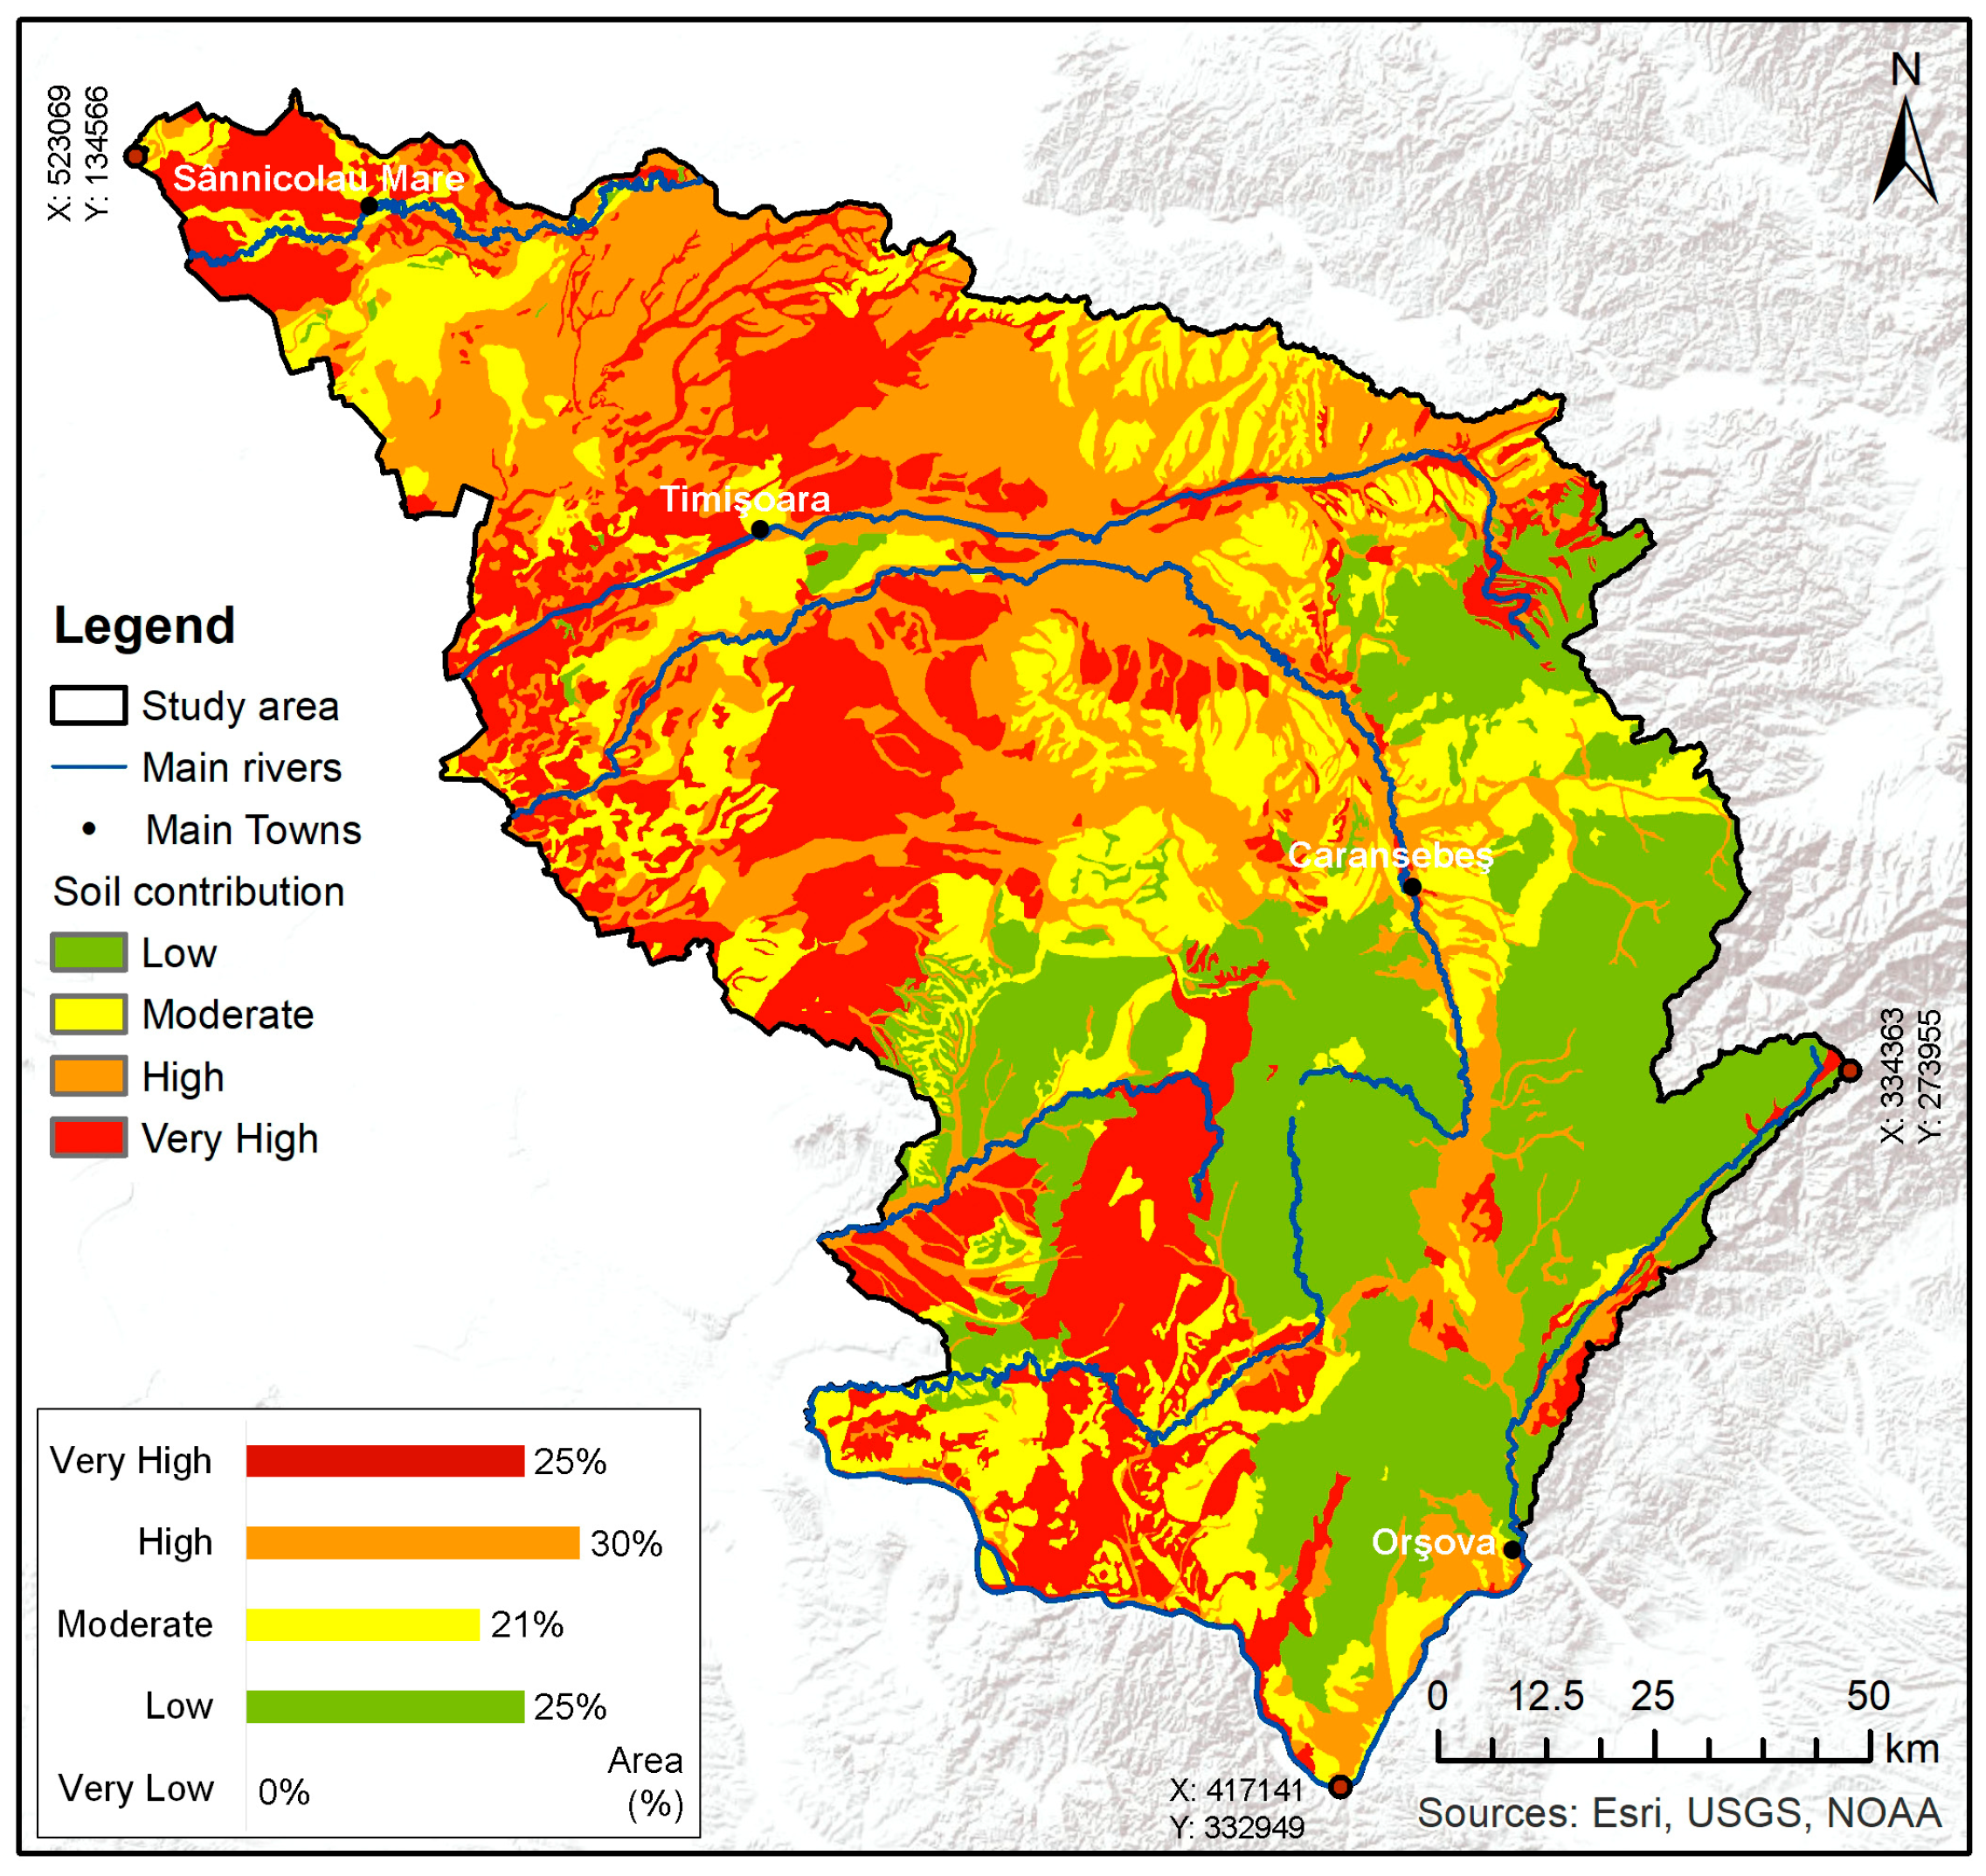
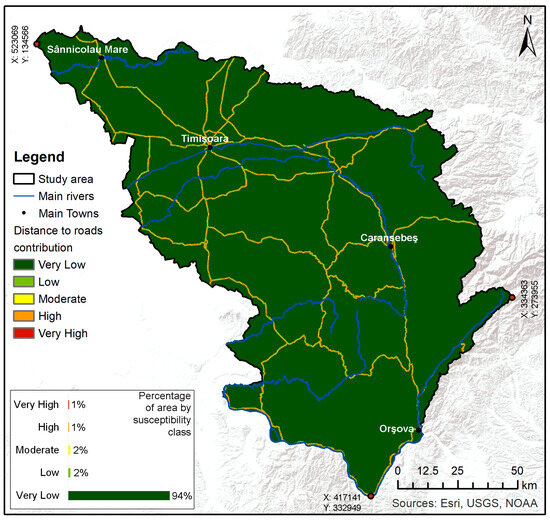
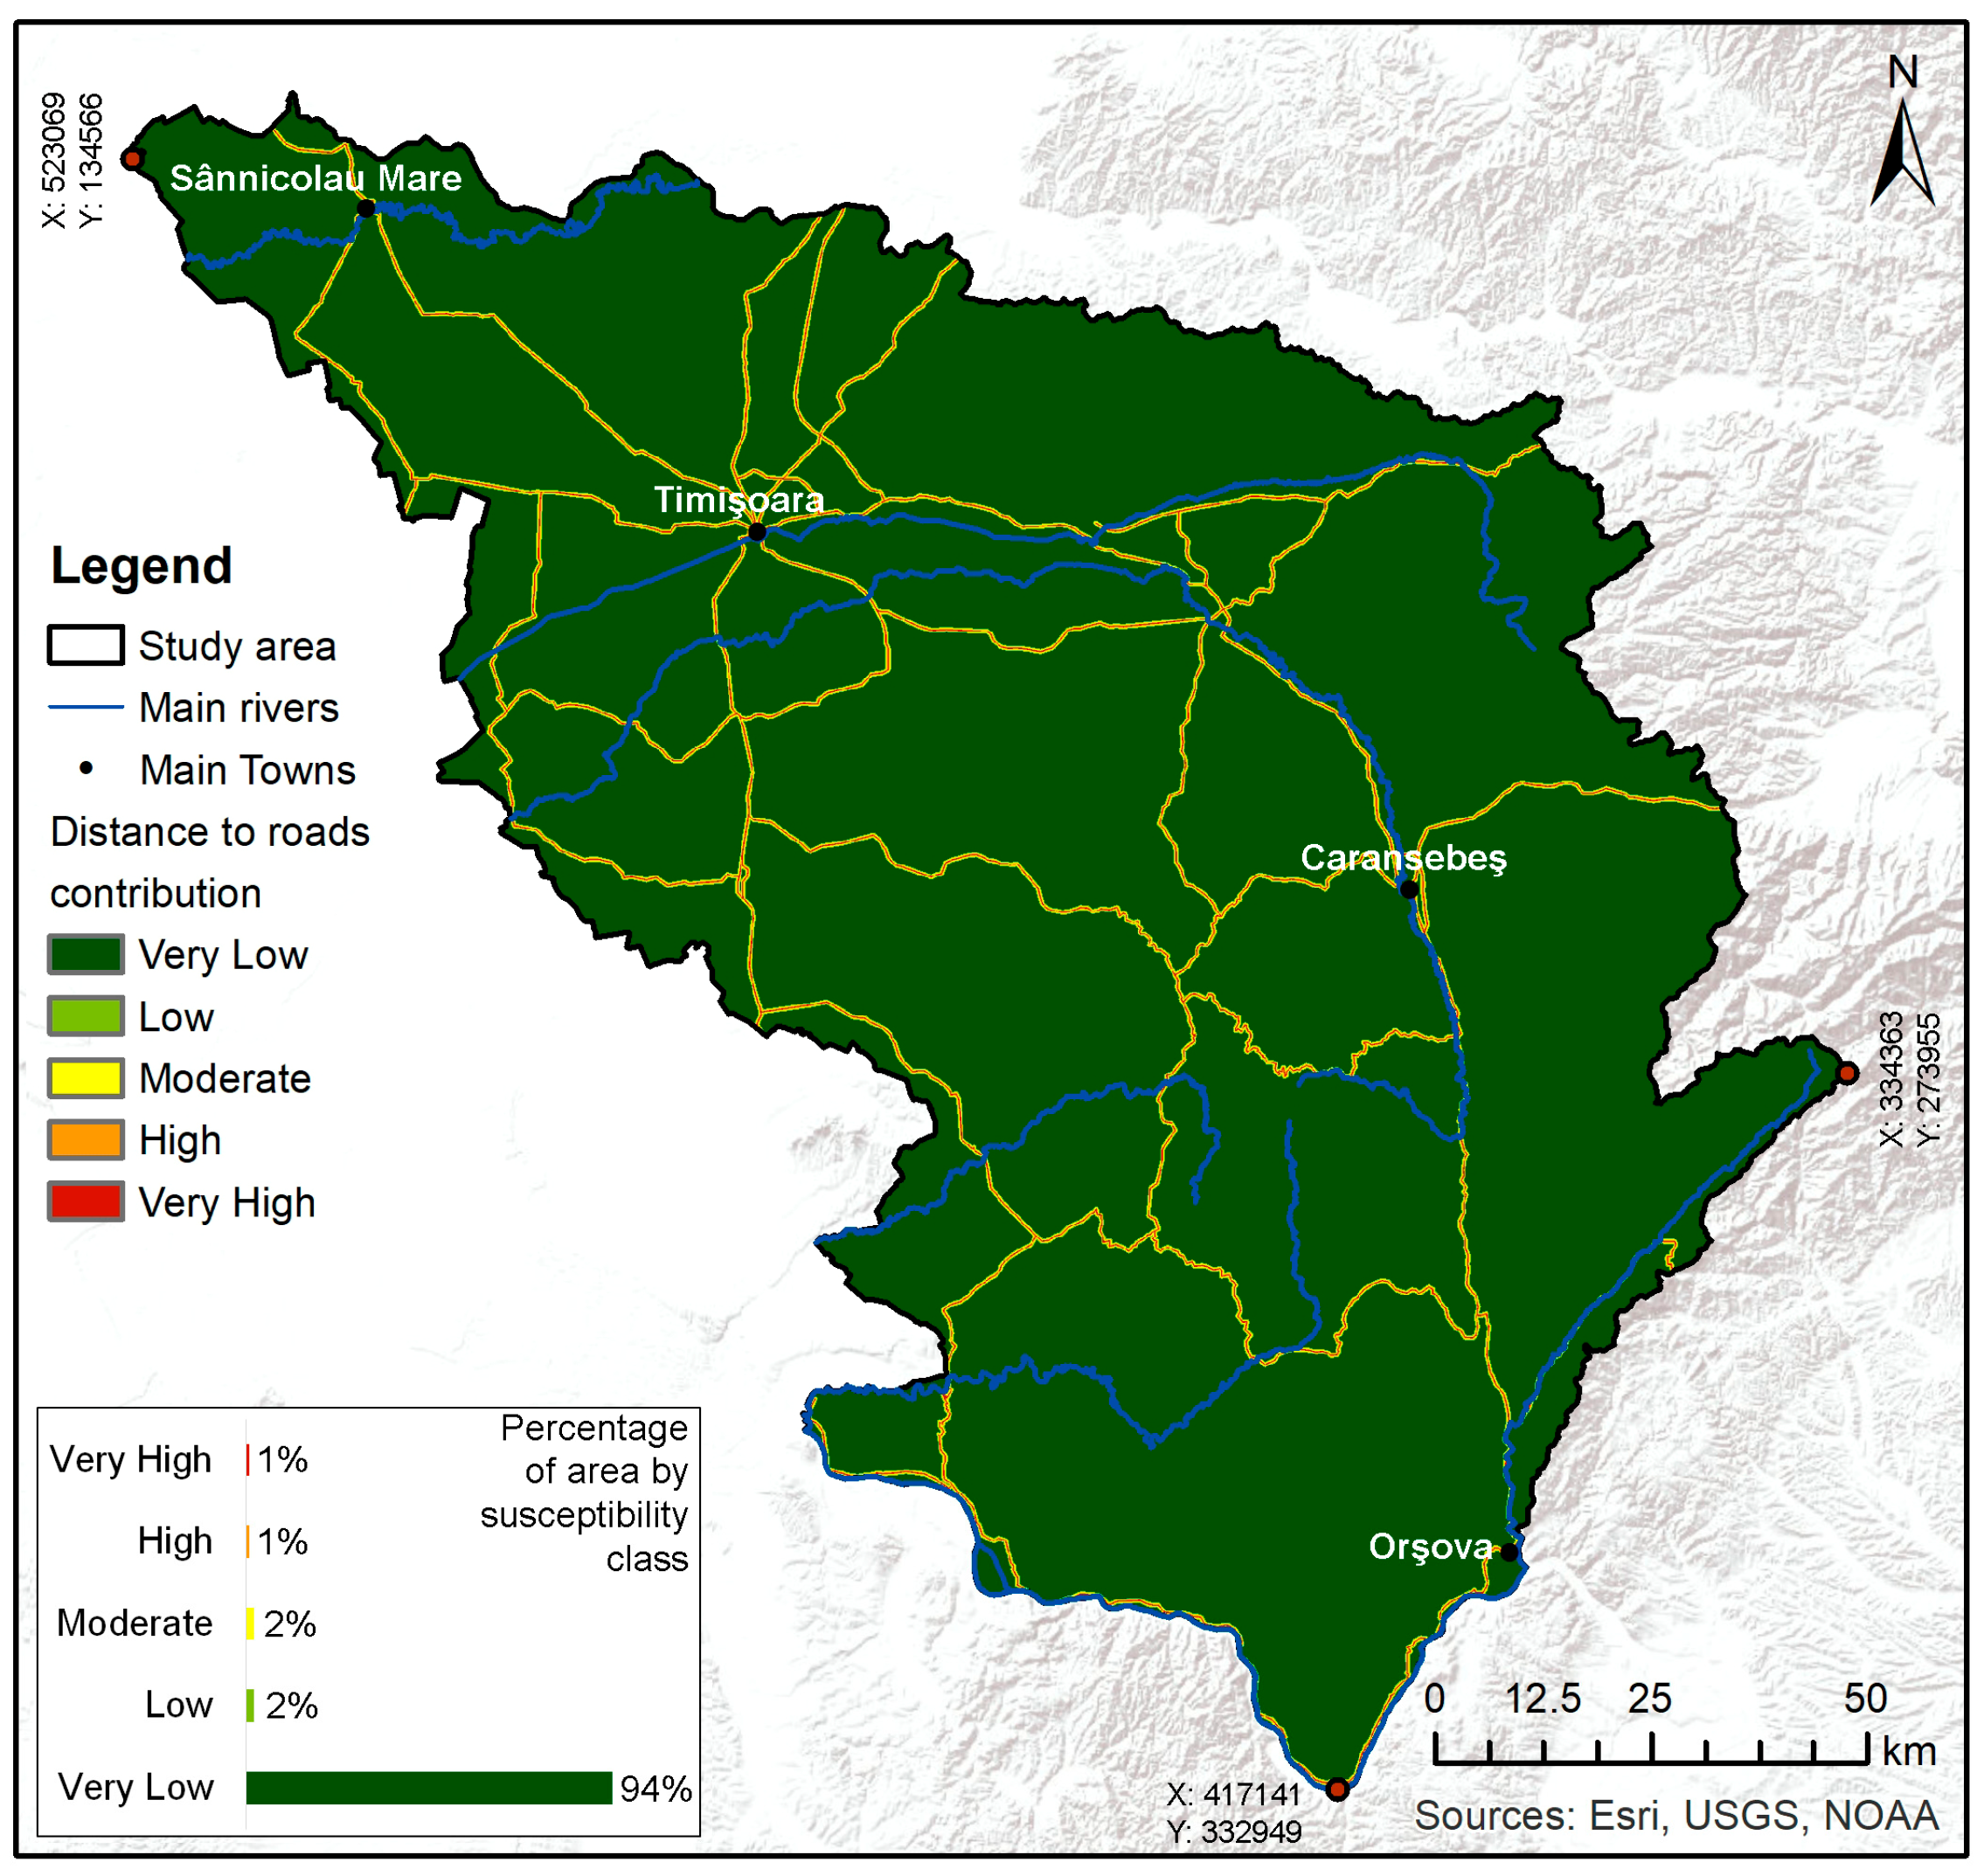
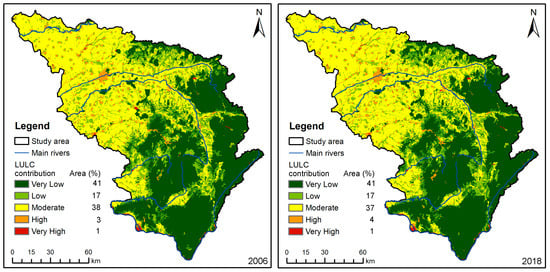
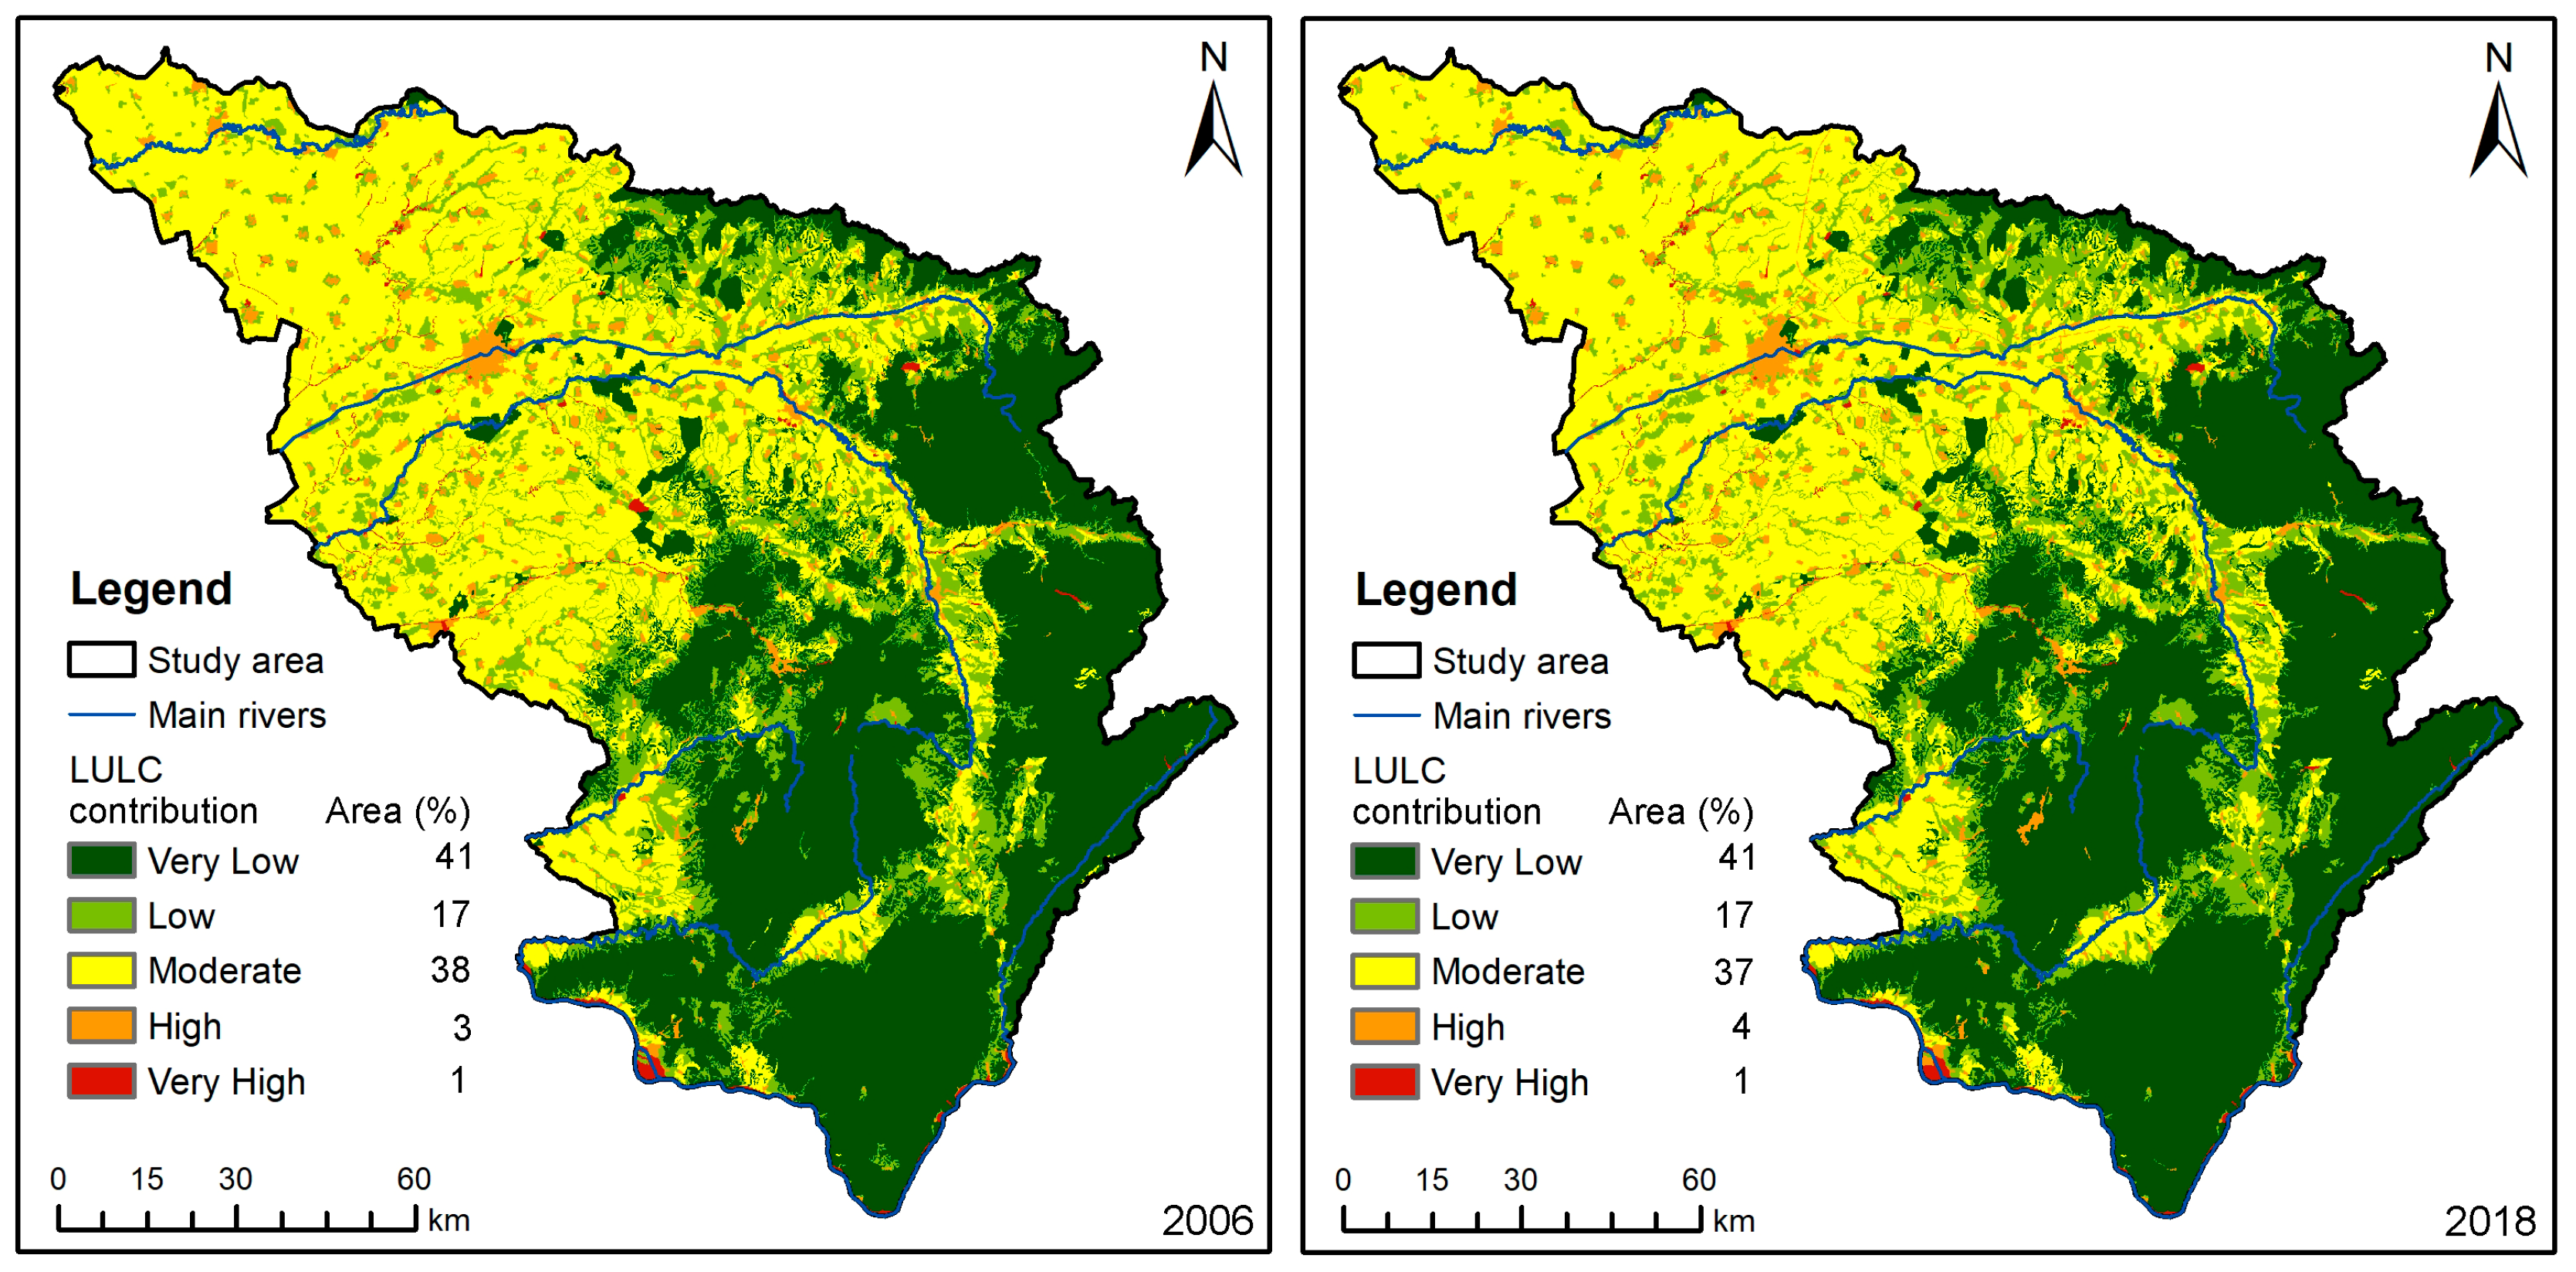
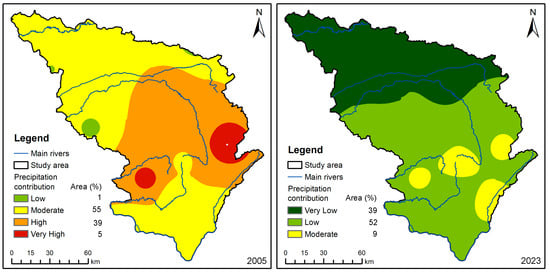
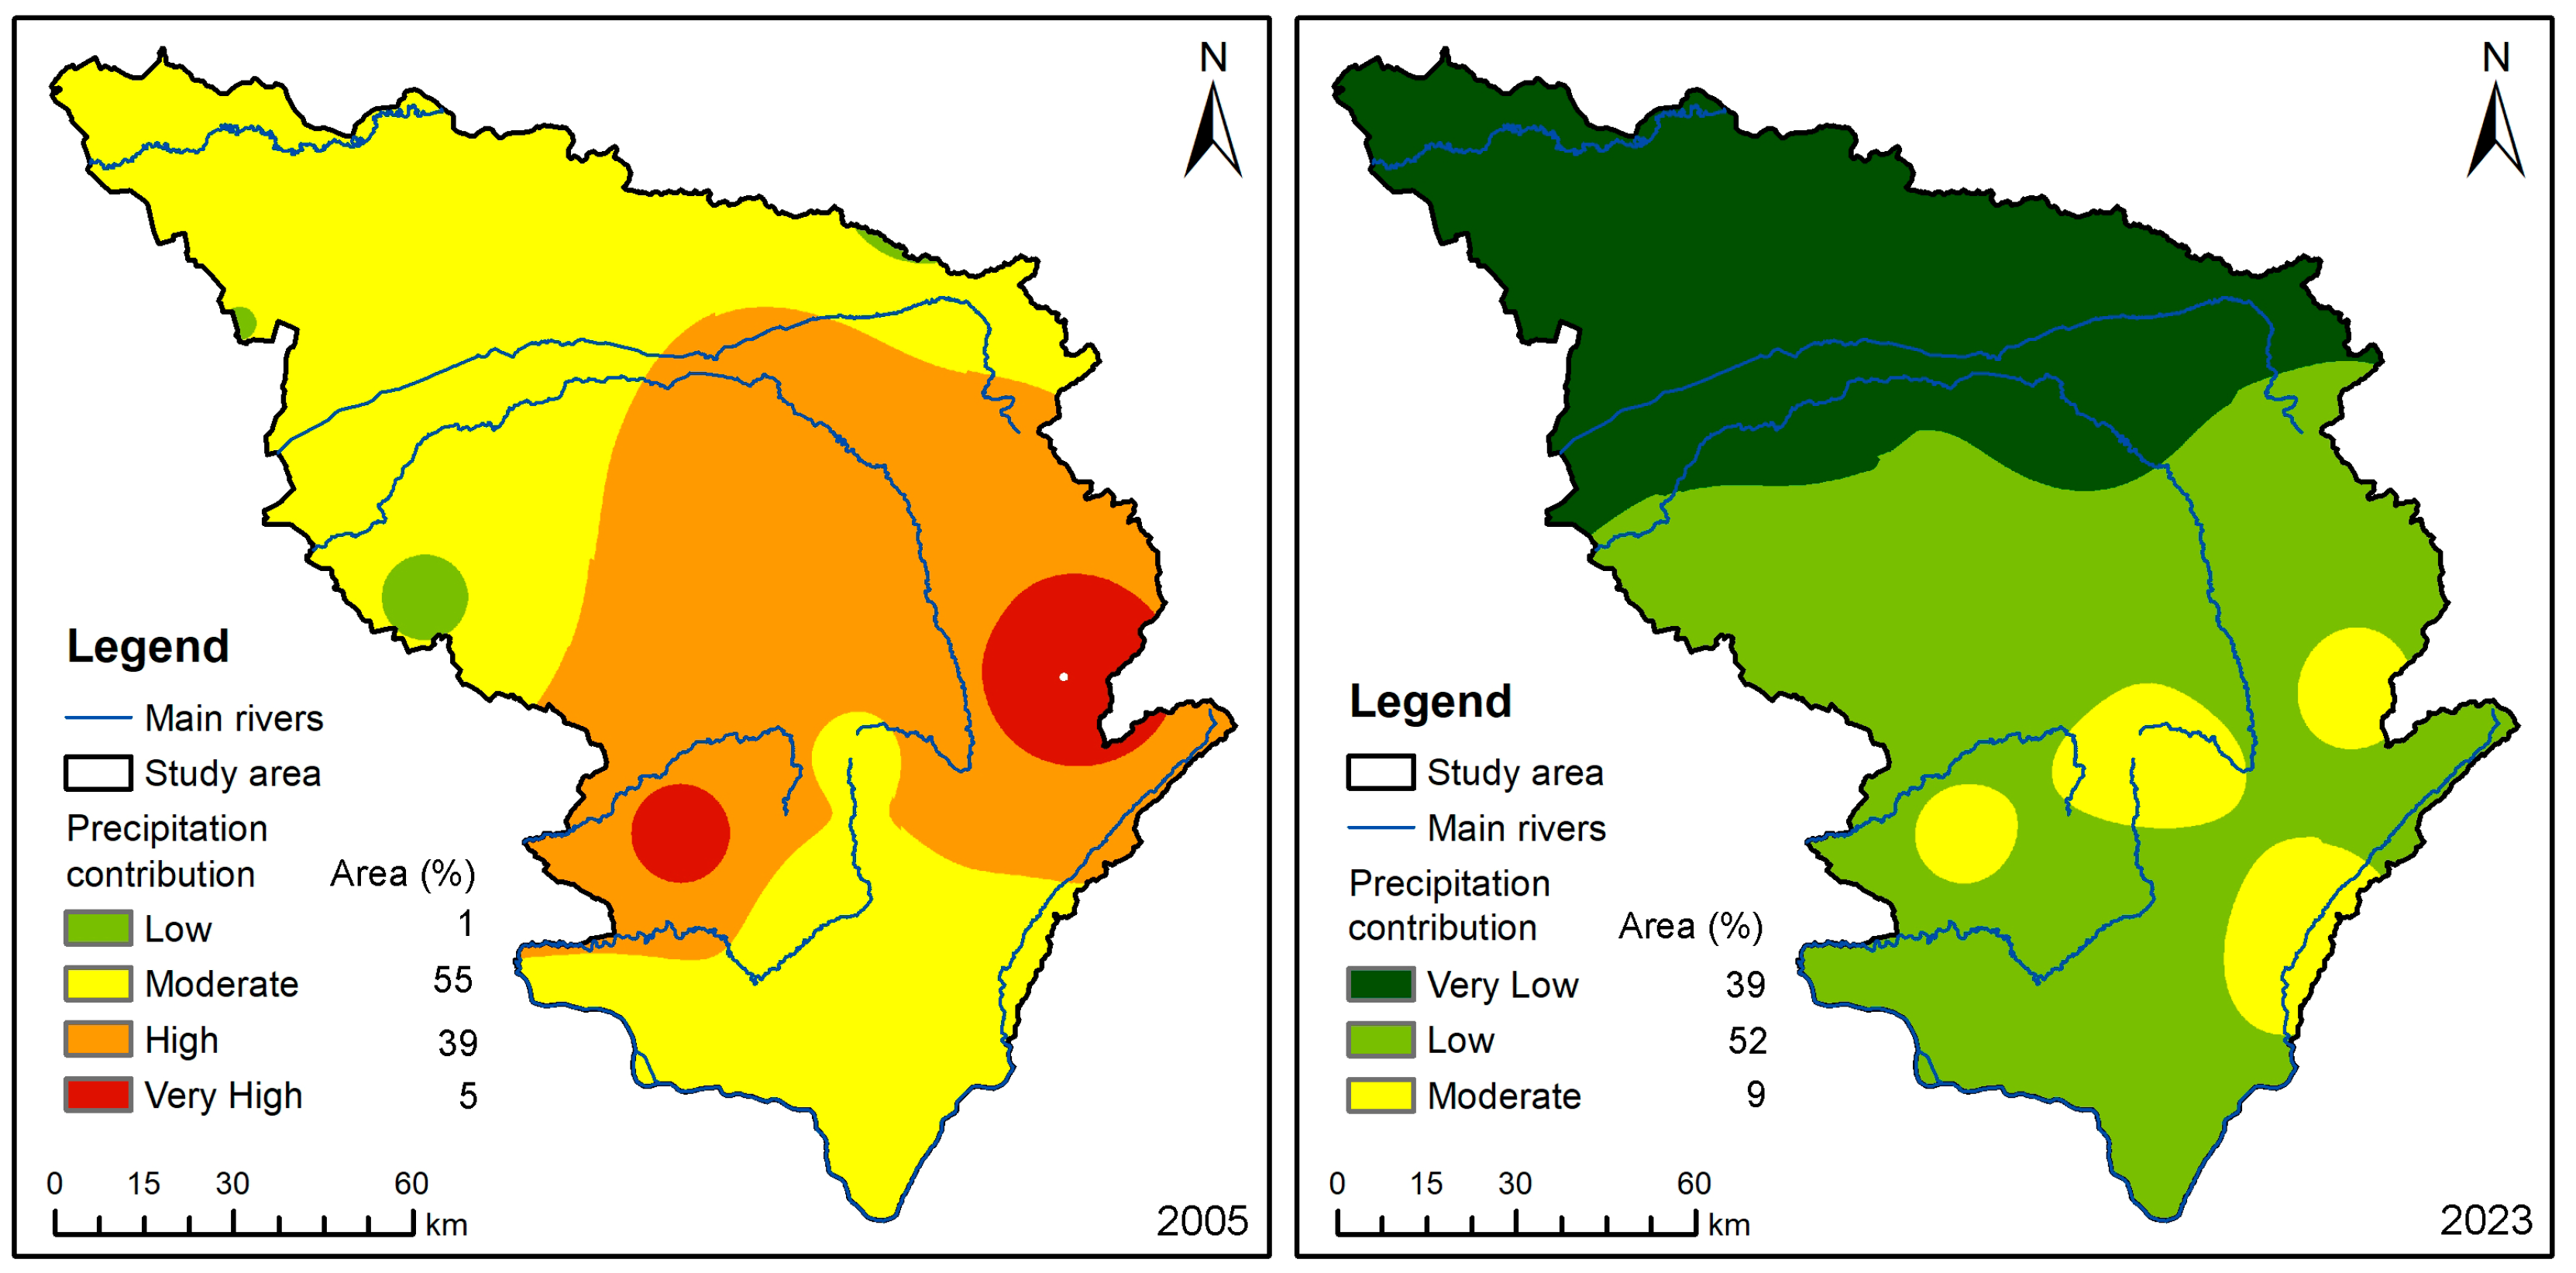
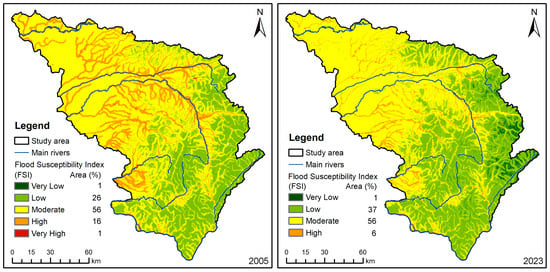
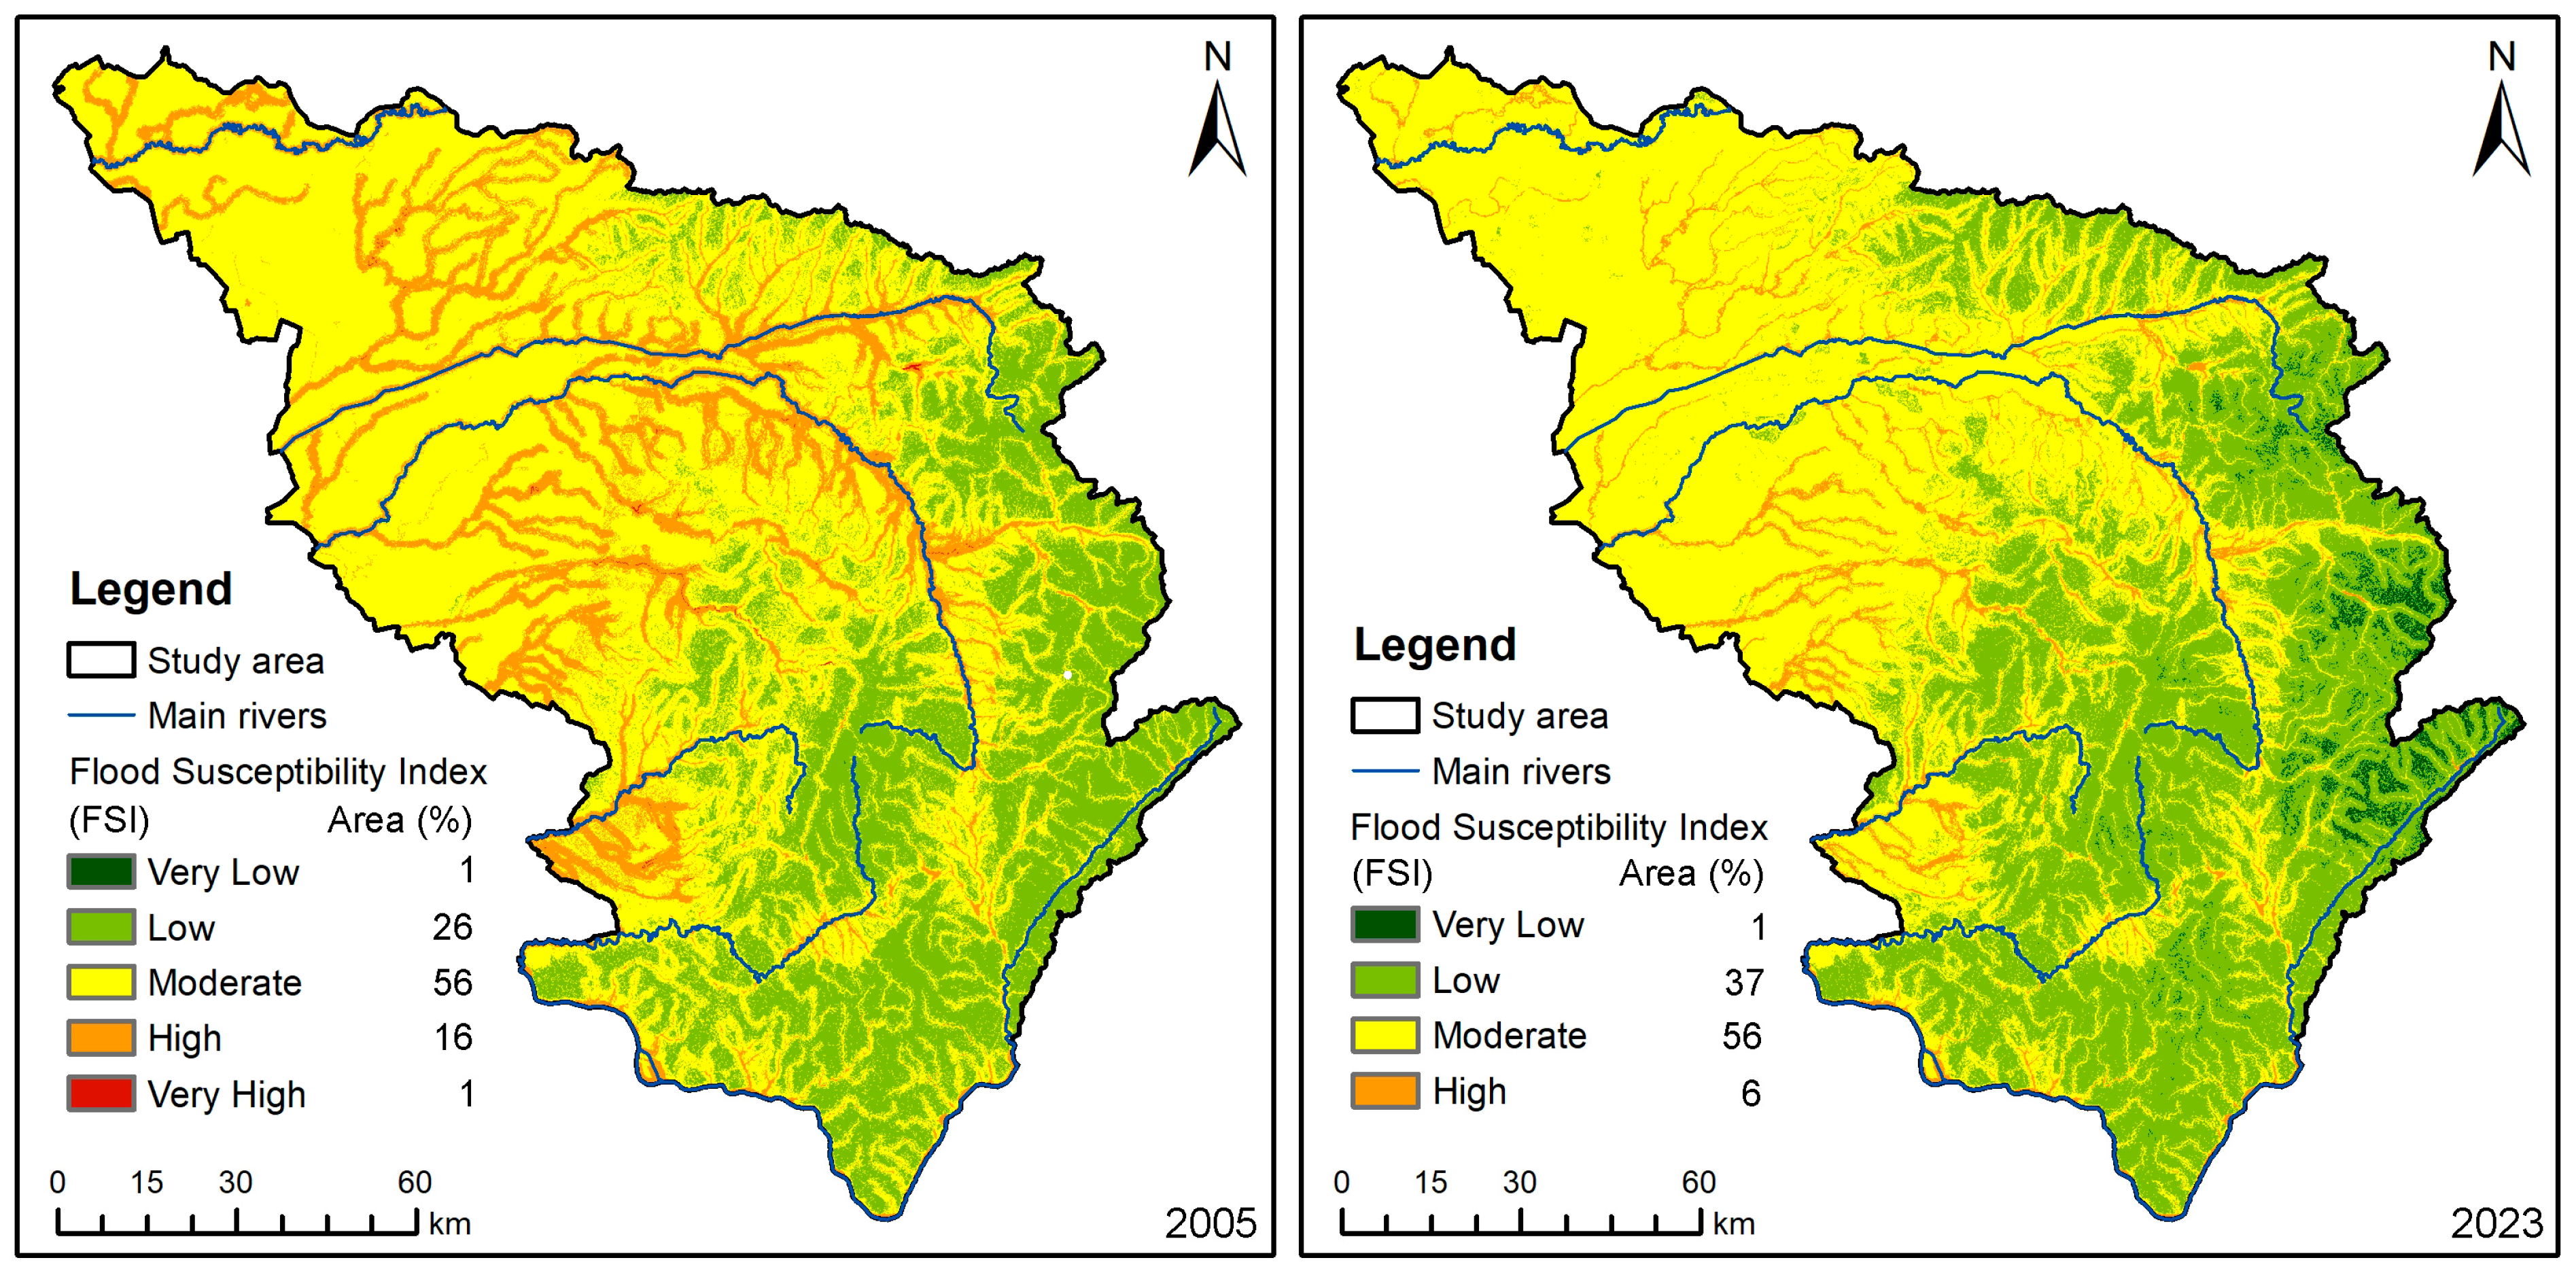
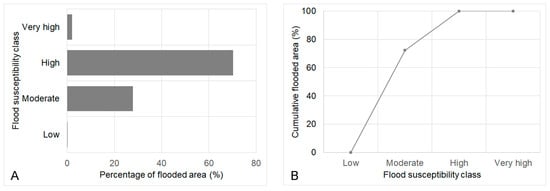
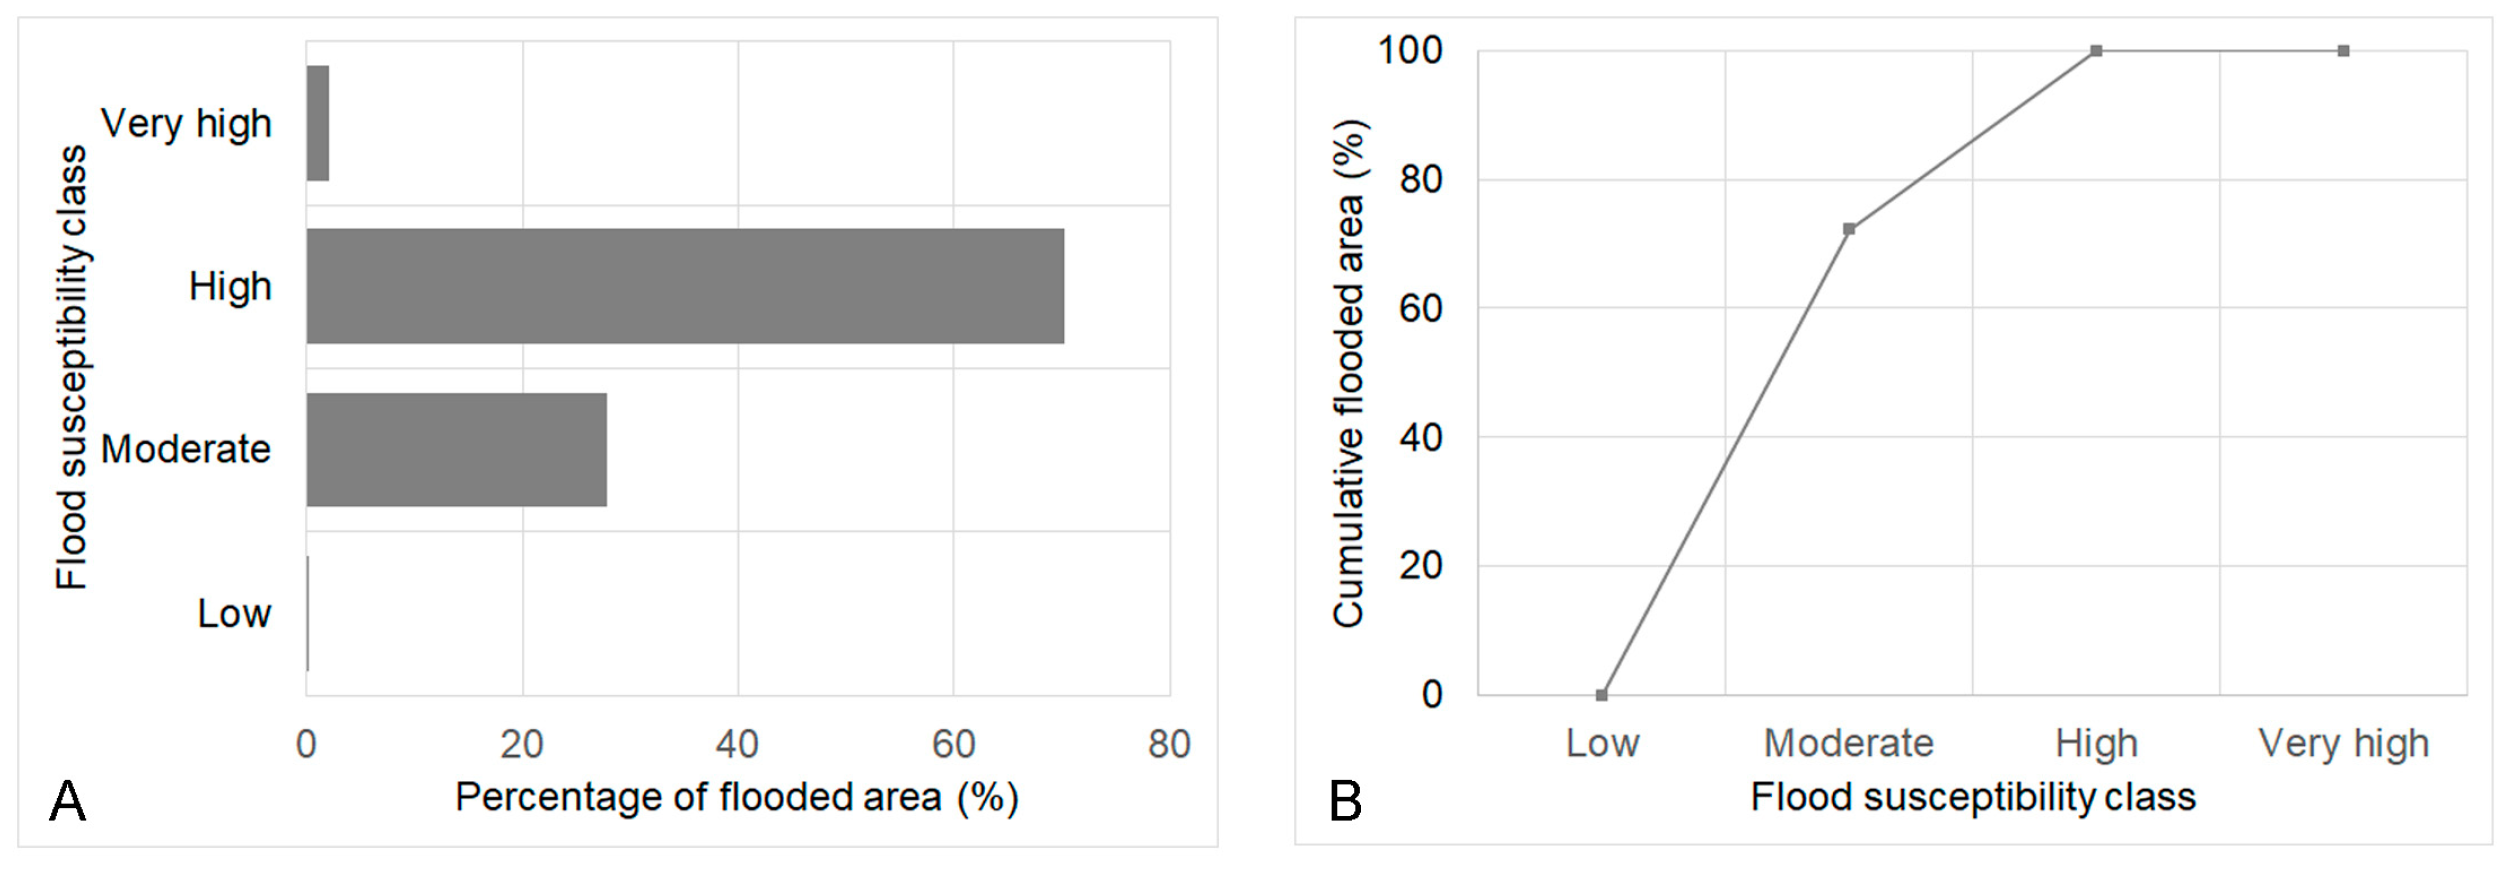
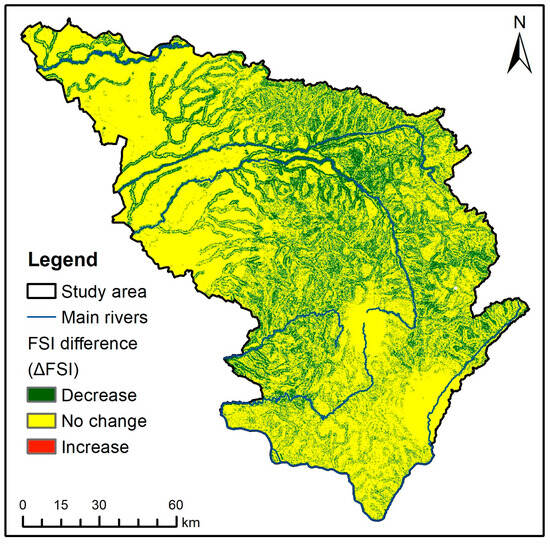
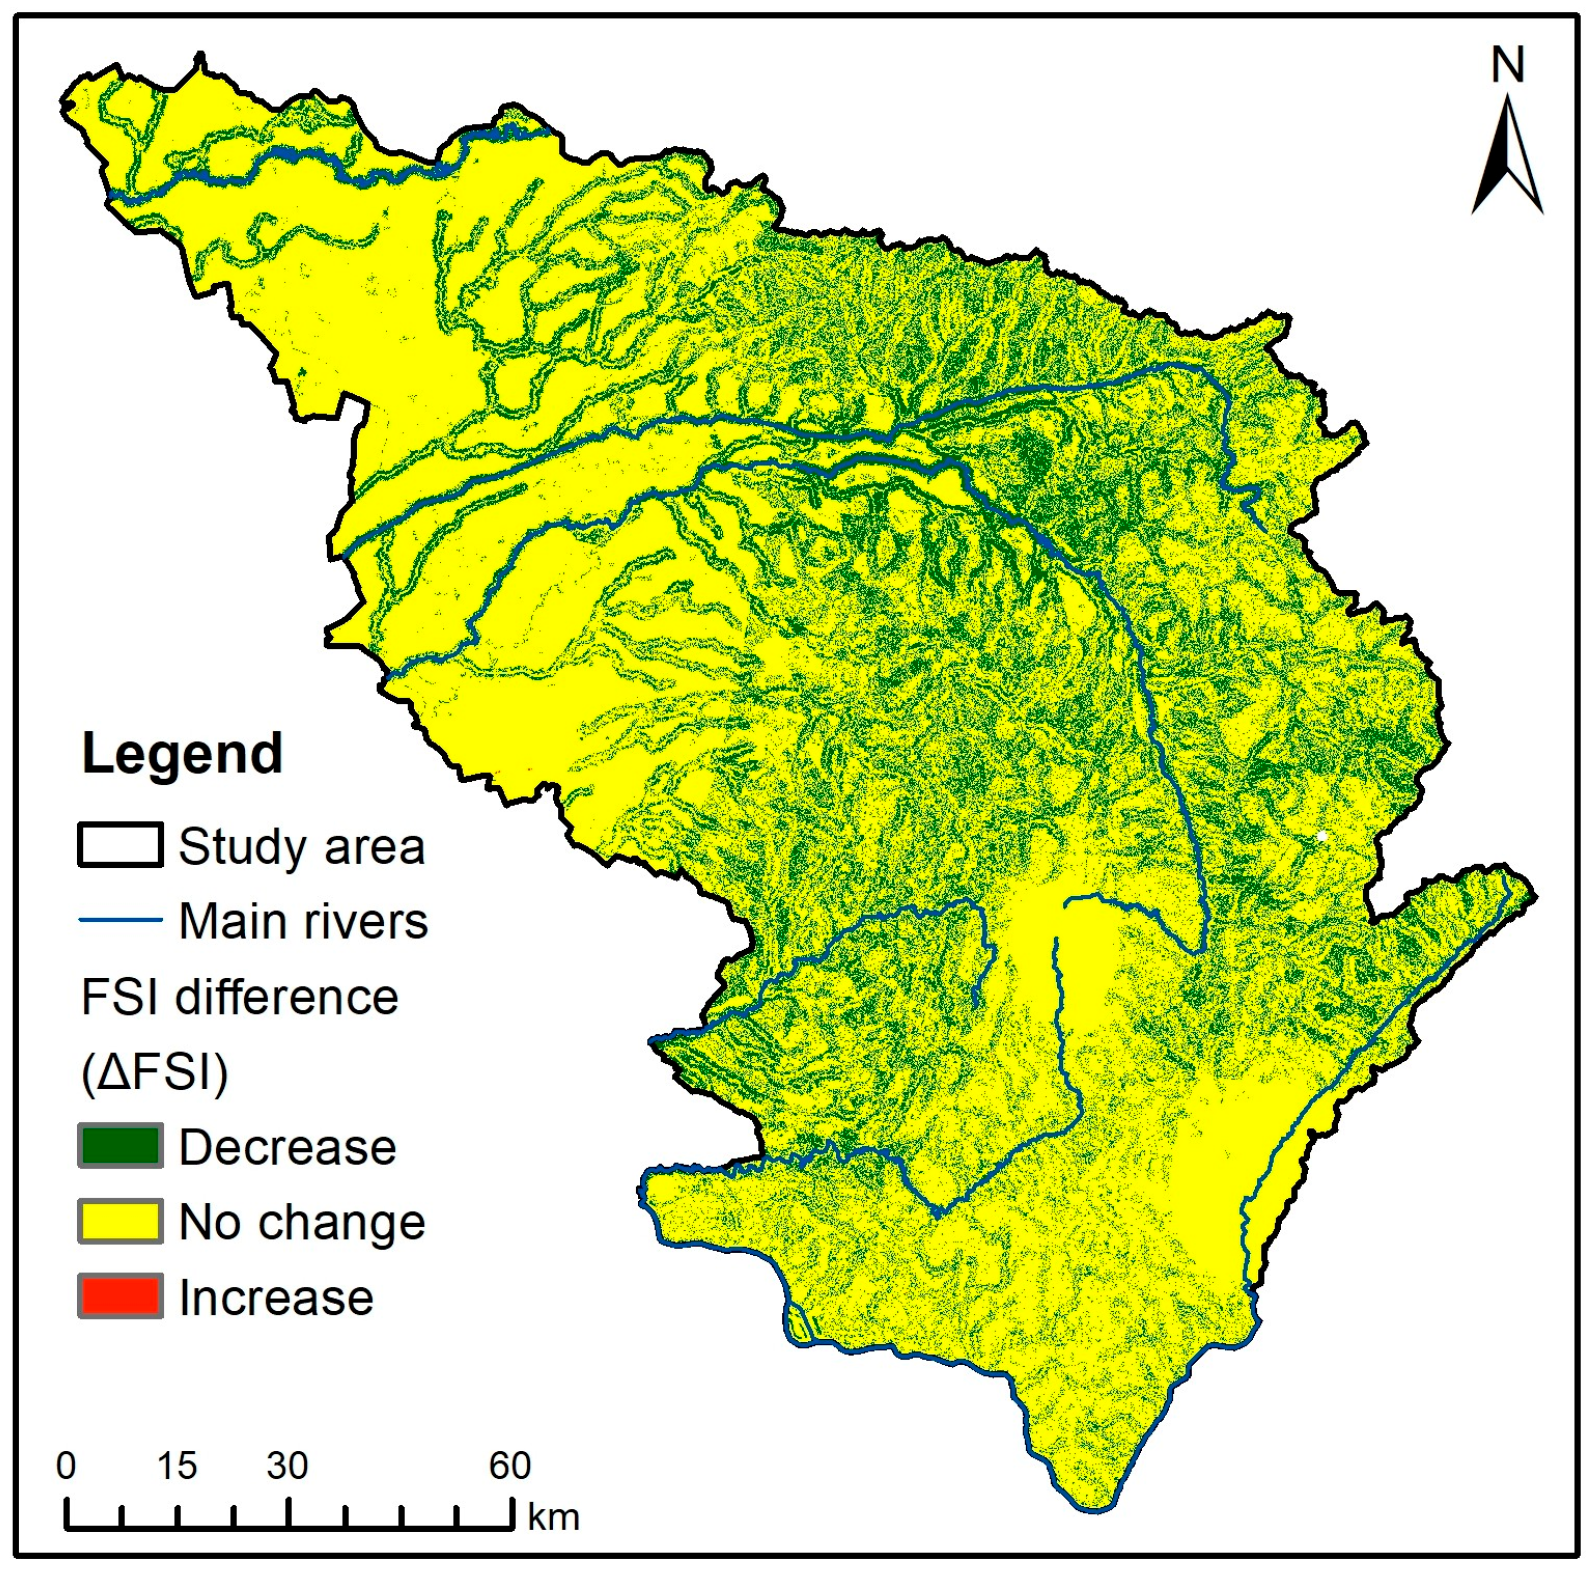

Disclaimer/Publisher’s Note: The statements, opinions and data contained in all publications are solely those of the individual author(s) and contributor(s) and not of MDPI and/or the editor(s). MDPI and/or the editor(s) disclaim responsibility for any injury to people or property resulting from any ideas, methods, instructions or products referred to in the content. |
© 2026 by the authors. Licensee MDPI, Basel, Switzerland. This article is an open access article distributed under the terms and conditions of the Creative Commons Attribution (CC BY) license.