Article

Spatial Disparities and Demographic Vulnerability of Small Settlements in Serbia: A Typological Framework for Place-Based Territorial Governance

by
Dragica Gatarić
1,
Bojan Đerčan
2,*,
Milka Bubalo Živković
2,
Snežana Vujadinović
1,
Neda Živak
3,
Dragica Delić
3,
Miloš Lutovac
4 and
Milena Lutovac Đaković
5
1
Faculty of Geography, University of Belgrade, 11000 Belgrade, Serbia
2
Department of Geography, Tourism and Hotel Management, Faculty of Sciences, University of Novi Sad, 21000 Novi Sad, Serbia
3
Faculty of Natural Sciences and Mathematics, University of Banja Luka, 78000 Banja Luka, Bosnia and Herzegovina
4
Department of Business and Information Studies, Belgrade Business and Arts Academy of Applied Studies, 11000 Belgrade, Serbia
5
Faculty of Economics, University of Belgrade, 11000 Belgrade, Serbia
*
Author to whom correspondence should be addressed.
Land 2026, 15(5), 723; https://doi.org/10.3390/land15050723
Submission received: 25 March 2026 / Revised: 18 April 2026 / Accepted: 22 April 2026 / Published: 24 April 2026

Abstract

Small settlements in Serbia are confronted with long-term processes of depopulation, ageing, and migration, characterised by pronounced spatial and structural heterogeneity. This raises questions about the effectiveness of uniform development policies and underscores the need for a differentiated, place-based approach. The aim of this paper is to identify the demographic heterogeneity of small settlements (with fewer than 100 inhabitants) and to analyse its implications for decentralised territorial development. The research is based on the analysis of 1302 settlements in Serbia, using 26 demographic, socio-economic, and geographical indicators. The methodological framework is based on principal component analysis and cluster analysis, complemented by nonparametric tests and logistic regression. The results indicate pronounced population ageing, low labour potential, and a clear spatial polarisation between accessible and peripheral settlements. Four clearly differentiated types of small settlements are identified. It is concluded that demographic heterogeneity represents a key determinant of development capacity, indicating the need for territorially sensitive and differentiated development policies. In this context, decentralisation and tailored development models may contribute to the revitalisation and long-term sustainability of rural areas.

1. Introduction

Settlement systems in Europe are increasingly characterised by pronounced demographic and territorial polarisation, in which small and peripheral settlements have been experiencing long-term population decline, functional erosion, and a reduction in development capacities [1]. These processes are particularly evident in semi-peripheral and post-socialist countries, where structural economic transformation, the centralisation of development, and unfavourable demographic trends have further deepened spatial inequalities. Serbia represents a typical example of these processes, as in recent decades it has faced continuous depopulation, population ageing, and the concentration of economic and administrative functions in urban centres. Consequently, small and peripheral settlements are becoming increasingly marginalised, with reduced access to public services and weakened local development capacities, which, in the long term, threaten the sustainability of the settlement system and deepen territorial inequalities.
In this context, the settlement system in Serbia is characterised by pronounced heterogeneity resulting from the interaction of historical development patterns, morphological conditions, socio-economic differentiation, and cultural factors [2,3]. This has led to a highly diverse settlement structure, ranging from functionally integrated local centres to extremely small and demographically fragile settlements with limited or completely lost basic functions. In this paper, demographic heterogeneity is defined as differences among settlements in age structure, migration patterns, educational attainment, and economic characteristics of the population, which directly affect local development potential and the accessibility of public services. Small settlements are defined as those with fewer than 100 inhabitants, according to the classification of the Statistical Office of the Republic of Serbia (SORS), while the term “dwarf settlements” is also used in the literature to emphasise their pronounced demographic and functional vulnerability [3].
Long-term processes of depopulation and fragmentation of the settlement network in Serbia, combined with negative demographic and economic trends, represent a serious threat to the sustainable development of the settlement system [4,5,6,7]. These changes are spatially differentiated and are often assessed as economically irrational and developmentally undesirable [8], resulting in two dominant tendencies: demographic growth in urban and suburban areas and continuous decline in rural communities. Consequently, spatial polarisation emerges, whereby certain areas are favoured while others are marginalised and peripheralised, producing broader socio-economic and spatial consequences.
The complexity of challenges faced by rural communities in Serbia is reflected in stagnation, declining vitality, spatial and functional degradation, isolation, and reduced accessibility to key public services [4,9]. In this sense, depopulation does not represent a solely demographic phenomenon, but also a deeper socio-economic transformation involving the weakening of institutions, labour markets, and local social structures [10]. In the broader European context, depopulation and rural decline are widespread processes, particularly in the southern, central, and eastern parts of the continent [11,12,13,14,15,16,17]. These processes are not limited to less developed countries but also occur in highly developed states such as the Netherlands, where the consequences of long-term centralisation of public services and economic activities are particularly pronounced [18,19].
In the context of these trends, many European countries express serious concern about the potential loss of national identity and the need for immigration to secure a sustainable labour force [20,21,22,23], although without expecting population levels to return to earlier values [24,25]. Accordingly, policies aimed at mitigating or managing rural depopulation are receiving increasing attention from scholars and policymakers [15,26].
At the policy level, depopulation is increasingly recognised as a structural challenge by international organisations such as the OECD, the United Nations, and the European Commission due to its long-term implications for territorial cohesion and regional inequalities [26]. United Nations projections indicate that population decline will affect many European countries by 2050, including Serbia [27]. In response to these challenges, increasing attention has been given to decentralisation and development approaches based on local specificities (place-based approaches), aimed at improving governance efficiency and aligning development policies with local conditions [28,29,30,31,32,33]. However, empirical research shows that the effects of decentralisation are not uniform, but depend on institutional capacities and development context, and in some cases may even exacerbate existing inequalities [34,35]. In Serbia, decentralisation is formally established but insufficiently implemented in practice, which limits its contribution to balanced territorial development [4,36,37,38].
Contemporary rural development is characterised by pronounced heterogeneity, encompassing simultaneous processes of stagnation and selective revitalisation. In addition to depopulation and population ageing, rural areas are affected by land abandonment, weakening economic functions, and increased vulnerability to climate risks [39,40]. In response to these challenges, various countries have developed rural revitalisation models based on the mobilisation of endogenous resources and integrated development approaches, such as Japan’s “One Village—One Product”, Thailand’s “One Tambon—One Product”, German initiatives for rural landscape preservation, Korea’s “Saemaul Undong”, and China’s Rural Revitalisation Strategy [41,42,43,44,45,46,47,48,49]. In Serbia, the demographic heterogeneity of small settlements—differences in age structure, migration patterns, and economic capacities—further complicates development processes, as some settlements function as local centres while others lose basic functions and become marginalised. Accordingly, an adapted application of international revitalisation models emerges as a possible response, including support for young families and local entrepreneurship, decentralised governance, and the development of tourism and agriculture [50,51,52,53]. These examples highlight the importance of context-sensitive development policies. Similar trends are observed in Europe through the valorisation of cultural heritage in France, digital and green transitions in Germany, investments in digital infrastructure in Scandinavia, and functional networking of settlements in Poland [54,55,56,57], as well as in Serbia, particularly through rural tourism development and revitalisation projects such as those in the Stara Planina region [3,58,59,60].
Although demographic decline and population ageing in Serbia are relatively well researched [12,18,19,61,62,63,64,65,66], there is still a lack of studies that systematically analyse the demographic heterogeneity of small settlements and their implications for territorial governance and development planning. In particular, there is a shortage of research linking micro-demographic structures with settlement development capacities, applying multivariate and cluster methods at the level of extremely small settlements, and translating demographic patterns into recommendations for place-based and decentralised policies. As a result, the relationship between demographic heterogeneity and differentiated development trajectories of small settlements remains insufficiently operationalised within development policy frameworks.
Research on small settlements in Serbia dates back to the 1970s, when rural sociologists, geographers, and architects first systematically identified their specific structural characteristics. However, long-term depopulation has led to a continuous redefinition of the concept of “small settlements”, with increasing focus on extremely small population units. Contemporary approaches emphasise that settlement classification should not be based solely on population size, but also on indicators such as population density, functional capacity, accessibility of public services, spatial isolation, and economic structure [67,68,69,70]. According to World Bank analyses, such settlements are increasingly losing basic social and economic functions, further deepening their marginalisation within the broader territorial system [71].
Based on the above, the paper poses the following research questions:
RQ1: How does demographic heterogeneity manifest in small settlements in Serbia, and in what ways can the identified patterns contribute to the design of decentralised and territorially differentiated development policies?
RQ2: What are the spatial patterns of distribution of small settlements in the Republic of Serbia, and which regional and local disparities characterise their territorial distribution?
RQ3: What are the key demographic and socio-economic characteristics of small settlements in Serbia, particularly in terms of age structure, migration patterns, educational attainment, and the economic profile of the population?
RQ4: What typological groups of small settlements can be identified on the basis of their demographic and developmental structure through the application of hierarchical cluster analysis?
RQ5: What implications do the identified types of small settlements have for the formulation of decentralised and place-based development policies aimed at the revitalisation of rural areas?

2. Materials and Methods

2.1. Study Area and Data

The research was conducted in small settlements within the Republic of Serbia. The analysed settlements are located across 92 administrative units and cover a total area of 14,859 km2. The study encompassed all settlements with fewer than 100 inhabitants, as defined by the SORS classification [3]. In the final analysis, 24 settlements without permanent residents were excluded. The selection of the study area is based on its representativeness for the dominant demographic and territorial development processes in Serbia, particularly within the context of decentralised territorial development. The observed small settlements provide an appropriate analytical framework for examining the impact of demographic heterogeneity on development capacities, service accessibility, and models of local governance. The empirical data used in the study refer to 2022, complemented by additional contextual data from the SORS database and spatial planning documentation.
In developing a typology of small settlements in Serbia, particular importance is placed on selecting variables that objectively and comprehensively reflect the structure, functions, and processes shaping the diversification of rural areas. In line with available data from the SORS [72], including final census publications and electronic databases accessible on its official website, a set of 26 indicators was used for the analysis, encompassing demographic, socio-economic, educational, and spatial–topographical variables. To ensure full transparency and reproducibility, the list of indicators, along with their operational definitions, units of measurement, and data sources, is presented in Appendix A (Table A1).

2.2. Procedure

Data on small settlements were systematised and statistically analysed using R 4.3.2. In the first stage, descriptive statistical analysis was conducted for all indicators. Subsequently, principal component analysis (PCA) was applied in order to reduce dimensionality and identify latent patterns of settlement differentiation. Prior to conducting PCA, the suitability of the data for factor reduction was assessed using the Kaiser–Meyer–Olkin (KMO) measure of sampling adequacy and Bartlett’s test of sphericity, whereby a statistically significant Bartlett test confirms that the correlation matrix differs from an identity matrix and that intercorrelations among indicators are sufficient for the application of PCA [73,74]. Variables were standardised (z-scores) beforehand to eliminate the influence of differing measurement scales. Following component extraction, Varimax rotation was applied to facilitate clearer interpretation of the loading structure and more precise definition of the extracted dimensions, with components interpreted on the basis of indicators exhibiting the highest loadings [73,75].
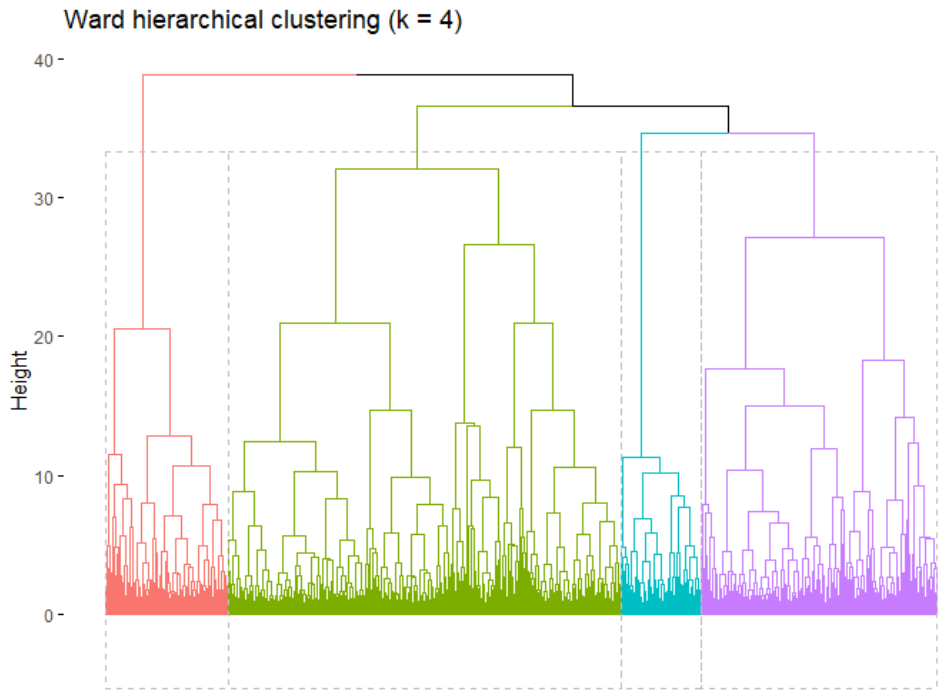
The typology of small settlements was derived through hierarchical cluster analysis (agglomerative approach). Scores on seven rotated components (Varimax) were used as input for clustering, thereby ensuring that clusters were formed on the basis of key latent dimensions while reducing multicollinearity among the original indicators. Distances between settlements were calculated using the Euclidean metric, and grouping was performed through Ward’s minimum variance method (Ward.D2). The number of clusters was determined through a combination of interpretability and internal validation. The average silhouette width was calculated for k = 2–8, with the maximum at k = 4 (0.138); accordingly, k = 4 was selected as the final solution. The dendrogram and silhouette analysis results are presented in Appendix A (Figure A1 and Table A2). Four types of small settlements were identified (Clusters 1–4), comprising 192, 615, 370, and 125 settlements, respectively.
To statistically confirm that the clusters differed according to key demographic, socio-economic, and spatial indicators, the Kruskal–Wallis test was used as a nonparametric alternative to the one-way ANOVA. Following the confirmation of overall statistical significance, Dunn’s post hoc test with Bonferroni correction was conducted to identify pairs of clusters exhibiting statistically significant differences [76]. In addition to demographic and spatial indicators, selected socio-economic variables were also included in the testing procedure, as proxies of the developmental capacity of small settlements, reflecting labour market conditions, human capital, and functional connectivity with urban centres (share of employed persons, share of highly educated population, and share of daily commuters).
To identify settlements experiencing pronounced demographic decline, the dependent variable in the logistic regression model was operationalised as an indicator of high demographic risk (high_risk) [77]. The population change index for 2022/2002 was used, defined as the percentage change in population from 2002 to 2022. Settlements were classified as high-risk (high_risk = 1) if population decline amounted to 50% or more (i.e., index < −50), while all remaining settlements were classified as lower risk (high_risk = 0). The 50% threshold was selected as a demographically meaningful criterion for severe shrinkage, as it denotes long-term, structural decline that exceeds ordinary fluctuations and carries direct implications for settlement sustainability. To test the sensitivity of findings to threshold selection, the model was re-estimated using alternative cut-off points of <−40 and <−60, with key results remaining stable (Appendix A, Table A3). Logistic regression results are presented as odds ratios (OR) with 95% confidence intervals, along with standard indicators of model fit and discrimination.
For spatial analysis and cartographic visualisation, ArcGIS Pro 3.2 and Microsoft Excel were utilised.

3. Results

3.1. Spatial Distribution of Small Settlements

According to the 2022 Census results, of the Republic of Serbia’s 4709 settlements, nearly one in four falls into the small settlement category. These settlements occupy almost one-fifth of the national territory, yet they account for only 55,444 inhabitants, representing merely 0.8% of Serbia’s total population. The average settlement size is 43 inhabitants.
The analysis reveals pronounced regional disparities in the spatial distribution of small settlements across the Republic of Serbia. At the statistical region level (Table 1), no small settlements are recorded in the Belgrade Region. In contrast, the Region of Southern and Eastern Serbia represents the core area of concentration, with 819 settlements (62.9%) that accommodate more than half of its total population (55.5%). The Region of Šumadija and Western Serbia includes 460 small settlements (35.3%), accounting for approximately 42% of the population of such settlements, whereas their presence in the Vojvodina Region is marginal—only 23 settlements (1.8%)—comprising 2.5% of the total population of small settlements [3].
At the level of local self-government (Figure 1), small settlements were identified in 92 of the 168 municipalities and cities in Serbia, indicating a widespread yet uneven distribution. A pronounced concentration is evident: nearly two-thirds of all small settlements are located within just 20 municipalities and cities. The highest numbers were recorded in Kuršumlija (75 settlements), Sjenica (65), Prokuplje (61), Knjaževac (58), Novi Pazar (52), and Vranje (51 settlements). These areas represent typical examples of regions characterised by long-term processes of depopulation and demographic ageing. At the same time, in certain municipalities such as Vrbas, Beočin, Čoka, Sečanj, Bor, Vrnjačka Banja, Lajkovac, Varvarin, Krupanj, Merošina, Paraćin, and Lučani, only a single small settlement has been recorded, indicating markedly heterogeneous local spatial patterns.
Spatial disparities and varying levels of demographic vulnerability are further illuminated by classifying settlements by population size, which provides the basis for their typological differentiation. According to this classification, small settlements are divided into three groups: those with 20 or fewer inhabitants, 21–50 inhabitants, and 51–100 inhabitants. The largest number of settlements with 20 or fewer inhabitants is concentrated in the Region of Southern and Eastern Serbia (302), whereas their number in the Region of Šumadija and Western Serbia is three times lower (96), indicating a more pronounced process of demographic erosion in the former region. In the Region of Southern and Eastern Serbia, the numbers of settlements with 21–50 and 51–100 inhabitants are broadly similar (260 and 257, respectively), whereas in the Region of Šumadija and Western Serbia and in the Region of Vojvodina, settlements with 51–100 inhabitants predominate (Figure 1), suggesting a relatively more favourable demographic structure of small settlements in these areas [3].

3.2. Descriptive Statistical Profile of Small Settlements

Following the spatial analysis, a statistical analysis of the selected indicators was conducted. Table 2 presents the basic descriptive characteristics of the analysed indicators for 1302 small settlements in Serbia. Given the presence of skewed distributions and extreme values in several variables, the mean and standard deviation are complemented by the median and the first and third quartiles as more robust measures of central tendency and dispersion.
The descriptive statistics show that the analysed settlements are predominantly small, remote, and demographically fragile. The median settlement size is only 38 inhabitants, located at a median elevation of 670 m and 16 km from the municipal centre. Demographic decline is severe, as the median population index (2022/2002) is 61.0, indicating that a typical settlement has lost more than half of its population over two decades. Ageing is particularly pronounced: the median share of children aged 0–14 is only 4.35%, while the share of the population aged 65+ reaches 41.1%, with a median age of 56.8 years and an ageing index of 400. Economic indicators are equally unfavourable, with low employment (13.3%) and a modest share of the economically active population (20.8%). The educational structure is weak, as the median share of highly educated residents is only 3.14%. At the same time, considerable internal heterogeneity is visible in daily commuting patterns and the degree of agrarian orientation.

3.3. Dimensionality Reduction and PCA Results

Given that the analysed dataset comprises a large number of interrelated demographic, socio-economic, educational, and spatial–topographic indicators, the individual interpretation of each variable does not allow for a clear identification of the dominant patterns of differentiation among small settlements. Due to the expected intercorrelations, PCA was used as a dimensionality reduction technique. The suitability of the dataset for PCA was assessed using the Kaiser–Meyer–Olkin (KMO) measure of sampling adequacy and Bartlett’s test of sphericity. The overall KMO value was 0.85, indicating a high level of adequacy of the correlation structure for dimensionality reduction. Bartlett’s test of sphericity was statistically significant (χ2(325) = 38,613.78; p < 0.001), leading to the rejection of the null hypothesis of an identity correlation matrix and confirming that intercorrelations among the indicators are sufficient to justify the application of PCA.
Following the standardisation of the 26 indicators, a PCA was conducted to identify the key latent dimensions that differentiate small settlements. To obtain stable and interpretable component scores for subsequent cluster analysis, seven principal components were retained. Cumulatively, the first seven components explain 65.76% of the total variance, indicating that the majority of the information contained in the original set of variables can be effectively summarised into a smaller number of dimensions without substantial information loss. The structure matrix of the 26 indicators and the extracted components after Varimax rotation is presented below (Table 3).
The results of the PCA indicate that the variability of small settlements can be summarised through several clearly identifiable latent dimensions. Component 1 (Demographic ageing and the burden of age dependency) is most strongly determined by the share of the population aged 65+ (0.863), the old-age dependency ratio (0.826), the total dependency ratio (0.830), the share of elderly households (0.831), as well as the proportion of pensioners (0.762) and the average age (0.726), which is characteristic of settlements experiencing advanced ageing and a high share of dependent population. Component 2 (Labour potential and economic activity) is primarily defined by the share of employed persons (0.824) and the proportion of the economically active population (0.756), with a moderate contribution from daily commuters (0.312) and settlement size (0.289), thereby distinguishing settlements with a relatively more functional labour base. Component 3 (Young population and reproductive potential) is most strongly associated with the share of children aged 0–14 (0.897) and the youth dependency ratio (0.893), along with the share of the fertile population (0.498), thus describing demographically more vital settlements and representing the opposite pole to the ageing dimension. Within the domain of migration profiles, Component 6 (Migration structure: in-migrants vs. autochthonous population) is most strongly defined by opposing loadings of the share of in-migrants (0.720) and the share of the autochthonous population (−0.769), differentiating settlements with more pronounced in-migration from those dominated by locally rooted populations. Finally, Component 7 (Spatial peripherality and rurality) is most strongly associated with distance from the municipal centre (0.686), elevation (0.590), and the share of the agricultural population (0.627), indicating mountainous, spatially isolated, and more agrarian settlements. Overall, the extracted components delineate the key axes of differentiation—ageing, labour potential, demographic vitality, migration profile, and spatial peripherality—and provide a robust basis for further typologisation of small settlements through cluster analysis.

3.4. Typology of Small Settlements: Cluster Analysis

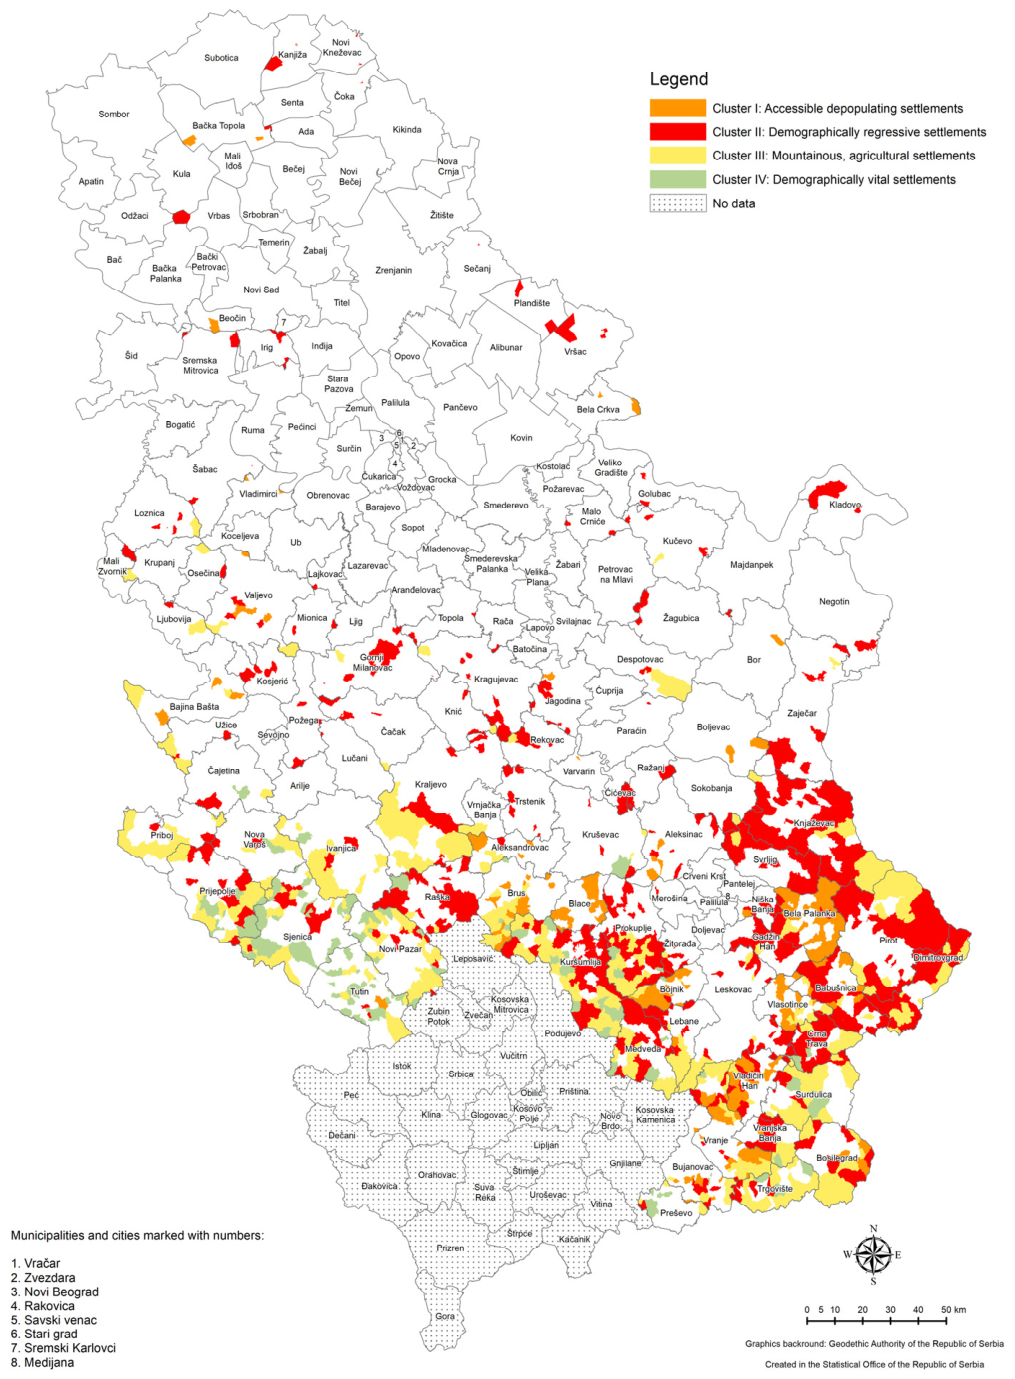
Subsequently, based on the obtained component scores, cluster analysis was conducted. The results of the cluster analysis indicate that small settlements can be grouped into four clearly differentiated clusters, which differ in terms of demographic structure, economic potential, migration profile, and spatial–topographic characteristics, as well as their territorial concentration within specific municipalities (Figure 2).
The first cluster includes 192 settlements (14.7% of all small settlements), concentrated mainly in Bela Palanka, Blace, Vranje, Bojnik, Vladičin Han and Vlasotince. It is characterised by severe demographic ageing, with a median share of 42.2% population aged 65+, 10.6% aged 80+, and an ageing index of 450. The median average age reaches 56.3 years, while elderly households account for 43.3%. Unlike more peripheral clusters, these settlements are relatively close to municipal centres (11 km median) and show stronger daily commuting (47.7%), indicating that demographic decline is more critical than spatial isolation.
The second cluster is the largest, comprising 615 settlements (47.2% of all small settlements), with the highest concentrations in Knjaževac, Prokuplje, Kuršumlija, Pirot and Raška. It shows the most adverse demographic profile, with a median share of 46.9% population aged 65+, an ageing index of 500, and the highest share of pensioners (46.7%). These settlements are situated at moderate elevations (550 m) and distances from municipal centres (15 km), with high dependency ratios (104). As the dominant settlement type, this cluster is marked by severe demographic burden and strong depopulation (median population change index −59.5).
The third cluster comprises 370 settlements (28.4%), most common in Novi Pazar, Kuršumlija, Vranje, Sjenica and Kraljevo. It is characterised by very small populations (median 25 inhabitants), a strong agricultural orientation (37.5%), low employment (12.1%) and weak daily commuting (20.0%). Spatially, these settlements are the most remote and elevated, with a median distance of 22.5 km from municipal centres and an elevation of 860 m. Although ageing is pronounced (38.8% aged 65+), the cluster’s most critical feature is the strongest depopulation trend, with a median population change index of −67.2.
The fourth cluster includes 125 settlements (9.6%) heavily concentrated in Sjenica and Tutin, followed by Kuršumlija, Prijepolje and Novi Pazar. This is the most demographically favourable cluster, with the highest share of young populations (20.0%), the lowest share aged 65+ (21.4%), the lowest average age (41.7 years), and the lowest ageing index (100). However, these settlements are located at the highest elevations (1015 m) and remain relatively remote (19 km) while recording the lowest employment levels (7.7%) and a low share of pensioners (19.0%).

3.5. Inter-Cluster Differences and Statistical Validation

In order to statistically verify that the four identified clusters differ with respect to key spatial, demographic, and socio-economic characteristics, the Kruskal–Wallis test was applied, given deviations from normality and/or the presence of extreme values in certain indicators. The results indicate that inter-cluster differences are statistically significant for all observed indicators (p < 0.001), confirming that the derived typology is empirically grounded. The most pronounced differences were identified in spatial–topographic indicators, particularly for mean elevation (χ2 = 380.37; df = 3; p < 0.001) and distance from the municipal centre (χ2 = 187.86; df = 3; p < 0.001), indicating that clusters are clearly differentiated in terms of orographic conditions and the degree of settlement peripherality.
At the same time, clusters differ substantially in terms of indicators of demographic ageing and dependency, especially the share of the population aged 65+ (χ2 = 213.39; df = 3; p < 0.001), the share of elderly households (χ2 = 227.41; df = 3; p < 0.001), the ageing index (χ2 = 236.45; df = 3; p < 0.001), and average age (χ2 = 257.05; df = 3; p < 0.001), while significant differences were also confirmed for depopulation dynamics (population change index 2022/2002: χ2 = 104.78; df = 3; p < 0.001). Following the confirmation of overall significance, Dunn’s post hoc test with Bonferroni correction was conducted to identify specific cluster pairs that differ statistically. The post hoc analysis revealed that clusters are clearly ranked by degree of peripherality: for distance from the municipal centre, statistically significant differences were observed between all pairs of clusters (p < 0.01). For mean elevation, significant differences were found between most pairs (e.g., 1–3, 2–3, 1–4, 2–4, and 3–4; p < 0.01), whereas the difference between clusters 1 and 2 was not significant (p = 1.000), suggesting a similar altitudinal profile for these two types. Regarding the ageing index, the most pronounced differences were observed in comparisons involving Cluster 4 relative to the other clusters (1–4, 2–4, and 3–4; p < 0.001), while differences among clusters 1–2, 1–3, and 2–3 did not remain statistically significant after correction (p > 0.05).

3.6. Determinants of Demographic Risk

To identify the determinants of demographic risk, a binary logistic regression was applied (Table 4). The model as a whole is statistically significant compared to the null model (Omnibus/LR test: χ2(9) = 283.57; p < 0.001), confirming that the selected set of predictors significantly contributes to explaining the probability of belonging to the high-risk group. Model fit is satisfactory (Hosmer–Lemeshow: χ2(8) = 10.336; p = 0.242), while discriminative ability is good (AUC = 0.784). At a classification threshold of 0.50, the model achieves high sensitivity (0.879) but lower specificity (0.390), indicating that it more reliably identifies high-risk settlements than low-risk ones.
The logistic regression results indicate that demographic risk is mainly shaped by age structure and peripherality. A higher share of residents aged 65+ significantly increases the probability of belonging to the high-risk group (p < 0.05), confirming that population ageing is a strong predictor of future decline through weaker labour supply, lower fertility potential, and rising dependency burdens. A greater distance from the municipal centre also increases the risk (p < 0.05), highlighting the vulnerability of remote settlements with poorer accessibility and weaker economic integration. In contrast, immigration has a protective effect, reducing the likelihood of high-risk classification (p < 0.05), while higher shares of highly educated and employed residents also lower risk, underlining the importance of human capital and labour-market participation for local resilience. The share of the agricultural population shows only a weak negative effect, suggesting that agrarian activity may slow decline but cannot reverse it alone. Overall, the findings imply that policies should prioritise population retention, improved accessibility, and economic diversification.

4. Discussion

The results confirm that small settlements in Serbia are a highly heterogeneous category of rural space, despite shared trends of long-term depopulation, ageing, and functional marginalisation. This supports the central assumption and answers RQ1 by showing that these settlements are not a homogeneous group of demographically vulnerable areas but rather exhibit distinct demographic and socio-economic structures. The findings align with contemporary research advocating territorially sensitive, place-based rural policies [13,15]. In this context, revitalising small settlements is particularly important in Serbia’s development policies. Initiatives aimed at revitalising small settlements represent an important mechanism for promoting sustainable development, not only by mitigating existing problems but also through a multidimensional approach encompassing economic renewal, social cohesion, environmental sustainability, and the preservation of cultural identity [78]. These initiatives are grounded in strategic documents, such as the Strategy of Agriculture and Rural Development of the Republic of Serbia [79], the National Programme for the Villages Revival [80], and the National Rural Development Program [81], which establish the foundations for the sustainable development and revitalisation of rural areas. Similar conclusions by Ahlmeyer and Volgmann [50] show that uniform development models in European rural areas often fail to achieve expected outcomes.
Furthermore, findings are consistent with recent international research that views rural depopulation as a multidimensional process shaped by demographic ageing, economic restructuring, and institutional change. Comparative studies show that population decline increasingly affects rural regions across Europe and Asia, weakening their economic and social capacities [82]. At the same time, policy reviews suggest that attempts to reverse depopulation often produce uneven outcomes because they insufficiently address territorial heterogeneity [26]. Recent European studies likewise identify ageing, economic decline, and the withdrawal of public services as key drivers of rural shrinkage [83].
The spatial analysis (RQ2) reveals strong regional polarisation in Serbia: nearly two-thirds of all small settlements are located in Southern and Eastern Serbia, while they are almost absent from the Belgrade Region and only marginally present in Vojvodina. This confirms earlier findings that mountainous and peripheral Balkan regions are especially affected by depopulation and demographic decline [12,18,19]. Similar concentrations of shrinking settlements have been identified in Spain, Italy, and Greece, where rural “emptying” is concentrated in peripheral mountain areas [11,16]. These patterns support the concept of rural peripheralisation, showing that marginalisation is both demographic and territorially conditioned.
Additional insight is provided by analysing the share of small settlements among the total number of settlements at the municipal level. In this regard, the municipality of Crna Trava stands out, where 22 of 25 settlements (88%) are classified as small. A similar pattern is observed in the municipalities of Kuršumlija, Dimitrovgrad, and Trgovište, where more than 80% of settlements have fewer than 100 inhabitants. In Bosilegrad, Bela Palanka, and Medveđa, more than 70% of settlements fall into this category, indicating a pronounced dominance of micro-settlement demographic structures [3]. This pattern can be directly linked to the components derived from PCA, which highlight the key demographic characteristics of these settlements.
The analysis of demographic and socio-economic characteristics (RQ3) shows that small settlements have a highly unfavourable age structure, with a very high share of population aged 65+ and a very low proportion of young residents, resulting in elevated ageing and dependency ratios. This supports studies identifying ageing as a major constraint on rural development in South-Eastern Europe [10,61,62], while similar trends are observed in Western and Southern Europe due to long-term youth out-migration to urban centres [25]. The results also indicate low employment levels and a modest share of highly educated residents, reflecting weak development capacity and limited human capital, consistent with World Bank assessments of functional degradation in the smallest rural settlements [71].
The PCA and cluster analysis identified four typological groups of small settlements (RQ4), confirming that their demographic and developmental heterogeneity can be systematically classified. Key dimensions of differentiation include population ageing, labour potential, reproductive vitality, migration structure, and spatial peripherality, consistent with international studies that stress the combined roles of demographic, economic, and spatial factors in rural sustainability [13,14]. Most settlements belong to clusters with highly unfavourable demographic characteristics, while only a small share shows demographic vitality and younger age structures. Notably, the most vital cluster is geographically peripheral, indicating that isolation alone does not cause demographic collapse; cultural, migratory, socio-economic, and institutional factors are also decisive.
The logistic regression confirms the importance of key demographic risk factors. A higher share of the elderly population and a greater distance from the municipal centre are the strongest predictors of increased risk, while higher in-migration, employment, and education levels are linked to greater demographic resilience. These findings support the concept of peripheralisation, whereby spatial isolation and limited access to resources drive long-term decline [13]. At the same time, the positive role of migration is consistent with research showing that in-migration can help revitalise rural communities [51].
The results have important implications for decentralised and territorially differentiated policies (RQ5). As small settlements differ greatly in demographic potential, economic structure, and accessibility, development strategies cannot be uniform. Settlements with more favourable demographic structures may serve as local development nodes, while strongly aged settlements require functional integration with larger centres. This approach aligns with the polycentric and place-based development model promoted by the European Commission and the OECD [28,29,31]. International experience also shows that revitalisation is more successful when demographic, economic, and institutional measures are combined, including entrepreneurship, tourism, and digital infrastructure [41,45,50].
Recent international research shows that rural shrinkage is strongly associated with structural changes in agriculture and land ownership, which alter settlement patterns and intensify the decline in peripheral regions [84]. European studies further indicate that long-term depopulation produces differentiated territorial typologies, requiring spatially sensitive development strategies [85]. Shrinking rural communities also face major functional changes in agriculture, public services, and ecological roles of space [78], while ageing and youth out-migration undermine social sustainability, local networks, and institutional capacity [86,87]. Empirical research from Central and Eastern Europe also shows that municipalities affected by demographic decline often develop alternative development strategies based on tourism, local entrepreneurship, and institutional cooperation [88,89].
From the perspective of decentralised territorial development, the results show that uniform rural policies are ineffective because they ignore structural differences among small settlements. Instead, differentiated place-based approaches are needed, distinguishing settlements with revitalisation potential from those where demographic decline has passed a critical threshold. However, decentralisation alone is insufficient without adequate local institutional and financial capacity, as municipalities with many small settlements often face limited resources and deepening inequalities. Effective policy, therefore, requires vertical and horizontal coordination between national goals and local needs. Fiscal incentives, transport infrastructure, housing renewal, digital connectivity, and basic services may help reduce depopulation, while a holistic approach that accounts for the combined impact of multiple policy instruments is essential [26].
The four-cluster typology confirms that small settlements in Serbia are not a homogeneous rural category, but structurally differentiated demographic-spatial systems with distinct constraints and potentials. Significant differences between clusters are mainly related to age structure, depopulation intensity, economic activity, and peripherality, showing that uniform rural revitalisation models cannot be equally effective. These findings support territorially differentiated, place-based policies that emphasise local capacities and institutional context [50]. International experiences, therefore, offer useful guidance, but must be selectively adapted to Serbia’s national and regional specificities.
Cluster 1: Spatially accessible, demographically depleted settlements
Settlements in the first cluster are relatively well connected to municipal centres yet marked by severe population ageing and a weakened reproductive base, indicating that their principal constraint lies in demographic erosion rather than spatial isolation. Comparable challenges have been recognised in Italy’s inner areas, where revitalisation measures have included support for young families, entrepreneurs, housing renewal, public services, and rural tourism, while experiences from Sweden and other Northern and Central European countries highlight the importance of local autonomy and digital infrastructure in strengthening social cohesion and quality of life [5,86]. In Serbia, this model is particularly relevant to accessible villages in South-Eastern Serbia (e.g., Bela Palanka, Babušnica, Vlasotince, and Vladičin Han), where priorities should include housing renovation, incentives for remote work, stronger labour-market integration, and subsidised daily mobility, enabling these settlements to function as residential rural zones within wider urban systems (Table 5).
Cluster 2: Most pronounced demographic regression
The second cluster represents the most demographically vulnerable settlement type, characterised by pronounced ageing, negative migration balance, and long-term depopulation, where demographic and economic decline reinforce one another. International experience suggests that isolated measures are rarely effective; instead, integrated approaches combining infrastructure development, agricultural modernisation, and local institutional mobilisation—such as China’s Rural Revitalisation Strategy and the Korean New Village Movement—have shown greater potential [44,45,51]. In Europe, similar principles include selective concentration of services, functional consolidation of settlements, and the conversion of abandoned areas into ecological or recreational zones, while the Smart Village project in Santa Fiora, Italy, illustrates that digital solutions are useful mainly where a minimum demographic and institutional base still exist [14,86]. For Serbia, particularly in South-Eastern regions, a realistic strategy would involve strengthening viable local cores and linking them to stronger centres, while the smallest and nearly abandoned settlements should be considered for controlled land-use transformation or functional consolidation.
Cluster 3: Peripheral, mountainous and agricultural settlements
The third cluster comprises remote, high-altitude settlements with small populations and a strong agricultural orientation, where peripherality acts both as a constraint and as a development asset through preserved landscapes, biodiversity, and traditional production. Their characteristics align with endogenous development models based on product specialisation and local branding, such as Japan’s “One Village One Product” concept [41]. Comparable examples include agri-tourism in France, local branding in Portugal, integrated tourism and livestock farming in the Austrian Alps, and gastronomy-led rural development in Montenegro, while Werfenweng demonstrates how sustainable mobility and tourism can strengthen mountain areas without undermining landscape capital [22,56,60,90,91,92]. In Serbia, similar potential exists in Stara Planina, Sjenica, Svrljig, Pirot, Golija, Kopaonik, and Divčibare, where tourism, livestock farming, dairy production, and organic agriculture could support diversification, although broader institutional coordination and infrastructure investment remain essential, as diversification alone rarely fully halts depopulation [93,94,95,96].
Cluster 4: Demographically vital, economically passive settlements
The fourth cluster is not only distinguished by the most favourable age structure but also by the lowest employment levels, indicating that its main challenge is not demographic decline but the weak economic activation of the working-age population. International experience shows that rural energy communities in Italy can stimulate local economies through renewable energy production, while examples from Estonia highlight the role of digital infrastructure, remote work, micro-enterprises, agro-ecological initiatives, and cultural projects in retaining its population [57,86,97]. In Serbia, this model is particularly relevant for Sjenica, Tutin, and Novi Pazar, where a relatively young population exists but formal employment opportunities remain limited, making digital services, cooperative models, and entrepreneurship key instruments for mobilising existing demographic potential.
The four clusters reveal distinct combinations of demographic, economic and spatial conditions, confirming that small settlements cannot be treated as a homogeneous category. Clusters 1 and 2 share severe depopulation and population ageing, yet Cluster 1 benefits from better accessibility to municipal centres, whereas Cluster 2 is marked by deeper regression, out-migration and structural decline. In contrast, Cluster 3 differs in its peripheral, mountainous location and stronger agricultural orientation, where remoteness creates both constraints and opportunities related to tourism, local products, and environmental resources. Cluster 4 stands apart as the most demographically vital group, with a younger population structure, but faces low employment and limited economic activation. Thus, while Clusters 1 and 2 primarily require demographic stabilisation measures, Cluster 3 depends on endogenous asset-based diversification, and Cluster 4 needs labour-market development and entrepreneurship policies to convert demographic potential into sustainable growth.

5. Conclusions

The results confirm that small settlements constitute a significant yet demographically vulnerable segment of Serbia’s settlement system. Nearly one in four settlements falls into this category, occupying a substantial share of national territory but accounting for only a negligible proportion of the population. Strong regional disparities are evident, with the highest concentration in Southern and Eastern Serbia and in mountainous and peripheral areas, while such settlements are almost absent from the Belgrade Region. This spatial polarisation indicates that depopulation, ageing, and functional decline are unevenly distributed and closely linked to geographic location, service accessibility, and local economic capacity.
The application of principal component analysis and hierarchical cluster analysis enabled the identification of four typological groups of small settlements, confirming that this category is not homogeneous but encompasses diverse demographic and developmental profiles. The analysis identified settlements with highly unfavourable demographic characteristics, as well as those which, despite their small population size, exhibit relatively more favourable demographic and socio-economic features.
The principal scientific contribution of this study lies in the development of an empirically grounded demographic typology of small settlements in Serbia, which enables a more precise understanding of their internal heterogeneity and development potential. By combining multiple statistical methods, the study provides a methodologically integrated framework for identifying demographic patterns and determinants of increased demographic risk. In doing so, it moves beyond traditional approaches that treat small settlements as a homogeneous category of rural space and highlights the importance of territorially differentiated and place-based development policies. An additional contribution lies in linking the demographic structure of settlements with their development capacities and implications for decentralised territorial development, an issue that has remained relatively underexplored in the existing literature on rural areas in Serbia.
Based on the obtained results, the following recommendations are proposed for enhancing the development of small settlements in Serbia:
  • Territorially differentiated and tailored strategies: Develop measures that take into account demographic heterogeneity and typological differences among small settlements, as they do not constitute a homogeneous category.
  • Support for the most vulnerable settlements: In regions characterised by pronounced depopulation and population ageing, efforts should focus on stimulating local economies, ensuring access to basic services, and improving infrastructure.
  • Strengthening local capacities: Reinforce local institutions and support entrepreneurship, as well as cultural and social resources, as mechanisms for mitigating depopulation.
  • Decentralised and place-based approach: Development policies and planning frameworks should be decentralised and territorially sensitive, adapted to the specific needs and potentials of each settlement.
  • Sustainable development: Strategies should be long-term in orientation and aimed at settlement stabilisation, the preservation of demographic diversity, and the prevention of spatially uneven depopulation.
However, the practical feasibility of the recommendations depends heavily on institutional and fiscal realities. Calls for territorially tailored strategies are analytically sound, yet they require strong local governance capacity, reliable municipal budgets, and inter-ministerial coordination—conditions that are unevenly developed across Serbia. Many municipalities with high-risk settlements already face administrative weaknesses, ageing populations, and limited investment capacity. In such contexts, sophisticated place-based strategies may be difficult to implement without substantial centralised state support.
The recommendation to support the most vulnerable settlements also requires critical prioritisation. While improving infrastructure, services, and local economies is desirable, not all settlements may be realistically stabilised given extreme depopulation, very small population bases, and persistent out-migration. In some cases, policy may need to shift from growth-oriented revitalisation to adaptive management, focusing on maintaining essential accessibility, managing land abandonment, and concentrating services in viable local centres. This introduces politically sensitive questions about which settlements can be sustained and which may continue to decline. Similarly, strengthening local capacities through entrepreneurship and social innovation is promising but constrained by demographic structure. Older, shrinking communities often have weaker entrepreneurial ecosystems, lower human capital stocks, and limited market demand. Without external networks, digital connectivity, and targeted incentives, local entrepreneurship alone may have limited transformative capacity.
Although the research is focused on Serbia, the obtained results have broader analytical relevance for understanding demographic processes in semi-peripheral and post-socialist European countries facing similar challenges. This study contributes to the international scholarly debate on the future of small settlements by highlighting the importance of demographic heterogeneity as a key analytical category in planning decentralised and sustainable territorial development.
Despite providing significant insights into the demographic dynamics of small settlements, this study has certain limitations. The analysis is primarily based on quantitative census data and available statistical indicators, while several important aspects of rural development, such as the quality of local institutions, social capital, cultural resources, and population perceptions, remain outside the analytical framework. Furthermore, this study focuses on a single temporal snapshot, which limits the ability to examine long-term developmental dynamics in greater detail. Future research could therefore incorporate longitudinal analyses and a combination of quantitative and qualitative methods in order to better capture the mechanisms of local resilience and the revitalisation potential of small rural communities.
Notwithstanding these limitations, the results clearly indicate that the demographic heterogeneity of small settlements represents a key factor that must be integrated into future strategies of decentralised territorial development. In this respect, this study provides both an empirical and conceptual basis for re-evaluating existing development policies and promoting differentiated approaches to the development of small settlements in Serbia. Understanding demographic heterogeneity is a fundamental prerequisite for designing effective policies to mitigate depopulation, strengthen local development capacities, and ensure the long-term stabilisation of the settlement network in Serbia. More broadly, the findings suggest that recognising the demographic heterogeneity of small settlements is essential for formulating sustainable, territorially sensitive development strategies in countries facing prolonged rural depopulation.

Author Contributions

Conceptualization, D.G., B.Đ. and M.B.Ž.; methodology, B.Đ., D.G., N.Ž. and M.L.Đ.; software, B.Đ., D.G., D.D. and M.L.; validation, D.G., M.L. and S.V.; formal analysis, D.G., B.Đ., M.L. and S.V.; investigation, D.G., B.Đ. and M.B.Ž.; resources, D.G., B.Đ., D.D. and M.L.Đ.; data curation, S.V., M.L.Đ. and N.Ž.; writing—original draft preparation, D.G., B.Đ. and M.B.Ž.; writing—review and editing, D.G., B.Đ., M.B.Ž., M.L.Đ. and S.V.; visualization, D.D., N.Ž. and B.Đ.; supervision, D.G. and B.Đ.; project administration, D.G. and B.Đ. All authors have read and agreed to the published version of the manuscript.

Funding

This research was supported by the Ministry of Science, Technological Development and Innovation of the Republic of Serbia under the Contract on the implementation and financing of scientific research (No. 451-03-34/2026-03/200091 and 451-03-34/2026-03/200125), and Provincial Secretariat for Higher Education and Scientific Research of Vojvodina Province (No. 003786630 2025 09418 003 000 000 001 04 002).

Data Availability Statement

The original contributions presented in the study are included in the article; further inquiries can be directed to the corresponding author.

Acknowledgments

The authors would like to express their sincere gratitude to Marija Anđelkovič, Dragana Paunović Radulović and Aleksa Stevanović from the Statistical Office of the Republic of Serbia for providing the data.

Conflicts of Interest

The authors declare no conflicts of interest.

Appendix A

Table A1. Explanation of the set of indicators used in the study.
IndicatorDomainOperational DefinitionUnit/ScaleData Source (Example Wording)
Average altitudeSpatial/
topographic
Average elevation of the settlement area.meters (m)Topographic/administrative GIS source; settlement-level dataset
Distance from the municipal centreSpatial/
accessibility
Road/air distance from the settlement to the municipal administrative centre.kilometres (km)Administrative/GIS source; settlement-level dataset
Population 2022Demography/
size
Number of residents in 2022.personsPopulation Census 2022 (settlement level)
Population change index 2022/2002Demography/
dynamics
Population change between 2002 and 2022 (as in the dataset; used for risk threshold and typology).% (percentage points)Population Censuses 2002 & 2022 (settlement level)
Share of immigrantsMobility/
migration
Share of in-migrants (persons who moved into the settlement).%Population Census 2022 (settlement level)
Share of autochthonous populationMobility/migrationShare of autochthonous (non-migrant) population.%Population Census 2022 (settlement level)
Share of daily commutersMobility/commuting (proxy)Share of daily commuters (functional link with employment/education centres).%Population Census 2022 (settlement level)
Share of the economically active population in the total populationSocio-economic/labour (proxy)Share of economically active persons in the total population.%Population Census 2022 (settlement level)
Share of employed personsSocio-economic/labour (proxy)Share of employed persons in the total population.%Population Census 2022 (settlement level)
Share of pensionersSocio-economic/structureShare of pensioners in the total population.%Population Census 2022 (settlement level)
Share of agricultural populationSocio-economic/structureShare of agricultural population in the total population.%Population Census 2022 (settlement level)
Share of population aged 0–14Demography/
age structure
Share of population aged 0–14 years.%Population Census 2022 (settlement level)
Share of population aged 65+Demography/
ageing (proxy)
Share of population aged 65 years and over.%Population Census 2022 (settlement level)
Share of population aged 80+Demography/
ageing
Share of population aged 80 years and over.%Population Census 2022 (settlement level)
Share of fertile populationDemography/fertility potentialShare of fertile-age population in the total population (as defined in the dataset).%Population Census 2022 (settlement level)
Average ageDemography/ageingAverage age of the population.yearsPopulation Census 2022 (settlement level)
Aging indexDemography/
ageing
Ageing index (ratio of older to younger population).indexPopulation Census 2022 (settlement level)
Youth dependency ratioDemography/
dependency
Youth dependency ratio (as defined in the dataset).indexPopulation Census 2022 (settlement level)
Old-age dependency ratioDemography/
dependency
Old-age dependency ratio (as defined in the dataset).indexPopulation Census 2022 (settlement level)
Total dependency ratioDemography/
dependency
Total dependency ratio (as defined in the dataset).indexPopulation Census 2022 (settlement level)
Share of married personsHousehold/
social structure
Share of married persons.%Population Census 2022 (settlement level)
Share of elderly householdsHousehold/
social structure
Share of elderly households.%Population Census 2022 (settlement level)
Share of persons without formal education and with incomplete primary educationEducation (proxy)Share of persons without formal education or with incomplete primary education.%Population Census 2022 (settlement level)
Share of persons with primary educationEducation (proxy)Share of persons with completed primary education.%Population Census 2022 (settlement level)
Share of persons with secondary educationEducation (proxy)Share of persons with completed secondary education.%Population Census 2022 (settlement level)
Share of persons with higher educationEducation (proxy)Share of persons with tertiary (higher) education.%Population Census 2022 (settlement level)
Source: authors’ processing.
Figure A1. Dendrogram. Source: authors’ processing.
Land 15 00723 g0a1
Table A2. Average silhouette width for the selection of the number of clusters (k = 2–8).
kAverage Silhouette Width
20.112
30.107
40.138
50.101
60.106
70.116
80.111
Source: authors’ processing.
Table A3. Sensitivity analysis of the high_risk definition using alternative depopulation thresholds (−40, −50 and −60).
Thresholds (Index≤)Predictorβp-Value
−40Share of population aged 65+0.04860.0000
−40Distance from the municipal centre0.05240.0000
−40Share of immigrants−0.01870.0683
−40Share of employed persons−0.01360.0247
−40Share of persons with higher education−0.02660.0118
−40Share of agricultural population−0.00310.3350
−50Share of population aged 65+0.04480.0000
−50Distance from the municipal centre0.04670.0000
−50Share of immigrants−0.02210.0067
−50Share of employed persons−0.02170.0000
−50Share of persons with higher education−0.02280.0081
−50Share of agricultural population−0.00760.0034
−60Share of population aged 65+0.04010.0000
−60Distance from the municipal centre0.03760.0000
−60Share of immigrants−0.02510.0006
−60Share of employed persons−0.02800.0000
−60Share of persons with higher education−0.02090.0081
−60Share of agricultural population−0.00870.0004
Source: authors’ processing.

References

  1. Newsham, N.; Rowe, F. Understanding the Trajectories of Population Decline Across Rural and Urban Europe. A Sequence Analysis. Popul. Space Place 2023, 29, e2630. [Google Scholar] [CrossRef]
  2. Đerčan, B.; Bjelajac, D.; Bubalo Živković, M.; Lukić, T.; Gatarić, D.; Pogrmić, Z. Exploring the Contemporary Spatial and Temporary Dynamics of the Settlement Hierarchy and System in Serbia’s Srem Region. Geogr. Pannonica 2024, 28, 271–283. [Google Scholar] [CrossRef]
  3. Gatarić, D. Stanovništvo u Malim Naseljima [Population in Small Settlements]; Republički Zavod za Statistiku: Beograd, Srbija, 2025. [Google Scholar]
  4. Drobnjaković, M. Developmental Role of Rural Settlements in Central Serbia, Special issue 95; Geographical Institute “Jovan Cvijić” SASA: Belgrade, Serbia, 2019. [Google Scholar]
  5. Stamenković, Đ.S.; Bačević, M. Geografija Naselja [Geography of Settlements]; Geografski fakultet Univerziteta u Beogradu: Belgrade, Serbia, 1992. [Google Scholar]
  6. Stamenković, Đ.S. Neka aktuelna pitanja prostorne organizacije mreže naselja i relevantni demografski problemi u Srbiji. Demografija 2004, 1, 115–134. [Google Scholar]
  7. Bubalo Živković, M.; Lukić, T.; Bjelajac, D.; Pogrmić, Z.; Jovanović, G. Deruralization as a global process and its trends in Serbia. Zb. Rad. Departmana Za Geogr. Turiz. I Hotel. 2024, 53, 69–79. [Google Scholar] [CrossRef]
  8. Mitrović, M.M. Sela u Srbiji: Promene Strukture i Problemi Održivog Razvoja [Villages in Serbia: Changes in Structure and Problems of Sustainable Development]; Republički Zavod za Statistiku: Beograd, Serbia, 2015. [Google Scholar]
  9. Tošić, D.; Drobnjaković, M. Seoska naselja u Srbiji—Stanje i perspektive [Rural settlements in Serbia—Status and perspectives]. In Lokalna Samouprava u Planiranju i Uređenju Prostora i Naselja [Local Self-Government in Planning and Arrangement of Space and Settlement]; Šećerov, V., Đorđević, S.D., Radosavljević, Z., Jeftić, R.M., Eds.; Asocijacija Prostornih Planera Srbije i Univerzitet u Beogradu—Geografski Fakultet: Beograd, Serbia, 2022; pp. 25–34. [Google Scholar]
  10. Nejašmić, I. Osnovne značajke depopulacije u Hrvatskoj u razdoblju 1953–1981 [Basic characteristics of depopulation in Croatia in the period 1953–1981]. Sociol. Sela 1990, 28, 33–50. [Google Scholar]
  11. Delgado Viñas, C. Depopulation processes in European rural areas: A case study of Cantabria (Spain). Eur. Countrys. 2019, 11, 341–369. [Google Scholar] [CrossRef]
  12. Nikitović, V. Višeslojna priroda depopulacije u Srbiji—Noviji trendovi i izgledi [The multifaceted nature of depopulation in Serbia—Newer trends and prospects]. In Ljudski Razvoj Kao Odgovor na Demografske Promene [Human Development as a Response to Demographic Changes]; Vuković, D., Ed.; Nacionalni Izveštaj o Ljudskom Razvoju: Beograd, Serbia, 2022; pp. 54–72. [Google Scholar]
  13. Dax, T.; Copus, A. European Rural Demographic Strategies: Foreshadowing Post-Lisbon Rural Development Policy? World 2022, 3, 938–956. [Google Scholar] [CrossRef]
  14. García-Madurga, M.Á.; Esteban-Navarro, M.Á.; Saz-Gil, I.; Anés-Sanz, S. Depopulation and Residential Dynamics in Teruel (Spain): Sustainable Housing in Rural Areas. Urban Sci. 2024, 8, 110. [Google Scholar] [CrossRef]
  15. Papadopoulos, A.G.; Baltas, P. Rural Depopulation in Greece: Trends, Processes, and Interpretations. Geographies 2024, 4, 1–20. [Google Scholar] [CrossRef]
  16. Martínez-Carrasco Pleite, F.; Colino Sueiras, J. Rural Depopulation in Spain: A Delphi Analysis on the Need for the Reorientation of Public Policies. Agriculture 2024, 14, 295. [Google Scholar] [CrossRef]
  17. Dragan, A.; Creţan, R.; Lungu, M.A. Neglected and Peripheral Spaces: Challenges of Socioeconomic Marginalization in a South Carpathian Area. Land 2024, 13, 1086. [Google Scholar] [CrossRef]
  18. Gatarić, D.; Đerčan, B.; Bubalo Živković, M.; Ostojić, M.; Manojlović, S.; Sibinović, M.; Lukić, T.; Jeftić, M.; Lutovac, M.; Lutovac, M. Can Depopulation Stop Deforestation? The Impact of Demographic Movement on Forest Cover Changes in the Settlements of the South Banat District (Serbia). Front. Environ. Sci. 2022, 10, 897201. [Google Scholar] [CrossRef]
  19. Joksimović, M.; Golić, R.; Krstić, F.; Malinić, V.; Vujadinović, S.; Šabić, D.; Gajić, M.; Nikolić, O.; Momčilović Petronijević, A.; Nikolić, V. Depopulacioni klaster—Naselja sa 20 i manje stanovnika u Srbiji [Depopulation cluster—Settlements with 20 or fewer inhabitants in Serbia]. Demografija 2023, 20, 99–118. [Google Scholar] [CrossRef]
  20. Dadà, A. Uomini e strade dell’emigrazione dall’Appennino toscano. In La Montagna Mediterranea; Albera, D., Corti, P., Eds.; Gribaudo: San Giovanni Lupatoto, Italy, 2000; pp. 153–164. [Google Scholar]
  21. Pinilla, V.; Ayuda, M.I.; Sáez, L.A. Rural Depopulation and the Migration Turnaround in Mediterranean Western Europe: A Case Study of Aragon, Spain. J. Rural. Community Dev. 2008, 3, 1–22. [Google Scholar]
  22. Pires de Almeida, M.A. Territorial inequalities: Depopulation and local development policies in the Portuguese rural world. Ager. Rev. De Estud. Sobre Despoblación Y Desarro. Rural. 2017, 22, 61–87. [Google Scholar] [CrossRef]
  23. Dragan, A.; Ispas, R.T.; Creţan, R. Recent Urban-to-Rural Migration and Its Impact on the Heritage of Depopulated Rural Areas in Southern Transylvania. Heritage 2024, 7, 4282–4299. [Google Scholar] [CrossRef]
  24. García-Sanz, B. Se acabó el éxodo rural? Nuevas dinámicas demográficas del mundo rural español. In La Lucha Contra la Despoblación Todavía Necesaria: Políticas y Estrategias Sobre la Despoblación en Las Áreas Rurales Del Siglo XXI; García-Pascual, F., Ed.; CEDDAR: Zaragoza, Spain, 2003; pp. 13–42. [Google Scholar]
  25. Johnson, K.M.; Lichter, D.T. Rural Depopulation: Growth and Decline Processes over Century the Past. Rural. Sociol. 2019, 84, 3–27. [Google Scholar] [CrossRef]
  26. Loras-Gimeno, D.; Díaz-Lanchas, J.; Gómez-Bengoechea, G. Rural depopulation in the 21st century: A systematic review of policy assessments. Reg. Sci. Policy Pract. 2025, 17, 100176. [Google Scholar] [CrossRef]
  27. United Nations. World Population Prospects 2024: Summary of Results; UN DESA/POP/2024/TR/NO. 9; United Nations: New York, NY, USA, 2024. [Google Scholar]
  28. Rodden, J. Comparative Federalism and Decentralization: On Meaning and Measurement. Comp. Politics 2004, 36, 481–500. [Google Scholar] [CrossRef]
  29. Shakil Ahmad, M.; Abu Talib, N. Decentralization and Participatory Rural Development: A Literature Review. Contemp. Econ. 2011, 5, 58–67. [Google Scholar] [CrossRef]
  30. Manor, J. Democratic Decentralization in Africa and Asia. IDS Bull. 1995, 26, 81–88. [Google Scholar] [CrossRef]
  31. Canare, T. Decentralization and Development Outcomes: What Does the Empirical Literature Really Say? Hacienda Pública Española/Rev. Public Econ. 2021, 237, 111–151. [Google Scholar] [CrossRef]
  32. Faguet, J. Governance from below in Bolivia: A theory of local government with two empirical tests. Lat. Am. Politics Soc. 2009, 51, 29–68. [Google Scholar] [CrossRef][Green Version]
  33. Klarić, M. Decentralization and sub-municipal goverment in South-Eastern European countries. Zb. Rad. Pravnog Fak. U Split. 2021, 58, 1035–1053. [Google Scholar] [CrossRef]
  34. Maro, P. The impact of decentralization on spatial equity and rural development in Tanzania. World Dev. Elsevier 1990, 18, 673–693. [Google Scholar] [CrossRef]
  35. Digdowiseiso, K.; Murshed, S.M.; Bergh, S.I. How Effective is fiscal decentralization for inequality reduction in developing countries? Sustainability 2022, 14, 505. [Google Scholar] [CrossRef]
  36. Drobnjaković, M.; Panić, M. Decentralizacijom do Bolje Integracije Ruralnog Prostora Srbije [Decentralization to Better Integration of the Rural Space of Serbia]; Institut za filozofiju i društvenu teoriju, Univerzitet u Beogradu, Insitut za demokratski angažman jugoistočne Evrope: Beograd, Serbia, 2023; pp. 1–19. [Google Scholar]
  37. Zakon o Lokalnoj Samoupravi [Law on Local Self-Government]. Available online: https://www.paragraf.rs/propisi/zakon_o_lokalnoj_samoupravi.html (accessed on 27 February 2026).
  38. Milosavljević, B.; Jerinić, J. Status of Serbian Towns in the Light of Recent Efforts Towards a National Decentralisation Strategy. Croat. Comp. Public Adm. HKJU CCPA 2016, 16, 77–106. [Google Scholar] [CrossRef][Green Version]
  39. Cheng, G.S. The Realization Mechanism of Rural Multi-Value Comes from Rural Living Environment Improvement in Mountain- ous Areas of Western China. Open Access Libr. J. 2023, 10, e10950. [Google Scholar] [CrossRef]
  40. Liu, Y.; Siwei, H.; Chen, N.; Zhao, R. Multifunctional rural areal system transformation and rural revitalization. Agric. Environ. Sustain. 2026, 1, 100007. [Google Scholar] [CrossRef]
  41. Nonaka, A.; Ono, H. Revitalization of Rural Economies though the Re structuring the Self-Sufficient Realm: Growth in Small Scale Rapeseed Production in Japan. Jpn. Agric. Res. Q. JARQ 2015, 49, 383–390. [Google Scholar] [CrossRef]
  42. Martin, P.; Jennifer, D. Narratives of Transition/Non-Transition towards Low Carbon Futures within English Rural Communities. J. Rural. Stud. 2014, 34, 79–95. [Google Scholar] [CrossRef]
  43. Cousineau, A. Toward New Towns for America. Am. J. Public Health 1952, 42, 89. [Google Scholar] [CrossRef]
  44. Guido, V.H.; Guy, D. Multifunctional Agriculture: A New Paradigm for European Agriculture and Rural Development; Ashgate Publishing Ltd.: Farnham, UK, 2003. [Google Scholar]
  45. Liu, Y.; Qiao, J.; Xiao, J.; Han, D.; Pan, T. Evaluation of the Effectiveness of Rural Revitalization and an Improvement Path: A Typical Old Revolutionary Cultural Area as an Example. Int. J. Environ. Res. Public Health 2022, 19, 13494. [Google Scholar] [CrossRef] [PubMed]
  46. Long, H.L.; Zhang, Y.N.; Tu, S.S. Rural Vitalization in China: A Perspec tive of Land Consolidation. J. Geogr. Sci. 2019, 29, 517–530. [Google Scholar] [CrossRef]
  47. An, W.; Wu, J. Educational research in the context of rural revitalization: Take papers of CNKI database from 2000 to 2021 as an example. Sci. Insights Educ. Front. 2021, 10, 1381–1397. [Google Scholar] [CrossRef]
  48. Liu, Y. Research on the urban-rural integration and rural revitalization in the new era in China. Acta Geogr. Sin. 2018, 73, 637–650. [Google Scholar] [CrossRef]
  49. Bi, G.; Yang, Q. The spatial production of rural settlements as rural homestays in the context of rural revitalization: Evidence from a rural tourism experiment in a Chinese village. Land Use Policy 2023, 128, 106600. [Google Scholar] [CrossRef]
  50. Ahlmeyer, F.; Volgmann, K. What Can We Expect for the Development of Rural Areas in Europe?—Trends of the Last Decade and Their Opportunities for Rural Regeneration. Sustainability 2023, 15, 5485. [Google Scholar] [CrossRef]
  51. Stenbacka, S.; Cassel, H.S. Planning for socially sustainable rural housing in Sweden. J. Rural. Stud. 2024, 110, 103377. [Google Scholar] [CrossRef]
  52. Pałka-Łebek, E.; Kiniorska, I. Classification of rural areas in Poland in the context of revitalization. J. Geogr. Politics Soc. 2019, 9, 44–56. [Google Scholar] [CrossRef]
  53. Hasddin; Ishak, A.; Jasman, J.; Kasim, S.; Haydir, S.T.; Asrul; Maladeni, E.S.; Taufik. Tourism village planning based on activity zoning and stakeholder participation. J. Dep. Geogr. Tour. Hotel. Manag. 2025, 54, 118–127. [Google Scholar] [CrossRef]
  54. Berriet-Solliec, M.; Diallo, A.; Gendre, C.; Larmet, V.; Lépicier, D.; Védrine, L. The National Rural Development Programme in France: How Does It Contribute to the Attractiveness of Regions? Econ. Et Stat./Econ. Stat. 2022, 534–535, 83–101. [Google Scholar] [CrossRef]
  55. Robert-Boeuf, C. Promoting Rural Regeneration and Sustainable Farming near Cities Thanks to Facilitating Operators in France? The Case of the Versailles Plain’s Association Governance Model. Sustainability 2023, 15, 7219. [Google Scholar] [CrossRef]
  56. Karami, M.; Madlener, R. Sustainability performance of rural municipalities in Germany. Energy Sustain. Soc. 2023, 13, 19. [Google Scholar] [CrossRef]
  57. Lorna, P.; Williams, F. Healthy Ageing in Smart Villages? Observations from the Field. Europ. Countrys. 2019, 11, 616–633. [Google Scholar] [CrossRef]
  58. Ministarstvo za Brigu o Selu. Konkurs za Dodelu Bespovratnih Sredstava za Kupovinu Seoske Kuće sa Okućnicom na Teritoriji Republike Srbije za 2021. Godinu [Ministry of Rural Care. Competition for the Allocation of Non-Reimbursable Funds for the Purchase of a Country House with a Yard in the Territory of the Republic of Serbia for 2021]; Ministarstvo za Brigu o Selu: Beograd, Serbia, 2021. [Google Scholar]
  59. Drobnjaković, M.; Panić, M. Introduction of the Approach for Reviving the Sub-Municipal Level as a Spatial Aspect of Decentralization in Serbia. Land 2024, 13, 752. [Google Scholar] [CrossRef]
  60. Bento, R.; Peixeira Marques, C.; Guedes, A. Rural tourism in Portugal: Moving to the countryside. J. Maps 2022, 18, 79–88. [Google Scholar] [CrossRef]
  61. Nikitović, V. Srbija kao imigraciona zemlja—Očekivana budućnost? [Serbia as an immigration country—The expected future?]. Stanovništvo 2009, 1, 31–52. [Google Scholar]
  62. Rašević, M. Odgovor Srbije na demografske izazove: Stanje i očekivanja [Serbia’s response to demographic challenges: Status and expectations]. In Stanovništvo i Razvoj; Vukotić, V., Ed.; Institut Društvenih Nauka: Beograd, Serbia, 2012; pp. 20–28. [Google Scholar]
  63. Martinović, M.; Ratkaj, I. Sustainable rural development in Serbia: Towards a quantitative typology of rural areas. Carpathian J. Earth Environ. Sci. 2015, 10, 37–48. [Google Scholar]
  64. Živanović, V.; Joksimović, M.; Golić, R.; Malinić, V.; Krstić, F.; Sedlak, M.; Kovjanić, A. Depopulated and abandoned areas in Serbia in the 21st century—From a local to a national problem. Sustainability 2022, 14, 10765. [Google Scholar] [CrossRef]
  65. Pogrmić, Z.; Bubalo-Živković, M.; Đerčan, B.; Sekulić, M. Demographic study: Aging in the context of urban decline in Vojvodina cities. Glas. Srp. Geogr. Drus. 2024, 104, 61–94. [Google Scholar] [CrossRef]
  66. Malinić, V.; Sedlak, M.; Krstić, F.; Joksimović, M.; Golić, R.; Gajić, M.; Vujadinovič, S.; Šabić, D. Land Cover Changes in the Rural Border Region of Serbia Affected by Demographic Dynamics. Land 2025, 14, 1663. [Google Scholar] [CrossRef]
  67. Igić, M.; Dinić Branković, M.; Vasilevska, L.; Živković, J. Development Problems and Potentials of Rural Settlements—Case study of Rural Settlements on the Territory of the City Municipality Pantelej, Niš. Archit. Civ. Eng. 2023, 21, 397–414. [Google Scholar] [CrossRef]
  68. UN-Habitat. Rural-Urban Linkages: Guiding Principles and Framework for Action to Advance Integrated Territorial Development; UN-Habitat: Nairobi, Kenya, 2018. [Google Scholar]
  69. Kojić, B. Seoska Arhitektura i Rurizam [Rural Architecture and Ruralism]; Građevinska Knjiga: Beograd, Srbija, 1973. [Google Scholar]
  70. Simonović, B. Sistem Seoskih Naselja u Užoj Srbiji [The System of Rural Settlements in Inner Serbia]; Institut za arhitekturu i urbanizam Srbije: Beograd, Srbija, 1976. [Google Scholar]
  71. World Bank. Infrastructure and Development in Rural Areas: Serbia Case Study; World Bank Reports: Washington, DC, USA, 2017. [Google Scholar]
  72. SORS. Popis stanovništva, domaćinstava i stanova 2022. Godine. In Uporedni Pregled Broja Stanovnika 1948, 1953, 1961, 1971, 1981, 1991, 2002, 2011. i 2022. Godine; Republički zavod za statistiku: Beograd, Srbija, 2023. [Google Scholar]
  73. Field, A. Discovering Statistics Using IBM SPSS Statistics, 5th ed.; SAGE: Newbury Park, USA, 2018. [Google Scholar]
  74. Jolliffe, I.T.; Cadima, J. Principal component analysis: A review and recent developments. Philos. Trans. R. Soc. A Math. Phys. Eng. Sci. 2016, 374, 20150202. [Google Scholar] [CrossRef]
  75. Hair, J.F.; Black, W.C.; Babin, B.J.; Anderson, R.E. Multivariate Data Analysis, 8th ed.; Cengage Learning: Andover, UK, 2019. [Google Scholar]
  76. Dunn, O.J. Multiple comparisons using rank sums. Technometrics 1964, 6, 241–252. [Google Scholar] [CrossRef]
  77. Chatterjee Samprit, H.S.A. Regression Analysis by Example-Fourth Edition; John Wiley & Sons, Inc.: Hoboken, NJ, USA, 2006. [Google Scholar]
  78. Bogdanov, N. Mala Ruralna Domaćinstva u Srbiji i Ruralna Nepoljoprivredna Ekonomija [Small Rural Households in Serbia and the Rural Non-Agricultural Economy]; UNDP: Beograd, Srbija, 2007. [Google Scholar]
  79. Ministarstvo Poljoprivrede, Šumarstva i Vodoprivrede. Strategija Poljoprivrede i Ruralnog Razvoja Republike Srbije za Period 2014–2024 [Strategy for Agriculture and Rural Development of the Republic of Serbia for the Period 2014-2024]; Ministarstvo Poljoprivrede, Šumarstva i Vodoprivrede: Beograd, Srbija, 2014. [Google Scholar]
  80. Mitrović, M.M. Nacionalni Program za Preporod Sela Srbije [National Programme for the Villages Revival]; Institut za Ekonomiku Poljoprivrede: Beograd, Srbija, 2020. [Google Scholar]
  81. Ministarstvo Poljoprivrede, Šumarstva i Vodoprivrede. Nacionalni Program Ruralnog Razvoja za Period 2022–2024 [National Rural Development Program for the Period 2022–2024]; Ministarstvo Poljoprivrede, Šumarstva i Vodoprivrede: Beograd, Srbija, 2022. [Google Scholar]
  82. Zhang, Y.; Dai, Z.; Chen, Y.; Li, Z.; Shan, X.; Wang, X.; Feng, Z.; Wu, K. The Impact of Rural Population Shrinkage on Rural Functions—A Case Study of Northeast China. Land 2025, 14, 1772. [Google Scholar] [CrossRef]
  83. Llases, L.; Mediavilla, J.; Lauer, A.; Gallego-Medina, R. Examining the Effects of Different Policy Approaches to Rural Depopulation Across Spanish Territories: Evidence From a Multi-Scenario Simulation Study. Popul. Space Place 2026, 32, e70229. [Google Scholar] [CrossRef]
  84. Mansilla-Quiñones, P.; Uribe-Sierra, S.E. Rural Shrinkage: Depopulation and Land Grabbing in Chilean Patagonia. Land 2024, 13, 11. [Google Scholar] [CrossRef]
  85. Mantino, F.; De Fano, G.; Asaro, G. Evaluating the Impact of Long-Term Demographic Changes on Local Participation in Italian Rural Policies (2014–2020): A Spatial Autoregressive Econometric Model. Land 2024, 13, 1581. [Google Scholar] [CrossRef]
  86. Mileto, C.; Vegas López-Manzanares, F. Strategies for the Regeneration of Rural Settlements Facing Depopulation: Analysis Methodology and Case Studies. Land 2024, 13, 1782. [Google Scholar] [CrossRef]
  87. Zamfirescu-Mareș, D.; Corman, S. Depopulation, Ageing, and Social Sustainability: Institutionalized Elderly and the Geography of Care Between Rural and Urban Romania. Sustainability 2025, 17, 10419. [Google Scholar] [CrossRef]
  88. Mróz, A.; Zwęglińska-Gałecka, D. Sustaining rural vitality: Lessons from Podlaskie, Poland. Eur. Plan. Stud. 2026, 34, 437–460. [Google Scholar] [CrossRef]
  89. Živković, M.B.; Đerčan, B.; Mlinarević, P.; Cimbaljević, M.; Pogrmić, Z.; Lukić, T.; Kalenjuk Pivarski, B.; Balotić, G.; Pljuco, D.; Lalić, M.; et al. Rural Tourism as a Factor of Rural Revitalization and Sustainability in the Republic of Serbia and Bosnia and Herzegovina. Sustainability 2025, 17, 5127. [Google Scholar] [CrossRef]
  90. Ciampa, F.; Marchiano, G.; Girard, L.F.; Angrisano, M. The Rural Village Regeneration for the European Built Environment: From Good Practices Towards a Conceptual Model. Sustainability 2025, 17, 2787. [Google Scholar] [CrossRef]
  91. Bassi, I.; Carzedda, M.; Iseppi, L. Innovative Local Development Initiatives in the Eastern Alps: Forest Therapy, Land Consolidation Associations and Mountaineering Villages. Land 2022, 11, 874. [Google Scholar] [CrossRef]
  92. Kalenjuk Pivarski, B.; Milić, Z.; Mitrović Milić, A.; Novaković, D.; Radević, D. The influence of geographical characteristics on the gastronomy of Montenegro: The role of education and sector positions in the perception of tourist potential. J. Dep. Geogr. Tour. Hotel. Manag. 2025, 54, 128–141. [Google Scholar] [CrossRef]
  93. Gatarić, D.; Ðerčan, M.B. Sustainable Development of Rural Tourist Settlements in Serbia: Building A Better Future for All. World Sustainability Series. In Handbook of Sustainable Development and Leisure Services; Lubowiecki-Vikuk, A., de Sousa, B.M.B., Đerčan, B., Leal Filho, W., Eds.; Springer Nature Switzerland AG: Cham, Switzerland, 2021; pp. 171–183. [Google Scholar] [CrossRef]
  94. Drobnjaković, M.; Panić, M.; Stanojević, G.; Doljak, D.; Kokotović Kanazir, V. Detection of the Seasonally Activated Rural Areas. Sustainability 2022, 14, 1604. [Google Scholar] [CrossRef]
  95. Ðerčan, B.; Gatarić, D.; Bubalo Živković, M.; Belij Radin, M.; Vukoičić, D.; Kalenjuk Pivarski, B.; Lukić, T.; Vasć, P.; Nikolić, M.; Lutovac, M.; et al. Evaluating Farm Tourism Development for Sustainability: A Case Study of Farms in the Peri-Urban Area of Novi Sad (Serbia). Sustainability 2023, 15, 12952. [Google Scholar] [CrossRef]
  96. Kalenjuk Pivarski, B.; Grubor, B.; Banjac, M.; Ðerčan, B.; Tešanović, D.; Šmugović, S.; Radivojević, G.; Ivanović, V.; Vujasinović, V.; Stošić, T. The Sustainability of Gastronomic Heritage and Its Significance for Regional Tourism Development. Heritage 2023, 6, 3402–3417. [Google Scholar] [CrossRef]
  97. Palang, H. From Collectivisation to Commodification: Transformations in Estonia’s Rural Landscape and Identity. Wieś i Rol. 2024, 4, 131–140. [Google Scholar] [CrossRef]
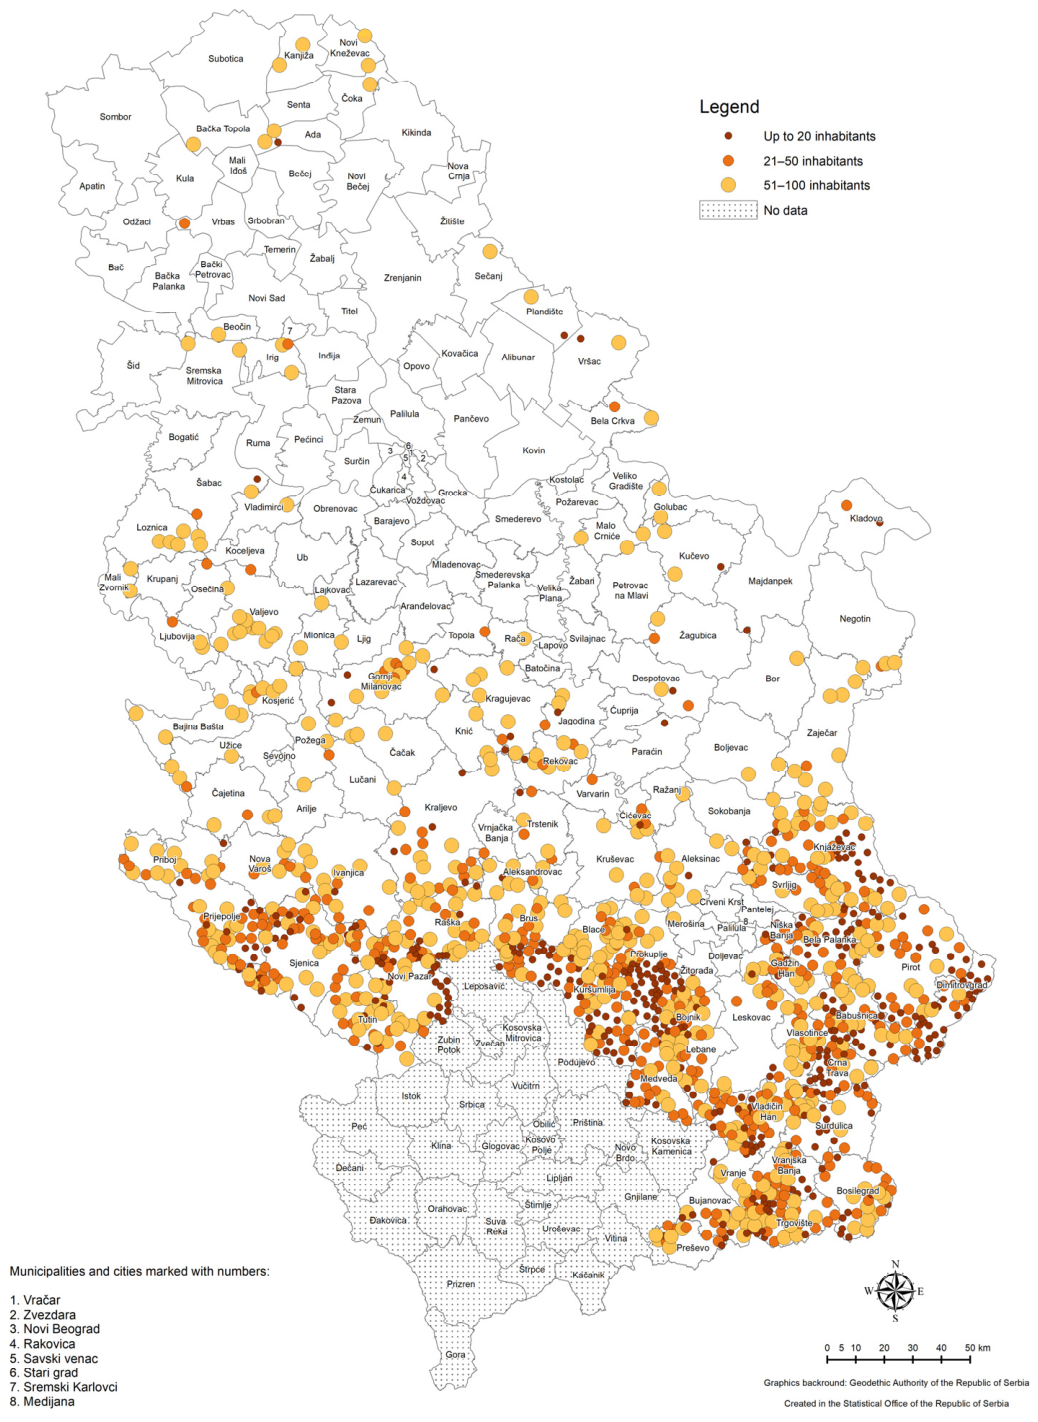
Figure 1. Spatial distribution of small settlements according to the 2022 Census. Source: [3].
Land 15 00723 g001
Figure 2. Spatial distribution of small settlement clusters, according to the 2022 Census. Source: authors, based on SORS data.
Land 15 00723 g002
Table 1. Spatial distribution of small settlements and population, 2022.
RegionNumber of Small SettlementsShare of Small Settlements in the Total Number of Small SettlementsPopulation in Small SettlementsShare of Population in the Total Population of Small Settlements
Belgrade Region
Vojvodina Region231.813772.5
Region of Šumadija and Western Serbia46035.323,28742.0
Region of Southern and Eastern Serbia81962.930,78055.5
Region of Kosovo and Metohija
Small settlements—total1302100.055,444100.0
Source: [3,72].
Table 2. Descriptive statistics of the analysed indicators.
IndicatorMeanSDMedianQ1Q3
Average altitude692.0295.0670.0470.0900.0
Distance from the municipal centre18.611.316.010.024.0
Population 202242.629.238.016.066.8
Population change index 2022/2002−56.131.7−61.0−72.4−47.2
Share of immigrants60.218.961.950.971.9
Share of autochthonous population83.528.6100.066.7100.0
Share of daily commuters40.634.038.90.066.7
Share of the economically active population in the total population22.116.020.810.032.5
Share of employed persons15.213.313.34.7921.9
Share of pensioners41.820.940.128.154.1
Share of agricultural population30.826.825.07.7447.6
Share of population aged 0–146.347.384.350.010.0
Share of population aged 65+43.420.941.129.455.6
Share of population aged 80+12.412.39.664.5616.7
Share of fertile population9.647.859.093.0514.9
Average age56.910.056.850.264.2
Ageing index688.0884.0400.0200.0767.0
Youth dependency ratio12.415.09.090.018.8
Old-age dependency ratio112.0120.075.047.8127.0
Total dependency ratio124.0117.089.561.5139.0
Share of married persons43.817.045.537.052.3
Share of persons without formal education and with incomplete primary education23.917.520.411.533.3
Share of persons with primary education31.616.130.422.240.0
Share of persons with secondary education32.116.731.821.442.9
Share of persons with higher education5.748.453.140.08.33
Share of elderly households40.721.540.026.753.8
Source: authors, based on SORS data.
Table 3. Results of PCA—structure matrix.
Indicator1234567
Average altitude−0.160−0.2130.053−0.298−0.063−0.1200.590
Distance from the municipal centre0.0770.026−0.086−0.055−0.133−0.1600.686
Population 2022−0.1870.2890.2700.596−0.121−0.097−0.205
Population change index 2022/2002−0.254−0.0170.3790.3790.1160.034−0.144
Share of immigrants0.072−0.0610.0830.0680.2190.7200.005
Share of autochthonous population−0.047−0.1810.0570.0490.166−0.7690.151
Share of daily commuters−0.0290.3120.0790.4450.093−0.039−0.127
Share of the economically active population in the total population−0.3660.756−0.0230.0430.0470.0780.022
Share of employed persons−0.2540.824−0.0020.1880.1170.0690.041
Share of pensioners0.762−0.232−0.3440.0690.0890.009−0.098
Share of agricultural population−0.1250.0960.0860.113−0.0190.0940.627
Share of population aged 0–14−0.318−0.0090.8970.059−0.048−0.0090.049
Share of population aged 65+0.863−0.181−0.3320.0310.0400.059−0.037
Share of population aged 80+0.6630.047−0.157−0.225−0.164−0.018−0.158
Share of fertile population−0.5320.1650.4980.1830.030−0.014−0.108
Average age0.726−0.130−0.622−0.105−0.0070.032−0.027
Ageing index0.1870.004−0.3990.433−0.057−0.189−0.129
Youth dependency ratio−0.142−0.0440.8930.042−0.0380.0100.037
Old-age dependency ratio0.826−0.168−0.0900.127−0.0190.0560.031
Total dependency ratio0.830−0.1780.0220.134−0.0240.0590.037
Share of married persons0.129−0.052−0.0060.6490.1140.1780.223
Share of persons without formal education and with incomplete primary education0.6660.144−0.040−0.292−0.370−0.1490.029
Share of persons with primary education−0.282−0.353−0.2840.173−0.6570.1500.197
Share of persons with secondary education−0.2840.222−0.0400.0620.697−0.058−0.252
Share of persons with higher education−0.011−0.067−0.0960.1120.6810.1390.026
Share of elderly households0.831−0.146−0.1820.0250.0840.084−0.135
Source: authors’ processing.
Table 4. Results of logistic regression.
PredictorβSEWalddfpOR95% CI (LL)95% CI (UL)
Intercept0.1680.5910.08110.7751.1830.3723.767
Share of population aged 65+0.0350.00819.0711<0.0011.0361.0201.052
Share of population aged 80+0.0150.0102.23210.1351.0150.9951.035
Old-age dependency ratio0.0020.0020.93510.3331.0020.9981.006
Distance from the municipal centre0.0440.00737.3561<0.0011.0451.0311.060
Average altitude0.0000.0001.51610.2181.0001.0001.001
Share of immigrants−0.0210.0086.86410.0090.9790.9630.995
Share of persons with higher education−0.0200.0085.32710.0210.9810.9640.997
Share of employed persons−0.0200.00514.1381<0.0010.9800.9700.990
Share of agricultural population−0.0080.0038.56710.0030.9920.9870.997
Source: authors’ processing.
Table 5. Cluster typology and policy implications.
ClusterDemographic PhaseDevelopment PathwayPublic Policy Priorities
Cluster 1—Spatially accessible, demographically depleted settlementsPost-reproductive phase of the rural cycle; advanced ageing and a weakened reproductive baseTransformation into residential rural settlements integrated into functional urban regionsDemographic revitalisation (subsidies for young families), renovation of housing stock, development of daily mobility, digital infrastructure, and support for remote work
Cluster 2—Settlements with the most pronounced demographic regressionTerminal phase of depopulation; extreme ageing and persistent migration deficitSelective revitalisation of sustainable cores and functional spatial consolidationIntegrated development strategies, concentration of public services, Smart Village initiatives, and the repurposing of space for ecological, tourism, or cultural functions
Cluster 3—Peripheral mountainous and agricultural settlementsStabilised small population with an agrarian orientationEndogenous development based on landscape capital and local productsAgri-tourism, branding of local products, organic production, integration of tourism and agriculture, and the development of gastronomic and tourism routes
Cluster 4—Demographically vital, economically passive settlementsRelatively young population with insufficient economic activationActivation of the working-age population through emerging economic sectorsDigital economy, development of micro-enterprises, energy communities, cooperative business models, and support for local entrepreneurship
Source: authors’ interpretation.
Disclaimer/Publisher’s Note: The statements, opinions and data contained in all publications are solely those of the individual author(s) and contributor(s) and not of MDPI and/or the editor(s). MDPI and/or the editor(s) disclaim responsibility for any injury to people or property resulting from any ideas, methods, instructions or products referred to in the content.