


Abstract
This study analyses the influence of three-dimensional (3D) urban form on intra-urban thermal variability and its long-term evolution in Zagreb, Croatia. The research focuses on four residential districts (Špansko sjever, Dugave, Lanište, and Novi Jelkovec) representing different development periods. The central hypothesis is that differences in the development period and urban compactness are associated with differences in summer thermal patterns, with more open spatial configurations generally exhibiting weaker thermal responses than more compact developments. The methodology integrates LiDAR-derived building morphology with a decade-long Landsat time series (2015–2024), including land surface temperature (LST), normalized difference vegetation index (NDVI), and normalized difference built-up index (NDBI). The results indicate a consistent increase in summer LST across all analysed neighbourhoods, with warming rates ranging from approximately 2.00 to 2.83 °C per decade. Built-up intensity shows a positive association with temperature, while vegetation trends are generally weak. A multiple linear regression model explains 47% of the variance in LST (R2 = 0.47), with NDBI identified as a significant predictor (p < 0.01), whereas NDVI and volumetric building density are not statistically significant. Despite this, neighbourhoods with higher volumetric building density (up to ≈2.96 m3/m2) tend to exhibit stronger warming trends compared to lower-density areas (≈1.69 m3/m2), indicating the additional explanatory value of three-dimensional urban morphology. These findings support the concept of a volumetric expression of urban thermal processes, while highlighting that 3D urban morphology contributes to the interpretation of the long-term thermal patterns when considered alongside other factors. They also emphasize the importance of integrating 3D spatial metrics into climate-sensitive urban planning and mitigation strategies.
1. Introduction
The urban heat island (UHI) phenomenon is a major urban climate issue associated with urbanization, land surface modification, and climate change. LST is widely used as a proxy for assessing UHI intensity. Cities tend to record higher temperatures than surrounding rural areas due to a high share of impervious surfaces, reduced vegetation cover, altered energy balance, and complex urban geometry [1,2]. UHI has important implications for quality of life, energy consumption, public health, and climate adaptation [3]. Therefore, it is essential to understand the key drivers of land surface temperature (LST) [1,2] and the possibilities for its mitigation through spatial planning [4,5].
Previous research consistently shows that land use and land cover play a major role in shaping the spatial distribution of LST. Industrial and densely built-up zones typically exhibit the highest LST, while vegetated and water surfaces have a pronounced cooling effect [6,7]. These patterns have been confirmed across different urban environments, where built-up intensity, transport infrastructure, and higher density increase heat stress, while vegetation reduces it through evapotranspiration and shading [8,9]. Many studies report a negative relationship between vegetation indicators, such as the normalized difference vegetation index (NDVI), and LST, as well as a positive relationship between built-up indicators, such as the normalized difference built-up index (NDBI) [10,11,12]. The cooling role of urban green spaces, particularly those with higher tree cover, has been widely recognized as one of the most effective natural mechanisms for mitigating UHI [13,14,15].
A large body of work relies on remote sensing approaches, especially the combination of LST, NDVI, and NDBI, which enables detailed monitoring of spatial patterns and the temporal dynamics of urban heat [16,17]. Long-term analyses based on multi-year satellite datasets further show that urban expansion and vegetation loss are associated with gradual increases in LST over time [18]. Landsat data are among the most widely used sources for this purpose because they contain thermal channels and allow for their long-term comparison.
Beyond land cover, research increasingly emphasizes the importance of urban form, including building density and spatial configuration [19]. However, these approaches are often based on simplified 3D indicators. These indicators do not fully capture the complexity of urban processes or the interactions between surface and structural characteristics of urban space [20,21]. Two-dimensional indicators do not account for the vertical structure of the city, including building height, volumetric arrangement, and shading effects, which play a significant role in urban thermal behaviour [22].
Recent studies, therefore, highlight the growing importance of three-dimensional urban morphology in explaining UHI patterns. Variables such as building height, density, and volumetric characteristics have been shown to significantly contribute to variations in LST and to improve model performance when combined with traditional land-cover indicators [23,24,25]. The influence of 3D morphology is not uniform but varies depending on the spatial scale, season, and urban context, reflecting complex and often nonlinear relationships between urban structure and thermal conditions [24,26,27]. Comparative studies across different cities further indicate that UHI patterns are not universal but depend on the specific morphological and climatic characteristics [28].
The development of 3D urban morphology analysis is closely linked to the availability of high-resolution data, particularly Light Detection and Ranging (LiDAR) and its integration with vector building data. LiDAR enables precise modelling of the digital surface model (DSM) and the digital terrain model (DTM), as well as the reconstruction 3D building structures described through attributes such as height, roof shape, and volume [29,30]. Combining LiDAR-derived urban morphology with long-term Landsat observations enables the analysis of relationships between urban form and thermal dynamics. It also supports the transition from two-dimensional to 3D urban models [31,32].
Building on these developments, recent research increasingly focuses on the integration of two-dimensional and 3D indicators of urban form. Such approaches have been shown to increase the explained variance of the surface temperature compared with models based on a single group of variables and to provide a more comprehensive understanding of urban thermal processes [25,33,34]. In addition, data-driven approaches are increasingly used to model these relationships and to support practical applications in urban planning and heat mitigation, including, in some cases, machine learning-based approaches [35,36,37,38]. Furthermore, integrated datasets combining morphological and spectral variables support the development of models that link the city’s three-dimensional structure with urban heat island intensity [32,35,38].
In the regional context, UHI research for the City of Zagreb remains relatively limited, although it has become more frequent and methodologically diverse in recent years. Existing studies confirm a strong influence of urbanization and vegetation loss on increasing surface temperatures, consistently highlighting differences between built-up and green areas [39,40]. Satellite-based analyses show that the highest temperatures are concentrated in densely built-up urban zones, while studies based on meteorological observations confirm the presence of UHI intensity that varies by season and local climatic conditions [41,42]. More recent work further links satellite-derived indicators with spatial planning metrics and identifies zones of elevated heat load [41,43]. Long-term analyses suggest that increasing temperatures in Zagreb are influenced not only by land-use change but also by broader climatic trends [44], while the importance of green infrastructure and nature-based solutions for mitigation is increasingly emphasized [45].
To further conceptualize the role of 3D urban structure in urban thermal processes, the concept of a volumetric expression of the urban heat island can be formalized by linking urban morphology with thermal response. Volumetric urban morphology—including building height, spatial configuration, and volumetric density—acts as a factor influencing thermal conditions in the urban environment, particularly through processes of ventilation and heat accumulation [46], and more broadly through radiative exchange, the surface energy balance, and heat fluxes [47]. In this context, volumetric UHI can be defined as the component of thermal variability arising from the 3D configuration of built structures, beyond the effects of two-dimensional land-cover characteristics. Operationally, this implies that LST or its temporal trend can be empirically modelled as a function of 2D (NDVI, NDBI) and 3D (volumetric density) variables. Although the results of this study indicate a positive relationship between volumetric density and warming, this relationship should be interpreted as indicative. Therefore, volumetric UHI can be understood as an extension of the classical UHI concept, where the vertical structure of the city represents an additional layer that modulates the intensity of urban warming.
Despite the research, significant methodological gaps remain. Although two-dimensional and 3D indicators of urban structure are increasingly being analysed, their integration within multi-year satellite-derived LST time series remains limited, particularly at the neighbourhood scale [48]. This limits the understanding of how the three-dimensional structure of the city influences not only the spatial distribution of LST but also its long-term dynamics and temporal evolution. In addition, different types of urban structure can generate substantially different LST responses, which, without a comparative approach across multiple neighbourhoods, remain insufficiently explored [49]. Furthermore, relatively few studies combine LiDAR data, building footprints, and long-term thermal datasets within a unified analytical framework [50].
To address these limitations and to improve the understanding of the relationship between urban morphology and the surface temperature, this study provides a novel integration of a ten-year Landsat time series (2015–2024) with 3D indicators of urban structure derived from LiDAR data. These indicators include building height and volumetric density. The analysis simultaneously examines long-term LST trends, relationships between 3D indicators (NDVI, NDBI) and temperature, and the influence of volumetric urban morphology on the spatial and temporal dynamics of the LST patterns, through a comparative analysis of multiple urban neighbourhoods in Zagreb, Croatia. This approach goes beyond the limitations of existing studies that analyse individual groups of variables, enabling an integrated assessment of the interactions between two-dimensional and 3D indicators in shaping LST patterns. In doing so, it provides one of the few comprehensive analytical frameworks that links multi-year satellite data with detailed 3D urban morphology at the neighbourhood scale.
2. Materials and Methods
2.1. Study Area
The study was conducted in the city of Zagreb, the capital of the Republic of Croatia, located in the northwestern part of Croatia (45°48′ N, 15°58′ E). With approximately 800,000 inhabitants, Zagreb represents the largest urban agglomeration in Croatia and exhibits pronounced morphological diversity, ranging from historical urban cores to large modernist housing estates built during the second half of the twentieth century, as well as more recent high-density residential developments.
The city is situated at the transition between the Pannonian Plain and the southern slopes of Mount Medvednica, a geographical setting that significantly influences its climatic and microclimatic conditions. Zagreb has a moderate continental climate (Cfb according to the Köppen–Geiger classification), characterized by cold winters and warm summers. The mean annual air temperature is approximately 11.5 °C, with average monthly values ranging from −0.5 °C in January to 22.5 °C in July. Average annual precipitation ranges between 850 and 900 mm, with peaks occurring in late spring and early autumn. In recent decades, the increasing frequency of summer heat waves has further emphasized the importance of understanding the spatial variability of microclimatic conditions and the dynamics of the urban thermal environment.
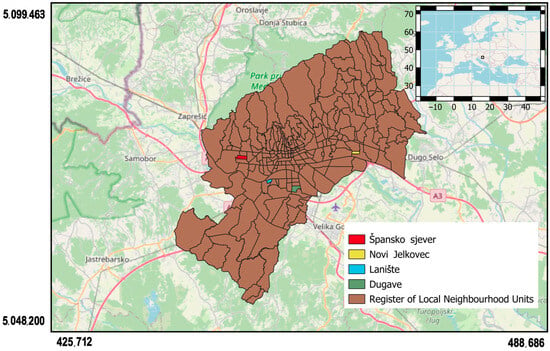
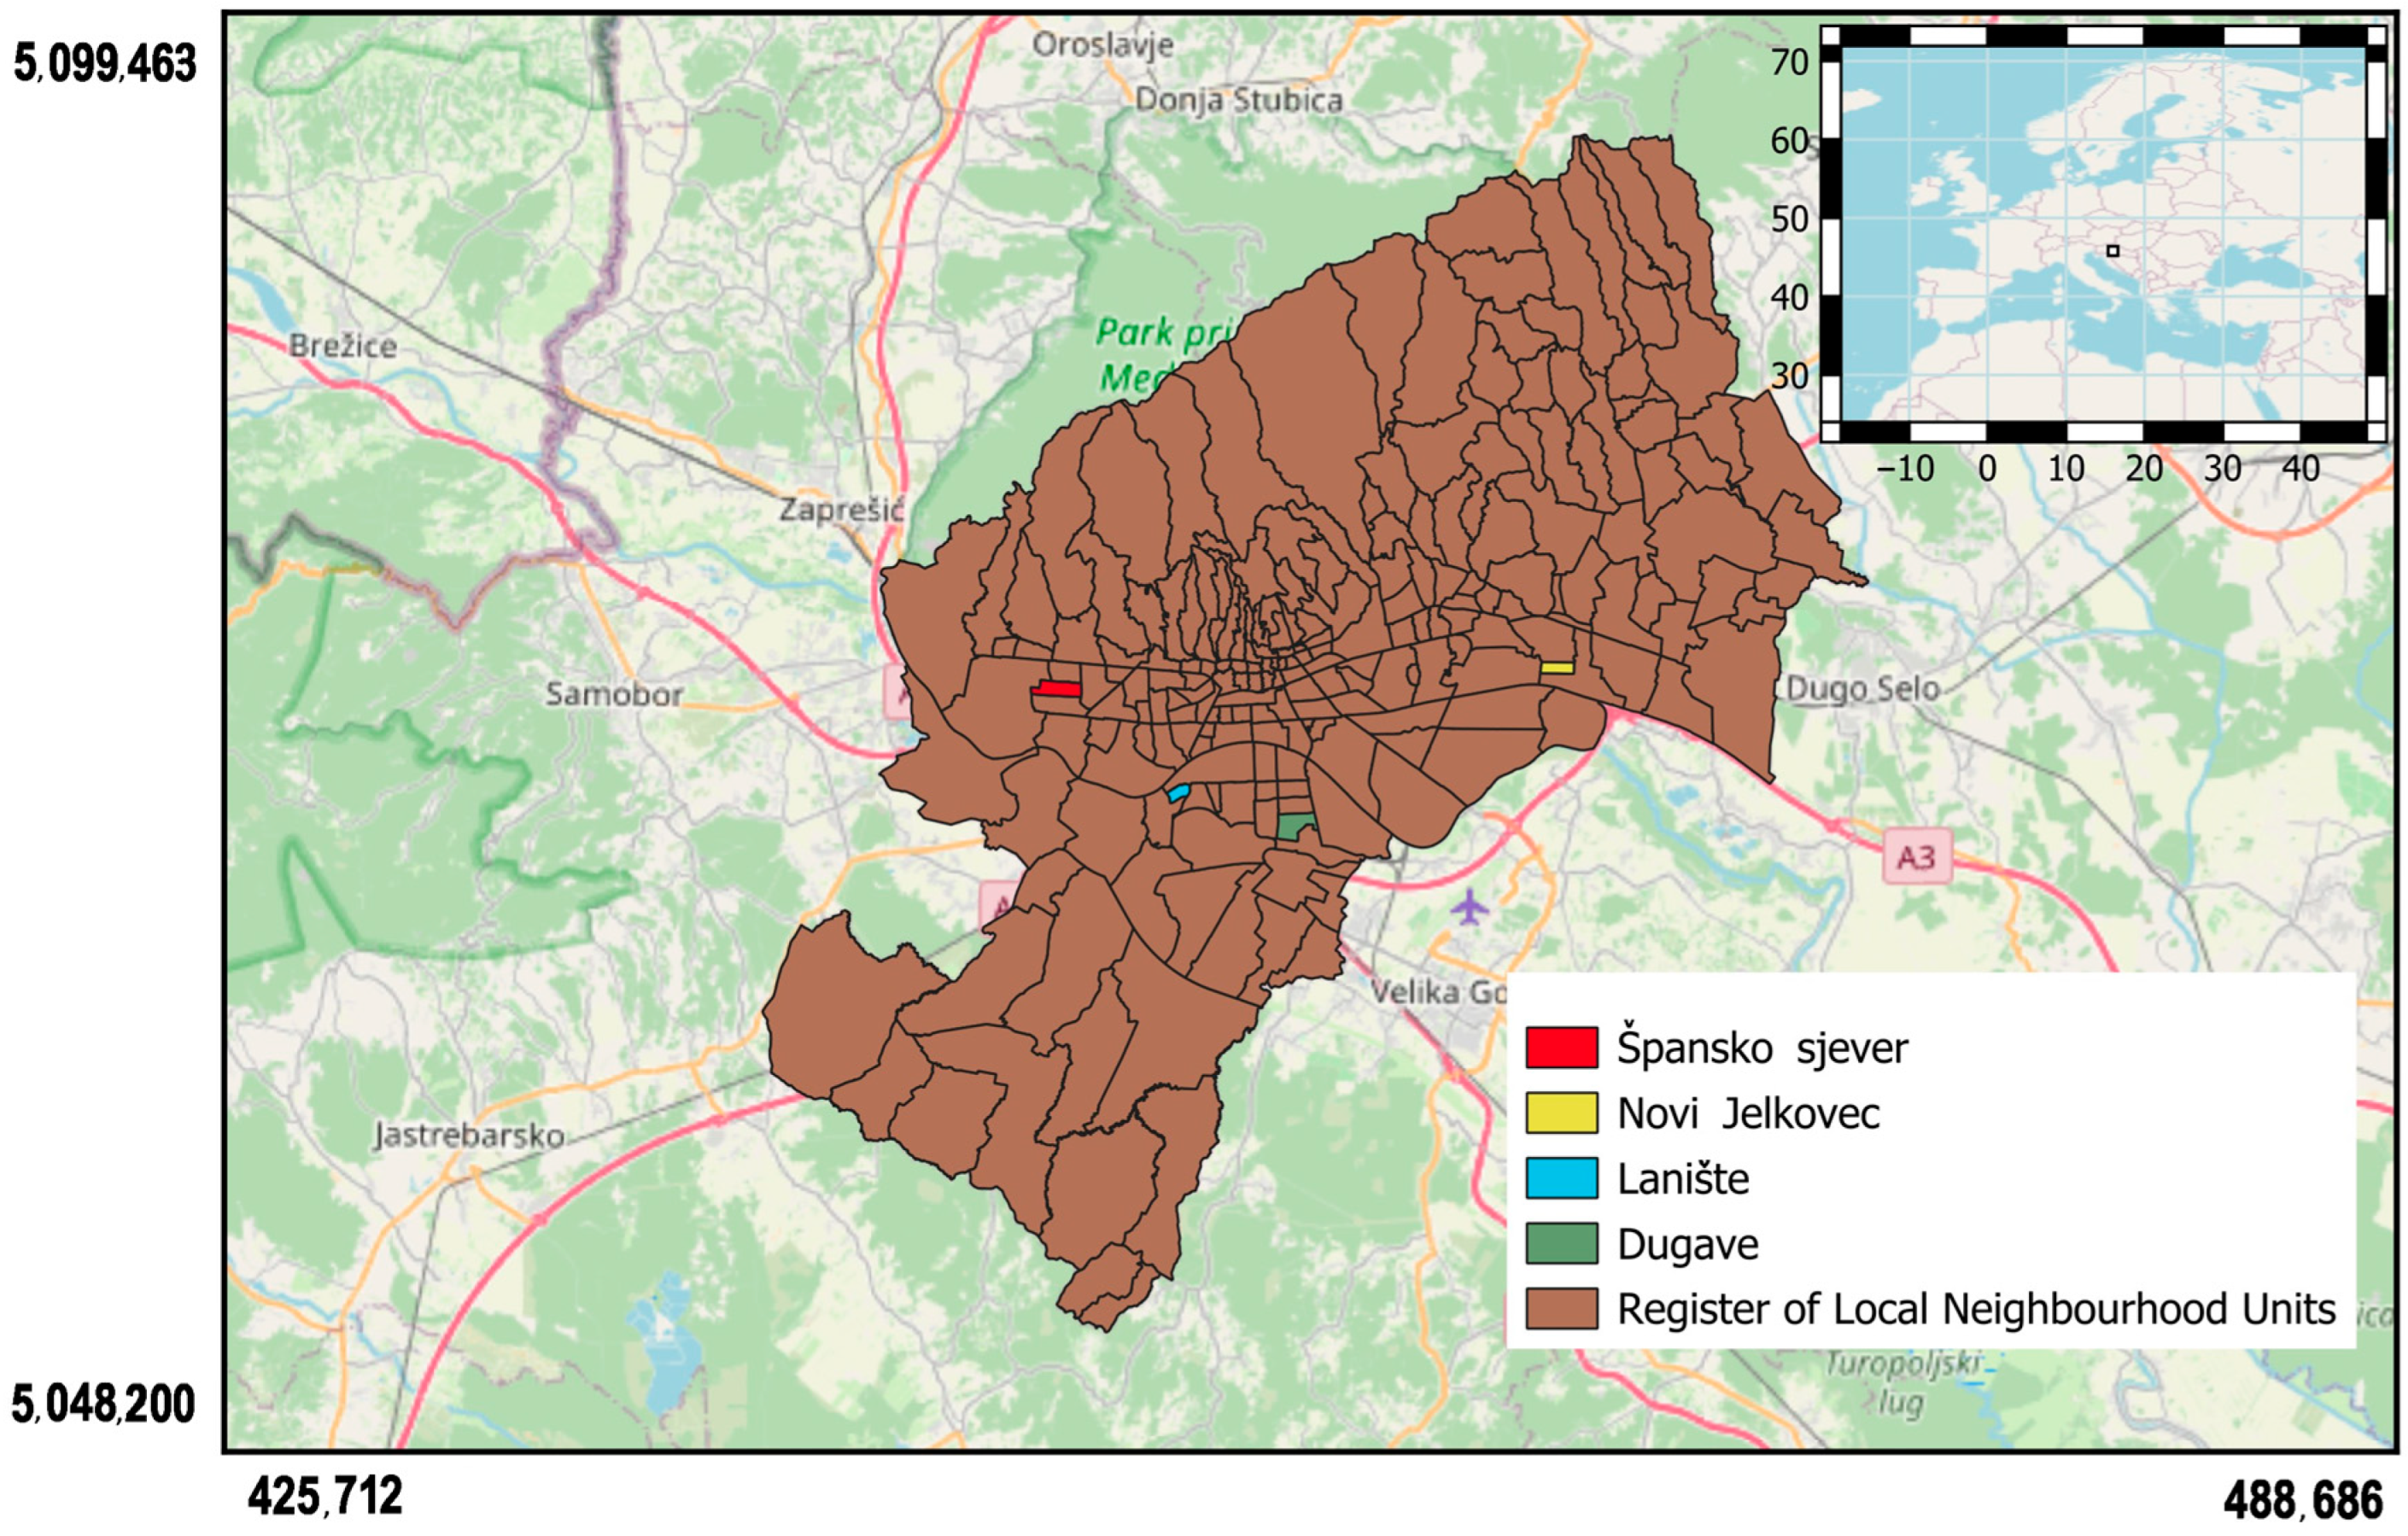
To analyse the relationship between 3D urban form and intra-urban thermal patterns, four neighbourhoods within Zagreb were selected as case-study areas (Dugave, Špansko sjever, Lanište and Novi Jelkovec; Figure 1). These areas represent different phases of residential development and contrasting urban morphological conditions within the city, ranging from more open and vegetation-rich areas (Dugave, Špansko sjever) to more compact and highly built environments (Lanište, Novi Jelkovec). This selection enables a comparative analysis of different urban configurations while maintaining a manageable number of cases for detailed multi-source analysis. Although the sample size is limited, the selected neighbourhoods capture a range of typical urban forms present in the city, allowing for meaningful comparison of thermal and morphological patterns.
Figure 1.
Study area showing the location of the four analysed neighbourhoods within the City of Zagreb, including an overview map of the study area within the broader European context. The four neighbourhoods are highlighted as follows: Spansko sjever (red), Novi Jelkovec (yellow), Laniste (blue), and Dugave (green), while the remaining areas are shown in brown.
The spatial boundaries used in the analysis correspond to administrative units known as Local Neighbourhood Councils (LNCs), with boundaries obtained from the Zagreb Geoportal (ZG Geoportal) [51], the official spatial data infrastructure platform of the Zagreb that integrates spatial datasets produced by municipal institutions and urban management authorities and provides open access to a wide range of spatial layers related to urban infrastructure, administrative divisions, and thematic datasets. The official boundaries dataset provides polygon boundaries for 218 neighbourhood units within the city. The neighbourhood polygons were downloaded in vector format and refined within a GIS environment to define the final areas of interest (AOI).
The use of LNC boundaries is methodologically justified, as they represent clearly defined local administrative units that correspond to urban planning structures such as residential blocks, infrastructure systems, and public spaces. Their use reduces subjectivity in defining spatial units and enables integration with demographic and planning datasets commonly organised within the same framework. In addition, this spatial level allows the identification of intra-neighbourhood variability in building typology, density, and vegetation structure, while avoiding excessive spatial averaging and supporting the interpretation of results in the context of urban planning and climate-adaptation strategies.
The analysed neighbourhoods represent different phases of Zagreb’s residential development. Špansko sjever and Dugave belong to large modernist housing estates developed during the expansion of Novi Zagreb in the 1970s and 1980s, characterised by block-based residential structures and extensive planned green spaces. In contrast, Lanište and Novi Jelkovec represent more recent developments (post-2000), characterised by higher residential density, mixed residential–commercial functions, and different spatial organisation of open spaces. Novi Jelkovec was developed within the Croatian social housing programme (POS), while Lanište evolved as a high-density residential and commercial zone associated with new urban infrastructure, including Arena Zagreb and major transport corridors.
The four analysed neighbourhoods are summarised in Table 1, which presents their key morphological characteristics, while the functional and planning context is described in the following text. Špansko sjever is a planned residential neighbourhood with a medium–high density and systematically integrated green areas, including tree-lined streets and playgrounds. Dugave represents a block-based residential neighbourhood with a medium density and extensive inter-block green spaces, reflecting the concept of “green neighbourhoods”. Lanište is a high-density residential and commercial area with fragmented vegetation and a high proportion of impervious surfaces. Novi Jelkovec is a high-density residential area with limited mature vegetation and developing green infrastructure.
Table 1.
Characteristics of the analysed LNCs.
Surface area is expressed in hectares (ha), a unit commonly used in urban planning studies. The selected neighbourhoods range from approximately 28 to 85 ha, corresponding to roughly 300–900 Landsat pixels (30 m resolution), which ensures a sufficiently large sample size for statistically robust neighbourhood-scale analysis of the land surface temperature and related indicators.
The data presented in Table 1 were derived from spatial datasets available through the Zagreb Geoportal [51]. Population data were obtained from the 2021 Population Census published by the Croatian Bureau of Statistics [52], while residential density values were calculated using population counts and corresponding neighbourhood areas. Information on the construction period and residential typology was derived from urban planning documentation and relevant literature. Descriptions of green structure and urban characteristics were based on visual interpretation of orthophoto imagery and a morphological assessment using GIS tools QGIS 3.42.1 (QGIS Development Team, Zurich, Switzerland).
The variables presented in Table 1 represent key morphological and land-cover characteristics associated with variations in urban thermal behaviour and intra-urban thermal patterns.
2.2. Data Sources
This study integrates multiple geospatial datasets, including LiDAR data obtained from the State Geodetic Administration (DGU) [53], Landsat satellite imagery obtained from the USGS Earth Explorer platform, and vector layers from the Croatian State Topographic Database—the Digital Cadastral Plan (DKP). These data sets were combined to leverage their complementary characteristics: LiDAR provides high-resolution three-dimensional information on the terrain and above-ground objects, while Landsat imagery enables the monitoring of temporal changes in vegetation and thermal indicators. Vector layers from DKP were used to define building locations and footprints, enabling spatial linkage with other datasets and supporting the analysis of urban structures.
The integration of LiDAR-derived urban morphology and long-term Landsat observations enables the analysis of the relationships between urban form and thermal dynamics. LST was derived from Landsat 8/9 Collection 2 Level-2 surface temperature products (ST_B10), which provide atmospherically corrected land surface temperature and already include surface emissivity correction based on the ASTER Global Emissivity Database. The data were processed using the official scaling factors and converted to degrees Celsius.
NDVI and NDBI were derived from Landsat 8/9 Operational Land Imager (OLI) surface reflectance data. All Landsat products were harmonized to a common spatial resolution of 30 m, and scenes with cloud cover over the study area were excluded from the research.
The integration of all datasets (Table 2) enables a comprehensive spatio-temporal analysis of the urban environment and its thermal patterns, reducing the limitations of individual datasets.
Table 2.
Data sources used in the study and their main characteristics.
2.3. Urban Morphology Extraction from LiDAR
The LiDAR dataset was used to generate the digital surface model (DSM) and the digital terrain model (DTM) with a spatial resolution of 1 m [43]. A normalized digital surface model (nDSM) was subsequently derived and clipped to the polygons of the selected neighbourhoods to spatially constrain the analysis to the target urban areas.
Since the raw nDSM does not distinguish buildings from vegetation, a building footprint layer derived from the DKP was used to filter out non-building objects and ensure that the subsequent analysis included only buildings. Building height statistics were then calculated from the nDSM using the Zonal Statistics tool in QGIS 3.42.1 (QGIS Development Team, Zurich, Switzerland). The maximum value was interpreted as an approximation of the total building height, while the mean value was used to assess structural homogeneity and reduce the influence of outliers.
The selection of morphological indicators was guided by both physical relevance and methodological considerations. The aim was to retain fundamental and directly interpretable variables while ensuring consistency with the proposed volumetric framework. Building height and volumetric density were therefore selected as the primary indicators of 3D urban morphology, as they directly represent the fundamental geometric properties of the built environment, including vertical structure and built volume. These parameters provide a physically grounded basis for analysing thermal response. They directly influence heat storage, airflow, and radiative exchange within the urban canopy layer. Although other 3D indicators are commonly used in urban climate studies, such as the sky view factor (SVF) or surface roughness, they are often related to or influenced by fundamental geometric characteristics such as building height and built density. For example, SVF represents a dimensionally reduced measure of the urban geometry based on the degree of sky obstruction, synthesizing the effects of building height and density [54].
The derived building height metrics were subsequently analysed together with satellite-derived NDVI, NDBI, and LST variables, enabling the integration of 3D urban morphology with surface-based indicators of vegetation, built-up intensity, and thermal behaviour.
In this framework, LiDAR-derived morphological metrics represent a relatively stable description of the urban structure, while multi-year Landsat observations capture the temporal variability of vegetation and the LST. The combination of static 3D urban morphology and long-term satellite-derived thermal signals provides a robust basis for analysing the relationships between urban form and the evolution of intra-urban thermal patterns over time.
High-resolution LiDAR data (1 m) were aggregated to a 30 m × 30 m grid to ensure spatial consistency with the Landsat-derived variables and to enable the integration of multiple data sources. While this aggregation reduces fine-scale micro-variability in urban morphology and may lead to a partial loss of structural detail, it enables a scale-consistent comparison and captures the dominant volumetric characteristics relevant for the LST patterns. The resulting harmonized data set provided the basis for subsequent spatial and statistical analyses. These analyses investigated relationships between urban morphology, land cover, and LST patterns. The results primarily reflect neighbourhood-scale thermal patterns, while micro-scale variability is incorporated within the aggregated signal and interpreted in accordance with this spatial scale.
2.4. Landsat Data Processing
To reduce the influence of extreme conditions (e.g., prolonged periods of heat or humidity), data from a ten-year period (2015–2024) were included in this study. This approach enables the extraction of a more stable and representative microclimatic signal. It also reduces the influence of interannual anomalies and seasonal variability.
The products of remote sensing methods (LST, NDVI, and NDBI) were calculated for the period 2015–2024, ensuring temporal consistency between different sensors and producing a homogeneous signal without major discontinuities. Here too, to reduce the impact of seasonal variability and anomalous phenomena, annual values of LST, NDVI, and NDBI were generated using a median composite based on all available Landsat scenes during the summer period (June–August). The analysis was limited to the summer months because urban thermal contrasts in temperate climates are most pronounced during the warmer part of the year, when temperature contrasts between built-up and vegetated surfaces are strongest.
Prior to compositing, Landsat 8/9 Collection 2 Level-2 scenes were subjected to a quality assurance (QA)-based filtering process in the Google Earth Engine environment. A scene-level filter (cloud cover < 20%) was applied to exclude highly contaminated scenes, while pixel-level cloud masking was performed using the QA_PIXEL band. Pixels affected by clouds, cloud shadows, cirrus, and snow were identified and excluded using bitwise masking. Only QA-screened pixels from individual scenes were retained, and median composites were subsequently generated for each summer period for LST, NDVI, and NDBI.
LST was obtained from the Landsat Collection 2 Level-2 surface temperature product (ST_B10), which provides atmospherically corrected land surface temperature and includes surface emissivity correction based on the ASTER Global Emissivity Database. The values were converted to degrees Celsius using the official scaling factors provided in the Landsat metadata. The applied scaling factors (0.00341802 and 149.0) follow the official Landsat Collection 2 Level-2 product specifications provided by the U.S. Geological Survey [55].
where ST_B10 denotes the scaled pixel values of the Landsat Collection 2 Level-2 surface temperature product. These values already represent atmospherically corrected land surface temperature with emissivity correction applied. The above equations were used only to apply the official scaling factors and convert temperature from Kelvin to degrees Celsius.
NDVI and NDBI were calculated from Landsat 8/9 Operational Land Imager (OLI) surface reflectance data using the standard formula:
Scaled surface reflectance values were used, applying the scale and offset coefficients provided in the Landsat metadata. The NDBI was calculated analogously using the SWIR and NIR bands:
where represents the median reflectance value of the corresponding Landsat spectral band.
LiDAR data (2022/2023) were treated as a static representation of the 3D urban structure, under the assumption that no significant changes in volumetric characteristics (building height and spatial configuration) occurred in the analysed neighbourhoods during the study period. This assumption is justified because these neighbourhoods were largely built before the beginning of the study period, and have not undergone major redevelopment processes, while potential changes are mainly associated with vegetation and surface characteristics. As an additional verification of the stability of the built-up pattern, built-up masks derived from NDBI were compared between the beginning and the end of the study period, revealing no significant spatial changes in the distribution of built-up areas.
Although NDBI does not capture vertical (volumetric) changes, it provides an indirect indication of the horizontal stability of the built-up structure. Given the spatial resolution of the Landsat data (30 m), as further detailed in Section 2.5, potential minor vertical changes (e.g., building upgrades or additions) are assumed to have a negligible impact on the aggregated thermal patterns. This scale alignment further ensures that LiDAR-derived volumetric characteristics are interpreted consistently with the spatial resolution of Landsat-based LST observations.
This approach implies the assumption of temporal stability of urban morphology, which may represent a potential source of bias in the analysis of long-term thermal trends. However, given the limited changes in built-up areas within the analysed neighbourhoods during the study period, as well as the confirmed stability of the spatial distribution of built surfaces, as further supported by the analysis presented in the preceding section, the impact of this assumption is limited. Consequently, the results are primarily interpreted in the context of the dominant long-term relationships between urban morphology and thermal patterns, rather than short-term or local changes in the structure of the built environment. Accordingly, the results are only moderately sensitive to this assumption.
After generating the annual composites, zonal statistics (mean and standard deviation) were calculated for each urban neighbourhood and year, enabling both spatial and interannual comparisons. In addition, GeoTIFF rasters (30 m) were produced for LST, NDVI, and NDBI, as well as multilayer stacks (LST_stack and NDVI_stack), which support further spatial analysis and visualization.
2.5. Spatial Integration and Analytical Framework
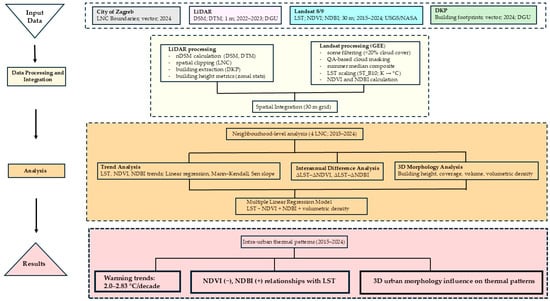
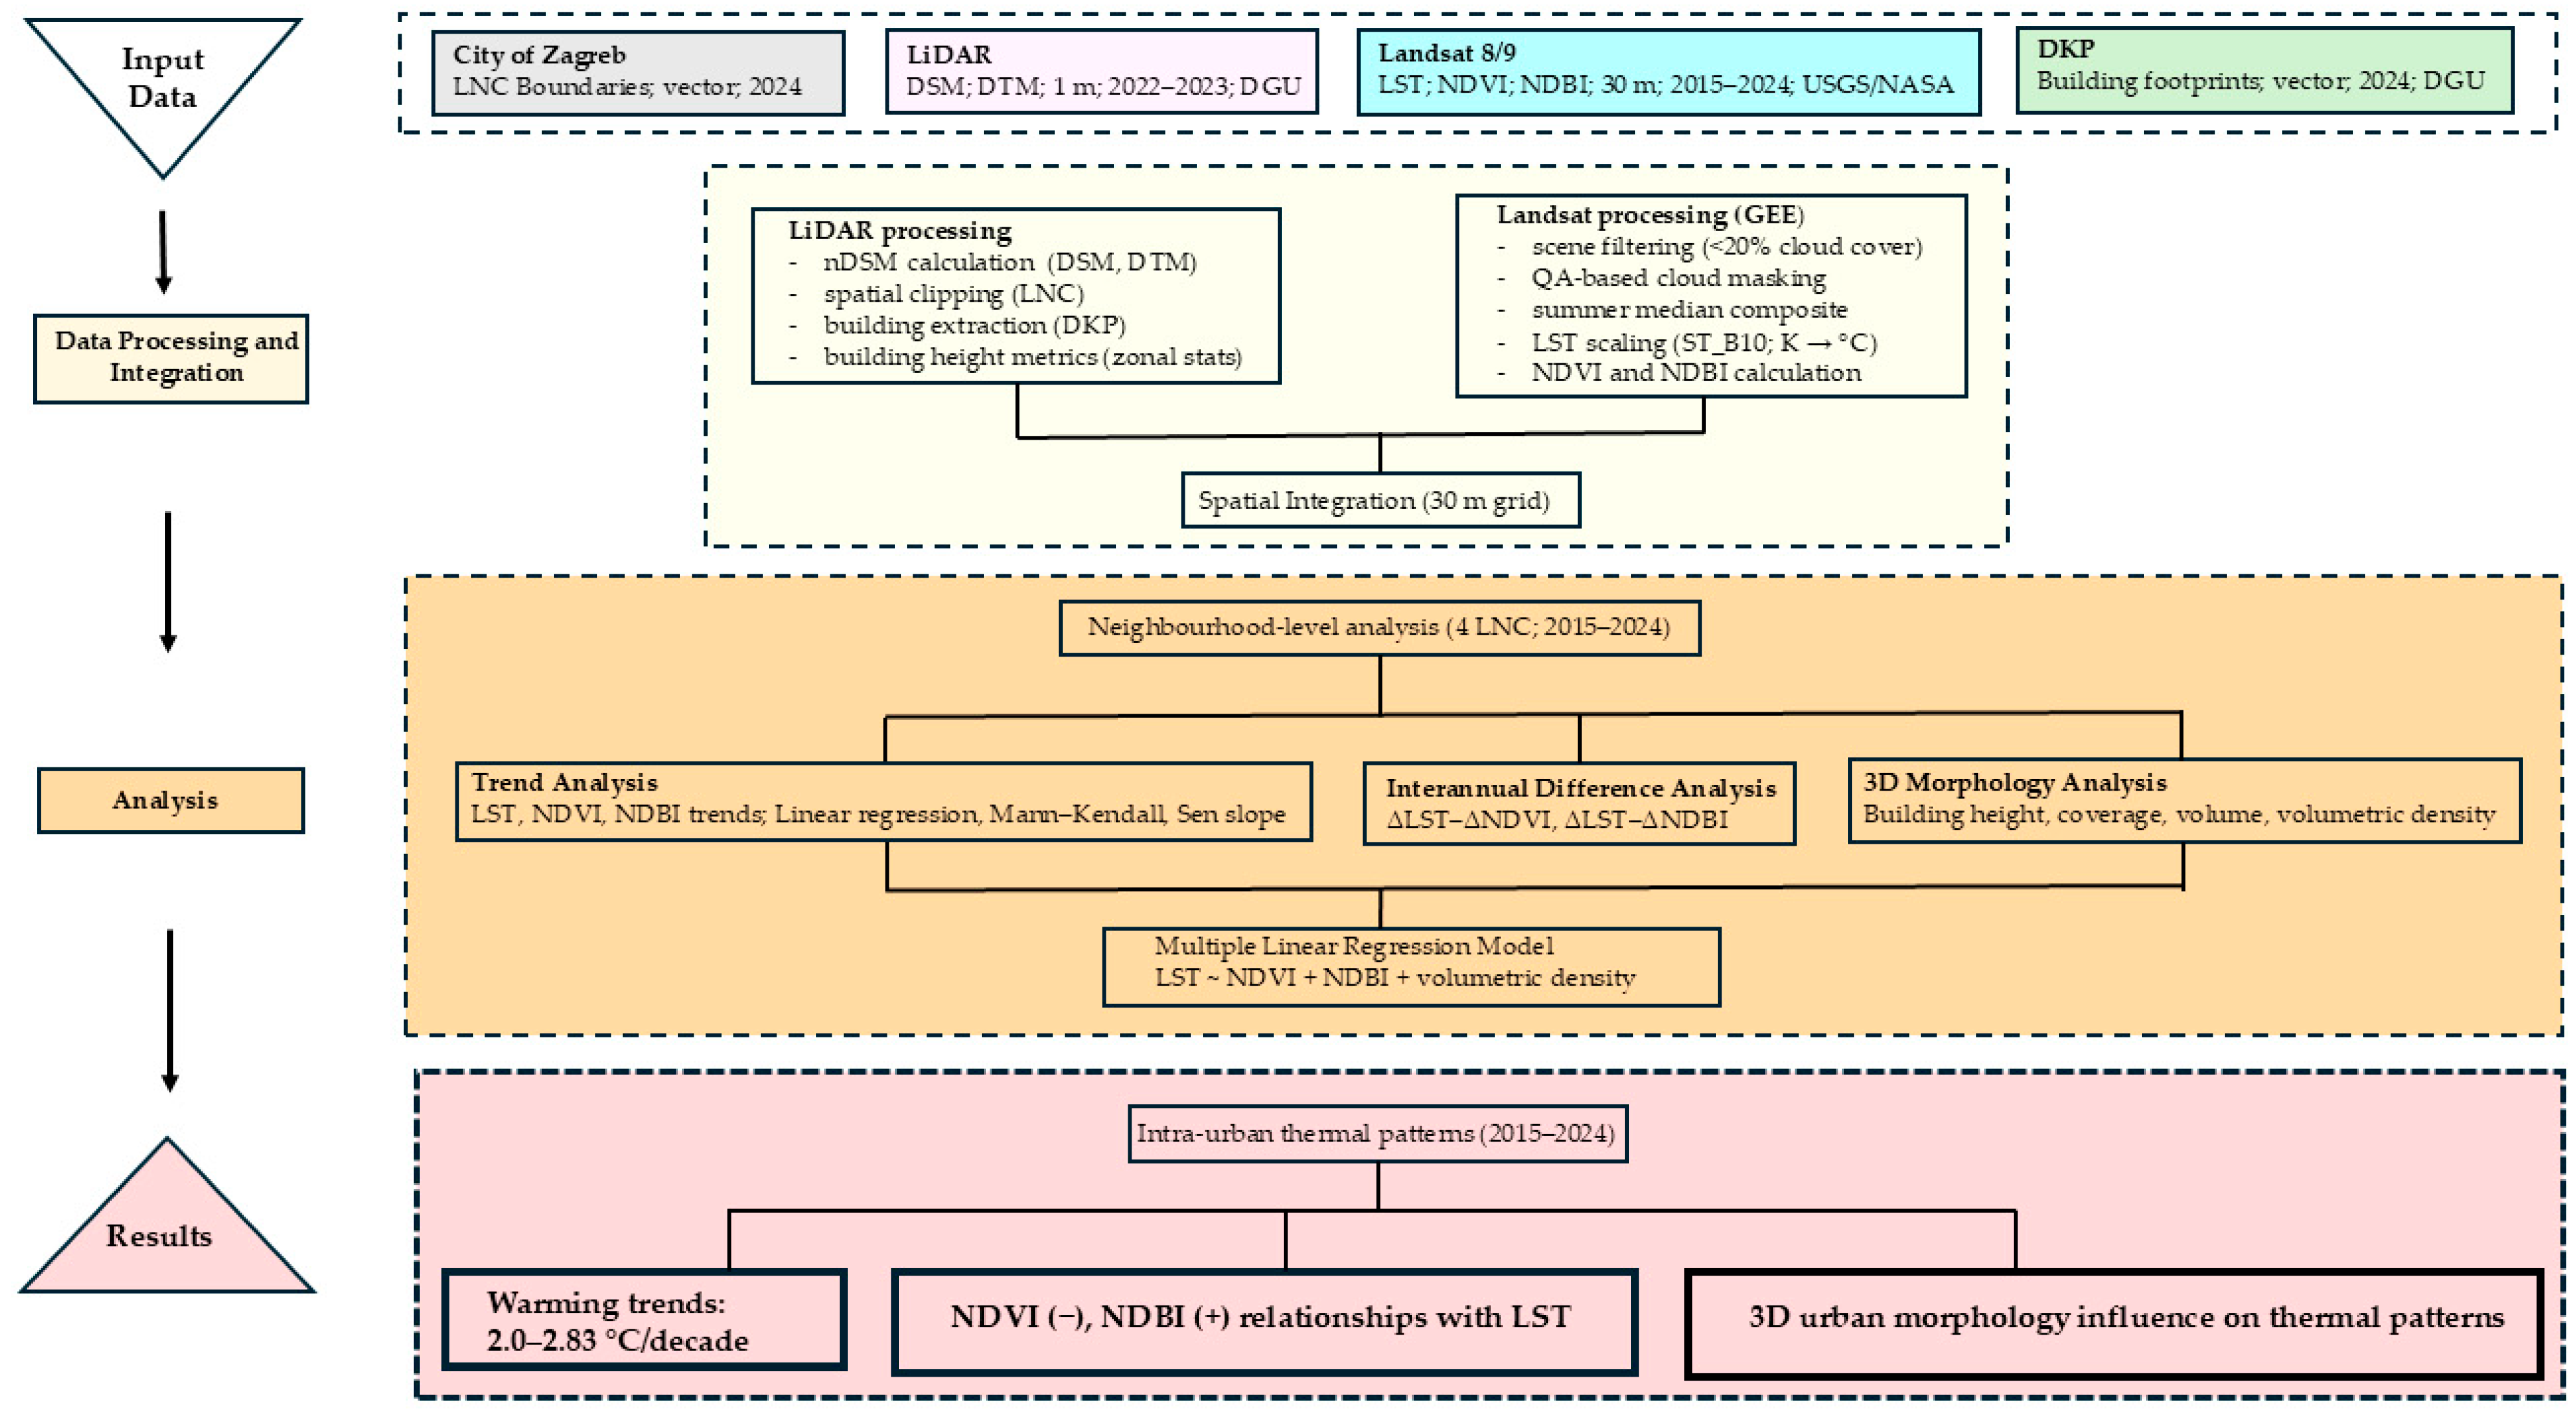
To enable an integrated analysis of datasets originating from different sources and spatio-temporal resolutions, all layers were standardized to the common analytical grid of 30 m × 30 m. This resolution was selected as a compromise between the high spatial resolution of the LiDAR models (1 m) and the spatial resolution of the Landsat multispectral data (30 m), while the thermal data (originally at 100 m resolution) were resampled to 30 m to ensure comparability among variables. This approach preserves sufficient spatial detail to capture intra-urban variability at the neighbourhood scale. The overall analytical workflow of the study is summarized in Figure 2.
Figure 2.
Integrated workflow of the study, illustrating the sequence from input datasets through processing and spatial integration to neighbourhood-level analysis and results.
Morphometric indicators derived from high-resolution LiDAR data were initially analysed at original 1 m resolution to preserve spatial heterogeneity. These results were subsequently aggregated to the 30 m grid, enabling the integration of detailed three-dimensional information with satellite-derived indicators of lower spatial resolution.
Data processing, including index calculation and layer preparation, was performed using scripts in the Google Earth Engine (GEE; Google LLC, Mountain View, CA, USA) Code Editor within an AOI covering the four selected neighbourhoods (Špansko sjever, Dugave, Lanište, and Novi Jelkovec). The neighbourhood polygons were uploaded as assets, enabling zonal operations within the defined administrative boundaries. For each year and neighbourhood, mean values and standard deviations were calculated for all pixels within each polygon, forming the basis for the subsequent spatial-statistical and correlation analyses. In addition to descriptive and trend-based analyses, a multiple linear regression model was applied to assess the combined relationship between LST and selected two-dimensional and three-dimensional indicators of urban structure. The mean summer LST was used as the dependent variable, while NDVI, NDBI, and volumetric building density were included as explanatory variables. The model was implemented using the ordinary least squares regression.
3. Results and Discussion
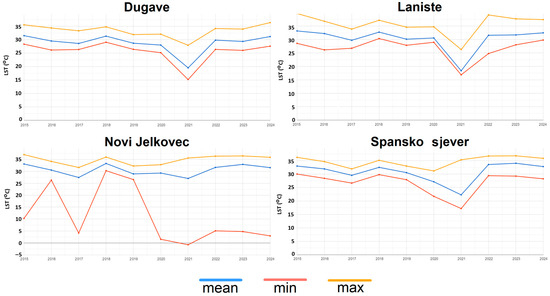
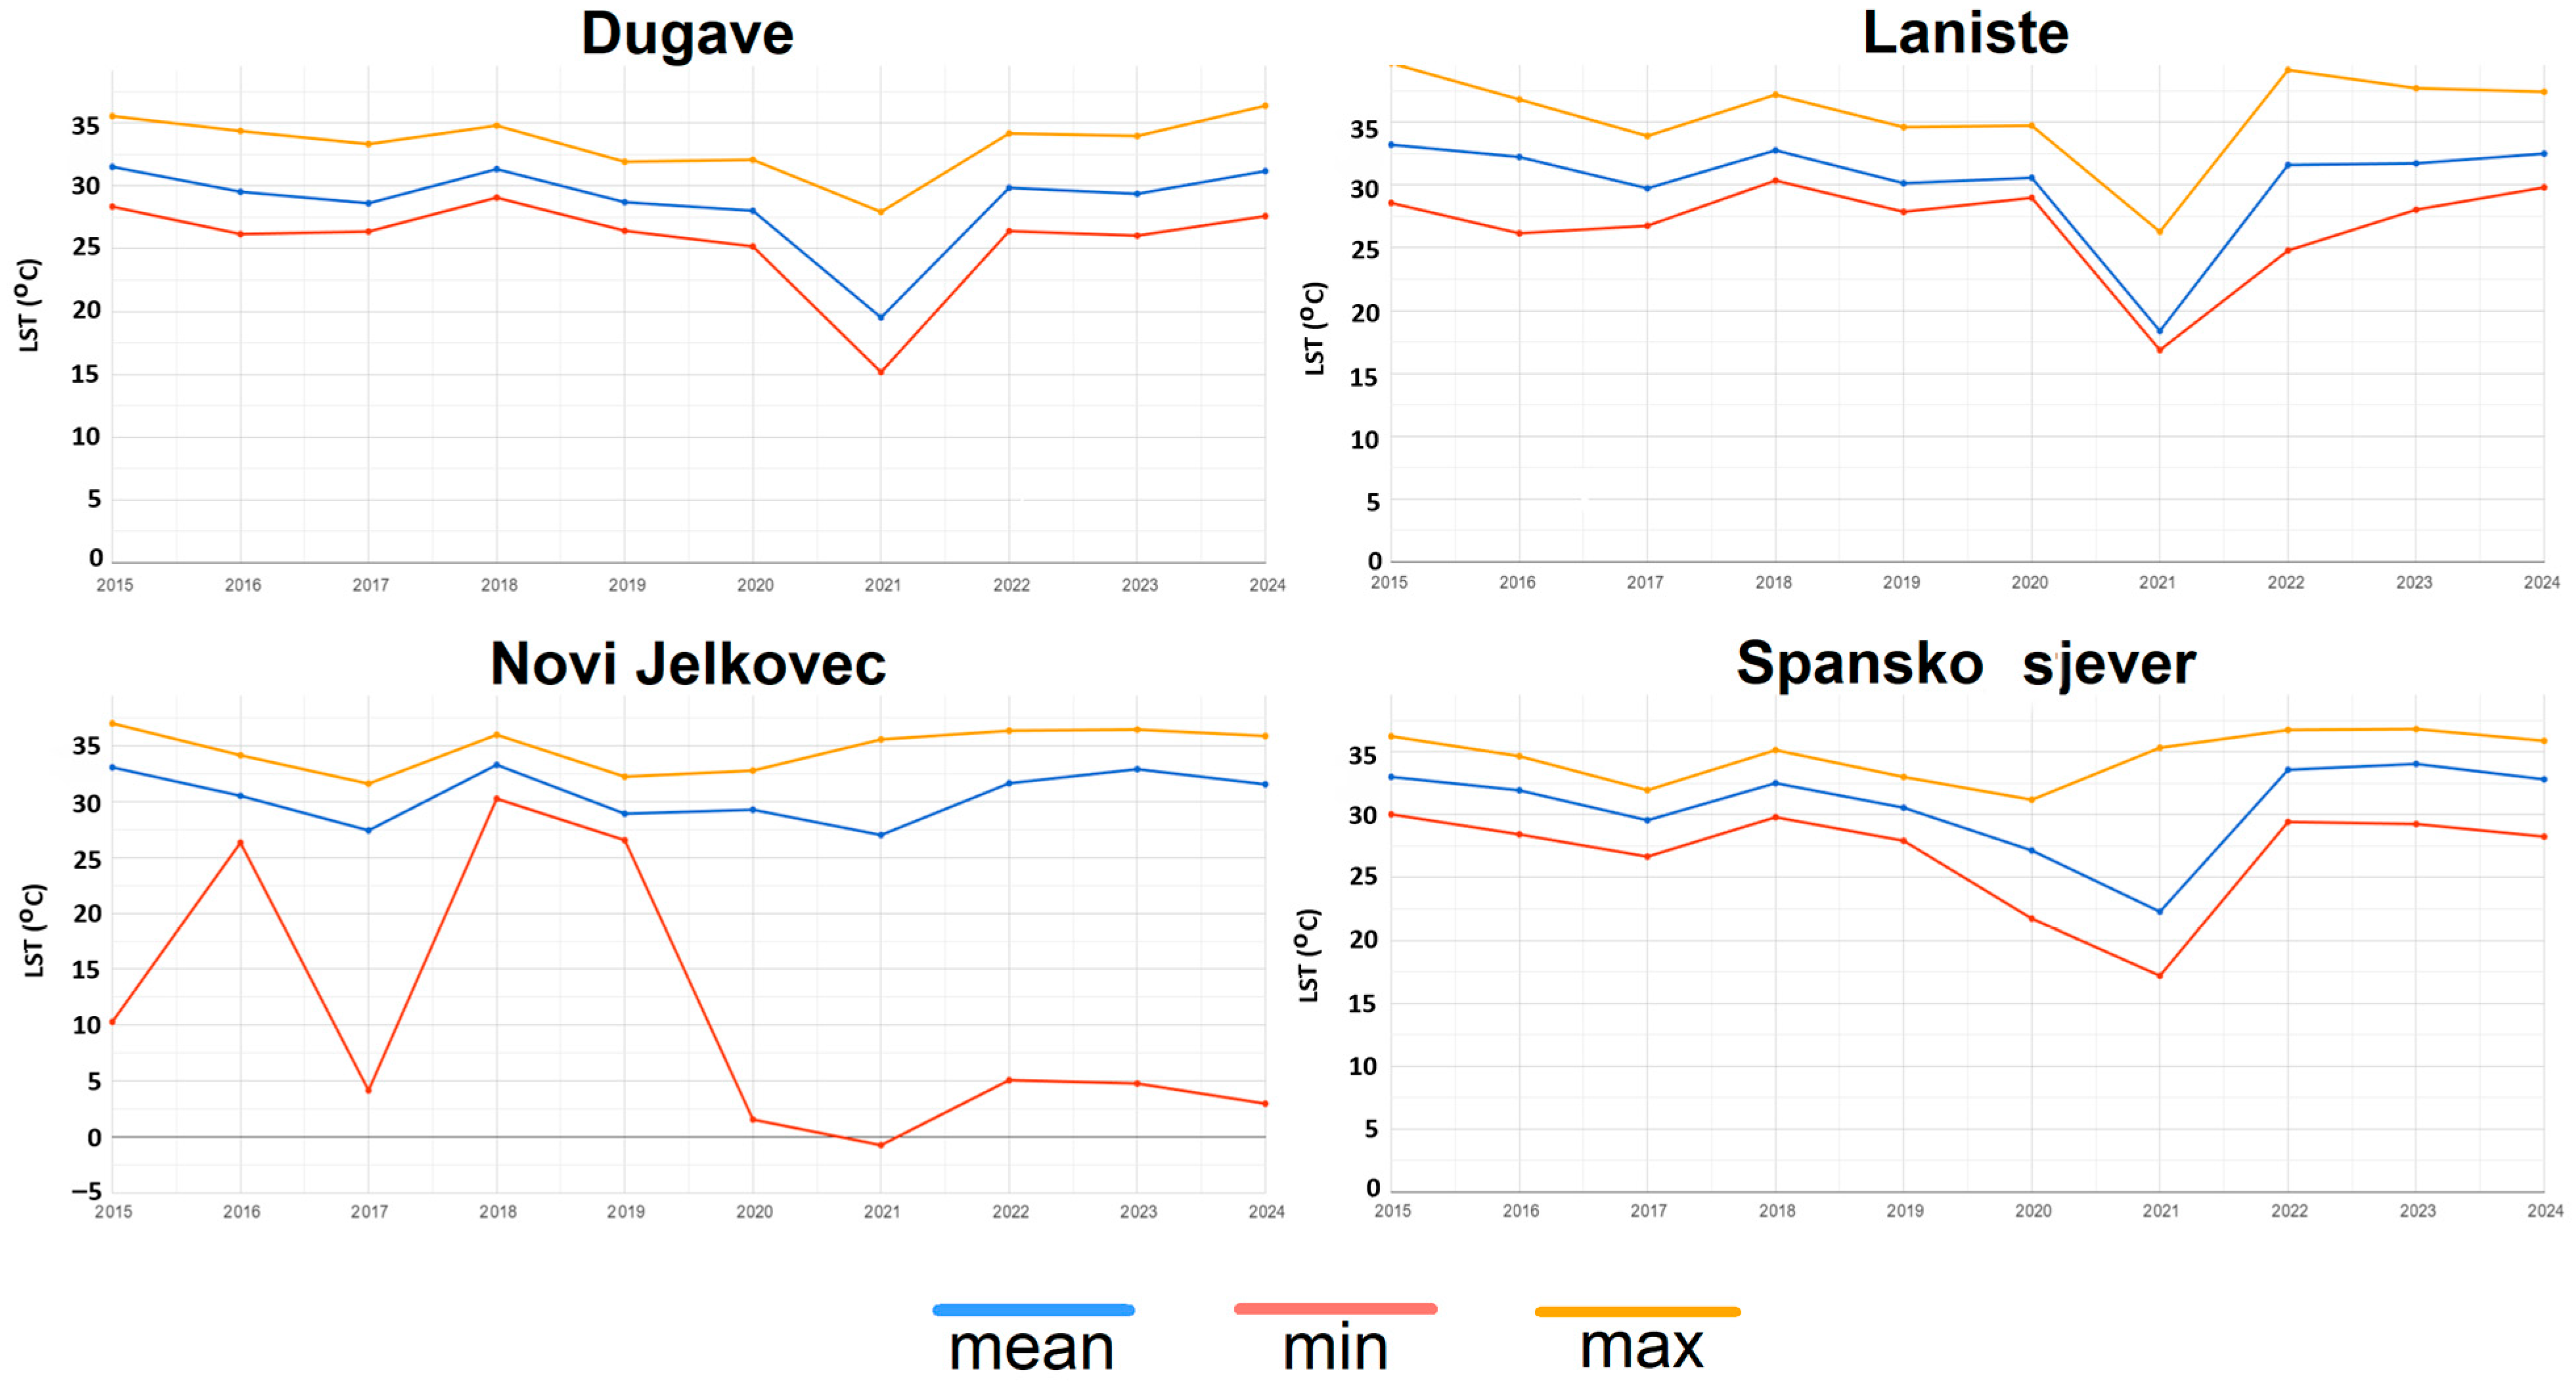
For spatial and interannual comparison of the LST changes within urban neighbourhoods, zonal statistics were calculated from the annual summer LST composites (Figure 3). The line graphs show the temporal evolution of the mean LST together with the corresponding minimum and maximum values for the period 2015–2024, based on the aggregation of pixels within the administrative boundaries of each neighbourhood. This approach enables a consistent comparison of neighbourhood-scale thermal dynamics, including interannual variability and temperature extremes. It provides a reliable basis for interpreting spatial and temporal LST patterns.
Figure 3.
Interannual dynamics of LST across the analysed LNCs (2015–2024), showing the mean, minimum, and maximum values derived from annual summer LST composites.
The results shown in Figure 3 reveal clear differences among neighbourhoods with contrasting urban structure and land-cover composition as represented by NDVI and NDBI. Dugave and Špansko sjever, which are characterised by a higher proportion of green and open spaces, show more moderate mean LST values and relatively stable temporal patterns, with smaller amplitudes between the minimum and maximum values. In contrast, Lanište and Novi Jelkovec exhibit higher mean and maximum LST values, together with more pronounced interannual variability. This overall pattern is consistent with previous findings and reflects the contrasting influence of vegetated and built-up surfaces on urban thermal conditions [10]. When the neighbourhoods are considered together, the contrast in temperature range (max–min) becomes particularly evident. Dugave and Špansko sjever display smoother interannual changes and narrower temperature ranges, consistent with a more moderate microclimatic regime. Lanište, by contrast, shows a wider range between minimum and maximum values and generally higher maximum LST, indicating stronger summer surface heating. A marked decrease in LST is visible in 2021 across all analysed neighbourhoods. Because this decline occurs synchronously in all four areas, it is more likely to reflect a broader meteorological signal than the local change in urban structure or land cover. These interannual fluctuations are likely associated with cooler or cloudier summer conditions affecting the wider region. Novi Jelkovec is particularly notable for its strong variability in minimum LST values, including several unusually low minima relative to the other neighbourhoods, which likely reflect local pixel-level heterogeneity within the annual raster composites. At the same time, its mean and maximum values remain relatively high. This combination suggests greater internal thermal heterogeneity than in other neighbourhoods. It also indicates that average values alone may not fully capture the complexity of intra-urban thermal patterns. This indicates that neighbourhood-scale averages may mask important internal spatial differences. This is particularly evident in areas with heterogeneous land-cover composition. Such intra-urban variability further emphasizes the role of fine-scale spatial heterogeneity in shaping thermal patterns [50].
Linear trends of summer LST, NDVI, and NDBI were analysed for the four urban neighbourhoods during the period 2015–2024. The results of the linear regression analysis, including trend slopes, coefficients of determination (R2), and associated p-values, are presented in Table 3, while the spatial patterns of LST trends are illustrated in Figure 4.
Table 3.
Linear trends of summer LST, NDVI, and NDBI in the analysed urban neighbourhoods (2015–2024).
Figure 4.
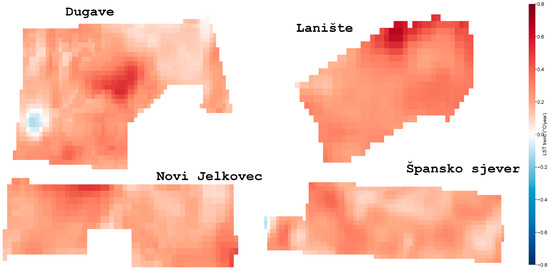
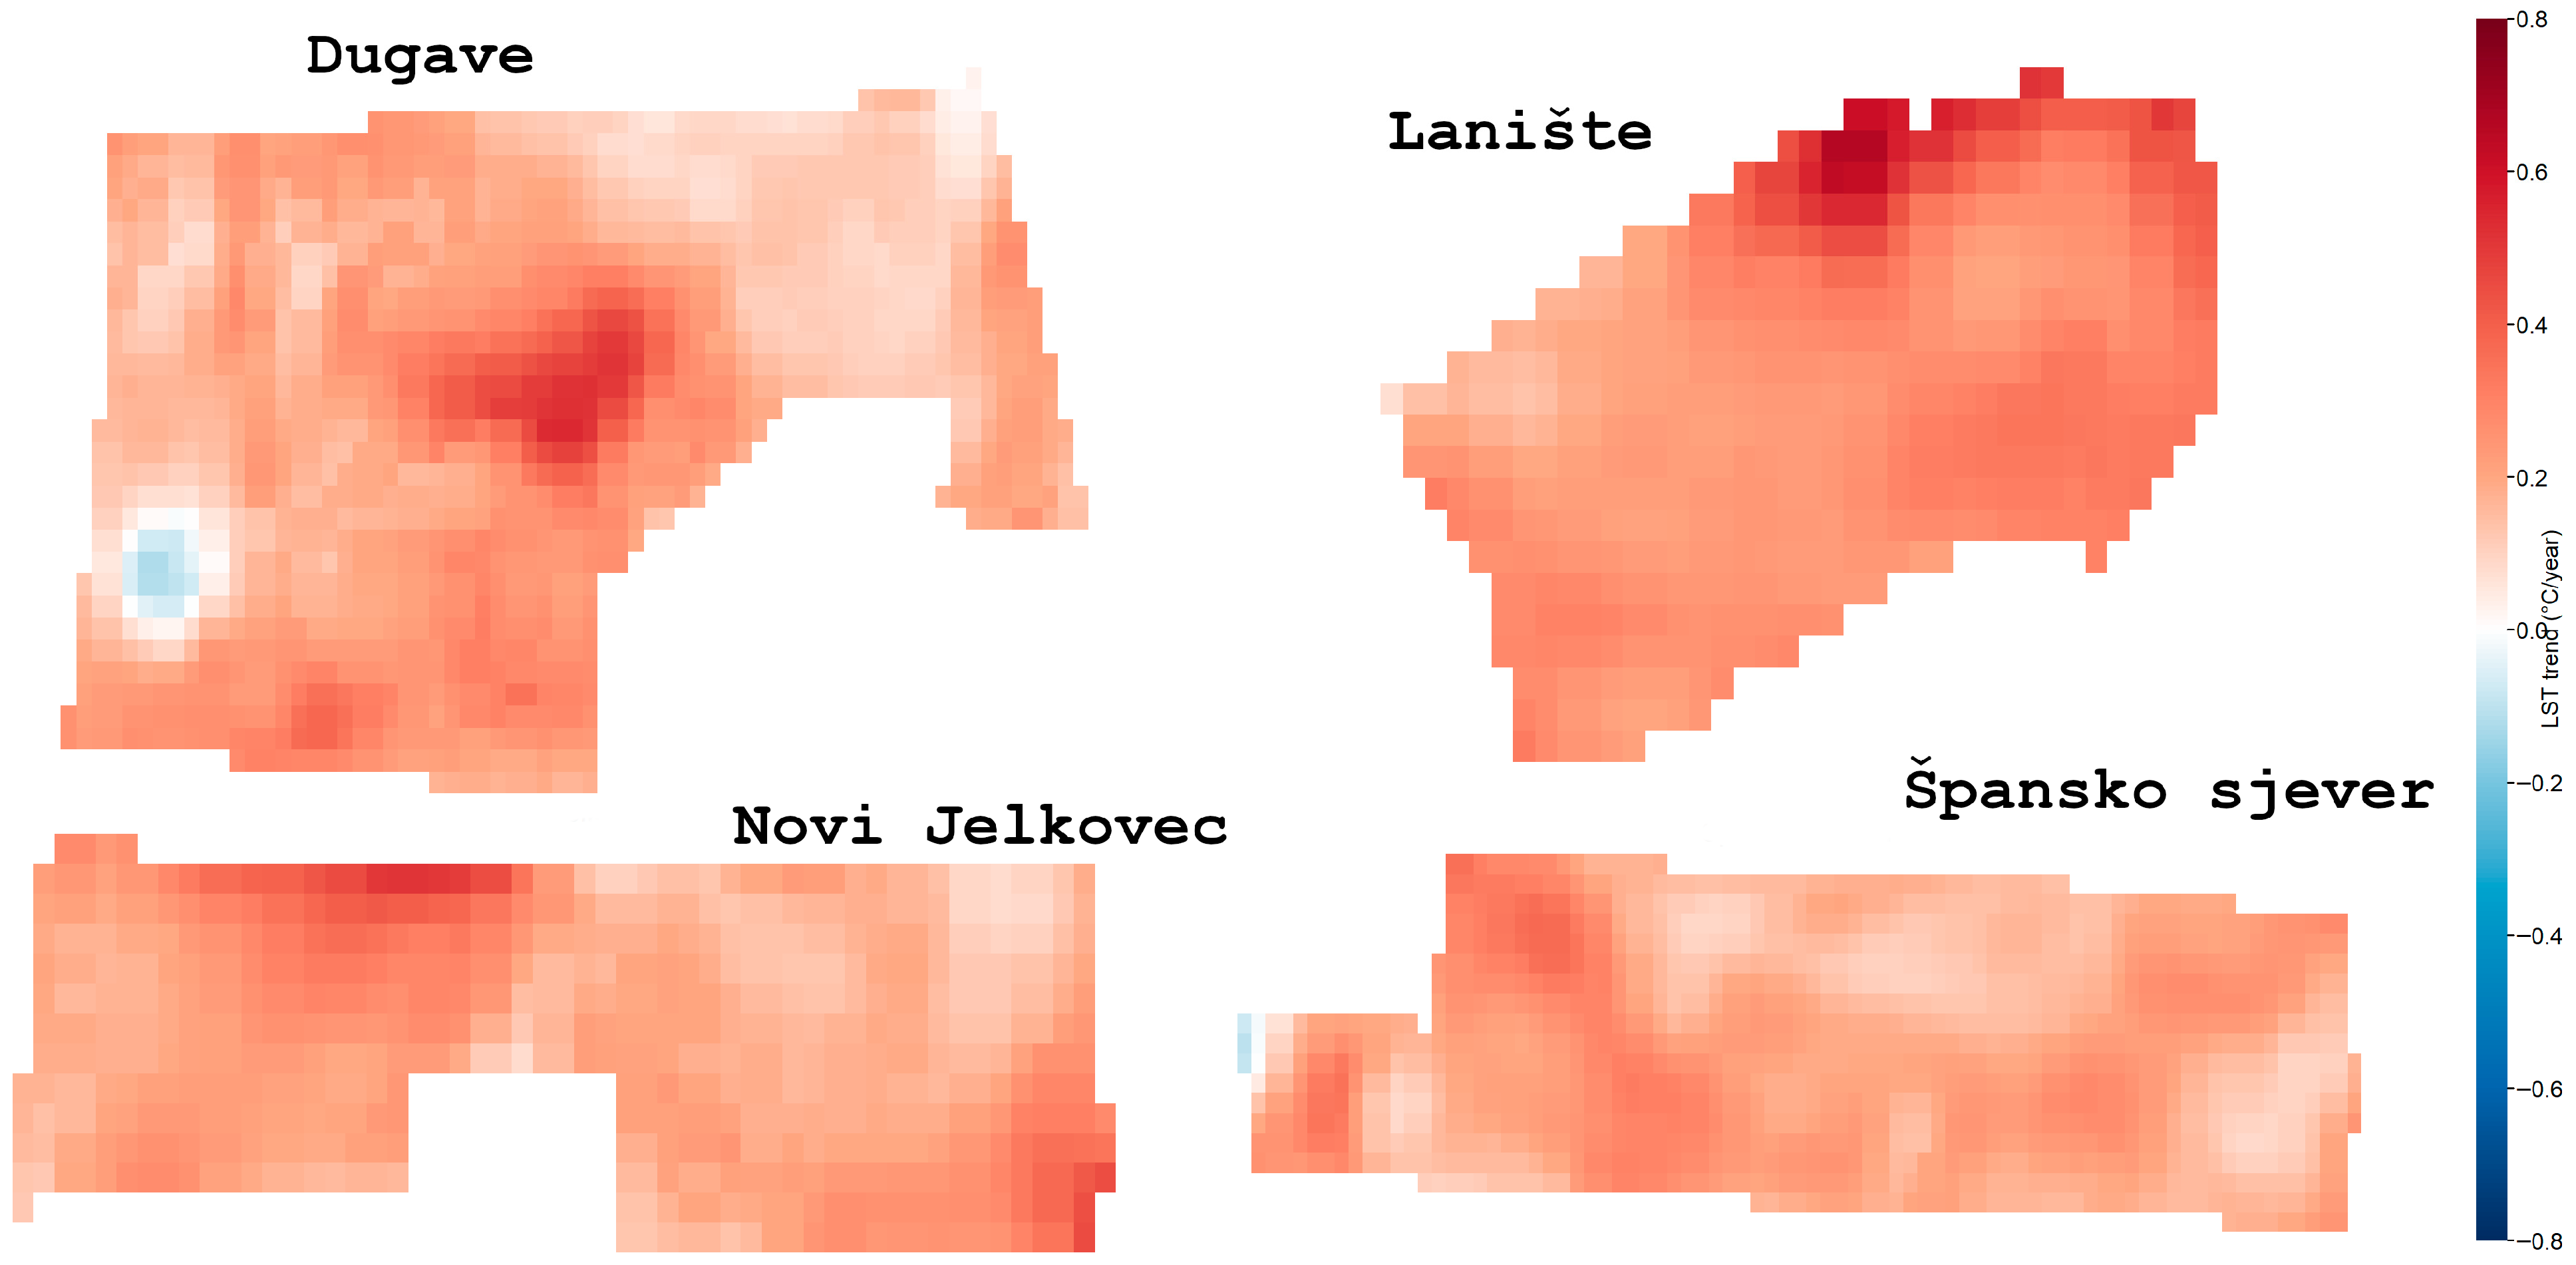
Spatial patterns of summer LST trends (°C/year) in the four studied LNCs (2015–2024). Positive values (red) indicate increasing surface temperatures, while negative values (blue) indicate cooling trends. A common diverging colour scale is applied across all panels.
Figure 4 indicates a consistent increase in summer land surface temperature, which is further supported by the trend analysis presented in Table 3. Positive LST trends are observed in all districts, with the strongest increases recorded in Lanište (+2.83 °C per decade) and Novi Jelkovec (+2.18 °C per decade), while Dugave and Špansko sjever exhibit slightly lower but still positive trends. The relatively low coefficients of determination (R2) suggest moderate to weak linear relationships, reflecting considerable interannual variability in summer temperatures, which is consistent with the variability observed in Figure 3. The spatial patterns in Figure 4 further highlight differences in the internal structure of warming. Lanište exhibits a relatively homogeneous and spatially coherent warming pattern, whereas Dugave and Špansko sjever show more heterogeneous spatial structures, including localized cooling pixels. Such patterns are consistent with differences in the land cover and local microclimatic conditions within neighbourhoods. NDVI trends are generally weak and non-significant across all neighbourhoods. Novi Jelkovec differs from the other neighbourhoods in showing a positive NDVI trend (+0.0244 per decade), although the trend is not statistically significant (p ≈ 0.70). This suggests that vegetation dynamics alone may not be sufficient to offset the broader warming signal at the neighbourhood scale, particularly over relatively short time periods. At the same time, the NDBI trends are predominantly positive, with the strongest increase observed in Lanište (+0.0139 per decade), indicating an increase or consolidation of the built-up surfaces. This pattern is consistent with previous studies showing that built-up expansion is associated with increased surface temperatures, while vegetation-related effects are often weaker or more variable over shorter time periods [10]. A particularly notable pattern is observed in Novi Jelkovec, where NDVI increases while NDBI decreases (although not statistically significant), yet LST still exhibits a relatively strong warming trend. This indicates that changes in surface cover alone do not fully explain the observed temperature dynamics, which is consistent with previous findings highlighting the role of additional factors beyond two-dimensional land-cover indicators [20,24]. Overall, these patterns suggest that neighbourhood-scale thermal behaviour is shaped not only by the proportion of vegetated and built-up surfaces, but also by their internal spatial configuration, which helps explain why similar average conditions may still produce different thermal responses.
To assess the robustness and statistical significance of the observed temporal trends, non-parametric Mann–Kendall and Sen’s slope methods were applied to the time series of LST, NDVI, and NDBI. The Mann–Kendall test evaluates the presence of a monotonic trend in a time series based on the statistic S, which is computed from all pairwise comparisons of observations. The standardized test statistic Z is defined as:
Statistical significance is assessed by comparing Z with the standard normal distribution (e.g., |Z| > 1.96 for α = 0.05).
The magnitude of the trend was estimated using Sen’s method, which provides a robust estimate of the rate of change in a variable over time. Sen’s slope is defined as:
where and are the values of the observed variable (LST, NDVI or NDBI) at time steps and , while j represents the time interval between observations. The Sen slope estimator β represents the median rate of change per unit time and is robust to the influence of extreme values and non-normal data distributions.
The results confirm a consistent positive trend in summer LST across all analysed neighbourhoods, with the highest Sen slope values observed in Lanište and Novi Jelkovec. This agrees with the linear regression results presented in Table 3 and supports the interpretation of a gradual intensification of thermal conditions in these areas. Such consistent warming trends have been widely reported in urban environments and are commonly associated with increasing urbanization and surface modification processes [14]. However, the Mann–Kendall test indicates that, despite the consistent direction of change, the LST trends remain non-significant (p > 0.05). This reinforces the interpretation that additional factors beyond two-dimensional land-cover indicators may influence the observed temperature dynamics, including the potential role of 3D urban structure, which is further explored in the following sections. For NDVI, the Sen slope estimates indicate weak or slightly negative trends in most neighbourhoods, suggesting relatively stable vegetation conditions over the study period. These results should be interpreted in the context of the linear regression analysis (Table 3), where NDVI trends are generally non-significant across all neighbourhoods, although Novi Jelkovec differs from the other neighbourhoods by exhibiting a positive NDVI trend. The differences between methods reflect the sensitivity of the estimators to short-term variability and the limited length of the time series. In the case of NDBI, the Sen slope values are generally positive in most neighbourhoods, particularly in Lanište, indicating a tendency towards increased built-up intensity or consolidation of the impervious surfaces. This pattern is consistent with previous findings linking the expansion of built-up areas to increased surface temperatures [10]. Novi Jelkovec exhibits a contrasting pattern. Although these trends are not consistently statistically significant, their direction is coherent with the patterns observed in the linear regression analysis. Overall, the combined use of linear regression, Mann–Kendall, and Sen’s slope indicates that urban warming is a consistent process across all neighbourhoods, but with varying degrees of statistical confidence. This highlights the importance of integrating multiple analytical approaches when interpreting urban thermal dynamics, particularly in the presence of short time series and high interannual variability. The results highlight the importance of considering both trend magnitude and statistical robustness when interpreting long-term urban thermal dynamics.
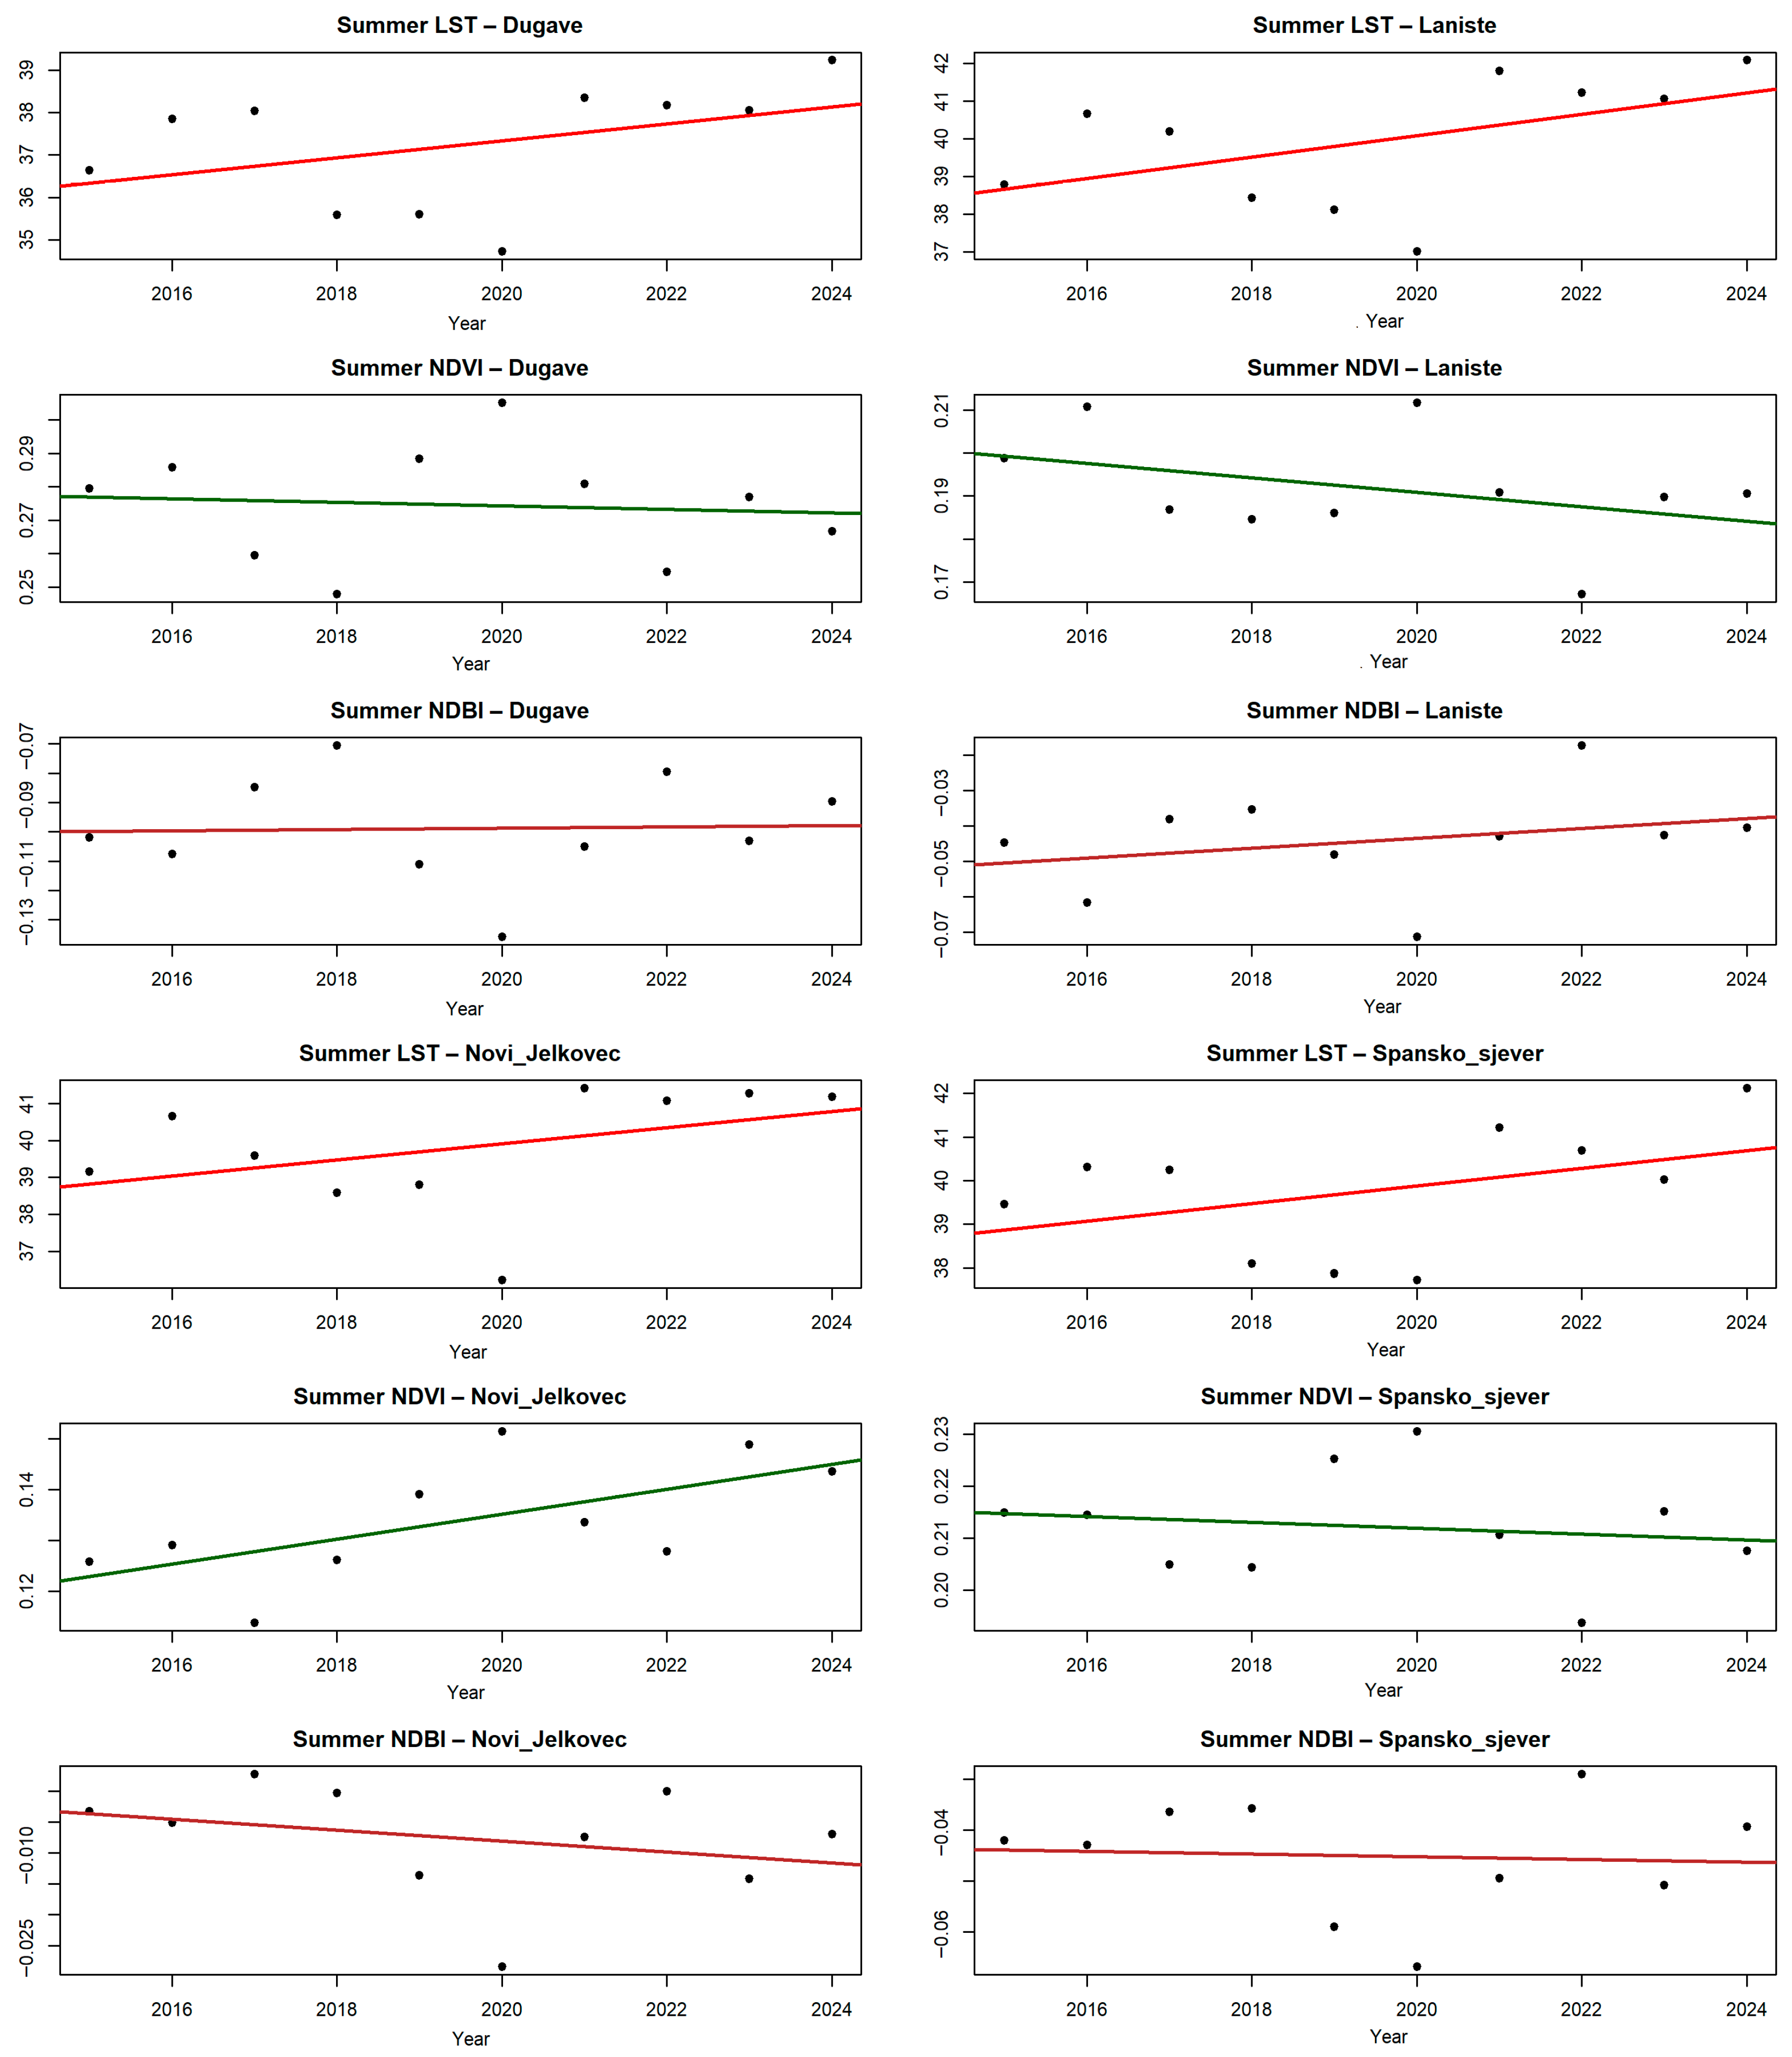
Figure 5 illustrates the temporal behavior of summer LST, NDVI, and NDBI across the four analysed neighbourhoods and confirms the previously shown positive LST trends. The highest values occur in Lanište and Novi Jelkovec, while Dugave and Špansko sjever exhibit weaker but still positive trends, consistent with the linear regression results presented in Table 3.
Figure 5.
Temporal trends of summer LST, NDVI, NDBI for the four analysed LNCs (2015–2024). Linear regression lines indicate the direction of the trends.
The Mann–Kendall test suggests that, although the direction of change is generally consistent, these trends do not consistently reach statistical significance (p > 0.05). This apparent discrepancy reflects the sensitivity of the non-parametric tests to short time series and pronounced interannual variability, which may reduce statistical power despite consistent trend direction. The dispersion of individual yearly observations around the fitted trends further illustrates this variability. For NDVI, the Sen slope estimates indicate weak but generally negative trends across neighbourhoods, suggesting a gradual decline in the vegetation cover. In contrast, NDBI shows predominantly positive tendencies in most neighbourhoods, particularly in Lanište, while Novi Jelkovec exhibits a contrasting pattern. The strongest increase in LST is observed in Lanište and Novi Jelkovec; however, the associated NDVI and NDBI trends differ between these neighbourhoods, indicating that warming is not uniformly linked to the two-dimensional land-cover changes. This further supports the interpretation that additional structural and spatial factors contribute to the observed thermal dynamics. While the results shown in Figure 5 confirm the direction and consistency of temporal trends across variables, they do not directly capture interannual co-variability between temperature and surface characteristics. These findings indicate that long-term directional trends and short-term annual responses should be interpreted as related but not equivalent aspects of urban thermal dynamics.
To further investigate the relationship between interannual changes in summer land surface temperature and changes in vegetation and built-up indices, annual differences (Δ) between consecutive years were analysed for LST, NDVI, and NDBI.
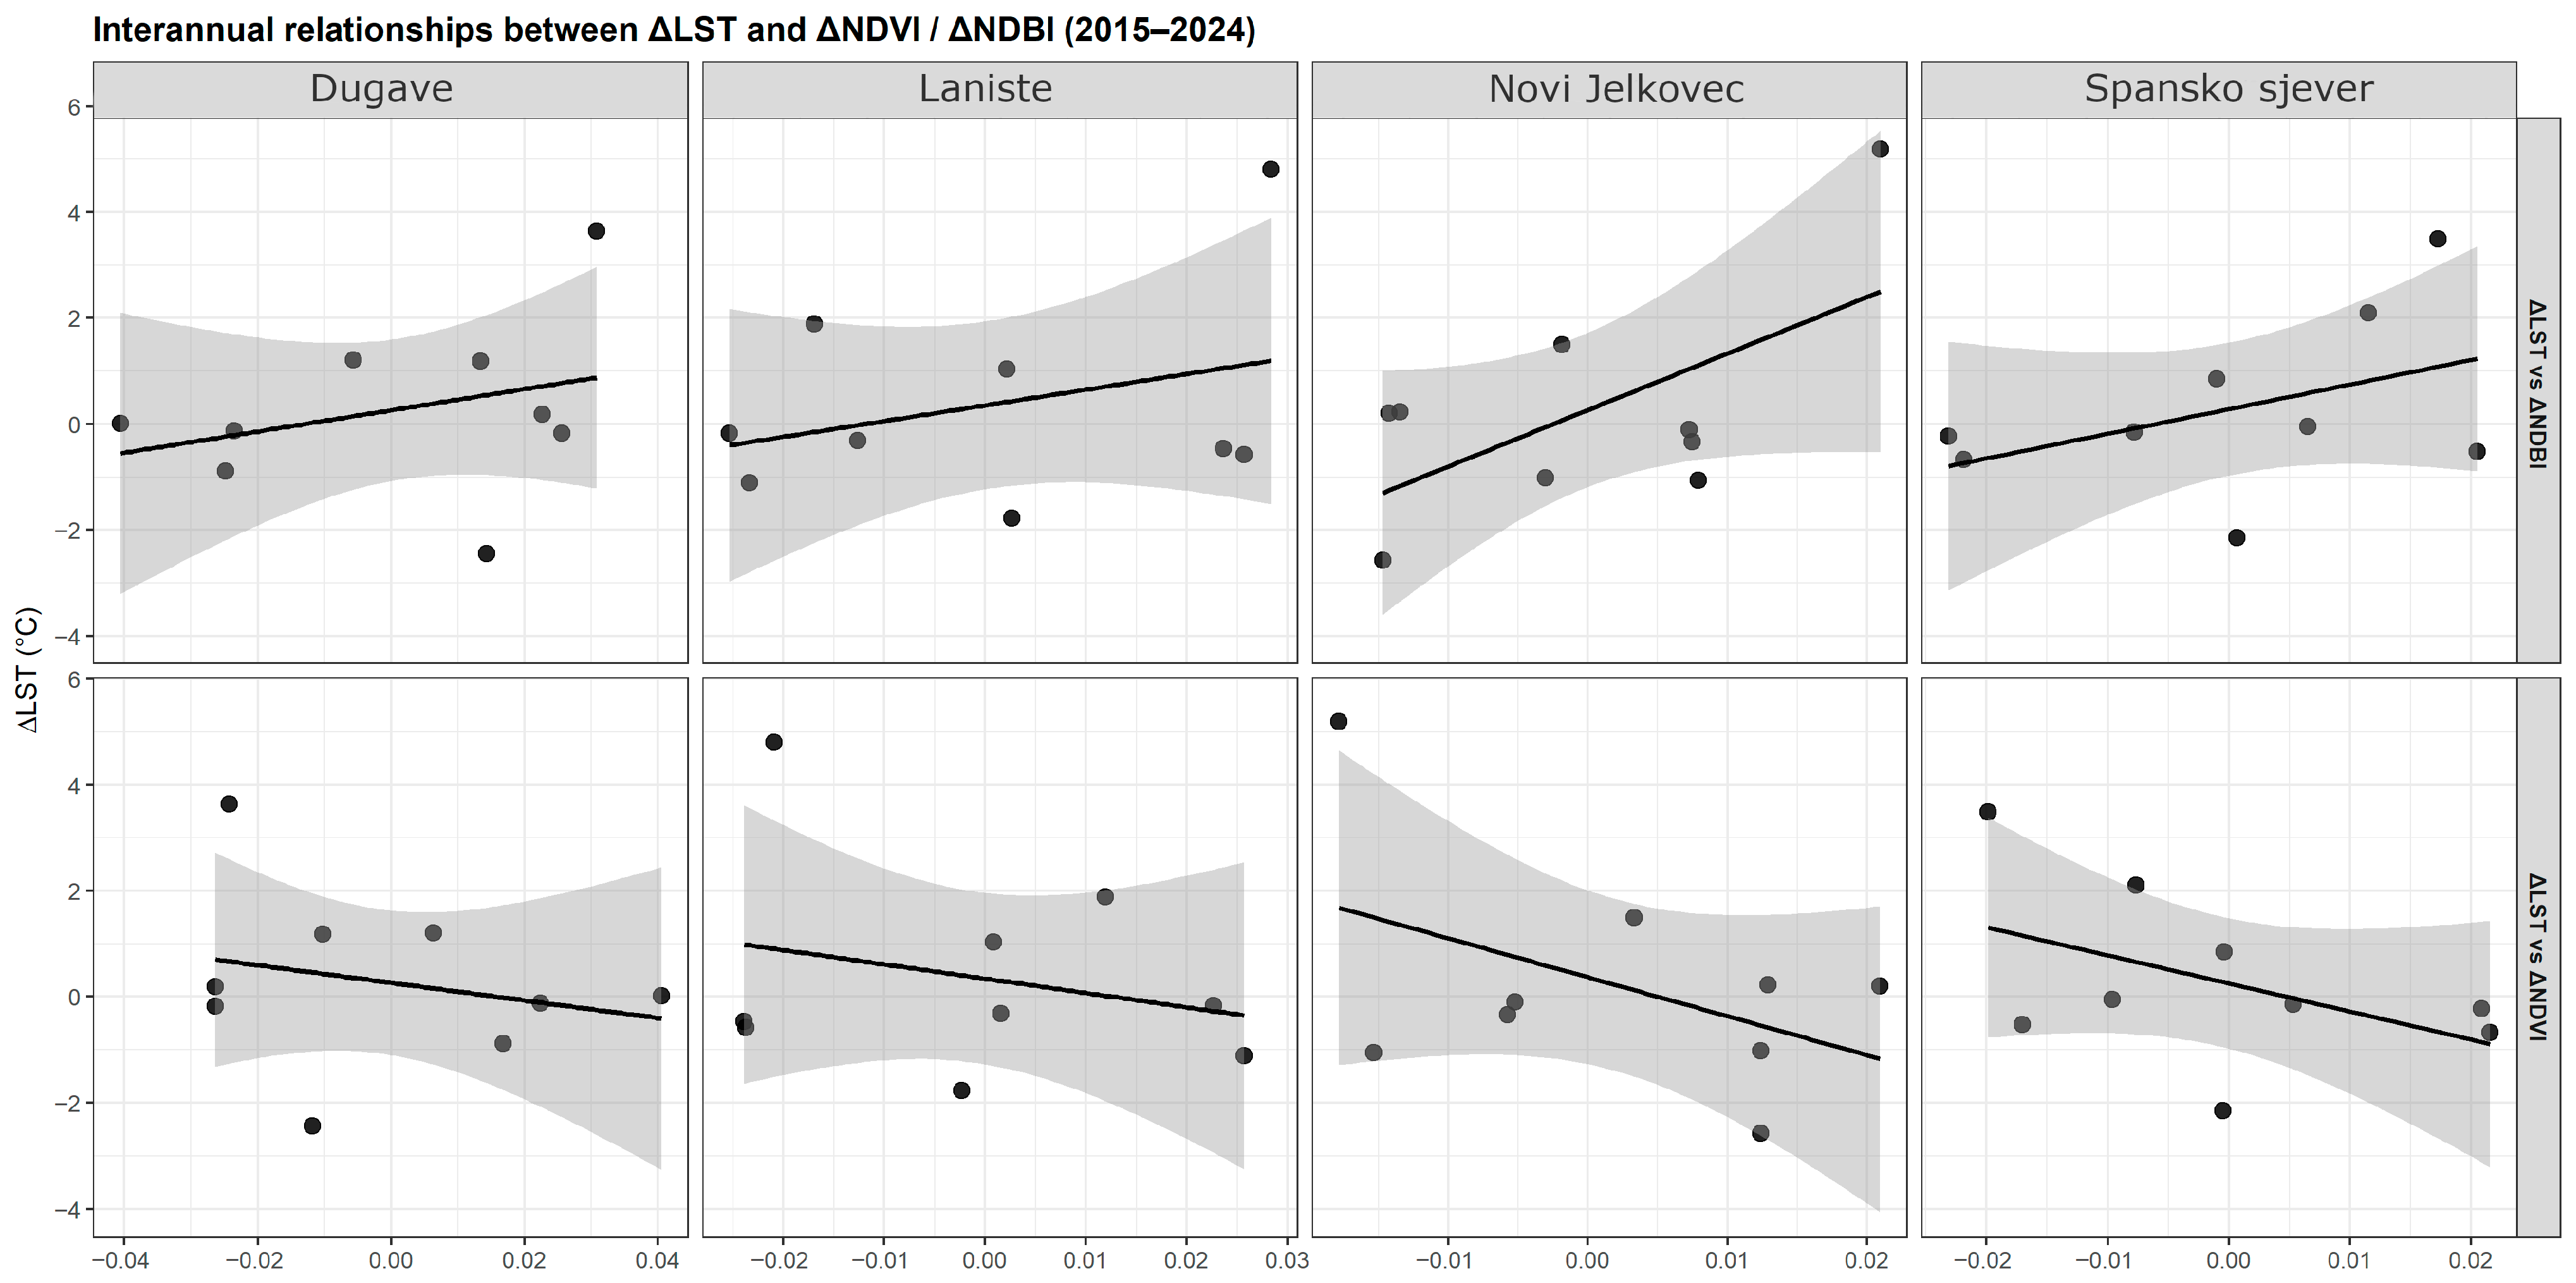
The results presented in Table 4 and Figure 6 show that the direction of the interannual relationships is generally consistent across neighbourhoods, although the strength of these relationships varies. In all four cases, ΔLST tends to be positively associated with ΔNDBI and negatively associated with ΔNDVI, although the strength of these relationships varies, with generally weaker and less consistent correlations observed in Dugave. This indicates that interannual relationships between LST and surface characteristics are present but relatively weak, suggesting that short-term temperature variability is influenced by multiple interacting factors. This further implies that short-term fluctuations are more sensitive to transient environmental conditions than to longer-term structural changes in land cover, as also indicated by studies highlighting the temporal variability in morphology–temperature relationships [29].
Table 4.
Interannual Pearson correlations between ΔLST and ΔNDVI and between ΔLST and ΔNDBI across the four analysed neighbourhoods (2015–2024).
Figure 6.
Interannual relationships between ΔLST and ΔNDVI and between ΔLST and ΔNDBI across the four analysed neighbourhoods (2015–2024). Linear regression lines are shown, with shaded areas representing confidence intervals.
The strongest positive relationship between ΔLST and ΔNDBI is observed in Novi Jelkovec (r ≈ 0.61, p ≈ 0.08), suggesting a stronger coupling between changes in built-up intensity and temperature dynamics in this neighbourhood. Lanište exhibits the same overall pattern, although with weaker coefficients, while Špansko sjever shows moderate correlations. In contrast, Dugave displays weaker and less consistent correlations, indicating a reduced sensitivity of temperature to short-term changes in land-cover characteristics. Although most correlations are not statistically significant (p > 0.05), their direction remains consistent across neighbourhoods. While the observed correlations are not statistically significant, their consistent direction across neighbourhoods suggests underlying relationships that may not be fully captured due to the limited sample size and interannual variability. Given the limited number of observations, these results should be interpreted primarily in terms of direction and consistency rather than in terms of statistical significance. The relatively small sample size reduces statistical power and likely contributes to the lack of statistically significant relationships.
The results suggest that the long-term warming trends are robust, whereas interannual temperature variability is only partially explained by concurrent changes in vegetation and built-up intensity, indicating the influence of multifactorial processes, which is consistent with studies emphasizing the role of both land-use and urban form characteristics in shaping LST patterns [20]. In Lanište, temperature changes appear more closely linked to variations in the impervious surface intensity, whereas in Novi Jelkovec the relationships between vegetation, built-up conditions, and temperature dynamics appear more complex. Because the previous analyses showed that long-term warming trends are only partially explained by two-dimensional land-cover indicators, additional insight was sought from the 3D urban morphology derived from building height and footprint data.
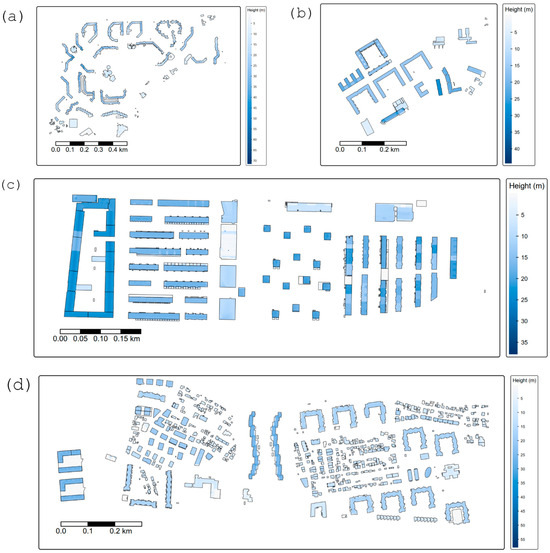
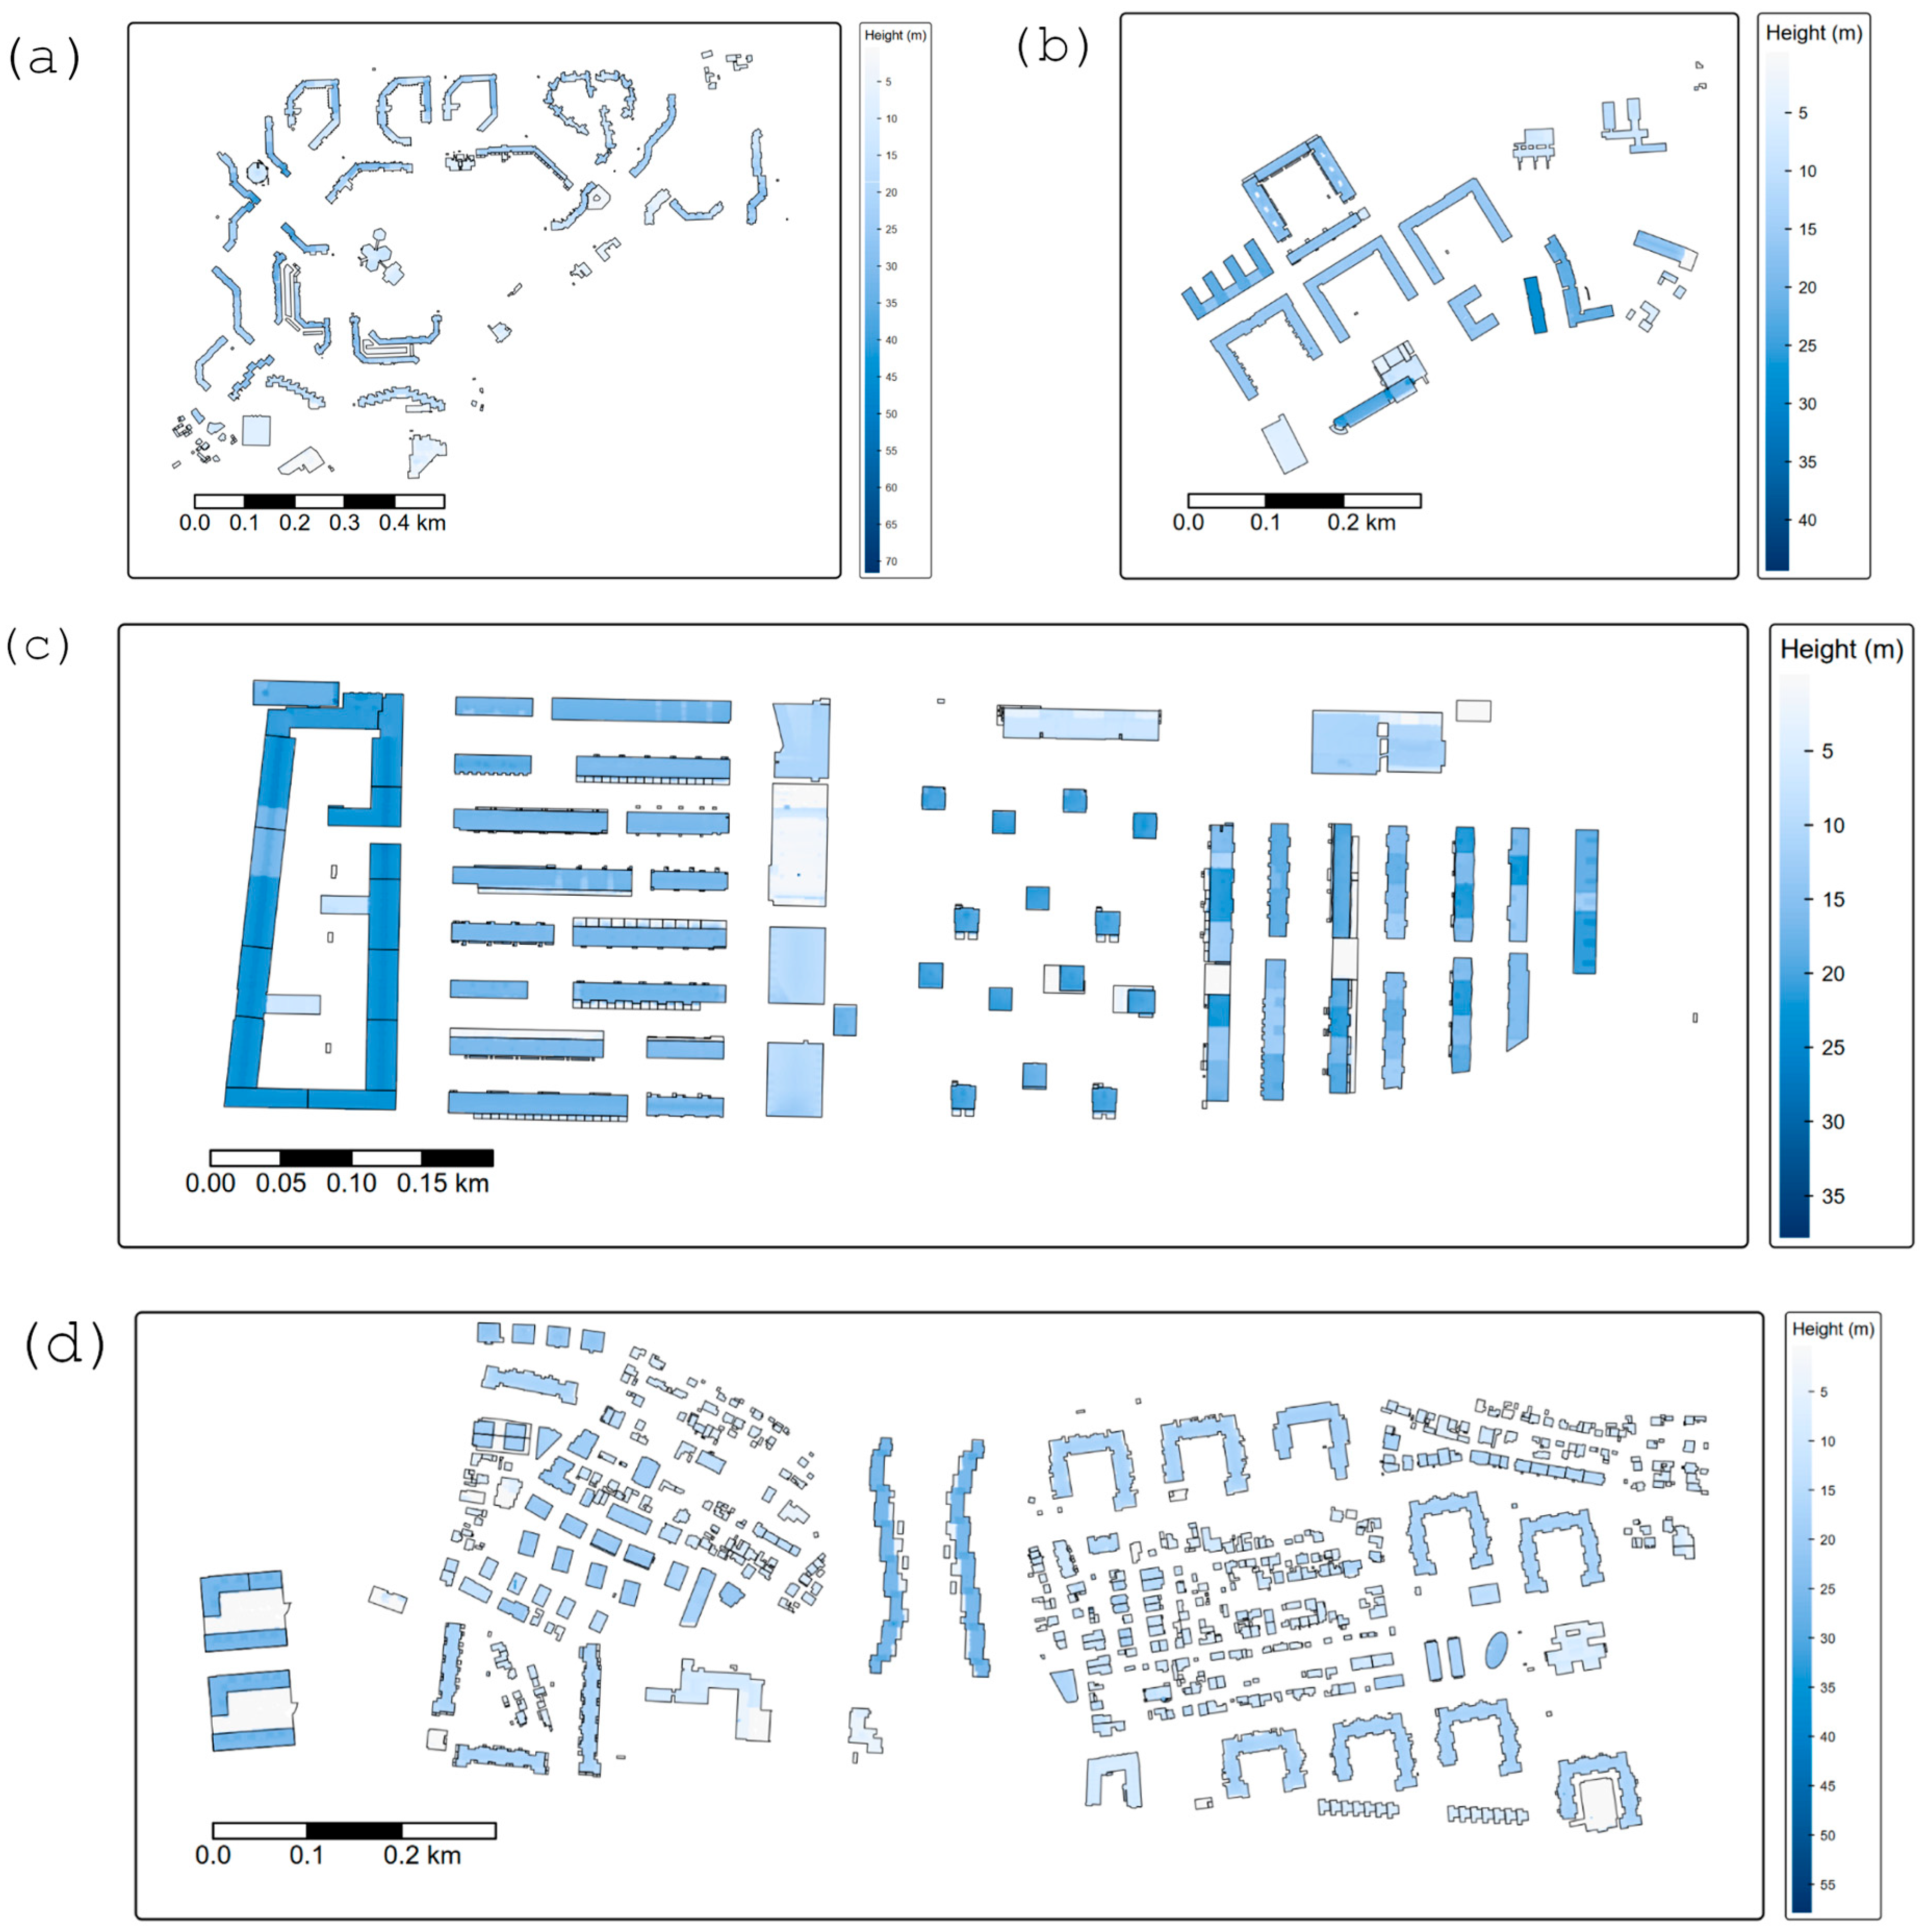
The results shown in Figure 7 illustrate the spatial distribution of building heights across the analysed neighbourhoods, highlighting differences in urban structure and internal spatial organisation. These patterns reveal distinct 3D configurations of built form, ranging from more homogeneous and compact arrangements to more heterogeneous and dispersed structures.
Figure 7.
Spatial distribution of building heights derived from LiDAR data for the analysed LNCs (Dugave (a), Lanište (b), Novi Jelkovec (c) and Špansko sjever (d)).
The results in Table 5 provide quantitative metrics of 3D urban morphology, including building height statistics, footprint area, coverage, and volumetric density. Together with the spatial distribution shown in Figure 7, these metrics offer additional context for interpreting differences in urban warming among the neighbourhoods. Among the analysed neighbourhoods, Novi Jelkovec exhibits the highest building coverage and volumetric density, indicating a compact spatial arrangement and a high concentration of built volume per unit area. This configuration is consistent with the pronounced increase in LST observed in previous analyses and suggests a strong influence of the three-dimensional built-form concentration on intra-urban thermal dynamics. In contrast, Dugave shows the greatest variability in the building heights and the highest maximum values, reflecting a more heterogeneous urban structure with a mix of lower and taller buildings. Lanište exhibits a different pattern, characterised by relatively high increases in LST accompanied by strong growth in built-up intensity, as indicated by NDBI trends. This suggests that warming in Lanište is more closely associated with the horizontal expansion of impervious surfaces than with volumetric concentration of built structures, which is consistent with the earlier trend and interannual analyses. Špansko sjever represents a relatively balanced urban configuration in terms of height distribution and land-cover composition. This spatial structure is associated with weaker and more stable LST trends, suggesting a more moderate thermal response compared to Lanište and Novi Jelkovec. Dugave, characterised by lower building coverage and volumetric density, reflects a more open urban structure. Although warming is also observed, the relationship between built form and temperature increase appears less direct, suggesting that the local morphological factors play a weaker role in shaping the observed thermal dynamics.
Table 5.
Three-dimensional urban morphology metrics derived from building height and footprint data for the analysed neighbourhoods (2015–2024). Height metrics (mean, median, SD, maximum, P90 and P95) are expressed in metres.
The combined analysis of Table 3 and Table 5, and Figure 7 indicates that differences in urban warming among the neighbourhoods are not solely controlled by the two-dimensional land-cover changes but are also influenced by the 3D urban morphology. In particular, the results suggest two complementary pathways of warming: the horizontal expansion of impervious surfaces, most evident in Lanište, and the volumetric concentration of built structures, most pronounced in Novi Jelkovec, in line with broader findings on the role of 2D and 3D urban form in shaping LST patterns [20]. These findings indicate that the neighbourhoods with higher concentrations of built volume or rapidly expanding impervious surfaces tend to exhibit stronger warming, whereas more heterogeneous or balanced urban configurations show a more moderate thermal response.
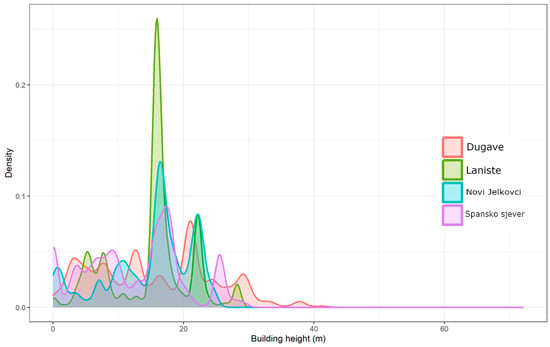
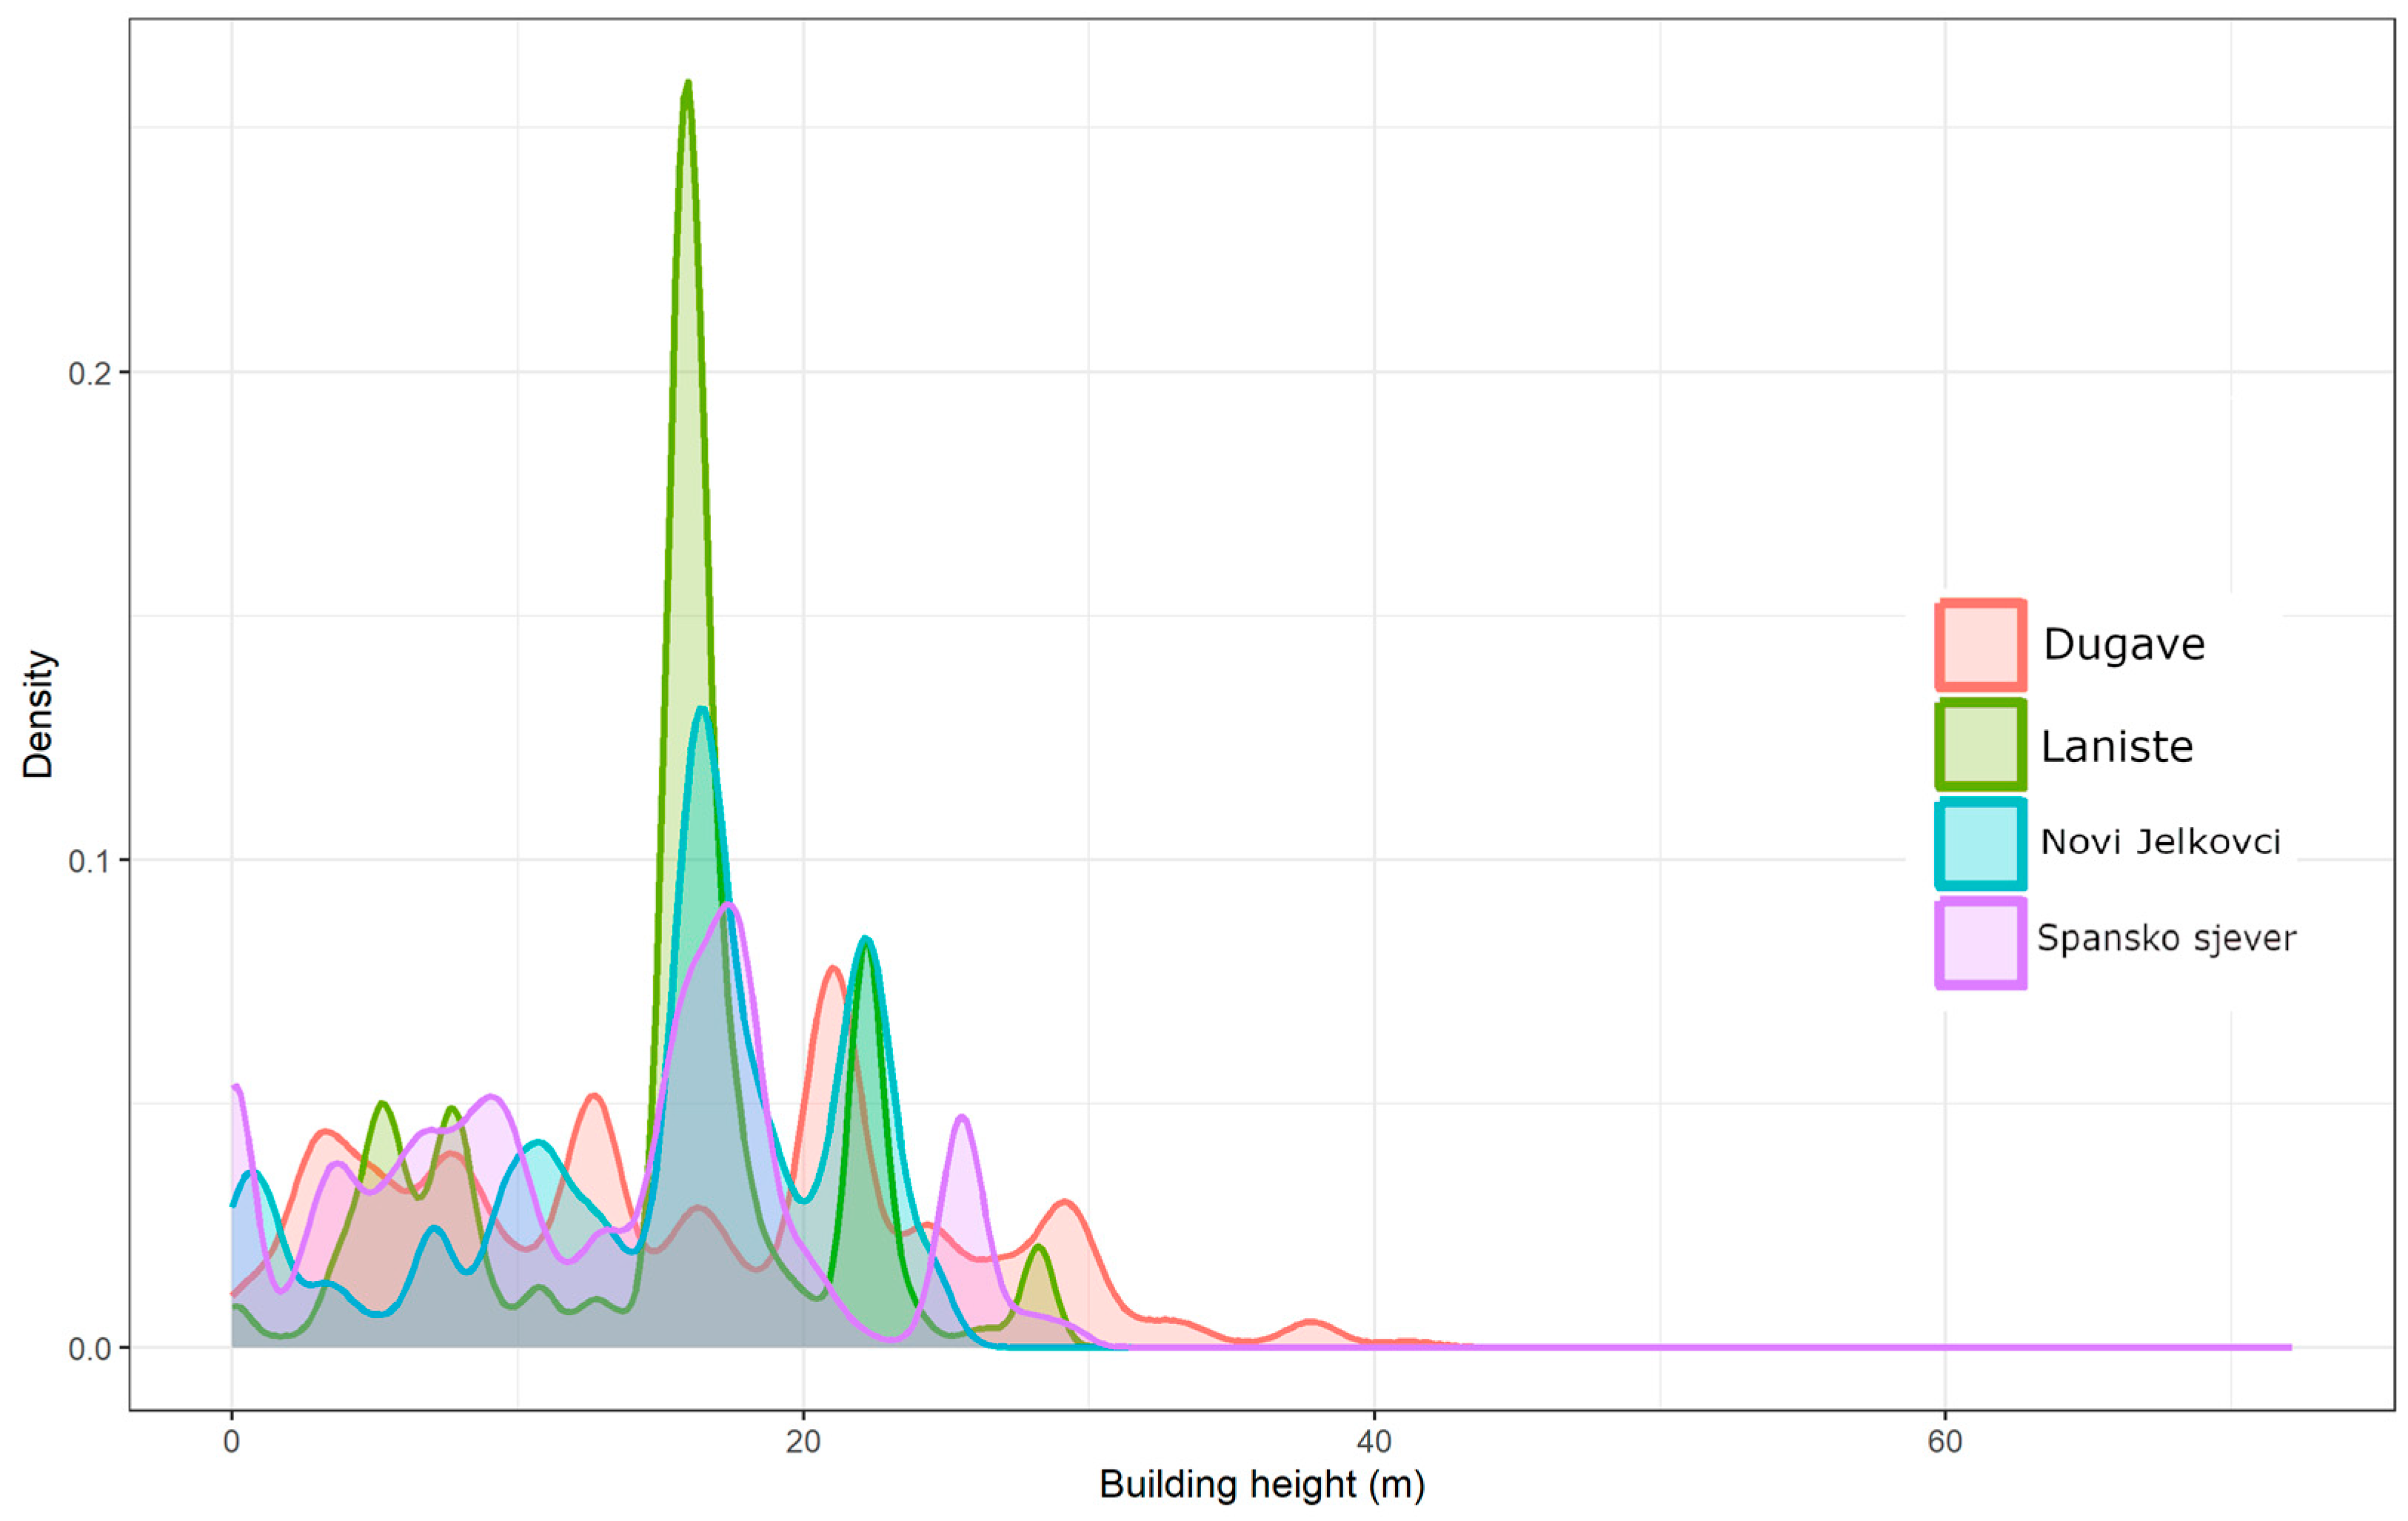
The results shown in Figure 8 present the kernel density distributions of building heights for the four analysed neighbourhoods, highlighting clear differences in the vertical urban structure. The shape of the density curves reflects the distinct development patterns, ranging from relatively homogeneous building stocks to more heterogeneous configurations.
Figure 8.
Kernel density distributions of building heights illustrating differences in vertical urban structure among the analysed LNCs.
Novi Jelkovec and Lanište exhibit pronounced and relatively narrow peaks, indicating a more uniform building stock typical of the planned residential developments. In Novi Jelkovec, building heights are strongly concentrated around 16–17 m, with a secondary concentration around 22 m, consistent with its median building height (16.34 m) and P90 value (22.42 m). Combined with the highest building coverage, this results in the highest volumetric density among the analysed neighbourhoods, indicating a compact three-dimensional structure. Lanište shows a similarly concentrated peak around 16 m, reflecting a homogeneous building structure with relatively low variability. However, its lower building coverage (14.49%) results in a more moderate volumetric density compared to Novi Jelkovec. In contrast, Dugave and Špansko sjever display broader and more irregular density curves, indicating more heterogeneous vertical structures. Dugave exhibits the widest spread of building heights, including a long right tail associated with the small number of very tall buildings (max 72.12 m). Despite having the highest maximum building height, its lower building coverage leads to the lowest volumetric density among the analysed neighbourhoods. Špansko sjever shows the lower typical building heights but a wider distribution, including taller structures, which, combined with relatively high coverage (19.25%), results in a moderately high volumetric density.
The density curves demonstrate that volumetric density is not determined by the building height alone, but by the combined effect of the height distribution and building coverage. These patterns are consistent with the differences in urban morphology identified in Table 5 and help explain the variation in thermal behaviour observed across neighbourhoods, particularly the stronger warming associated with compact or highly built environments. This can be attributed to reduced ventilation, increased heat storage, and limited radiative cooling in more densely built structures. Such a pattern suggests that urban warming is influenced not only by surface characteristics but also by the three-dimensional configuration of built structures, supporting the concept of a volumetric urban heat island. In this context, spatial configuration and structural complexity play a key role in modulating thermal responses beyond surface characteristics alone.
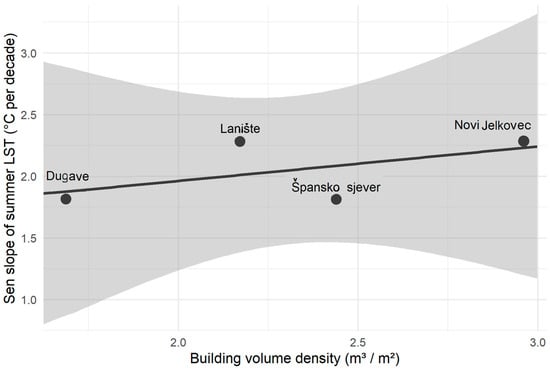
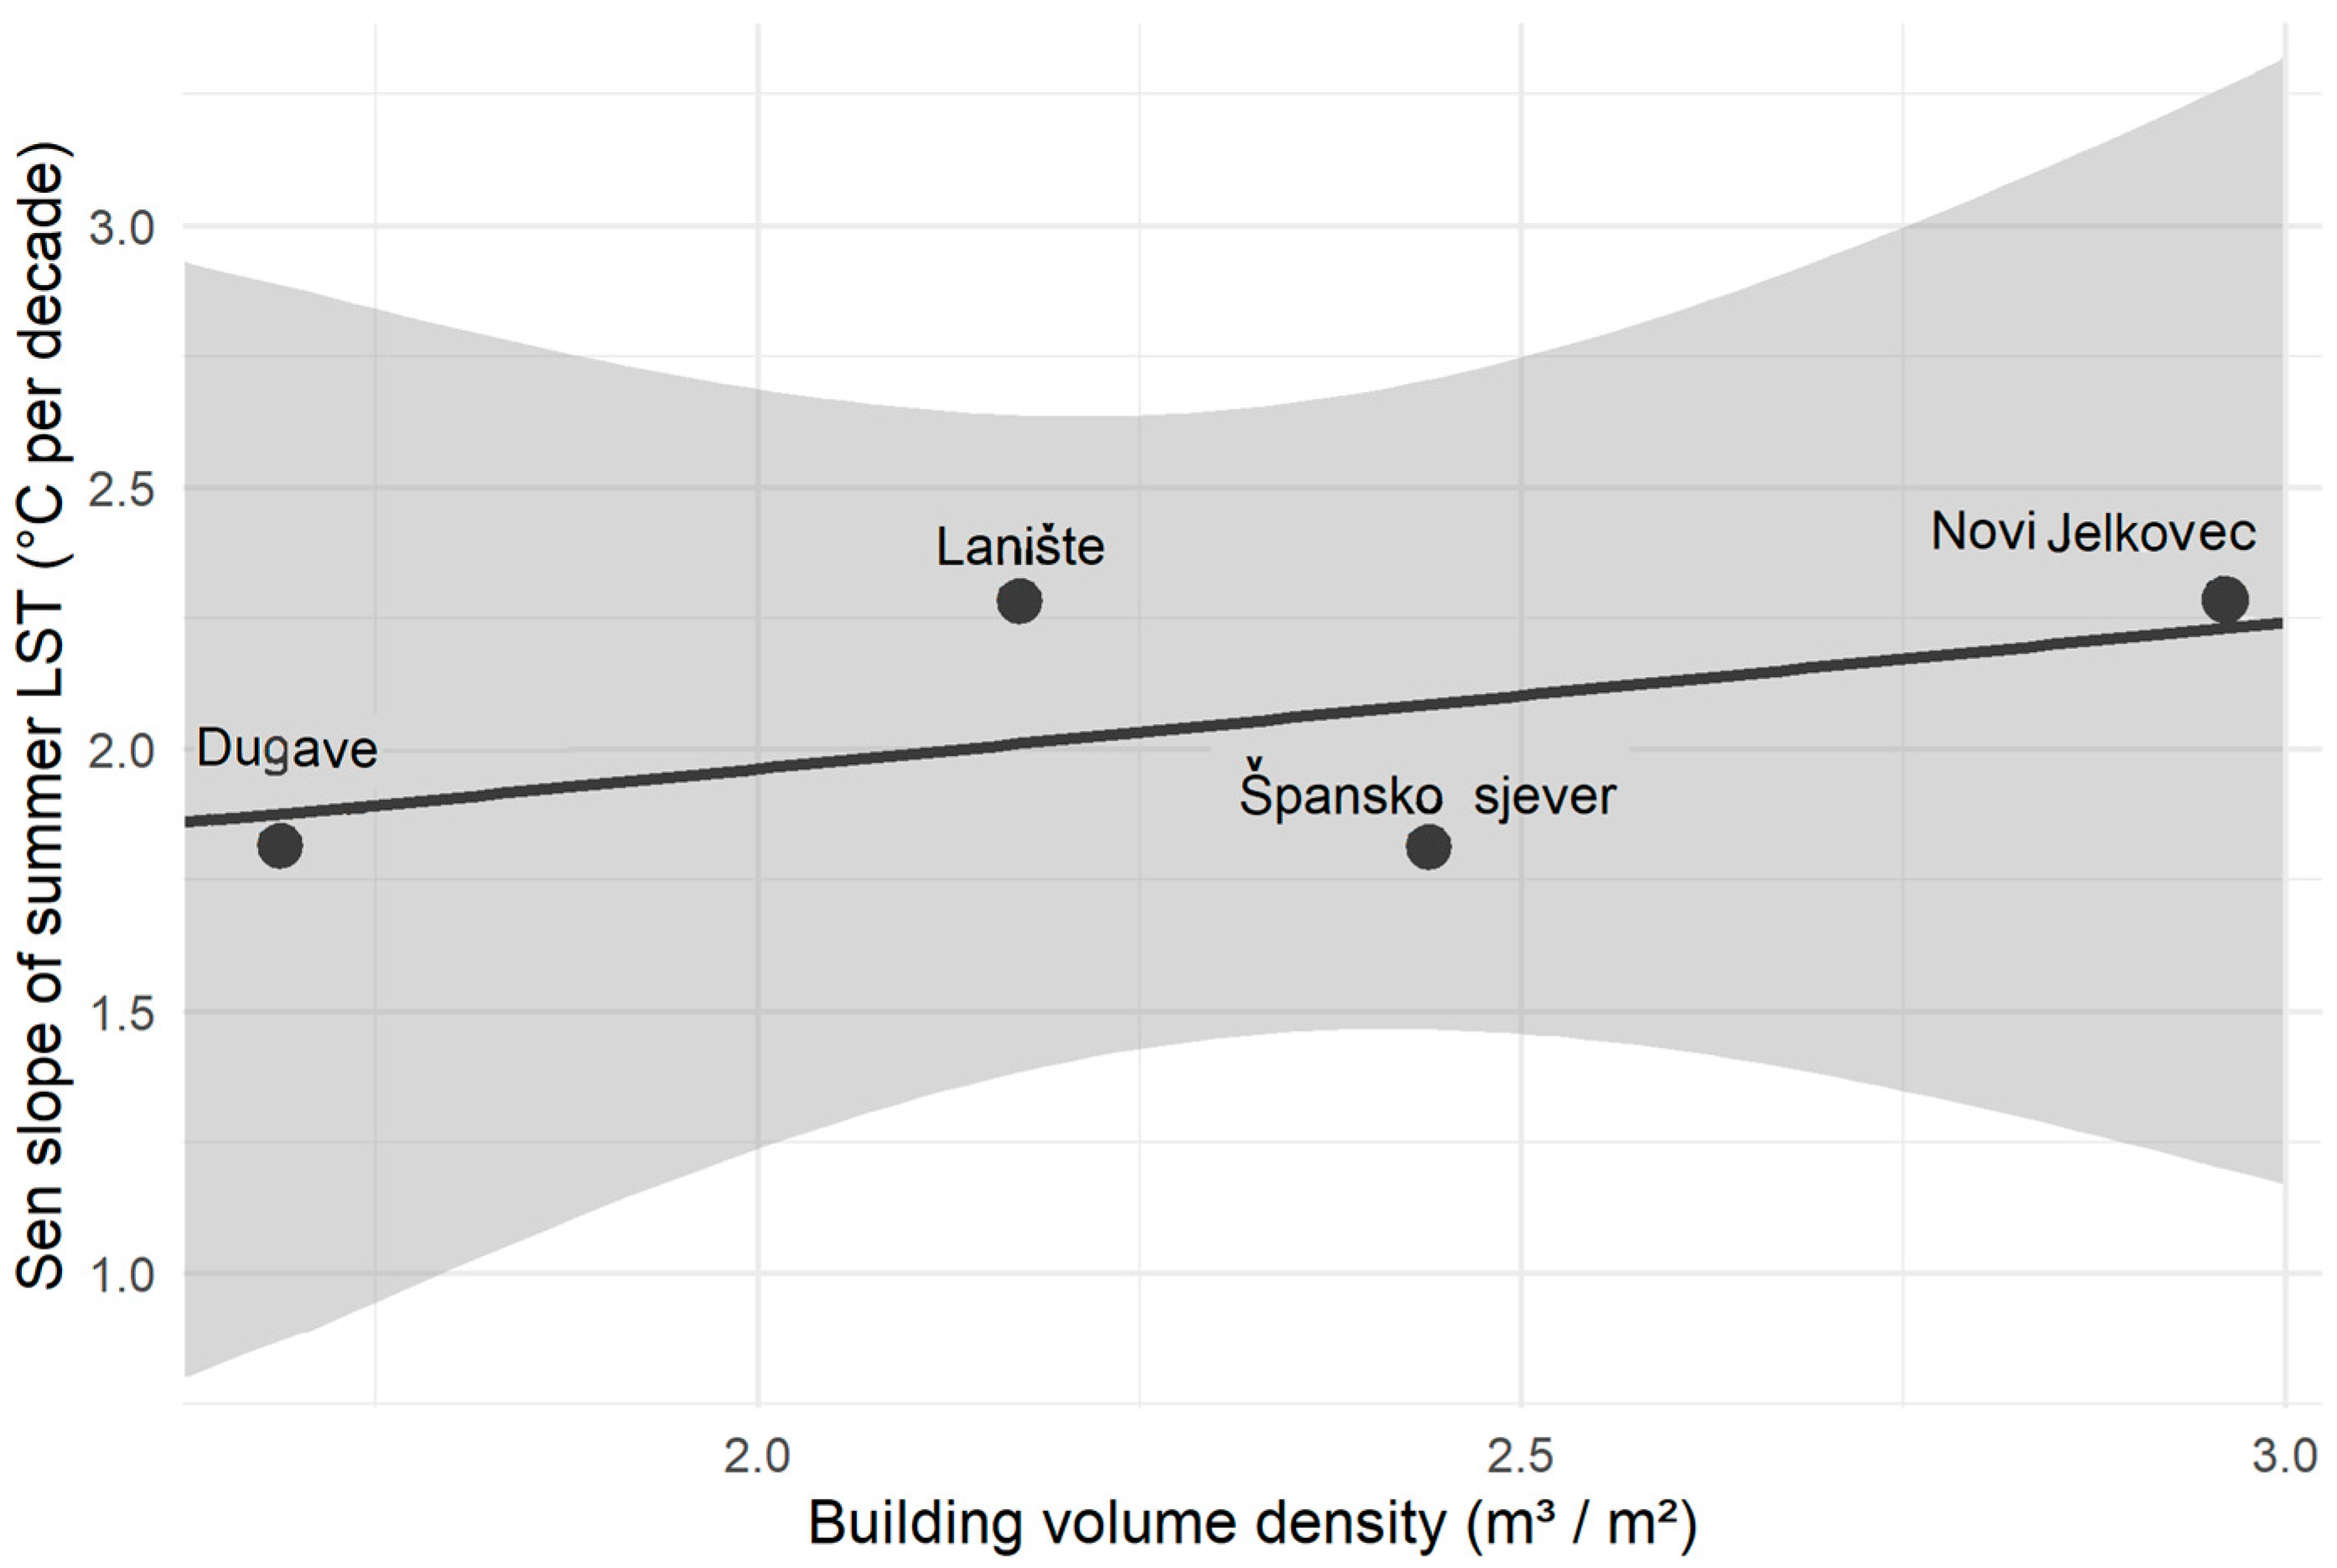
The results shown in Figure 9 illustrate the relationship between volumetric building density and the rate of summer surface warming across the analysed neighbourhoods. The results suggest a positive relationship, with neighbourhoods characterised by higher volumetric density generally exhibiting stronger warming trends. Dugave shows the lowest volumetric density (1.69 m3 m−2) and the weakest warming trend (≈2.00 °C per decade), while Špansko sjever exhibits relatively high density (2.44 m3 m−2) and a warming trend of ≈2.02 °C per decade. Lanište and Novi Jelkovec, characterised by higher volumetric densities (2.17 and 2.96 m3 m−2, respectively), exhibit warming trends of ≈2.83 and ≈2.18 °C per decade, indicating a potential relationship between the three-dimensional building density and the rate of temperature increase. However, the relationship is not strictly linear, and some deviations are visible, particularly in Špansko sjever, which exhibits lower warming than expected given its relatively high volumetric density. Given that the underlying trends are not statistically significant and the number of observations is limited (n = 4), this relationship should be interpreted as indicative rather than conclusive. The deviations suggest that additional factors, such as vegetation, surface materials, and local urban configuration, also influence thermal dynamics. Rather than providing statistical evidence of a strong correlation, the results indicate a consistent tendency that aligns with the broader patterns identified in previous analyses.
Figure 9.
Relationship between building volume density and the rate of summer surface warming across the analysed LNCs. The regression line is shown, with the grey shaded area representing the confidence interval.
To further examine these relationships, a multiple linear regression model was applied using LST as the dependent variable and NDVI, NDBI, and volumetric building density as predictors. The model was based on neighbourhood-year observations (n = 40) and was statistically significant (F = 10.78, p < 0.001), explaining approximately 47% of the variance in LST (R2 = 0.47; adjusted R2 = 0.43). This indicates a moderate explanatory power, suggesting that while the selected variables contribute to LST variability, a substantial proportion of variance remains unexplained, likely due to additional environmental and microclimatic factors.
Among the predictors, NDBI showed a significant positive association with LST (β = 96.75, p = 0.0015), confirming the influence of built-up intensity on surface temperature. In contrast, NDVI and volumetric building density were not statistically significant (p > 0.05), indicating that neither vegetation nor three-dimensional structure alone fully explain the observed LST variability. Although these relationships are not statistically robust, consistent directional trends point to contextual or interacting influences, suggesting that LST variability is shaped by multiple factors rather than single predictors.
This interpretation is further supported by the potential overlap in the explanatory roles of the analysed variables and the influence of multicollinearity, reinforcing that the observed statistical relationships are influenced by multiple interacting factors, which may reduce the individual explanatory power of single variables within the model.
The findings suggest that two-dimensional land-cover indicators (NDVI and NDBI) help explain spatial variability in temperature. In contrast, 3D urban morphology—expressed through volumetric building density—may influence the rate of urban warming over time. This supports the concept of the volumetric urban heat island effect, in which the vertical structure of the built environment contributes to long-term thermal dynamics. This highlights that urban warming cannot be fully understood through surface-based indicators alone, as the spatial organization and vertical complexity of built structures play a critical role in shaping local thermal responses. In this context, neighbourhoods with similar land-cover characteristics may exhibit different warming trajectories depending on their three-dimensional configuration.
4. Conclusions
This study explores the long-term dynamics of intra-urban thermal patterns in four representative neighbourhoods of Zagreb by combining satellite-derived land surface temperature (LST), spectral land-cover indicators (NDVI and NDBI), and 3D urban morphology derived from LiDAR data. Linear regression, Sen’s slope estimation, the Mann–Kendall test, and interannual difference analysis were used to capture both long-term trends and year-to-year variability in urban thermal conditions.
A consistent increase in summer (June–September) LST was observed across all analysed neighbourhoods during the period 2015–2024, with warming rates ranging from approximately 2.00 °C per decade in Dugave to approximately 2.83 °C per decade in Lanište, while Novi Jelkovec (≈2.18 °C per decade) and Špansko sjever (≈2.02 °C per decade) exhibit intermediate values. Although these trends are not consistently statistically significant, the overall direction of warming remains stable across methods. NDVI generally indicates weak or slightly negative trends in vegetation across most neighbourhoods, while Novi Jelkovec shows a non-significant positive trend.
Interannual analysis further suggests that these long-term changes are accompanied by consistent relationships between temperature, vegetation, and built-up intensity. In general, increases in built-up intensity tend to coincide with higher temperatures, while increases in vegetation are associated with lower temperatures. However, these relationships should be interpreted with caution due to the limited number of observations and the influence of interannual variability.
These results also suggest that the two-dimensional land-cover indicators alone cannot fully explain the observed thermal patterns, particularly in areas with more complex three-dimensional urban structures. Neighbourhoods with higher volumetric building density, reaching ≈2.96 m3/m2 in Novi Jelkovec, tend to show stronger warming compared to lower-density areas such as Dugave (≈1.69 m3/m2). However, the relationship should be interpreted as indicative rather than statistically conclusive, as illustrated by Špansko sjever, which exhibits relatively high volumetric density (≈2.44 m3/m2) but only moderate warming (≈2.02 °C/10 year). The relationship is not strictly linear. This points to the role of additional factors such as vegetation, surface materials, and local urban configuration. This indicates that the influence of vertical urban structure on thermal dynamics is evident, but not independently determinative, and should be understood within a multi-factor framework.
A broader structural pattern can be recognized within the analysed neighbourhoods. While newer developments such as Novi Jelkovec and Lanište generally show more compact built forms and stronger warming, these patterns are not uniformly expressed across all neighbourhoods, as illustrated by Špansko sjever. These differences are consistent with stronger warming in more compact neighbourhoods and highlight the influence of both urban morphology and development history on local thermal behaviour. The findings show that neighbourhoods may share a common warming direction while differing in their thermal pathways, highlighting the added explanatory value of 3D urban morphology.
Overall, the results suggest that long-term urban warming in the analysed neighbourhoods of Zagreb is driven by the combined effects of land-cover change and three-dimensional urban structure. In this context, the results support the concept of a volumetric urban heat island, in which the vertical configuration of the built environment contributes to the intensification of thermal conditions over time. However, this relationship should be interpreted as an empirically supported pattern rather than a statistically proven causal relationship. Combining satellite temperature time series with LiDAR-based urban morphology provides a more complete framework for analysing intra-urban thermal dynamics. It integrates temporal thermal trends with three-dimensional structural properties of the built environment, offering a more comprehensive understanding than either approach alone.
From a practical perspective, the findings of this study have several implications for urban planning and climate adaptation strategies. The results suggest that the design of climate-sensitive urban environments should consider the land-cover characteristics, particularly vegetation and built-up intensity, as well as vertical urban structure. Limiting the excessive built-up density and promoting the integration of green infrastructure within high-density areas may help mitigate urban heat accumulation.
Furthermore, the observed variability between neighbourhoods highlights the importance of context-sensitive planning approaches, in which the specific morphological characteristics of individual urban areas are considered rather than applying uniform mitigation strategies. In this sense, the results suggest that spatial configurations with a greater share of open and green areas may contribute to more moderate thermal responses compared with more compact and intensively built structures. The inclusion of three-dimensional urban indicators in planning frameworks may therefore support a more effective understanding and management of urban thermal processes.
These findings should be interpreted within the specific urban and morphological context of Zagreb, while further research on a larger number of urban areas and longer time series is needed to refine and generalize these conclusions. These findings suggest that urban heat dynamics cannot be fully understood through 2D land-cover analysis alone but benefit from a three-dimensional perspective of urban form.
Author Contributions
Conceptualization, S.Š.; methodology, S.Š. and O.B.O.; software, S.Š.; validation, S.Š. and O.B.O.; formal analysis, S.Š.; investigation, S.Š., O.B.O., V.C. and A.K.; resources, S.Š., V.C. and A.K.; data curation, S.Š.; writing—original draft preparation, S.Š. and O.B.O.; writing—review and editing, S.Š., O.B.O., V.C. and A.K.; visualization, S.Š.; supervision, S.Š. and A.K.; project administration, S.Š.; funding acquisition, V.C. All authors have read and agreed to the published version of the manuscript.
Funding
This research was funded by the University North within the scientific project “The influence of the 3D structure of a city on the intensity of the urban heat island”, number UNIN-TEH-26-1-4, Varazdin, Croatia (2026).
Data Availability Statement
Landsat satellite data used in this study are publicly available from USGS/NASA repositories. LiDAR data are not publicly available due to access restrictions but may be obtained from the State Geodetic Administration or from the corresponding author upon reasonable request. Local Neighbourhood Council (LNC) boundary data are publicly available via the Zagreb Geoportal.
Conflicts of Interest
The authors declare no conflicts of interest.
Abbreviations
The following abbreviations are used in this manuscript:
| UHI | Urban Heat Island |
| LST | Land Surface Temperature |
| NDVI | Normalized Difference Vegetation Index |
| NDBI | Normalized Difference Built-up Index |
| MK | Mann–Kendall test |
| SD | Standard deviation |
| LNC | Local Neighbourhood Councils |
| AOI | Area of Interest |
| POS | Croatian social housing programme |
| DSM | Digital Surface Model |
| DTM | Digital Terrain Model |
| nDSM | Normalized Digital Surface Model |
| OLI | Operational Land Imager |
| TIRS | Thermal Infrared Sensor |
| GEE | Google Earth Engine |
| DKP | Digital Cadastral Plan |
| DGU | State Geodetic Administration |
| SVF | Sky View Factor |
| 3D | Three-Dimensional |
References
- Kara, Y.; Yavuz, V. Urban Microclimates in a Warming World: Land Surface Temperature (LST) Trends Across Ten Major Cities on Seven Continents. Urban Sci. 2025, 9, 115. [Google Scholar] [CrossRef] [Scilit]
- Wang, N.; Shen, L.; Fei, W.; Liu, Y.; Zhao, H.; Liu, L.; Wang, A.; He, B.-J. Seasonal Effects of Urban Morphology on the Thermal Environment Based on Automated Machine Learning: A Case Study of Beijing. Remote Sens. 2025, 17, 3150. [Google Scholar] [CrossRef] [Scilit]
- Filho, W.L.; Wolf, F.; Castro-Díaz, R.; Li, C.; Ojeh, V.; Gutiérrez, N.; Bönecke, J. Addressing the Urban Heat Islands Effect: A Cross-Country Assessment of the Role of Green Infrastructure. Sustainability 2021, 13, 753. [Google Scholar] [CrossRef] [Scilit]
- Ekanayaka, N.; Kankanamge, N.; Kangana, N.; Goonetilleke, A. The Impact of Urban Ventilation Corridors on Land Surface Temperature: A Temporal Multisource Spatial Analysis of Colombo, Sri Lanka. Environ. Urban. Asia 2025, 16, 41–69. [Google Scholar] [CrossRef] [Scilit]
- Ma, X.; Ong, B.L. Optimizing Urban Greenery for Climate Resilience: A Case Study in Perth, Australia. Land 2025, 14, 1088. [Google Scholar] [CrossRef] [Scilit]
- Lu, Y.; Yue, W.; Huang, Y. Effects of land use on land surface temperature: A case study of Wuhan, China. Int. J. Environ. Res. Public Health 2021, 18, 9987. [Google Scholar] [CrossRef] [Scilit]
- Dugord, P.A.; Lauf, S.; Schuster, C.; Kleinschmit, B. Land use patterns, temperature distribution, and potential heat stress risk—The case study Berlin, Germany. Comput. Environ. Urban Syst. 2014, 48, 86–98. [Google Scholar] [CrossRef] [Scilit]
- Erdem, U.; Cubukcu, K.M.; Sharifi, A. An analysis of urban form factors driving urban heat island: The case of Izmir. Environ. Dev. Sustain. 2021, 23, 7835–7859. [Google Scholar] [CrossRef] [Scilit]
- Ünal, Y.S.; Sonuç, C.Y.; Incecik, S.; Topcu, H.S.; Diren-Üstün, D.H.; Temizöz, H.P. Investigating urban heat island intensity in Istanbul. Theor. Appl. Climatol. 2020, 139, 175–190. [Google Scholar] [CrossRef] [Scilit]
- Guha, S.; Govil, H.; Dey, A.; Gill, N. Analytical study of land surface temperature with NDVI and NDBI using Landsat 8 data. Eur. J. Remote Sens. 2018, 51, 667–678. [Google Scholar] [CrossRef] [Scilit]
- Naserikia, M.; Asadi Shamsabadi, E.; Rafieian, M.; Leal Filho, W. Climate modulates land cover impact on UHI. Sci. Rep. 2022, 12, 16276. [Google Scholar] [CrossRef] [Scilit]
- Dushi, M.; Berila, A. Population density and LST in Prizren. Sci. Rev. Eng. Environ. Sci. 2022, 31, 47–62. [Google Scholar] [CrossRef] [Scilit]
- Schmidt, P.; Lawrence, B.T. Association between land surface temperature and green volume. Sustainability 2022, 14, 14642. [Google Scholar] [CrossRef] [Scilit]
- Morabito, M.; Crisci, A.; Guerri, G.; Messeri, A.; Congedo, L.; Munafò, M. Surface urban heat islands in Italian cities. Sci. Total Environ. 2021, 751, 142334. [Google Scholar] [CrossRef] [Scilit] [PubMed]
- Kaplan, G.; Avdan, U.; Avdan, Z.Y. Urban heat island analysis using Landsat 8 data. Proceedings 2018, 2, 358. [Google Scholar] [CrossRef] [Scilit]
- Halder, B.; Karimi, A.; Mohammad, P.; Bandyopadhyay, J.; Brown, R.D.; Yaseen, Z.M. Land alteration and UHI in Seville. Theor. Appl. Climatol. 2022, 150, 613–635. [Google Scholar] [CrossRef] [Scilit]
- Zhao, X.; Yang, S.; Shen, S.; Fang, Y. UHI and land use changes in Beijing. Proc. SPIE 2009, 7454, 74541J. [Google Scholar] [CrossRef] [Scilit]
- Selka, I.; Mokhtari, A.M.; Tabet Aoul, K.A.; Bengusmia, D.; Kacemi, M.; Djebbar, K.E.B. Land use changes and LST using GEE. ISPRS Int. J. Geo-Inf. 2024, 13, 237. [Google Scholar] [CrossRef] [Scilit]
- Wang, C.; Zhang, H.; Ma, Z.; Yang, H.; Jia, W. Urban morphology influencing the urban heat island in the high-density city of Xi’an based on the local climate zone. Sustainability 2024, 16, 3946. [Google Scholar] [CrossRef] [Scilit]
- Yan, J.; Yin, C.; An, Z.; Mu, B.; Wen, Q.; Li, Y.; Zhang, Y.; Chen, W.; Wang, L.; Song, Y. The influence of urban form on land surface temperature: A comprehensive investigation from 2D urban land use and 3D buildings. Land 2023, 12, 1802. [Google Scholar] [CrossRef] [Scilit]
- Du, S.; Wu, Y.; Guo, L.; Fan, D.; Sun, W. How does the 2D/3D urban morphology affect the urban heat island across urban functional zones? ISPRS Int. J. Geo-Inf. 2024, 13, 120. [Google Scholar] [CrossRef] [Scilit]
- Yu, H.; Zhang, C.; Yu, L. Do Different Urban Morphologies Have Consistent Patterns on Urban Heat Islands in Different Cities and Scales? A Local Climate Zone Exploration. IEEE J. Sel. Top. Appl. Earth Obs. Remote Sens. 2025, 18, 2429–2443. [Google Scholar] [CrossRef] [Scilit]
- Liu, B.; Guo, X.; Jiang, J. Urban morphology and UHI. Sustainability 2023, 15, 10787. [Google Scholar] [CrossRef] [Scilit]
- Zhu, Z.; Shen, Y.; Fu, W.; Zheng, D.; Huang, P.; Li, J.; Lan, Y.; Chen, Z.; Liu, Q.; Xu, X. 2D/3D morphology and LST. Ecol. Indic. 2023, 150, 110221. [Google Scholar] [CrossRef] [Scilit]
- Mo, Y.; Huang, Y.; Zhong, R.; Wang, B.; Guo, Z. Effects of 2D/3D morphology on LST. Buildings 2025, 15, 1256. [Google Scholar] [CrossRef] [Scilit]
- Bai, Y.; Wang, M.; Yan, Y.; Wang, H. 2D/3D morphology and diurnal LST. Sci. Rep. 2025, 15, 39740. [Google Scholar] [CrossRef] [Scilit]
- Han, W. Scale effects of building morphology on LST. Sci. Rep. 2023, 13, 19312. [Google Scholar] [CrossRef] [Scilit]
- Sinha, S.; Banerjee, A. Review of LULC and UHI dynamics. Discov. Geosci. 2025, 3, 253. [Google Scholar] [CrossRef] [Scilit]
- Han, S.; Hou, H.; Estoque, R.C.; Zheng, Y.; Shen, C.; Murayama, Y. Seasonal effects of morphology on LST. Build. Environ. 2023, 228, 109913. [Google Scholar] [CrossRef] [Scilit]
- Zhou, G.; Song, C.; Simmers, J.; Cheng, P. Urban 3D GIS from LiDAR. Comput. Geosci. 2004, 30, 345–353. [Google Scholar] [CrossRef]
- Alexander, C.; Smith-Voysey, S.; Jarvis, C.H.; Tansey, K. Integrating footprints and LiDAR. Comput. Environ. Urban Syst. 2009, 33, 285–292. [Google Scholar] [CrossRef] [Scilit]
- Kaya, Y. Building heights from ICESat-2 and GEDI. Buildings 2024, 14, 3571. [Google Scholar] [CrossRef] [Scilit]
- Bai, D.; Miao, C.; Xi, Y.; Liu, H.; He, C. 2D/3D building morphology and urban heat. Ecol. Indic. 2025, 180, 114296. [Google Scholar] [CrossRef] [Scilit]
- Zeynali, R.; Mandanici, E.; Bitelli, G. Urban morphology and air/surface temperatures. Sustainability 2026, 18, 1695. [Google Scholar] [CrossRef] [Scilit]
- Şengün, E.; Arefi, H.; Aksoy, S.; Taheri, P. Modelling urban heat island with Landsat and LiDAR. J. Geospat. Surv. 2023, 3, 1. [Google Scholar] [CrossRef] [Scilit]
- Peña Acosta, M.; Vahdatikhaki, F.; Santos, J.; Hammad, A.; Dorée, A.G. Data-driven UHI modelling for planning. Sustain. Cities Soc. 2021, 71, 102948. [Google Scholar] [CrossRef] [Scilit]
- Li, K.; Wang, H. Data-driven mitigation of urban heat. Buildings 2025, 15, 3544. [Google Scholar] [CrossRef] [Scilit]
- Snaiki, R.; Merabtine, A. Machine learning for UHI: A review. Sustain. Cities Soc. 2025, 134, 106943. [Google Scholar] [CrossRef] [Scilit]
- Seletković, A.; Kičić, M.; Ančić, M.; Kolić, J.; Pernar, R. UHI analysis in Zagreb. Sustainability 2023, 15, 3963. [Google Scholar] [CrossRef] [Scilit]
- Krtalić, A.; Kuveždić Divjak, A.; Čmrlec, K. Satellite-driven UHI assessment in Zagreb. ISPRS Ann. Photogramm. Remote Sens. Spatial Inf. Sci. 2020, V-3-2020, 757–764. [Google Scholar] [CrossRef] [Scilit]
- Bečić, D.; Gašparović, M. UHI and land-use patterns in Zagreb. Land 2025, 14, 1470. [Google Scholar] [CrossRef] [Scilit]
- Maradin, M.; Filipčić, A. Urban heat island intensity of Zagreb in summer and winter season. In International Scientific Conference GEOBALCANICA 2018; Geobalcanica Society: Skopje, North Macedonia, 2018; pp. 3–13. [Google Scholar] [CrossRef] [Scilit]
- Bečić, D.; Pažur, A. Exploring Spatial Patterns of Urban Heat Islands in Zagreb. In Proceedings of the REAL CORP 2025, 30th International Conference on Urban Planning and Regional Development in the Information Society GeoMultimedia, Graz, Austria, 14–16 April 2025; pp. 459–468. [Google Scholar] [CrossRef]
- Nimac, I.; Herceg-Bulić, I.; Žuvela-Aloise, M. Urbanisation and heat load in Zagreb. Urban Clim. 2022, 46, 101343. [Google Scholar] [CrossRef] [Scilit]
- European Commission. Building Heat Resilience in Zagreb, Croatia. 2023. Available online: https://mission-adaptation-portal.ec.europa.eu/stories-0/building-heat-resilience-zagreb-croatia_en (accessed on 21 March 2026).
- Zhang, L.; Bagan, H.; Chen, C.; Yoshida, T. Exploring the impact of urban morphology on river cooling effects: A case study of the Arakawa River in Tokyo. Ecol. Indic. 2025, 172, 113288. [Google Scholar] [CrossRef] [Scilit]
- Li, X.; Zhang, L.; Hao, Y.; Shi, Z.; Zhang, P.; Xiong, X.; Li, Y.; Lu, Z. Understanding resilience of urban food-energy-water nexus system: Insights from an ecological network analysis of megacity Beijing. Sustain. Cities Soc. 2023, 95, 104605. [Google Scholar] [CrossRef] [Scilit]
- Li, X.; Zhou, Y.; Asrar, G.R.; Imhoff, M.; Li, X. The surface urban heat island response to urban expansion: A panel analysis for the conterminous United States. Sci. Total Environ. 2017, 605–606, 426–435. [Google Scholar] [CrossRef] [Scilit]
- Stewart, I.D.; Oke, T.R. Local climate zones for urban temperature studies. Bull. Am. Meteorol. Soc. 2012, 93, 1879–1900. [Google Scholar] [CrossRef] [Scilit]
- Guo, G.; Wu, Z.; Xiao, R.; Chen, Y.; Liu, X.; Zhang, X. Impacts of urban biophysical composition on land surface temperature in urban heat island clusters. Landsc. Urban Plan. 2016, 135, 1–10. [Google Scholar] [CrossRef] [Scilit]
- City of Zagreb. General Urban Plan of the City of Zagreb; City of Zagreb Urban Planning Institute: Zagreb, Croatia, 2022; Available online: https://geoportal.zagreb.hr (accessed on 27 November 2025).
- Croatian Bureau of Statistics. Census of Population, Households and Dwellings 2021. 2022. Available online: https://dzs.gov.hr/u-fokusu/popis-2021/ (accessed on 27 November 2025).
- Državna Geodetska Uprava (DGU). Multisenzorsko Zračno Snimanje Republike Hrvatske—LiDAR Podaci. Nacionalna Infrastruktura Prostornih Podataka (NIPP). Available online: https://registri.nipp.hr/tcpdf/print/izvor_javno.php?id=1871 (accessed on 21 March 2026).
- Qiang, C.; Cheng, Q.; Li, K.; Wang, D.; Cao, S. The influence of sky view factor on daytime and nighttime urban land surface temperature in different spatial-temporal scales: A case study of Beijing. Remote Sens. 2021, 13, 4117. [Google Scholar] [CrossRef] [Scilit]
- U.S. Geological Survey (USGS). Landsat 8–9 Collection 2 Level-2 Science Product Guide; U.S. Geological Survey: Reston, VA, USA, 2023. Available online: https://www.usgs.gov/landsat-missions/landsat-collection-2-surface-temperature (accessed on 21 March 2026).

Disclaimer/Publisher’s Note: The statements, opinions and data contained in all publications are solely those of the individual author(s) and contributor(s) and not of MDPI and/or the editor(s). MDPI and/or the editor(s) disclaim responsibility for any injury to people or property resulting from any ideas, methods, instructions or products referred to in the content. |
© 2026 by the authors. Licensee MDPI, Basel, Switzerland. This article is an open access article distributed under the terms and conditions of the Creative Commons Attribution (CC BY) license.