Abstract
Protected areas play a critical role in conserving biodiversity and ecosystem services, yet their effectiveness in mitigating anthropogenic pressures, particularly in fragile alpine ecosystems like the Three-River-Source region of the Qinghai Plateau—a vital water tower for Asia—requires long-term and rigorous assessment. This study evaluates the effectiveness of the Three-River-Source Nature Reserve by analyzing spatiotemporal changes in the human footprint from 2000 to 2024. Utilizing a globally consistent human footprint dataset refined with high-resolution grazing intensity data for the Qinghai Plateau, we compared human footprint dynamics inside and outside the reserve and across its three functional zones (core, buffer, experimental). To isolate the policy effect, we employed a propensity score matching (PSM) approach to control for confounding geographical and socio-economic factors. Results indicate that while human pressure increased overall, the nature reserve was partially effective. The PSM-based comparison revealed that the increase in human footprint inside the nature reserve was lower than in matched external control areas. This effect was spatially heterogeneous and positively correlated with management intensity: it was most pronounced in the core zone, moderate in the buffer zone, and negligible in the experimental zone. The conservation outcomes showed notable improvement following policy enhancements, particularly after the national park’s formal establishment. The findings confirm the value of strict internal protection and functional zoning but highlight the challenge of intensifying peripheral pressures, underscoring the need for integrated landscape-level management strategies beyond the reserve’s boundaries to ensure long-term ecological integrity.
1. Introduction
Protected areas are a core means of conserving biodiversity and maintaining ecosystem services, and their effectiveness is directly linked to the achievement of global ecological security [1,2,3]. Thus, evaluating and improving their effectiveness is essential to ensuring ecological integrity, supporting human well-being, and advancing toward long-term planetary sustainability. Based on a previous study [4], the evaluation of protected area effectiveness is a multi-layered system encompassing the assessment of its coverage, management inputs, site selection rationale, threat abatement effectiveness, and direct biodiversity outcomes, as well as the core components emphasized by the International Union for Conservation of Nature (IUCN) Green List of standards (https://iucngreenlist.org/standard/components-criteria/, accessed on 10 January 2026), such as good governance, sound design and planning, effective management, and successful conservation outcomes. Among these elements, effective management—and notably its efficacy in mitigating human threats—constitutes a cornerstone of success, a subject of extensive discussion and a core concern of this study.
Against the backdrop of increasingly pronounced global climate and environmental changes [5,6], and with the advancement of the UN Convention on Biological Diversity’s “30 by 30 target” (which aims to protect at least 30% of the world’s terrestrial and marine areas by 2030) [7,8,9], many scholars have conducted evaluations of the management effectiveness of protected areas in addressing human threats [4,10,11,12]. For instance, Geldmann et al. [13], by creating a global map of human pressure, conducted a large-scale assessment of the effectiveness of protected areas in mitigating anthropogenic pressures. Their study found that while human pressure inside protected areas was generally lower than in surrounding areas, some sites still faced significant threats. Jones et al. [14] further revealed that approximately one-third of the world’s protected areas remain under intense human pressure. Such evaluations are crucial not only for measuring the practical outcomes of conservation investments but also for providing a basis for optimizing management strategies, thereby helping to reverse the global trend of biodiversity loss [15,16]. Currently, from a global perspective, the proportion of protected areas that have undergone effectiveness assessments in mitigating anthropogenic pressures remains low, highlighting the urgency of large-scale, long-term evaluation studies.
In China, the development of a system of protected areas with national parks at its core has been advancing [17], and the assessment of effectiveness is receiving increasing emphasis [15,18,19]. These evaluations focus on multiple dimensions such as the status of key protected species, ecosystem structure, ecosystem services, and the management and control of major threat factors [20]. It is noteworthy that human activities, as a central element of threat factors, have been recognized as one of the critical indicators for measuring management effectiveness [21].
The Three-River-Source region, located in the hinterland of the Qinghai Plateau, is the source of three major rivers: the Yangtze, Yellow, and Lancang (the upper Mekong) Rivers, earning it the title “Water Tower of Asia” [22,23]. In addition, its unique environment supports exceptional biodiversity for a high-altitude region [24]. The Three-River-Source Nature Reserve is vast in area, ranking as one of China’s largest nature reserves and one of the larger protected areas globally. Given the substantial human, material, and financial resources invested in managing such an extensive reserve, evaluating the effectiveness of its management has become an urgent and necessary task [25,26]. Numerous studies have evaluated the effectiveness of this reserve [26,27,28,29,30,31]. Early assessments primarily focused on changes in ecosystem patterns following the implementation of ecological projects. For example, Shao et al.’s evaluation of the 2005–2009 ecological protection and construction project indicated that the trend of ecological degradation in the reserve was initially curbed [32]. In recent years, with advances in remote sensing and geographical information science technologies, research has expanded. For instance, Zhao et al. [27] assessed the reserve’s effectiveness in conserving biodiversity and ecosystem services, while Tan et al. [28], focusing on changes in the human pressure, found the Three-River-Source Nature Reserve to be “partially effective” in mitigating human pressures.
A review of these studies reveals several limitations. Firstly, regarding the assessment perspective, most existing research concentrates on ecosystem indicators [27,29,32], with relatively insufficient attention paid to the control of human activities—a more direct indicator reflecting the outcome of management interventions. However, this assessment is particularly critical for the Three-River-Source Nature Reserve. The region has an average elevation of 4500 m, which is close to the snow line, resulting in an ecosystem that is highly fragile and sensitive, with low productivity. In such habitats, even minimal human disturbance may lead to significant or severe ecosystem degradation. Although Gu et al. [33] examined the spatial heterogeneity of grazing pressure in the Three-River-Source region, comprehensive assessments integrating multiple dimensions of human activity, such as road construction, grazing, mining, and settlement expansion, remain scarce. Secondly, methodologically, data on human activities in existing studies often rely on simulations or short-term surveys, lacking support from long-term, spatially explicit human activity datasets [34,35]. Particularly, dynamic data on spatially and temporally quantified grazing activities are extremely scarce. This limitation hampers the accuracy and spatiotemporal comparability of the assessments. Finally, concerning the temporal scope, most research covers earlier time periods, leaving a near gap in effectiveness evaluations for the past decade [14,28]. This makes it difficult to reflect the outcomes of the latest conservation policies. Notably, while Tan et al. directly assessed changes in the human pressure, their study period does not cover the critical phase of the Three-River-Source National Park pilot program and subsequent enhanced management measures [28]. This period represents a significant transformation in the protected area’s management system, the effectiveness of which urgently requires evaluation.
To address the aforementioned research gaps, this study aims to evaluate the effectiveness of the Three-River-Source Nature Reserve in managing human threats from 2000 to 2024. We will employ the newly released global human footprint dataset [36], which integrates multidimensional data including population density, land use, road distribution, grazing intensity, and nighttime light. This dataset comprehensively reflects the spatial distribution and intensity changes in human pressures on ecosystems. By analyzing the spatiotemporal characteristics of the human footprint within the reserve and comparing them with non-protected areas, this research seeks to address the following questions: (1) How has the human footprint changed within the Three-River-Source Nature Reserve and its surrounding areas from 2000 to 2024, and what are its spatiotemporal differentiation characteristics? (2) Have the establishment and management measures of the reserve contributed to mitigating human activity intensity? (3) How does management effectiveness vary across different functional zones (core zone, buffer zone, and experimental zone), and what do these differences reveal about the efficacy of management strategies? By analyzing a 25-year time series, this study will help elucidate long-term trends and phased characteristics of human activity regulation in the Three-River-Source Nature Reserve, providing a basis for enhancing the management efficacy of the “Water Tower of Asia” and achieving harmonious coexistence between humans and nature.
2. Study Area
2.1. The Protection Policy Evolution for the Three-River Source Nature Reserve
To enhance ecological protection in this region, China established the Provincial-level Three-River-Source Nature Reserve in 2000, which was upgraded to a national reserve in 2003 (Table 1). As a type of protected area, nature reserves in China generally prioritize strict protection, which aligns them most closely with IUCN Category Ia (Strict Nature Reserve). However, in terms of the Three-River-Source Nature Reserve, with its vast expanse, minimal human disturbance, and high ecological integrity, it reflects a conservation philosophy and management approach that is more akin to IUCN Category Ib (Wilderness Area). The first phase of ecological protection/restoration projects was implemented starting in 2005 (Table 1). During 2015–2016, the government issued the Three-River-Source National Park System Pilot Program, initiating the pilot phase [37,38]. In 2021, China formally established the Three-River-Source National Park, marking a new stage in the region’s ecological protection and demonstrating the national-level importance attached to conserving this critical ecological functional zone [38].

Table 1.
The protection policy summary for the Three-River Source Nature Reserve.
2.2. The Ecological Importance of the Three-River-Source Nature Reserve
The Three-River-Source Nature Reserve covers a total area of 152,300 km2, ranking as one of China’s largest and highest national nature reserves. It is situated in southern Qinghai Province, China (Figure 1), with an average altitude exceeding 4500 m above sea level. It delivers approximately 60 billion m3 of water annually to downstream areas, supporting billions of people across Asia [39,40,41]. It comprises 18 protected sub-zones, each containing three functional zones. The name, location, area, and conservation objectives of each protected sub-zone are shown in Figure 1 and Table 2. Its vast expanse and well-preserved alpine ecosystem are of representative significance on a global scale [42].
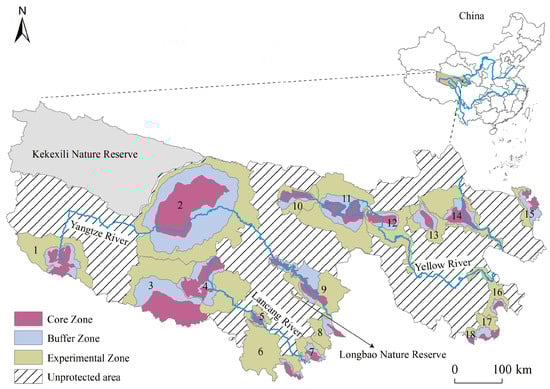
Figure 1.
Geographical location of the Three-River-Source region and the Three-River-Source National Nature Reserve. The reserve comprises 18 protected sub-zones. The names, areas, and conservation objectives of the 18 protected sub-zones can be retrieved by their corresponding serial numbers in Table 2.
Table 2.
List of the 18 Protected Sub-zones in the Three-River-Source Nature Reserve.
The ecological importance of this reserve is exceptionally high [24,27]. It encompasses vast expanses of glaciers, snow-capped mountains, lake wetlands, and grassland meadows while also performing critical ecosystem services. Renowned as a germplasm resource bank for alpine species, it provides habitat for numerous rare wildlife species, including the Tibetan antelope, snow leopard, wild yak, and black-necked crane [43]. However, given the region’s economic underdevelopment and persistent poverty, it has long grappled with the challenge of reconciling conservation with development. Historical human activities, such as overgrazing, once led to ecological issues, including grassland degradation [44] and lake shrinkage [40].
To evaluate the effectiveness of the management in the Three-River-Source Nature Reserve, this study compares changes in human activities inside the reserve with those in non-reserve areas within the broader Three-River-Source region. It is important to note that within the extensive Three-River-Source region, apart from the Three-River-Source Nature Reserve, there are two other national nature reserves: Hoh Xil and Longbao (Figure 1). Hoh Xil nature reserve serves as a key habitat and migration corridor for the Tibetan antelope, while Longbao nature reserve primarily focuses on protecting rare birds like the black-necked crane. Although these areas, along with the Three-River-Source Nature Reserve, form a protected area network, they differ in management objectives, intensity of human activities, and conservation priorities. It is not suitable to consider these regions as having no management or protection whatsoever. Therefore, when conducting the comparative analysis between areas inside and outside the Three-River-Source Nature Reserve, both the Hoh Xil and Longbao reserves are excluded from the “non-reserve” control group to ensure a more precise assessment.
3. Materials and Methods
3.1. Data Sources and Pre-Processing
The data utilized in this study are derived from the following three primary sources.
The boundary of the Three-River-Source Nature Reserve and the demarcation lines of its three functional zones. The vectorized boundary and functional zoning maps (i.e., core, buffer, and experimental zones) of the Three-River-Source Nature Reserve and the Hoh Xil and Longbao reserves were obtained from the two published studies [27,28]. These studies digitized the official boundaries released by China’s ecological and environmental authorities, ensuring the spatial data’s accuracy and authority.
The human disturbance dataset. In this study, we adopt the human footprint to characterize human disturbance, which represents the comprehensive degree of disturbance exerted by humans on ecosystems. Annual terrestrial human footprint data from 2000 to 2024 at a 1 km resolution were sourced from the dataset published by Mu et al. [36]. This globally consistent dataset integrates eight key anthropogenic pressure factors, including population density, land use, road networks, and nighttime light (NTL). It offers the longest continuous and most up-to-date time series for large-scale human footprint assessments and has been widely applied in ecological evaluations [15]. The dataset employs high-precision input data: it uses a harmonized global NTL product that integrates inter-calibrated observations from the Defense Meteorological Satellite Program (DMSP) with simulated DMSP-like data from the Visible Infrared Imaging Radiometer Suite (VIIRS) to ensure temporal consistency [45]. For representing built environments, it utilizes the global artificial impervious area dataset [46], which provides superior temporal consistency and more accurate delineation of urban extents compared to estimates derived solely from NTL data [47,48].
The grazing intensity data for the Qinghai Plateau. To complement the human footprint dataset and better capture the dynamics of a dominant local anthropogenic activity, we incorporated annual high-resolution grazing intensity data for the Qinghai Plateau from 1990 to 2020 [49]. This spatially explicit, long-term dataset provides critical information on livestock distribution pressure, and it has been widely applied in research related to human-land relationships [50]. Given the unavailability of grazing intensity data beyond 2020 at the time of this study, the values for 2020 were applied as a proxy for the period 2021–2024. This approach is based on the assumption that large-scale grazing patterns on the Qinghai Plateau remained relatively stable during these subsequent years [34,35,51].
In addition to the three primary data sources mentioned above, the following data were also utilized in this study to serve the propensity score matching model. Variates covering five major categories were selected: topography (elevation and slope), population, transportation, land use, and climate. The specific data sources and processing procedures are as follows: elevation and slope data were obtained from the Geospatial Data Cloud platform (https://www.gscloud.cn/); population density data were sourced from the global dataset published by WorldPop (https://hub.worldpop.org/); road density data were acquired from the National Catalogue Service for Geographic Information (https://www.webmap.cn/); land use type data were obtained from the China Land Cover Dataset [52]; and climate factors, namely annual mean temperature and annual precipitation, were sourced from the Resource and Environmental Science and Data Platform (https://www.resdc.cn/). To ensure analytical consistency, all raster data were uniformly resampled to a 1 km resolution during processing.
3.2. Methods
3.2.1. Revision of the Human Footprint Dataset
As the Three-River-Source region is a traditional pastoral area, livestock grazing constitutes the dominant livelihood activity and exerts significant pressure on ecosystems, particularly grassland systems [33,53]. Thus, grazing activity and its dynamics must be considered in human activity mapping. However, most existing human activity datasets [48,54], including the one adopted in this study, treat grazing as a static factor due to the lack of dynamic grazing data. This approach leads to a substantial underestimation of human pressure in this region. To address this gap, prior to evaluating the conservation effectiveness of the Three-River-Source Nature Reserve, we improved the human footprint dataset using the recently published Annual High-Resolution Grazing-intensity Maps on the Qinghai Plateau (1990–2020) [49].
The revision procedure consisted of three steps: (1) Resampling the original grazing intensity data to a 1 km resolution; (2) Normalizing the resampled grazing intensity values; (3) The normalized grazing intensity for each grid was multiplied by a factor of 4, consistent with the weighting scheme used in the original human footprint model [36]. Subsequently, it was overlaid with the original human footprint data from the same year to obtain the updated human footprint dataset.
3.2.2. Comparison of Human Footprint Changes Inside and Outside the Reserve
We first analyzed the spatiotemporal changes in the human footprint within the Three-River-Source Nature Reserve and in non-protected areas of the broader Three-River-Source region from 2000 to 2024. We then compared the differences between the two zones. Key policy milestones—including the reserve’s establishment in 2000, its upgrade to a national nature reserve in 2003, the launch of the first-phase ecological conservation and construction project in 2005, the national park pilot during 2015–2016, and the formal establishment of the national park in 2021 (Table 1)—were considered critical time nodes for detailed analysis.
Given that the protected and non-protected areas are comparable in size and share similar natural and socio-economic conditions, e.g., high-altitude environment, vulnerable alpine ecosystems, pastoral livelihoods, and multi-ethnic culture, a lower increase in the human footprint inside the reserve relative to outside would initially indicate effective control of human activities by the reserve management [15,28].
3.2.3. Analysis of Human Footprint Changes Across Functional Zones
The Three-River-Source Nature Reserve is divided into three functional zones—core zone (strict protection), buffer zone (restricted activity), and experimental zone (sustainable use)—each with progressively less stringent regulations on human activities. According to the Regulations on Nature Reserves and the relevant provisions of the Three-River-Source Nature Reserve Administration, the core zone contains well-preserved ecosystems or key habitats of rare species. Access and productive facilities are strictly prohibited, with exceptions only for approved scientific research. The buffer zone, surrounding the core area, aims to mitigate external disturbances. Tourism and production activities are prohibited, though non-destructive scientific observation is permitted. The experimental zone permits activities such as scientific experiments, education, ecotourism, and sustainable resource use, provided they do not cause pollution or ecological damage. The distribution of the three functional zones of 18 sub-zones is shown in Figure 1. Based on the above information, it can be seen that the core zone of the Three-River-Source Reserve corresponds to IUCN Category Ia (Strict Nature Reserve), where human activity is strictly limited for ecological protection; the buffer zone aligns with Category Ib (Wilderness Area), preserving large-scale natural conditions while permitting limited scientific activities; and the experimental zone is equivalent to Category II (National Park), supporting sustainable ecotourism and environmental education.
3.2.4. Evaluation Based on Propensity Score Matching
To control for the potential influence of physical, geographical, and socioeconomic factors on human activity intensity, based on previous studies [55,56], this study selected elevation, slope, population density, annual precipitation, annual mean temperature, road distance, and land use type as variables and conducted an analysis using a propensity score matching model. Following this procedure, a comparison of changes in the human footprint inside and outside the nature reserve can then be conducted, thereby minimizing the influence of other factors on changes in human activities as much as possible, allowing for a rigorous assessment of the regulatory effect of the nature reserve policy on the human footprint.
Specifically, randomly generated points inside the Three-River-Source Nature Reserve served as the treatment group, while randomly generated points outside the reserve were used as the control group. Considering the 1 km spatial resolution of the human footprint data, a minimum distance of 1 km was set between random points to prevent multiple points from falling within the same raster cell. Points within the reserve were generated at a density corresponding to 10% of its total area [57]. After removing points with missing data, 15,055 valid points were retained for the treatment group. Correspondingly, 15,783 points were ultimately generated outside the reserve as the control group. Propensity score matching was then performed between the treatment and control groups using the nearest neighbor matching method within a caliper. The caliper width was set to one-quarter of the standard deviation of the propensity scores to restrict the similarity range of the matched samples.
4. Results
4.1. Spatiotemporal Changes and Differences in Human Footprint Inside and Outside the Three-River-Source Nature Reserve for 2000–2024
Figure 2 illustrates the spatiotemporal changes in the human footprint inside and outside the Three-River-Source Nature Reserve from 2000 to 2024. The human footprint values outside the reserve were consistently and significantly higher than those inside throughout the study period. Specifically, the external human footprint increased from 5.4490 in 2000 to 5.8565 in 2024. In contrast, the internal human footprint showed a more moderate increase, rising from 4.5560 to 4.8951 over the same period. Consequently, the absolute difference (Outside minus Inside) widened from approximately 0.8930 to 0.9614.
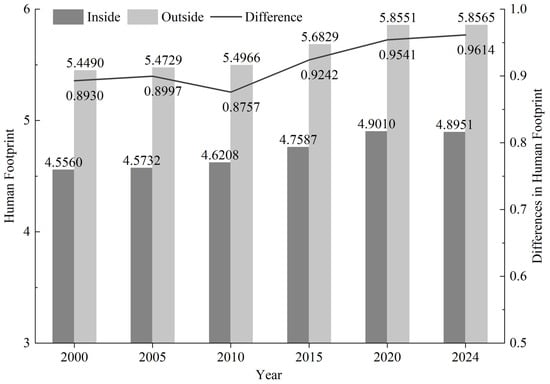
Figure 2.
Changes in the human footprint inside and outside the Three-River-Source Nature Reserve from 2000 to 2024.
The temporal trends reveal a nuanced relationship with key conservation policy milestones. Inside the reserve, the human footprint growth was relatively slow from 2000 to 2010, which may be associated with the initial establishment and subsequent upgrade to national reserve, alongside early ecological projects. A more noticeable increase occurred between 2010 and 2020, potentially reflecting cumulative pressures or adaptive human activities. Notably, a stabilization and slight decrease in the internal human footprint is observed from 2020 to 2024 (4.9010 to 4.8951), a period coinciding with the formal establishment of the Three-River-Source National Park. This suggests that the enhanced management regime may have begun to curb internal pressures. Conversely, the external human footprint exhibited a near-monotonic increase, indicating a steady rise in anthropogenic pressure in the surrounding, less-regulated areas (Figure 2).
Human footprint intensity exhibited significant spatial heterogeneity across the Three-River-Source Nature Reserve (Figure 3). Overall, higher human footprint values were predominantly distributed along the eastern and southeastern edges of the reserve, areas typically in closer proximity to transportation corridors and settlements. In contrast, the vast western and central regions of the protected area consistently maintained lower human footprint levels.
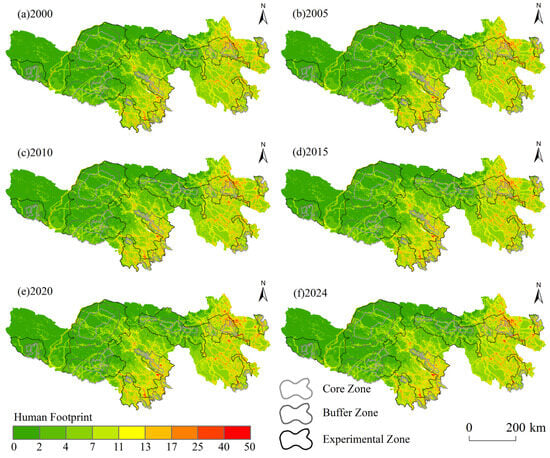
Figure 3.
Spatiotemporal dynamics of the human footprint in and around the Three-River-Source Nature Reserve for 2000, 2005, 2010, 2015, 2020, and 2024. Both the Hoh Xil and Longbao nature reserves are excluded from the “non-reserve” control group to ensure a more precise assessment.
An analysis of spatiotemporal changes revealed that, from 2000 to 2024, the reserve successfully preserved extensive zones of low human footprint over the long term. However, anthropogenic pressure increased in peripheral regions. Specifically, the spatial extent of areas with a higher human footprint showed expansion over time, particularly in the southeastern periphery and outer buffer zones, indicating a trend of spatial proliferation of human influence. Notably, the large, contiguous area within the reserve boundary maintained its low footprint values across all time slices, underscoring the role of protected area establishment in safeguarding large tracts of land from intensive human disturbance.
A closer examination of the periods following key policy interventions (Table 1) reveals further insights. After 2015, coinciding with the initiation of the national park system pilot, and notably from 2020 to 2024, following its formal establishment, distinct patterns emerged. During these phases, despite a continued increase in peripheral pressure—evidenced by a noticeable intensification of the human footprint around several residential clusters—the stable, low value within the reserve boundary remained largely intact. No significant invasion of high-intensity patches into this reserve was observed. This spatial persistence of the low-impact reserve, amidst rising surrounding pressures, provides spatial evidence supporting the effectiveness of the implemented management and regulatory measures in maintaining the ecological integrity of the reserve’s most critical areas.
4.2. Human Footprint Dynamics Across Functional Zones of the Three-River-Source Nature Reserve for 2000–2024
Analysis of the human footprint trends across the three functional zones of the Three-River-Source Nature Reserve from 2000 to 2024 reveals a clear hierarchy and distinct temporal dynamics (Figure 4). Throughout the study period, the experimental zone exhibited the highest human footprint values, increasing from 5.0331 to 5.4240. The buffer zone maintained intermediate levels, rising from 4.0110 to 4.3203. The core zone consistently displayed the lowest human footprint, showing a modest increase from 3.9959 to 4.2377.
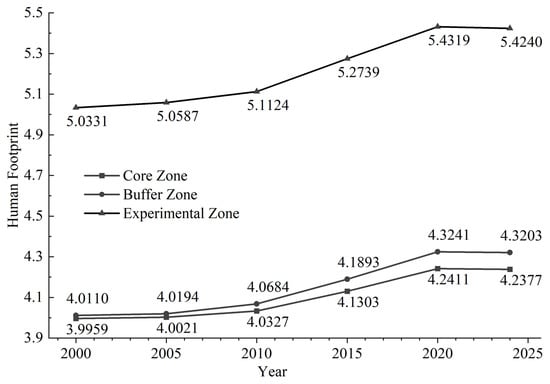
Figure 4.
Human footprint value across the three functional zones of the Three-River-Source Nature Reserve for 2000–2024.
The observed spatial pattern—experimental zone > buffer zone > core zone—directly corresponds to the gradient of management intensity and permitted human activity levels, validating the fundamental design of the functional zoning system. The significantly lower and most stable human footprint in the core zone underscores the effectiveness of the strictest protections in preserving areas of highest ecological value from anthropogenic pressure. The intermediate level in the buffer zone reflects its role in mitigating external influences. The highest pressure in the experimental zone aligns with its designated purpose of accommodating certain human activities and regional development needs.
Temporally, all three zones show an overall upward trend, indicating a background of increasing regional anthropogenic pressure. However, the rates of increase diverged. The core zone experienced the smallest absolute increase (~0.2418), followed by the buffer zone (~0.3093), and the experimental zone with the largest (~0.3909). This gradient in growth rates suggests that protection measures were most effective in slowing down the intensification of human pressure in the most strictly managed areas. A closer look at the trends suggests possible phase changes: a period of relatively steeper increase in the early 2010s may reflect cumulative development pressures, followed by a notable deceleration and stabilization in growth rates across all zones, particularly after around 2015. This inflection coincides with the implementation of the national park system pilot and subsequent strengthened governance, indicating that enhanced integrated management has been effective in curbing the acceleration of human footprint expansion within the reserve.
4.3. Evaluation Results Based on Propensity Score Matching
4.3.1. Balance Test Results
According to the balance test results presented in Table 3, the absolute bias between the treatment and control groups was significantly reduced for most variables after matching. The absolute standardized differences for all variables were below 5%, well under the 20% threshold recommended for balance diagnostics [55]. T-tests conducted at the 0.05 significance level indicated no statistically significant differences in the most observed variables between the matched groups, confirming that the matching procedure was effective.
Table 3.
Balance test results for propensity score matching.
4.3.2. Effectiveness of the Three-River-Source Nature Reserve in Alleviating Human Pressure
Overall, between 2000 and 2024, the increase in the human footprint inside the Three-River-Source Nature Reserve was slightly lower than that in the external control areas (Table 4). This indicates that the intensity of human activities within the reserve increased at a slightly slower pace compared to areas outside, suggesting that the nature reserve policy has exerted a certain inhibitory effect on the expansion of human activities at the aggregate level.
Table 4.
Changes in Human Footprint and Comparison with External Control Groups in the Three-River-Source Nature Reserve and Its Functional Zones, 2000–2024.
Analyzed by functional zone, the regulatory effects exhibit distinct spatial heterogeneity (Table 4). The effect is most pronounced in the Core Zone, where the increase in the human footprint inside the zone was significantly lower than in its external control areas, with a substantial difference of −0.1768. This demonstrates that the strict conservation measures in the Core Zone have effectively curbed the intensification of human activities. The Buffer Zone shows a moderate regulatory effect, with an internal increase also lower than that of its external controls, indicating a certain level of containment, albeit weaker than in the Core Zone. In contrast, the regulatory effect appears limited in the Experimental Zone, where the trend in human footprint increase is essentially consistent with that in the external control areas.
5. Discussion
5.1. The Use of the Human Footprint
Human footprint serves as an excellent indicator for evaluating the effectiveness of ecological engineering management. In this study, we successfully used the human footprint as a proxy for human activities to assess the effectiveness of nature reserves in mitigating integrated human pressures. Similar approaches, including even global-scale assessments, have been adopted internationally [13,14], as this indicator offers advantages in cost-effectiveness and sustainability. Traditional ecological effectiveness assessments [29,32] often target specific project periods and require substantial funding and personnel for extensive field surveys and remote sensing interpretation, resulting in shorter time series and high costs. Meanwhile, some model-based studies [27] output ecosystem services or use habitat quality as a proxy for biodiversity, and these results often lack thorough ground validation. The well-validated human footprint dataset used in our study enables a 25-year temporal monitoring at a relatively low cost. Its results directly reflect the reserve’s management effectiveness against human disturbance, providing an efficient supplement for long-term and dynamic conservation effectiveness evaluation. Therefore, the application of the human footprint index can be extended to a variety of ecological conservation and restoration scenarios beyond nature reserves. Its effectiveness has been validated in such assessments. For instance, Allan et al. [58] integrated human footprint with forest loss data to systematically evaluate the conservation effectiveness and threats facing Natural World Heritage Sites globally.
Compared with studies conducted in the same region as this paper, our findings show consistency while demonstrating distinct advantages in data and methodology. Evaluations of the effectiveness of the Three-River-Source Nature Reserve from an ecological dimension [27,29,32] indicate that while the overall trend of ecosystem degradation has been initially contained with partial improvement, and ecological recovery in key project areas is better than in non-project areas, the challenge of grassland degradation has not been fundamentally reversed. Our assessment results highly correspond with this picture. This consistency between human activity and ecological status assessments, from different dimensions, jointly confirms the achievements and ongoing challenges faced by the Three-River-Source Nature Reserve. Our core conclusion also aligns with the evaluation results based on the human footprint by Tan et al. [28]. This consensus, derived from different data sources and methodologies, mutually reinforces the basic pattern of the reserve’s management effectiveness and enhances the reliability of our findings. However, our study advances the assessment in terms of comprehensiveness, timeliness, and precision. Firstly, compared to the human footprint datasets like those from Tan et al. [28] and Venter et al. [47,48], the dataset developed by Mu et al. [36] employed in this study offers a longer temporal coverage (up to 2024) and higher spatial resolution in nighttime light and built-up area data. More importantly, we further refined this dataset by incorporating dynamic grazing intensity, significantly improving the accuracy of human footprint in representing anthropogenic pressure in the alpine pastoral systems of the Qinghai Plateau [49]. Finally, in addition to descriptive comparison, we further employed the PSM method to conduct a rigorous evaluation of the conservation policy effectiveness. Consequently, for the Three-River-Source Nature Reserve, our assessment results are arguably among the most reliable currently available (Table 5).
Table 5.
A comparison of properties of representative human footprint datasets for the Three-River-Source region.
Finally, the application of the human footprint index extends far beyond evaluating the management effectiveness of ecological restoration and conservation projects. As a comprehensive and quantifiable tool, it plays a pivotal role in various fields of ecological research and conservation practice. For instance, this indicator can be used to analyze the direct impact of human activities on biodiversity. Relevant research has demonstrated how changes in the human footprint directly drive changes in species extinction risk [59]. In conservation planning, human footprint data can be integrated with ensemble modeling to effectively identify priority areas for ecological protection. A case in point is the work by Sofi and colleagues in 2023 [60], which applied this approach to delineate conservation priorities for the habitats of the vulnerable species Arnebia euchroma. Furthermore, the human footprint serves as a fundamental metric for monitoring global changes in wilderness areas [61], providing essential data to assess the encroachment of human activity on the planet’s last wild spaces. This underscores the index’s broad utility as a versatile tool for macro-scale ecological assessment and systematic conservation planning.
5.2. Analysis of Conservation Effectiveness and Policy Implications
The key findings of this study indicate that the Three-River-Source Nature Reserve is “partially effective” in mitigating human pressure, as demonstrated by a lower growth rate of the human footprint inside the reserve compared to matched external areas and a gradient of decreasing effectiveness from the core zone to the experimental zone. These findings are not an isolated case but align closely with the common challenges and existing understanding of protected areas worldwide [13,14,15].
First, our conclusion that “human pressure persists yet grows at a controlled rate inside the protected area” resonates with the findings of global assessments, such as that by Geldmann et al. [13]. Our analysis using the PSM method provides more robust, counterfactual-based empirical evidence for this general pattern in the Three-River-Source region. This consensus underscores a critical policy challenge: while protected areas prove effective, managing human disturbances within them remains a persistent and arduous task. Future conservation efforts must place equal emphasis on enhancing management effectiveness and on expanding protected area coverage to meet the “30 by 30” target. For reserves like the Three-River-Source, located in high-altitude, ecologically fragile, and sensitive regions, even a slight increase in human activity can lead to severe ecological consequences. Therefore, this issue demands heightened attention from policymakers and stakeholders.
Second, the pressure divergence pattern of internal mitigation versus external intensification revealed in this study is a typical manifestation of the ecological islandization process experienced by many protected areas [3,15]. The accumulating human pressure from the periphery can not only erode reserve boundaries through edge effects but also impede species migration and ecological processes, ultimately undermining the long-term viability of the protected area [3]. The Three-River-Source case clearly illustrates that even a large, strictly managed reserve cannot be entirely insulated from the macro pressures of regional socio-economic development.
Finally, the call for “integrated landscape management beyond borders” should be understood within the theoretical frameworks of “social-ecological system” coupling and the “conservation spillover effect” [3]. As highlighted by Cumming, management actions within protected areas can generate significant spillover effects on surrounding habitats [3]. The implication for the Three-River-Source region is that future conservation policies should not only focus on curbing anthropogenic disturbances within the reserve but also proactively design synergistic mechanisms that foster positive regional spillovers. For instance, measures such as ecological compensation can be utilized to integrate the ecological brand value and partial benefits generated by national parks with the development of surrounding communities. This approach can transform peripheral areas from sources of pressure into conservation allies, thereby facilitating a shift in the conservation paradigm from defensive isolation to proactive synergy. This is crucial not only for the Three-River-Source region but also for many areas worldwide where the conflict between conservation and development is pronounced, as it is key to achieving long-term conservation goals.
The effectiveness of conservation measures correlates well with key policy milestones. During the initial period (2000–2005), following its establishment as a provincial reserve but prior to the implementation of major ecological projects, the mitigation of human pressure was relatively limited. Subsequently, the effectiveness improved, particularly after the initiation of the national park pilot program and its formal establishment. The diverging post-2020 trends—specifically, the decrease in human footprint inside the reserve versus its continued growth outside—provide clear evidence that the enhanced, integrated management under the national park regime has effectively buffered against regional development pressures. This temporal pattern confirms that the intensity and comprehensiveness of management interventions are crucial determinants of conservation outcomes.
The observed phenomenon in this study—where conservation effectiveness decreases along a gradient of management intensity—strongly validates the fundamental logic of the IUCN protected area management classification system and the core-buffer zone planning model [4]. However, this successful model is now facing new challenges. China is transitioning from the three-zone model of nature reserves to the two-zone model of national parks (https://www.gov.cn/gongbao/2026/issue_12566/202602/content_7057936.html, accessed on 20 February 2026). Internationally, the optimal design and governance of buffer zones, as well as their critical role in mitigating edge effects, have consistently been key research focuses. Our study demonstrates that the buffer zone in the Three-River-Source region indeed serves as an intermediary in alleviating pressure transmission. Therefore, under the two-zone reform, how to replace the physical buffering function of the original buffer zone through other management or community agreement measures—to prevent the core zone from being directly exposed to increasing external pressures—remains an urgent international issue that requires monitoring and validation.
5.3. Limitations and Future Works
This study has several limitations. In terms of data, grazing-related information remains relatively difficult to obtain. Currently, several global human footprint datasets are based on a unified global pasture dataset from the year 2000 [62]. Although a 2015 version of this dataset has been recently released [63], compared to the annual high-resolution data available for the Qinghai Plateau up to 2020 [49], this study employed the grazing intensity dataset specific to the Qinghai Plateau, which provides more detailed insights. However, this dataset only covers grazing intensity up to 2020, with no data available for the years 2021–2024, highlighting a need for future improvements. Additionally, Table 5 shows that factors such as major roadways, railways, and navigable waterways remain static in the human footprint data. This means that the revised human footprint presented in this paper is still a conservative estimate and likely an underestimate, a point that should be noted by readers.
In terms of future works, other similar protected areas in China, such as the Hainan Tropical Rainforest National Park, which was upgraded through the integration of multiple national nature reserves, also urgently require effectiveness assessments. The management effectiveness evaluation method proposed in this study is characterized by its speed, simplicity, and strong operability, making it well-suited for such applications. Furthermore, even if stakeholders wish to simultaneously assess multiple protected areas—such as all nature reserves and national parks across China, or even protected areas worldwide—the evaluation methodology presented in this paper may also be applicable. Finally, to gain a deeper understanding of the drivers behind changes in the human footprint, a key direction for future research is to quantify the relative contribution of each driving factor—including policy interventions, socioeconomic changes, and climate variability—to these changes.
6. Conclusions
This study provides a longitudinal and rigorous analysis of the human footprint dynamics within the Three-River-Source Nature Reserve from 2000 to 2024. By employing propensity score matching to control for extrinsic confounding factors, we obtained a more robust assessment of the reserve’s causal effect on alleviating human pressure. The findings demonstrate that the reserve has achieved partial success in mitigating human pressures. This is evidenced not only by the persistent and significant absolute disparity in human footprint levels between its interior and exterior but also by the PSM-based counterfactual analysis: the growth of the human footprint inside the reserve was measurably slower than in comparable external areas.
The research reveals a clear correlation between the intensity of policy interventions and conservation outcomes. Noticeable improvements followed the reserve’s upgrade to national park status, with internal pressures stabilizing post-2020 even as external pressures continued to rise. The spatial analysis, further validated by the PSM results across functional zones, confirms the effectiveness of the zoning strategy. A distinct gradient of regulatory impact—strongest in the core zone, moderate in the buffer zone, and minimal in the experimental zone—closely aligns with the gradient of management intensity and permitted human activities.
These insights reinforce the importance of strict, differentiated management within protected areas. They contribute critical evidence to support the ongoing development and optimization of China’s national park system and offer valuable implications for achieving the goals of the post-2020 global biodiversity framework. Future research should focus on extending the temporal scope of analysis, particularly through continued monitoring of key pressures like grazing, and investigating the long-term impacts of management policy transitions, such as the shift from a three-zone to a two-zone protection model.
Author Contributions
Conceptualization, S.L. and J.L.; methodology, S.L. and J.L.; software, Q.L.; validation, Q.L., F.X. and J.L.; formal analysis, S.L.; investigation, Q.L. and F.X.; resources, S.L. and J.L.; data curation, Q.L.; writing—original draft preparation, S.L.; writing—review and editing, S.L. and J.L.; visualization, Q.L. and F.X.; supervision, S.L. and J.L.; project administration, S.L. and J.L.; funding acquisition, S.L. and J.L. All authors have read and agreed to the published version of the manuscript.
Funding
This research was funded by the Research Project of Humanities and Social Sciences of the Ministry of Education, China, grant number 23YJA630046; the National Social Science Foundation of China (Art Science) Project (Grant No. 24BH166); and the Open Fund of the Hubei Key Laboratory of Environment and Culture in Yangtze Regions, grant number YC2025-5.
Data Availability Statement
The data that support the findings of this research will be provided by request.
Conflicts of Interest
The authors declare no conflicts of interest.
References
- Brahic, E.; Deuffic, P. Forest management in a French Natura 2000 conservation site: Integrating or keeping environmental standards at a distance? J. Nat. Conserv. 2026, 91, 127203. [Google Scholar] [CrossRef]
- Barth, A.; Ranacher, L.; Hesser, F.; Stern, T.; Schuster, K.C. Bridging business and biodiversity: An analysis of biodiversity assessment tools. Environ. Sustain. Indic. 2025, 26, 100682. [Google Scholar] [CrossRef]
- Cumming, G.S. Protected area management has significant spillover effects on vegetation. Nature 2025, 650, 642–651. [Google Scholar] [CrossRef]
- Rodrigues, A.S.L.; Cazalis, V. The multifaceted challenge of evaluating protected area effectiveness. Nat. Commun. 2020, 11, 5147. [Google Scholar] [CrossRef]
- Li, S.; Liu, Y.; Li, J.; Zhang, X. Mapping cropping patterns in the North China Plain over the past 300 years and an analysis of the drivers of change. J. Geogr. Sci. 2024, 34, 2074–2088. [Google Scholar] [CrossRef]
- Li, S.; Gao, D.; Zhao, Z.; Hua, L. Croplands in Canada over the past millennium: A geographically explicit reconstruction. Sci. China Earth Sci. 2025, 68, 1612–1623. [Google Scholar] [CrossRef]
- Yan, N.; Liu, G.; Casazza, M.; Chen, X.; Yang, Z. Towards 30 × 30 biodiversity targets: Potential contributions of ecological restoration based on biodiversity credit. Earth Crit. Zone 2025, 2, 100029. [Google Scholar] [CrossRef]
- Neugarten, R.A.; Chaplin-Kramer, R.; Sharp, R.P.; Schuster, R.; Strimas-Mackey, M.; Roehrdanz, P.R.; Mulligan, M.; van Soesbergen, A.; Hole, D.; Kennedy, C.M.; et al. Mapping the planet’s critical areas for biodiversity and nature’s contributions to people. Nat. Commun. 2024, 15, 261. [Google Scholar] [CrossRef] [PubMed]
- Shen, X.; Liu, M.; Hanson, J.O.; Wang, J.; Locke, H.; Watson, J.E.M.; Ellis, E.C.; Li, S.; Ma, K. Countries’ differentiated responsibilities to fulfill area-based conservation targets of the Kunming-Montreal Global Biodiversity Framework. One Earth 2023, 6, 548–559. [Google Scholar] [CrossRef]
- Keck, F.; Peller, T.; Alther, R.; Barouillet, C.; Blackman, R.; Capo, E.; Chonova, T.; Couton, M.; Fehlinger, L.; Kirschner, D.; et al. The global human impact on biodiversity. Nature 2025, 641, 395–400. [Google Scholar] [CrossRef] [PubMed]
- Santos Silva, A.R.; Rosa, M.R.; Vasconcelos, R.N.d. Evaluating the effectiveness of protected areas in preserving ecosystem processes via remote Sensing: A review. J. Nat. Conserv. 2025, 87, 127002. [Google Scholar] [CrossRef]
- Stoll-Kleemann, S. Evaluation of management effectiveness in protected areas: Methodologies and results. Basic Appl. Ecol. 2010, 11, 377–382. [Google Scholar] [CrossRef]
- Geldmann, J.; Manica, A.; Burgess, N.D.; Coad, L.; Balmford, A. A global-level assessment of the effectiveness of protected areas at resisting anthropogenic pressures. Proc. Natl. Acad. Sci. USA 2019, 116, 23209–23215. [Google Scholar] [CrossRef]
- Jones, K.R.; Venter, O.; Fuller, R.A.; Allan, J.R.; Maxwell, S.L.; Negret, P.J.; Watson, J.E.M. One-third of global protected land is under intense human pressure. Science 2018, 360, 788–791. [Google Scholar] [CrossRef] [PubMed]
- Li, Y.; Gong, J.; Li, S. Management Effectiveness of Protected Areas in Mitigating Human Disturbance: A Case Study of the Qilian Mountains for 2000–2022. Land 2025, 14, 2229. [Google Scholar] [CrossRef]
- Zhang, Z.X.; Dong, K.K.; Chen, Z.Q.; Hou, G.L.; Liu, Z.L. Comparative assessment of biodiversity conservation effectiveness across protected areas through considering both management efforts and ecological background. J. Environ. Manag. 2026, 398, 12. [Google Scholar] [CrossRef]
- Zhang, X.; Luo, H.; Shu, X.; Zhang, L. The ecological and economic impacts of national park pilot projects in China. Ecol. Econ. 2026, 243, 108936. [Google Scholar] [CrossRef]
- Jiang, M.; Zhao, X.; Wang, R.; Yin, L.; Zhang, B. Assessment of Conservation Effectiveness of the Qinghai–Tibet Plateau Nature Reserves from a Human Footprint Perspective with Global Lessons. Land 2023, 12, 869. [Google Scholar] [CrossRef]
- Cao, Z.Y.; Shao, M.; Lu, Z.Y.; Dong, X.Y.; Ma, C.; Yao, P. Quantitative assessment of ecological conservation effectiveness and spillover effects of China’s first group of national parks. Biol. Conserv. 2025, 308, 111242. [Google Scholar] [CrossRef]
- Li, J.; Hu, G.Y.; Wang, F. Evaluating China’s National Park Pilots: Constructing an Indicator System for Performance Assessment. Land 2025, 14, 2077. [Google Scholar] [CrossRef]
- Hu, X.; Wang, Z.; Zhang, Y.; Gong, D.; Liu, L.; Li, K. Effectiveness of Conservation Measures Based on Assessment of Grazing Intensity in the Yellow River Source Region. Land 2025, 14, 813. [Google Scholar] [CrossRef]
- Han, Z.; Song, W.; Deng, X.Z.; Xu, X.L. Trade-Offs and Synergies in Ecosystem Service within the Three-Rivers Headwater Region, China. Water 2017, 9, 588. [Google Scholar] [CrossRef]
- Yao, T.; Bolch, T.; Chen, D.; Gao, J.; Immerzeel, W.; Piao, S.; Su, F.; Thompson, L.; Wada, Y.; Wang, L.; et al. The imbalance of the Asian water tower. Nat. Rev. Earth Environ. 2022, 3, 618–632. [Google Scholar] [CrossRef]
- Li, S.; Zhang, H.; Zhou, X.; Yu, H.; Li, W. Enhancing protected areas for biodiversity and ecosystem services in the Qinghai–Tibet Plateau. Ecosyst. Serv. 2020, 43, 101090. [Google Scholar] [CrossRef]
- Zong, L. The path to effective national park conservation and management: Hainan Tropical Rainforest National Park System Pilot Area. Int. J. Geoherit. Parks 2020, 8, 225–229. [Google Scholar] [CrossRef]
- Liu, X.Y.; Min, Q.W.; Jiao, W.J. Revealing Changes in the Management Capacity of the Three-River-Source National Park, China: An Application of the Best Practice-Based Evaluation Method. Land 2022, 11, 1565. [Google Scholar] [CrossRef]
- Zhao, C.; Su, S.; Gong, Z.; Lv, C.; Li, N.; Luo, Q.; Zhou, X.; Li, S. Effectiveness of protected areas in the Three-river Source Region of the Tibetan Plateau for biodiversity and ecosystem services. Ecol. Indic. 2023, 154, 110861. [Google Scholar] [CrossRef]
- Tan, L.; Guo, G.; Li, S. The Sanjiangyuan Nature Reserve Is Partially Effective in Mitigating Human Pressures. Land 2022, 11, 43. [Google Scholar] [CrossRef]
- Shao, Q.Q.; Cao, W.; Fan, J.W.; Huang, L.; Xu, X.L. Effects of an ecological conservation and restoration project in the Three-River Source Region, China. J. Geogr. Sci. 2017, 27, 183–204. [Google Scholar] [CrossRef]
- Liu, L.W.; Wang, C.; Li, S.K.; Zhang, X.H.; He, M.Z. Dynamic Changes and Driving Factors of the Quality of the Ecological Environment in Sanjiangyuan National Park. Remote Sens. 2025, 17, 3587. [Google Scholar] [CrossRef]
- Jiang, R.; Liu, J. Characterization and projection of spatial and temporal changes in habitat quality of Sanjiangyuan based on land use change. J. Geogr. Sci. 2024, 34, 1797–1821. [Google Scholar] [CrossRef]
- Shao, Q.; Liu, J.; Huang, L.; Fan, J.; Xu, X.; Wang, J. Integrated assessment on the effectiveness of ecological conservation in Sanjiangyuan National Nature Reserve. Geogr. Res. 2013, 32, 1645–1656. [Google Scholar]
- Gu, C.J.; Liu, L.S.; Zhang, Y.L.; Wei, B.; Cui, B.H.; Gong, D.Q. Understanding the spatial heterogeneity of grazing pressure in the Three-River-Source Region on the Tibetan Plateau. J. Geogr. Sci. 2023, 33, 1660–1680. [Google Scholar] [CrossRef]
- Ji, W.; Luo, Y.; Liao, Y.; Wu, W.; Wei, X.; Yang, Y.; He, X.Z.; Shen, Y.; Ma, Q.; Yi, S.; et al. UAV Assisted Livestock Distribution Monitoring and Quantification: A Low-Cost and High-Precision Solution. Animals 2023, 13, 3069. [Google Scholar] [CrossRef]
- Liu, S.; Shao, Q.; Yang, F.; Guo, X.; Wang, D.; Huang, H.; Wang, Y.; Liu, J.; Fan, J.; Li, Y. Using UAVs Remote Sensing for Population and Distribution of Grazing Livestock in the Source Region of the Yellow River. J. Geo-Inf. Sci. 2021, 23, 1286–1295. [Google Scholar]
- Mu, H.; Li, X.; Wen, Y.; Huang, J.; Du, P.; Su, W.; Miao, S.; Geng, M. A global record of annual terrestrial Human Footprint dataset from 2000 to 2018. Sci. Data 2022, 9, 176. [Google Scholar] [CrossRef]
- Tang, X. The establishment of national park system: A new milestone for the field of nature conservation in China. Int. J. Geoherit. Parks 2020, 8, 195–202. [Google Scholar] [CrossRef]
- Ling, W. Three-River-Source National Park System Pilot Area’s steps toward cohesive conservation and management. Int. J. Geoherit. Parks 2020, 8, 220–224. [Google Scholar] [CrossRef]
- Zhang, L.; Schlaepfer, D.R.; Chen, Z.; Liu, Z.; Liu, Z.; Gu, S.; Lauenroth, W.K. Assessing Water Source Stability in the Three River Source Region: A Comprehensive 35-Year Analysis. Earth’s Future 2025, 13, e2024EF005564. [Google Scholar] [CrossRef]
- Xiao, Z.; Ding, M.; Li, L.; Nie, Y.; Pan, J.; Li, R.; Liu, L.; Zhang, Y. Divergent changes of surface water and its climatic drivers in the headwater region of the Three Rivers on the Qinghai-Tibet Plateau. Ecol. Indic. 2024, 158, 111615. [Google Scholar] [CrossRef]
- Li, L.H.; Zhang, Y.L.; Liu, L.S.; Wu, J.S.; Li, S.C.; Zhang, H.Y.; Zhang, B.H.; Ding, M.J.; Wang, Z.F.; Paudel, B. Current challenges in distinguishing climatic and anthropogenic contributions to alpine grassland variation on the Tibetan Plateau. Ecol. Evol. 2018, 8, 5949–5963. [Google Scholar] [CrossRef]
- Zhang, T.; Wang, W.; Emmer, A.; Jin, G.; Liu, K.; An, B.; Yao, T. Ecohydrological and geomorphological importance of glacial lakes. Earth-Sci. Rev. 2026, 273, 105356. [Google Scholar] [CrossRef]
- Wu, T.; Lian, X.; Li, H.; Wang, D.; Chen, J.; Miao, Z.; Zhang, T. Adaptation of migratory Tibetan antelope to infrastructure development. Ecosyst. Health Sustain. 2021, 7, 1910077. [Google Scholar] [CrossRef]
- Wang, S.S.; Jia, L.Z.; Cai, L.P.; Wang, Y.J.; Zhan, T.Y.; Huang, A.Q.; Fan, D.L. Assessment of Grassland Degradation on the Tibetan Plateau Based on Multi-Source Data. Remote Sens. 2022, 14, 6011. [Google Scholar] [CrossRef]
- Li, X.; Zhou, Y.; Zhao, M.; Zhao, X. A harmonized global nighttime light dataset 1992–2018. Sci. Data 2020, 7, 168. [Google Scholar] [CrossRef]
- Gong, P.; Li, X.; Wang, J.; Bai, Y.; Chen, B.; Hu, T.; Liu, X.; Xu, B.; Yang, J.; Zhang, W.; et al. Annual maps of global artificial impervious area (GAIA) between 1985 and 2018. Remote Sens. Environ. 2020, 236, 111510. [Google Scholar] [CrossRef]
- Venter, O.; Sanderson, E.W.; Magrach, A.; Allan, J.R.; Beher, J.; Jones, K.R.; Possingham, H.P.; Laurance, W.F.; Wood, P.; Fekete, B.M.; et al. Sixteen years of change in the global terrestrial human footprint and implications for biodiversity conservation. Nat. Commun. 2016, 7, 12558. [Google Scholar] [CrossRef] [PubMed]
- Venter, O.; Sanderson, E.W.; Magrach, A.; Allan, J.R.; Beher, J.; Jones, K.R.; Possingham, H.P.; Laurance, W.F.; Wood, P.; Fekete, B.M.; et al. Global terrestrial Human Footprint maps for 1993 and 2009. Sci. Data 2016, 3, 160067. [Google Scholar] [CrossRef]
- Zhou, J.; Niu, J.; Wu, N.; Lu, T. Annual high-resolution grazing-intensity maps on the Qinghai–Tibet Plateau from 1990 to 2020. Earth Syst. Sci. Data 2024, 16, 5171–5189. [Google Scholar] [CrossRef]
- Che, M.L.; Nian, Y.Y.; Wang, C.Y.; Zhang, W.H.; Chen, J.; Liao, B.Z.; Pei, T. Multi-time scale analysis of human activity patterns on the Qinghai-Tibet Plateau using location request data. Int. J. Digit. Earth 2025, 18, 2543570. [Google Scholar] [CrossRef]
- Gao, H.; Jiang, F.; Chi, X.; Li, G.; Cai, Z.; Qin, W.; Zhang, J.; Wu, T.; Zhang, T. The carrying pressure of livestock is higher than that of large wild herbivores in Yellow River source area, China. Ecol. Model. 2020, 431, 109163. [Google Scholar] [CrossRef]
- Yang, J.; Huang, X. The 30 m annual land cover dataset and its dynamics in China from 1990 to 2019. Earth Syst. Sci. Data 2021, 13, 3907–3925. [Google Scholar] [CrossRef]
- Wang, S.; Fan, J.; Wang, M.; Tang, R.; Jiang, N.-J. Relative contributions of climate and grazing to forage supply in the Yellow River source area. J. Environ. Manag. 2025, 374, 124141. [Google Scholar] [CrossRef]
- Theobald, D.M.; Oakleaf, J.R.; Moncrieff, G.; Voigt, M.; Kiesecker, J.; Kennedy, C.M. Global extent and change in human modification of terrestrial ecosystems from 1990 to 2022. Sci. Data 2025, 12, 606. [Google Scholar] [CrossRef] [PubMed]
- Rubin, D.B. Using Propensity Scores to Help Design Observational Studies: Application to the Tobacco Litigation. Health Serv. Outcomes Res. Methodol. 2001, 2, 169–188. [Google Scholar] [CrossRef]
- Wu, H.; Fang, S.; Yang, Y.; Cheng, J. Changes in habitat quality of nature reserves in depopulating areas due to anthropogenic pressure: Evidence from Northeast China, 2000–2018. Ecol. Indic. 2022, 138, 108844. [Google Scholar] [CrossRef]
- Kurz, C.F.; Krzywinski, M.; Altman, N. Propensity score matching. Nat. Methods 2024, 21, 1770–1772. [Google Scholar] [CrossRef]
- Allan, J.R.; Venter, O.; Maxwell, S.; Bertzky, B.; Jones, K.; Shi, Y.; Watson, J.E.M. Recent increases in human pressure and forest loss threaten many Natural World Heritage Sites. Biol. Conserv. 2017, 206, 47–55. [Google Scholar] [CrossRef]
- Di Marco, M.; Venter, O.; Possingham, H.P.; Watson, J.E.M. Changes in human footprint drive changes in species extinction risk. Nat. Commun. 2018, 9, 4621. [Google Scholar] [CrossRef] [PubMed]
- Sofi, I.I.; Shah, M.A.; Ganie, A.H. Integrating human footprint with ensemble modelling identifies priority habitats for conservation: A case study in the distributional range of Arnebia euchroma, a vulnerable species. Environ. Monit. Assess. 2023, 195, 914. [Google Scholar] [CrossRef]
- Allan, J.R.; Venter, O.; Watson, J.E.M. Temporally inter-comparable maps of terrestrial wilderness and the Last of the Wild. Sci. Data 2017, 4, 170187. [Google Scholar] [CrossRef] [PubMed]
- Ramankutty, N.; Evan, A.T.; Monfreda, C.; Foley, J.A. Farming the planet: 1. Geographic distribution of global agricultural lands in the year 2000. Glob. Biogeochem. Cycle 2008, 22, GB1003. [Google Scholar] [CrossRef]
- Mehrabi, Z.; Tong, K.; Fortin, J.; Stanimirova, R.; Friedl, M.; Ramankutty, N. Global agricultural lands in the year 2015. Earth Syst. Sci. Data 2025, 17, 3473–3496. [Google Scholar] [CrossRef]


Disclaimer/Publisher’s Note: The statements, opinions and data contained in all publications are solely those of the individual author(s) and contributor(s) and not of MDPI and/or the editor(s). MDPI and/or the editor(s) disclaim responsibility for any injury to people or property resulting from any ideas, methods, instructions or products referred to in the content. |
© 2026 by the authors. Licensee MDPI, Basel, Switzerland. This article is an open access article distributed under the terms and conditions of the Creative Commons Attribution (CC BY) license.