Article

Screening Native Herbaceous Species for Rain Garden Applications Under Different Submersion Regimes

1
Department of Civil and Environmental Engineering, University of Perugia, Borgo XX Giugno 74, 06121 Perugia, Italy
2
Department of Medicine and Surgery, University of Perugia, Piazza L. Severi 1, 06132 Perugia, Italy
*
Author to whom correspondence should be addressed.
Land 2026, 15(3), 476; https://doi.org/10.3390/land15030476
Submission received: 5 February 2026 / Revised: 9 March 2026 / Accepted: 13 March 2026 / Published: 16 March 2026

Abstract

Rain gardens are increasingly implemented as Nature-Based Solutions for stormwater management, where vegetation must tolerate alternating wet and dry conditions driven by design-related drainage times. Despite the central role of plants, experimentally based guidance on species selection, particularly for locally adapted herbaceous taxa, remains limited. This study presents a controlled experimental screening of 13 native Italian herbaceous species to evaluate their response to two different submersion regimes. Plants were subjected to repeated short (1-day) and longer (3-day) submersion cycles and compared with a non-flooded control. Species performance was assessed through an integrated framework combining survival, growth responses, biomass allocation and visual condition. All species survived across treatments, indicating a general tolerance to transient waterlogging. However, interspecific differences emerged when multiple response variables were jointly considered. Several species not typically associated with prolonged inundation maintained high performance under longer submersion regimes, while some taxa from drier environments also showed resilience to waterlogging. The results highlight that tolerance to submersion cannot be inferred solely from habitat moisture affinity and that submersion duration represents a key design variable for rain garden design. This study provides a pragmatic, low-cost screening approach to support context-specific plant selection in temperate urban environments.

1. Introduction

Urbanization and soil sealing are widely recognized as major drivers of altered hydrological regimes in urban environments, leading to increased surface runoff, reduced infiltration, and heightened flood risk [1,2]. These effects are further exacerbated by climate change [3], which is intensifying the frequency and magnitude of short-duration, high-intensity rainfall events in many regions [4,5]. In this context, Nature-Based Solutions (NBS), and in particular Green Stormwater Infrastructures (GSI), have gained increasing attention as effective strategies for mitigating stormwater-related impacts by restoring more natural hydrological processes within the built environment [6,7,8,9].
Among GSI, rain gardens (RGs) are multifunctional devices that provide multiple ecosystem services simultaneously [10,11]. In addition to stormwater quantity control through temporary storage and infiltration, RGs contribute to improving water quality via filtration and biological uptake, enhancing urban biodiversity, and providing aesthetic and social benefits [12,13,14]. The overall performance and long-term functionality of RGs, however, strongly depend on vegetation, which plays a central role in regulating hydrological processes, supporting microbial activity, and ensuring system resilience over time [15,16,17,18].
In Italy, sustainable stormwater management is increasingly advocated as a key adaptation measure to climate change impacts in urban environments [19,20]. Several pilot RGs projects have been implemented across the peninsula [19], while the main ongoing implementation of SuDS, including RGs, is the Milan Sponge City Project [21]. Additional initiatives include a LIFE project focused on sustainable stormwater management in peri-urban contexts [22]. Experimental RGs have also been established for research purposes, notably in Padova in 2011, where both hydrological performance and plant adaptability were investigated under local conditions [23,24,25].
Plant selection is a critical design component, as rain garden species must tolerate pronounced hydrological variability, typically alternating between short-term submersion following rainfall events and dry phases during inter-event periods [17,18,26,27]. Despite this central role, the criteria underlying plant selection—particularly for herbaceous species—are often unclear or poorly documented [27,28]. Moreover, much of the existing guidance on RG vegetation is based on North American or Northern European species pools and is largely derived from technical manuals rather than experimental studies [15,16]. This limitation is increasingly relevant under current and projected climate change scenarios, which are expected to increase climatic variability and expand the geographical extent of Mediterranean-type conditions [26,29].
In the scientific literature, vegetation in SuDS is frequently addressed from a general perspective, focusing on the influence of plant functional traits or morphological characteristics on hydrological performance [15,30], or on simplified responses of individual species [2]. While these approaches provide valuable conceptual insights, they offer limited support for selecting locally adapted taxa, largely due to the scarcity of both qualitative and quantitative data on species-specific morphology and physiological responses to stress. Public databases can partially support species characterization [31,32], but they are predominantly focused on North American taxa, limiting their applicability in other biogeographical contexts. Although theoretical frameworks and design-oriented guidance are available, including for less-explored arid or semi-arid contexts [33,34], experimentally derived, region-specific evidence remains limited.
Rain gardens are typically designed to drain within 24 h, with a maximum saturated period of up to 72 h [18,35] or 96 h [27,36,37], although most technical references indicate a target dewatering time of approximately one day [27]. These drainage dynamics generate distinct moisture gradients within RGs, both vertically and horizontally, resulting in three main functional zones: a frequently saturated bottom, moderately moist side slopes subjected to occasional flooding, and relatively dry upper margins [38]. The alternation of flooding and drying cycles makes RGs functionally analogous to transitional zones between terrestrial and wetland ecosystems, while remaining strongly influenced by engineered substrate properties and design choices [27].
Despite the practical relevance of these design assumptions, experimentally based quantitative indications on species tolerance to different submersion durations remain scarce [27,32]. With the notable exception of Yuan and Dunnett [27,39], who derived their experimental approach from the “pot-in-pot” method proposed by Dylewski et al. [28], few studies have explicitly tested plant responses to controlled cyclic flooding. Yuan and Dunnett [27,39] evaluated 15 perennial herbaceous species under simulated 1-day and 4-day flooding cycles, while Dylewski et al. [28] focused on three shrub species with 3-day and 7-day flooding cycles. The same pot-in-pot method was used to test other shrub species by Ref. [40], while more recently, Ref. [18] applied it to evaluate the growth response of two respectively drought- and flood-tolerant herbaceous species to the combined stressors. Eben et al. [41] evaluated, in a container-based, long-term experiment, the effects of multiple stressors (flooding, drought, and salt presence) on a broad range of German-native herbaceous species for infiltration swales. In Ref. [35], a further stressor besides salt presence, freezing, was combined with drought–flooding cycles. A selection of wetland species was also tested for cyclic flooding by Ref. [42], while a selection of sedges with different wetland distributions was tested for different flooding durations and drought intensities by Ref. [43]. Further studies on combined stressors and cyclic flooding include tests on herbaceous species under cold-climate roadside conditions [44,45] and long-term field evaluations in experimental RGs, such as those conducted in Italy by Bortolini and Zanin [23], where eleven mostly non-native species were monitored under real precipitation patterns.
Within this context, the present study focuses on submersion and consequent waterlogging as a key environmental stress typical of RGs. It does not aim to provide a definitive assessment of long-term field performance or interspecific interactions. Instead, it proposes a controlled experimental screening of 13 native Italian herbaceous species, comparing their responses to repeated one-day and three-day submersion cycles, in alternation with a four-day drying-out period. The experimental protocol is derived from the approach developed by Yuan and Dunnett [27,39], simplified here to test the feasibility of a low-budget, pragmatic, and rapidly deployable screening method. By integrating survival, growth, biomass allocation, and visual quality into a composite scoring framework, the study enables direct comparison among species with contrasting ecological backgrounds.
The specific objectives of this study are to: (i) test native Italian species already reported in the literature and explore the potential extension of suitable taxa through taxonomic or ecological affinity with previously recommended species; (ii) provide quantitative indications of tolerated submersion durations relevant to RG design; and (iii) evaluate the effectiveness and replicability of a simplified screening approach to support context-specific plant selection, applicable both in academic research and in operational contexts such as plant nurseries and public agencies.

2. Materials and Methods

2.1. Tested Species

The selection of species to be tested was based on an extensive review of both the scientific and gray literature, with the aim of identifying a representative pool of native herbaceous taxa potentially suitable for rain garden (RG) applications. Scientific sources primarily included peer-reviewed articles, with particular emphasis on review papers synthesizing existing experimental and applied evidence [2,26,33,46]. The gray literature comprised RG design guidelines [13,37,38] and Stormwater Management Manuals [8,47,48,49,50,51,52,53,54], which were consulted to capture practitioner-based knowledge and commonly adopted plant selection criteria. The list of the broader pull of species cultivated for the experiment is reported in Table S2 (Supplementary Material S1).
Species were selected based on their occurrence within the Italian territory and their documented use or mention in RG-related literature. Where direct references to Italian native species were lacking, an analogical selection approach was adopted, considering species belonging to the same genus or family and sharing comparable functional and ecological traits. Examples include Achillea millefolium [47,48,52,54,55,56], Eupatorium cannabinum and Lychnis flos-cuculi [38], Geum rivale [30], Inula ensifolia and Sanguisorba officinalis [2,57], Viscaria vulgaris [58], the genus Melica [54], and the genus Epilobium [59]. Seed commercial availability also influenced the final selection, reflecting a pragmatic constraint commonly encountered in applied plant screening studies.
Not all sown species successfully germinated or completed the cultivation phase; a total of 19 taxa were initially considered suitable for experimental testing. Owing to space limitations, the number of species included in the experiment was subsequently reduced to 13. These species, listed in Table 1, were selected to retain the widest possible diversity in terms of ecological strategies and habitat affinities within the constraints of the experimental setup. Tables S3 and S4 ( Supplementary Material S2), respectively, document the presence of each taxon in the reviewed literature and the selection process (Table S3), as well as the main ecological characteristics of the selected species (Table S4).
Most of the major botanical families commonly represented in RG applications are included in the selected species pool. In particular, Asteraceae and Poaceae are the most frequently cited families in the reviewed literature, while Rosaceae, Plantaginaceae, and Onagraceae are also represented by several taxa across the analyzed references. The 13 species included in the experiment were selected to ensure a balanced representation of taxa originating from dry to mesic, variable, and moist to wet environments. The moisture gradient reported in Table 1 was derived from Ellenberg indicator values for soil moisture [60,61], combined with information on species’ preferred habitats and substrates as reported in floristic and ecological sources [62,63,64]; both data sources are detailed in Table S4 (Supplementary Material S2).
In line with their intended use, Ellenberg values were employed as relative indicators of species’ ecological positioning along moisture gradients rather than as direct descriptors of physiological requirements. The values were considered during the preliminary species selection to ensure that the tested species covered a gradient of ecological affinity for soil moisture, ranging from taxa typically associated with relatively drier conditions to species characteristic of wetter habitats. This approach allowed the experiment to include plants with different ecological strategies in relation to water availability. Ellenberg values were not used as predictive variables in the statistical analyses but were considered descriptively in the Discussion section to support the ecological interpretation of the observed responses.
The inclusion of species from comparatively dry environments was motivated by their potential tolerance to strong moisture fluctuations, particularly drought phases, which may occur in typical fast-draining rain garden substrates, consistently with Ref. [41]. For instance, Inula ensifolia L. naturally occurs in arid streambeds that may nonetheless experience episodic inundation [62,63], suggesting ecological strategies potentially compatible with alternating wet and dry conditions. Species selection also accounted for geographical distribution across the Italian peninsula and across multiple altitudinal ranges, as documented in floristic references [63,64]. Some grassland species with limited documented use in RG applications, such as Brachypodium pinnatum, were intentionally included to represent taxa with low expected tolerance to prolonged saturation, thereby testing the discriminatory power of the screening approach.
The main ecological parameters of the selected taxa are summarized in Table S4, including Ellenberg indicator values for light, temperature, moisture, soil reaction, nutrient availability, and salinity, together with information on typical habitats and substrates. These ecological differences provide a contextual framework for interpreting species-specific responses to the applied flooding treatments and may support future screening and selection of additional local taxa for RG applications. Ellenberg indicator values for moisture were obtained from the available literature for each species.

2.2. Plant Cultivation

Before the experimental treatments, all species were cultivated under controlled conditions in individual containers using a fast-draining substrate representative of bioretention media. Plants were grown under uniform environmental conditions to minimize cultivation-related variability and were allowed an acclimation period before the start of the flooding treatments. Saturated hydraulic conductivity (Ks) was prioritized for the final substrate selection, as it directly reflects drainage capacity and aeration conditions relevant to cyclic flooding experiments and, for this reason, was experimentally tested (see Supplementary Material S1). Among the candidate substrate mixtures, all characterized by a predominantly sandy composition, the final selection fell on the mixture that showed a Ks value (47 mm h−1) comparable to that reported in the reference cyclic flooding experiment by Yuan and Dunnett (57 mm h−1) [27], supporting its suitability for reproducing similar hydrological conditions. Full details on substrate composition, cultivation procedures, and maintenance practices are provided in Supplementary Material S1.

2.3. Experimental Phase

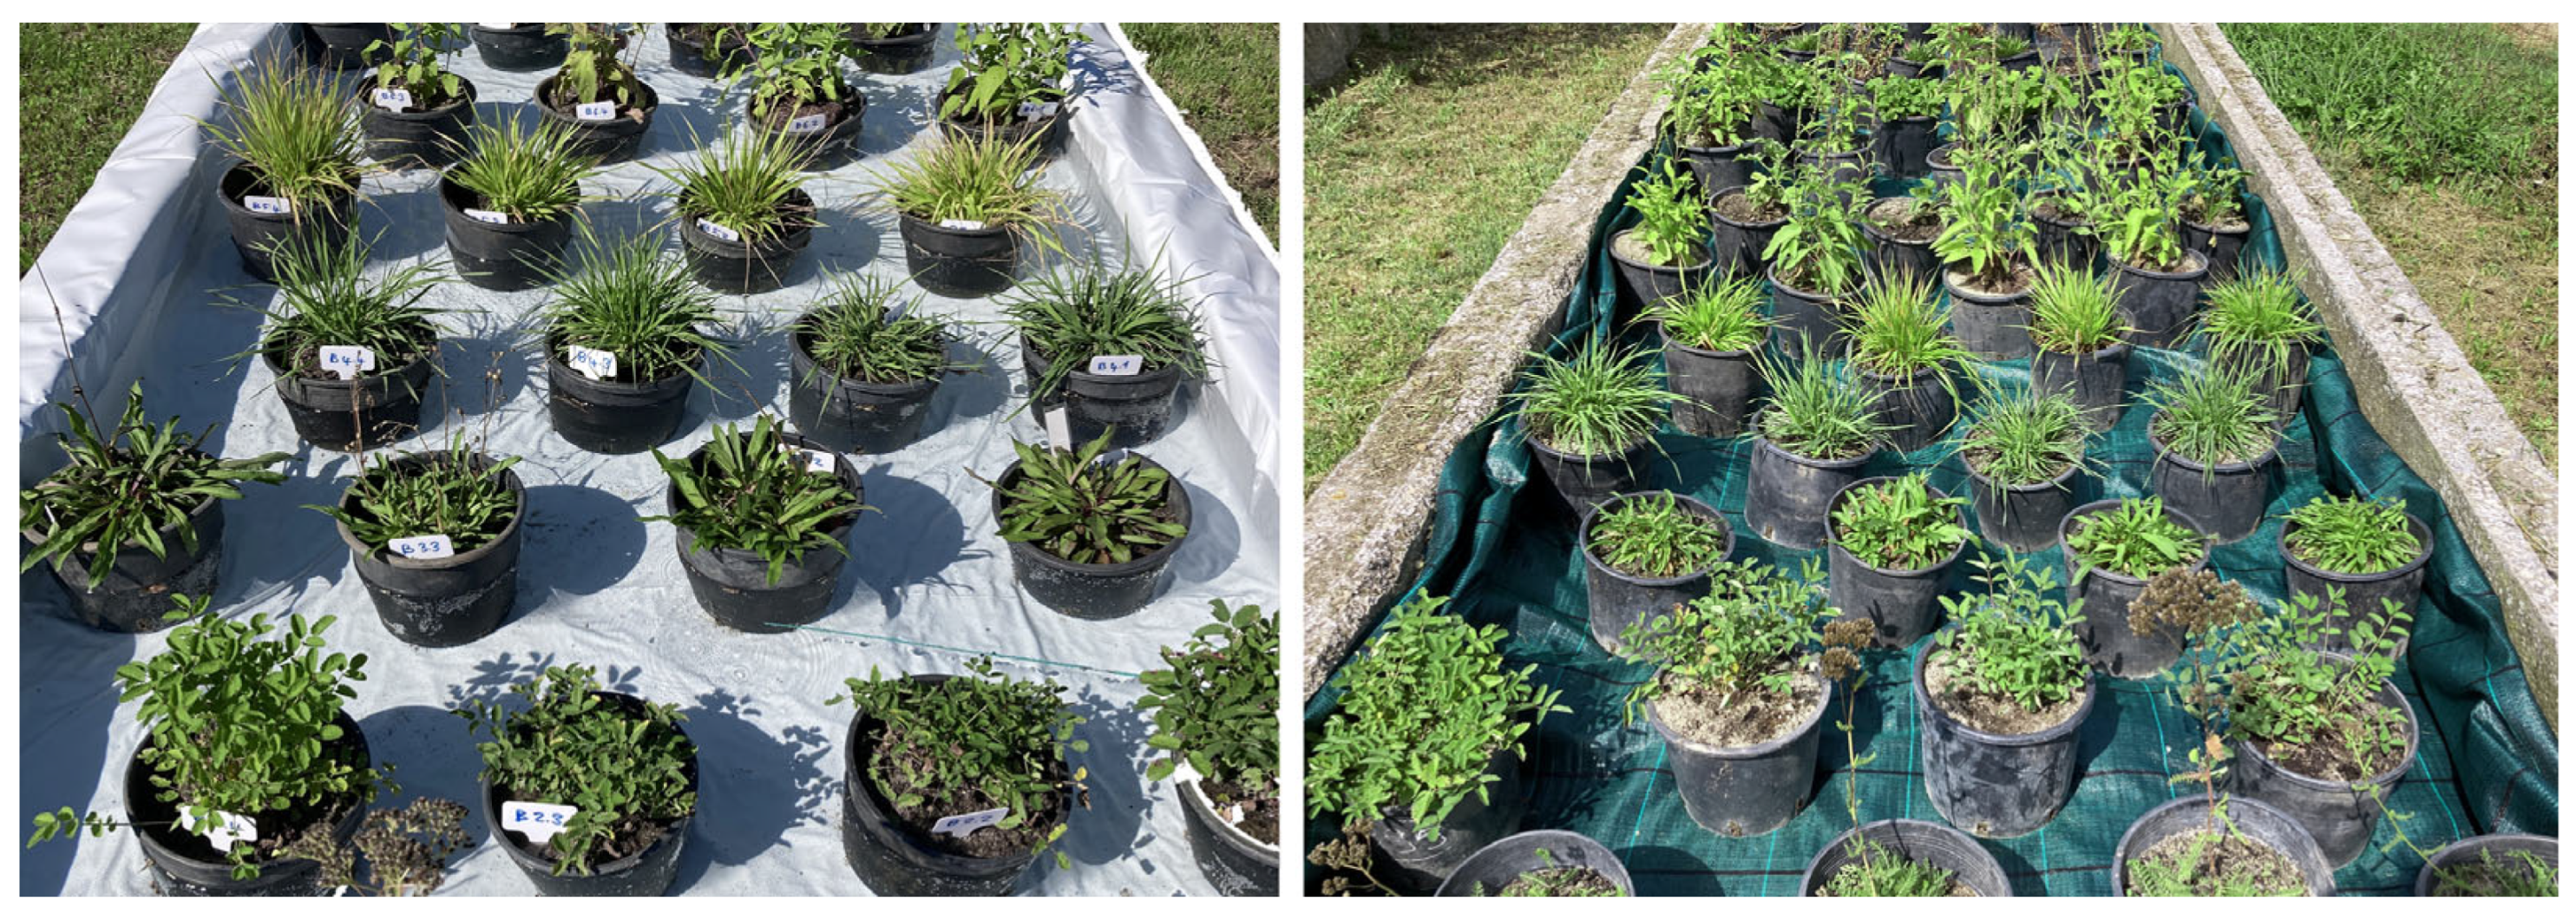
The present experiment largely followed the experimental design adopted by Yuan and Dunnett [27]. In particular, it maintained the same overall duration (32 days), the pot-in-pot setup, the comparison between two short-flooding treatments and a control, and the alternation of flooding phases with four-day drying periods. The main differences consisted of a slight reduction in the duration of the longer flooding treatment (3 days instead of 4) and a reduction in the number of individuals per treatment per species (four instead of five), due to operational constraints that occurred during the development of the experiment. A comparable number of species was tested (13 species compared to the 15 species included in the original Yuan and Dunnett study). The experimental period was shifted from late spring to late summer–early autumn, mainly as a consequence of the plant cultivation phase preceding the experimental trial. Furthermore, the experiment was not conducted in a greenhouse but outdoors (Figure 1).
The experiment took place at the Centro Appenninico del Terminillo “Carlo Jucci” (42°25′13.81″ N, 12°48′41.47″ E) from 1 September to 2 October 2025. The late summer–early autumn timing corresponds to a transitional phenological phase for many herbaceous species, when vegetative growth may slow, and early senescence processes begin. Although this seasonal window may differ from typical spring establishment conditions, it is ecologically relevant in Mediterranean and temperate climates, where intense rainfall events frequently occur in late summer and autumn. During the study period, average maximum, minimum, and mean air temperatures were 25.9 °C, 11.5 °C, and 18.7 °C, respectively, with a total of 597.9 growing degree days (GDD).
For each of the 13 species, three experimental groups were established: one control and two flooding treatments. Each group consisted of four plants, resulting in a total of 12 individuals per species. Plants were selected to ensure uniformity in both vegetative development and root system size. The experiment was conducted outdoors, with each experimental group placed in a basin approximately 20 cm deep and measuring 1.5 × 4.5 m. Within each basin, plants were evenly spaced to ensure full light exposure and sufficient space for growth. Pots within each basin were arranged on a predefined grid with even spacing (Figure 2). Initial pot positions were randomly assigned within the grid, and pots were subsequently re-randomized on a weekly basis throughout the experimental period to reduce potential positional or edge effects (e.g., light gradients, temperature variation).
The first group, serving as the control (C), was maintained under mesic conditions through calibrated irrigation. The control group was kept in a fixed basin throughout the experiment, and irrigation schedules were adjusted in response to precipitation events. The second group (1_D) was subjected to repeated one-day submersion cycles, each followed by four days of drying without irrigation; a total of seven cycles were completed over the one-month experimental period. The third group (3_D) underwent repeated three-day submersion cycles, each followed by four days of drying without irrigation, for a total of four cycles over the same period.
During the submersion phases of the 1_D and 3_D treatments, plants were placed in impermeable basins, with water levels maintained at the substrate surface through periodic water additions. Water was replaced weekly. Identical empty basins positioned adjacent to the flooded basins were used to hold the plants during the intermediate drying phases. Flooding treatments, therefore, were applied at the basin level, with one basin assigned to each treatment. Consequently, pots within the same basin shared the same water column and were considered sub-samples of the basin-level treatment rather than fully independent experimental units for water-mediated effects. Basins were standardized in size, material, waterproof lining, exposure, water source, and water level, and were located within a few meters of each other to minimize environmental heterogeneity.
Only two precipitation events occurred during the experimental period. The first took place while both the 1_D and 3_D groups were submerged. The second occurred during a drying phase of the 1_D treatment; in this case, plants were temporarily moved to a covered area to prevent unintended water inputs.

2.4. Evaluations, Measurements, Statistics, and Scoring

Plant performance under the different treatments was evaluated using a multi-criteria approach combining survival, quantitative growth responses, biomass allocation, and qualitative visual condition. This integrated framework was adopted to capture complementary aspects of plant response to cyclic flooding, recognizing that single metrics may be insufficient to discriminate species performance under short-term screening conditions. The choice of survival, growth, and biomass assessment, and the equal weighting of these parameters, was derived from the reference experiment of Yuan and Dunnett [27].
At the end of the experimental period, survival was assessed for each treatment group, considering both aboveground tissues and root systems. Based on the percentage of surviving individuals, a score ranging from 1 to 5 was assigned to each treatment for each species (Table S5, Supplementary Material S3), following a scoring system adapted from Ref. [27]. Survival scoring was used as an initial filter to identify treatments inducing severe stress or mortality.
Subsequently, plant responses to the three treatments were evaluated using quantitative growth and dimensional parameters (Section 2.4.1), together with a semi-quantitative visual assessment of plant condition and aesthetic quality (Section 2.4.2). The evaluations were based on ANCOVA and ANOVA tests and post hoc Tukey Tests, executed through the R language based, open-source software Jamovi (Version 2.6) [65] as detailed in the following sections. Because treatments were applied at the basin level, individual pots were treated as observational units within a controlled screening framework. Statistical analyses therefore aim to estimate treatment-related differences among plants while acknowledging that basin-level effects cannot be fully separated from treatment effects.
The complementary evaluations were then integrated into a composite scoring framework (Section 2.4.3), intended as a support tool for the comparative interpretation among species and treatments.

2.4.1. Growth Assessment

Dimensional data. Plant height (H) and canopy spread (SPD) were measured at the beginning and at the end of the experiment to quantify growth responses over the one-month observation period. Canopy spread was calculated as the mean of the major and minor horizontal diameters, while plant height was measured as the distance from the plant base to the tip of the highest leaf.
Biomass data. Aboveground and belowground biomass were quantified through destructive sampling at the end of the experiment. Aboveground biomass was harvested at the crown level, weighed fresh to obtain shoot fresh weight (SFW), and subsequently oven-dried to constant weight to determine shoot dry weight (SDW). Belowground biomass was obtained by manually separating roots (and rhizomes, where present) from the substrate, followed by careful washing. Root dry weight (RDW) was measured after oven drying. In species characterized by very fine or fragile root systems, some loss of material during separation may have occurred despite careful handling. Root dry mass was harvested at slightly different times among treatments due to substantial differences in substrate moisture conditions. Control pots were harvested one week after the experimental period, whereas flooded treatments were harvested one week later. This staggered harvest was necessary to avoid differential root–substrate detachment and the potential loss of fine roots in wetter substrates.
Statistical analysis. Plant dimensional growth variables (spread and height) were analyzed using analysis of covariance (ANCOVA), with final measurements as dependent variables, treatment as a fixed factor, and the corresponding initial measurements as covariates to account for baseline differences among plants. Aboveground fresh weight (SFW), shoot dry weight (SDW), and root dry weight (RDW) were analyzed using one-way analysis of variance (ANOVA) with treatment as a fixed factor. All analyses were conducted separately for each species. In the case of RDW, because harvest timing coincided with treatment groups, time-to-harvest could not be statistically separated from treatment effects. RDW analyses therefore compare treatments while acknowledging the potential temporal confounding associated with asynchronous harvest.
Pairwise comparisons among treatments were estimated using Tukey-adjusted contrasts, which were calculated for all treatment pairs to obtain adjusted mean differences and their associated confidence intervals. These contrasts were used both to interpret treatment responses and to derive the magnitude-based screening score.
Before statistical analyses, model assumptions were evaluated. Normality of residuals was assessed using the Shapiro–Wilk test, and homogeneity of variances among treatments was tested using Levene’s test. To account for multiple testing across species, p-values for treatment effects were adjusted using the Benjamini–Hochberg false discovery rate (FDR) procedure, and the resulting q-values are reported.
Given the small sample size (n 4 individuals per treatment), a sensitivity power analysis was conducted to evaluate the detectable effect size. The analysis indicated that the experimental design had approximately 80% power to detect medium-to-large effects (Cohen’s f ≥ 0.40) at α = 0.05. Therefore, non-significant results should be interpreted cautiously. Acknowledging the limited statistical power of the design, treatment responses were interpreted primarily through effect sizes, confidence intervals, and a proposed magnitude-based screening score rather than relying solely on p-value thresholds, as described in the following section.
Magnitude-based screening score. To provide a practical synthesis of treatment responses across species, a 7-point screening score (as in Ref. [27]) was developed based on the magnitude of treatment–control differences and their associated uncertainty, as reported in Table S6 (Supplementary Material S3). The score was calculated from the percentage change between treatment and control (Δ%) and the corresponding 95% confidence intervals. Δ% was calculated from model-adjusted treatment contrasts (estimated marginal means) obtained from ANCOVA (for growth variables) or ANOVA (for biomass variables). Scores ranged from 1 to 7, where 4 indicates negligible differences from the control, values above 4 indicate increasing positive responses to the treatment, and values below 4 indicate negative responses. Thresholds for small (5–10%), moderate (10–25%), and large (>25%) effects were defined using percentage change ranges, and extreme scores (1–2 or 6–7) were assigned only when the confidence interval did not include zero, indicating a consistent directional effect.
The proposed magnitude-based scoring system was intended as a complementary screening tool summarizing treatment performance across species and does not rely on dichotomous p-value thresholds. Nevertheless, full statistical results, including p-values and Benjamini–Hochberg adjusted q-values, are reported to ensure transparency, allow formal statistical inference, and enhance comparability with other experiments. The scoring approach therefore complements, rather than replaces, statistical testing by emphasizing effect magnitude and uncertainty, which might be more directly relevant for ecological interpretation and practical species screening.

2.4.2. Semi-Quantitative Visual Scoring

In addition to quantitative measurements, plant condition was evaluated through a semi-quantitative visual assessment conducted at the beginning and at the end of the experiment. This rapid assessment aimed to capture visible stress symptoms and overall visual quality, which are relevant both for plant health and for potential aesthetic performance in rain garden applications. Three groups of characteristics were considered: (A) general stress symptoms and/or nutrient deficiencies; (B) presence of dead or damaged tissues; and (C) vegetation vigor and density. Each category was scored on a scale from 1 to 6 according to predefined criteria (Table S7, Supplementary Material S3), resulting in a maximum possible score of 18 points per individual.
The selection of traits considered for the visual assessment was derived from the reference literature on plant responses to cyclic flooding. In particular, Ref. [43] based their visual damage rating on the percentage of vegetation dieback, while Ref. [23] developed an overall aesthetic evaluation considering the extent of tissue desiccation and wilting. Ref. [45] proposed a vitality scoring system that refers both to plant development and to the presence and severity of dead tissues, leaf damage, necrosis, and chlorosis. In the present study, these symptoms were evaluated separately rather than through a single overall score. This approach was adopted to facilitate further interpretations of species-specific responses by considering multiple aspects of plant condition, including symptoms potentially related to waterlogging stress as well as those associated with the specific experimental cultivation conditions.
Visual assessments were conducted independently by two trained operators. During scoring, plants were identified using neutral labels that did not indicate treatment identity, and pots were presented to raters in randomized order to minimize potential observer bias. After independent scoring, a structured consensus procedure was then applied. By default, the final score corresponded to the arithmetic mean of the two independent ratings, rounded to the nearest predefined score category (integer or 0.5 increment). However, if one evaluator considered that averaging did not adequately represent the observed plant condition, based on notes recorded during the assessment, the case was reviewed. When these notes were insufficient to resolve the discrepancy, the plant was re-examined jointly by both operators, and a final consensus score was assigned.
After the three visual categories (A, B, and C) were scored to capture complementary aspects of plant condition (i.e., vegetative vigor, presence of dead or altered tissues), the primary visual index was defined as the cumulative score (A + B + C), integrating these dimensions into a single composite indicator of plant performance. Inter-rater reliability was quantified using a two-way random-effects intraclass correlation coefficient (ICC(2,k)), which indicated good agreement between evaluators (ICC = 0.82; 95% CI: 0.75–0.86).
Statistical analysis and scoring. Statistical analyses were performed on the final cumulative score using ANCOVA models with the corresponding baseline score as a covariate, while the change in cumulative score (Δ(A + B + C)) was used as a descriptive indicator of treatment response (the cumulative Δ and the single A, B, and C Δ are reported in Table S12, Supplementary Material S4). The same magnitude-based scoring system applied to growth and biomass parameters was adopted. In this case, though, the absolute value of the final visual score was also considered to identify marked weaknesses or consistently poor performance, and a corrective adjustment was applied as detailed in Table S8 (Supplementary Material S3).

2.4.3. Composite Performance Index

The composite performance index was constructed by summing survival, growth, biomass, and visual condition scores. Equal weighting was applied, as in Ref. [27], to reflect the complementary nature of these indicators: dimensional growth (height and spread) and biomass accumulation describe different aspects of plant performance, while root biomass is particularly relevant under flooding due to root exposure to hypoxic stress. Therefore, for each species and treatment, the composite performance score was calculated by summing the points assigned to the six parameters: (I) survival rate (1–5 points; Table S5); (II) canopy spread growth; (III) height growth; (IV) mean aboveground biomass (SFW and SDW); (V) belowground biomass (RDW; 1–7 points for parameters II–V; Table S6); and (VI) qualitative visual assessment (0–10 points; Tables S7 and S8). The resulting total score ranged from 5 to 43 points per treatment.
The threshold for acceptable performance under 1-day or 3-day submersion was set at 27 points. This threshold represents a theoretical midpoint scenario in which all plants survive and show no substantial growth or biomass reduction relative to controls (score = 4 for growth-related parameters), while visual condition, besides being not affected by the treatment (score = 4), also indicates good plant vigor and limited tissue damage (+2 points).
To evaluate the robustness of the composite performance index, a sensitivity analysis was conducted by recalculating species scores under alternative weighting schemes. Two additional scenarios were tested: (i) reduced weight of the visual condition score (0.5×), and (ii) increased weight of biomass parameters (1.5×). Species rankings obtained under these alternative schemes were compared with the original ranking.

3. Results

All plants in all treatment groups survived the experimental period. Accordingly, the maximum survival score (5 points) was assigned to all species under all treatments.

3.1. Growth Parameters

Average dimensional growth parameters (SPD, H) and biomass values (SFW, SDW, and RDW) for each species and treatment, together with the results of ANCOVA and ANOVA tests and post hoc tests, are reported in Tables S9–S11 (Supplementary Material S4). Based on these data, a score ranging from 1 to 7 was assigned to each submersion treatment for each of the four growth-related parameters, following the procedure described in Section 2.4 (magnitude-based screening score).
Overall, growth responses differed markedly among species and between the two submersion regimes, highlighting contrasting sensitivities to short (1_D) and prolonged (3_D) flooding cycles. While several species exhibited enhanced aboveground growth under at least one submersion treatment, others showed reduced growth or biomass accumulation relative to the control, indicating heterogeneous responses across functional groups.

3.1.1. Aboveground Responses

Treatment effects on plant growth parameters, height, and spread varied among species. ANCOVA analyses revealed significant treatment effects on spread for Lychnis and Briza (Table 2). In both species, the 1_D treatment increased spread relative to controls (+13.4% and +10.1%, respectively). A similar positive response was observed in Geum, where spread increased by approximately 17% under both treatments, and Sanguisorba, although statistical support weakened after correction for multiple testing. Moderate increases in plant height were also observed in Achillea (+13.0% under 1_D), although these effects were not significant after adjustment for multiple testing. For most other species, treatment effects on both spread and height were small and statistically unsupported after correction, with percentage differences generally below ±10%.
The magnitude-based screening score summarizing treatment–control differences (Δ%) and their associated uncertainty (95% CI) broadly confirmed the patterns identified by the ANCOVA analyses. High scores (6) were assigned to treatments producing consistent positive growth responses, notably for spread in Lychnis, Briza, Sanguisorba, and Geum. Most other species received neutral scores (4), indicating negligible or uncertain differences from the control.
Slight negative responses were detected in a limited number of cases. These included reductions in plant height for Achillea under the 3_D treatment (−14.1%) and Briza under 3_D (−7.9%), as well as decreases in spread for Veronica (−5.0%), Viscaria (−7.0%), and Melica (−6.1% and −5.4%). In Viscaria, small reductions were also observed in plant height under both treatments (−6.2% and −5.5%). However, these effects were generally modest and associated with confidence intervals overlapping zero.
Overall, these results indicate that only a subset of species exhibited consistent positive growth responses to the treatments, while most species showed limited or neutral effects.
Treatment effects on aboveground biomass varied among species. ANOVA analyses revealed significant treatment effects on shoot fresh weight (SFW) in several taxa, including Althaea, Brachypodium, Briza, Eupatorium, Lychnis, and Melica (Table 3). Among these species, strong positive responses were observed in Lychnis, where SFW increased markedly under the 1_D treatment (+124%), and in Briza and Geum, which also showed substantial biomass increases under both treatments. In Sanguisorba, SFW increased markedly under the 3_D treatment (+105.5%), but with a lower statistical significance. Althaea and Inula exhibited moderate positive responses, with SFW increases of approximately 30–32% relative to controls.
For shoot dry weight (SDW), significant treatment effects were detected in Achillea, Althaea, Brachypodium, Epilobium, Geum, Lychnis, Melica, and Sanguisorba, even if only partially retained after multiple testing correction. Among these, the strongest increases were observed in Sanguisorba (+96.2% under 3_D), Lychnis (+70.7% under 1_D), Epilobium (+50.4% under 3_D), and Geum (+32.5% under 1_D). Relevant increases were also recorded in Inula and Althaea, where SDW increased by more than 30% under 3_D treatment relative to controls.
In contrast, negative responses were detected in a few species. Notably, Brachypodium showed substantial biomass reductions under both treatments (SFW −20.7% and −36.5%; SDW −37.0% and −35.1%). Melica also exhibited decreases in both SFW (−18.0%, −20.8%) and SDW (−24.5%,−30.1%). More moderate declines were observed in Achillea under 3_D treatment (SFW −18.8%; SDW −22.9%) and Viscaria (SFW −18.3% under 3_D). For several other species, including Veronica, treatment effects on biomass were small and statistically unsupported after correction for multiple testing, with percentage differences generally within ±10%.
The magnitude-based screening score broadly confirmed these patterns. High scores (6–7) were assigned to species showing consistent biomass increases under treatment conditions, notably Althaea, Briza, Epilobium, Eupatorium, Geum, Lychnis, and Inula. In contrast, species exhibiting marked biomass reductions, such as Brachypodium and Melica, received low scores (1–3), indicating reduced performance under cyclic flooding regimes. Most remaining species received intermediate or neutral scores (4–5), reflecting modest or uncertain treatment effects.

3.1.2. Belowground Responses

Visual inspection of belowground organs indicated that, across treatments, most species explored a large proportion of the container volume, although differences in root density and spatial distribution were observed. Viscaria exhibited a particularly shallow root system, with limited substrate exploration, while a similar but less pronounced pattern was observed for Melica, especially under submersion treatments.
ANOVA analyses revealed a significant treatment effect for Achillea, with both treatments resulting in strong reductions in root biomass relative to the control (−28.0% under 1_D and −35.9% under 3_D), which were reflected in low screening scores (Table 4). Moderate negative responses were also observed in Inula (−40.2% under 1_D and −30.6% under 3_D), although statistical support weakened after correction for multiple testing, and in Melica (−26.9%, −34.2%), while Brachypodium exhibited smaller decreases (−13.4% and −18.4%).
Conversely, positive responses were detected in a limited number of taxa. Eupatorium exhibited the most pronounced increases in root biomass, being +22.7% under 1_D and +34.5% under 3_D, the latter associated with confidence intervals not including zero and a high screening score. More moderate increases were observed in Geum and Viscaria, although these effects were generally associated with wide confidence intervals.
For several species, including Althaea, Epilobium, Lychnis, and Sanguisorba, treatment effects on RDW were small with percentage differences typically below ±10% and statistically unsupported. These cases were reflected in neutral screening scores.
Overall, the results indicate that root biomass responses to the treatments were species-specific, with strong negative effects detected in a few taxa (notably Achillea and Inula), positive responses in a limited subset (particularly Eupatorium), and mostly neutral responses for the remaining species. RDW differences among control and treatments, though, should be interpreted cautiously because harvest timing differed between control and flooded treatments.

3.2. Visual Assessment

Inter-rater reliability for the composite visual score Δ(A + B + C) was evaluated using a two-way random-effects model with absolute agreement (ICC(2,2)). The results showed that agreement between raters was good (ICC = 0.82; 95% CI: 0.75–0.86).
The results of the visual evaluation are reported in detail in Table S12 (Supplementary Material S4), as average ∆ values for each single evaluation parameter (A, B, and C), and for the total scoring (A + B + C), together with the final average score of each treatment, per species. Across species and treatments, most Δ values were negative (including control treatments), indicating a general decline in visual condition over the experimental period. The magnitude of these changes, though, was generally limited, with Δ values typically ranging between 1 and 3 points, corresponding to acceptable aesthetic and sanitary conditions. Furthermore, submersion treatments did not systematically result in worse visual conditions compared to the control. In several cases, visual scores under flooding treatments were comparable to, or higher than, those observed in non-flooded conditions.
The ANCOVA and post hoc analysis results are reported in Table S13 (Supplementary Material S4) and summarized in Table 5, showing that visual assessment responses were generally modest and species-specific. ANCOVA analyses, including baseline visual scores as covariates, indicated significant treatment effects only for Epilobium and Eupatorium, although these effects were not retained after correction for multiple testing. Among the tested species, Eupatorium showed the strongest positive response (+35.3% under 1_D, +31.9% under 3_D). Moderate positive responses were also observed in Althaea (+13.6–21.4%), Geum (+10.5% under 1_D), and Veronica (+7.5–9.9%), although confidence intervals generally overlapped zero.
For most species, including Achillea, Brachypodium, Briza, Inula, and Lychnis, treatment effects were small, with percentage differences typically below ±5%, indicating minimal changes relative to control conditions. Except for Brachypodium, though, all these species exhibited the highest total final scores (A + B + C), an aspect which was included in the overall evaluation through the additional scoring system (Score (II) in the table) introduced in Section 2.4 and described in Table S8. Negative responses were limited to a few taxa, most notably Melica (−6.0% under 1_D and −13.1% under 3_D), which also exhibited the lowest final scorings (<13), and Viscaria (−6.4% and −5.7% under the two treatments).
The magnitude-based screening score broadly supported these patterns. High scores were primarily associated with Eupatorium and Althaea, while most species received neutral scores. Overall, visual assessments suggested that only a subset of species exhibited noticeable differences—in this case, improvements—under cyclic submersion treatments, whereas the majority maintained comparable visual performance to the control.

3.3. Overall Performance

Overall performance scores for each species under the 1_D and 3_D treatments were calculated following the procedure described in Section 2.4.3 and are reported in Table 6 and Table 7. Species marked with an asterisk (*) met the predefined threshold for acceptable performance under the respective submersion regime.
Under the 1_D treatment, the highest total scores were recorded for Geum and Lychnis, followed by Eupatorium and Briza. Sanguisorba, Inula, Achillea, Althaea, and Veronica also achieved total scores above the predefined threshold. In contrast, Epilobium, Viscaria, Brachypodium, and Melica scored below the threshold for acceptable performance under this treatment.
Under the 3_D treatment, the highest total scores were achieved by Eupatorium and Geum, followed by Sanguisorba and Althaea. Epilobium, Inula, Lychnis achieved scores at or above the predefined threshold, with Veronica slightly below. Differently from the 1_D results, Briza and Achillea scored below the threshold, whereas Viscaria, Brachypodium, and Melica again showed the lowest overall scores.
The sensitivity analysis showed that species rankings were highly consistent across the weighting scenarios described in Section 2.4.3. Rank correlations between the original index and the alternative schemes were very high (ρ = 0.97–0.99), indicating that the composite performance index is robust to reasonable variations in parameter weighting.

4. Discussion

The results of this study should be interpreted within the scope of a preliminary, controlled screening aimed at exploring short-term plant responses to cyclic flooding conditions typical of rain garden systems, rather than as a definitive assessment of long-term field performance. The use of simplified flooding simulations for early-stage species evaluation is consistent with experimental approaches previously adopted in rain garden and bioretention research [18,27,28,35,43]. Several studies emphasize the value of controlled screening to evaluate candidate taxa, while acknowledging the limited capacity of such methods to reproduce the full complexity of field conditions [16,27,66].
The experiment was conducted over one month in late summer–early autumn and at a single site, which may limit the direct generalization of absolute growth responses to spring establishment conditions. Some taxa may have already entered early phenological stages of senescence during this period, potentially influencing growth dynamics. Relative differences among species remain informative for preliminary selection, even if absolute growth rates may vary across seasons. Future studies should extend the duration of the experiment and replicate the protocol under spring establishment conditions and, where feasible, across multiple sites or years to better capture seasonal and meteorological variability.
From a statistical perspective, the relatively small sample size per treatment implies that the experimental design had sufficient power, primarily, to detect medium-to-large effects. As expected, after applying the Benjamini–Hochberg correction for multiple comparisons, only a limited number of responses remained statistically significant (q < 0.05), including two cases for SPD (Lychnis, Briza), six for SFW (Althaea, Brachypodium, Briza, Eupatorium, Lychnis, and Melica), one for SDW (Epilobium), and one for RDW (Achillea). In addition, flooding treatments were applied at the basin level; therefore, basin-specific environmental conditions cannot be entirely disentangled from treatment effects. Consequently, the results should be interpreted primarily as a controlled screening of species responses under cyclic flooding conditions rather than as a fully replicated experimental test of treatment effects.
In light of these design constraints, treatment responses were not interpreted solely on the basis of statistical significance. This approach deliberately departs from a strict significance-testing framework by emphasizing the ecological relevance, direction, and uncertainty of treatment effects. The thresholds used to classify effect magnitudes represent operational criteria intended to translate quantitative differences into a comparable screening index. Although the resulting scores may vary to some extent depending on the magnitude thresholds adopted, the overall interpretation relies on the consistent direction and relative magnitude of treatment effects. Moreover, the robustness of the composite index to alternative weighting schemes was verified through sensitivity analysis, which showed highly consistent species rankings across scenarios.
As reported in the reference studies [27,28] and in other experiments based on short-term flooding [18,28,40,43], all tested species survived repeated inundation events, suggesting that short-term waterlogging alone rarely represents a lethal stress for perennial herbaceous plants. However, in agreement with the literature, if survival proved insufficient to discriminate among species, clearer interspecific differences emerged when growth dynamics, biomass allocation, and other stress assessments were jointly considered [35,41,43,44,58], supporting the adoption of multiple performance metrics in preliminary plant selection frameworks [27]. A key difference between this study and Refs. [27,39], though, lies in the use of a visual assessment instead of chlorophyll fluorescence measurements, which may limit the screening capacity for predicting plant stress beyond the experimental period. Other authors, though, report the unsuitability of this method for early stress identification [41]. Although visual scoring inherently includes a subjective component, the use of predefined scoring criteria, independent raters, and the quantification of inter-rater reliability ensured a consistent and reproducible evaluation framework.
Under the one-day submersion regime, among the highest overall performances are those observed in Geum rivale and Eupatorium cannabinum, suggesting a strong capacity to tolerate short-term waterlogging while maintaining satisfactory growth and visual quality. This response is coherent with their ecological association with moist but not permanently inundated habitats [60,61], which aligns with previous studies identifying species with this ecology, such as those from riparian margins or moist meadows, as suitable for rain garden zones subject to brief flooding events [27,66]. This is also consistent with the results of Ref. [43] for facultative wetland species (USDA classification), which is the case of Geum rivale [67]. Lychnis flos-cuculi in particular, but also Sanguisorba officinalis, likewise achieved high scores under one-day submersion, supporting observations that species typical of moist meadows and transitional habitats can perform well under periodic saturation, particularly when adequate drainage phases are present [23,43]. These taxa appear to be promising candidates for zones exposed to periodic flooding and warrant further validation under field conditions.
The good performance of Briza media under short-term flooding is noteworthy, as this species is generally associated with mesic grasslands [62,63]. Its response suggests a tolerance to brief inundation events, consistent with the results of Ref. [41] that highlight the limitations of predicting rain garden suitability based solely on habitat affinity [27].
In this regard, the use of Ellenberg-type indicator values for moisture (U), which is consistent with Ref. [41], can be helpful to frame habitat-based expectations, but only if their meaning is correctly interpreted. Ellenberg indicators are based on species’ realized occurrence in plant communities; accordingly, differences in U values should be read as probabilistic differences among sites rather than as absolute “needs” of the species [60]. Moreover, the moisture scale itself explicitly spans from very dry to aquatic conditions, supporting its use as a comparative ecological descriptor—e.g., useful for plant grouping—while still implying that species may show broader amplitudes and context-dependent performance [60,68], especially when moved into engineered systems such as bioretention media.
In contrast, Althaea officinalis showed comparatively lower performance under one-day submersion despite its association with wet habitats [61,62,63,69], a pattern that may reflect a preference for more persistent moisture conditions and a reduced tolerance to the repeated drying phases imposed by fast-draining substrates, a constraint reported for some wetland-adapted species in bioretention systems applications [15,66].
Among species originating from comparatively dry or hydrologically variable environments [61,62,70], also encompassing disturbed sites [60]; Inula ensifolia and Achillea millefolium achieved acceptable performance under one-day flooding, while Veronica spicata scored at the adopted threshold. This response suggests that tolerance to brief waterlogging events cannot be reliably inferred from habitat moisture affiliation alone [68], but rather reflects species-specific combinations of functional traits shaped by trade-offs among multiple stress tolerances [41,71]. The result also confirms the positive findings of Ref. [41] on Achillea and on the genus Inula (the tested species was I. hirta). The only concern is the reduction in RDW for the flooded treatments in Achillea, a result which is consistent with the observations of Ref. [43] on facultative or upland species [72]. Nevertheless, RDW comparisons should be interpreted with caution because roots from control and flooded treatments were harvested at different times, introducing a potential temporal confounding that cannot be fully disentangled from treatment effects. However, the positive performance of the three species—Inula, Achillea, Veronica—is of particular interest since the relevance of drought stress in RGs [18], especially when designed with fast-draining substrates or generically exposed to a strong alternation of wet and dry phases, as frequently reported in rising southern European Mediterranean and temperate–Mediterranean transitional climates [17,23,26].
A similar interpretation to that of Althaea (lack of sufficient moisture) may partially apply to Epilobium hirsutum [73], although in this case the low overall score under short-term flooding—2 points under the threshold—may have also been influenced by phenological dynamics of early senescence. Indeed, part of the plants in all treatments (and also in the residual plants of the species excluded from the experiment) in the latest part of the experimental period showed a partial drying out of the basal tissues, which is consistent with the reduced or absent growth observed in the dimensional and biomass measurements. This case emphasizes the importance of temporal scale when interpreting short-duration screening experiments [27]. Indeed, the constraints associated with the late summer–early autumn phenological phase may have limited consistent vegetative regrowth not only in species showing visible signs of senescence, but also in others that did not display clear symptoms. As a consequence, treatment responses may have been more difficult to detect given the limited statistical power of the experiment.
Viscaria vulgaris, and more consistently Brachypodium pinnatum and Melica ciliata, exhibited limited tolerance to one-day cyclic submersion, confirming their unsuitability for rain garden zones subject to saturation and aligning with their ecological preferences [61,62]. Similar results confirm previous studies’ general observations on drought-prone species [26,33,66], and are consistent with other experimental findings [18]. In Ref. [41], though, Melica ciliata showed a good response to multiple stressors encompassing flooding. Furthermore, reporting that some drought resistance mechanisms might function also in hypoxic conditions, and demonstrating good tolerance to flooding also in drought-prone species, Ref. [41] suggests further research and testing within this type of flora. This is also relevant in order to create robust mixed plantings of dry and moist-tolerant species, as suggested by Ref. [35].
When the three-day submersion regime is considered, the overall results highlight a slight shift in species ranking that underscores the importance of flooding duration as a key driver of plant responses in RGs. Eupatorium cannabinum and Geum rivale, though, were confirmed as top-performing species also under three-day submersion. This result supports their suitability for rain garden zones characterized by more frequent or prolonged flooding and is consistent with previous studies identifying riparian and wetland-associated species [62,74], as reliable candidates for the most hydrologically stressed zones [26,66].
However, in Eupatorium, the presence of a certain proportion of dry foliage even under these treatments may indicate a limited tolerance to drought stress, potentially suggesting emergency irrigation interventions, as hypothesized by Ref. [43] for some of the tested species. It should nevertheless be considered that the drying-out phase applied in this study represents a different experimental condition from a conventional drought stress test, such as that reported in Ref. [18], where a significant biomass reduction was observed in the wet-tolerant Lythrum salicaria. However, part of the tissues’ decline in Eupatorium might also be explained as an early stage of senescence, similarly to Epilobium, which frequently co-occurs in similar habitats [74]. In this case, the plausible retarding effect of high water availability on leaves’ desiccation, compared to Epilobium, was more marked and observed in both flooding treatments. A higher water availability, though, also positively affected Epilobium, which in this case ranked fifth with a score of 29, and Althaea officinalis, which ranked fourth.
Sanguisorba officinalis emerged as a high-performing species under prolonged cyclic flooding, showing enhanced growth and stable visual condition despite being mostly associated with moist rather than permanently flooded habitats [61,62,63]. This response suggests a high degree of plasticity in waterlogging tolerance and corroborates findings from previous studies reporting that species from moist meadow environments may successfully exploit extended saturation when followed by adequate drainage phases [23,27]. Furthermore, the result is consistent with the USDA classification of Sanguisorba as a facultative wetland species [75].
In contrast, a species that performed well under short-term flooding, such as Lychnis flos-cuculi, exhibited reduced tolerance to longer inundation periods, indicating a narrower ecological amplitude with respect to flooding duration, a pattern consistent with the differences in tolerance ranges reported in the experimental reference study [27,71]. Briza media similarly fell below acceptable performance levels under three-day flooding, reinforcing the interpretation that mesic grassland species may tolerate brief but not prolonged saturation.
Overall, the species-specific responses observed in this type of study might integrate the zonation approach adopted in widely used stormwater and green infrastructure design manuals in the United States, which distinguishes between zones subject to frequent ponding, intermittent saturation, and predominantly mesic conditions, and recommends plant selection accordingly [47,49,51,59]. Acknowledging that these manuals are largely based on empirical practice [15,16,28], the present results provide experimental support for their underlying logic, although this shows that plant suitability is strongly dependent on flooding duration design and cannot be generalized across rain garden zones.
Across both flooding regimes, the observed species-specific patterns support the broader view that rain garden suitability reflects functional responses to hydrological variability rather than simple habitat moisture affinity. At the same time, the container-based experimental design and the use of a fast-draining substrate, representative of many rain garden implementations, may have influenced species responses by accentuating contrasts between flooded treatments and the mesic control, consistently with the observations of Refs. [27,41]. Consequently, the control treatment—more subject to a fast, repeated drying out—might be regarded as a relative reference rather than an optimal growth benchmark. Furthermore, although saturated hydraulic conductivity was measured to verify drainage properties, other substrate characteristics (e.g., density, porosity, and organic matter content) were not quantified. These properties may influence aeration and water availability under cyclic flooding and, therefore, represent a potential limitation when extrapolating the results to other substrate conditions.
Also, interspecific interactions and, most importantly, multiple concurrent stressors (such as drought, freezing, salinity, or pollutant loads) which are known to influence rain garden vegetation performance under real-world conditions [35,44,57], have not been considered in this study.
The main objective of this study was to develop and test a standardized screening framework capable of discriminating among species under controlled cyclic flooding conditions. Within the acknowledged limitations, the analysis of overall performance nonetheless provides valuable indications that might support the preliminary selection and prioritization of native species for different rain garden zones, while clearly highlighting the need for subsequent long-term validation under operational conditions. Indeed, field validation across seasons and sites will be necessary before translating these screening results into design guidelines.

5. Conclusions

This study screened 13 herbaceous species native and widely distributed in Italy to explore their potential suitability for rain garden (RG) applications under contrasting moisture regimes, comparing a control condition with repeated short (1-day) and longer (3-day) submersion cycles. All species survived across treatments under the adopted substrate and climatic conditions, suggesting a general capacity to tolerate transient waterlogging over the duration of the experiment. However, when growth responses, biomass allocation, and visual condition were considered jointly through the composite scoring framework, differences among species became apparent.
Several species showed relatively stable performance under short-term submersion, which is among the most frequent flooding conditions in operational RGs, whereas a smaller group maintained acceptable performance under the longer inundation cycles tested in this study. These patterns suggest that submersion duration may represent an important design consideration in RG planning and that species responses may vary along this gradient. In addition, the observed responses indicate that tolerance to waterlogging cannot always be inferred directly from habitat moisture affinity alone, highlighting the potential value of experimental screening under controlled yet realistic conditions.
Given the exploratory nature of the experiment, the relatively small number of replicates, and the late-season phenological context, the results should be interpreted as a preliminary screening rather than a definitive assessment of treatment effects. Within these constraints, the study provides an initial indication of species that may perform satisfactorily under short or moderate submersion events in RG settings relevant to the Italian context.
Future studies could further test these patterns by replicating the experiment during spring, when vegetative growth is typically more active, and by extending the screening to species adapted to drier environmental conditions, including strictly Mediterranean taxa. In addition, experimental designs incorporating multiple concurrent stress factors could help better represent the complex environmental conditions experienced in operational RG systems.

Supplementary Materials

The following supporting information can be downloaded at: https://www.mdpi.com/article/10.3390/land15030476/s1, Supplementary Material S1: Plant cultivation; Supplementary Material S2: Species selection and description; Supplementary Material S3: Evaluation scoring parameters; Supplementary Material S4: Growth and visual assessment.

Author Contributions

Conceptualization, L.B.; methodology, L.B. and A.T.; data curation, L.B., F.O. and A.T.; writing—original draft preparation, L.B.; writing—review and editing, L.B., F.O. and M.F.; supervision, M.F. All authors have read and agreed to the published version of the manuscript.

Funding

This research received no external funding.

Data Availability Statement

Data will be available upon reasonable request.

Acknowledgments

The authors would like to acknowledge the experimental center Centro Appenninico del Terminillo “Carlo Jucci” for providing facilities and staff support for the experimental activities. The authors also acknowledge Green Service s.r.l. for funding the PhD program within which this research was conducted. During the preparation of this manuscript/study, the author(s) used Chat GPT 5.2 for the purposes of: final contents organization and consistency validation; English improvement. The authors have reviewed and edited the output and take full responsibility for the content of this publication.

Conflicts of Interest

The authors declare no conflicts of interest.

Abbreviations

The following abbreviations are used in this manuscript:
NBSNature-Based Solutions
GSIGreen Stormwater Infrastructures
RG/RGsRain garden/Rain gardens
SGRCanopy spread growth rate
HGRHeight growth rate
SFWShoot fresh weight
SDWShoot dry weight
RDWRoot dry weight

References

  1. Ferreira, C.S.; Mourato, S.; Kasanin-Grubin, M.; Ferreira, A.J.D.; Destouni, G.; Kalantari, Z. Effectiveness of Nature-Based Solutions in Mitigating Flood Hazard in a Mediterranean Peri-Urban Catchment. Water 2020, 12, 2893. [Google Scholar] [CrossRef] [Scilit]
  2. Chaves, M.T.R.; Farias, T.R.L.; Eloi, W.M. Comparative Analysis of Bioretention Design Strategies for Urban Runoff Infiltration: A Critical Overview. Ecol. Eng. 2024, 207, 107352. [Google Scholar] [CrossRef] [Scilit]
  3. Calvin, K.; Dasgupta, D.; Krinner, G.; Mukherji, A.; Thorne, P.W.; Trisos, C.; Romero, J.; Aldunce, P.; Barrett, K.; Blanco, G.; et al. IPCC, 2023: Climate Change 2023: Synthesis Report. Contribution of Working Groups I, II and III to the Sixth Assessment Report of the Intergovernmental Panel on Climate Change [Core Writing Team, H. Lee and J. Romero (Eds.)]; Arias, P., Bustamante, M., Elgizouli, I., Flato, G., Howden, M., Méndez-Vallejo, C., Pereira, J.J., Pichs-Madruga, R., Rose, S.K., Saheb, Y., et al., Eds.; IPCC: Geneva, Switzerland, 2023. [Google Scholar]
  4. Donat, M.G.; Lowry, A.L.; Alexander, L.V.; O’Gorman, P.A.; Maher, N. More Extreme Precipitation in the World’s Dry and Wet Regions. Nat. Clim. Change 2016, 6, 508–513. [Google Scholar] [CrossRef] [Scilit]
  5. Tramblay, Y.; Somot, S. Future Evolution of Extreme Precipitation in the Mediterranean. Clim. Change 2018, 151, 289–302. [Google Scholar] [CrossRef] [Scilit]
  6. European Commission Green Infrastructure (GI)—Enhancing Europe’s Natural Capital. 2013. Available online: https://eur-lex.europa.eu/legal-content/EN/TXT/PDF/?uri=CELEX:52013IP0600&from=EN (accessed on 20 November 2025).
  7. Fletcher, T.D.; Shuster, W.; Hunt, W.F.; Ashley, R.; Butler, D.; Arthur, S.; Trowsdale, S.; Barraud, S.; Semadeni-Davies, A.; Bertrand-Krajewski, J.-L.; et al. SUDS, LID, BMPs, WSUD and More—The Evolution and Application of Terminology Surrounding Urban Drainage. Urban Water J. 2015, 12, 525–542. [Google Scholar] [CrossRef] [Scilit]
  8. Abellán García, A.I.; Cruz Pérez, N.; Santamarta, J.C. Sustainable Urban Drainage Systems in Spain: Analysis of the Research on SUDS Based on Climatology. Sustainability 2021, 13, 7258. [Google Scholar] [CrossRef] [Scilit]
  9. Özer, E.; Tansel, B. Climate Stressors and Adaptation Strategies Using Green Stormwater Infrastructure (GSI) Systems in Urban Areas: Improving Design and Functionality. City Environ. Interact. 2025, 25, 100185. [Google Scholar] [CrossRef] [Scilit]
  10. Prudencio, L.; Null, S.E. Stormwater Management and Ecosystem Services: A Review. Environ. Res. Lett. 2018, 13, 033002. [Google Scholar] [CrossRef] [Scilit]
  11. Veerkamp, C.J.; Schipper, A.M.; Hedlund, K.; Lazarova, T.; Nordin, A.; Hanson, H.I. A Review of Studies Assessing Ecosystem Services Provided by Urban Green and Blue Infrastructure. Ecosyst. Serv. 2021, 52, 101367. [Google Scholar] [CrossRef] [Scilit]
  12. Woods Ballard, B.; Wilson, S.; Udale-Clarke, H.; Illman, S.; Scott, T.; Ashley, R.; Kellagher, R. The SUDS Manual; CIRIA: London, UK, 2015. [Google Scholar]
  13. Steiner, L.M.; Domm, R.W. Rain Gardens: Sustainable Landscaping for a Beautiful Yard and a Healthy World; Voyageur Press: Minneapolis, MN, USA, 2012. [Google Scholar]
  14. Yuan, J.; Dunnett, N.; Stovin, V. The Influence of Vegetation on Rain Garden Hydrological Performance. Urban Water J. 2017, 14, 1083–1089. [Google Scholar] [CrossRef] [Scilit]
  15. Skorobogatov, A.; He, J.; Chu, A.; Valeo, C.; van Duin, B. The Impact of Media, Plants and Their Interactions on Bioretention Performance: A Review. Sci. Total Environ. 2020, 715, 136918. [Google Scholar] [CrossRef] [Scilit] [PubMed]
  16. Dagenais, D.; Brisson, J.; Fletcher, T.D. The Role of Plants in Bioretention Systems; Does the Science Underpin Current Guidance? Ecol. Eng. 2018, 120, 532–545. [Google Scholar] [CrossRef] [Scilit]
  17. Bonciarelli, L.; Orlandi, F.; Muscas, D.; Fornaciari, M. Sustainable Stormwater Management and Bioretention: An Overview of Reviews of the Last 10 Years. Land 2025, 14, 736. [Google Scholar] [CrossRef] [Scilit]
  18. Bakhtina, M.; Rosef, L.; Torre, S.; Hanslin, H.M. Shoot and Root Growth in Response to Hydrological Fluctuations in the Drought-Tolerant-Knautia Arvensis and Wet-Tolerant Lythrum Salicaria. Nat.-Based Solut. 2025, 8, 100281. [Google Scholar] [CrossRef] [Scilit]
  19. ISPRA. Verso Città Resilienti: Gli Interventi Del Programma Sperimentale per l’adattamento Ai Cambiamenti Climatici in Ambito Urbano. Quad. Ambiente E Soc. 2023, 29. Available online: https://www.isprambiente.gov.it/files2024/pubblicazioni/quaderni/quaderno_as_adattamento_finale.pdf (accessed on 20 November 2025).
  20. Ministero dell’Ambiente e della Tutela del Territorio e del Mare. Elementi per una Strategia Nazionale di Adattamento ai Cambiamenti Climatici. Available online: https://www.mase.gov.it/portale/documents/d/guest/strategia_adattamentocc-pdf (accessed on 20 November 2025).
  21. Callerio, M. Progetto Di Fattibilita Tecnico Economica—Piano Urbano Integrato Citta Metropolitana Spugna. 2022. Available online: https://www.cittametropolitana.mi.it/export/sites/default/PNRR/Piani-Urbani-Integrati/Spugna/R0-Relazione-PFTE_CMM-Spugna.pdf (accessed on 20 November 2025).
  22. Life Beware. Available online: https://www.lifebeware.eu/ (accessed on 19 January 2026).
  23. Bortolini, L.; Zanin, G. Hydrological Behaviour of Rain Gardens and Plant Suitability: A Study in the Veneto Plain (North-Eastern Italy) Conditions. Urban For. Urban Green. 2018, 34, 121–133. [Google Scholar] [CrossRef] [Scilit]
  24. Michielan, E. Le Piante Del Rain Garden Di Agripolis: Valutazione Dell’ Adattabilita’ Alle Condizioni Idriche. 2013. Available online: https://thesis.unipd.it/retrieve/98f01b42-69f0-476c-b35f-c6365506bf9a/Michielan_Enrico.pdf (accessed on 20 June 2025).
  25. Bortolini, L.; Zanin, G. The Experimental and Educational Rain Gardens of the Agripolis Campus (North-East Italy): Preliminary Results on Hydrological and Plant Behavior. Acta Hortic. 2017, 1189, 531–536. [Google Scholar] [CrossRef] [Scilit]
  26. Corduan, D.; Kühn, N. Planting for the Urban Rain—Vegetation in Urban Bioretention Systems for Stormwater Management under Temperate Climate Conditions—A Systematic Review. Sustainability 2024, 16, 8861. [Google Scholar] [CrossRef] [Scilit]
  27. Yuan, J.; Dunnett, N. Plant Selection for Rain Gardens: Response to Simulated Cyclical Flooding of 15 Perennial Species. Urban For. Urban Green. 2018, 35, 57–65. [Google Scholar] [CrossRef] [Scilit]
  28. Dylewski, K.L.; Wright, A.N.; Tilt, K.M.; LeBleu, C. Effects of Short Interval Cyclic Flooding on Growth and Survival of Three Native Shrubs. HortTechnology 2011, 21, 461–465. [Google Scholar] [CrossRef] [Scilit]
  29. Beniston, M.; Stephenson, D.B.; Christensen, O.B.; Ferro, C.A.T.; Frei, C.; Goyette, S.; Halsnaes, K.; Holt, T.; Jylhä, K.; Koffi, B.; et al. Future Extreme Events in European Climate: An Exploration of Regional Climate Model Projections. Clim. Change 2007, 81, 71–95. [Google Scholar] [CrossRef] [Scilit]
  30. Boldrin, D.; Knappett, J.A.; Leung, A.K.; Brown, J.L.; Loades, K.W.; Bengough, A.G. Modifying Soil Properties with Herbaceous Plants for Natural Flood Risk-Reduction. Ecol. Eng. 2022, 180, 106668. [Google Scholar] [CrossRef] [Scilit]
  31. TRY Plant Trait Database. Available online: https://www.try-db.org/TryWeb/Home.php (accessed on 18 January 2026).
  32. USDA Plants Database. Available online: https://plants.usda.gov/ (accessed on 18 January 2026).
  33. Doğmuşöz, B.B. Plant Selection for Rain Gardens in Temperate Climates: The Case of Izmir, Turkey. J. Des. Resil. Archit. Plan. 2024, 5, 18–34. [Google Scholar] [CrossRef] [Scilit]
  34. Houdeshel, C.D.; Pomeroy, C.A.; Hultine, K.R. Bioretention Design for Xeric Climates Based on Ecological Principles. JAWRA J. Am. Water Resour. Assoc. 2012, 48, 1178–1190. [Google Scholar] [CrossRef] [Scilit]
  35. Bakhtina, M.; Hanslin, H.M.; Torre, S.; Ergon, Å.; Rosef, L. Impact of Fluctuating Hydrology during Summer and Autumn on Winter Frost Hardiness and Salt Tolerance of Selected Raingarden Species. Urban For. Urban Green. 2024, 101, 128534. [Google Scholar] [CrossRef] [Scilit]
  36. Davis, A.P.; Hunt, W.F.; Traver, R.G.; Clar, M. Bioretention Technology: Overview of Current Practice and Future Needs. J. Environ. Eng. 2009, 135, 109–117. [Google Scholar] [CrossRef] [Scilit]
  37. Woelfle-Erskine, C.; Uncapher, A. Creating Rain Gardens: Capturing The Rain For Your Own Water-Efficient Garden; Timber Press: Portland, OR, USA, 2012. [Google Scholar]
  38. Dunnett, N.; Clayden, A. Rain Gardens: Managing Water Sustainably in the Garden and Designed Landscape; Timber Press: Portland, OR, USA, 2007. [Google Scholar]
  39. Yuan, J. Investigating The Planting Potential For Urban Rain Gardens: Plant Selection, Establishment and Performance. Ph.D. Thesis, University of Sheffield, Sheffield, UK, 2016. [Google Scholar]
  40. Jernigan, K.J.; Wright, A.N. Effect of Repeated Short Interval Flooding Events on Root and Shoot Growth of Four Landscape Shrub Taxa. J. Environ. Hortic. 2011, 29, 220–222. [Google Scholar] [CrossRef] [Scilit]
  41. Eben, P.; Duthweiler, S.; Helmreich, B.; Knoll, S.; Moning, C.; Stinshoff, P.; Pauleit, S. Thriving under Multiple Stressors: Performance of Drought-Tolerant Perennials and Their Suitability for Infiltration Swales. Urban For. Urban Green. 2024, 101, 128535. [Google Scholar] [CrossRef] [Scilit]
  42. Kercher, S.M.; Zedler, J.B. Flood Tolerance in Wetland Angiosperms: A Comparison of Invasive and Noninvasive Species. Aquat. Bot. 2004, 80, 89–102. [Google Scholar] [CrossRef] [Scilit]
  43. Nelson, R.S.; McGinnis, E.E.; Daigh, A.L.M. Rain Garden Sedges Tolerate Cyclical Flooding and Drought. HortScience 2018, 53, 1669–1676. [Google Scholar] [CrossRef] [Scilit]
  44. Laukli, K.; Gamborg, M.; Haraldsen, T.K.; Vike, E. Soil and Plant Selection for Rain Gardens along Streets and Roads in Cold Climates: Simulated Cyclic Flooding and Real-Scale Studies of Five Herbaceous Perennial Species. Urban For. Urban Green. 2022, 68, 127477. [Google Scholar] [CrossRef] [Scilit]
  45. Laukli, K.; Vinje, H.; Haraldsen, T.K.; Vike, E. Plant Selection for Roadside Rain Gardens in Cold Climates Using Real-Scale Studies of Thirty-One Herbaceous Perennials. Urban For. Urban Green. 2022, 78, 127759. [Google Scholar] [CrossRef] [Scilit]
  46. Greksa, A.; Ljubojevic, M.; Blagojevic, B. The Value of Vegetation in Nature-Based Solutions: Roles, Challenges, and Utilization in Managing Different Environmental and Climate-Related Problems. Sustainability 2024, 16, 3273. [Google Scholar] [CrossRef] [Scilit]
  47. Apt, D.; Trapp, J.M.; Yeager, M.; Benvau, J. Low Impact Development Manual for Southern California: Technical Guidance and Site Planning Strategies. 2019. Available online: https://socalsmc.org/wp-content/uploads/2019/07/SoCal-LID-Manual-2019-Update-2019-05-31.pdf (accessed on 10 January 2026).
  48. City of San Diego Storm Water Division San Diego Low Impact Development Design Manual. Appendix E: Plant Palette. San Diego Low Impact Development Design Manual. 2011. Available online: https://www.sandiegocounty.gov/content/dam/sdc/dpw/WATERSHED_PROTECTION_PROGRAM/susmppdf/lid_appendix_e_plant_pallette.pdf (accessed on 9 January 2026).
  49. City of Seattle City of Seattle Stormwater Manual. Appendix E: Additional Design Requirements and Plant Lists. City of Seattle Stormwater Manual. 2021. Available online: https://www.seattle.gov/documents/Departments/SDCI/Codes/StormwaterCode/2021SWManualApxEAddDesignReqClean.pdf (accessed on 10 January 2026).
  50. Florida Department of Environmental Protection Green Stormwater Infrastructure Plant Guide. Available online: https://ffl.ifas.ufl.edu/media/fflifasufledu/docs/gsi-documents/GSI-Maintenance-Manual.pdf (accessed on 10 January 2026).
  51. New York State Department of Environmental Conservation. New York State Stormwater Management Design Manual Appendix H: Landscaping Guidance/Plant Lists. New York State Stormwater Management Design Manual. 2024. Available online: https://extapps.dec.ny.gov/docs/water_pdf/swdmappendixh.pdf (accessed on 10 January 2026).
  52. Santa Clara Valley Urban Runoff Pollution Prevention Program Stormwater Handbook. Appendix D: Plant List and Planting Guidance for Landscape Based Stormwater Measures. Stormwater Handbook. 2024. Available online: https://scvurppp.org/wp-content/uploads/2024/07/Appendix-D-2024_20240718.pdf (accessed on 9 January 2026).
  53. Shaw, D.; Schmidt, R. Plants for Stormwater Design. Species Selection for the Upper Midwest. Available online: https://www.ou.edu/content/dam/okh2o/docs/PFSD_Shaw_Schmidt.pdf (accessed on 9 January 2026).
  54. San Francisco Public Utility Commission San Francisco Stormwater Management Requirements and Design Guidelines. Appendix D: Vegetation Palette For Bioretention BMPs. San Francisco Stormwater Management Requirements and Design Guidelines. Available online: https://www.sfpuc.gov/sites/default/files/construction-and-contracts/design-guidelines/SMR_ApxD_VegetationPalette_May2016.pdf (accessed on 10 January 2026).
  55. Rippy, M.A.; Krauss, L.; Pierce, G.; Winfrey, B. Plant Functional Traits and Viewer Characteristics Co-Regulate Cultural Services Provisioning by Stormwater Bioretention. Ecol. Eng. 2021, 168, 106284. [Google Scholar] [CrossRef] [Scilit]
  56. Pham, M.A.; Spring, M.R.; Sivakoff, F.S.; Gardiner, M.M. Reclaiming Urban Vacant Land to Manage Stormwater and Support Insect Habitat. Urban Ecosyst. 2023, 26, 1813–1827. [Google Scholar] [CrossRef] [Scilit]
  57. Dudrick, R.; Hoffman, M.; Antoine, J.; Austin, K.; Bedoya, L.; Clark, S.; Dean, H.; Medina, A.; Gotsch, S.G. Do Plants Matter?: Determining What Drives Variation in Urban Rain Garden Performance. Ecol. Eng. 2024, 201, 107208. [Google Scholar] [CrossRef] [Scilit]
  58. Bakhtina, M.; Bay, N.; Rosef, L.; Hanslin, H.M. The Impact of Soil Hydrological Regimes and Vegetation Systems on Plant Performance and Root Depth Distribution in Bioswale Microcosms. Environ. Technol. 2024, 45, 4334–4345. [Google Scholar] [CrossRef] [Scilit] [PubMed]
  59. Minnesota Stormwater Manual. Available online: https://www.pca.state.mn.us/business-with-us/minnesota-stormwater-manual (accessed on 10 January 2026).
  60. Pignatti, S. Valori Di Biondicazione Delle Piante Vascolari Della Flora d’Italia. Braun-Blanquetia 2005, 39. Available online: https://www.scienzadellavegetazione.it/wp-content/uploads/2023/07/NUMERO-39.pdf (accessed on 20 January 2026).
  61. Tichý, L.; Axmanová, I.; Dengler, J.; Guarino, R.; Jansen, F.; Midolo, G.; Nobis, M.P.; Van Meerbeek, K.; Aćić, S.; Attorre, F.; et al. Ellenberg-type Indicator Values for European Vascular Plant Species. J. Veg. Sci. 2023, 34, e13168. [Google Scholar] [CrossRef] [Scilit]
  62. Pignatti, S. Flora d’Italia; Edagricole Calderini: Bologna, Italy, 2017. [Google Scholar]
  63. Acta Plantarum. 2023. Available online: https://www.actaplantarum.org/ (accessed on 18 January 2026).
  64. Portale Della Flora d’Italia—Portal to the Flora of Italy. Available online: http://dryades.units.it/floritaly (accessed on 18 January 2026).
  65. The Jamovi Project. 2025. Available online: https://www.jamovi.org/ (accessed on 15 January 2026).
  66. Hunt, W.F.; Lord, B.; Loh, B.; Sia, A. Plant Selection for Bioretention Systems and Stormwater Treatment Practices; SpringerBriefs in Water Science and Technology; Springer Singapore: Singapore, 2015; ISBN 978-981-287-244-9. [Google Scholar]
  67. USDA. Plants Database Plant Profile Wetland. Available online: https://plants.usda.gov/plant-profile/GERI2/wetland (accessed on 30 January 2026).
  68. Ter Braak, C.J.F.; Gremmen, N.J.M. Ecological Amplitudes of Plant Species and the Internal Consistency of Ellenberg’s Indicator Values for Moisture. Vegetatio 1987, 69, 79–87. [Google Scholar] [CrossRef] [Scilit]
  69. USDA. Plants Database Plant Profile Wetland. Available online: https://plants.usda.gov/plant-profile/ALOF2/wetland (accessed on 30 January 2026).
  70. Mann, A.; Majeski, M.; Pokorny, M. Plant Guide for Common Yarrow (Achillea millefolium L.); USDA-Natural Resources Conservation Service, Bridger Plant Materials Center: Bridger, MT, USA, 2022.
  71. Niinemets, U.; Valadares, F. Tolerance to Shade, Drought, and Waterlogging of Temperate Northern Hemisphere Trees and Shrubs. Ecol. Monogr. 2006, 76, 521–547. [Google Scholar] [CrossRef] [Scilit]
  72. USDA. Plants Database Plant Profile Wetland. Available online: https://plants.usda.gov/plant-profile/acmi2/wetland (accessed on 30 January 2026).
  73. USDA. Plants Database Plant Profile Wetland. Available online: https://plants.usda.gov/plant-profile/EPHI/wetland (accessed on 30 January 2026).
  74. Lenssen, J.P.M.; Menting, F.B.J.; Van Der Putten, W.H.; Blom, C.W.P.M. Effects of Sediment Type and Water Level on Biomass Production of Wetland Plant Species. Aquat. Bot. 1999, 64, 151–165. [Google Scholar] [CrossRef] [Scilit]
  75. USDA. Plants Database Plant Profile Wetland. Available online: https://plants.usda.gov/plant-profile/SAOF3/wetland (accessed on 30 January 2026).
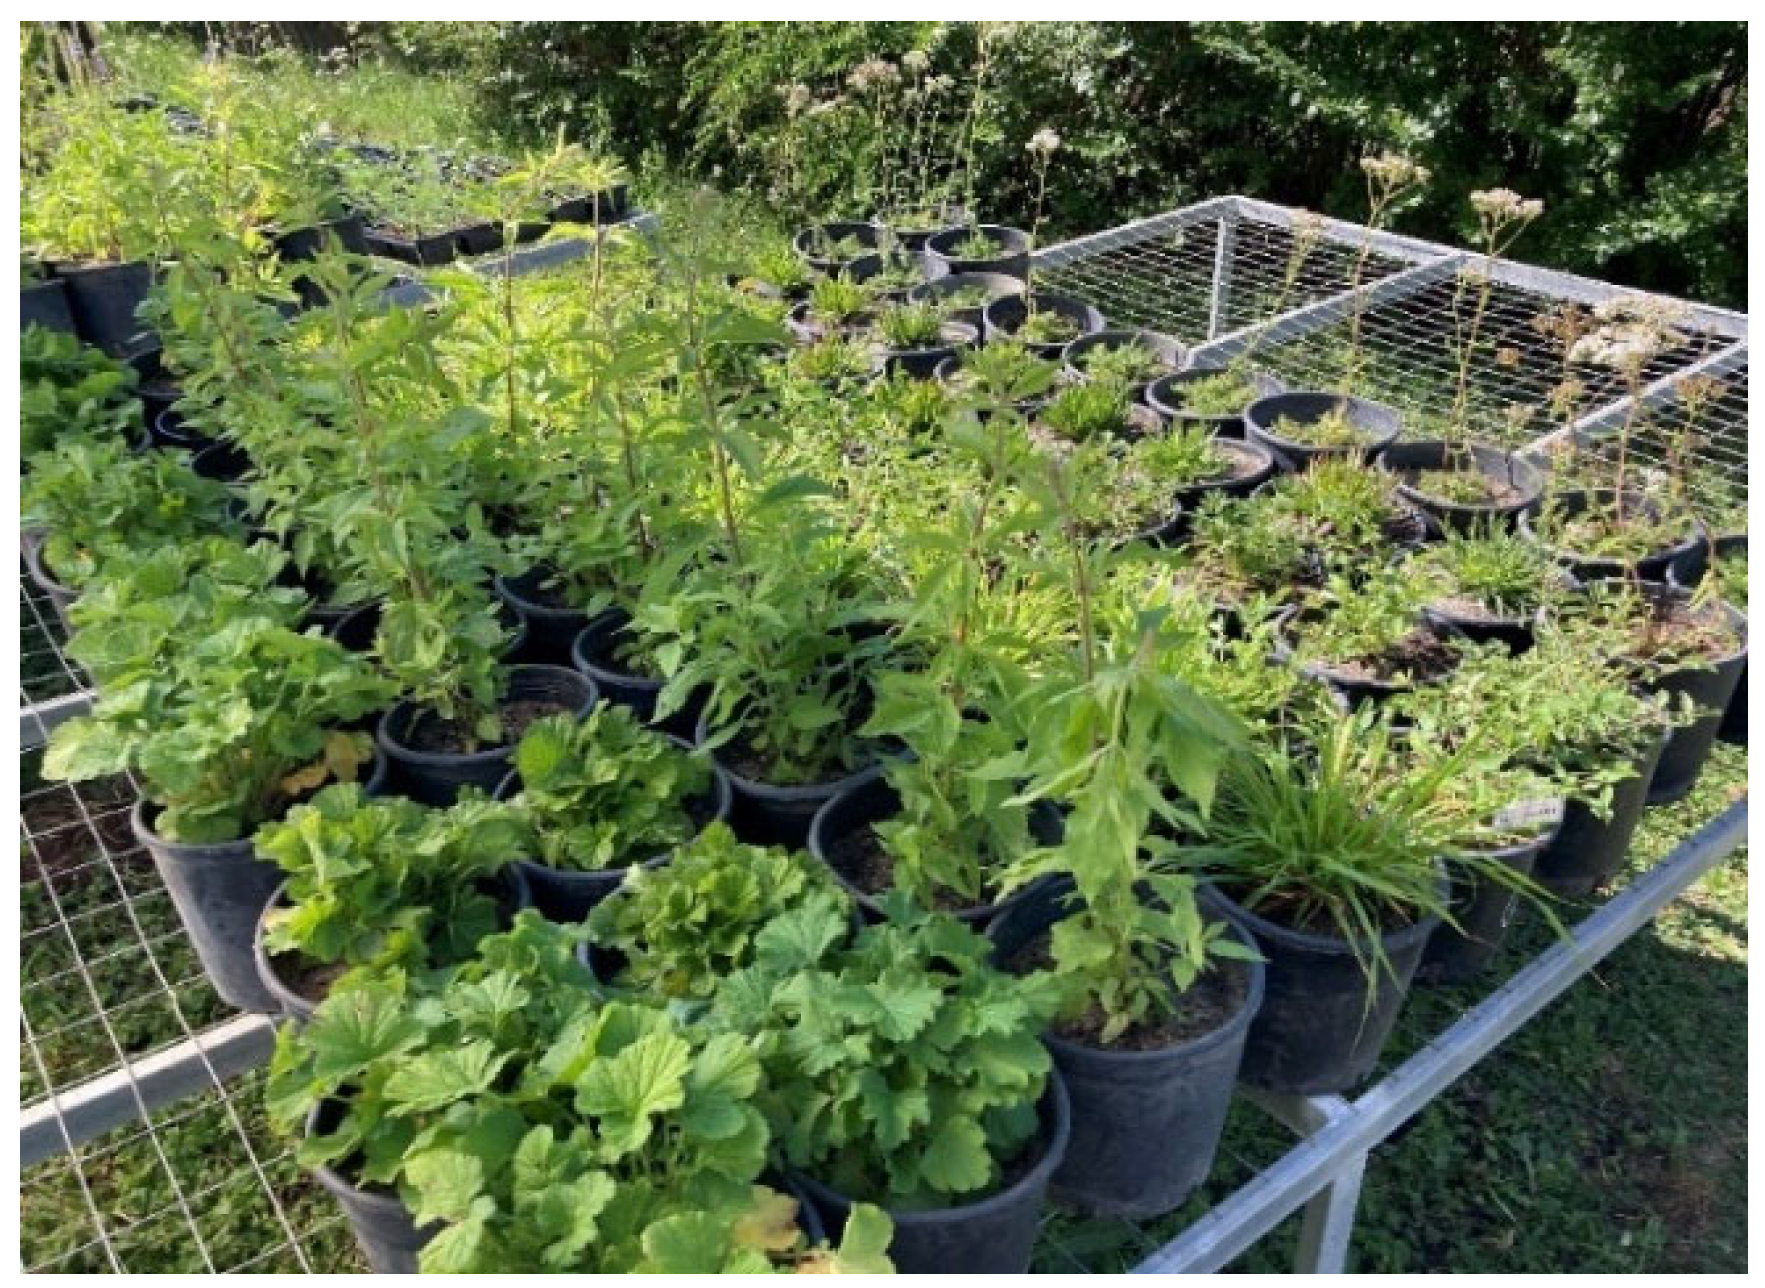
Figure 1. Some selected species (Geum, Eupatorium, Briza). The figure shows the plants’ development at the beginning of August, after their transferring in the final 3.5 L pots for the one-month establishment phase.
Land 15 00476 g001
Figure 2. Impermeabilized basin used for the flooding phase (left) and basin used for the drying phase (right). The figures show the distribution of plants on a predefined grid, with individuals equally spaced within the basins (1.5 m wide and 4.5 m long).
Land 15 00476 g002
Table 1. Selected species’ family, distribution, altitudinal range, moisture range, and uses.
SpeciesFamilyDistribution in ItalyAltitudinal RangeHabitats’ MoistureUses
NorthCenterSouthLowlandHillsMountainSubalpineAlpineDryMesicMoistWetMedicinalEdible
Achillea millefolium L. Asteraceaexxxxxxxxxx xx
Althaea officinalis L.Malvaceaexxxxxx xxxx
Brachypodium pinnatum (L.) P.Beauv.Poaceaex x x xx x
Briza media L.Poaceaexxxxxxx x x
Epilobium hirsutum L.Onagraceaexxxxxx xxx
Eupatorium cannabinum L.Asteraceaexxxxxx xxxx
Geum rivale L. Rosaceaexxx xxxx xxx
Inula ensifolia L. Asteraceaex xx x x
Lychnis flos-cuculi L.Caryophyllaceaexxxxxxx xx x
Melica ciliata L.Poaceaexxxxxxx x
Sanguisorba officinalis L.Rosaceaexxxxxxx xxxxx
Veronica spicata L.Plantaginaceaexx xxx x
Viscaria vulgaris Bernh. Caryophyllaceaex x xx
Table 2. Synthesis of the results of the ANCOVA test and post hoc Tukey Test for spread (SPD) and height (H) growth. The complete table is reported in Supplementary Material S4 (Table S9).
SPDH
SpeciespqT∆%95% ICScorepqT∆%95% ICScore
Achillea0.0970.2101_D9.5%−1.811.6650.0400.1731_D13.0%−0.682.815
3_D−0.4%−0.304.1143_D−14.1%−2.930.613
Althaea0.6730.7761_D6.3%−0.793.5350.0160.1041_D5.1%−0.034.875
3_D8.5%−0.44.1353_D4.2%−0.274.184
Brachypodium0.4680.6901_D−1.2%−1.732.3140.5020.6531_D−3.3%−3.51.104
3_D−3.5%−2.810.9443_D−4.8%−4.10.704
Briza0.0060.0391_D10.1%0.785.8860.4100.6531_D3.1%−1.381.934
3_D4.4%−0.353.3543_D−7.9%−2.380.983
Epilobium0.7160.7761_D1.5%−1.42.0940.5660.6691_D1.8%−1.512.124
3_D2.3%−1.1−2.343_D5.9%−0.992.935
Eupatorium0.3260.6051_D6.5%−0.673.2750.0120.1041_D2.8%−0.663.494
3_D4.7%−1.012.9143_D8.0%0.727.475
Geum0.0290.0811_D17.1%0.627.3160.3950.6531_D2.9%−1.152.174
3_D16.9%0.487.3463_D5.7%−0.712.765
Inula0.0240.0811_D5.7%0.324.6750.4570.6531_D2.7%−1.402.124
3_D3.2%−0.443.2043_D−0.4%−1.801.694
Lychnis0.0030.0391_D13.4%1.037.3460.2240.6531_D−4.7%−2.40.944
3_D3.2%−0.862.8543_D3.7%−1.12.274
Melica0.5310.6901_D−6.1%−2.61.2330.8610.9331_D−2.1%−21.264
3_D−5.4%−2.71.1533_D−3.1%−1.901.384
Sanguisorba0.0310.0811_D10.7%0.727.4760.4010.6531_D8.8%−0.892.845
3_D18.8%−0.463.1553_D7.8%−0.852.595
Veronica0.5260.6901_D−2.5%−2.870.9840.9640.9641_D5.4%0.898.625
3_D−5.0%−4.120.3633_D−0.9%−2.731.144
Viscaria0.7900.7901_D−2.7%−2.871.5740.3810.6531_D−6.2%−3.31.113
3_D−7.0%−4.250.8433_D−5.5%−2.80.793
Table 3. Synthesis of the ANOVA test and post hoc Tukey Test for shoot fresh weight (SFW) and shoot dry weight (SDW). The complete table is reported in Supplementary Material S4 (Table S10).
SFWSDW
SpeciespqT∆%95% ICScorepqT∆%95% ICScore
Achillea0.0560.1001_D21.8%−0.622.7850.0460.0751_D24.4%−0.622.795
3_D−18.8%−2.600.7533_D−22.9%−2.700.673
Althaea0.020.0431_D16.9%−0.433.0650.0240.0751_D9.8%−1.012.275
3_D32.2%0.424.5873_D36.2%0.304.357
Brachypodium0.0150.0431_D−20.7%−3.270.3030.0240.0751_D−37.3%−4.12−0.181
3_D−36.5%−4.74−0.4913_D−35.1%−3.95−0.091
Briza0.0190.0431_D44.8%−0.732.6350.070.1011_D19.1%−1.142.105
3_D117.7%0.424.5873_D73.1%−0.043.715
Epilobium0.0940.1221_D29.1%−0.792.5550.0030.0391_D15.5%−0.662.725
3_D58.4%−0.09−3.6253_D50.4%0.955.747
Eupatorium0.0120.0431_D6.0%−1.202.0450.0840.1091_D8.8%−1.222.015
3_D37.0%0.474.6873_D38.8%−0.123.585
Geum0.0680.1001_D44.1%−0.033.7250.0440.0751_D32.5%0.154.057
3_D32.6%−0.393.1253_D20.4%−0.433.065
Inula0.4310.4671_D31.4%−0.832.4950.4420.5221_D23.2%−1.052.215
3_D31.9%−0.822.5053_D37.3%0.742.617
Lychnis0.00090.0121_D124.2%1.426.8870.0290.0751_D70.7%0.013.777
3_D12.6%−1.192.0453_D8.5%−1.831.385
Melica0.0160.0431_D−18.0%−4.01−0.1330.0420.0751_D−24.5%−3.470.183
3_D−20.8%−4.44−0.3533_D−30.1%−3.95−0.091
Sanguisorba0.0690.1001_D33.0%−1.052.2150.0350.0751_D2.1%−1.571.644
3_D105.5%−0.023.7553_D96.2%0.043.867
Veronica0.9750.9751_D1.2%−1.571.6340.9770.9881_D3.0%−1.511.694
3_D5.3%−1.451.7553_D−2.1%−1.661.544
Viscaria0.4080.4671_D−2.7%−1.741.4740.9880.9881_D−2.7%−1.71.54
3_D−18.3%−2.600.7533_D−2.1%−1.681.524
Table 4. Synthesis of the results of the ANOVA test and post hoc Tukey Test for root dry weight. The complete table is reported in Supplementary Material S4 (Table S11).
pQη2pT∆%95% CIScore
Achillea0.0030.0390.7251_D−28.0%−4.66−0.461
3_D−35.9%−5.64−0.911
Althaea0.8420.9960.0371_D6.0%−1.401.805
3_D−6.6%−1.821.383
Brachypodium0.5770.9380.1151_D−13.4%−2.171.093
3_D−18.4%−2.390.913
Briza0.1550.4030.3391_D0.8%−1.571.634
3_D−29.4%−3.04−0.451
Epilobium0.9960.9960.0011_D0.9%−1.571.634
3_D1.9%−1.541.664
Eupatorium0.0160.0910.5991_D22.7%−0.153.525
3_D34.5%0.454.657
Geum0.2080.4510.2941_D12.9%−0.742.615
3_D5.6%−1.212.025
Inula0.0210.0910.5781_D−40.2%−4.420.343
3_D−30.6%−3.680.063
Lychnis0.8240.9960.0421_D−3.0%−1.851.364
3_D2.3%−1.411.804
Melica0.3070.5700.2311_D−26.9%−2.530.803
3_D−34.2%−2.810.603
Sanguisorba0.950.9960.0111_D−1.5%−1.731.474
3_D−2.6%−1.831.384
Veronica0.0530.1720.4791_D−38.0%−3.70.053
3_D−2.9%−1.741.464
Viscaria0.8680.9960.0311_D19.7%−1.231.995
3_D11.7%−1.381.835
Table 5. Synthesis of the results of the ANCOVA test and post hoc Tukey Test for the visual assessment. The complete table is reported in Supplementary Material S4 (Table S12).
pqT∆%95% ICScore (I)Av. Treatm. (A + B + C)Score (II)Total Score
Achillea0.6890.8961_D1.3%−1.371.98417.737
3_D−1.4%−1.981.31417.337
Althaea0.0540.1661_D13.6%−0.493.13512.4−23
3_D21.4%0.044.13613.206
Brachypodium0.2070.4141_D3.0%−1.292.52414.404
3_D−4.5%−2.640.79413.404
Briza0.5540.8001_D3.4%−1.711.86416.126
3_D−3.0%−2.031.29415.115
Epilobium0.0310.1341_D6.6%0.3213.59512.9−23
3_D9.2%0.1864.39513.205
Eupatorium0.0250.1341_D35.3%0.084.54713.807
3_D31.9%0.064.11713.407
Geum0.0640.1661_D10.5%0.0923.88516.627
3_D2.3%−1.452.30415.315
Inula1.0001.1_D−1.4%−2.641.01417.537
3_D−1.4%−2.510.88417.537
Lychnis0.9511_D0.3%−1.711.86416.926
3_D1.1%−1.552.0241726
Melica0.2230.4141_D−6.0%−3.370.37312.3−21
3_D−13.1%−5.93−0.60211.4−20
Sanguisorba0.8040.9501_D2.5%−1.431.96415.215
3_D5.0%−1.342.41515.616
Veronica0.3680.5981_D7.5%−0.912.57514.805
3_D9.9%−0.762.92515.116
Viscaria0.0160.1341_D−6.4%−4.66−0.30315.414
3_D−5.7%−4.26−0.12315.614
Table 6. Results for 1_D treatment: total scoring (* species that met the predefined threshold for acceptable performance under the respective submersion regime).
SpeciesTreat. SurvivalSPDHAverage SFW-SDWRDWVisual
Assess.
Composite Scoring
Geum *1_D56465733
Lychnis *1_D56474632
Eupatorium *1_D55455731
Briza *1_D56454630
Sanguisorba *1_D5654.54529.5
Inula *1_D55453729
Achillea *1_D55551728
Althaea *1_D55555328
Veronica *1_D54544527
Epilobium1_D54454325
Viscaria1_D54345425
Brachypodium1_D54423422
Melica1_D53433119
Table 7. Results for 3_D treatment: total scoring (* species that met the predefined threshold for acceptable performance under the respective submersion regime).
SpeciesTreat.SurvivalSPDHAverage SFW-SDWRDWVisual
Assess.
Composite Scoring
Eupatorium *3_D54567734
Geum *3_D56555531
Sanguisorba *3_D55564631
Althaea *3_D55473630
Epilobium *3_D54564529
Inula *3_D54463729
Lychnis *3_D54454628
Veronica3_D5344.54626.5
Briza3_D54361524
Viscaria3_D5333.55424
Achillea3_D54331723
Brachypodium3_D54413421
Melica3_D53423017
Disclaimer/Publisher’s Note: The statements, opinions and data contained in all publications are solely those of the individual author(s) and contributor(s) and not of MDPI and/or the editor(s). MDPI and/or the editor(s) disclaim responsibility for any injury to people or property resulting from any ideas, methods, instructions or products referred to in the content.